Ronneby, MN Map & Demographics
Ronneby Map
Ronneby Overview
$35,594
PER CAPITA INCOME
$122,500
AVG FAMILY INCOME
$126,250
AVG HOUSEHOLD INCOME
0.33
INEQUALITY / GINI INDEX
54
TOTAL POPULATION
27
MALE POPULATION
27
FEMALE POPULATION
100.00
MALES / 100 FEMALES
100.00
FEMALES / 100 MALES
35.7
MEDIAN AGE
3.6
AVG FAMILY SIZE
3.4
AVG HOUSEHOLD SIZE
29
LABOR FORCE [ PEOPLE ]
80.6%
PERCENT IN LABOR FORCE
6.9%
UNEMPLOYMENT RATE
Income in Ronneby
Income Overview in Ronneby
Per Capita Income in Ronneby is $35,594, while median incomes of families and households are $122,500 and $126,250 respectively.
| Characteristic | Number | Measure |
| Per Capita Income | 54 | $35,594 |
| Median Family Income | 14 | $122,500 |
| Mean Family Income | 14 | $129,814 |
| Median Household Income | 16 | $126,250 |
| Mean Household Income | 16 | $119,188 |
| Income Deficit | 14 | $0 |
| Wage / Income Gap (%) | 54 | 0.00% |
| Wage / Income Gap ($) | 54 | 100.00¢ per $1 |
| Gini / Inequality Index | 54 | 0.33 |
Earnings by Sex in Ronneby
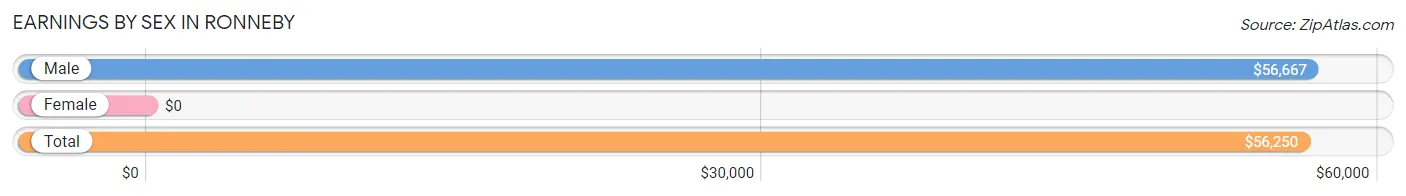
| Sex | Number | Average Earnings |
| Male | 22 (71.0%) | $56,667 |
| Female | 9 (29.0%) | $0 |
| Total | 31 (100.0%) | $56,250 |
Earnings by Sex by Income Bracket in Ronneby
The most common earnings brackets in Ronneby are $35,000 to $39,999 for men (5 | 22.7%) and $10,000 to $12,499 for women (2 | 22.2%).
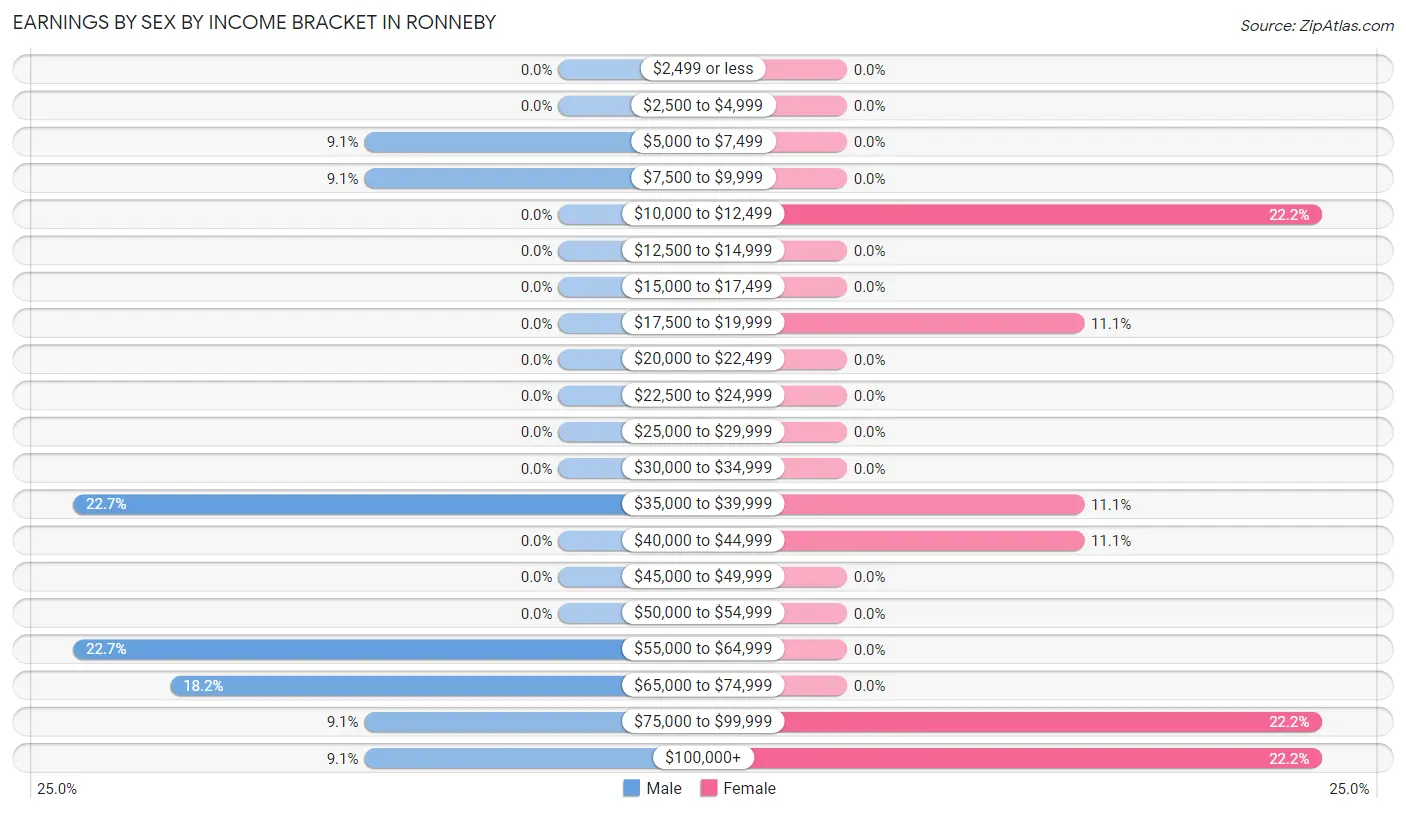
| Income | Male | Female |
| $2,499 or less | 0 (0.0%) | 0 (0.0%) |
| $2,500 to $4,999 | 0 (0.0%) | 0 (0.0%) |
| $5,000 to $7,499 | 2 (9.1%) | 0 (0.0%) |
| $7,500 to $9,999 | 2 (9.1%) | 0 (0.0%) |
| $10,000 to $12,499 | 0 (0.0%) | 2 (22.2%) |
| $12,500 to $14,999 | 0 (0.0%) | 0 (0.0%) |
| $15,000 to $17,499 | 0 (0.0%) | 0 (0.0%) |
| $17,500 to $19,999 | 0 (0.0%) | 1 (11.1%) |
| $20,000 to $22,499 | 0 (0.0%) | 0 (0.0%) |
| $22,500 to $24,999 | 0 (0.0%) | 0 (0.0%) |
| $25,000 to $29,999 | 0 (0.0%) | 0 (0.0%) |
| $30,000 to $34,999 | 0 (0.0%) | 0 (0.0%) |
| $35,000 to $39,999 | 5 (22.7%) | 1 (11.1%) |
| $40,000 to $44,999 | 0 (0.0%) | 1 (11.1%) |
| $45,000 to $49,999 | 0 (0.0%) | 0 (0.0%) |
| $50,000 to $54,999 | 0 (0.0%) | 0 (0.0%) |
| $55,000 to $64,999 | 5 (22.7%) | 0 (0.0%) |
| $65,000 to $74,999 | 4 (18.2%) | 0 (0.0%) |
| $75,000 to $99,999 | 2 (9.1%) | 2 (22.2%) |
| $100,000+ | 2 (9.1%) | 2 (22.2%) |
| Total | 22 (100.0%) | 9 (100.0%) |
Earnings by Sex by Educational Attainment in Ronneby
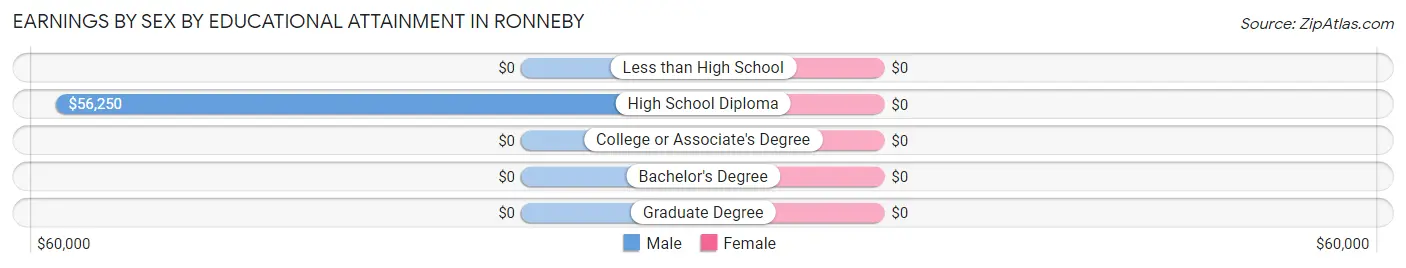
| Educational Attainment | Male Income | Female Income |
| Less than High School | - | - |
| High School Diploma | $56,250 | $0 |
| College or Associate's Degree | - | - |
| Bachelor's Degree | - | - |
| Graduate Degree | - | - |
| Total | $58,750 | $0 |
Family Income in Ronneby
Family Income Brackets in Ronneby
According to the Ronneby family income data, there are 6 families falling into the $100,000 to $149,999 income range, which is the most common income bracket and makes up 42.9% of all families.
| Income Bracket | # Families | % Families |
| Less than $10,000 | 0 | 0.0% |
| $10,000 to $14,999 | 0 | 0.0% |
| $15,000 to $24,999 | 0 | 0.0% |
| $25,000 to $34,999 | 0 | 0.0% |
| $35,000 to $49,999 | 0 | 0.0% |
| $50,000 to $74,999 | 3 | 21.4% |
| $75,000 to $99,999 | 3 | 21.4% |
| $100,000 to $149,999 | 6 | 42.9% |
| $150,000 to $199,999 | 0 | 0.0% |
| $200,000+ | 2 | 14.3% |
Family Income by Famaliy Size in Ronneby
| Income Bracket | # Families | Median Income |
| 2-Person Families | 4 (28.6%) | $0 |
| 3-Person Families | 2 (14.3%) | $0 |
| 4-Person Families | 7 (50.0%) | $0 |
| 5-Person Families | 1 (7.1%) | $0 |
| 6-Person Families | 0 (0.0%) | $0 |
| 7+ Person Families | 0 (0.0%) | $0 |
| Total | 14 (100.0%) | $122,500 |
Family Income by Number of Earners in Ronneby
| Number of Earners | # Families | Median Income |
| No Earners | 0 (0.0%) | $0 |
| 1 Earner | 5 (35.7%) | $0 |
| 2 Earners | 6 (42.9%) | $146,250 |
| 3+ Earners | 3 (21.4%) | $0 |
| Total | 14 (100.0%) | $122,500 |
Household Income in Ronneby
Household Income Brackets in Ronneby
With 8 households falling in the category, the $100,000 to $149,999 income range is the most frequent in Ronneby, accounting for 50.0% of all households.
| Income Bracket | # Households | % Households |
| Less than $10,000 | 2 | 12.5% |
| $10,000 to $14,999 | 0 | 0.0% |
| $15,000 to $24,999 | 0 | 0.0% |
| $25,000 to $34,999 | 0 | 0.0% |
| $35,000 to $49,999 | 0 | 0.0% |
| $50,000 to $74,999 | 3 | 18.8% |
| $75,000 to $99,999 | 1 | 6.3% |
| $100,000 to $149,999 | 8 | 50.0% |
| $150,000 to $199,999 | 0 | 0.0% |
| $200,000+ | 2 | 12.5% |
Household Income by Householder Age in Ronneby
The median household income in Ronneby is $126,250, with the highest median household income of $143,125 found in the 25 to 44 years age bracket for the primary householder. A total of 9 households (56.2%) fall into this category.
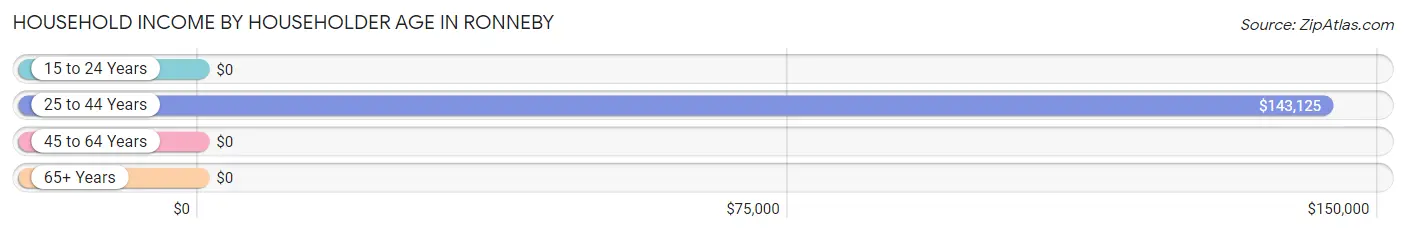
| Income Bracket | # Households | Median Income |
| 15 to 24 Years | 0 (0.0%) | $0 |
| 25 to 44 Years | 9 (56.2%) | $143,125 |
| 45 to 64 Years | 5 (31.2%) | $0 |
| 65+ Years | 2 (12.5%) | $0 |
| Total | 16 (100.0%) | $126,250 |
Poverty in Ronneby
Income Below Poverty by Sex and Age in Ronneby
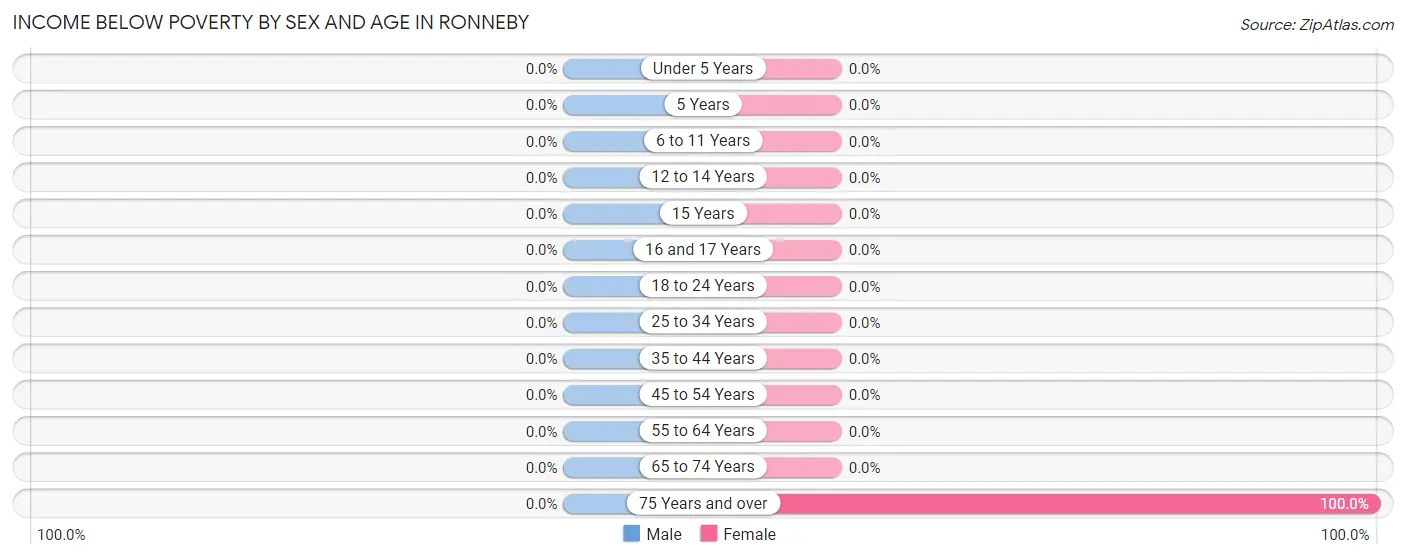
| Age Bracket | Male | Female |
| Under 5 Years | 0 (0.0%) | 0 (0.0%) |
| 5 Years | 0 (0.0%) | 0 (0.0%) |
| 6 to 11 Years | 0 (0.0%) | 0 (0.0%) |
| 12 to 14 Years | 0 (0.0%) | 0 (0.0%) |
| 15 Years | 0 (0.0%) | 0 (0.0%) |
| 16 and 17 Years | 0 (0.0%) | 0 (0.0%) |
| 18 to 24 Years | 0 (0.0%) | 0 (0.0%) |
| 25 to 34 Years | 0 (0.0%) | 0 (0.0%) |
| 35 to 44 Years | 0 (0.0%) | 0 (0.0%) |
| 45 to 54 Years | 0 (0.0%) | 0 (0.0%) |
| 55 to 64 Years | 0 (0.0%) | 0 (0.0%) |
| 65 to 74 Years | 0 (0.0%) | 0 (0.0%) |
| 75 Years and over | 0 (0.0%) | 2 (100.0%) |
| Total | 0 (0.0%) | 2 (7.4%) |
Income Above Poverty by Sex and Age in Ronneby
According to the poverty statistics in Ronneby, males aged under 5 years and females aged under 5 years are the age groups that are most secure financially, with 100.0% of males and 100.0% of females in these age groups living above the poverty line.
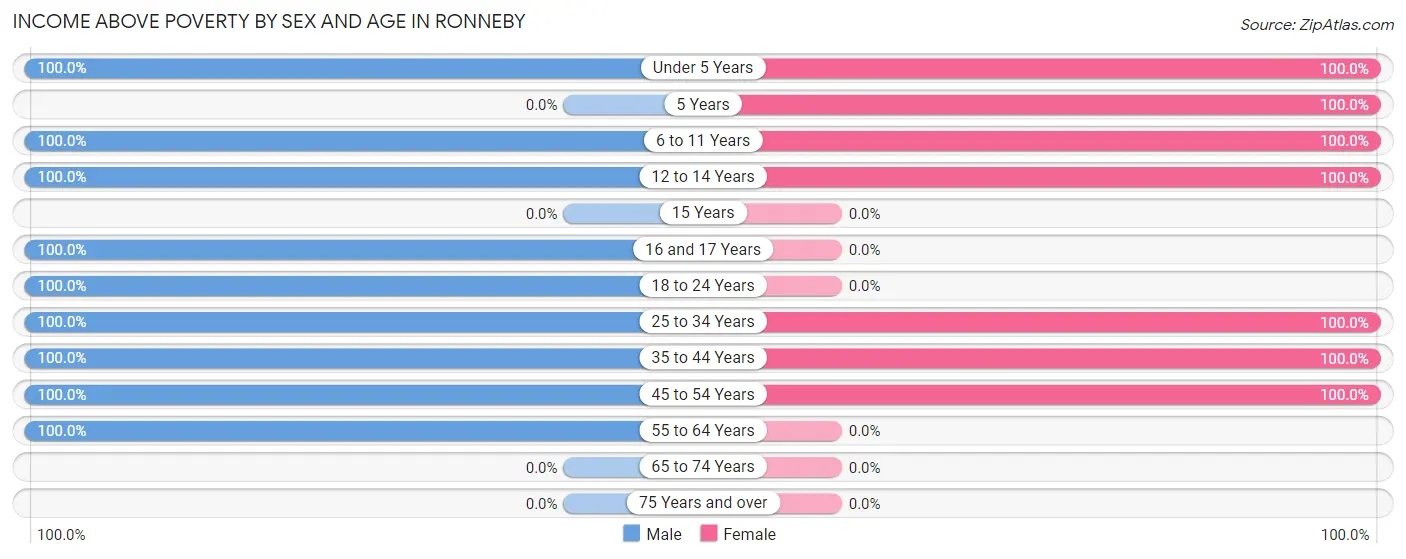
| Age Bracket | Male | Female |
| Under 5 Years | 1 (100.0%) | 7 (100.0%) |
| 5 Years | 0 (0.0%) | 1 (100.0%) |
| 6 to 11 Years | 2 (100.0%) | 2 (100.0%) |
| 12 to 14 Years | 2 (100.0%) | 3 (100.0%) |
| 15 Years | 0 (0.0%) | 0 (0.0%) |
| 16 and 17 Years | 2 (100.0%) | 0 (0.0%) |
| 18 to 24 Years | 2 (100.0%) | 0 (0.0%) |
| 25 to 34 Years | 2 (100.0%) | 1 (100.0%) |
| 35 to 44 Years | 6 (100.0%) | 7 (100.0%) |
| 45 to 54 Years | 8 (100.0%) | 4 (100.0%) |
| 55 to 64 Years | 2 (100.0%) | 0 (0.0%) |
| 65 to 74 Years | 0 (0.0%) | 0 (0.0%) |
| 75 Years and over | 0 (0.0%) | 0 (0.0%) |
| Total | 27 (100.0%) | 25 (92.6%) |
Income Below Poverty Among Married-Couple Families in Ronneby
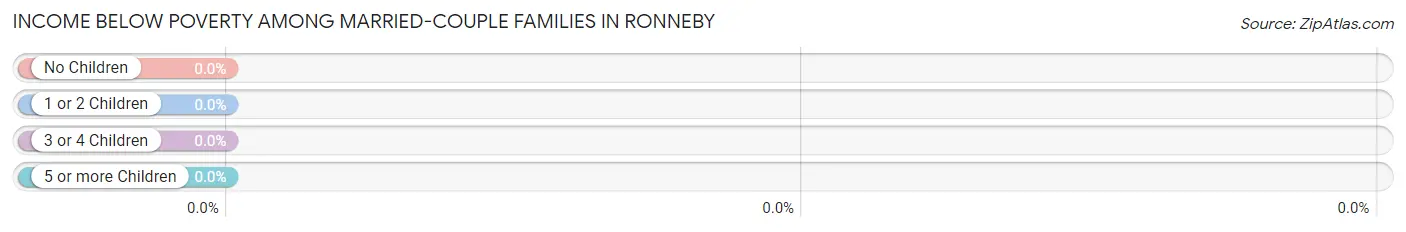
| Children | Above Poverty | Below Poverty |
| No Children | 2 (100.0%) | 0 (0.0%) |
| 1 or 2 Children | 10 (100.0%) | 0 (0.0%) |
| 3 or 4 Children | 0 (0.0%) | 0 (0.0%) |
| 5 or more Children | 0 (0.0%) | 0 (0.0%) |
| Total | 12 (100.0%) | 0 (0.0%) |
Income Below Poverty Among Single-Parent Households in Ronneby
| Children | Single Father | Single Mother |
| No Children | 0 (0.0%) | 0 (0.0%) |
| 1 or 2 Children | 0 (0.0%) | 0 (0.0%) |
| 3 or 4 Children | 0 (0.0%) | 0 (0.0%) |
| 5 or more Children | 0 (0.0%) | 0 (0.0%) |
| Total | 0 (0.0%) | 0 (0.0%) |
Income Below Poverty Among Married-Couple vs Single-Parent Households in Ronneby
| Children | Married-Couple Families | Single-Parent Households |
| No Children | 0 (0.0%) | 0 (0.0%) |
| 1 or 2 Children | 0 (0.0%) | 0 (0.0%) |
| 3 or 4 Children | 0 (0.0%) | 0 (0.0%) |
| 5 or more Children | 0 (0.0%) | 0 (0.0%) |
| Total | 0 (0.0%) | 0 (0.0%) |
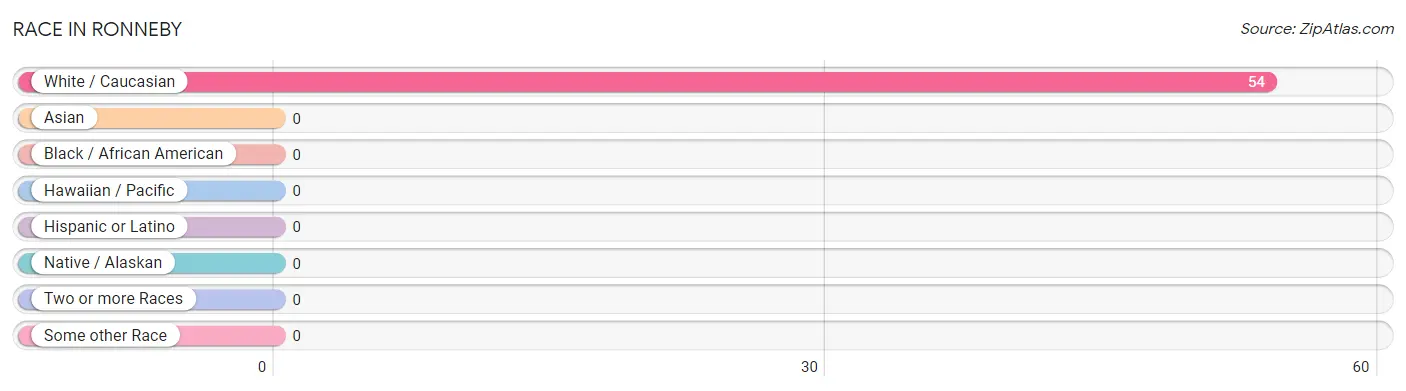
Race in Ronneby
The most populous races in Ronneby are , and White / Caucasian (54 | 100.0%).
| Race | # Population | % Population |
| Asian | 0 | 0.0% |
| Black / African American | 0 | 0.0% |
| Hawaiian / Pacific | 0 | 0.0% |
| Hispanic or Latino | 0 | 0.0% |
| Native / Alaskan | 0 | 0.0% |
| White / Caucasian | 54 | 100.0% |
| Two or more Races | 0 | 0.0% |
| Some other Race | 0 | 0.0% |
| Total | 54 | 100.0% |
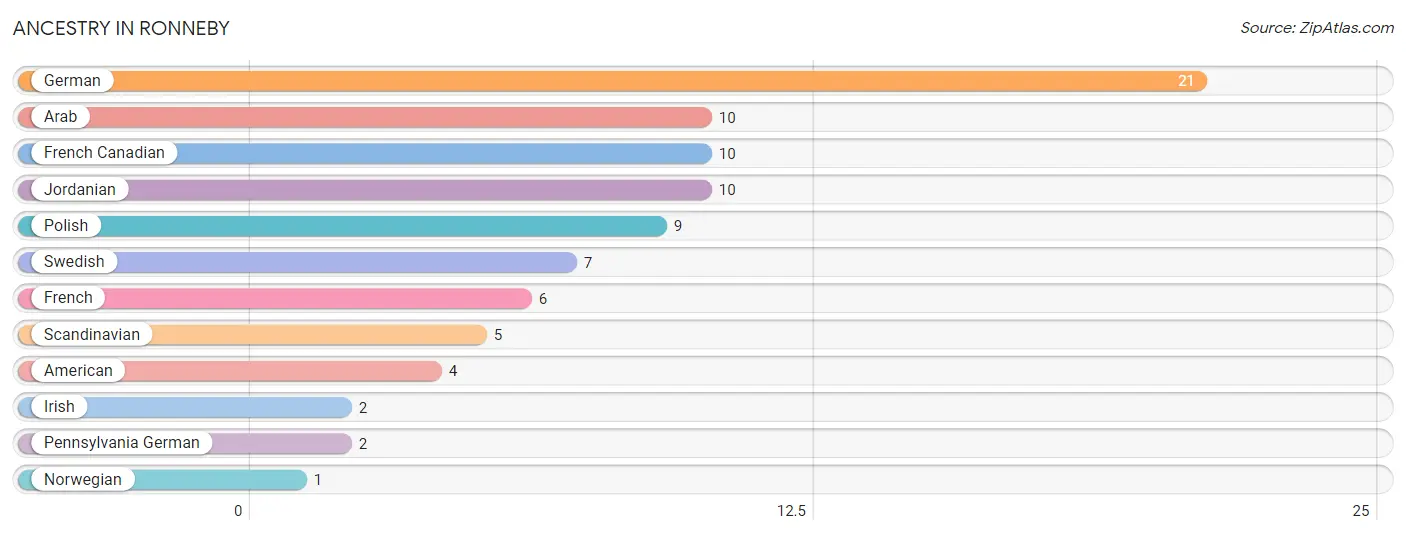
Ancestry in Ronneby
The most populous ancestries reported in Ronneby are German (21 | 38.9%), Arab (10 | 18.5%), French Canadian (10 | 18.5%), Jordanian (10 | 18.5%), and Polish (9 | 16.7%), together accounting for 111.1% of all Ronneby residents.
| Ancestry | # Population | % Population |
| American | 4 | 7.4% |
| Arab | 10 | 18.5% |
| French | 6 | 11.1% |
| French Canadian | 10 | 18.5% |
| German | 21 | 38.9% |
| Irish | 2 | 3.7% |
| Jordanian | 10 | 18.5% |
| Norwegian | 1 | 1.8% |
| Pennsylvania German | 2 | 3.7% |
| Polish | 9 | 16.7% |
| Scandinavian | 5 | 9.3% |
| Swedish | 7 | 13.0% | View All 12 Rows |
Immigrants in Ronneby

| Immigration Origin | # Population | % Population | View All 0 Rows |
Sex and Age in Ronneby
Sex and Age in Ronneby
The most populous age groups in Ronneby are 45 to 49 Years (6 | 22.2%) for men and Under 5 Years (7 | 25.9%) for women.
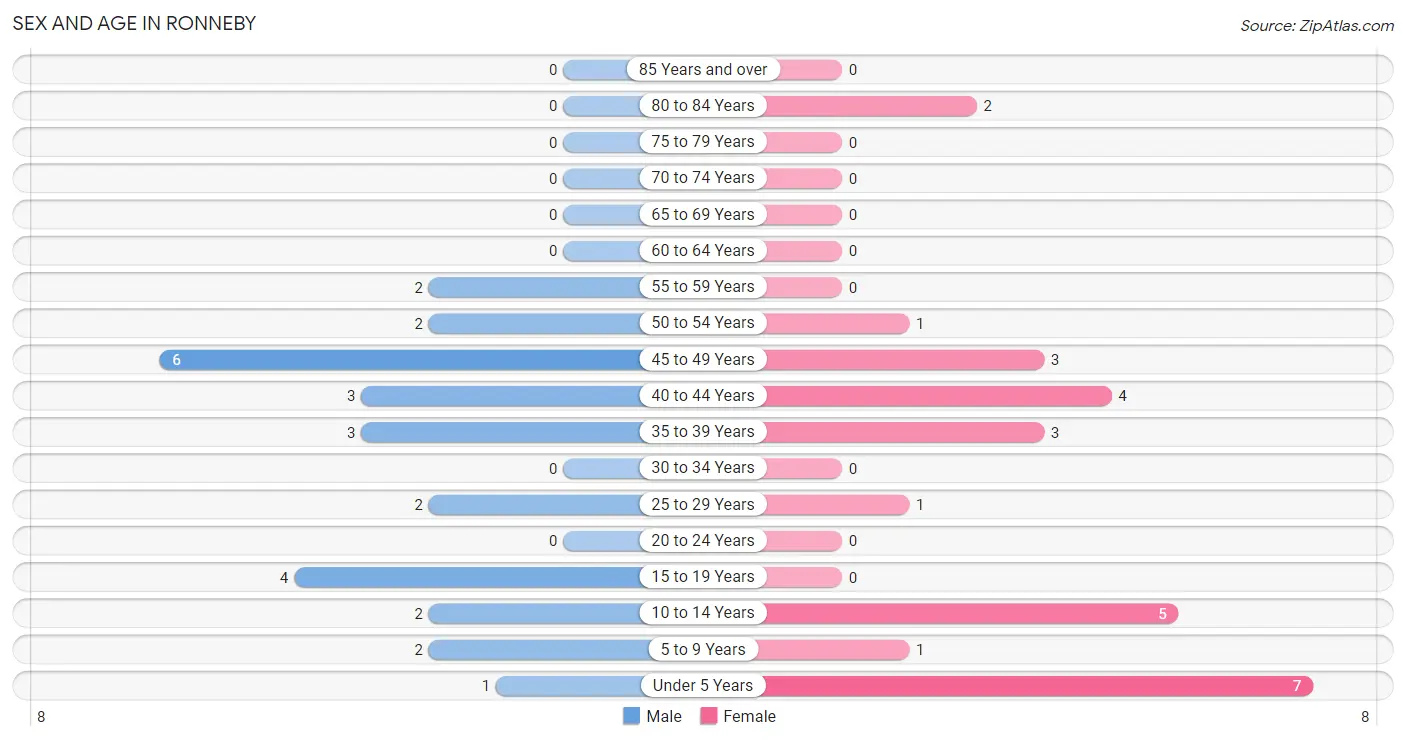
| Age Bracket | Male | Female |
| Under 5 Years | 1 (3.7%) | 7 (25.9%) |
| 5 to 9 Years | 2 (7.4%) | 1 (3.7%) |
| 10 to 14 Years | 2 (7.4%) | 5 (18.5%) |
| 15 to 19 Years | 4 (14.8%) | 0 (0.0%) |
| 20 to 24 Years | 0 (0.0%) | 0 (0.0%) |
| 25 to 29 Years | 2 (7.4%) | 1 (3.7%) |
| 30 to 34 Years | 0 (0.0%) | 0 (0.0%) |
| 35 to 39 Years | 3 (11.1%) | 3 (11.1%) |
| 40 to 44 Years | 3 (11.1%) | 4 (14.8%) |
| 45 to 49 Years | 6 (22.2%) | 3 (11.1%) |
| 50 to 54 Years | 2 (7.4%) | 1 (3.7%) |
| 55 to 59 Years | 2 (7.4%) | 0 (0.0%) |
| 60 to 64 Years | 0 (0.0%) | 0 (0.0%) |
| 65 to 69 Years | 0 (0.0%) | 0 (0.0%) |
| 70 to 74 Years | 0 (0.0%) | 0 (0.0%) |
| 75 to 79 Years | 0 (0.0%) | 0 (0.0%) |
| 80 to 84 Years | 0 (0.0%) | 2 (7.4%) |
| 85 Years and over | 0 (0.0%) | 0 (0.0%) |
| Total | 27 (100.0%) | 27 (100.0%) |
Families and Households in Ronneby
Median Family Size in Ronneby
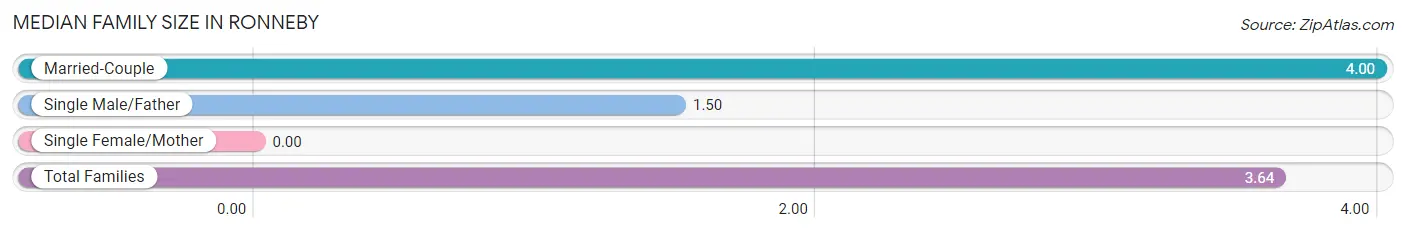
| Family Type | # Families | Family Size |
| Married-Couple | 12 (85.7%) | 4.00 |
| Single Male/Father | 2 (14.3%) | 1.50 |
| Single Female/Mother | 0 (0.0%) | - |
| Total Families | 14 (100.0%) | 3.64 |
Median Household Size in Ronneby
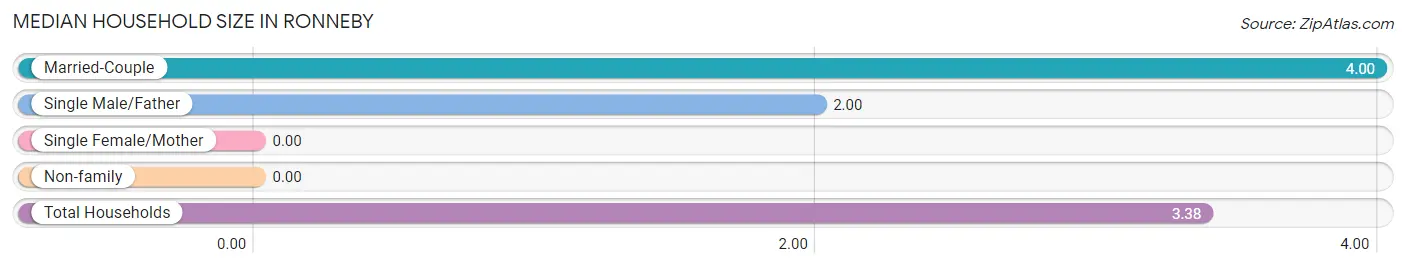
| Household Type | # Households | Household Size |
| Married-Couple | 12 (75.0%) | 4.00 |
| Single Male/Father | 2 (12.5%) | 2.00 |
| Single Female/Mother | 0 (0.0%) | - |
| Non-family | 2 (12.5%) | - |
| Total Households | 16 (100.0%) | 3.38 |
Household Size by Marriage Status in Ronneby
Out of a total of 16 households in Ronneby, 14 (87.5%) are family households, while 2 (12.5%) are nonfamily households. The most numerous type of family households are 4-person households, comprising 7, and the most common type of nonfamily households are 1-person households, comprising 2.
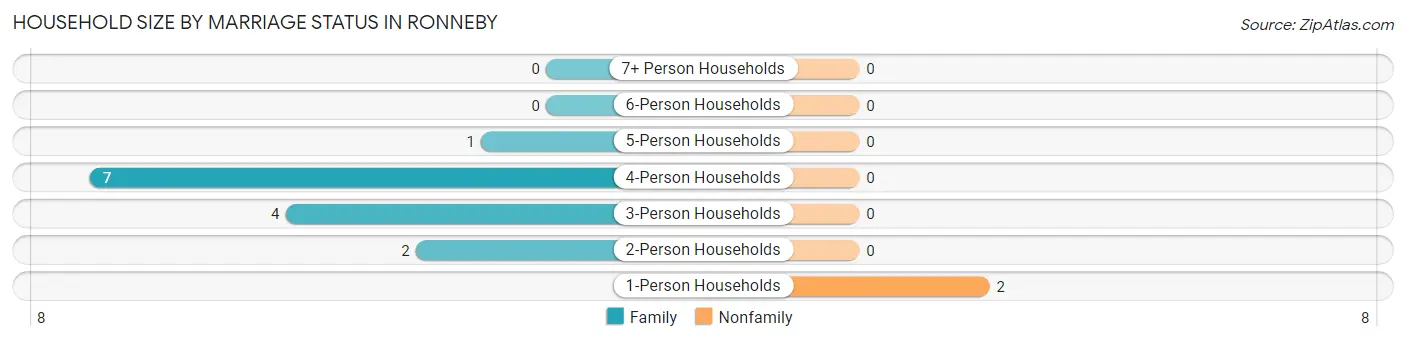
| Household Size | Family Households | Nonfamily Households |
| 1-Person Households | - | 2 (12.5%) |
| 2-Person Households | 2 (12.5%) | 0 (0.0%) |
| 3-Person Households | 4 (25.0%) | 0 (0.0%) |
| 4-Person Households | 7 (43.8%) | 0 (0.0%) |
| 5-Person Households | 1 (6.2%) | 0 (0.0%) |
| 6-Person Households | 0 (0.0%) | 0 (0.0%) |
| 7+ Person Households | 0 (0.0%) | 0 (0.0%) |
| Total | 14 (87.5%) | 2 (12.5%) |
Female Fertility in Ronneby
Fertility by Age in Ronneby
Average fertility rate in Ronneby is 273.0 births per 1,000 women. Women in the age bracket of 35 to 50 years have the highest fertility rate with 300.0 births per 1,000 women. Women in the age bracket of 35 to 50 years acount for 100.0% of all women with births.
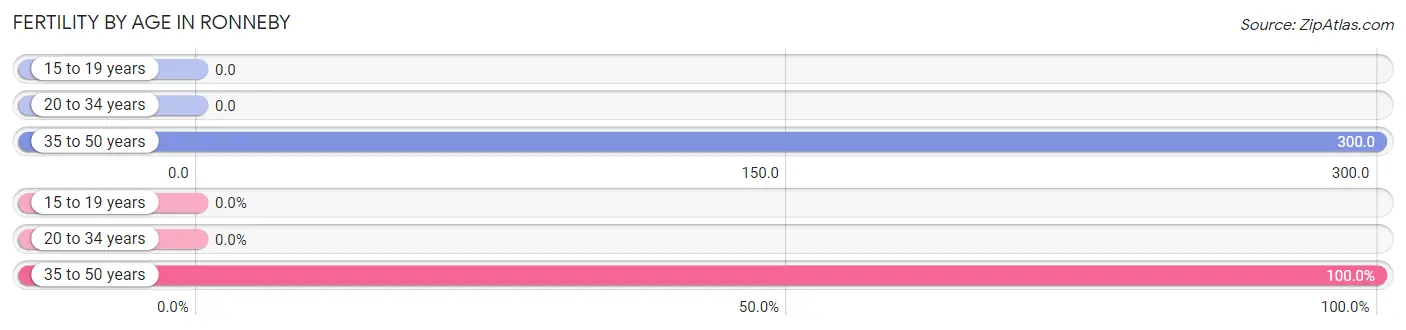
| Age Bracket | Women with Births | Births / 1,000 Women |
| 15 to 19 years | 0 (0.0%) | 0.0 |
| 20 to 34 years | 0 (0.0%) | 0.0 |
| 35 to 50 years | 3 (100.0%) | 300.0 |
| Total | 3 (100.0%) | 273.0 |
Fertility by Age by Marriage Status in Ronneby
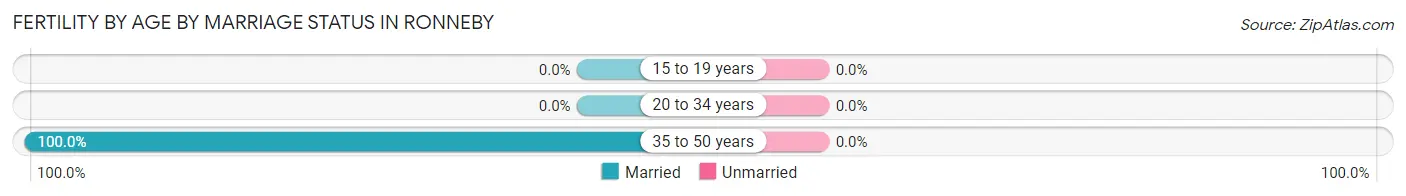
| Age Bracket | Married | Unmarried |
| 15 to 19 years | 0 (0.0%) | 0 (0.0%) |
| 20 to 34 years | 0 (0.0%) | 0 (0.0%) |
| 35 to 50 years | 3 (100.0%) | 0 (0.0%) |
| Total | 3 (100.0%) | 0 (0.0%) |
Fertility by Education in Ronneby
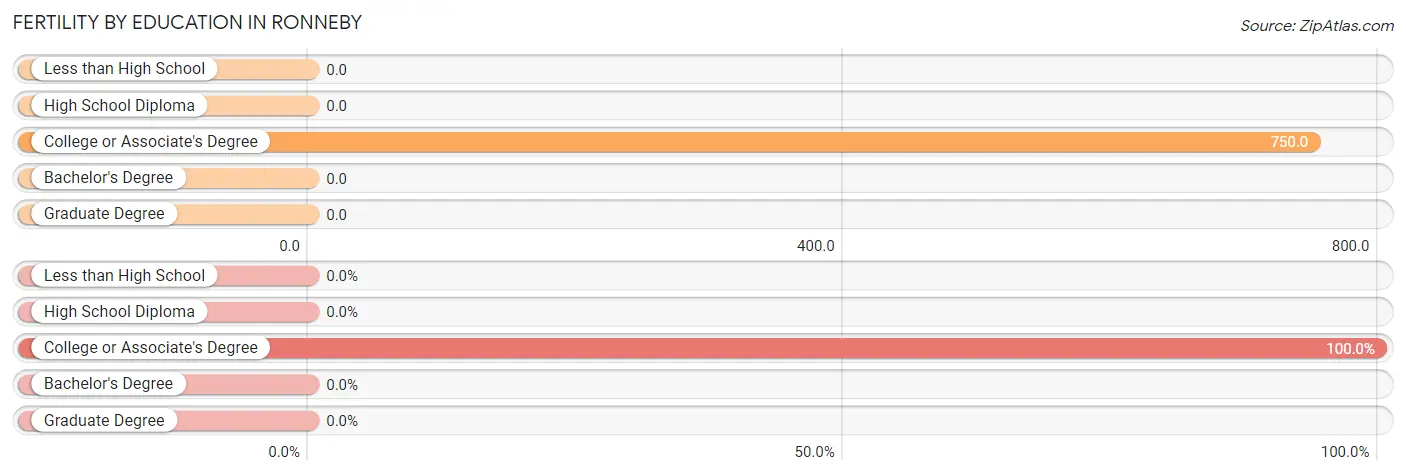
| Educational Attainment | Women with Births | Births / 1,000 Women |
| Less than High School | 0 (0.0%) | 0.0 |
| High School Diploma | 0 (0.0%) | 0.0 |
| College or Associate's Degree | 3 (100.0%) | 750.0 |
| Bachelor's Degree | 0 (0.0%) | 0.0 |
| Graduate Degree | 0 (0.0%) | 0.0 |
| Total | 3 (100.0%) | 273.0 |
Fertility by Education by Marriage Status in Ronneby
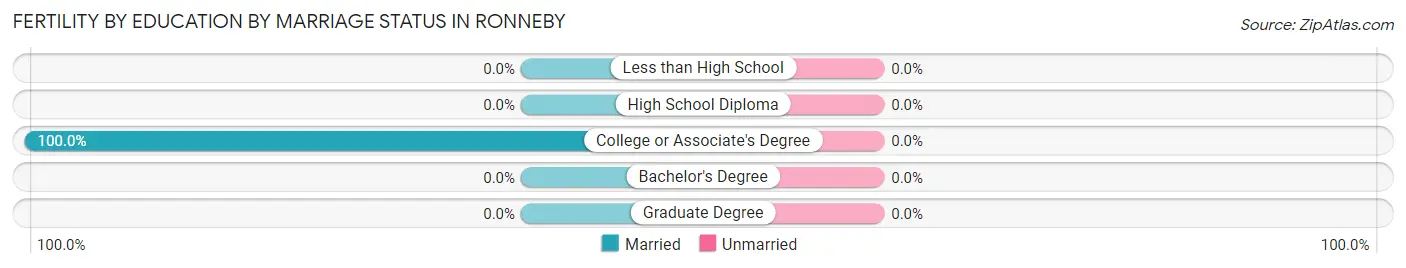
| Educational Attainment | Married | Unmarried |
| Less than High School | 0 (0.0%) | 0 (0.0%) |
| High School Diploma | 0 (0.0%) | 0 (0.0%) |
| College or Associate's Degree | 3 (100.0%) | 0 (0.0%) |
| Bachelor's Degree | 0 (0.0%) | 0 (0.0%) |
| Graduate Degree | 0 (0.0%) | 0 (0.0%) |
| Total | 3 (100.0%) | 0 (0.0%) |
Employment Characteristics in Ronneby
Employment by Class of Employer in Ronneby
Among the 27 employed individuals in Ronneby, private company employees (17 | 63.0%), self-employed (not incorporated) (5 | 18.5%), and self-employed (incorporated) (2 | 7.4%) make up the most common classes of employment.
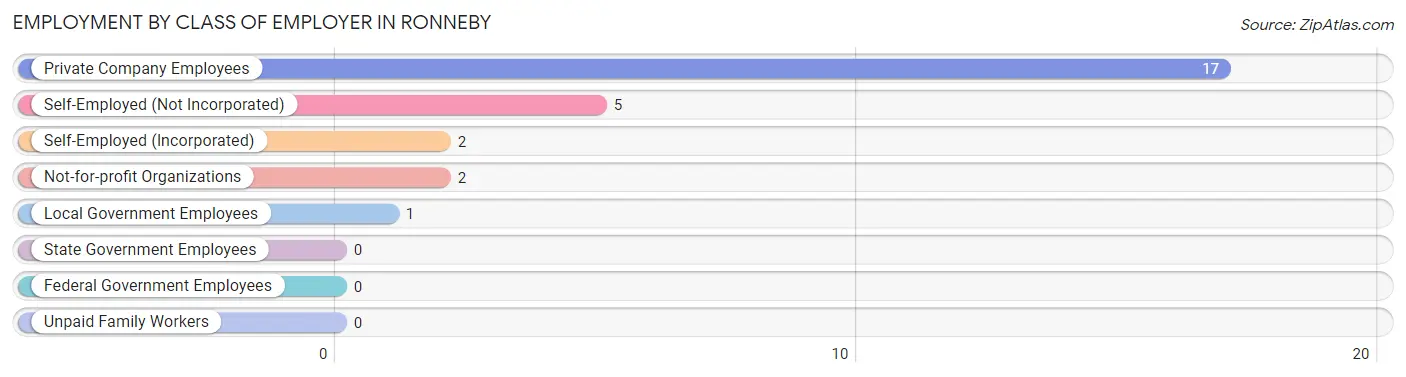
| Employer Class | # Employees | % Employees |
| Private Company Employees | 17 | 63.0% |
| Self-Employed (Incorporated) | 2 | 7.4% |
| Self-Employed (Not Incorporated) | 5 | 18.5% |
| Not-for-profit Organizations | 2 | 7.4% |
| Local Government Employees | 1 | 3.7% |
| State Government Employees | 0 | 0.0% |
| Federal Government Employees | 0 | 0.0% |
| Unpaid Family Workers | 0 | 0.0% |
| Total | 27 | 100.0% |
Employment Status by Age in Ronneby
According to the labor force statistics for Ronneby, out of the total population over 16 years of age (36), 80.6% or 29 individuals are in the labor force, with 6.9% or 2 of them unemployed. The age group with the highest labor force participation rate is 25 to 29 years, with 100.0% or 3 individuals in the labor force. Within the labor force, the 25 to 29 years age range has the highest percentage of unemployed individuals, with 66.7% or 2 of them being unemployed.
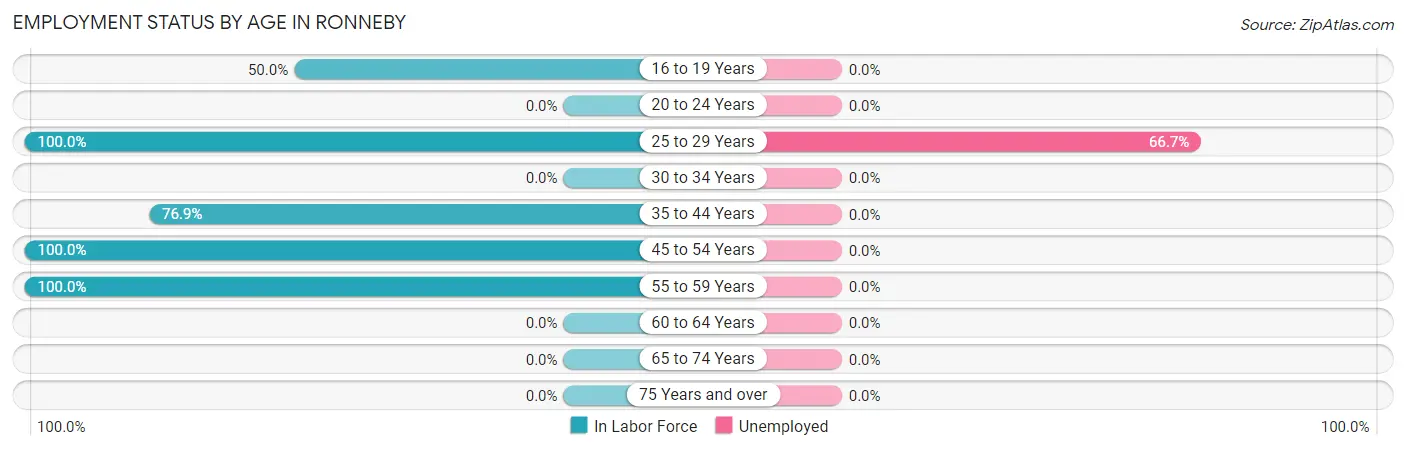
| Age Bracket | In Labor Force | Unemployed |
| 16 to 19 Years | 2 (50.0%) | 0 (0.0%) |
| 20 to 24 Years | 0 (0.0%) | 0 (0.0%) |
| 25 to 29 Years | 3 (100.0%) | 2 (66.7%) |
| 30 to 34 Years | 0 (0.0%) | 0 (0.0%) |
| 35 to 44 Years | 10 (76.9%) | 0 (0.0%) |
| 45 to 54 Years | 12 (100.0%) | 0 (0.0%) |
| 55 to 59 Years | 2 (100.0%) | 0 (0.0%) |
| 60 to 64 Years | 0 (0.0%) | 0 (0.0%) |
| 65 to 74 Years | 0 (0.0%) | 0 (0.0%) |
| 75 Years and over | 0 (0.0%) | 0 (0.0%) |
| Total | 29 (80.6%) | 2 (6.9%) |
Employment Status by Educational Attainment in Ronneby
According to labor force statistics for Ronneby, 90.0% of individuals (27) out of the total population between 25 and 64 years of age (30) are in the labor force, with 7.4% or 2 of them being unemployed. The group with the highest labor force participation rate are those with the educational attainment of high school diploma, with 100.0% or 16 individuals in the labor force. Within the labor force, individuals with high school diploma education have the highest percentage of unemployment, with 12.5% or 2 of them being unemployed.
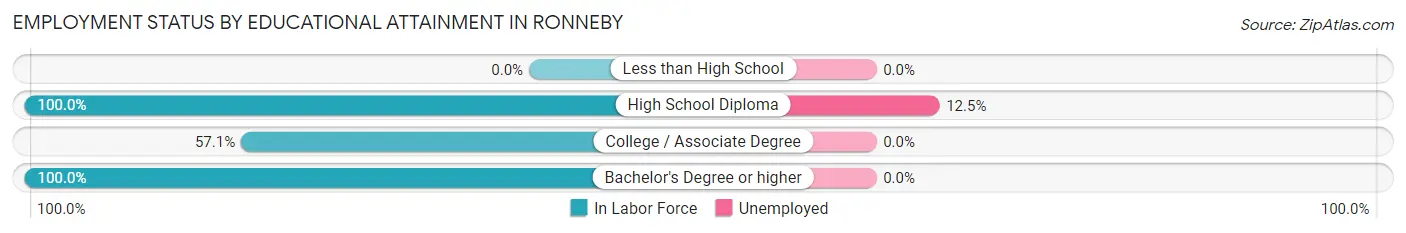
| Educational Attainment | In Labor Force | Unemployed |
| Less than High School | 0 (0.0%) | 0 (0.0%) |
| High School Diploma | 16 (100.0%) | 2 (12.5%) |
| College / Associate Degree | 4 (57.1%) | 0 (0.0%) |
| Bachelor's Degree or higher | 7 (100.0%) | 0 (0.0%) |
| Total | 27 (90.0%) | 2 (7.4%) |
Employment Occupations by Sex in Ronneby
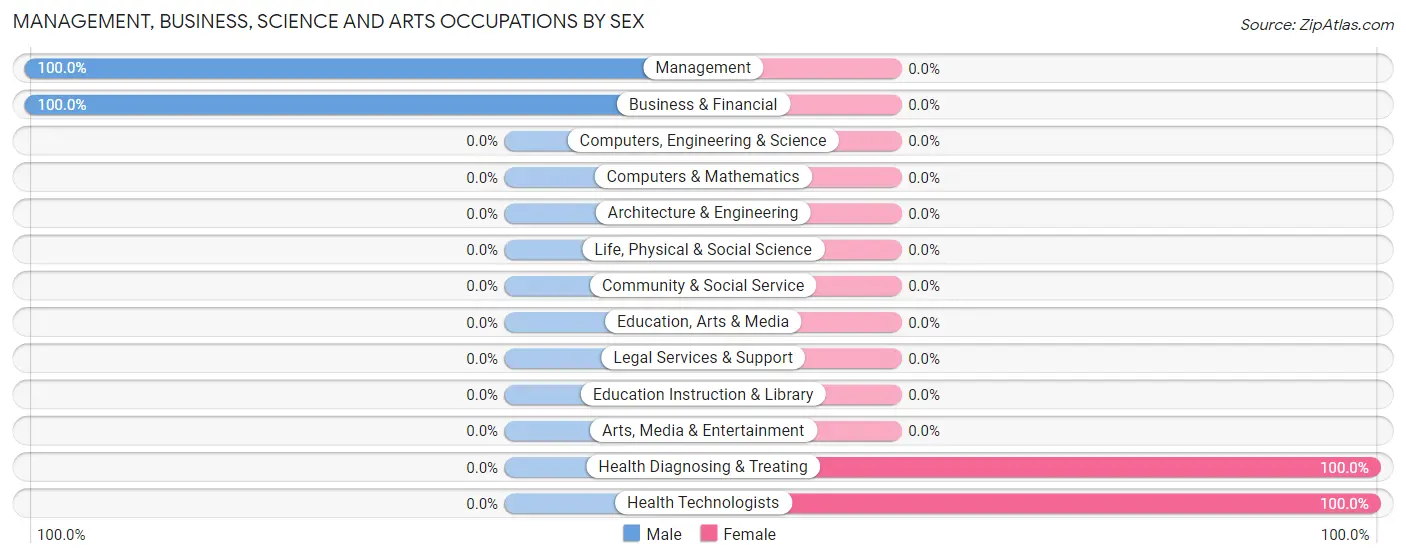
Management, Business, Science and Arts Occupations
The most common Management, Business, Science and Arts occupations in Ronneby are Management (3 | 11.1%), Business & Financial (2 | 7.4%), Health Diagnosing & Treating (2 | 7.4%), and Health Technologists (2 | 7.4%).
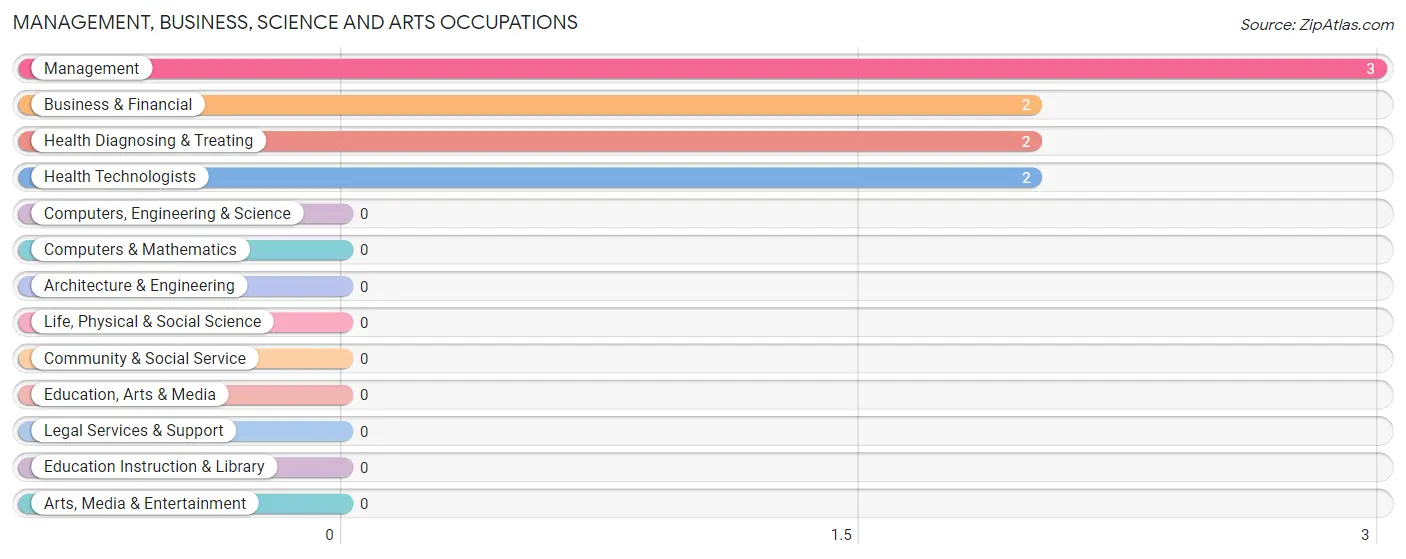
Management, Business, Science and Arts Occupations by Sex
Within the Management, Business, Science and Arts occupations in Ronneby, the most male-oriented occupations are Management (100.0%), and Business & Financial (100.0%), while the most female-oriented occupations are Health Diagnosing & Treating (100.0%), and Health Technologists (100.0%).
| Occupation | Male | Female |
| Management | 3 (100.0%) | 0 (0.0%) |
| Business & Financial | 2 (100.0%) | 0 (0.0%) |
| Computers, Engineering & Science | 0 (0.0%) | 0 (0.0%) |
| Computers & Mathematics | 0 (0.0%) | 0 (0.0%) |
| Architecture & Engineering | 0 (0.0%) | 0 (0.0%) |
| Life, Physical & Social Science | 0 (0.0%) | 0 (0.0%) |
| Community & Social Service | 0 (0.0%) | 0 (0.0%) |
| Education, Arts & Media | 0 (0.0%) | 0 (0.0%) |
| Legal Services & Support | 0 (0.0%) | 0 (0.0%) |
| Education Instruction & Library | 0 (0.0%) | 0 (0.0%) |
| Arts, Media & Entertainment | 0 (0.0%) | 0 (0.0%) |
| Health Diagnosing & Treating | 0 (0.0%) | 2 (100.0%) |
| Health Technologists | 0 (0.0%) | 2 (100.0%) |
| Total (Category) | 5 (71.4%) | 2 (28.6%) |
| Total (Overall) | 18 (66.7%) | 9 (33.3%) |
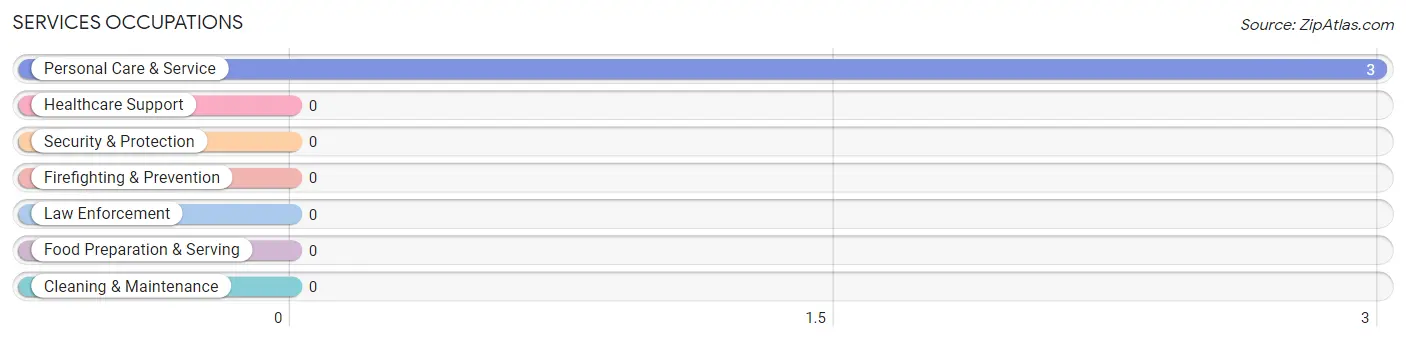
Services Occupations
The most common Services occupations in Ronneby are , and Personal Care & Service (3 | 11.1%).
Services Occupations by Sex
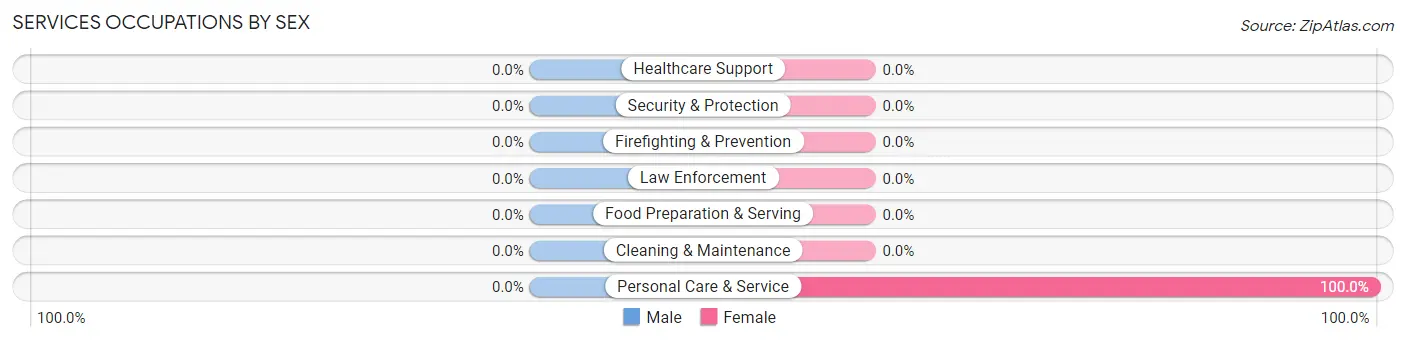
| Occupation | Male | Female |
| Healthcare Support | 0 (0.0%) | 0 (0.0%) |
| Security & Protection | 0 (0.0%) | 0 (0.0%) |
| Firefighting & Prevention | 0 (0.0%) | 0 (0.0%) |
| Law Enforcement | 0 (0.0%) | 0 (0.0%) |
| Food Preparation & Serving | 0 (0.0%) | 0 (0.0%) |
| Cleaning & Maintenance | 0 (0.0%) | 0 (0.0%) |
| Personal Care & Service | 0 (0.0%) | 3 (100.0%) |
| Total (Category) | 0 (0.0%) | 3 (100.0%) |
| Total (Overall) | 18 (66.7%) | 9 (33.3%) |
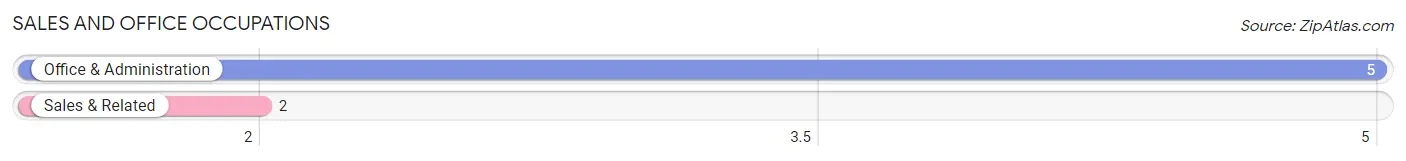
Sales and Office Occupations
The most common Sales and Office occupations in Ronneby are Office & Administration (5 | 18.5%), and Sales & Related (2 | 7.4%).
Sales and Office Occupations by Sex
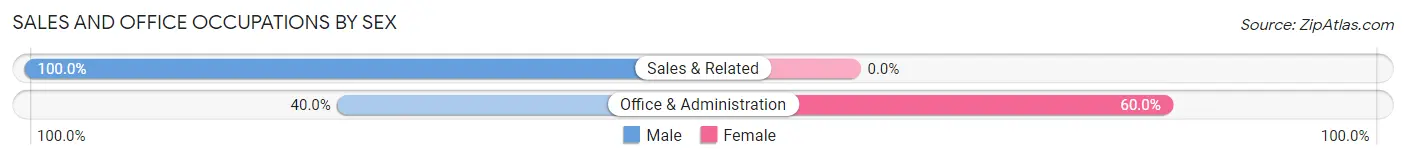
| Occupation | Male | Female |
| Sales & Related | 2 (100.0%) | 0 (0.0%) |
| Office & Administration | 2 (40.0%) | 3 (60.0%) |
| Total (Category) | 4 (57.1%) | 3 (42.9%) |
| Total (Overall) | 18 (66.7%) | 9 (33.3%) |
Natural Resources, Construction and Maintenance Occupations
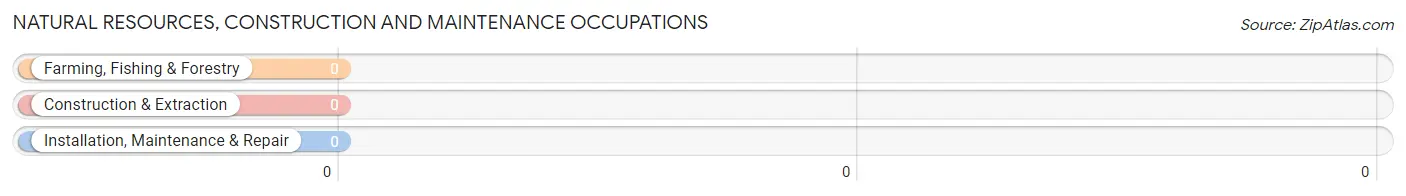
Natural Resources, Construction and Maintenance Occupations by Sex
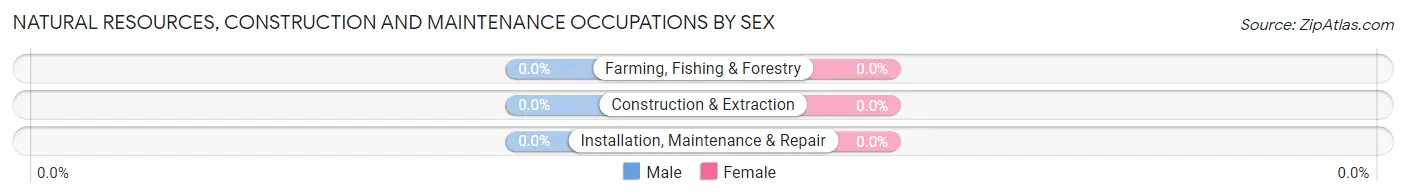
| Occupation | Male | Female |
| Farming, Fishing & Forestry | 0 (0.0%) | 0 (0.0%) |
| Construction & Extraction | 0 (0.0%) | 0 (0.0%) |
| Installation, Maintenance & Repair | 0 (0.0%) | 0 (0.0%) |
| Total (Category) | 0 (0.0%) | 0 (0.0%) |
| Total (Overall) | 18 (66.7%) | 9 (33.3%) |
Production, Transportation and Moving Occupations
The most common Production, Transportation and Moving occupations in Ronneby are Material Moving (9 | 33.3%), and Production (1 | 3.7%).
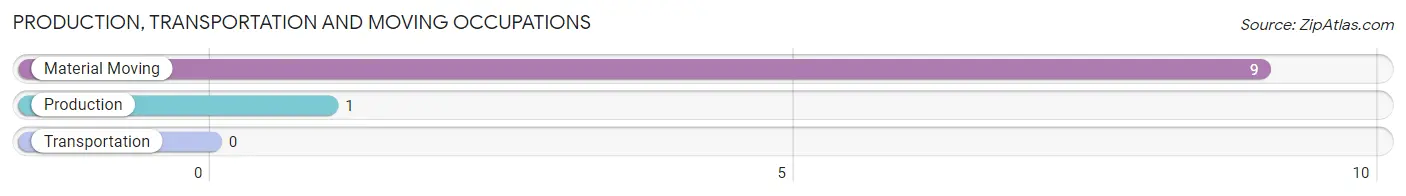
Production, Transportation and Moving Occupations by Sex
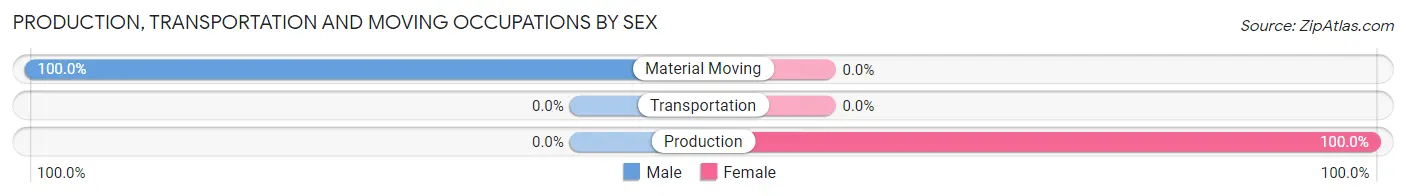
| Occupation | Male | Female |
| Production | 0 (0.0%) | 1 (100.0%) |
| Transportation | 0 (0.0%) | 0 (0.0%) |
| Material Moving | 9 (100.0%) | 0 (0.0%) |
| Total (Category) | 9 (90.0%) | 1 (10.0%) |
| Total (Overall) | 18 (66.7%) | 9 (33.3%) |
Employment Industries by Sex in Ronneby
Employment Industries in Ronneby
The major employment industries in Ronneby include Retail Trade (8 | 29.6%), Manufacturing (4 | 14.8%), Health Care & Social Assistance (4 | 14.8%), Agriculture, Fishing & Hunting (3 | 11.1%), and Wholesale Trade (2 | 7.4%).
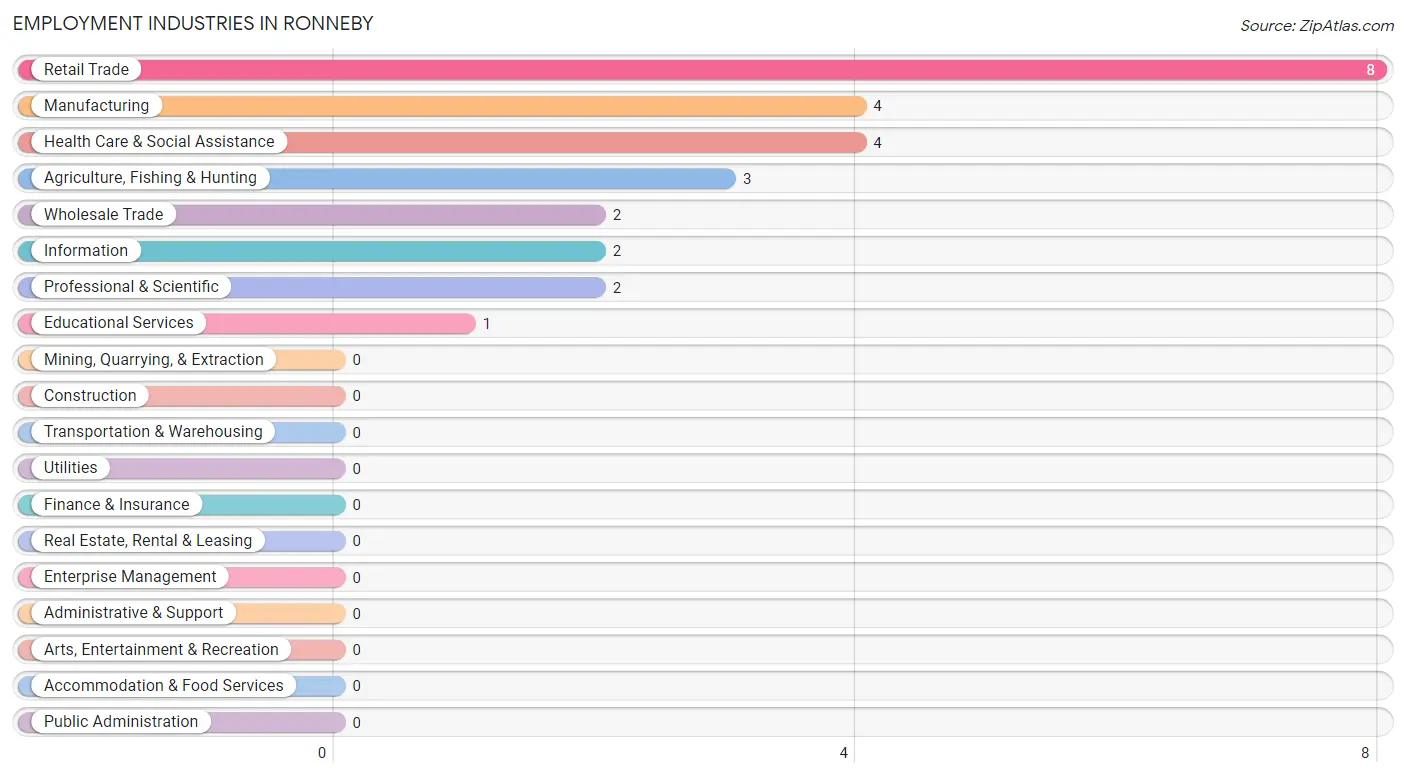
Employment Industries by Sex in Ronneby
The Ronneby industries that see more men than women are Agriculture, Fishing & Hunting (100.0%), Wholesale Trade (100.0%), and Retail Trade (100.0%), whereas the industries that tend to have a higher number of women are Information (100.0%), Educational Services (100.0%), and Health Care & Social Assistance (100.0%).

| Industry | Male | Female |
| Agriculture, Fishing & Hunting | 3 (100.0%) | 0 (0.0%) |
| Mining, Quarrying, & Extraction | 0 (0.0%) | 0 (0.0%) |
| Construction | 0 (0.0%) | 0 (0.0%) |
| Manufacturing | 3 (75.0%) | 1 (25.0%) |
| Wholesale Trade | 2 (100.0%) | 0 (0.0%) |
| Retail Trade | 8 (100.0%) | 0 (0.0%) |
| Transportation & Warehousing | 0 (0.0%) | 0 (0.0%) |
| Utilities | 0 (0.0%) | 0 (0.0%) |
| Information | 0 (0.0%) | 2 (100.0%) |
| Finance & Insurance | 0 (0.0%) | 0 (0.0%) |
| Real Estate, Rental & Leasing | 0 (0.0%) | 0 (0.0%) |
| Professional & Scientific | 2 (100.0%) | 0 (0.0%) |
| Enterprise Management | 0 (0.0%) | 0 (0.0%) |
| Administrative & Support | 0 (0.0%) | 0 (0.0%) |
| Educational Services | 0 (0.0%) | 1 (100.0%) |
| Health Care & Social Assistance | 0 (0.0%) | 4 (100.0%) |
| Arts, Entertainment & Recreation | 0 (0.0%) | 0 (0.0%) |
| Accommodation & Food Services | 0 (0.0%) | 0 (0.0%) |
| Public Administration | 0 (0.0%) | 0 (0.0%) |
| Total | 18 (66.7%) | 9 (33.3%) |
Education in Ronneby
School Enrollment in Ronneby
The most common levels of schooling among the 12 students in Ronneby are middle school (7 | 58.3%), college / undergraduate (3 | 25.0%), and high school (2 | 16.7%).
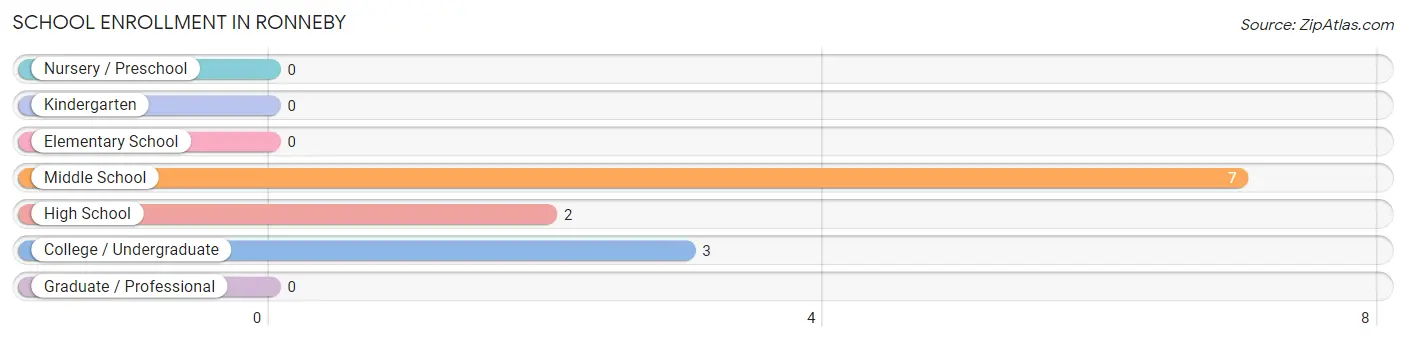
| School Level | # Students | % Students |
| Nursery / Preschool | 0 | 0.0% |
| Kindergarten | 0 | 0.0% |
| Elementary School | 0 | 0.0% |
| Middle School | 7 | 58.3% |
| High School | 2 | 16.7% |
| College / Undergraduate | 3 | 25.0% |
| Graduate / Professional | 0 | 0.0% |
| Total | 12 | 100.0% |
School Enrollment by Age by Funding Source in Ronneby
Out of a total of 12 students who are enrolled in schools in Ronneby, 4 (33.3%) attend a private institution, while the remaining 8 (66.7%) are enrolled in public schools. The age group of 10 to 14 year olds has the highest likelihood of being enrolled in private schools, with 4 (57.1% in the age bracket) enrolled. Conversely, the age group of 15 to 17 year olds has the lowest likelihood of being enrolled in a private school, with 2 (100.0% in the age bracket) attending a public institution.
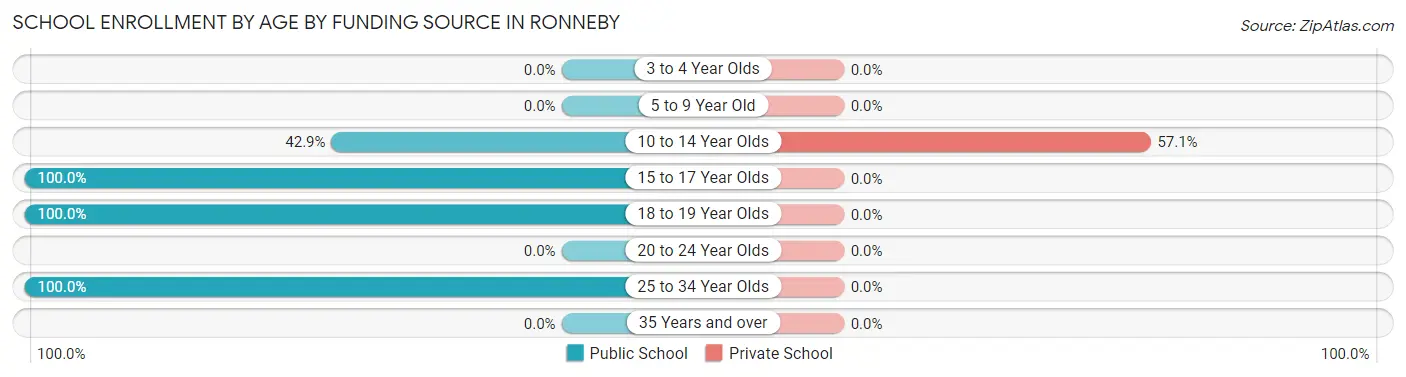
| Age Bracket | Public School | Private School |
| 3 to 4 Year Olds | 0 (0.0%) | 0 (0.0%) |
| 5 to 9 Year Old | 0 (0.0%) | 0 (0.0%) |
| 10 to 14 Year Olds | 3 (42.9%) | 4 (57.1%) |
| 15 to 17 Year Olds | 2 (100.0%) | 0 (0.0%) |
| 18 to 19 Year Olds | 2 (100.0%) | 0 (0.0%) |
| 20 to 24 Year Olds | 0 (0.0%) | 0 (0.0%) |
| 25 to 34 Year Olds | 1 (100.0%) | 0 (0.0%) |
| 35 Years and over | 0 (0.0%) | 0 (0.0%) |
| Total | 8 (66.7%) | 4 (33.3%) |
Educational Attainment by Field of Study in Ronneby
Science & technology (3 | 42.9%), bio, nature & agricultural (2 | 28.6%), and education (2 | 28.6%) are the most common fields of study among 7 individuals in Ronneby who have obtained a bachelor's degree or higher.
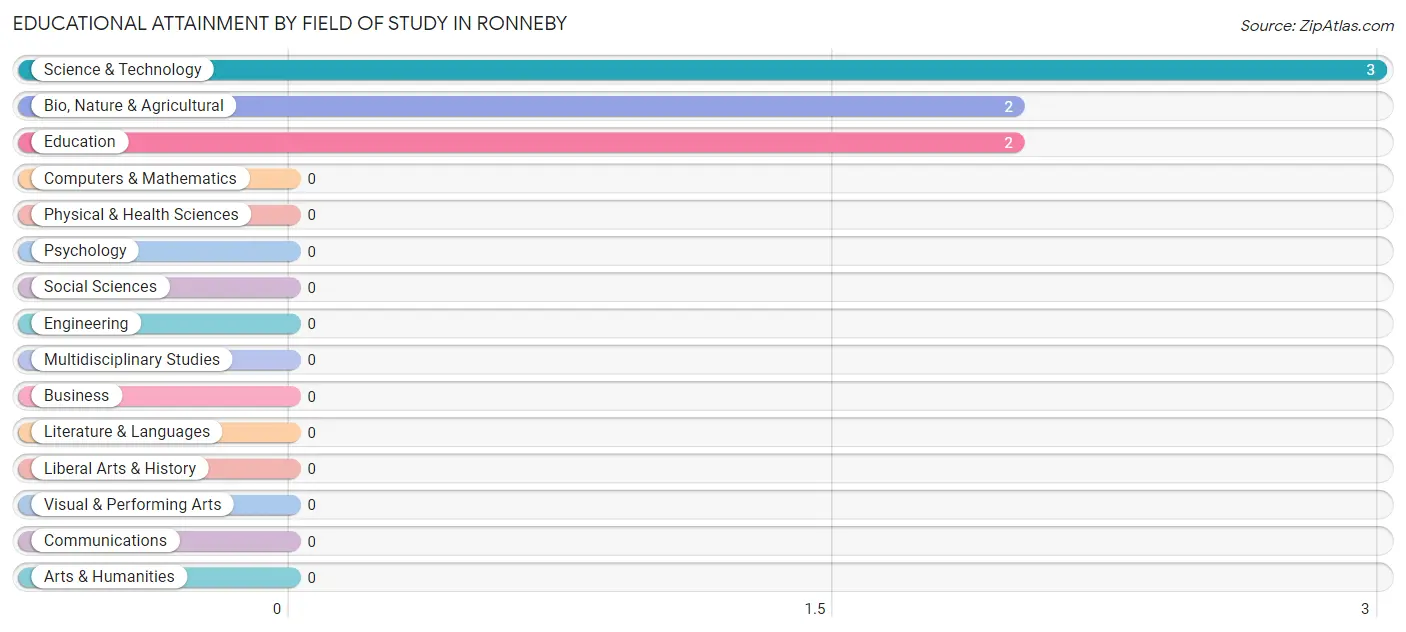
| Field of Study | # Graduates | % Graduates |
| Computers & Mathematics | 0 | 0.0% |
| Bio, Nature & Agricultural | 2 | 28.6% |
| Physical & Health Sciences | 0 | 0.0% |
| Psychology | 0 | 0.0% |
| Social Sciences | 0 | 0.0% |
| Engineering | 0 | 0.0% |
| Multidisciplinary Studies | 0 | 0.0% |
| Science & Technology | 3 | 42.9% |
| Business | 0 | 0.0% |
| Education | 2 | 28.6% |
| Literature & Languages | 0 | 0.0% |
| Liberal Arts & History | 0 | 0.0% |
| Visual & Performing Arts | 0 | 0.0% |
| Communications | 0 | 0.0% |
| Arts & Humanities | 0 | 0.0% |
| Total | 7 | 100.0% |
Transportation & Commute in Ronneby
Vehicle Availability by Sex in Ronneby
The most prevalent vehicle ownership categories in Ronneby are males with 3 vehicles (8, accounting for 44.4%) and females with 3 vehicles (4, making up 88.9%).
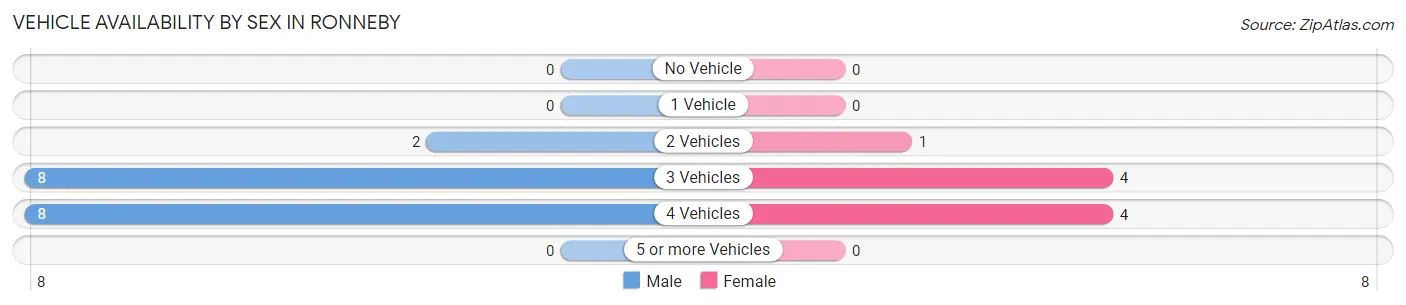
| Vehicles Available | Male | Female |
| No Vehicle | 0 (0.0%) | 0 (0.0%) |
| 1 Vehicle | 0 (0.0%) | 0 (0.0%) |
| 2 Vehicles | 2 (11.1%) | 1 (11.1%) |
| 3 Vehicles | 8 (44.4%) | 4 (44.4%) |
| 4 Vehicles | 8 (44.4%) | 4 (44.4%) |
| 5 or more Vehicles | 0 (0.0%) | 0 (0.0%) |
| Total | 18 (100.0%) | 9 (100.0%) |
Commute Time in Ronneby
The most frequently occuring commute durations in Ronneby are 15 to 19 minutes (10 commuters, 43.5%), 20 to 24 minutes (6 commuters, 26.1%), and 5 to 9 minutes (4 commuters, 17.4%).
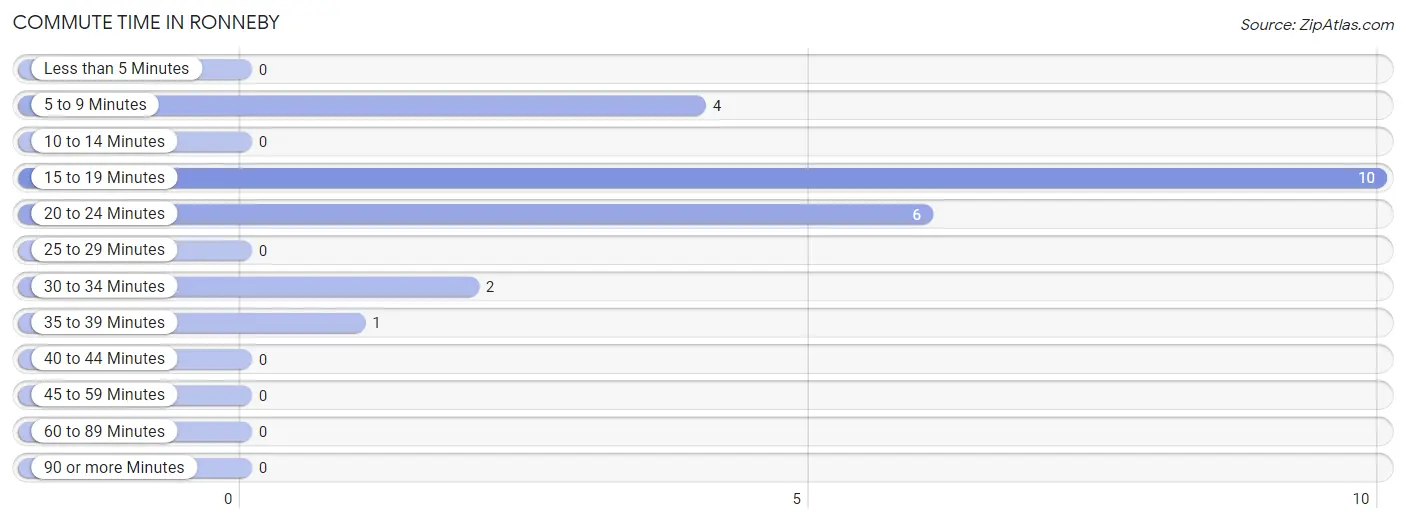
| Commute Time | # Commuters | % Commuters |
| Less than 5 Minutes | 0 | 0.0% |
| 5 to 9 Minutes | 4 | 17.4% |
| 10 to 14 Minutes | 0 | 0.0% |
| 15 to 19 Minutes | 10 | 43.5% |
| 20 to 24 Minutes | 6 | 26.1% |
| 25 to 29 Minutes | 0 | 0.0% |
| 30 to 34 Minutes | 2 | 8.7% |
| 35 to 39 Minutes | 1 | 4.3% |
| 40 to 44 Minutes | 0 | 0.0% |
| 45 to 59 Minutes | 0 | 0.0% |
| 60 to 89 Minutes | 0 | 0.0% |
| 90 or more Minutes | 0 | 0.0% |
Commute Time by Sex in Ronneby
The most common commute times in Ronneby are 15 to 19 minutes (10 commuters, 55.6%) for males and 5 to 9 minutes (2 commuters, 40.0%) for females.
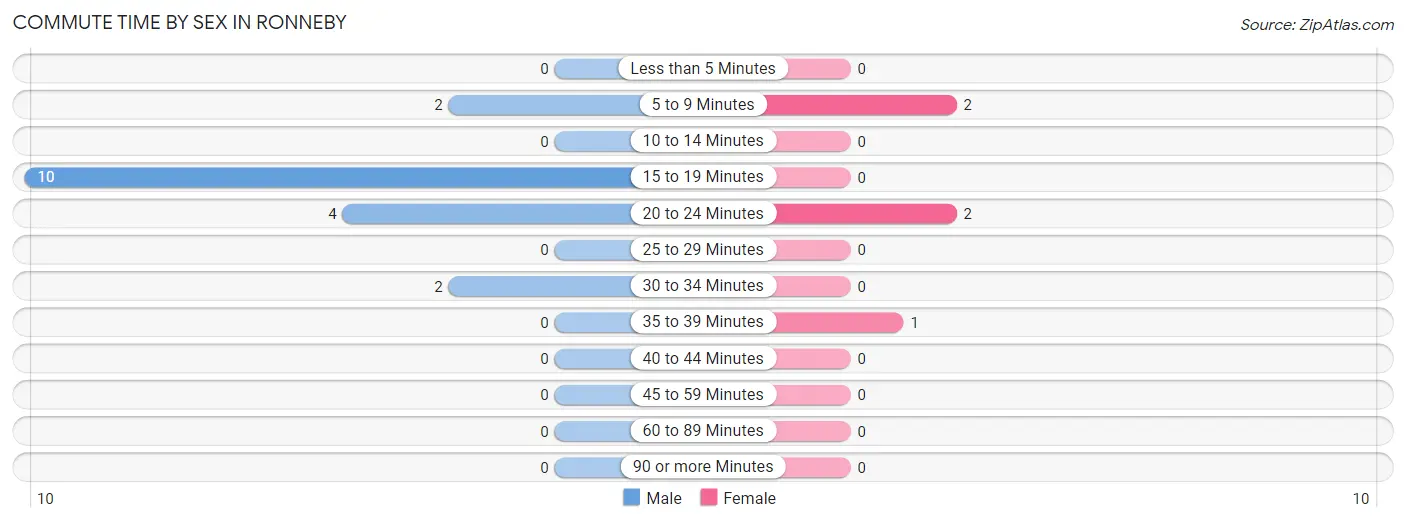
| Commute Time | Male | Female |
| Less than 5 Minutes | 0 (0.0%) | 0 (0.0%) |
| 5 to 9 Minutes | 2 (11.1%) | 2 (40.0%) |
| 10 to 14 Minutes | 0 (0.0%) | 0 (0.0%) |
| 15 to 19 Minutes | 10 (55.6%) | 0 (0.0%) |
| 20 to 24 Minutes | 4 (22.2%) | 2 (40.0%) |
| 25 to 29 Minutes | 0 (0.0%) | 0 (0.0%) |
| 30 to 34 Minutes | 2 (11.1%) | 0 (0.0%) |
| 35 to 39 Minutes | 0 (0.0%) | 1 (20.0%) |
| 40 to 44 Minutes | 0 (0.0%) | 0 (0.0%) |
| 45 to 59 Minutes | 0 (0.0%) | 0 (0.0%) |
| 60 to 89 Minutes | 0 (0.0%) | 0 (0.0%) |
| 90 or more Minutes | 0 (0.0%) | 0 (0.0%) |
Time of Departure to Work by Sex in Ronneby
The most frequent times of departure to work in Ronneby are 7:00 AM to 7:29 AM (6, 33.3%) for males and 4:00 PM to 11:59 PM (3, 60.0%) for females.
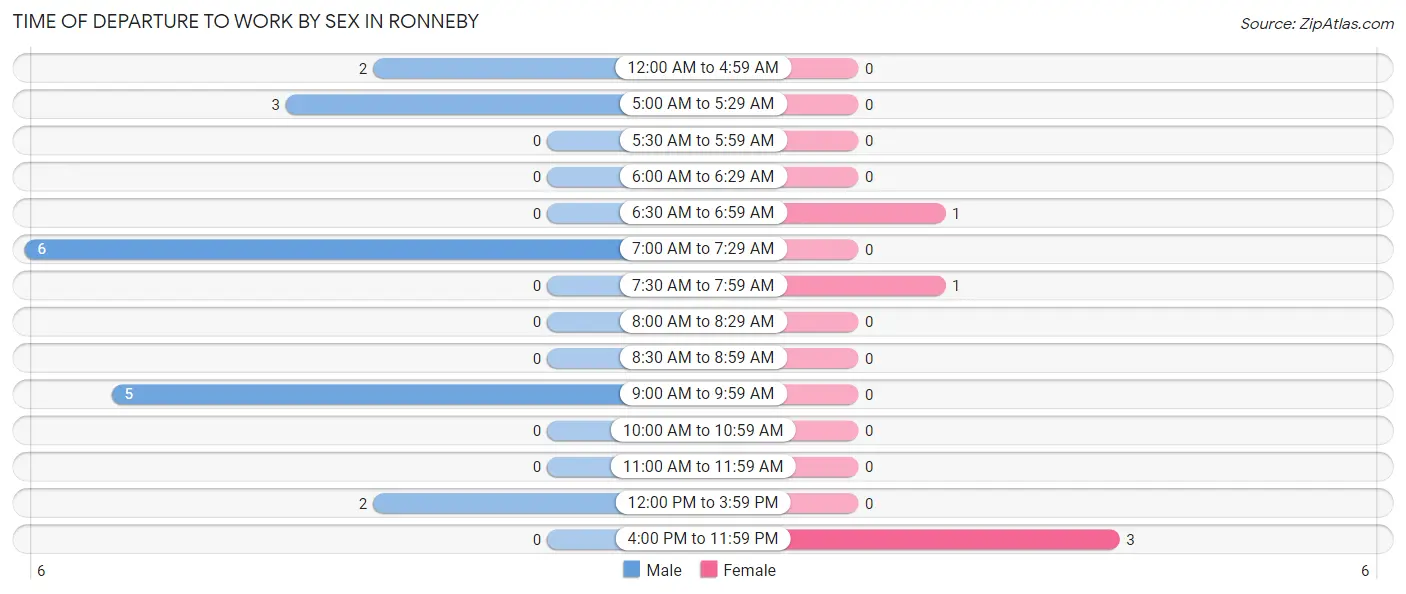
| Time of Departure | Male | Female |
| 12:00 AM to 4:59 AM | 2 (11.1%) | 0 (0.0%) |
| 5:00 AM to 5:29 AM | 3 (16.7%) | 0 (0.0%) |
| 5:30 AM to 5:59 AM | 0 (0.0%) | 0 (0.0%) |
| 6:00 AM to 6:29 AM | 0 (0.0%) | 0 (0.0%) |
| 6:30 AM to 6:59 AM | 0 (0.0%) | 1 (20.0%) |
| 7:00 AM to 7:29 AM | 6 (33.3%) | 0 (0.0%) |
| 7:30 AM to 7:59 AM | 0 (0.0%) | 1 (20.0%) |
| 8:00 AM to 8:29 AM | 0 (0.0%) | 0 (0.0%) |
| 8:30 AM to 8:59 AM | 0 (0.0%) | 0 (0.0%) |
| 9:00 AM to 9:59 AM | 5 (27.8%) | 0 (0.0%) |
| 10:00 AM to 10:59 AM | 0 (0.0%) | 0 (0.0%) |
| 11:00 AM to 11:59 AM | 0 (0.0%) | 0 (0.0%) |
| 12:00 PM to 3:59 PM | 2 (11.1%) | 0 (0.0%) |
| 4:00 PM to 11:59 PM | 0 (0.0%) | 3 (60.0%) |
| Total | 18 (100.0%) | 5 (100.0%) |
Housing Occupancy in Ronneby
Occupancy by Ownership in Ronneby
Of the total 16 dwellings in Ronneby, owner-occupied units account for 16 (100.0%), while renter-occupied units make up 0 (0.0%).
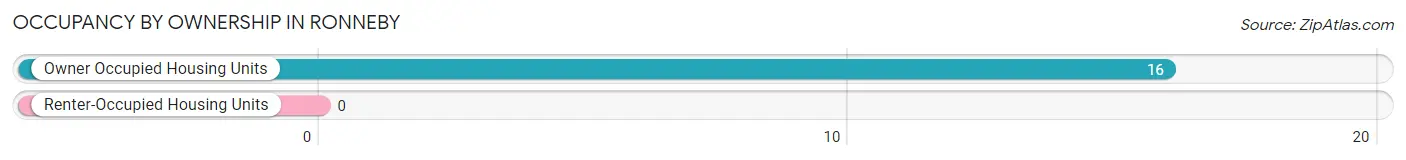
| Occupancy | # Housing Units | % Housing Units |
| Owner Occupied Housing Units | 16 | 100.0% |
| Renter-Occupied Housing Units | 0 | 0.0% |
| Total Occupied Housing Units | 16 | 100.0% |
Occupancy by Household Size in Ronneby
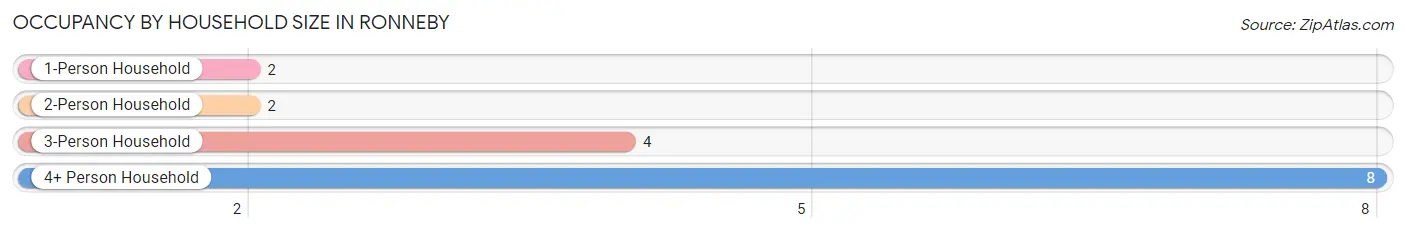
| Household Size | # Housing Units | % Housing Units |
| 1-Person Household | 2 | 12.5% |
| 2-Person Household | 2 | 12.5% |
| 3-Person Household | 4 | 25.0% |
| 4+ Person Household | 8 | 50.0% |
| Total Housing Units | 16 | 100.0% |
Occupancy by Ownership by Household Size in Ronneby
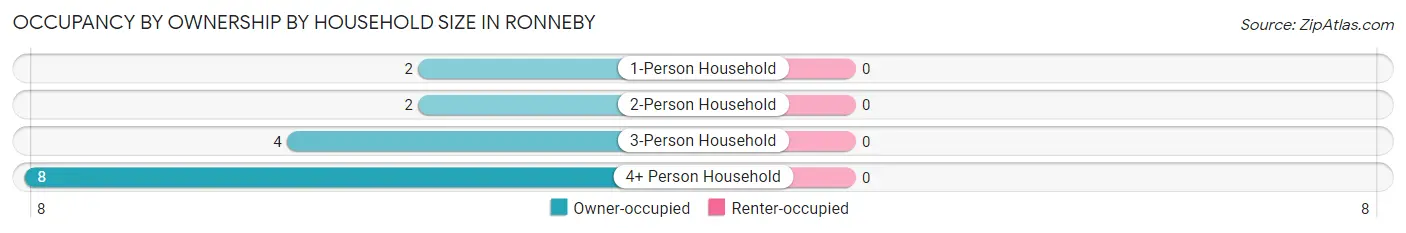
| Household Size | Owner-occupied | Renter-occupied |
| 1-Person Household | 2 (100.0%) | 0 (0.0%) |
| 2-Person Household | 2 (100.0%) | 0 (0.0%) |
| 3-Person Household | 4 (100.0%) | 0 (0.0%) |
| 4+ Person Household | 8 (100.0%) | 0 (0.0%) |
| Total Housing Units | 16 (100.0%) | 0 (0.0%) |
Occupancy by Educational Attainment in Ronneby
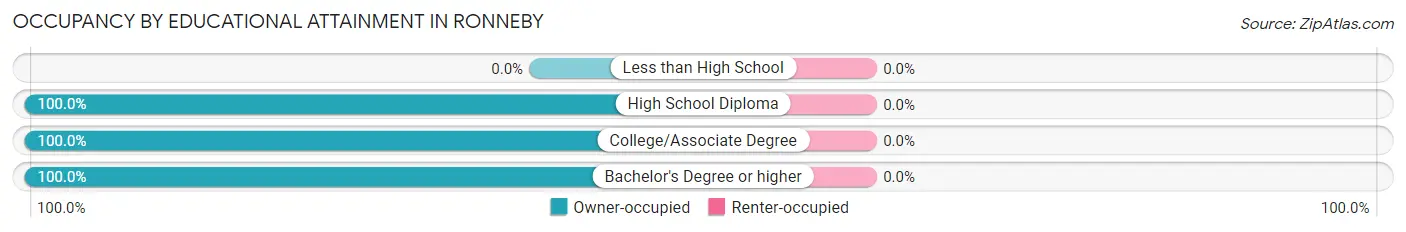
| Household Size | Owner-occupied | Renter-occupied |
| Less than High School | 0 (0.0%) | 0 (0.0%) |
| High School Diploma | 8 (100.0%) | 0 (0.0%) |
| College/Associate Degree | 3 (100.0%) | 0 (0.0%) |
| Bachelor's Degree or higher | 5 (100.0%) | 0 (0.0%) |
Occupancy by Age of Householder in Ronneby
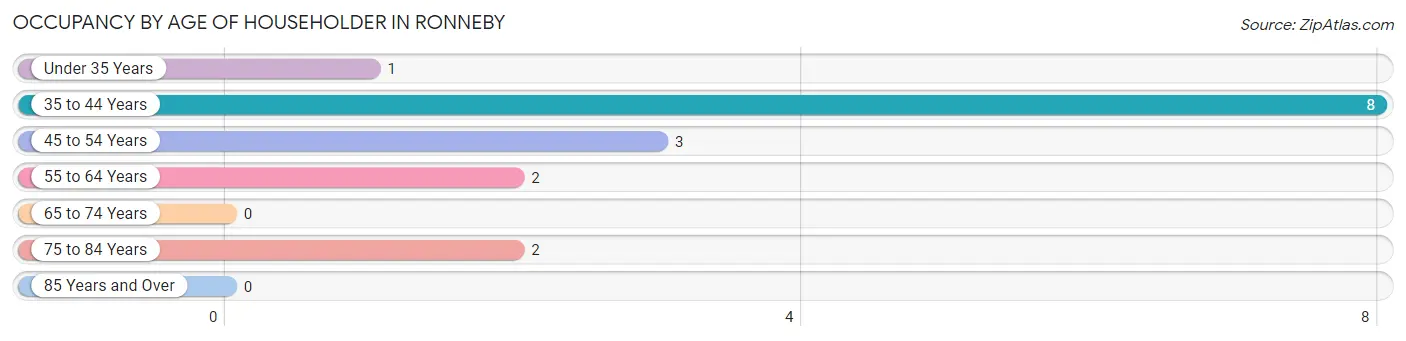
| Age Bracket | # Households | % Households |
| Under 35 Years | 1 | 6.2% |
| 35 to 44 Years | 8 | 50.0% |
| 45 to 54 Years | 3 | 18.8% |
| 55 to 64 Years | 2 | 12.5% |
| 65 to 74 Years | 0 | 0.0% |
| 75 to 84 Years | 2 | 12.5% |
| 85 Years and Over | 0 | 0.0% |
| Total | 16 | 100.0% |
Housing Finances in Ronneby
Median Income by Occupancy in Ronneby
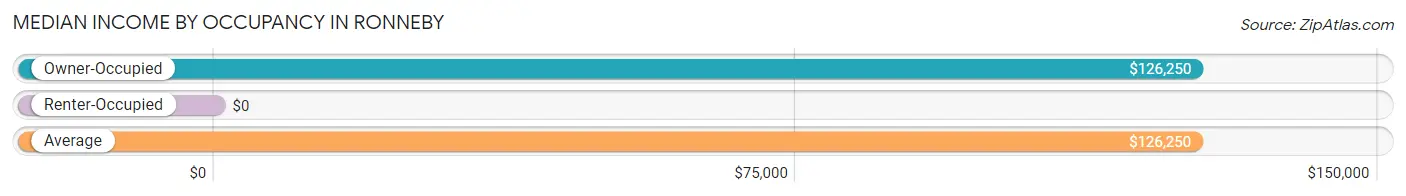
| Occupancy Type | # Households | Median Income |
| Owner-Occupied | 16 (100.0%) | $126,250 |
| Renter-Occupied | 0 (0.0%) | $0 |
| Average | 16 (100.0%) | $126,250 |
Occupancy by Householder Income Bracket in Ronneby
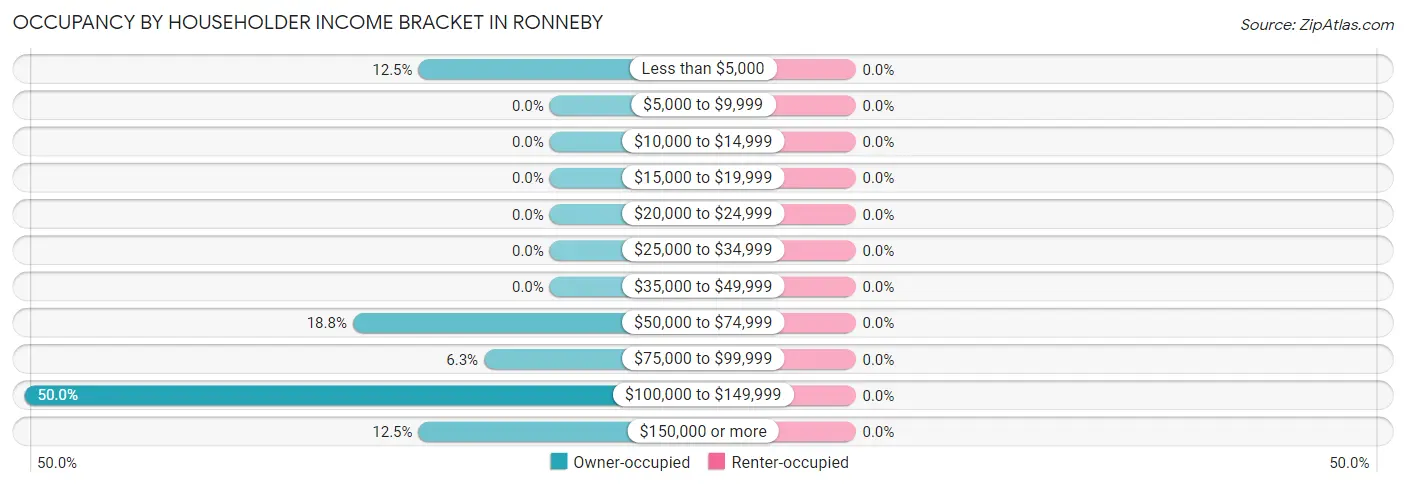
| Income Bracket | Owner-occupied | Renter-occupied |
| Less than $5,000 | 2 (12.5%) | 0 (0.0%) |
| $5,000 to $9,999 | 0 (0.0%) | 0 (0.0%) |
| $10,000 to $14,999 | 0 (0.0%) | 0 (0.0%) |
| $15,000 to $19,999 | 0 (0.0%) | 0 (0.0%) |
| $20,000 to $24,999 | 0 (0.0%) | 0 (0.0%) |
| $25,000 to $34,999 | 0 (0.0%) | 0 (0.0%) |
| $35,000 to $49,999 | 0 (0.0%) | 0 (0.0%) |
| $50,000 to $74,999 | 3 (18.8%) | 0 (0.0%) |
| $75,000 to $99,999 | 1 (6.2%) | 0 (0.0%) |
| $100,000 to $149,999 | 8 (50.0%) | 0 (0.0%) |
| $150,000 or more | 2 (12.5%) | 0 (0.0%) |
| Total | 16 (100.0%) | 0 (0.0%) |
Monthly Housing Cost Tiers in Ronneby
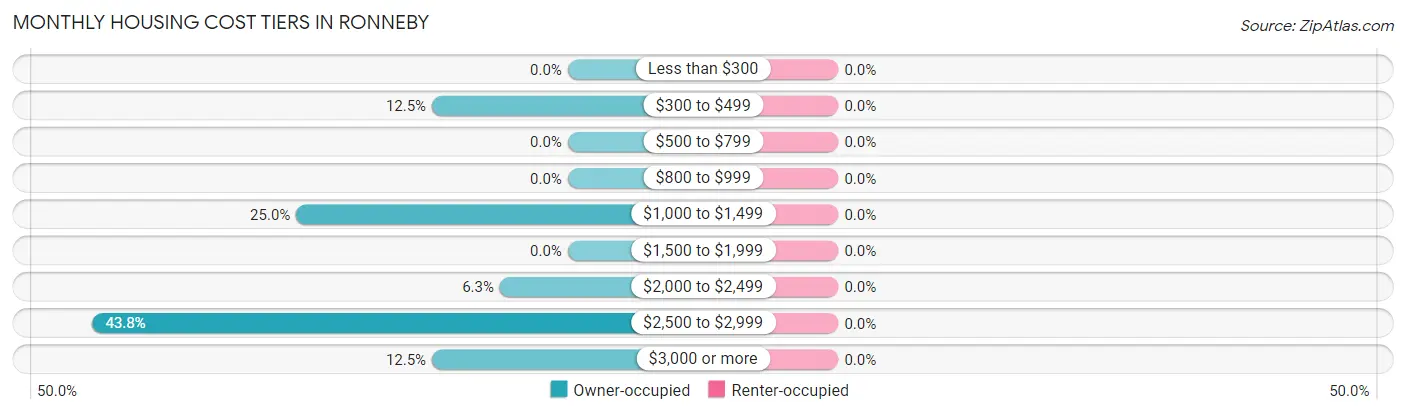
| Monthly Cost | Owner-occupied | Renter-occupied |
| Less than $300 | 0 (0.0%) | 0 (0.0%) |
| $300 to $499 | 2 (12.5%) | 0 (0.0%) |
| $500 to $799 | 0 (0.0%) | 0 (0.0%) |
| $800 to $999 | 0 (0.0%) | 0 (0.0%) |
| $1,000 to $1,499 | 4 (25.0%) | 0 (0.0%) |
| $1,500 to $1,999 | 0 (0.0%) | 0 (0.0%) |
| $2,000 to $2,499 | 1 (6.2%) | 0 (0.0%) |
| $2,500 to $2,999 | 7 (43.8%) | 0 (0.0%) |
| $3,000 or more | 2 (12.5%) | 0 (0.0%) |
| Total | 16 (100.0%) | 0 (0.0%) |
Physical Housing Characteristics in Ronneby
Housing Structures in Ronneby
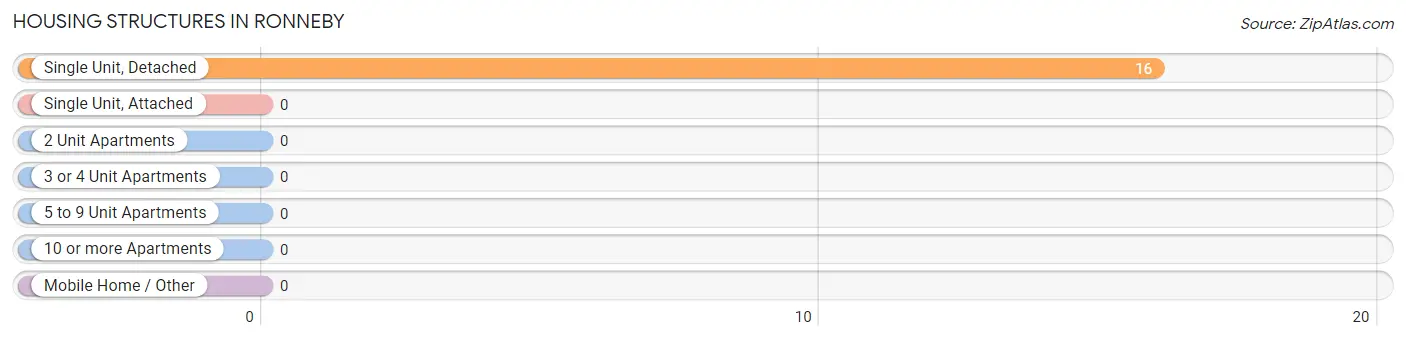
| Structure Type | # Housing Units | % Housing Units |
| Single Unit, Detached | 16 | 100.0% |
| Single Unit, Attached | 0 | 0.0% |
| 2 Unit Apartments | 0 | 0.0% |
| 3 or 4 Unit Apartments | 0 | 0.0% |
| 5 to 9 Unit Apartments | 0 | 0.0% |
| 10 or more Apartments | 0 | 0.0% |
| Mobile Home / Other | 0 | 0.0% |
| Total | 16 | 100.0% |
Housing Structures by Occupancy in Ronneby
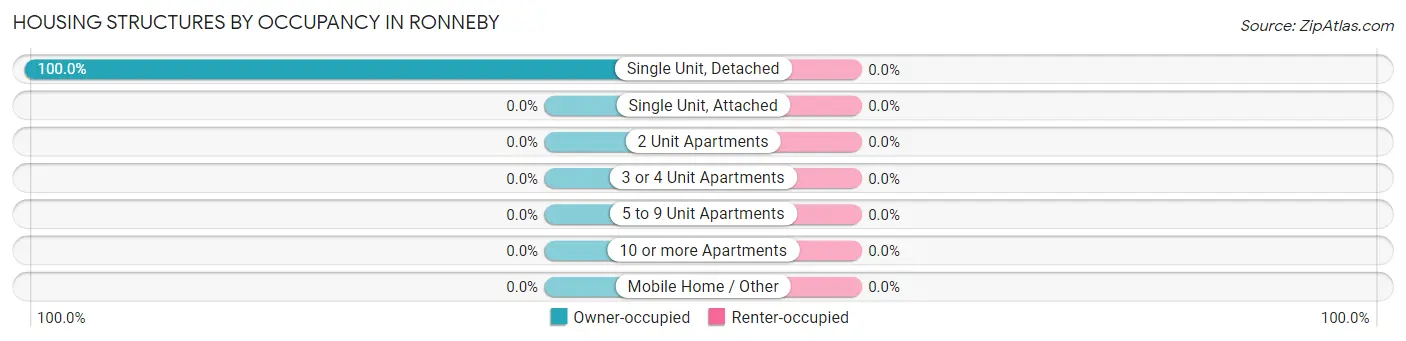
| Structure Type | Owner-occupied | Renter-occupied |
| Single Unit, Detached | 16 (100.0%) | 0 (0.0%) |
| Single Unit, Attached | 0 (0.0%) | 0 (0.0%) |
| 2 Unit Apartments | 0 (0.0%) | 0 (0.0%) |
| 3 or 4 Unit Apartments | 0 (0.0%) | 0 (0.0%) |
| 5 to 9 Unit Apartments | 0 (0.0%) | 0 (0.0%) |
| 10 or more Apartments | 0 (0.0%) | 0 (0.0%) |
| Mobile Home / Other | 0 (0.0%) | 0 (0.0%) |
| Total | 16 (100.0%) | 0 (0.0%) |
Housing Structures by Number of Rooms in Ronneby
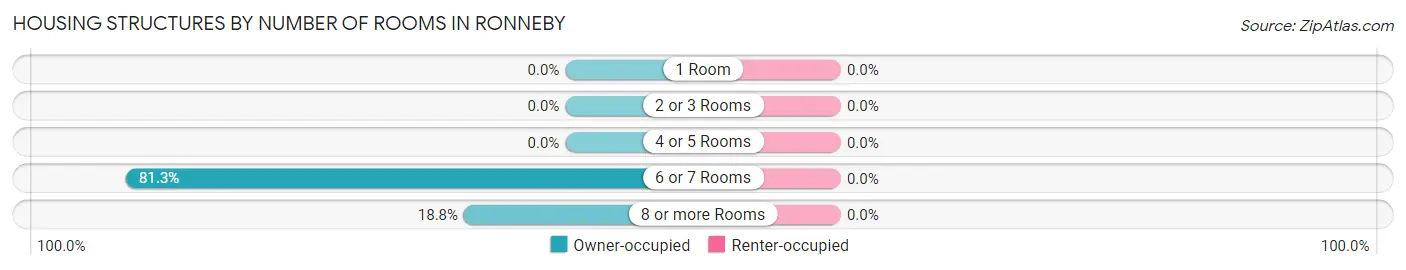
| Number of Rooms | Owner-occupied | Renter-occupied |
| 1 Room | 0 (0.0%) | 0 (0.0%) |
| 2 or 3 Rooms | 0 (0.0%) | 0 (0.0%) |
| 4 or 5 Rooms | 0 (0.0%) | 0 (0.0%) |
| 6 or 7 Rooms | 13 (81.2%) | 0 (0.0%) |
| 8 or more Rooms | 3 (18.8%) | 0 (0.0%) |
| Total | 16 (100.0%) | 0 (0.0%) |
Housing Structure by Heating Type in Ronneby
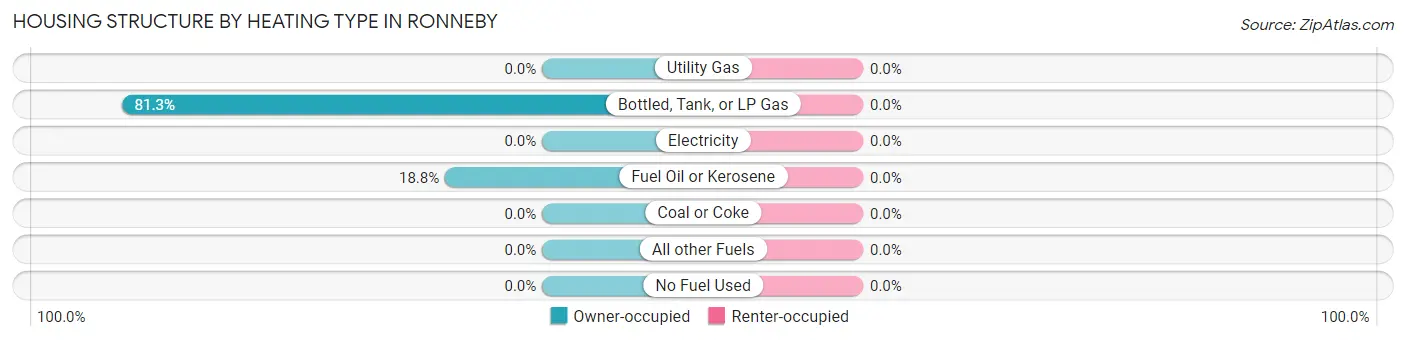
| Heating Type | Owner-occupied | Renter-occupied |
| Utility Gas | 0 (0.0%) | 0 (0.0%) |
| Bottled, Tank, or LP Gas | 13 (81.2%) | 0 (0.0%) |
| Electricity | 0 (0.0%) | 0 (0.0%) |
| Fuel Oil or Kerosene | 3 (18.8%) | 0 (0.0%) |
| Coal or Coke | 0 (0.0%) | 0 (0.0%) |
| All other Fuels | 0 (0.0%) | 0 (0.0%) |
| No Fuel Used | 0 (0.0%) | 0 (0.0%) |
| Total | 16 (100.0%) | 0 (0.0%) |
Household Vehicle Usage in Ronneby
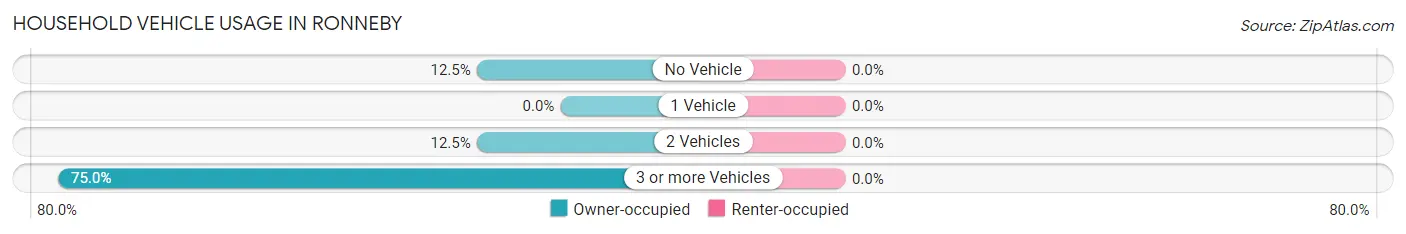
| Vehicles per Household | Owner-occupied | Renter-occupied |
| No Vehicle | 2 (12.5%) | 0 (0.0%) |
| 1 Vehicle | 0 (0.0%) | 0 (0.0%) |
| 2 Vehicles | 2 (12.5%) | 0 (0.0%) |
| 3 or more Vehicles | 12 (75.0%) | 0 (0.0%) |
| Total | 16 (100.0%) | 0 (0.0%) |
Real Estate & Mortgages in Ronneby
Real Estate and Mortgage Overview in Ronneby
| Characteristic | Without Mortgage | With Mortgage |
| Housing Units | 2 | 14 |
| Median Property Value | - | - |
| Median Household Income | - | - |
| Monthly Housing Costs | - | - |
| Real Estate Taxes | - | - |
Property Value by Mortgage Status in Ronneby
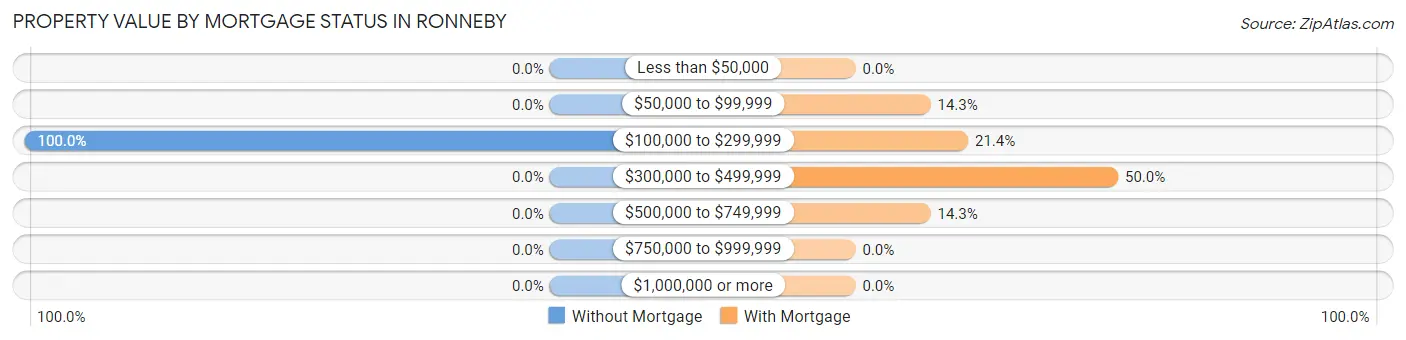
| Property Value | Without Mortgage | With Mortgage |
| Less than $50,000 | 0 (0.0%) | 0 (0.0%) |
| $50,000 to $99,999 | 0 (0.0%) | 2 (14.3%) |
| $100,000 to $299,999 | 2 (100.0%) | 3 (21.4%) |
| $300,000 to $499,999 | 0 (0.0%) | 7 (50.0%) |
| $500,000 to $749,999 | 0 (0.0%) | 2 (14.3%) |
| $750,000 to $999,999 | 0 (0.0%) | 0 (0.0%) |
| $1,000,000 or more | 0 (0.0%) | 0 (0.0%) |
| Total | 2 (100.0%) | 14 (100.0%) |
Household Income by Mortgage Status in Ronneby
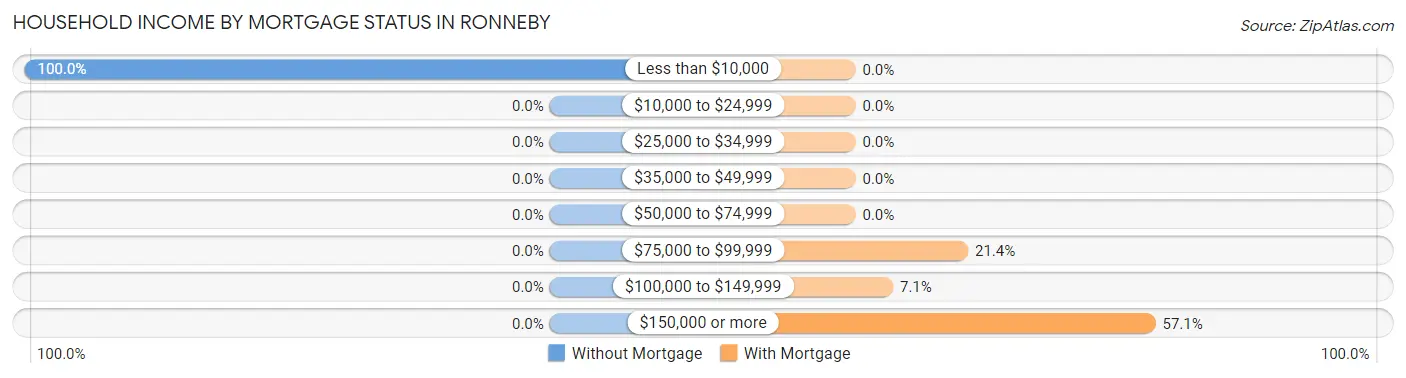
| Household Income | Without Mortgage | With Mortgage |
| Less than $10,000 | 2 (100.0%) | 0 (0.0%) |
| $10,000 to $24,999 | 0 (0.0%) | 0 (0.0%) |
| $25,000 to $34,999 | 0 (0.0%) | 0 (0.0%) |
| $35,000 to $49,999 | 0 (0.0%) | 0 (0.0%) |
| $50,000 to $74,999 | 0 (0.0%) | 0 (0.0%) |
| $75,000 to $99,999 | 0 (0.0%) | 3 (21.4%) |
| $100,000 to $149,999 | 0 (0.0%) | 1 (7.1%) |
| $150,000 or more | 0 (0.0%) | 8 (57.1%) |
| Total | 2 (100.0%) | 14 (100.0%) |
Property Value to Household Income Ratio in Ronneby
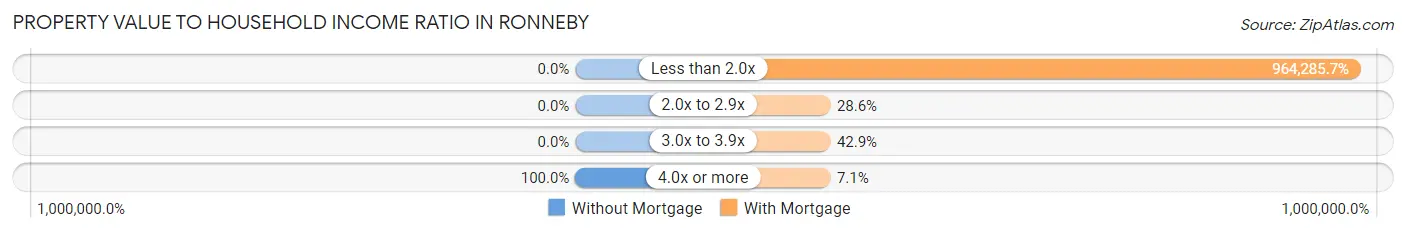
| Value-to-Income Ratio | Without Mortgage | With Mortgage |
| Less than 2.0x | 0 (0.0%) | 135,000 (964,285.7%) |
| 2.0x to 2.9x | 0 (0.0%) | 4 (28.6%) |
| 3.0x to 3.9x | 0 (0.0%) | 6 (42.9%) |
| 4.0x or more | 2 (100.0%) | 1 (7.1%) |
| Total | 2 (100.0%) | 14 (100.0%) |
Real Estate Taxes by Mortgage Status in Ronneby
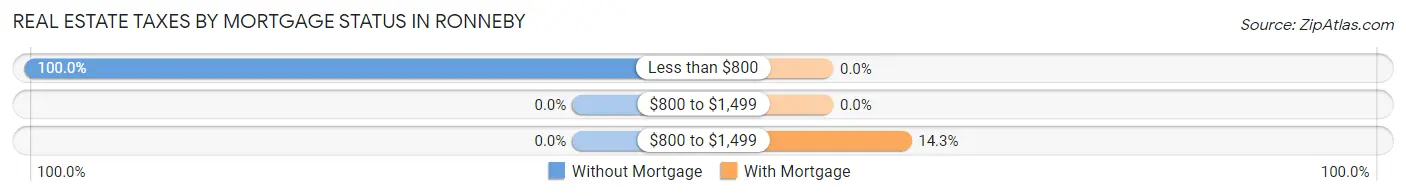
| Property Taxes | Without Mortgage | With Mortgage |
| Less than $800 | 2 (100.0%) | 0 (0.0%) |
| $800 to $1,499 | 0 (0.0%) | 0 (0.0%) |
| $800 to $1,499 | 0 (0.0%) | 2 (14.3%) |
| Total | 2 (100.0%) | 14 (100.0%) |
Health & Disability in Ronneby
Health Insurance Coverage by Age in Ronneby
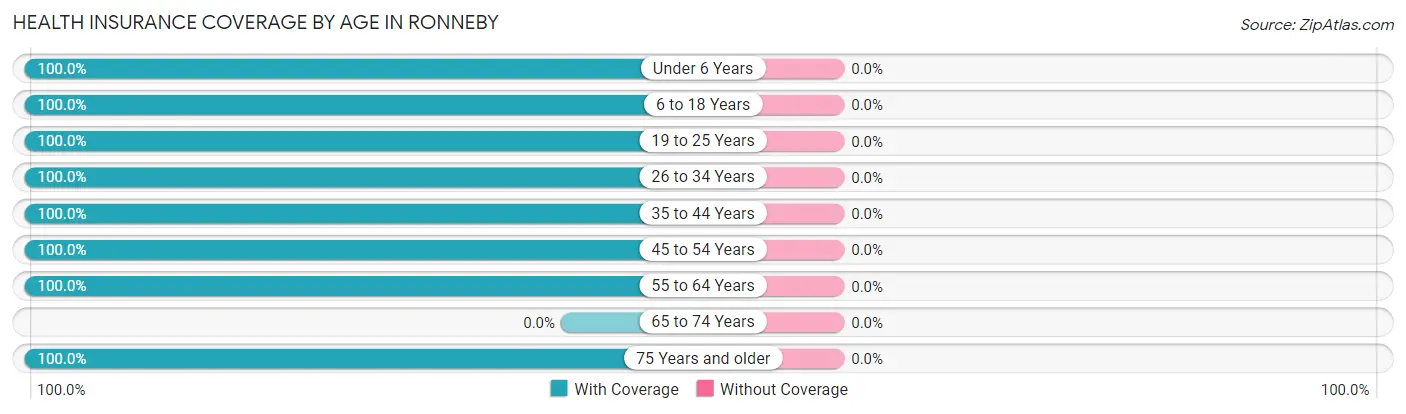
| Age Bracket | With Coverage | Without Coverage |
| Under 6 Years | 9 (100.0%) | 0 (0.0%) |
| 6 to 18 Years | 11 (100.0%) | 0 (0.0%) |
| 19 to 25 Years | 2 (100.0%) | 0 (0.0%) |
| 26 to 34 Years | 3 (100.0%) | 0 (0.0%) |
| 35 to 44 Years | 13 (100.0%) | 0 (0.0%) |
| 45 to 54 Years | 12 (100.0%) | 0 (0.0%) |
| 55 to 64 Years | 2 (100.0%) | 0 (0.0%) |
| 65 to 74 Years | 0 (0.0%) | 0 (0.0%) |
| 75 Years and older | 2 (100.0%) | 0 (0.0%) |
| Total | 54 (100.0%) | 0 (0.0%) |
Health Insurance Coverage by Citizenship Status in Ronneby
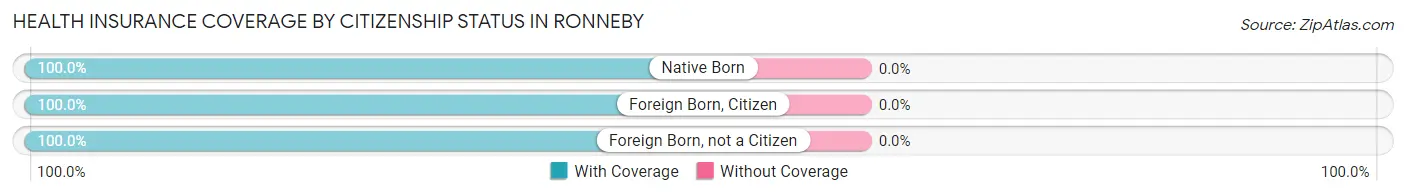
| Citizenship Status | With Coverage | Without Coverage |
| Native Born | 9 (100.0%) | 0 (0.0%) |
| Foreign Born, Citizen | 11 (100.0%) | 0 (0.0%) |
| Foreign Born, not a Citizen | 2 (100.0%) | 0 (0.0%) |
Health Insurance Coverage by Household Income in Ronneby
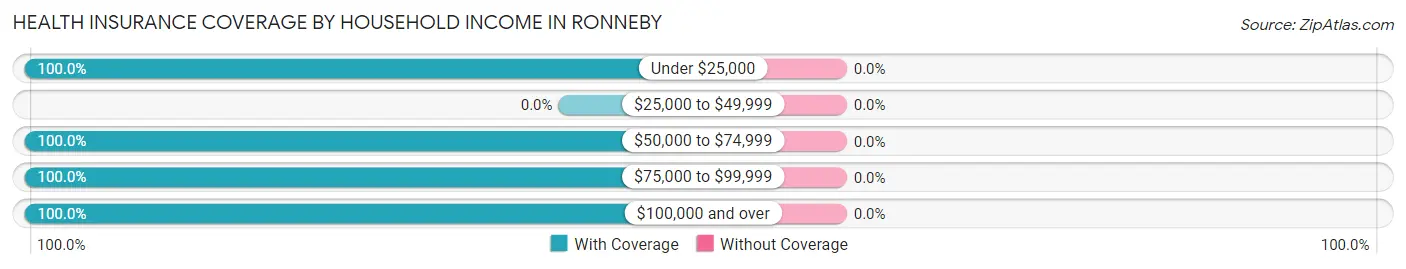
| Household Income | With Coverage | Without Coverage |
| Under $25,000 | 2 (100.0%) | 0 (0.0%) |
| $25,000 to $49,999 | 0 (0.0%) | 0 (0.0%) |
| $50,000 to $74,999 | 13 (100.0%) | 0 (0.0%) |
| $75,000 to $99,999 | 5 (100.0%) | 0 (0.0%) |
| $100,000 and over | 34 (100.0%) | 0 (0.0%) |
Public vs Private Health Insurance Coverage by Age in Ronneby
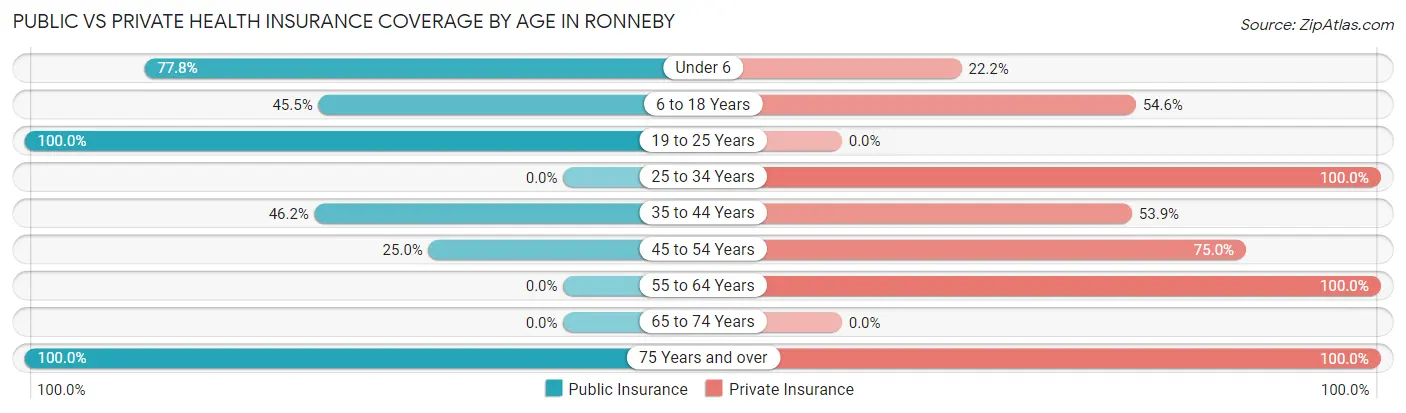
| Age Bracket | Public Insurance | Private Insurance |
| Under 6 | 7 (77.8%) | 2 (22.2%) |
| 6 to 18 Years | 5 (45.5%) | 6 (54.5%) |
| 19 to 25 Years | 2 (100.0%) | 0 (0.0%) |
| 25 to 34 Years | 0 (0.0%) | 3 (100.0%) |
| 35 to 44 Years | 6 (46.2%) | 7 (53.8%) |
| 45 to 54 Years | 3 (25.0%) | 9 (75.0%) |
| 55 to 64 Years | 0 (0.0%) | 2 (100.0%) |
| 65 to 74 Years | 0 (0.0%) | 0 (0.0%) |
| 75 Years and over | 2 (100.0%) | 2 (100.0%) |
| Total | 25 (46.3%) | 31 (57.4%) |
Disability Status by Sex by Age in Ronneby
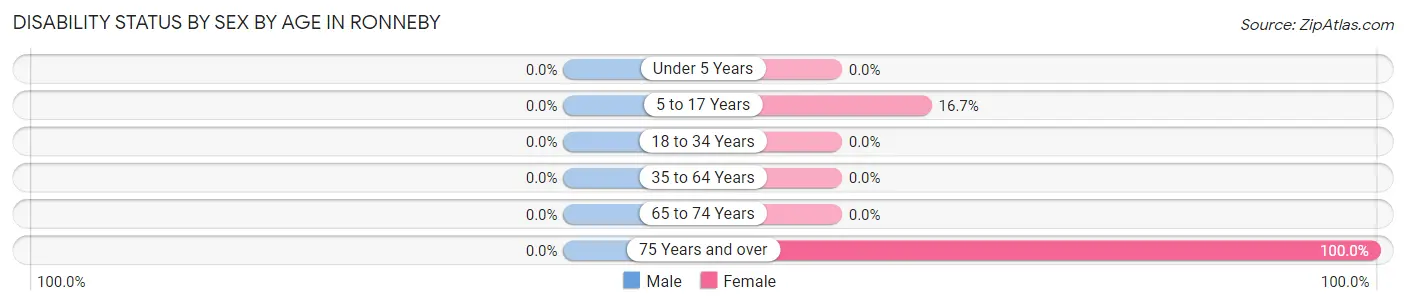
| Age Bracket | Male | Female |
| Under 5 Years | 0 (0.0%) | 0 (0.0%) |
| 5 to 17 Years | 0 (0.0%) | 1 (16.7%) |
| 18 to 34 Years | 0 (0.0%) | 0 (0.0%) |
| 35 to 64 Years | 0 (0.0%) | 0 (0.0%) |
| 65 to 74 Years | 0 (0.0%) | 0 (0.0%) |
| 75 Years and over | 0 (0.0%) | 2 (100.0%) |
Disability Class by Sex by Age in Ronneby
Disability Class: Hearing Difficulty
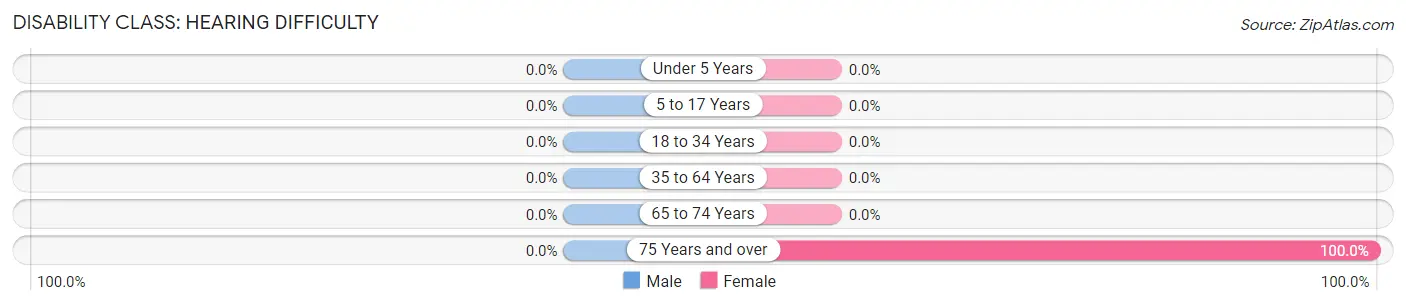
| Age Bracket | Male | Female |
| Under 5 Years | 0 (0.0%) | 0 (0.0%) |
| 5 to 17 Years | 0 (0.0%) | 0 (0.0%) |
| 18 to 34 Years | 0 (0.0%) | 0 (0.0%) |
| 35 to 64 Years | 0 (0.0%) | 0 (0.0%) |
| 65 to 74 Years | 0 (0.0%) | 0 (0.0%) |
| 75 Years and over | 0 (0.0%) | 2 (100.0%) |
Disability Class: Vision Difficulty
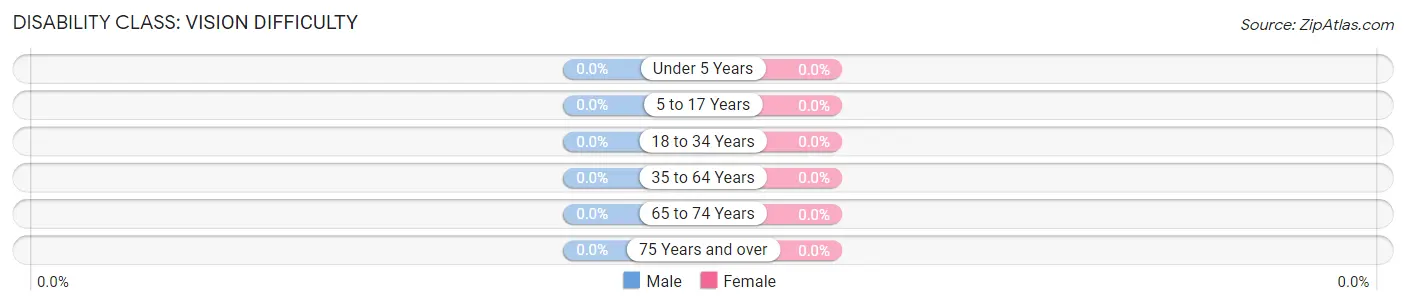
| Age Bracket | Male | Female |
| Under 5 Years | 0 (0.0%) | 0 (0.0%) |
| 5 to 17 Years | 0 (0.0%) | 0 (0.0%) |
| 18 to 34 Years | 0 (0.0%) | 0 (0.0%) |
| 35 to 64 Years | 0 (0.0%) | 0 (0.0%) |
| 65 to 74 Years | 0 (0.0%) | 0 (0.0%) |
| 75 Years and over | 0 (0.0%) | 0 (0.0%) |
Disability Class: Cognitive Difficulty
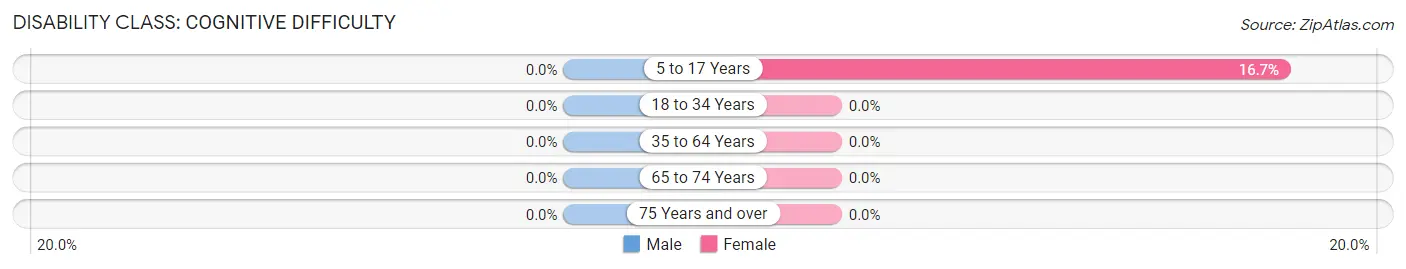
| Age Bracket | Male | Female |
| 5 to 17 Years | 0 (0.0%) | 1 (16.7%) |
| 18 to 34 Years | 0 (0.0%) | 0 (0.0%) |
| 35 to 64 Years | 0 (0.0%) | 0 (0.0%) |
| 65 to 74 Years | 0 (0.0%) | 0 (0.0%) |
| 75 Years and over | 0 (0.0%) | 0 (0.0%) |
Disability Class: Ambulatory Difficulty
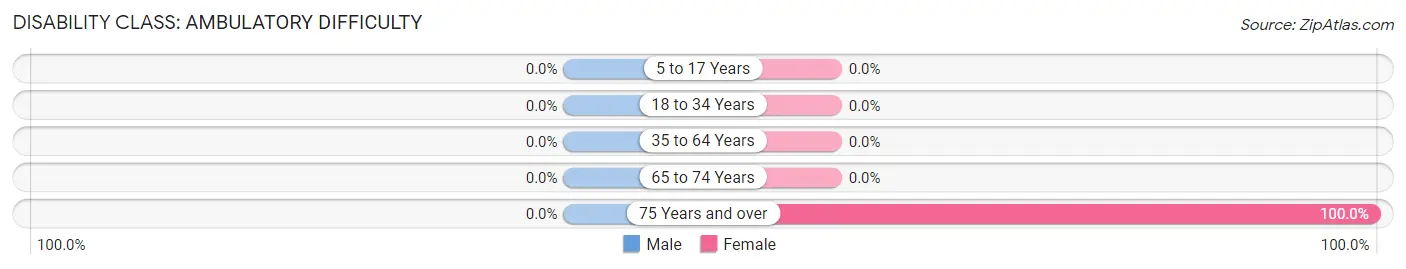
| Age Bracket | Male | Female |
| 5 to 17 Years | 0 (0.0%) | 0 (0.0%) |
| 18 to 34 Years | 0 (0.0%) | 0 (0.0%) |
| 35 to 64 Years | 0 (0.0%) | 0 (0.0%) |
| 65 to 74 Years | 0 (0.0%) | 0 (0.0%) |
| 75 Years and over | 0 (0.0%) | 2 (100.0%) |
Disability Class: Self-Care Difficulty
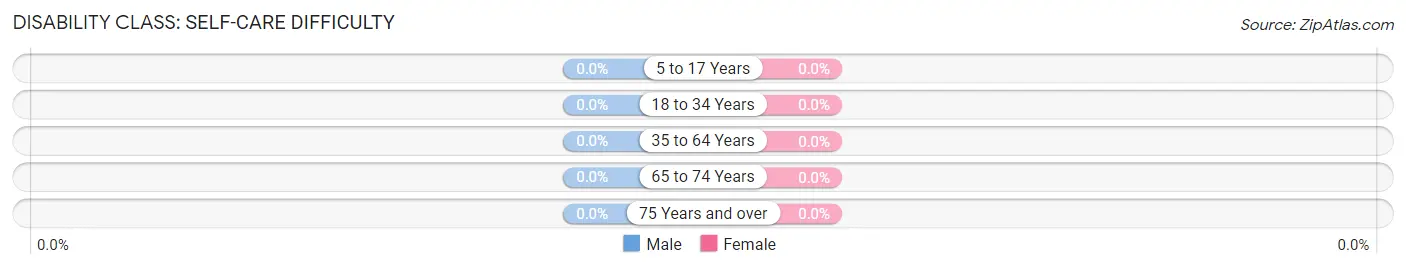
| Age Bracket | Male | Female |
| 5 to 17 Years | 0 (0.0%) | 0 (0.0%) |
| 18 to 34 Years | 0 (0.0%) | 0 (0.0%) |
| 35 to 64 Years | 0 (0.0%) | 0 (0.0%) |
| 65 to 74 Years | 0 (0.0%) | 0 (0.0%) |
| 75 Years and over | 0 (0.0%) | 0 (0.0%) |
Technology Access in Ronneby
Computing Device Access in Ronneby
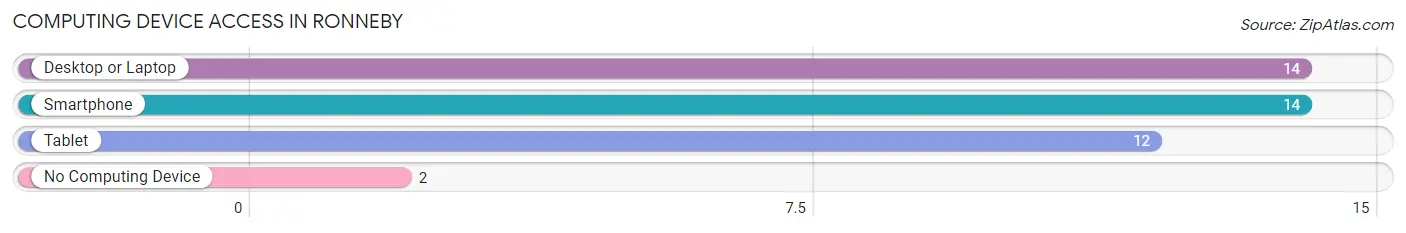
| Device Type | # Households | % Households |
| Desktop or Laptop | 14 | 87.5% |
| Smartphone | 14 | 87.5% |
| Tablet | 12 | 75.0% |
| No Computing Device | 2 | 12.5% |
| Total | 16 | 100.0% |
Internet Access in Ronneby
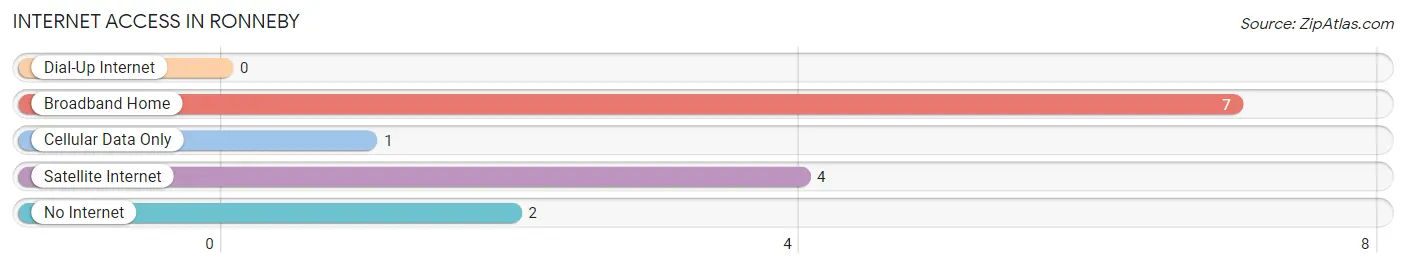
| Internet Type | # Households | % Households |
| Dial-Up Internet | 0 | 0.0% |
| Broadband Home | 7 | 43.8% |
| Cellular Data Only | 1 | 6.2% |
| Satellite Internet | 4 | 25.0% |
| No Internet | 2 | 12.5% |
| Total | 16 | 100.0% |
Ronneby Summary
Ronneby, Minnesota is a small town located in the southeastern corner of the state, near the border of Wisconsin. It is part of the Twin Cities metropolitan area and is located in the county of Chisago. The town has a population of approximately 1,500 people and is known for its rural charm and small-town atmosphere.
History
The area that is now Ronneby was first settled in the late 1800s by Swedish immigrants. The town was originally called “Swedish Settlement” and was later renamed “Ronneby” after the Swedish city of Ronneby. The town was officially incorporated in 1891 and has remained a small, rural community ever since.
Geography
Ronneby is located in the southeastern corner of Minnesota, near the border of Wisconsin. It is part of the Twin Cities metropolitan area and is located in the county of Chisago. The town is situated on the banks of the Sunrise River and is surrounded by rolling hills and forests. The town is located approximately 40 miles north of Minneapolis and is accessible by car or bus.
Economy
The economy of Ronneby is largely based on agriculture and tourism. The town is home to several small businesses, including a grocery store, a hardware store, and a few restaurants. The town also has a small industrial park, which is home to a few manufacturing companies. The town is also home to a few small farms, which produce a variety of crops, including corn, soybeans, and hay.
Demographics
As of the 2010 census, the population of Ronneby was 1,500 people. The town is predominantly white, with approximately 95% of the population being of European descent. The median household income in Ronneby is $45,000, which is slightly lower than the national average. The town has a low unemployment rate and a high rate of homeownership.
Conclusion
Ronneby, Minnesota is a small town located in the southeastern corner of the state, near the border of Wisconsin. It is part of the Twin Cities metropolitan area and is known for its rural charm and small-town atmosphere. The town has a population of approximately 1,500 people and is largely based on agriculture and tourism. The town is predominantly white, with approximately 95% of the population being of European descent. The median household income in Ronneby is $45,000, which is slightly lower than the national average. The town has a low unemployment rate and a high rate of homeownership.
Common Questions
What is Per Capita Income in Ronneby?
Per Capita income in Ronneby is $35,594.
What is the Median Family Income in Ronneby?
Median Family Income in Ronneby is $122,500.
What is the Median Household income in Ronneby?
Median Household Income in Ronneby is $126,250.
What is Inequality or Gini Index in Ronneby?
Inequality or Gini Index in Ronneby is 0.33.
What is the Total Population of Ronneby?
Total Population of Ronneby is 54.
What is the Total Male Population of Ronneby?
Total Male Population of Ronneby is 27.
What is the Total Female Population of Ronneby?
Total Female Population of Ronneby is 27.
What is the Ratio of Males per 100 Females in Ronneby?
There are 100.00 Males per 100 Females in Ronneby.
What is the Ratio of Females per 100 Males in Ronneby?
There are 100.00 Females per 100 Males in Ronneby.
What is the Median Population Age in Ronneby?
Median Population Age in Ronneby is 35.7 Years.
What is the Average Family Size in Ronneby
Average Family Size in Ronneby is 3.6 People.
What is the Average Household Size in Ronneby
Average Household Size in Ronneby is 3.4 People.
How Large is the Labor Force in Ronneby?
There are 29 People in the Labor Forcein in Ronneby.
What is the Percentage of People in the Labor Force in Ronneby?
80.6% of People are in the Labor Force in Ronneby.
What is the Unemployment Rate in Ronneby?
Unemployment Rate in Ronneby is 6.9%.