Spring Hill, MN Map & Demographics
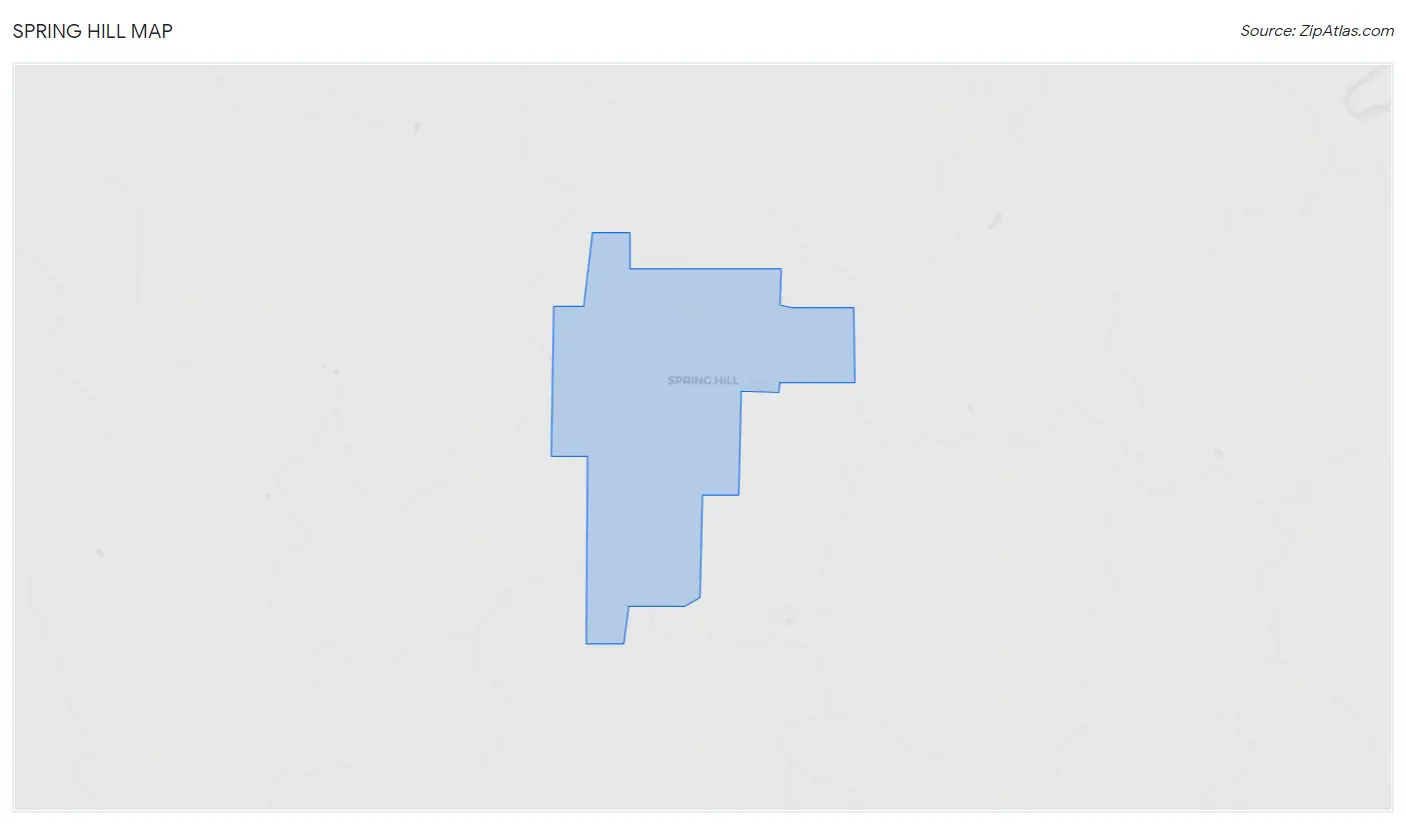
Spring Hill Map
Spring Hill Overview
$35,957
PER CAPITA INCOME
$61,875
AVG FAMILY INCOME
$80,417
AVG HOUSEHOLD INCOME
38.7%
WAGE / INCOME GAP [ % ]
61.3¢/ $1
WAGE / INCOME GAP [ $ ]
0.26
INEQUALITY / GINI INDEX
98
TOTAL POPULATION
43
MALE POPULATION
55
FEMALE POPULATION
78.18
MALES / 100 FEMALES
127.91
FEMALES / 100 MALES
22.8
MEDIAN AGE
2.9
AVG FAMILY SIZE
2.0
AVG HOUSEHOLD SIZE
64
LABOR FORCE [ PEOPLE ]
85.3%
PERCENT IN LABOR FORCE
Spring Hill Area Codes
Income in Spring Hill
Income Overview in Spring Hill
Per Capita Income in Spring Hill is $35,957, while median incomes of families and households are $61,875 and $80,417 respectively.
| Characteristic | Number | Measure |
| Per Capita Income | 98 | $35,957 |
| Median Family Income | 13 | $61,875 |
| Mean Family Income | 13 | $76,185 |
| Median Household Income | 50 | $80,417 |
| Mean Household Income | 50 | $75,046 |
| Income Deficit | 13 | $0 |
| Wage / Income Gap (%) | 98 | 38.74% |
| Wage / Income Gap ($) | 98 | 61.26¢ per $1 |
| Gini / Inequality Index | 98 | 0.26 |
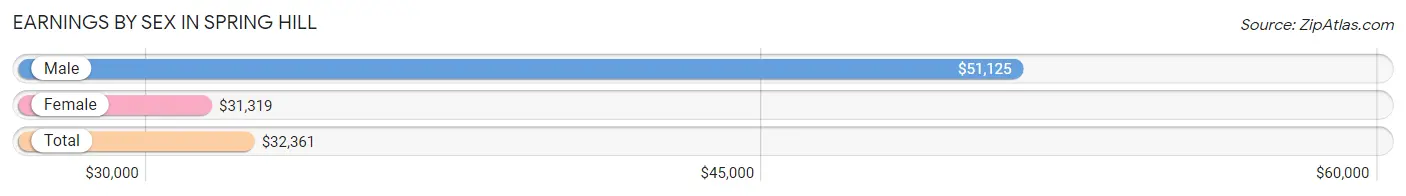
Earnings by Sex in Spring Hill
Average Earnings in Spring Hill are $32,361, $51,125 for men and $31,319 for women, a difference of 38.7%.
| Sex | Number | Average Earnings |
| Male | 29 (43.9%) | $51,125 |
| Female | 37 (56.1%) | $31,319 |
| Total | 66 (100.0%) | $32,361 |
Earnings by Sex by Income Bracket in Spring Hill
The most common earnings brackets in Spring Hill are $50,000 to $54,999 for men (10 | 34.5%) and $30,000 to $34,999 for women (18 | 48.6%).
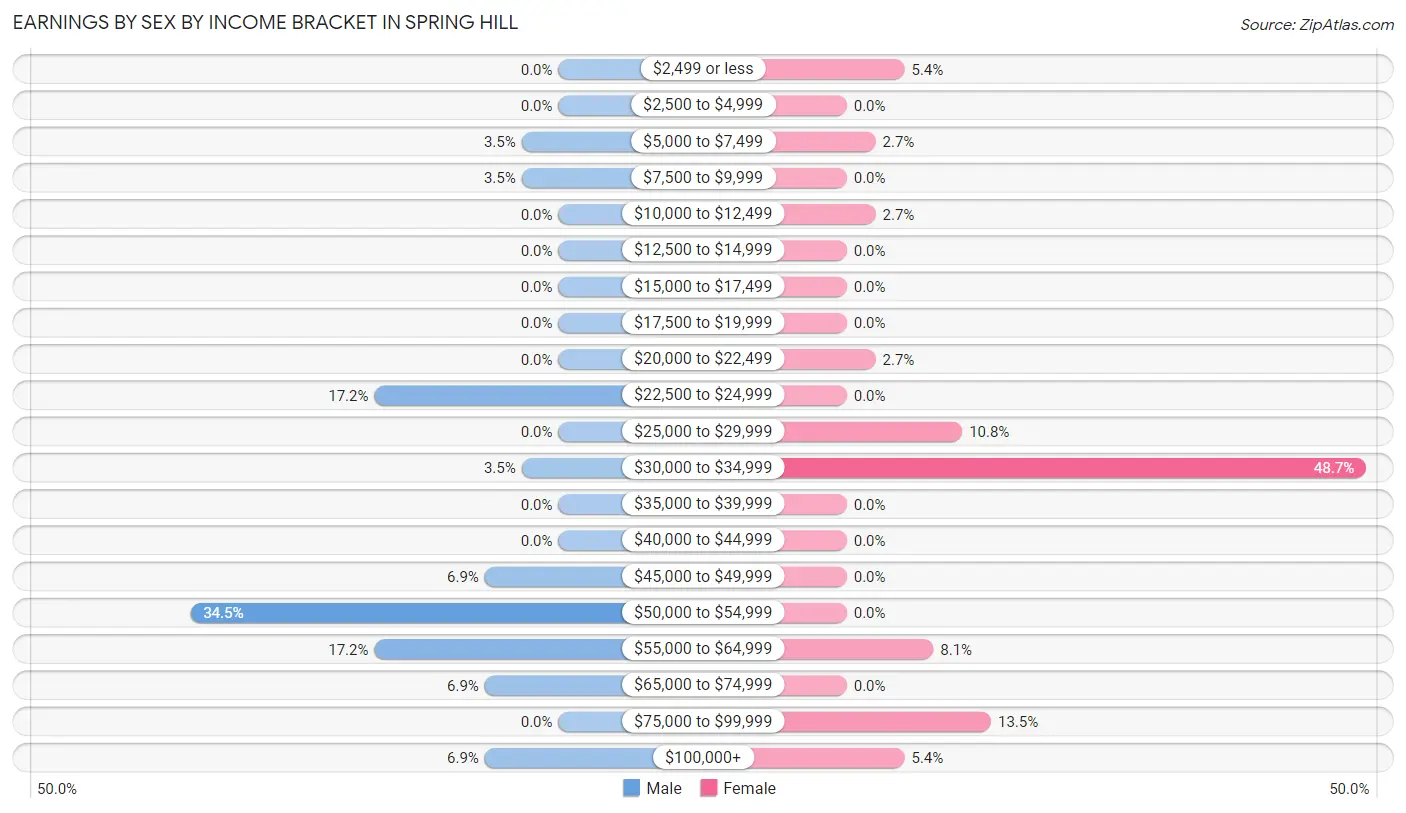
| Income | Male | Female |
| $2,499 or less | 0 (0.0%) | 2 (5.4%) |
| $2,500 to $4,999 | 0 (0.0%) | 0 (0.0%) |
| $5,000 to $7,499 | 1 (3.5%) | 1 (2.7%) |
| $7,500 to $9,999 | 1 (3.5%) | 0 (0.0%) |
| $10,000 to $12,499 | 0 (0.0%) | 1 (2.7%) |
| $12,500 to $14,999 | 0 (0.0%) | 0 (0.0%) |
| $15,000 to $17,499 | 0 (0.0%) | 0 (0.0%) |
| $17,500 to $19,999 | 0 (0.0%) | 0 (0.0%) |
| $20,000 to $22,499 | 0 (0.0%) | 1 (2.7%) |
| $22,500 to $24,999 | 5 (17.2%) | 0 (0.0%) |
| $25,000 to $29,999 | 0 (0.0%) | 4 (10.8%) |
| $30,000 to $34,999 | 1 (3.5%) | 18 (48.6%) |
| $35,000 to $39,999 | 0 (0.0%) | 0 (0.0%) |
| $40,000 to $44,999 | 0 (0.0%) | 0 (0.0%) |
| $45,000 to $49,999 | 2 (6.9%) | 0 (0.0%) |
| $50,000 to $54,999 | 10 (34.5%) | 0 (0.0%) |
| $55,000 to $64,999 | 5 (17.2%) | 3 (8.1%) |
| $65,000 to $74,999 | 2 (6.9%) | 0 (0.0%) |
| $75,000 to $99,999 | 0 (0.0%) | 5 (13.5%) |
| $100,000+ | 2 (6.9%) | 2 (5.4%) |
| Total | 29 (100.0%) | 37 (100.0%) |
Earnings by Sex by Educational Attainment in Spring Hill
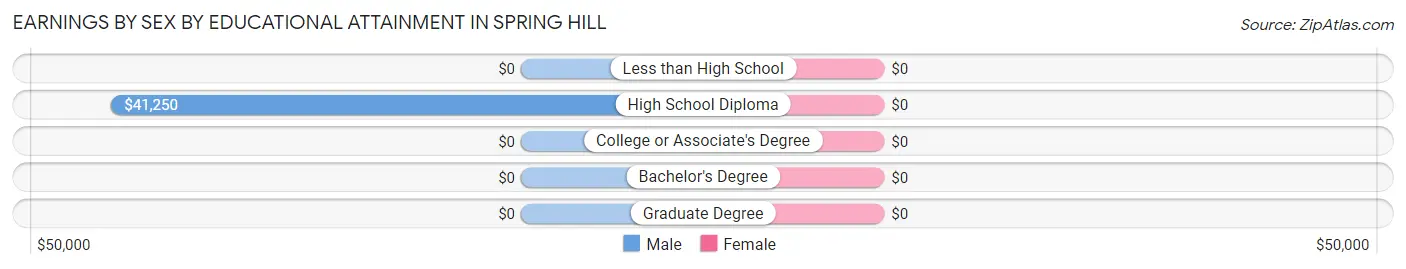
| Educational Attainment | Male Income | Female Income |
| Less than High School | - | - |
| High School Diploma | $41,250 | $0 |
| College or Associate's Degree | - | - |
| Bachelor's Degree | - | - |
| Graduate Degree | - | - |
| Total | $49,375 | $0 |
Family Income in Spring Hill
Family Income Brackets in Spring Hill
According to the Spring Hill family income data, there are 7 families falling into the $50,000 to $74,999 income range, which is the most common income bracket and makes up 53.8% of all families.
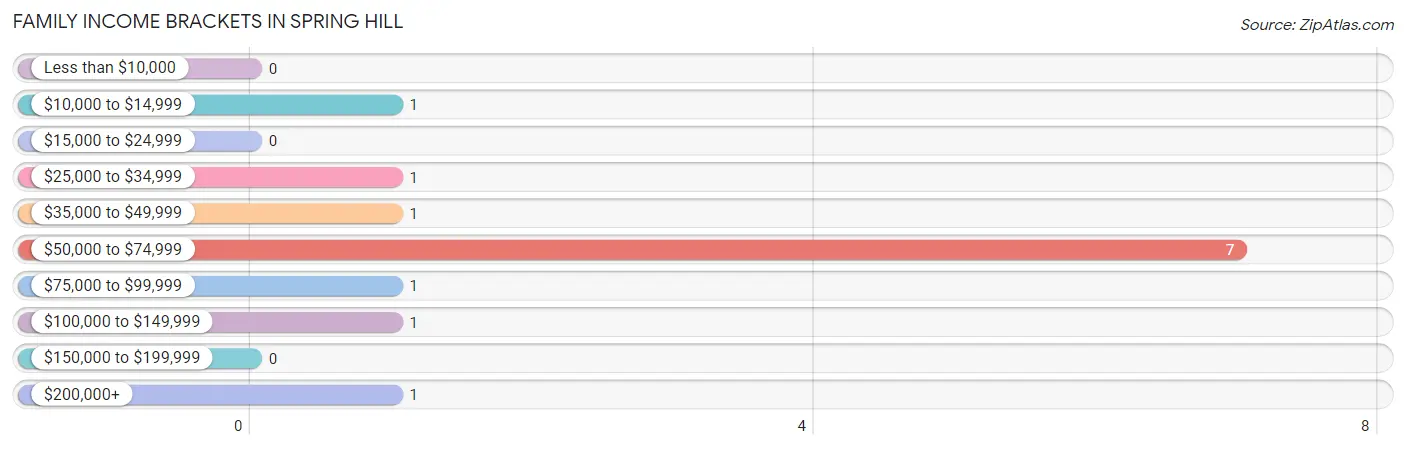
| Income Bracket | # Families | % Families |
| Less than $10,000 | 0 | 0.0% |
| $10,000 to $14,999 | 1 | 7.7% |
| $15,000 to $24,999 | 0 | 0.0% |
| $25,000 to $34,999 | 1 | 7.7% |
| $35,000 to $49,999 | 1 | 7.7% |
| $50,000 to $74,999 | 7 | 53.8% |
| $75,000 to $99,999 | 1 | 7.7% |
| $100,000 to $149,999 | 1 | 7.7% |
| $150,000 to $199,999 | 0 | 0.0% |
| $200,000+ | 1 | 7.7% |
Family Income by Famaliy Size in Spring Hill
2-person families (10 | 76.9%) account for the highest median family income in Spring Hill with $60,000 per family, while 2-person families (10 | 76.9%) have the highest median income of $30,000 per family member.
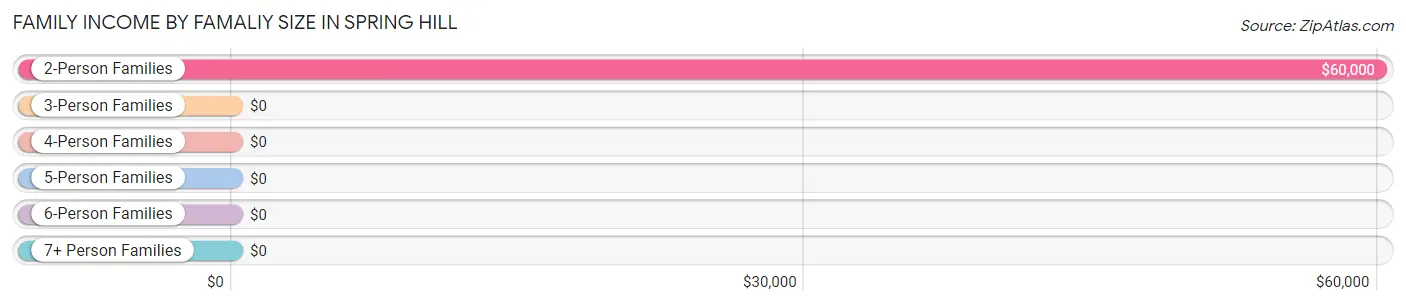
| Income Bracket | # Families | Median Income |
| 2-Person Families | 10 (76.9%) | $60,000 |
| 3-Person Families | 0 (0.0%) | $0 |
| 4-Person Families | 0 (0.0%) | $0 |
| 5-Person Families | 1 (7.7%) | $0 |
| 6-Person Families | 2 (15.4%) | $0 |
| 7+ Person Families | 0 (0.0%) | $0 |
| Total | 13 (100.0%) | $61,875 |
Family Income by Number of Earners in Spring Hill
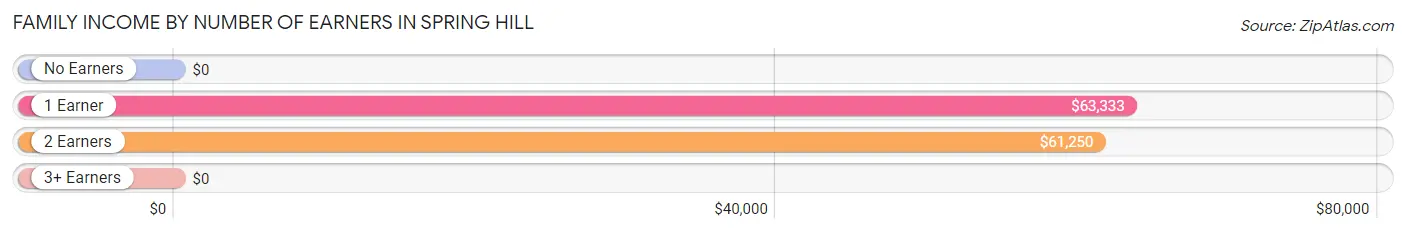
| Number of Earners | # Families | Median Income |
| No Earners | 1 (7.7%) | $0 |
| 1 Earner | 6 (46.2%) | $63,333 |
| 2 Earners | 6 (46.2%) | $61,250 |
| 3+ Earners | 0 (0.0%) | $0 |
| Total | 13 (100.0%) | $61,875 |
Household Income in Spring Hill
Household Income Brackets in Spring Hill
With 19 households falling in the category, the $75,000 to $99,999 income range is the most frequent in Spring Hill, accounting for 38.0% of all households.
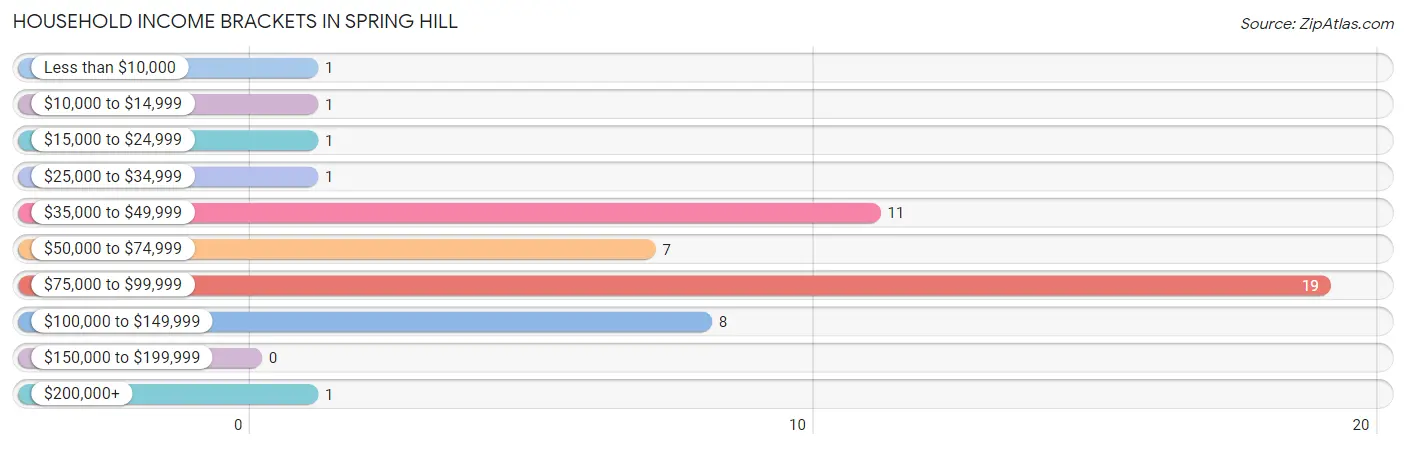
| Income Bracket | # Households | % Households |
| Less than $10,000 | 1 | 2.0% |
| $10,000 to $14,999 | 1 | 2.0% |
| $15,000 to $24,999 | 1 | 2.0% |
| $25,000 to $34,999 | 1 | 2.0% |
| $35,000 to $49,999 | 11 | 22.0% |
| $50,000 to $74,999 | 7 | 14.0% |
| $75,000 to $99,999 | 19 | 38.0% |
| $100,000 to $149,999 | 8 | 16.0% |
| $150,000 to $199,999 | 0 | 0.0% |
| $200,000+ | 1 | 2.0% |
Household Income by Householder Age in Spring Hill
The median household income in Spring Hill is $80,417, with the highest median household income of $110,500 found in the 45 to 64 years age bracket for the primary householder. A total of 10 households (20.0%) fall into this category. Meanwhile, the 15 to 24 years age bracket for the primary householder has the lowest median household income of $0, with 18 households (36.0%) in this group.
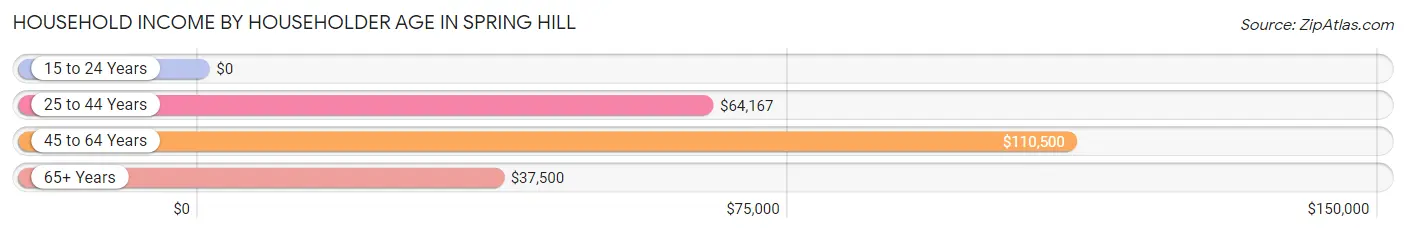
| Income Bracket | # Households | Median Income |
| 15 to 24 Years | 18 (36.0%) | $0 |
| 25 to 44 Years | 8 (16.0%) | $64,167 |
| 45 to 64 Years | 10 (20.0%) | $110,500 |
| 65+ Years | 14 (28.0%) | $37,500 |
| Total | 50 (100.0%) | $80,417 |
Poverty in Spring Hill
Income Below Poverty by Sex and Age in Spring Hill
With 2.7% poverty level for males and 3.8% for females among the residents of Spring Hill, 65 to 74 year old males and 75 year old and over females are the most vulnerable to poverty, with 1 males (50.0%) and 1 females (20.0%) in their respective age groups living below the poverty level.
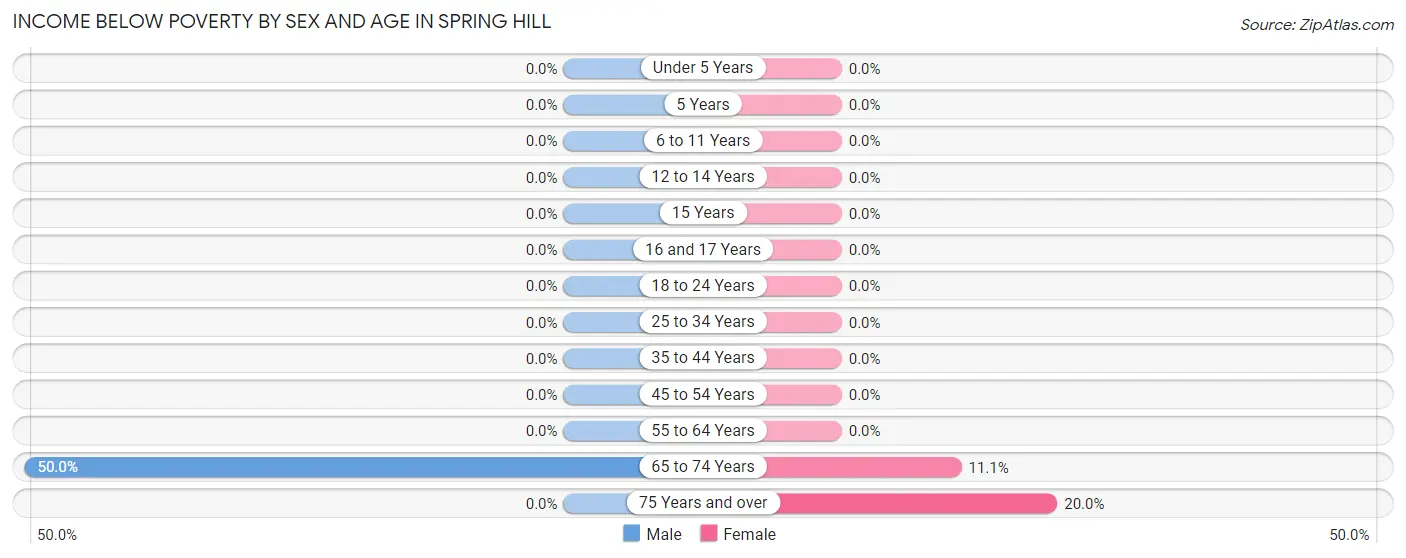
| Age Bracket | Male | Female |
| Under 5 Years | 0 (0.0%) | 0 (0.0%) |
| 5 Years | 0 (0.0%) | 0 (0.0%) |
| 6 to 11 Years | 0 (0.0%) | 0 (0.0%) |
| 12 to 14 Years | 0 (0.0%) | 0 (0.0%) |
| 15 Years | 0 (0.0%) | 0 (0.0%) |
| 16 and 17 Years | 0 (0.0%) | 0 (0.0%) |
| 18 to 24 Years | 0 (0.0%) | 0 (0.0%) |
| 25 to 34 Years | 0 (0.0%) | 0 (0.0%) |
| 35 to 44 Years | 0 (0.0%) | 0 (0.0%) |
| 45 to 54 Years | 0 (0.0%) | 0 (0.0%) |
| 55 to 64 Years | 0 (0.0%) | 0 (0.0%) |
| 65 to 74 Years | 1 (50.0%) | 1 (11.1%) |
| 75 Years and over | 0 (0.0%) | 1 (20.0%) |
| Total | 1 (2.7%) | 2 (3.8%) |
Income Above Poverty by Sex and Age in Spring Hill
According to the poverty statistics in Spring Hill, males aged under 5 years and females aged under 5 years are the age groups that are most secure financially, with 100.0% of males and 100.0% of females in these age groups living above the poverty line.
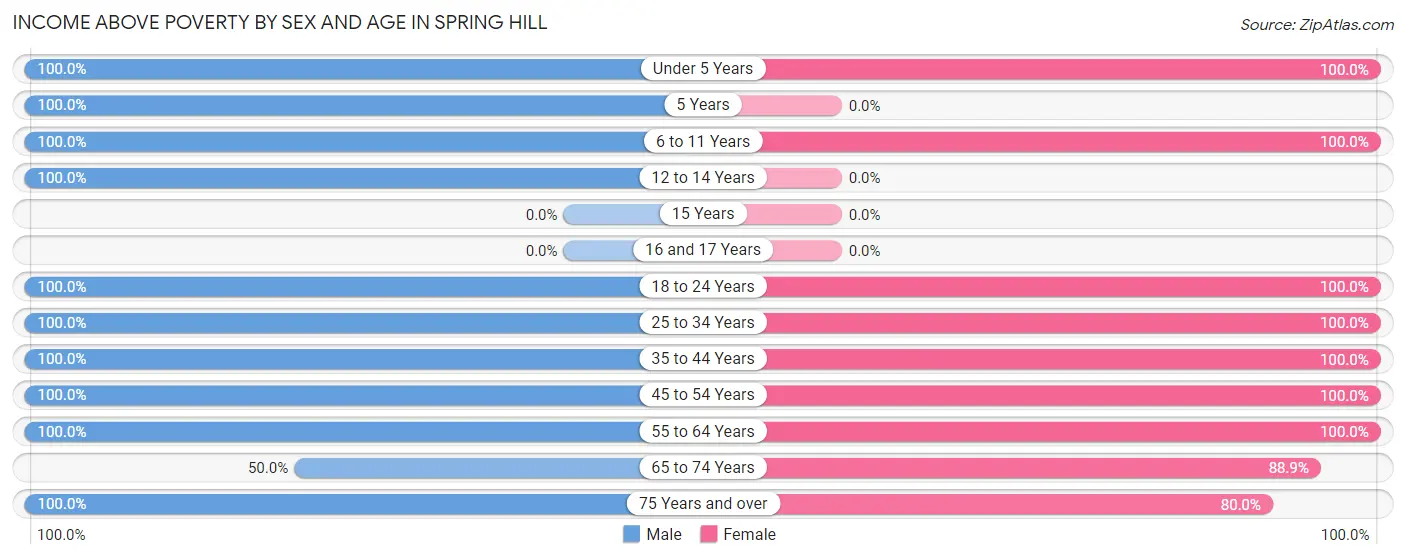
| Age Bracket | Male | Female |
| Under 5 Years | 2 (100.0%) | 2 (100.0%) |
| 5 Years | 1 (100.0%) | 0 (0.0%) |
| 6 to 11 Years | 2 (100.0%) | 5 (100.0%) |
| 12 to 14 Years | 2 (100.0%) | 0 (0.0%) |
| 15 Years | 0 (0.0%) | 0 (0.0%) |
| 16 and 17 Years | 0 (0.0%) | 0 (0.0%) |
| 18 to 24 Years | 10 (100.0%) | 18 (100.0%) |
| 25 to 34 Years | 1 (100.0%) | 4 (100.0%) |
| 35 to 44 Years | 4 (100.0%) | 1 (100.0%) |
| 45 to 54 Years | 9 (100.0%) | 5 (100.0%) |
| 55 to 64 Years | 3 (100.0%) | 3 (100.0%) |
| 65 to 74 Years | 1 (50.0%) | 8 (88.9%) |
| 75 Years and over | 1 (100.0%) | 4 (80.0%) |
| Total | 36 (97.3%) | 50 (96.2%) |
Income Below Poverty Among Married-Couple Families in Spring Hill
The poverty statistics for married-couple families in Spring Hill show that 11.1% or 1 of the total 9 families live below the poverty line. Families with no children have the highest poverty rate of 16.7%, comprising of 1 families. On the other hand, families with 3 or 4 children have the lowest poverty rate of 0.0%, which includes 0 families.
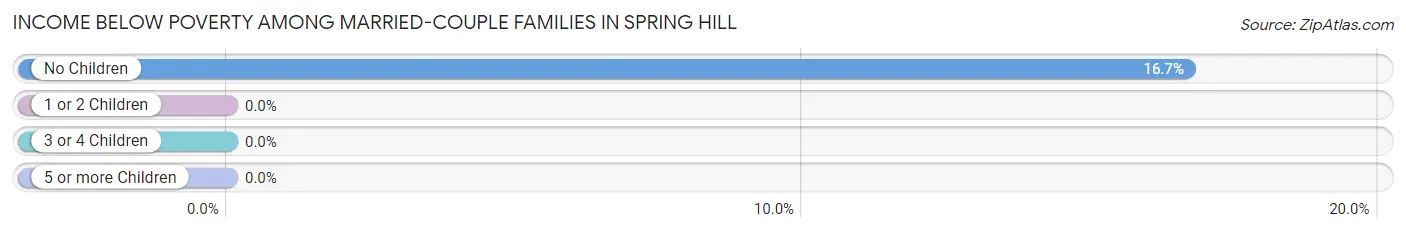
| Children | Above Poverty | Below Poverty |
| No Children | 5 (83.3%) | 1 (16.7%) |
| 1 or 2 Children | 0 (0.0%) | 0 (0.0%) |
| 3 or 4 Children | 3 (100.0%) | 0 (0.0%) |
| 5 or more Children | 0 (0.0%) | 0 (0.0%) |
| Total | 8 (88.9%) | 1 (11.1%) |
Income Below Poverty Among Single-Parent Households in Spring Hill
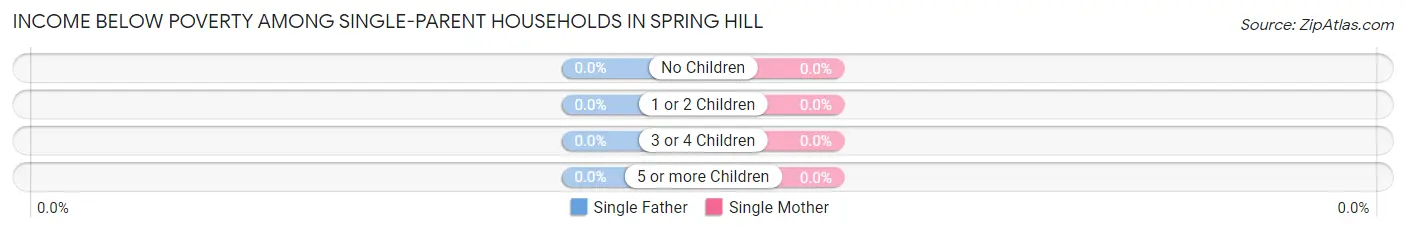
| Children | Single Father | Single Mother |
| No Children | 0 (0.0%) | 0 (0.0%) |
| 1 or 2 Children | 0 (0.0%) | 0 (0.0%) |
| 3 or 4 Children | 0 (0.0%) | 0 (0.0%) |
| 5 or more Children | 0 (0.0%) | 0 (0.0%) |
| Total | 0 (0.0%) | 0 (0.0%) |
Income Below Poverty Among Married-Couple vs Single-Parent Households in Spring Hill
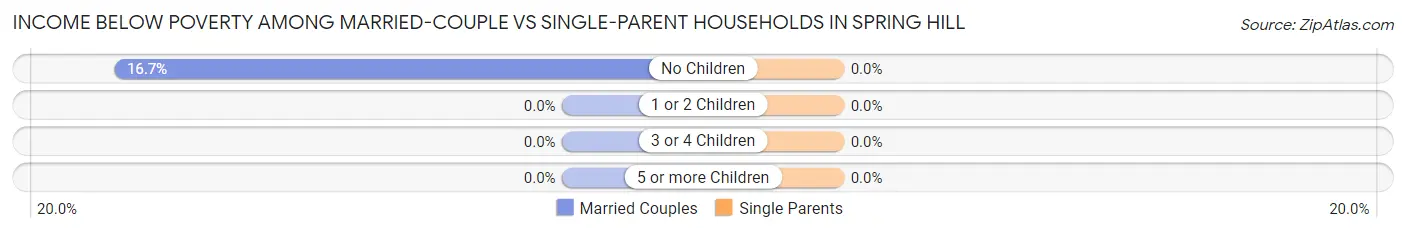
| Children | Married-Couple Families | Single-Parent Households |
| No Children | 1 (16.7%) | 0 (0.0%) |
| 1 or 2 Children | 0 (0.0%) | 0 (0.0%) |
| 3 or 4 Children | 0 (0.0%) | 0 (0.0%) |
| 5 or more Children | 0 (0.0%) | 0 (0.0%) |
| Total | 1 (11.1%) | 0 (0.0%) |
Race in Spring Hill
The most populous races in Spring Hill are White / Caucasian (92 | 93.9%), and Two or more Races (6 | 6.1%).
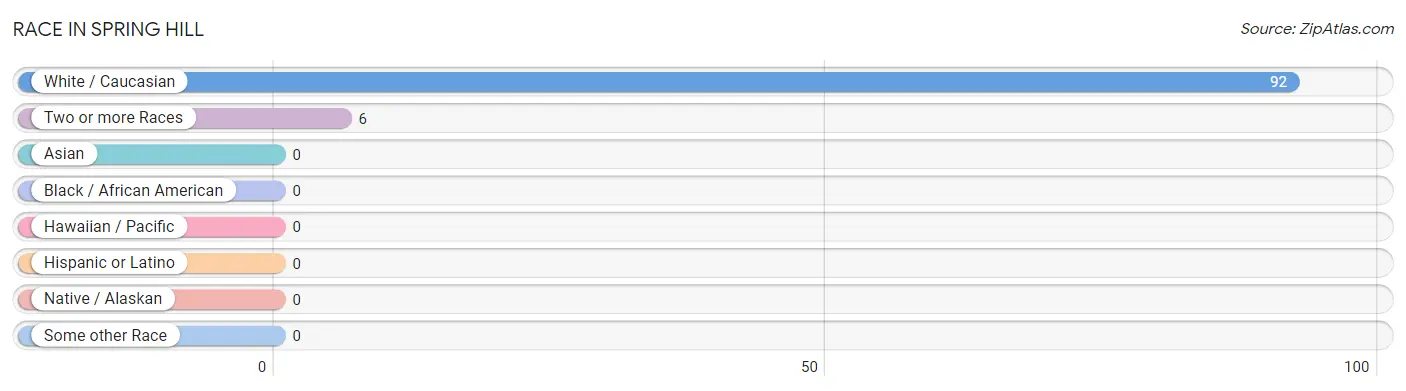
| Race | # Population | % Population |
| Asian | 0 | 0.0% |
| Black / African American | 0 | 0.0% |
| Hawaiian / Pacific | 0 | 0.0% |
| Hispanic or Latino | 0 | 0.0% |
| Native / Alaskan | 0 | 0.0% |
| White / Caucasian | 92 | 93.9% |
| Two or more Races | 6 | 6.1% |
| Some other Race | 0 | 0.0% |
| Total | 98 | 100.0% |
Ancestry in Spring Hill
The most populous ancestries reported in Spring Hill are German (37 | 37.8%), Dutch (2 | 2.0%), and Austrian (1 | 1.0%), together accounting for 40.8% of all Spring Hill residents.
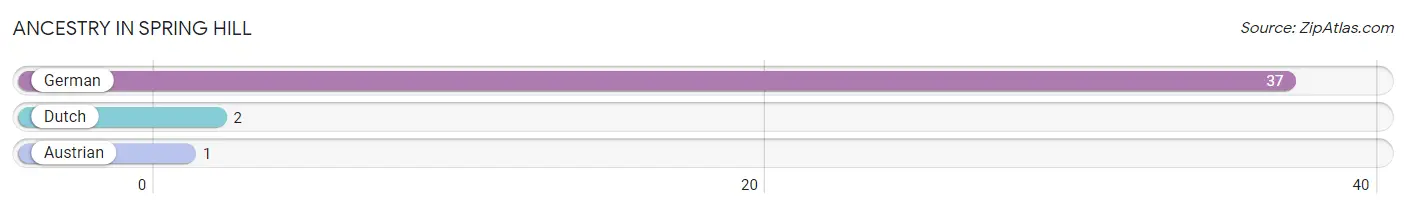
| Ancestry | # Population | % Population |
| Austrian | 1 | 1.0% |
| Dutch | 2 | 2.0% |
| German | 37 | 37.8% | View All 3 Rows |
Immigrants in Spring Hill

| Immigration Origin | # Population | % Population | View All 0 Rows |
Sex and Age in Spring Hill
Sex and Age in Spring Hill
The most populous age groups in Spring Hill are 20 to 24 Years (10 | 23.3%) for men and 15 to 19 Years (18 | 32.7%) for women.
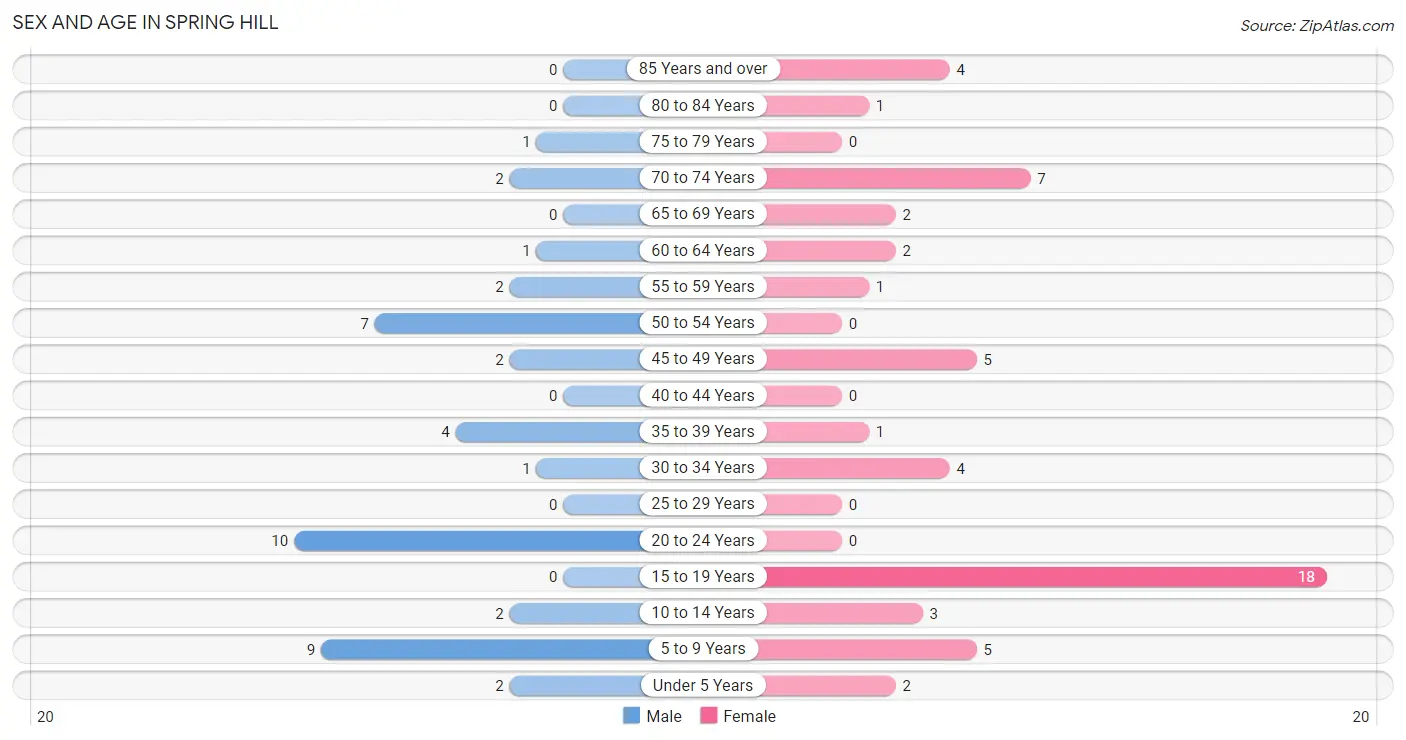
| Age Bracket | Male | Female |
| Under 5 Years | 2 (4.6%) | 2 (3.6%) |
| 5 to 9 Years | 9 (20.9%) | 5 (9.1%) |
| 10 to 14 Years | 2 (4.6%) | 3 (5.4%) |
| 15 to 19 Years | 0 (0.0%) | 18 (32.7%) |
| 20 to 24 Years | 10 (23.3%) | 0 (0.0%) |
| 25 to 29 Years | 0 (0.0%) | 0 (0.0%) |
| 30 to 34 Years | 1 (2.3%) | 4 (7.3%) |
| 35 to 39 Years | 4 (9.3%) | 1 (1.8%) |
| 40 to 44 Years | 0 (0.0%) | 0 (0.0%) |
| 45 to 49 Years | 2 (4.6%) | 5 (9.1%) |
| 50 to 54 Years | 7 (16.3%) | 0 (0.0%) |
| 55 to 59 Years | 2 (4.6%) | 1 (1.8%) |
| 60 to 64 Years | 1 (2.3%) | 2 (3.6%) |
| 65 to 69 Years | 0 (0.0%) | 2 (3.6%) |
| 70 to 74 Years | 2 (4.6%) | 7 (12.7%) |
| 75 to 79 Years | 1 (2.3%) | 0 (0.0%) |
| 80 to 84 Years | 0 (0.0%) | 1 (1.8%) |
| 85 Years and over | 0 (0.0%) | 4 (7.3%) |
| Total | 43 (100.0%) | 55 (100.0%) |
Families and Households in Spring Hill
Median Family Size in Spring Hill
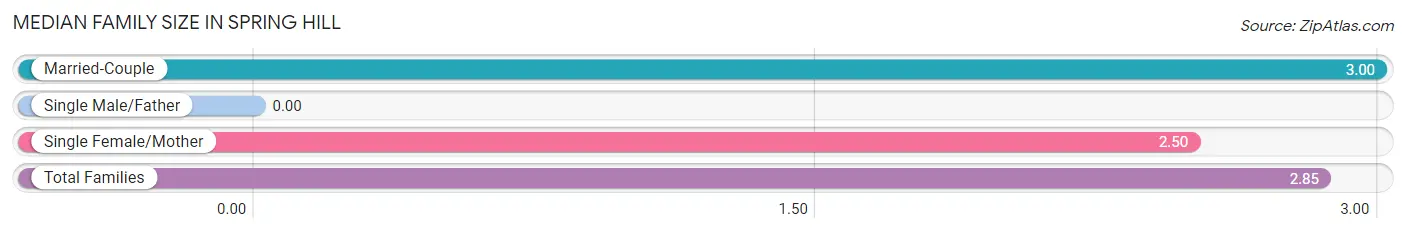
| Family Type | # Families | Family Size |
| Married-Couple | 9 (69.2%) | 3.00 |
| Single Male/Father | 0 (0.0%) | - |
| Single Female/Mother | 4 (30.8%) | 2.50 |
| Total Families | 13 (100.0%) | 2.85 |
Median Household Size in Spring Hill
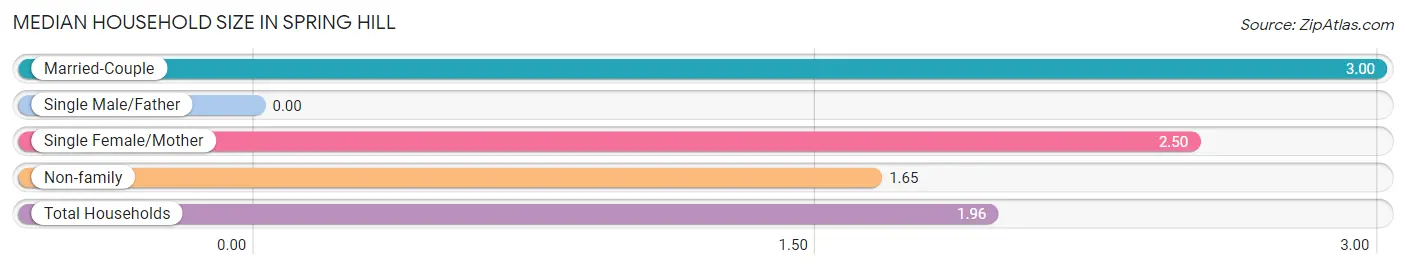
| Household Type | # Households | Household Size |
| Married-Couple | 9 (18.0%) | 3.00 |
| Single Male/Father | 0 (0.0%) | - |
| Single Female/Mother | 4 (8.0%) | 2.50 |
| Non-family | 37 (74.0%) | 1.65 |
| Total Households | 50 (100.0%) | 1.96 |
Household Size by Marriage Status in Spring Hill
Out of a total of 50 households in Spring Hill, 13 (26.0%) are family households, while 37 (74.0%) are nonfamily households. The most numerous type of family households are 2-person households, comprising 10, and the most common type of nonfamily households are 2-person households, comprising 18.
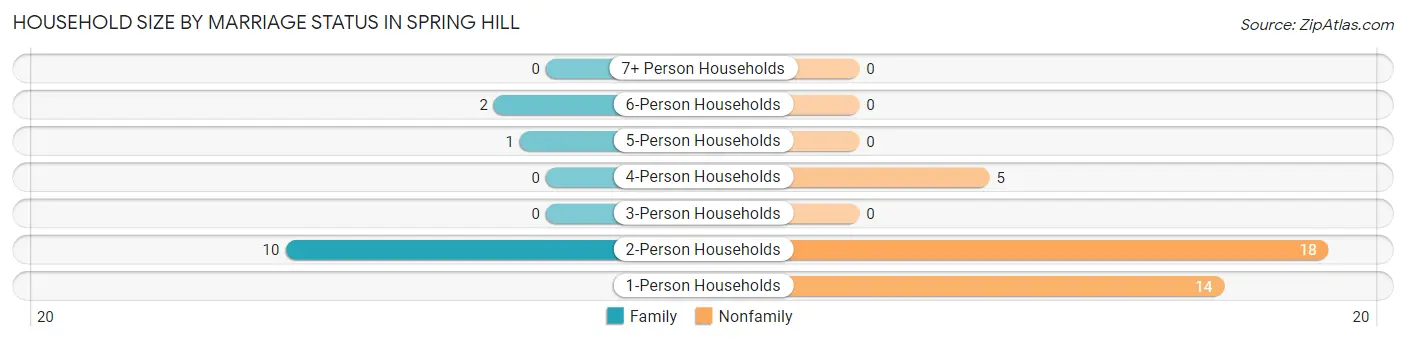
| Household Size | Family Households | Nonfamily Households |
| 1-Person Households | - | 14 (28.0%) |
| 2-Person Households | 10 (20.0%) | 18 (36.0%) |
| 3-Person Households | 0 (0.0%) | 0 (0.0%) |
| 4-Person Households | 0 (0.0%) | 5 (10.0%) |
| 5-Person Households | 1 (2.0%) | 0 (0.0%) |
| 6-Person Households | 2 (4.0%) | 0 (0.0%) |
| 7+ Person Households | 0 (0.0%) | 0 (0.0%) |
| Total | 13 (26.0%) | 37 (74.0%) |
Female Fertility in Spring Hill
Fertility by Age in Spring Hill
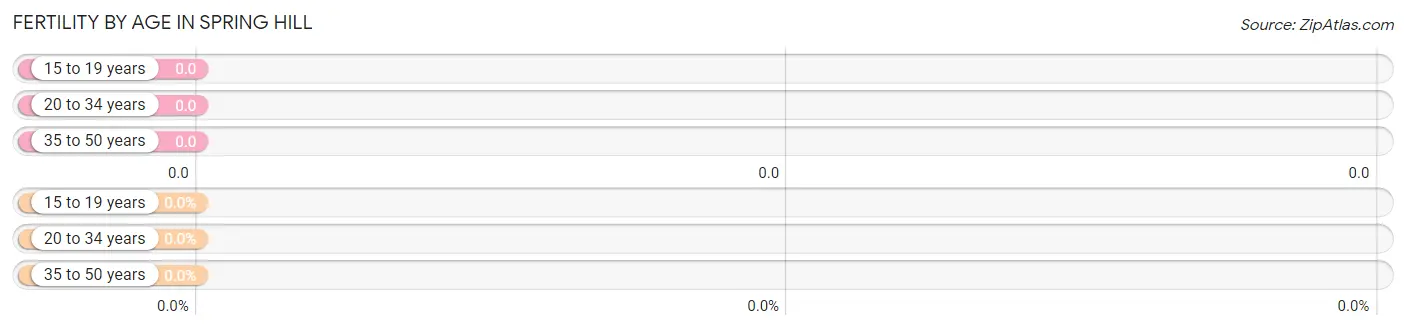
| Age Bracket | Women with Births | Births / 1,000 Women |
| 15 to 19 years | 0 (0.0%) | 0.0 |
| 20 to 34 years | 0 (0.0%) | 0.0 |
| 35 to 50 years | 0 (0.0%) | 0.0 |
| Total | 0 (0.0%) | 0.0 |
Fertility by Age by Marriage Status in Spring Hill
| Age Bracket | Married | Unmarried |
| 15 to 19 years | 0 (0.0%) | 0 (0.0%) |
| 20 to 34 years | 0 (0.0%) | 0 (0.0%) |
| 35 to 50 years | 0 (0.0%) | 0 (0.0%) |
| Total | 0 (0.0%) | 0 (0.0%) |
Fertility by Education in Spring Hill
| Educational Attainment | Women with Births | Births / 1,000 Women |
| Less than High School | 0 (0.0%) | 0.0 |
| High School Diploma | 0 (0.0%) | 0.0 |
| College or Associate's Degree | 0 (0.0%) | 0.0 |
| Bachelor's Degree | 0 (0.0%) | 0.0 |
| Graduate Degree | 0 (0.0%) | 0.0 |
| Total | 0 (0.0%) | 0.0 |
Fertility by Education by Marriage Status in Spring Hill
| Educational Attainment | Married | Unmarried |
| Less than High School | 0 (0.0%) | 0 (0.0%) |
| High School Diploma | 0 (0.0%) | 0 (0.0%) |
| College or Associate's Degree | 0 (0.0%) | 0 (0.0%) |
| Bachelor's Degree | 0 (0.0%) | 0 (0.0%) |
| Graduate Degree | 0 (0.0%) | 0 (0.0%) |
| Total | 0 (0.0%) | 0 (0.0%) |
Employment Characteristics in Spring Hill
Employment by Class of Employer in Spring Hill
Among the 64 employed individuals in Spring Hill, private company employees (52 | 81.2%), self-employed (not incorporated) (5 | 7.8%), and self-employed (incorporated) (2 | 3.1%) make up the most common classes of employment.
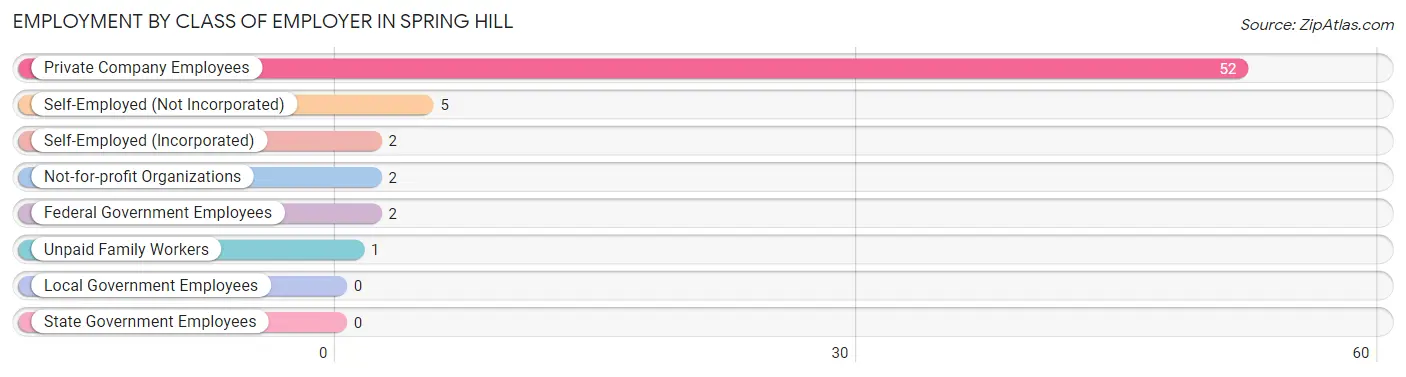
| Employer Class | # Employees | % Employees |
| Private Company Employees | 52 | 81.2% |
| Self-Employed (Incorporated) | 2 | 3.1% |
| Self-Employed (Not Incorporated) | 5 | 7.8% |
| Not-for-profit Organizations | 2 | 3.1% |
| Local Government Employees | 0 | 0.0% |
| State Government Employees | 0 | 0.0% |
| Federal Government Employees | 2 | 3.1% |
| Unpaid Family Workers | 1 | 1.6% |
| Total | 64 | 100.0% |
Employment Status by Age in Spring Hill
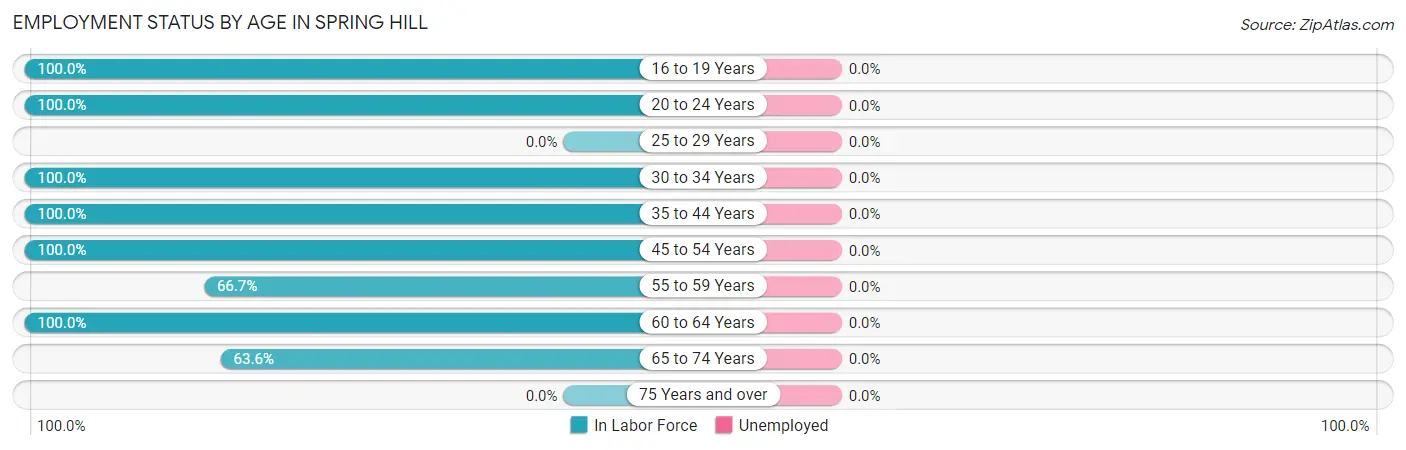
| Age Bracket | In Labor Force | Unemployed |
| 16 to 19 Years | 18 (100.0%) | 0 (0.0%) |
| 20 to 24 Years | 10 (100.0%) | 0 (0.0%) |
| 25 to 29 Years | 0 (0.0%) | 0 (0.0%) |
| 30 to 34 Years | 5 (100.0%) | 0 (0.0%) |
| 35 to 44 Years | 5 (100.0%) | 0 (0.0%) |
| 45 to 54 Years | 14 (100.0%) | 0 (0.0%) |
| 55 to 59 Years | 2 (66.7%) | 0 (0.0%) |
| 60 to 64 Years | 3 (100.0%) | 0 (0.0%) |
| 65 to 74 Years | 7 (63.6%) | 0 (0.0%) |
| 75 Years and over | 0 (0.0%) | 0 (0.0%) |
| Total | 64 (85.3%) | 0 (0.0%) |
Employment Status by Educational Attainment in Spring Hill
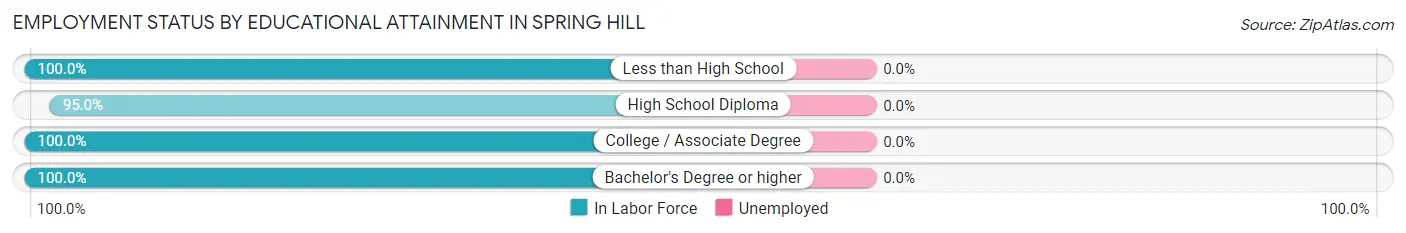
| Educational Attainment | In Labor Force | Unemployed |
| Less than High School | 2 (100.0%) | 0 (0.0%) |
| High School Diploma | 19 (95.0%) | 0 (0.0%) |
| College / Associate Degree | 2 (100.0%) | 0 (0.0%) |
| Bachelor's Degree or higher | 6 (100.0%) | 0 (0.0%) |
| Total | 29 (96.7%) | 0 (0.0%) |
Employment Occupations by Sex in Spring Hill
Management, Business, Science and Arts Occupations
The most common Management, Business, Science and Arts occupations in Spring Hill are Management (3 | 4.7%), Health Diagnosing & Treating (1 | 1.6%), and Health Technologists (1 | 1.6%).
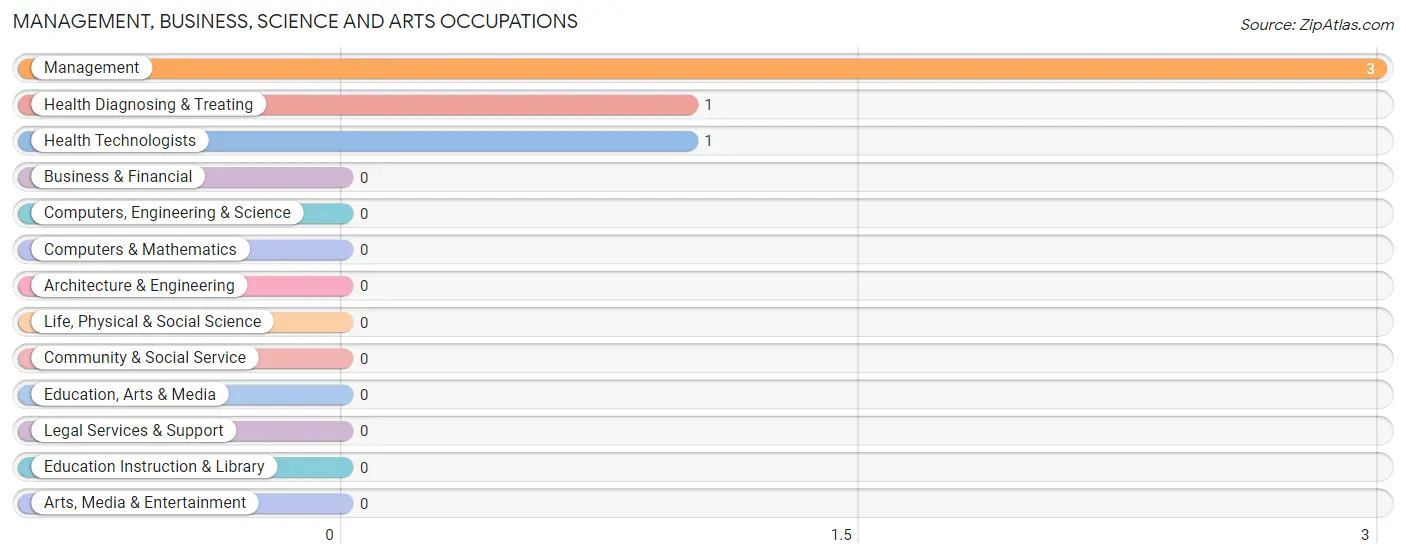
Management, Business, Science and Arts Occupations by Sex
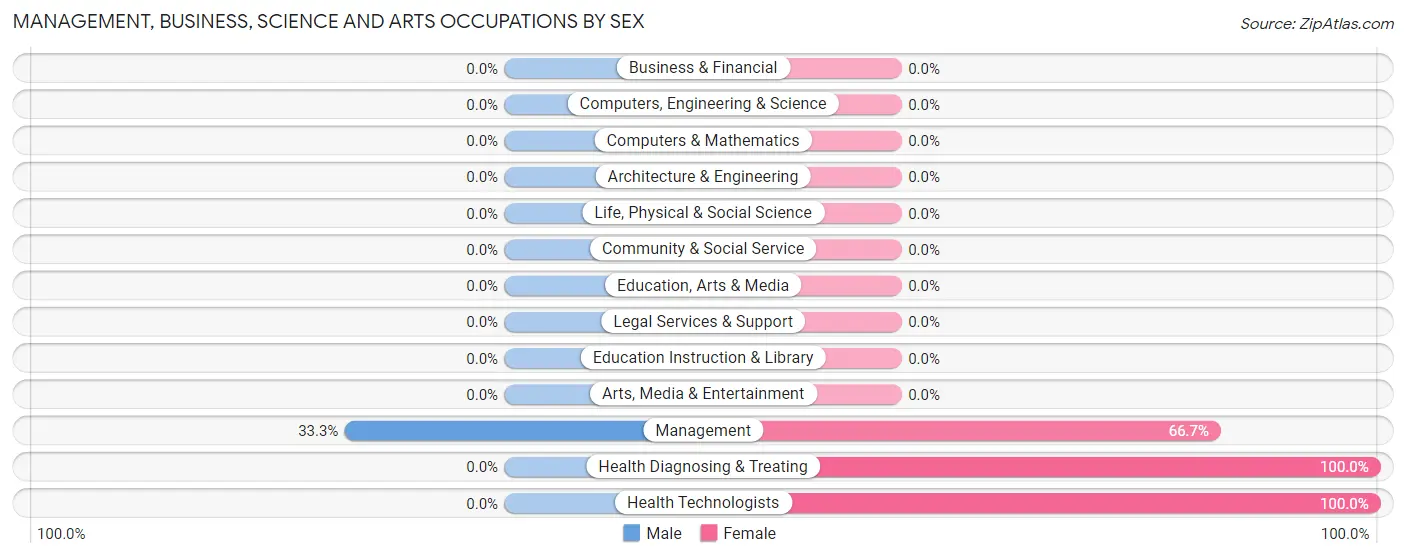
| Occupation | Male | Female |
| Management | 1 (33.3%) | 2 (66.7%) |
| Business & Financial | 0 (0.0%) | 0 (0.0%) |
| Computers, Engineering & Science | 0 (0.0%) | 0 (0.0%) |
| Computers & Mathematics | 0 (0.0%) | 0 (0.0%) |
| Architecture & Engineering | 0 (0.0%) | 0 (0.0%) |
| Life, Physical & Social Science | 0 (0.0%) | 0 (0.0%) |
| Community & Social Service | 0 (0.0%) | 0 (0.0%) |
| Education, Arts & Media | 0 (0.0%) | 0 (0.0%) |
| Legal Services & Support | 0 (0.0%) | 0 (0.0%) |
| Education Instruction & Library | 0 (0.0%) | 0 (0.0%) |
| Arts, Media & Entertainment | 0 (0.0%) | 0 (0.0%) |
| Health Diagnosing & Treating | 0 (0.0%) | 1 (100.0%) |
| Health Technologists | 0 (0.0%) | 1 (100.0%) |
| Total (Category) | 1 (25.0%) | 3 (75.0%) |
| Total (Overall) | 28 (43.8%) | 36 (56.2%) |
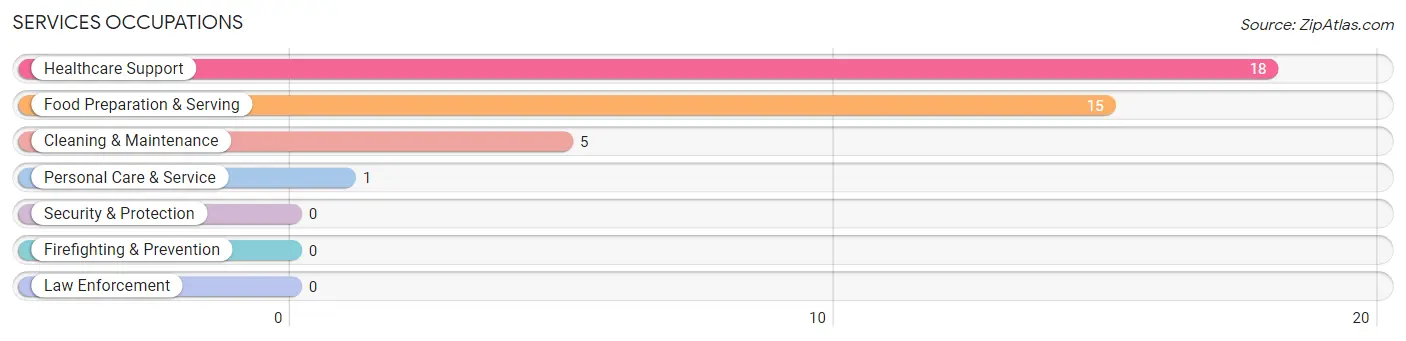
Services Occupations
The most common Services occupations in Spring Hill are Healthcare Support (18 | 28.1%), Food Preparation & Serving (15 | 23.4%), Cleaning & Maintenance (5 | 7.8%), and Personal Care & Service (1 | 1.6%).
Services Occupations by Sex
Within the Services occupations in Spring Hill, the most male-oriented occupations are Cleaning & Maintenance (80.0%), and Food Preparation & Serving (66.7%), while the most female-oriented occupations are Healthcare Support (100.0%), Personal Care & Service (100.0%), and Food Preparation & Serving (33.3%).
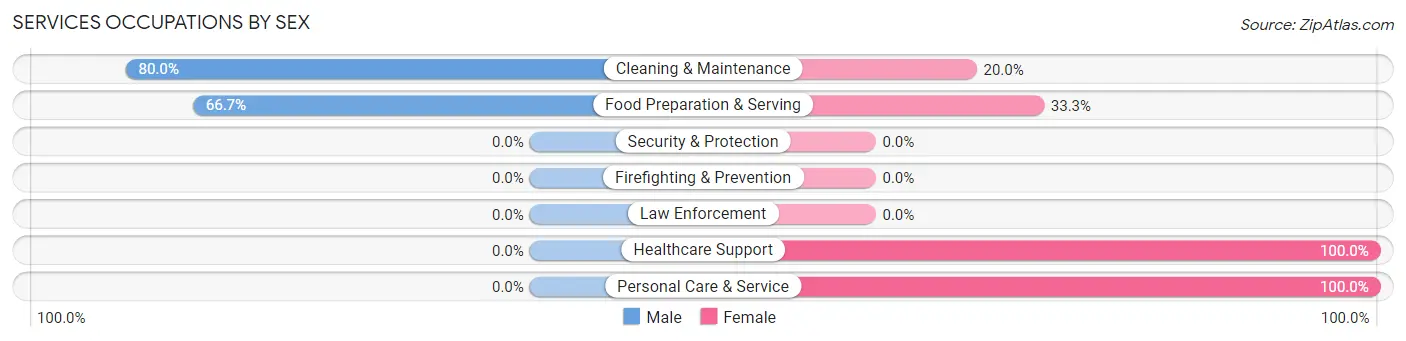
| Occupation | Male | Female |
| Healthcare Support | 0 (0.0%) | 18 (100.0%) |
| Security & Protection | 0 (0.0%) | 0 (0.0%) |
| Firefighting & Prevention | 0 (0.0%) | 0 (0.0%) |
| Law Enforcement | 0 (0.0%) | 0 (0.0%) |
| Food Preparation & Serving | 10 (66.7%) | 5 (33.3%) |
| Cleaning & Maintenance | 4 (80.0%) | 1 (20.0%) |
| Personal Care & Service | 0 (0.0%) | 1 (100.0%) |
| Total (Category) | 14 (35.9%) | 25 (64.1%) |
| Total (Overall) | 28 (43.8%) | 36 (56.2%) |
Sales and Office Occupations
The most common Sales and Office occupations in Spring Hill are , and Office & Administration (8 | 12.5%).
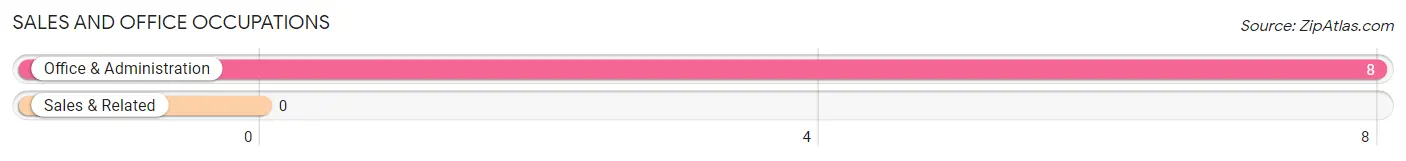
Sales and Office Occupations by Sex
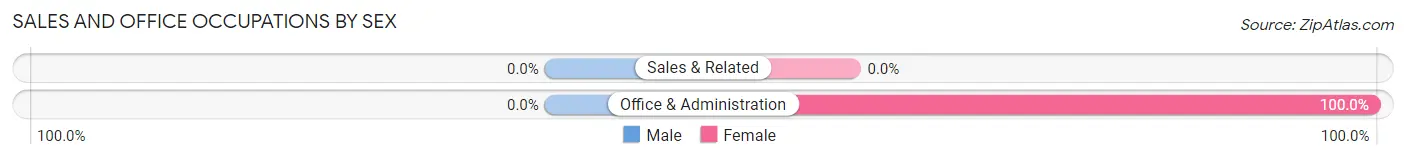
| Occupation | Male | Female |
| Sales & Related | 0 (0.0%) | 0 (0.0%) |
| Office & Administration | 0 (0.0%) | 8 (100.0%) |
| Total (Category) | 0 (0.0%) | 8 (100.0%) |
| Total (Overall) | 28 (43.8%) | 36 (56.2%) |
Natural Resources, Construction and Maintenance Occupations
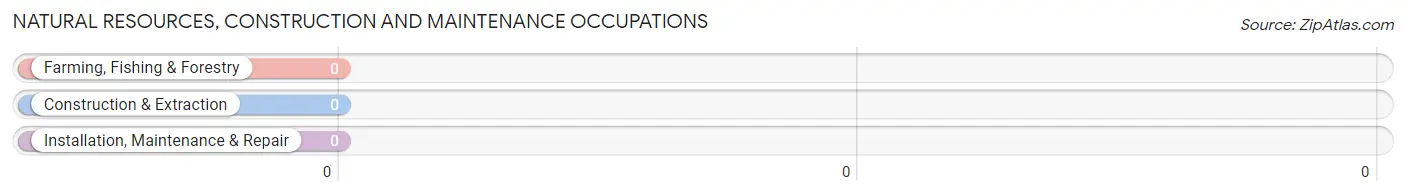
Natural Resources, Construction and Maintenance Occupations by Sex
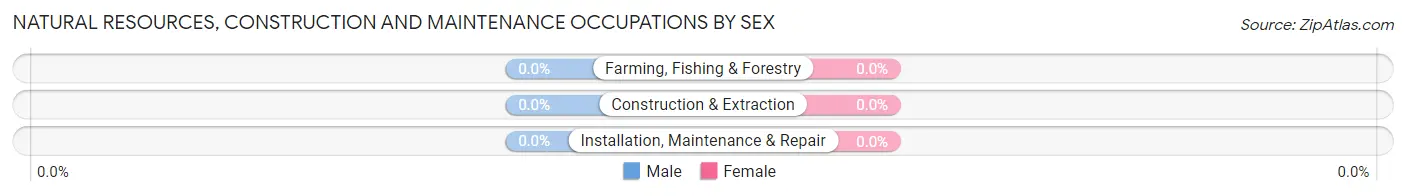
| Occupation | Male | Female |
| Farming, Fishing & Forestry | 0 (0.0%) | 0 (0.0%) |
| Construction & Extraction | 0 (0.0%) | 0 (0.0%) |
| Installation, Maintenance & Repair | 0 (0.0%) | 0 (0.0%) |
| Total (Category) | 0 (0.0%) | 0 (0.0%) |
| Total (Overall) | 28 (43.8%) | 36 (56.2%) |
Production, Transportation and Moving Occupations
The most common Production, Transportation and Moving occupations in Spring Hill are Production (5 | 7.8%), Material Moving (5 | 7.8%), and Transportation (3 | 4.7%).
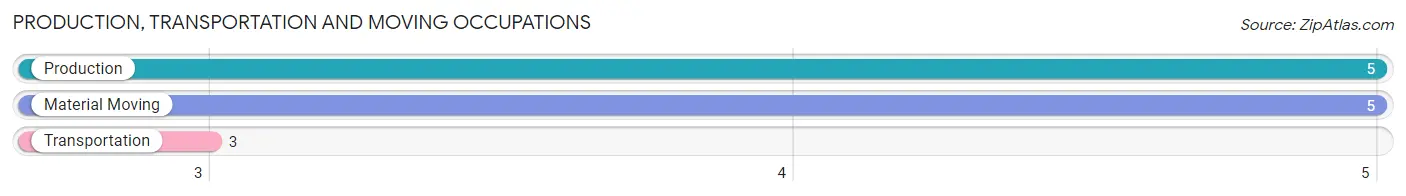
Production, Transportation and Moving Occupations by Sex
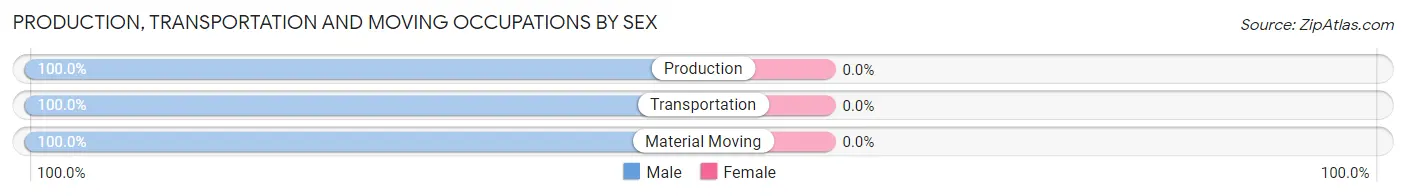
| Occupation | Male | Female |
| Production | 5 (100.0%) | 0 (0.0%) |
| Transportation | 3 (100.0%) | 0 (0.0%) |
| Material Moving | 5 (100.0%) | 0 (0.0%) |
| Total (Category) | 13 (100.0%) | 0 (0.0%) |
| Total (Overall) | 28 (43.8%) | 36 (56.2%) |
Employment Industries by Sex in Spring Hill
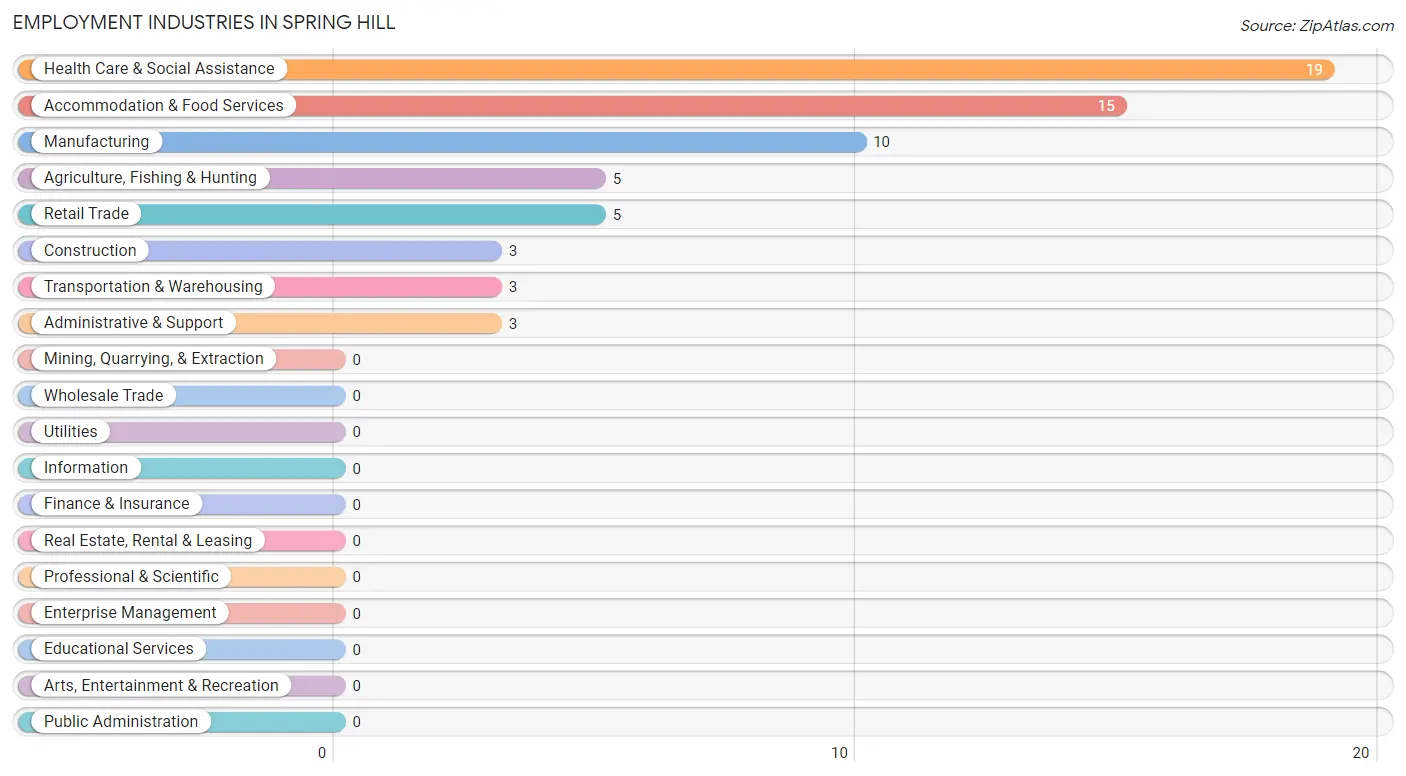
Employment Industries in Spring Hill
The major employment industries in Spring Hill include Health Care & Social Assistance (19 | 29.7%), Accommodation & Food Services (15 | 23.4%), Manufacturing (10 | 15.6%), Agriculture, Fishing & Hunting (5 | 7.8%), and Retail Trade (5 | 7.8%).
Employment Industries by Sex in Spring Hill
The Spring Hill industries that see more men than women are Retail Trade (100.0%), Transportation & Warehousing (100.0%), and Administrative & Support (66.7%), whereas the industries that tend to have a higher number of women are Construction (100.0%), Health Care & Social Assistance (100.0%), and Manufacturing (50.0%).
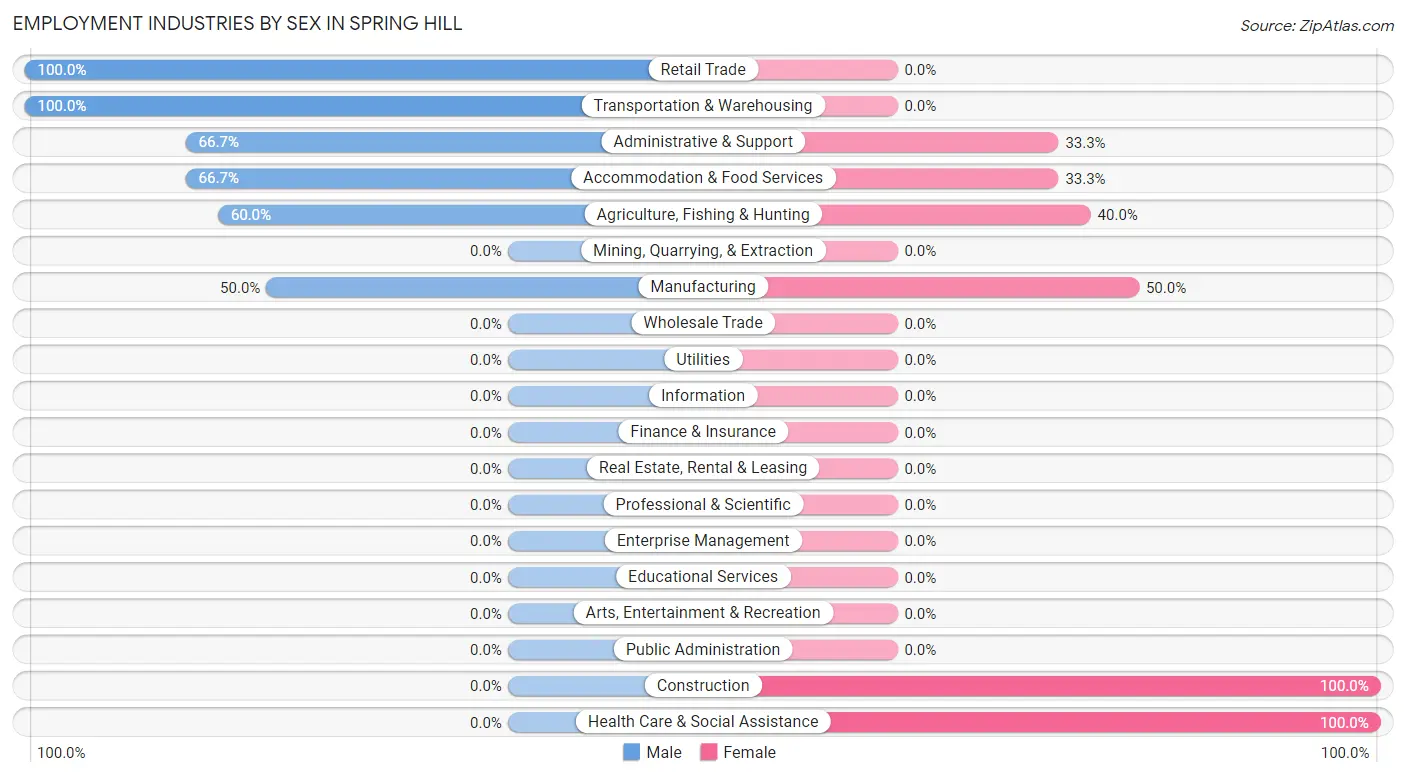
| Industry | Male | Female |
| Agriculture, Fishing & Hunting | 3 (60.0%) | 2 (40.0%) |
| Mining, Quarrying, & Extraction | 0 (0.0%) | 0 (0.0%) |
| Construction | 0 (0.0%) | 3 (100.0%) |
| Manufacturing | 5 (50.0%) | 5 (50.0%) |
| Wholesale Trade | 0 (0.0%) | 0 (0.0%) |
| Retail Trade | 5 (100.0%) | 0 (0.0%) |
| Transportation & Warehousing | 3 (100.0%) | 0 (0.0%) |
| Utilities | 0 (0.0%) | 0 (0.0%) |
| Information | 0 (0.0%) | 0 (0.0%) |
| Finance & Insurance | 0 (0.0%) | 0 (0.0%) |
| Real Estate, Rental & Leasing | 0 (0.0%) | 0 (0.0%) |
| Professional & Scientific | 0 (0.0%) | 0 (0.0%) |
| Enterprise Management | 0 (0.0%) | 0 (0.0%) |
| Administrative & Support | 2 (66.7%) | 1 (33.3%) |
| Educational Services | 0 (0.0%) | 0 (0.0%) |
| Health Care & Social Assistance | 0 (0.0%) | 19 (100.0%) |
| Arts, Entertainment & Recreation | 0 (0.0%) | 0 (0.0%) |
| Accommodation & Food Services | 10 (66.7%) | 5 (33.3%) |
| Public Administration | 0 (0.0%) | 0 (0.0%) |
| Total | 28 (43.8%) | 36 (56.2%) |
Education in Spring Hill
School Enrollment in Spring Hill
The most common levels of schooling among the 38 students in Spring Hill are college / undergraduate (18 | 47.4%), elementary school (13 | 34.2%), and middle school (5 | 13.2%).
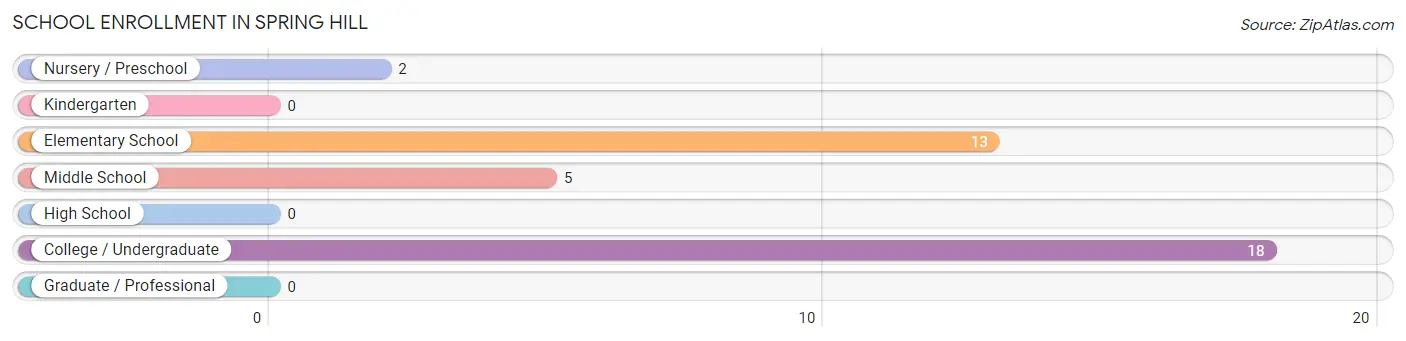
| School Level | # Students | % Students |
| Nursery / Preschool | 2 | 5.3% |
| Kindergarten | 0 | 0.0% |
| Elementary School | 13 | 34.2% |
| Middle School | 5 | 13.2% |
| High School | 0 | 0.0% |
| College / Undergraduate | 18 | 47.4% |
| Graduate / Professional | 0 | 0.0% |
| Total | 38 | 100.0% |
School Enrollment by Age by Funding Source in Spring Hill
Out of a total of 38 students who are enrolled in schools in Spring Hill, 2 (5.3%) attend a private institution, while the remaining 36 (94.7%) are enrolled in public schools. The age group of 3 to 4 year olds has the highest likelihood of being enrolled in private schools, with 2 (100.0% in the age bracket) enrolled. Conversely, the age group of 5 to 9 year old has the lowest likelihood of being enrolled in a private school, with 13 (100.0% in the age bracket) attending a public institution.
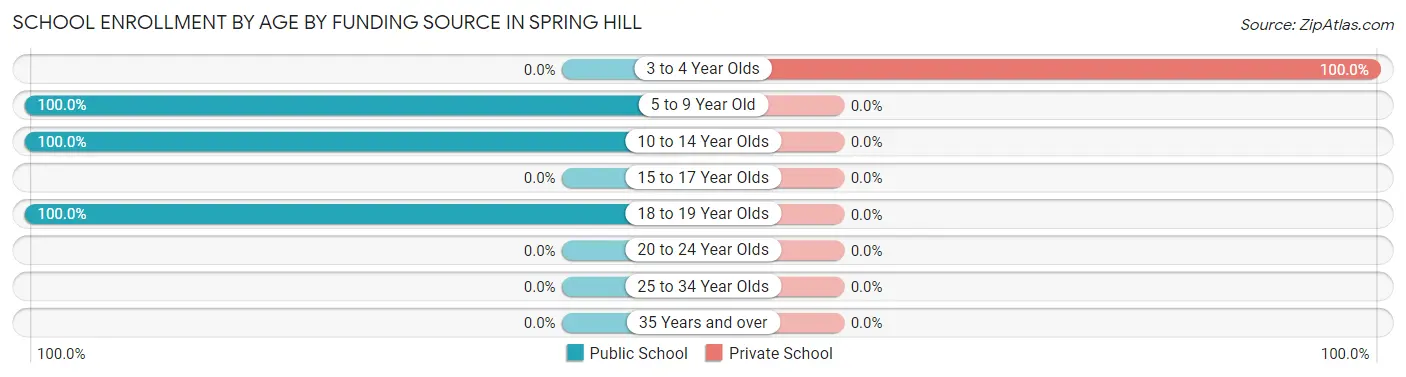
| Age Bracket | Public School | Private School |
| 3 to 4 Year Olds | 0 (0.0%) | 2 (100.0%) |
| 5 to 9 Year Old | 13 (100.0%) | 0 (0.0%) |
| 10 to 14 Year Olds | 5 (100.0%) | 0 (0.0%) |
| 15 to 17 Year Olds | 0 (0.0%) | 0 (0.0%) |
| 18 to 19 Year Olds | 18 (100.0%) | 0 (0.0%) |
| 20 to 24 Year Olds | 0 (0.0%) | 0 (0.0%) |
| 25 to 34 Year Olds | 0 (0.0%) | 0 (0.0%) |
| 35 Years and over | 0 (0.0%) | 0 (0.0%) |
| Total | 36 (94.7%) | 2 (5.3%) |
Educational Attainment by Field of Study in Spring Hill
Business (5 | 83.3%), and education (1 | 16.7%) are the most common fields of study among 6 individuals in Spring Hill who have obtained a bachelor's degree or higher.
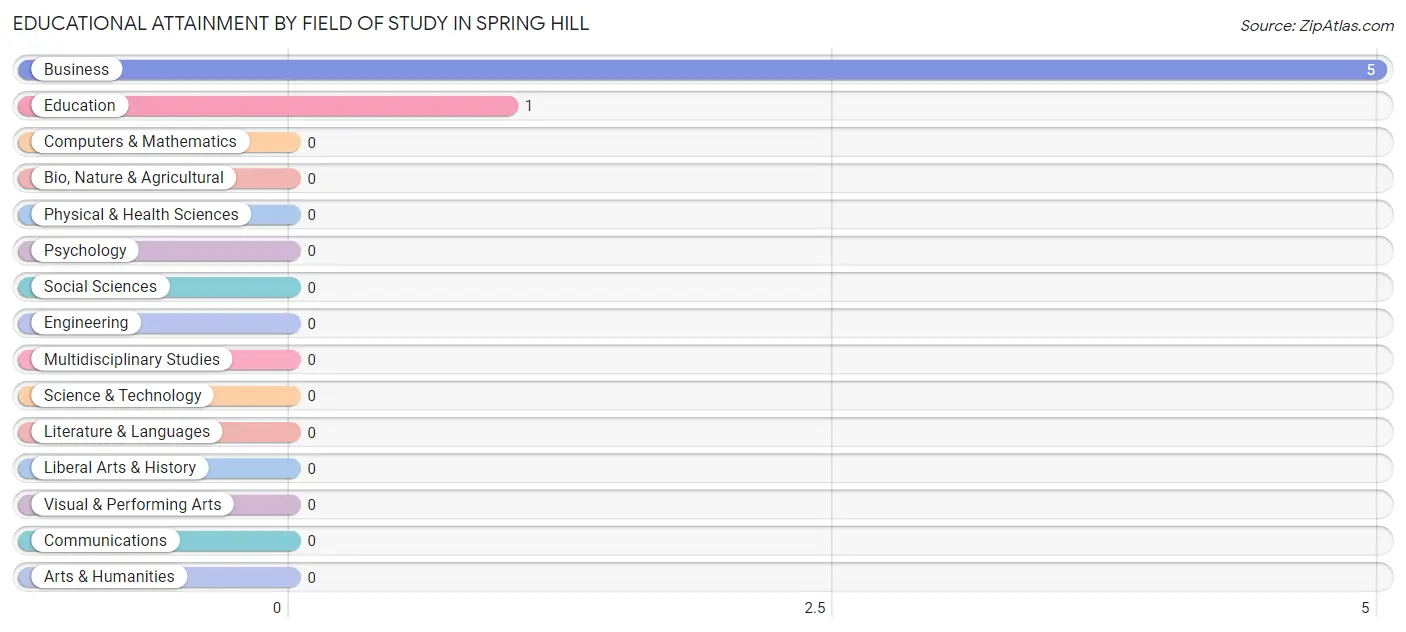
| Field of Study | # Graduates | % Graduates |
| Computers & Mathematics | 0 | 0.0% |
| Bio, Nature & Agricultural | 0 | 0.0% |
| Physical & Health Sciences | 0 | 0.0% |
| Psychology | 0 | 0.0% |
| Social Sciences | 0 | 0.0% |
| Engineering | 0 | 0.0% |
| Multidisciplinary Studies | 0 | 0.0% |
| Science & Technology | 0 | 0.0% |
| Business | 5 | 83.3% |
| Education | 1 | 16.7% |
| Literature & Languages | 0 | 0.0% |
| Liberal Arts & History | 0 | 0.0% |
| Visual & Performing Arts | 0 | 0.0% |
| Communications | 0 | 0.0% |
| Arts & Humanities | 0 | 0.0% |
| Total | 6 | 100.0% |
Transportation & Commute in Spring Hill
Vehicle Availability by Sex in Spring Hill
The most prevalent vehicle ownership categories in Spring Hill are males with 4 vehicles (12, accounting for 42.9%) and females with 4 vehicles (18, making up 33.3%).
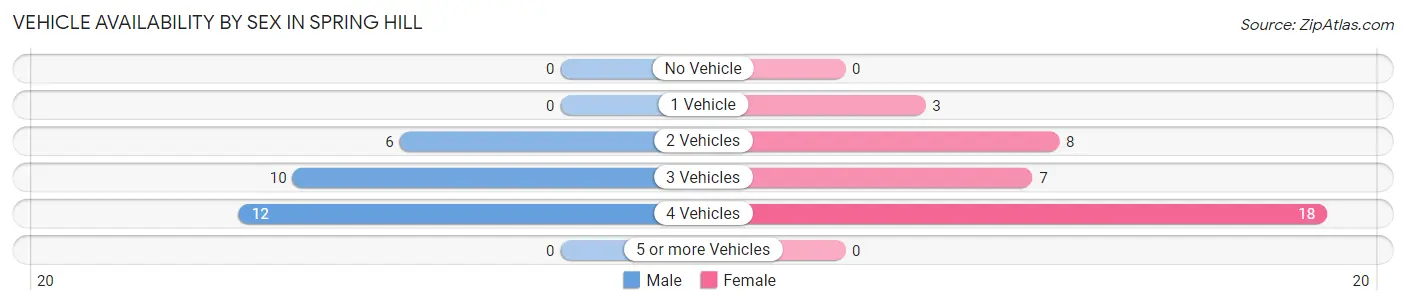
| Vehicles Available | Male | Female |
| No Vehicle | 0 (0.0%) | 0 (0.0%) |
| 1 Vehicle | 0 (0.0%) | 3 (8.3%) |
| 2 Vehicles | 6 (21.4%) | 8 (22.2%) |
| 3 Vehicles | 10 (35.7%) | 7 (19.4%) |
| 4 Vehicles | 12 (42.9%) | 18 (50.0%) |
| 5 or more Vehicles | 0 (0.0%) | 0 (0.0%) |
| Total | 28 (100.0%) | 36 (100.0%) |
Commute Time in Spring Hill
The most frequently occuring commute durations in Spring Hill are 20 to 24 minutes (35 commuters, 59.3%), less than 5 minutes (16 commuters, 27.1%), and 15 to 19 minutes (4 commuters, 6.8%).
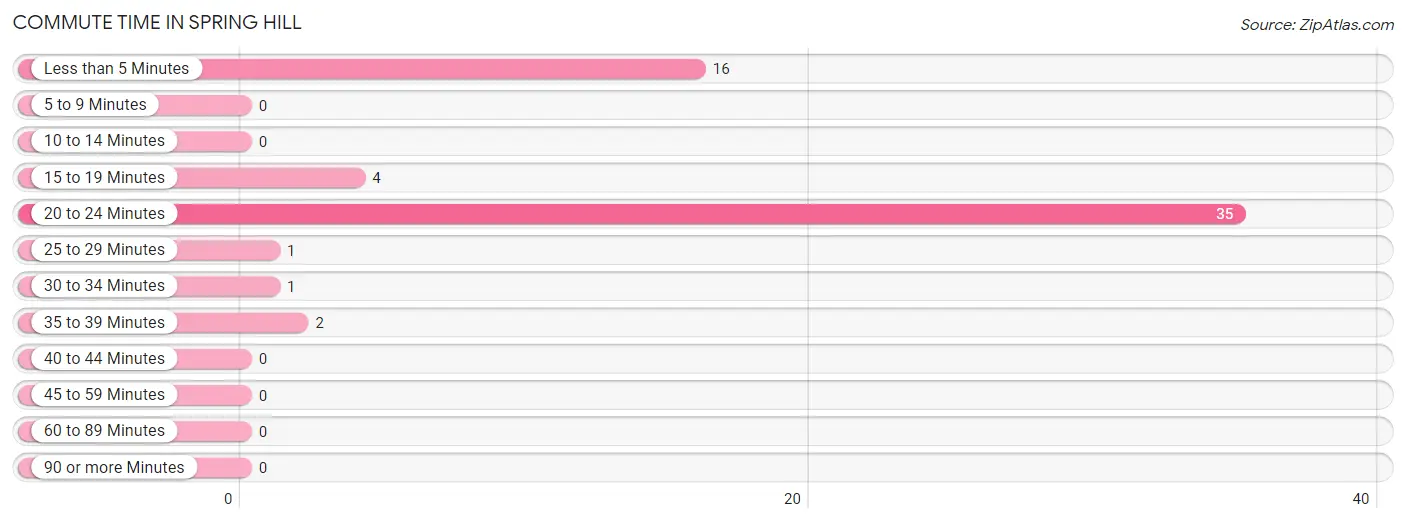
| Commute Time | # Commuters | % Commuters |
| Less than 5 Minutes | 16 | 27.1% |
| 5 to 9 Minutes | 0 | 0.0% |
| 10 to 14 Minutes | 0 | 0.0% |
| 15 to 19 Minutes | 4 | 6.8% |
| 20 to 24 Minutes | 35 | 59.3% |
| 25 to 29 Minutes | 1 | 1.7% |
| 30 to 34 Minutes | 1 | 1.7% |
| 35 to 39 Minutes | 2 | 3.4% |
| 40 to 44 Minutes | 0 | 0.0% |
| 45 to 59 Minutes | 0 | 0.0% |
| 60 to 89 Minutes | 0 | 0.0% |
| 90 or more Minutes | 0 | 0.0% |
Commute Time by Sex in Spring Hill
The most common commute times in Spring Hill are 20 to 24 minutes (15 commuters, 57.7%) for males and 20 to 24 minutes (20 commuters, 60.6%) for females.
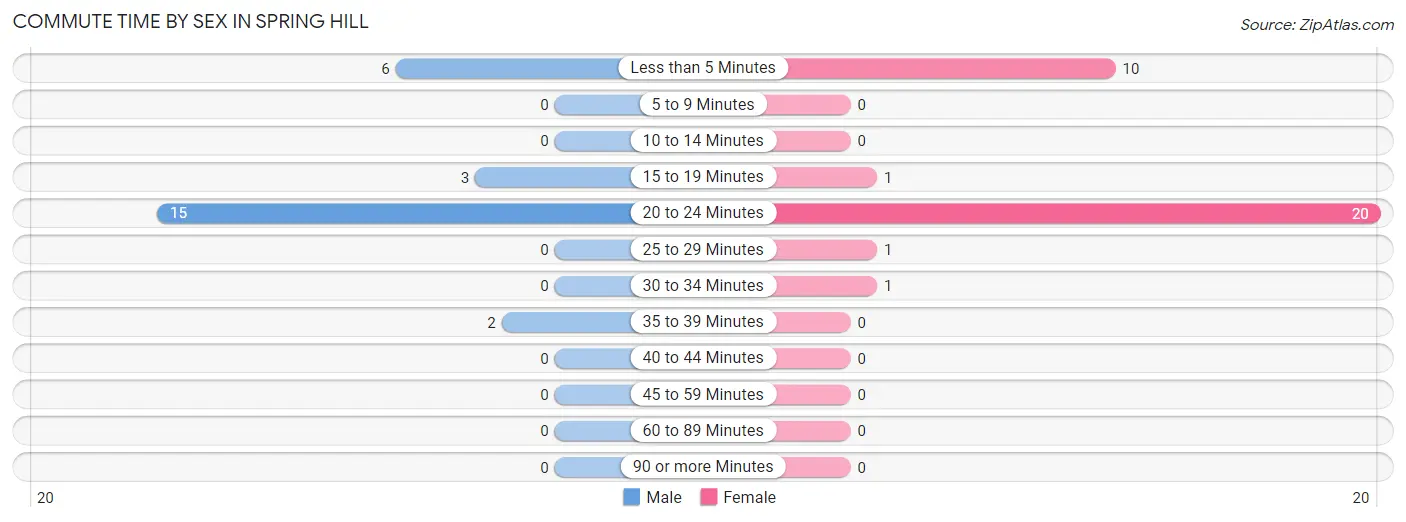
| Commute Time | Male | Female |
| Less than 5 Minutes | 6 (23.1%) | 10 (30.3%) |
| 5 to 9 Minutes | 0 (0.0%) | 0 (0.0%) |
| 10 to 14 Minutes | 0 (0.0%) | 0 (0.0%) |
| 15 to 19 Minutes | 3 (11.5%) | 1 (3.0%) |
| 20 to 24 Minutes | 15 (57.7%) | 20 (60.6%) |
| 25 to 29 Minutes | 0 (0.0%) | 1 (3.0%) |
| 30 to 34 Minutes | 0 (0.0%) | 1 (3.0%) |
| 35 to 39 Minutes | 2 (7.7%) | 0 (0.0%) |
| 40 to 44 Minutes | 0 (0.0%) | 0 (0.0%) |
| 45 to 59 Minutes | 0 (0.0%) | 0 (0.0%) |
| 60 to 89 Minutes | 0 (0.0%) | 0 (0.0%) |
| 90 or more Minutes | 0 (0.0%) | 0 (0.0%) |
Time of Departure to Work by Sex in Spring Hill
The most frequent times of departure to work in Spring Hill are 8:00 AM to 8:29 AM (15, 57.7%) for males and 12:00 PM to 3:59 PM (23, 69.7%) for females.
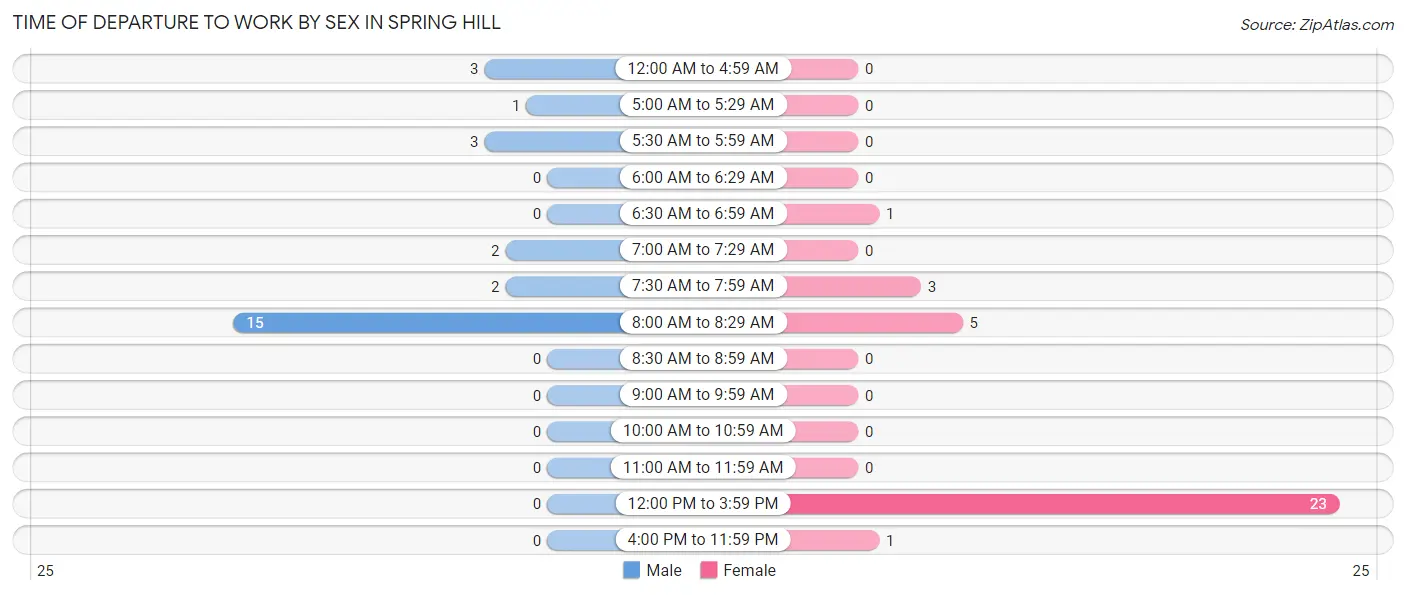
| Time of Departure | Male | Female |
| 12:00 AM to 4:59 AM | 3 (11.5%) | 0 (0.0%) |
| 5:00 AM to 5:29 AM | 1 (3.8%) | 0 (0.0%) |
| 5:30 AM to 5:59 AM | 3 (11.5%) | 0 (0.0%) |
| 6:00 AM to 6:29 AM | 0 (0.0%) | 0 (0.0%) |
| 6:30 AM to 6:59 AM | 0 (0.0%) | 1 (3.0%) |
| 7:00 AM to 7:29 AM | 2 (7.7%) | 0 (0.0%) |
| 7:30 AM to 7:59 AM | 2 (7.7%) | 3 (9.1%) |
| 8:00 AM to 8:29 AM | 15 (57.7%) | 5 (15.1%) |
| 8:30 AM to 8:59 AM | 0 (0.0%) | 0 (0.0%) |
| 9:00 AM to 9:59 AM | 0 (0.0%) | 0 (0.0%) |
| 10:00 AM to 10:59 AM | 0 (0.0%) | 0 (0.0%) |
| 11:00 AM to 11:59 AM | 0 (0.0%) | 0 (0.0%) |
| 12:00 PM to 3:59 PM | 0 (0.0%) | 23 (69.7%) |
| 4:00 PM to 11:59 PM | 0 (0.0%) | 1 (3.0%) |
| Total | 26 (100.0%) | 33 (100.0%) |
Housing Occupancy in Spring Hill
Occupancy by Ownership in Spring Hill
Of the total 50 dwellings in Spring Hill, owner-occupied units account for 50 (100.0%), while renter-occupied units make up 0 (0.0%).
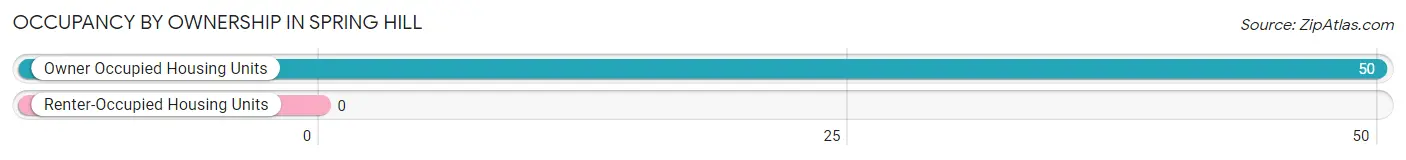
| Occupancy | # Housing Units | % Housing Units |
| Owner Occupied Housing Units | 50 | 100.0% |
| Renter-Occupied Housing Units | 0 | 0.0% |
| Total Occupied Housing Units | 50 | 100.0% |
Occupancy by Household Size in Spring Hill
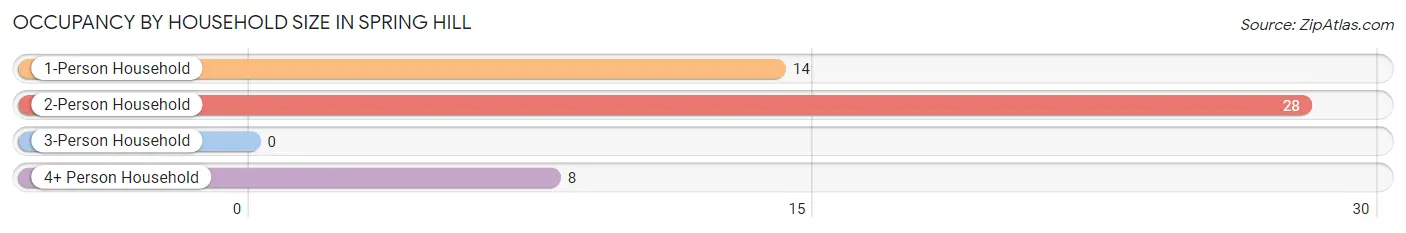
| Household Size | # Housing Units | % Housing Units |
| 1-Person Household | 14 | 28.0% |
| 2-Person Household | 28 | 56.0% |
| 3-Person Household | 0 | 0.0% |
| 4+ Person Household | 8 | 16.0% |
| Total Housing Units | 50 | 100.0% |
Occupancy by Ownership by Household Size in Spring Hill
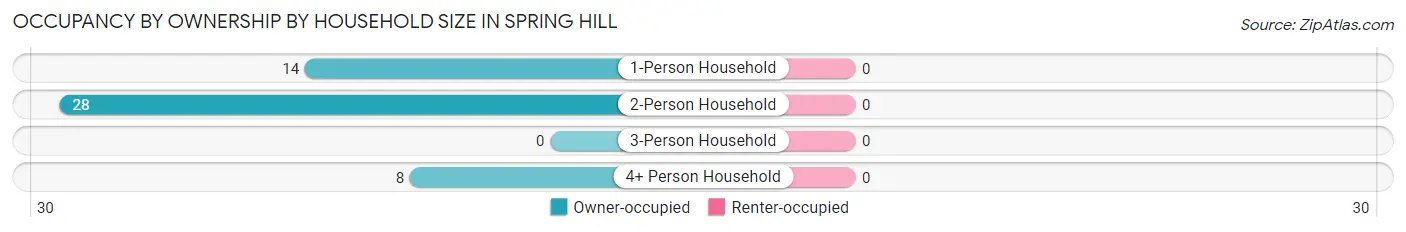
| Household Size | Owner-occupied | Renter-occupied |
| 1-Person Household | 14 (100.0%) | 0 (0.0%) |
| 2-Person Household | 28 (100.0%) | 0 (0.0%) |
| 3-Person Household | 0 (0.0%) | 0 (0.0%) |
| 4+ Person Household | 8 (100.0%) | 0 (0.0%) |
| Total Housing Units | 50 (100.0%) | 0 (0.0%) |
Occupancy by Educational Attainment in Spring Hill
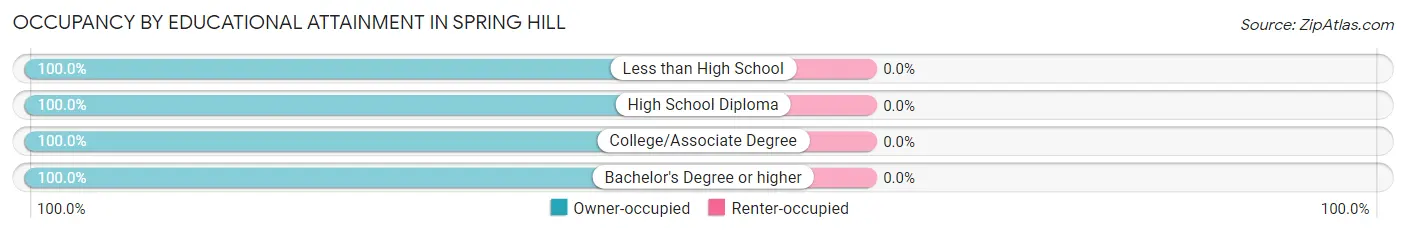
| Household Size | Owner-occupied | Renter-occupied |
| Less than High School | 6 (100.0%) | 0 (0.0%) |
| High School Diploma | 36 (100.0%) | 0 (0.0%) |
| College/Associate Degree | 3 (100.0%) | 0 (0.0%) |
| Bachelor's Degree or higher | 5 (100.0%) | 0 (0.0%) |
Occupancy by Age of Householder in Spring Hill
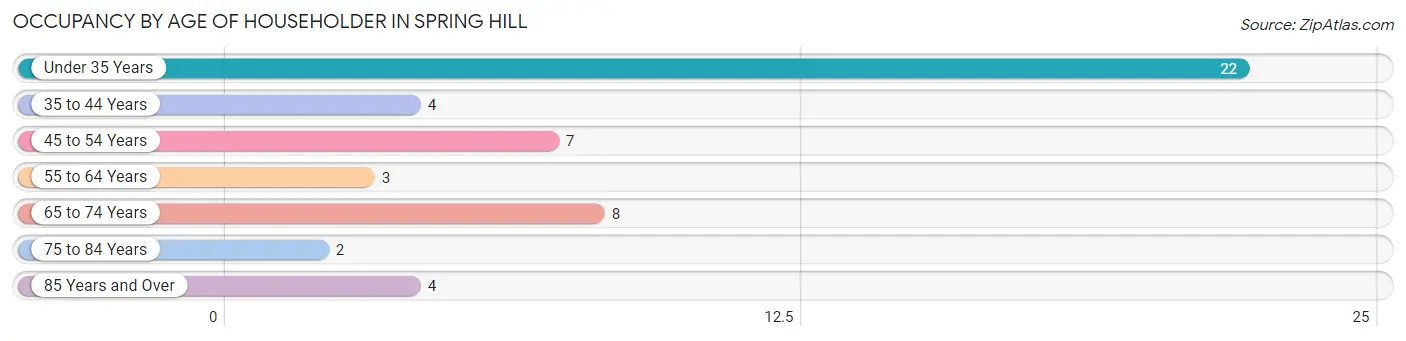
| Age Bracket | # Households | % Households |
| Under 35 Years | 22 | 44.0% |
| 35 to 44 Years | 4 | 8.0% |
| 45 to 54 Years | 7 | 14.0% |
| 55 to 64 Years | 3 | 6.0% |
| 65 to 74 Years | 8 | 16.0% |
| 75 to 84 Years | 2 | 4.0% |
| 85 Years and Over | 4 | 8.0% |
| Total | 50 | 100.0% |
Housing Finances in Spring Hill
Median Income by Occupancy in Spring Hill
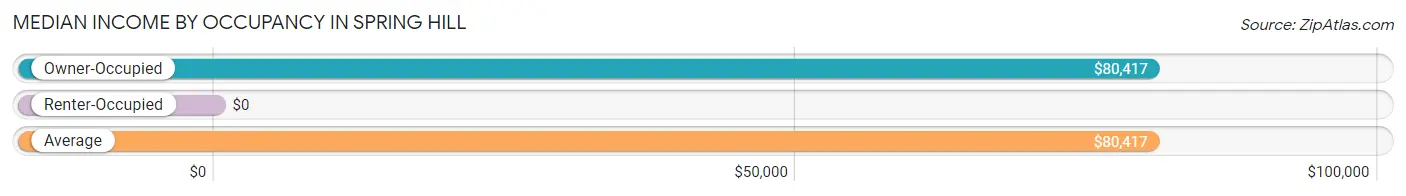
| Occupancy Type | # Households | Median Income |
| Owner-Occupied | 50 (100.0%) | $80,417 |
| Renter-Occupied | 0 (0.0%) | $0 |
| Average | 50 (100.0%) | $80,417 |
Occupancy by Householder Income Bracket in Spring Hill
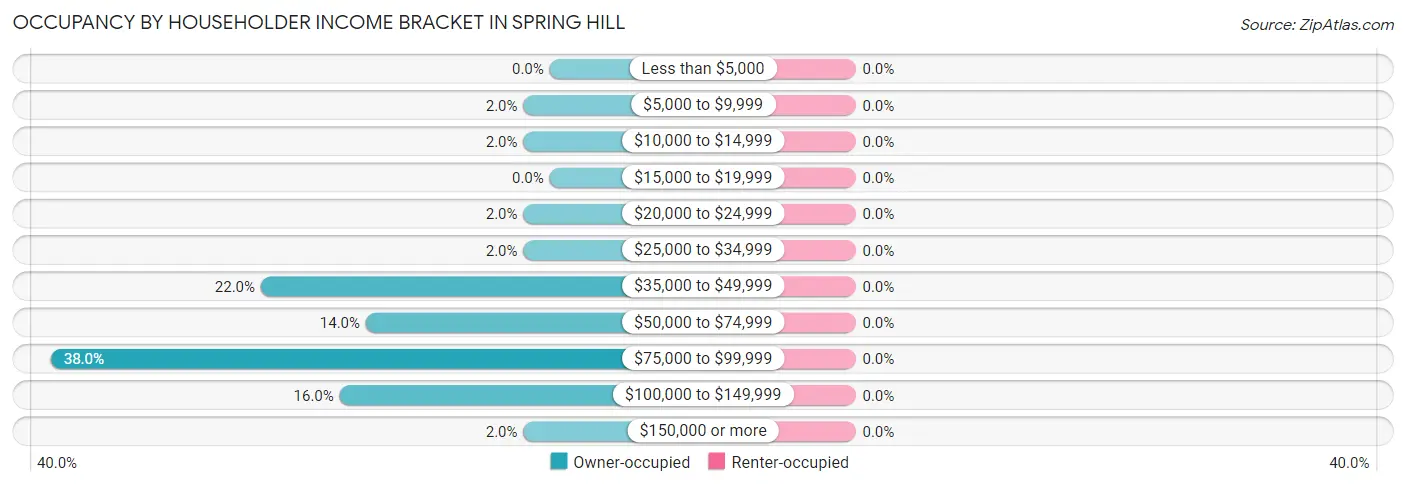
| Income Bracket | Owner-occupied | Renter-occupied |
| Less than $5,000 | 0 (0.0%) | 0 (0.0%) |
| $5,000 to $9,999 | 1 (2.0%) | 0 (0.0%) |
| $10,000 to $14,999 | 1 (2.0%) | 0 (0.0%) |
| $15,000 to $19,999 | 0 (0.0%) | 0 (0.0%) |
| $20,000 to $24,999 | 1 (2.0%) | 0 (0.0%) |
| $25,000 to $34,999 | 1 (2.0%) | 0 (0.0%) |
| $35,000 to $49,999 | 11 (22.0%) | 0 (0.0%) |
| $50,000 to $74,999 | 7 (14.0%) | 0 (0.0%) |
| $75,000 to $99,999 | 19 (38.0%) | 0 (0.0%) |
| $100,000 to $149,999 | 8 (16.0%) | 0 (0.0%) |
| $150,000 or more | 1 (2.0%) | 0 (0.0%) |
| Total | 50 (100.0%) | 0 (0.0%) |
Monthly Housing Cost Tiers in Spring Hill
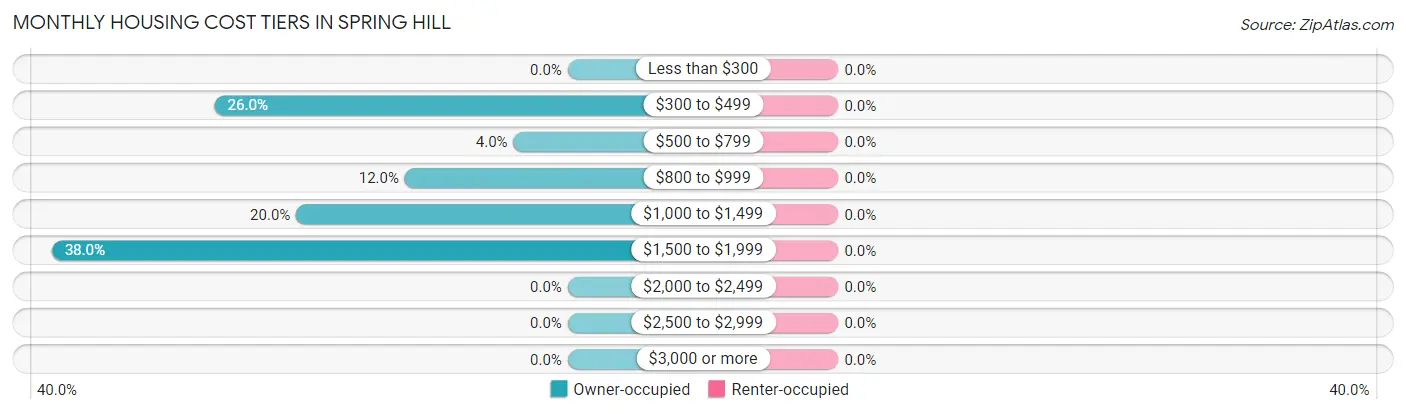
| Monthly Cost | Owner-occupied | Renter-occupied |
| Less than $300 | 0 (0.0%) | 0 (0.0%) |
| $300 to $499 | 13 (26.0%) | 0 (0.0%) |
| $500 to $799 | 2 (4.0%) | 0 (0.0%) |
| $800 to $999 | 6 (12.0%) | 0 (0.0%) |
| $1,000 to $1,499 | 10 (20.0%) | 0 (0.0%) |
| $1,500 to $1,999 | 19 (38.0%) | 0 (0.0%) |
| $2,000 to $2,499 | 0 (0.0%) | 0 (0.0%) |
| $2,500 to $2,999 | 0 (0.0%) | 0 (0.0%) |
| $3,000 or more | 0 (0.0%) | 0 (0.0%) |
| Total | 50 (100.0%) | 0 (0.0%) |
Physical Housing Characteristics in Spring Hill
Housing Structures in Spring Hill
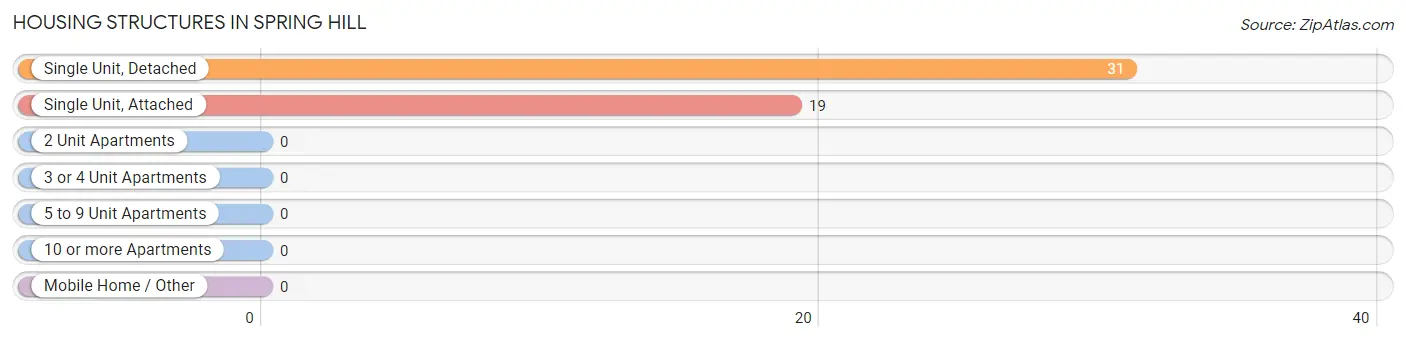
| Structure Type | # Housing Units | % Housing Units |
| Single Unit, Detached | 31 | 62.0% |
| Single Unit, Attached | 19 | 38.0% |
| 2 Unit Apartments | 0 | 0.0% |
| 3 or 4 Unit Apartments | 0 | 0.0% |
| 5 to 9 Unit Apartments | 0 | 0.0% |
| 10 or more Apartments | 0 | 0.0% |
| Mobile Home / Other | 0 | 0.0% |
| Total | 50 | 100.0% |
Housing Structures by Occupancy in Spring Hill
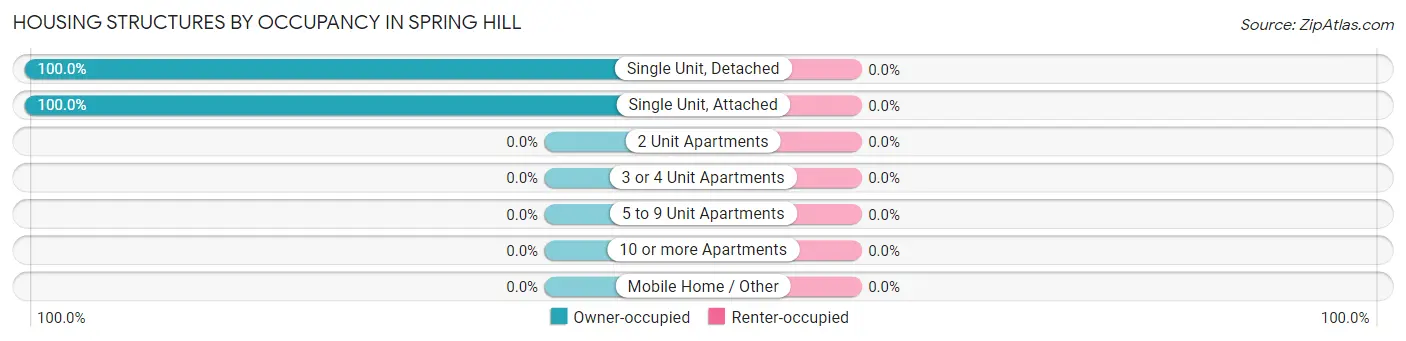
| Structure Type | Owner-occupied | Renter-occupied |
| Single Unit, Detached | 31 (100.0%) | 0 (0.0%) |
| Single Unit, Attached | 19 (100.0%) | 0 (0.0%) |
| 2 Unit Apartments | 0 (0.0%) | 0 (0.0%) |
| 3 or 4 Unit Apartments | 0 (0.0%) | 0 (0.0%) |
| 5 to 9 Unit Apartments | 0 (0.0%) | 0 (0.0%) |
| 10 or more Apartments | 0 (0.0%) | 0 (0.0%) |
| Mobile Home / Other | 0 (0.0%) | 0 (0.0%) |
| Total | 50 (100.0%) | 0 (0.0%) |
Housing Structures by Number of Rooms in Spring Hill
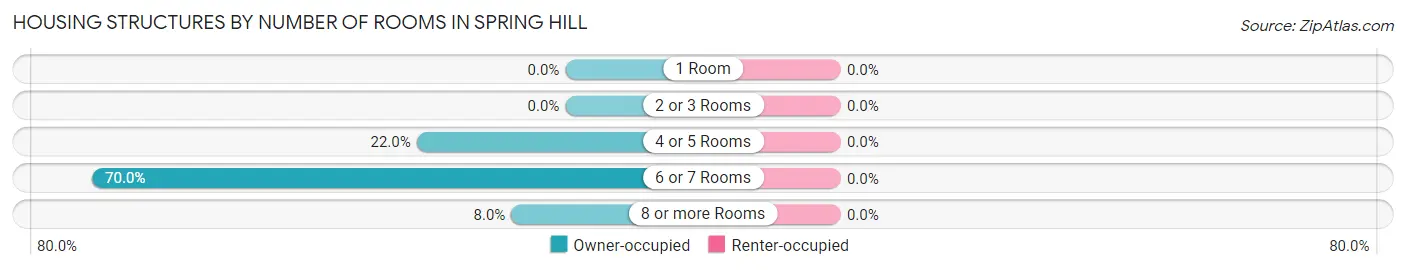
| Number of Rooms | Owner-occupied | Renter-occupied |
| 1 Room | 0 (0.0%) | 0 (0.0%) |
| 2 or 3 Rooms | 0 (0.0%) | 0 (0.0%) |
| 4 or 5 Rooms | 11 (22.0%) | 0 (0.0%) |
| 6 or 7 Rooms | 35 (70.0%) | 0 (0.0%) |
| 8 or more Rooms | 4 (8.0%) | 0 (0.0%) |
| Total | 50 (100.0%) | 0 (0.0%) |
Housing Structure by Heating Type in Spring Hill
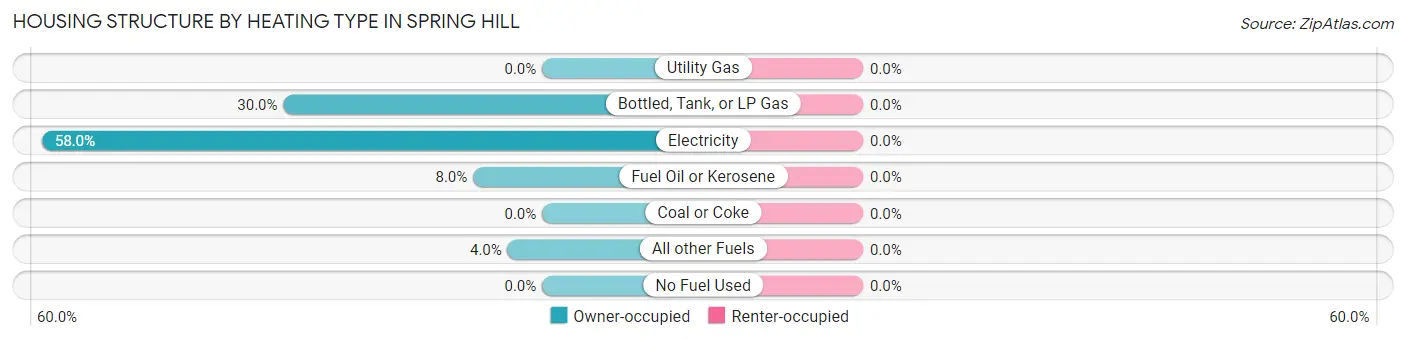
| Heating Type | Owner-occupied | Renter-occupied |
| Utility Gas | 0 (0.0%) | 0 (0.0%) |
| Bottled, Tank, or LP Gas | 15 (30.0%) | 0 (0.0%) |
| Electricity | 29 (58.0%) | 0 (0.0%) |
| Fuel Oil or Kerosene | 4 (8.0%) | 0 (0.0%) |
| Coal or Coke | 0 (0.0%) | 0 (0.0%) |
| All other Fuels | 2 (4.0%) | 0 (0.0%) |
| No Fuel Used | 0 (0.0%) | 0 (0.0%) |
| Total | 50 (100.0%) | 0 (0.0%) |
Household Vehicle Usage in Spring Hill
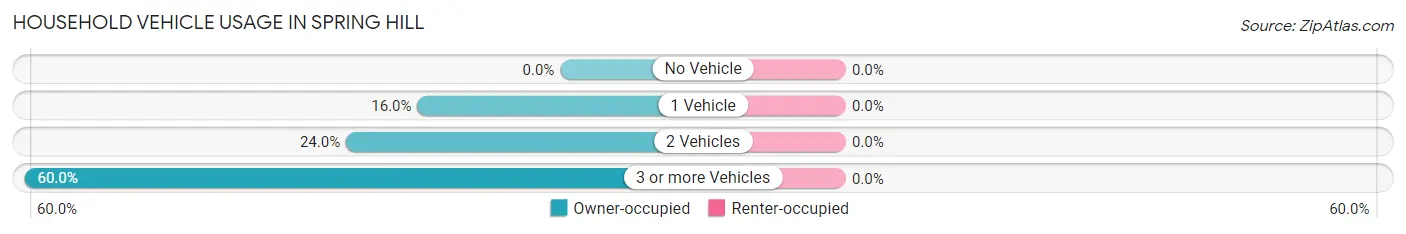
| Vehicles per Household | Owner-occupied | Renter-occupied |
| No Vehicle | 0 (0.0%) | 0 (0.0%) |
| 1 Vehicle | 8 (16.0%) | 0 (0.0%) |
| 2 Vehicles | 12 (24.0%) | 0 (0.0%) |
| 3 or more Vehicles | 30 (60.0%) | 0 (0.0%) |
| Total | 50 (100.0%) | 0 (0.0%) |
Real Estate & Mortgages in Spring Hill
Real Estate and Mortgage Overview in Spring Hill
| Characteristic | Without Mortgage | With Mortgage |
| Housing Units | 18 | 32 |
| Median Property Value | $118,800 | $181,800 |
| Median Household Income | $47,500 | $1 |
| Monthly Housing Costs | $450 | $0 |
| Real Estate Taxes | $2,000 | $0 |
Property Value by Mortgage Status in Spring Hill
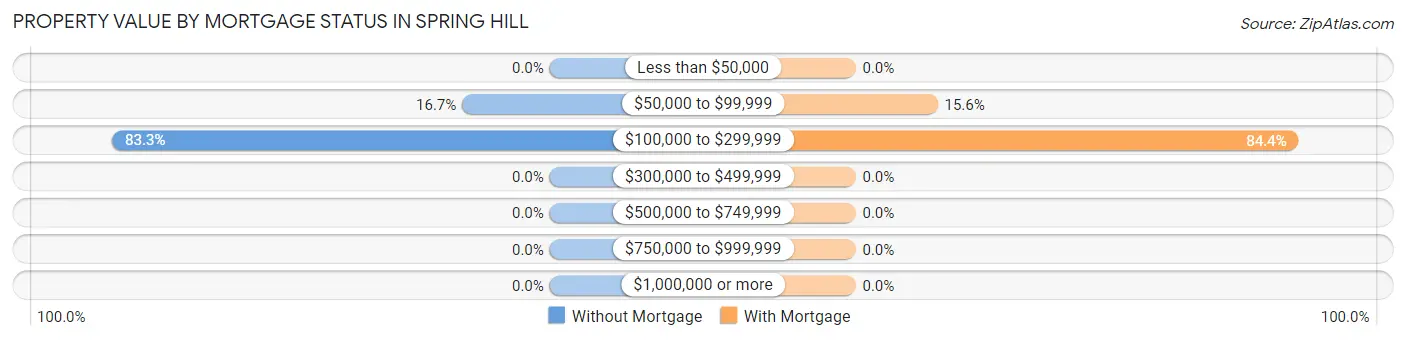
| Property Value | Without Mortgage | With Mortgage |
| Less than $50,000 | 0 (0.0%) | 0 (0.0%) |
| $50,000 to $99,999 | 3 (16.7%) | 5 (15.6%) |
| $100,000 to $299,999 | 15 (83.3%) | 27 (84.4%) |
| $300,000 to $499,999 | 0 (0.0%) | 0 (0.0%) |
| $500,000 to $749,999 | 0 (0.0%) | 0 (0.0%) |
| $750,000 to $999,999 | 0 (0.0%) | 0 (0.0%) |
| $1,000,000 or more | 0 (0.0%) | 0 (0.0%) |
| Total | 18 (100.0%) | 32 (100.0%) |
Household Income by Mortgage Status in Spring Hill
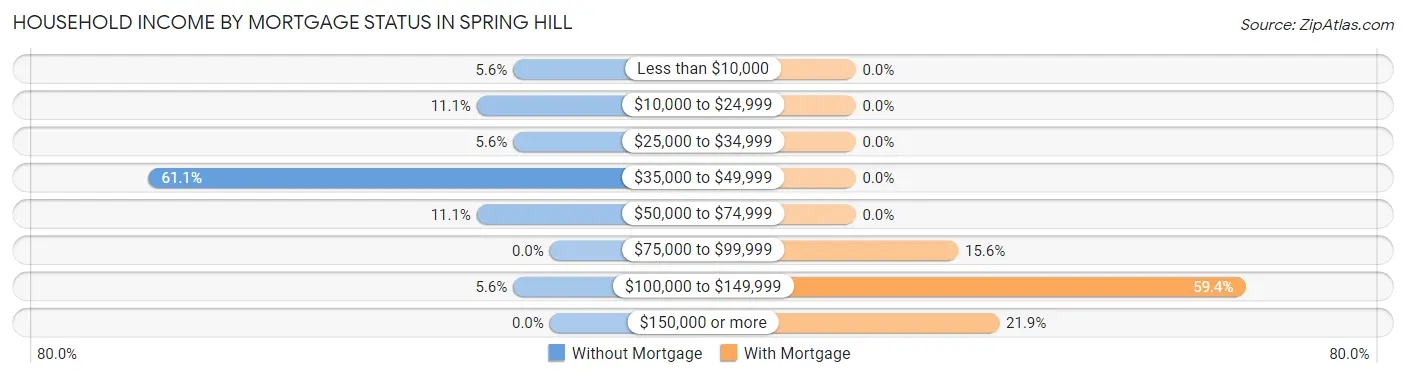
| Household Income | Without Mortgage | With Mortgage |
| Less than $10,000 | 1 (5.6%) | 0 (0.0%) |
| $10,000 to $24,999 | 2 (11.1%) | 0 (0.0%) |
| $25,000 to $34,999 | 1 (5.6%) | 0 (0.0%) |
| $35,000 to $49,999 | 11 (61.1%) | 0 (0.0%) |
| $50,000 to $74,999 | 2 (11.1%) | 0 (0.0%) |
| $75,000 to $99,999 | 0 (0.0%) | 5 (15.6%) |
| $100,000 to $149,999 | 1 (5.6%) | 19 (59.4%) |
| $150,000 or more | 0 (0.0%) | 7 (21.9%) |
| Total | 18 (100.0%) | 32 (100.0%) |
Property Value to Household Income Ratio in Spring Hill
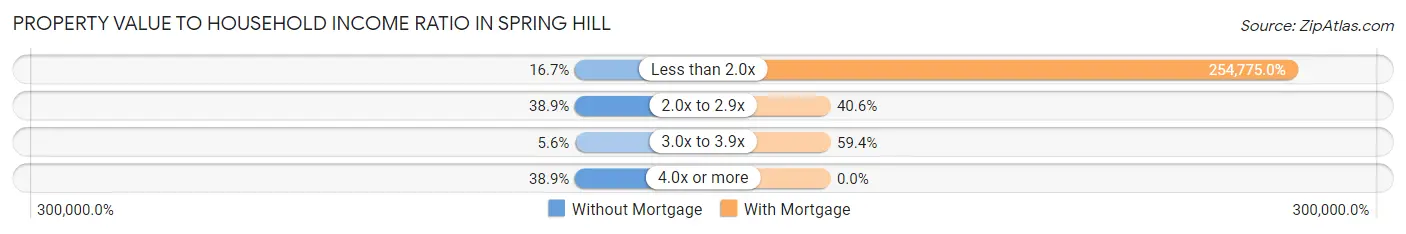
| Value-to-Income Ratio | Without Mortgage | With Mortgage |
| Less than 2.0x | 3 (16.7%) | 81,528 (254,775.0%) |
| 2.0x to 2.9x | 7 (38.9%) | 13 (40.6%) |
| 3.0x to 3.9x | 1 (5.6%) | 19 (59.4%) |
| 4.0x or more | 7 (38.9%) | 0 (0.0%) |
| Total | 18 (100.0%) | 32 (100.0%) |
Real Estate Taxes by Mortgage Status in Spring Hill
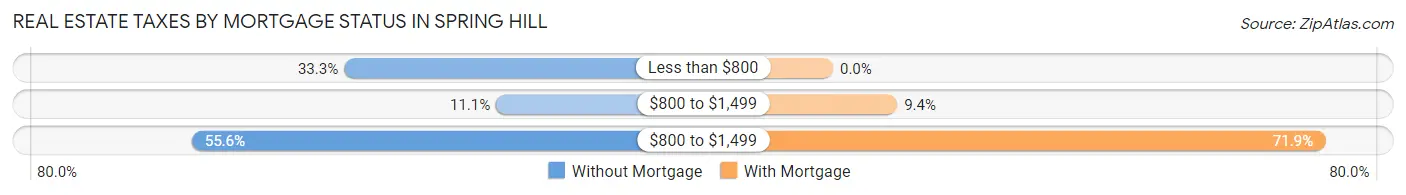
| Property Taxes | Without Mortgage | With Mortgage |
| Less than $800 | 6 (33.3%) | 0 (0.0%) |
| $800 to $1,499 | 2 (11.1%) | 3 (9.4%) |
| $800 to $1,499 | 10 (55.6%) | 23 (71.9%) |
| Total | 18 (100.0%) | 32 (100.0%) |
Health & Disability in Spring Hill
Health Insurance Coverage by Age in Spring Hill
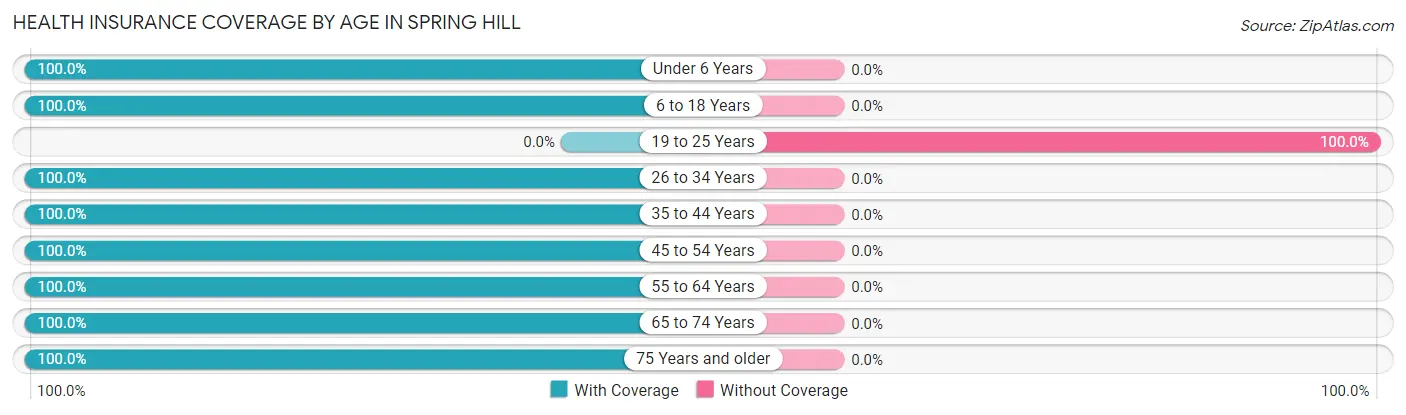
| Age Bracket | With Coverage | Without Coverage |
| Under 6 Years | 5 (100.0%) | 0 (0.0%) |
| 6 to 18 Years | 18 (100.0%) | 0 (0.0%) |
| 19 to 25 Years | 0 (0.0%) | 28 (100.0%) |
| 26 to 34 Years | 5 (100.0%) | 0 (0.0%) |
| 35 to 44 Years | 5 (100.0%) | 0 (0.0%) |
| 45 to 54 Years | 14 (100.0%) | 0 (0.0%) |
| 55 to 64 Years | 6 (100.0%) | 0 (0.0%) |
| 65 to 74 Years | 11 (100.0%) | 0 (0.0%) |
| 75 Years and older | 6 (100.0%) | 0 (0.0%) |
| Total | 70 (71.4%) | 28 (28.6%) |
Health Insurance Coverage by Citizenship Status in Spring Hill
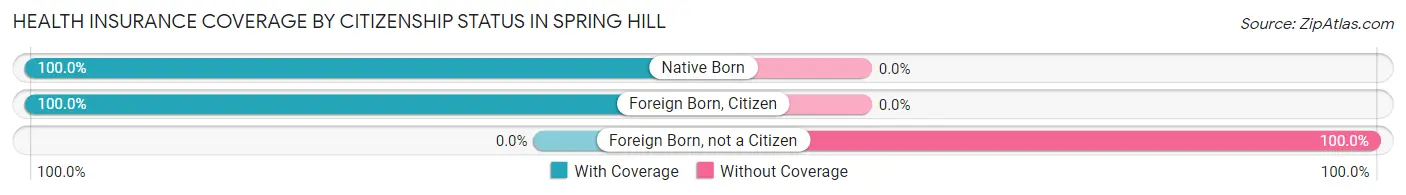
| Citizenship Status | With Coverage | Without Coverage |
| Native Born | 5 (100.0%) | 0 (0.0%) |
| Foreign Born, Citizen | 18 (100.0%) | 0 (0.0%) |
| Foreign Born, not a Citizen | 0 (0.0%) | 28 (100.0%) |
Health Insurance Coverage by Household Income in Spring Hill
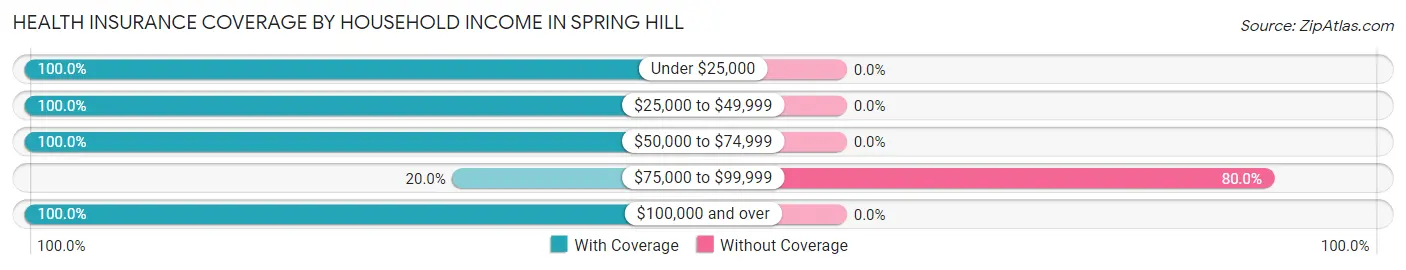
| Household Income | With Coverage | Without Coverage |
| Under $25,000 | 4 (100.0%) | 0 (0.0%) |
| $25,000 to $49,999 | 14 (100.0%) | 0 (0.0%) |
| $50,000 to $74,999 | 18 (100.0%) | 0 (0.0%) |
| $75,000 to $99,999 | 7 (20.0%) | 28 (80.0%) |
| $100,000 and over | 27 (100.0%) | 0 (0.0%) |
Public vs Private Health Insurance Coverage by Age in Spring Hill
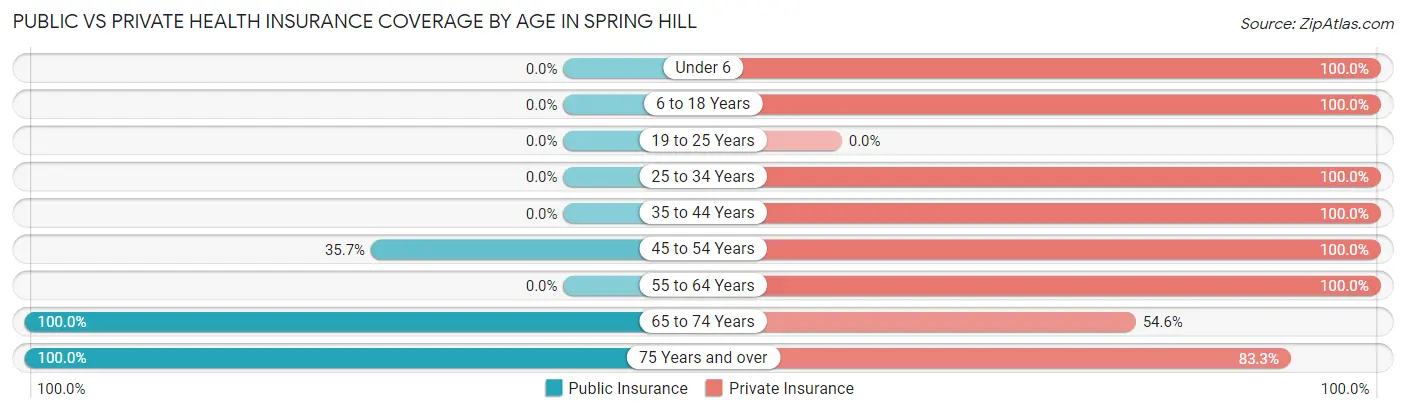
| Age Bracket | Public Insurance | Private Insurance |
| Under 6 | 0 (0.0%) | 5 (100.0%) |
| 6 to 18 Years | 0 (0.0%) | 18 (100.0%) |
| 19 to 25 Years | 0 (0.0%) | 0 (0.0%) |
| 25 to 34 Years | 0 (0.0%) | 5 (100.0%) |
| 35 to 44 Years | 0 (0.0%) | 5 (100.0%) |
| 45 to 54 Years | 5 (35.7%) | 14 (100.0%) |
| 55 to 64 Years | 0 (0.0%) | 6 (100.0%) |
| 65 to 74 Years | 11 (100.0%) | 6 (54.5%) |
| 75 Years and over | 6 (100.0%) | 5 (83.3%) |
| Total | 22 (22.5%) | 64 (65.3%) |
Disability Status by Sex by Age in Spring Hill
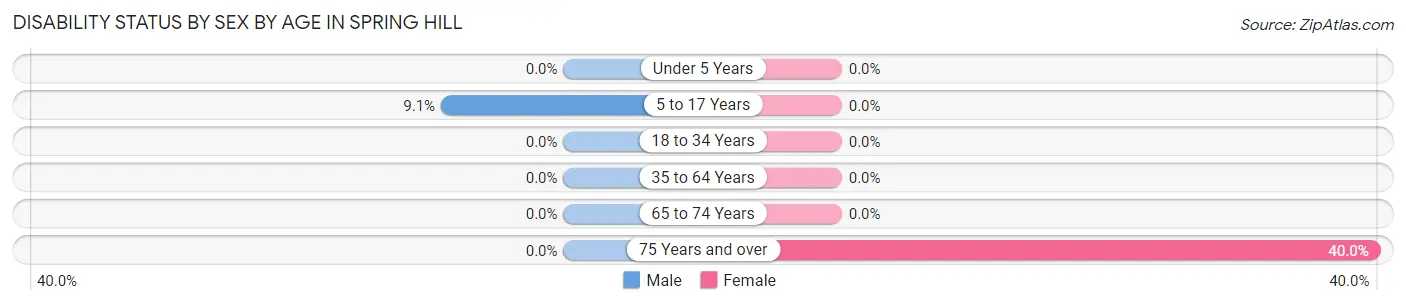
| Age Bracket | Male | Female |
| Under 5 Years | 0 (0.0%) | 0 (0.0%) |
| 5 to 17 Years | 1 (9.1%) | 0 (0.0%) |
| 18 to 34 Years | 0 (0.0%) | 0 (0.0%) |
| 35 to 64 Years | 0 (0.0%) | 0 (0.0%) |
| 65 to 74 Years | 0 (0.0%) | 0 (0.0%) |
| 75 Years and over | 0 (0.0%) | 2 (40.0%) |
Disability Class by Sex by Age in Spring Hill
Disability Class: Hearing Difficulty
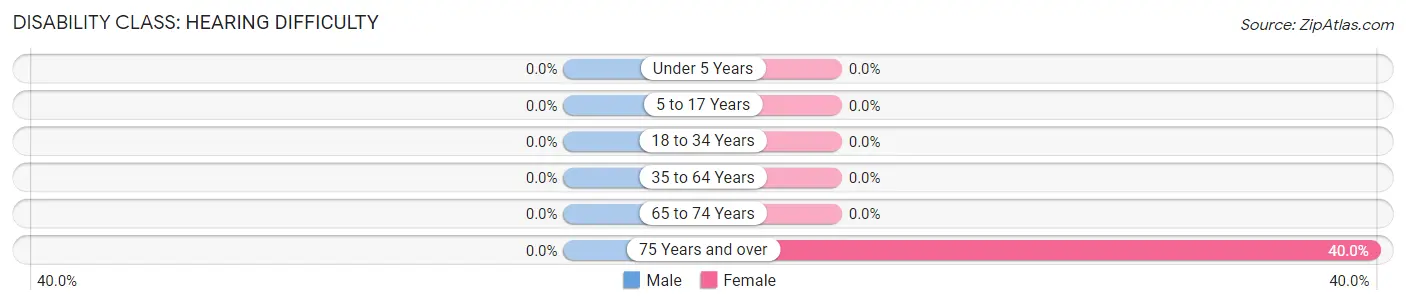
| Age Bracket | Male | Female |
| Under 5 Years | 0 (0.0%) | 0 (0.0%) |
| 5 to 17 Years | 0 (0.0%) | 0 (0.0%) |
| 18 to 34 Years | 0 (0.0%) | 0 (0.0%) |
| 35 to 64 Years | 0 (0.0%) | 0 (0.0%) |
| 65 to 74 Years | 0 (0.0%) | 0 (0.0%) |
| 75 Years and over | 0 (0.0%) | 2 (40.0%) |
Disability Class: Vision Difficulty
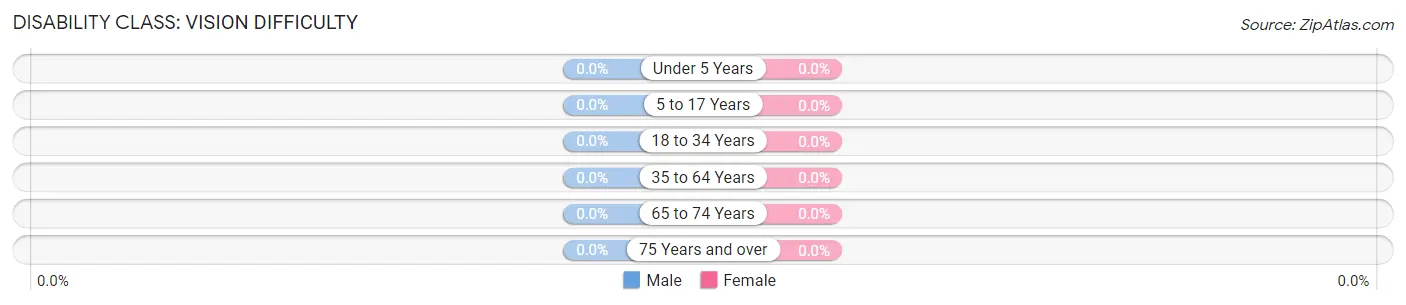
| Age Bracket | Male | Female |
| Under 5 Years | 0 (0.0%) | 0 (0.0%) |
| 5 to 17 Years | 0 (0.0%) | 0 (0.0%) |
| 18 to 34 Years | 0 (0.0%) | 0 (0.0%) |
| 35 to 64 Years | 0 (0.0%) | 0 (0.0%) |
| 65 to 74 Years | 0 (0.0%) | 0 (0.0%) |
| 75 Years and over | 0 (0.0%) | 0 (0.0%) |
Disability Class: Cognitive Difficulty
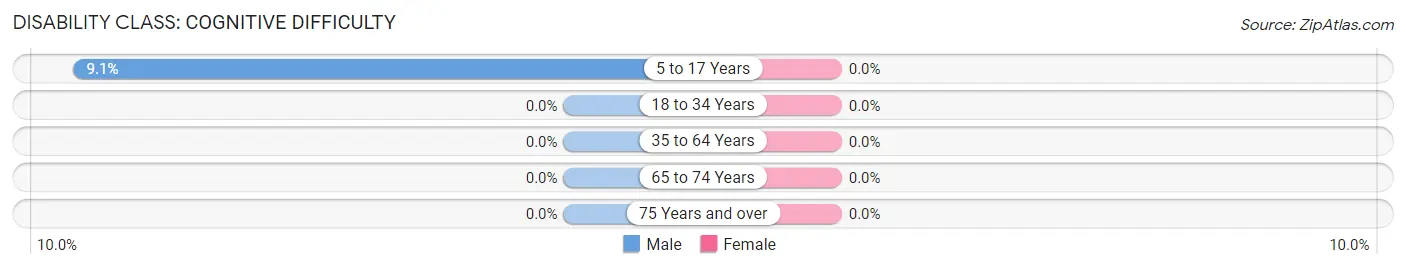
| Age Bracket | Male | Female |
| 5 to 17 Years | 1 (9.1%) | 0 (0.0%) |
| 18 to 34 Years | 0 (0.0%) | 0 (0.0%) |
| 35 to 64 Years | 0 (0.0%) | 0 (0.0%) |
| 65 to 74 Years | 0 (0.0%) | 0 (0.0%) |
| 75 Years and over | 0 (0.0%) | 0 (0.0%) |
Disability Class: Ambulatory Difficulty
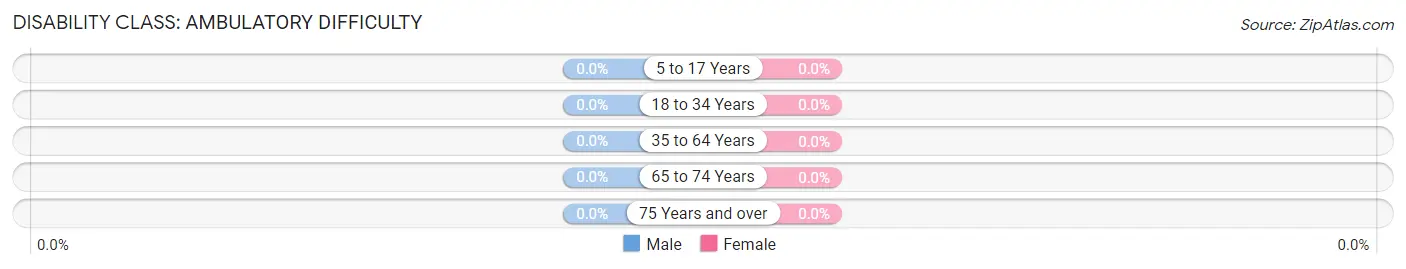
| Age Bracket | Male | Female |
| 5 to 17 Years | 0 (0.0%) | 0 (0.0%) |
| 18 to 34 Years | 0 (0.0%) | 0 (0.0%) |
| 35 to 64 Years | 0 (0.0%) | 0 (0.0%) |
| 65 to 74 Years | 0 (0.0%) | 0 (0.0%) |
| 75 Years and over | 0 (0.0%) | 0 (0.0%) |
Disability Class: Self-Care Difficulty
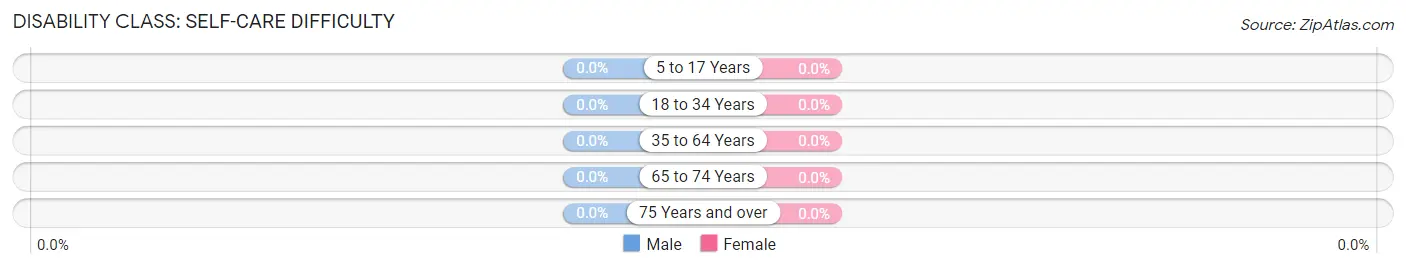
| Age Bracket | Male | Female |
| 5 to 17 Years | 0 (0.0%) | 0 (0.0%) |
| 18 to 34 Years | 0 (0.0%) | 0 (0.0%) |
| 35 to 64 Years | 0 (0.0%) | 0 (0.0%) |
| 65 to 74 Years | 0 (0.0%) | 0 (0.0%) |
| 75 Years and over | 0 (0.0%) | 0 (0.0%) |
Technology Access in Spring Hill
Computing Device Access in Spring Hill
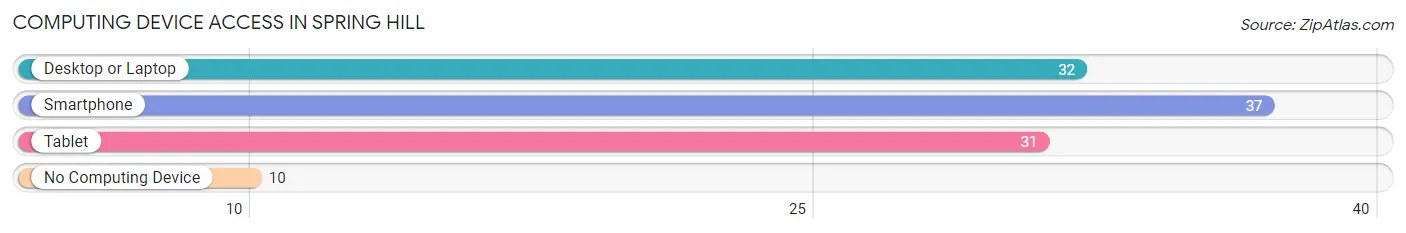
| Device Type | # Households | % Households |
| Desktop or Laptop | 32 | 64.0% |
| Smartphone | 37 | 74.0% |
| Tablet | 31 | 62.0% |
| No Computing Device | 10 | 20.0% |
| Total | 50 | 100.0% |
Internet Access in Spring Hill
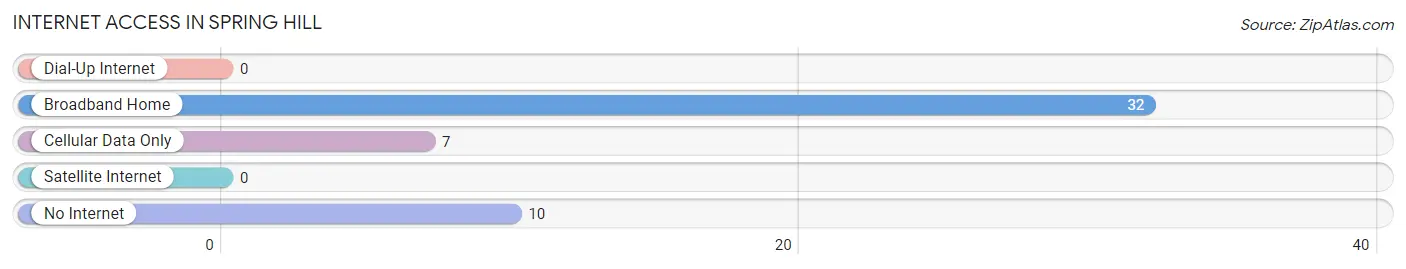
| Internet Type | # Households | % Households |
| Dial-Up Internet | 0 | 0.0% |
| Broadband Home | 32 | 64.0% |
| Cellular Data Only | 7 | 14.0% |
| Satellite Internet | 0 | 0.0% |
| No Internet | 10 | 20.0% |
| Total | 50 | 100.0% |
Spring Hill Summary
History
Spring Hill is a small city located in the southern part of Minnesota, in Scott County. It is a suburb of the Twin Cities metropolitan area, located about 20 miles south of Minneapolis and St. Paul. The city was founded in 1854 by a group of settlers from New England, who were looking for a place to settle and start a new life. The city was named after a nearby spring, which provided the settlers with a source of fresh water.
The city grew slowly over the years, and by the early 1900s, it had become a thriving community. The city was home to a variety of businesses, including a flour mill, a sawmill, a brickyard, and a creamery. The city also had a number of churches, schools, and other civic organizations.
In the 1950s, the city began to experience rapid growth as the Twin Cities metropolitan area expanded. This growth was fueled by the construction of Interstate 35, which connected the city to the rest of the metropolitan area. The city also experienced a population boom, as many people moved to the area to take advantage of the new job opportunities.
Today, Spring Hill is a vibrant and growing city. It is home to a variety of businesses, including retail stores, restaurants, and professional services. The city also has a number of parks and recreational facilities, as well as a number of cultural and educational institutions.
Geography
Spring Hill is located in the southern part of Minnesota, in Scott County. It is situated on the banks of the Minnesota River, about 20 miles south of Minneapolis and St. Paul. The city covers an area of about 5.5 square miles, and has a population of approximately 8,000 people.
The city is located in a region of rolling hills and wooded areas. The terrain is mostly flat, with some areas of higher elevation. The climate is generally mild, with cold winters and warm summers.
Economy
The economy of Spring Hill is largely based on the service sector. The city is home to a variety of businesses, including retail stores, restaurants, and professional services. The city also has a number of parks and recreational facilities, as well as a number of cultural and educational institutions.
The city is also home to a number of manufacturing companies, including a paper mill, a printing company, and a plastics manufacturer. The city is also home to a number of technology companies, including a software development firm and a medical device manufacturer.
Demographics
As of the 2010 census, the population of Spring Hill was 8,000 people. The racial makeup of the city was 87.3% White, 5.2% African American, 0.7% Native American, 1.7% Asian, 0.1% Pacific Islander, and 4.0% from other races. The median household income was $60,000, and the median family income was $68,000.
The city is home to a variety of religious denominations, including Catholic, Lutheran, Methodist, and Baptist. The city also has a number of cultural and educational institutions, including a library, a museum, and a performing arts center.
Conclusion
Spring Hill is a small city located in the southern part of Minnesota, in Scott County. It is a suburb of the Twin Cities metropolitan area, located about 20 miles south of Minneapolis and St. Paul. The city was founded in 1854 by a group of settlers from New England, and has since grown into a vibrant and growing city. The city is home to a variety of businesses, including retail stores, restaurants, and professional services. The city also has a number of parks and recreational facilities, as well as a number of cultural and educational institutions. The population of Spring Hill is 8,000 people, and the median household income is $60,000.
Common Questions
What is Per Capita Income in Spring Hill?
Per Capita income in Spring Hill is $35,957.
What is the Median Family Income in Spring Hill?
Median Family Income in Spring Hill is $61,875.
What is the Median Household income in Spring Hill?
Median Household Income in Spring Hill is $80,417.
What is Income or Wage Gap in Spring Hill?
Income or Wage Gap in Spring Hill is 38.7%.
Women in Spring Hill earn 61.3 cents for every dollar earned by a man.
What is Inequality or Gini Index in Spring Hill?
Inequality or Gini Index in Spring Hill is 0.26.
What is the Total Population of Spring Hill?
Total Population of Spring Hill is 98.
What is the Total Male Population of Spring Hill?
Total Male Population of Spring Hill is 43.
What is the Total Female Population of Spring Hill?
Total Female Population of Spring Hill is 55.
What is the Ratio of Males per 100 Females in Spring Hill?
There are 78.18 Males per 100 Females in Spring Hill.
What is the Ratio of Females per 100 Males in Spring Hill?
There are 127.91 Females per 100 Males in Spring Hill.
What is the Median Population Age in Spring Hill?
Median Population Age in Spring Hill is 22.8 Years.
What is the Average Family Size in Spring Hill
Average Family Size in Spring Hill is 2.9 People.
What is the Average Household Size in Spring Hill
Average Household Size in Spring Hill is 2.0 People.
How Large is the Labor Force in Spring Hill?
There are 64 People in the Labor Forcein in Spring Hill.
What is the Percentage of People in the Labor Force in Spring Hill?
85.3% of People are in the Labor Force in Spring Hill.