Sargeant, MN Map & Demographics
Sargeant Map
Sargeant Overview
$35,261
PER CAPITA INCOME
$64,167
AVG FAMILY INCOME
$63,438
AVG HOUSEHOLD INCOME
40.3%
WAGE / INCOME GAP [ % ]
59.7¢/ $1
WAGE / INCOME GAP [ $ ]
0.41
INEQUALITY / GINI INDEX
41
TOTAL POPULATION
28
MALE POPULATION
13
FEMALE POPULATION
215.38
MALES / 100 FEMALES
46.43
FEMALES / 100 MALES
34.9
MEDIAN AGE
2.6
AVG FAMILY SIZE
2.2
AVG HOUSEHOLD SIZE
32
LABOR FORCE [ PEOPLE ]
82.1%
PERCENT IN LABOR FORCE
Sargeant Zip Codes
Sargeant Area Codes
Income in Sargeant
Income Overview in Sargeant
Per Capita Income in Sargeant is $35,261, while median incomes of families and households are $64,167 and $63,438 respectively.
| Characteristic | Number | Measure |
| Per Capita Income | 41 | $35,261 |
| Median Family Income | 10 | $64,167 |
| Mean Family Income | 10 | $73,680 |
| Median Household Income | 19 | $63,438 |
| Mean Household Income | 19 | $64,247 |
| Income Deficit | 10 | $0 |
| Wage / Income Gap (%) | 41 | 40.28% |
| Wage / Income Gap ($) | 41 | 59.72¢ per $1 |
| Gini / Inequality Index | 41 | 0.41 |
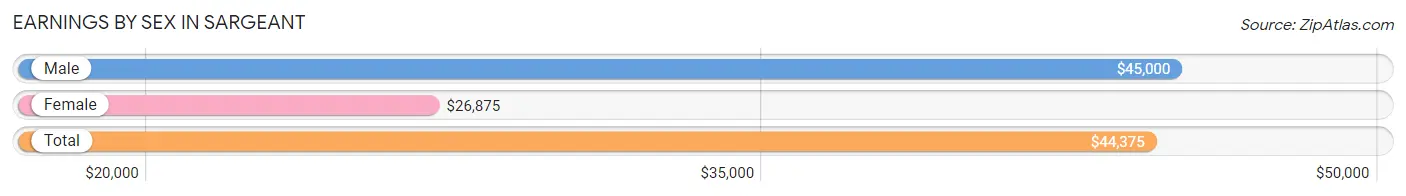
Earnings by Sex in Sargeant
Average Earnings in Sargeant are $44,375, $45,000 for men and $26,875 for women, a difference of 40.3%.
| Sex | Number | Average Earnings |
| Male | 22 (66.7%) | $45,000 |
| Female | 11 (33.3%) | $26,875 |
| Total | 33 (100.0%) | $44,375 |
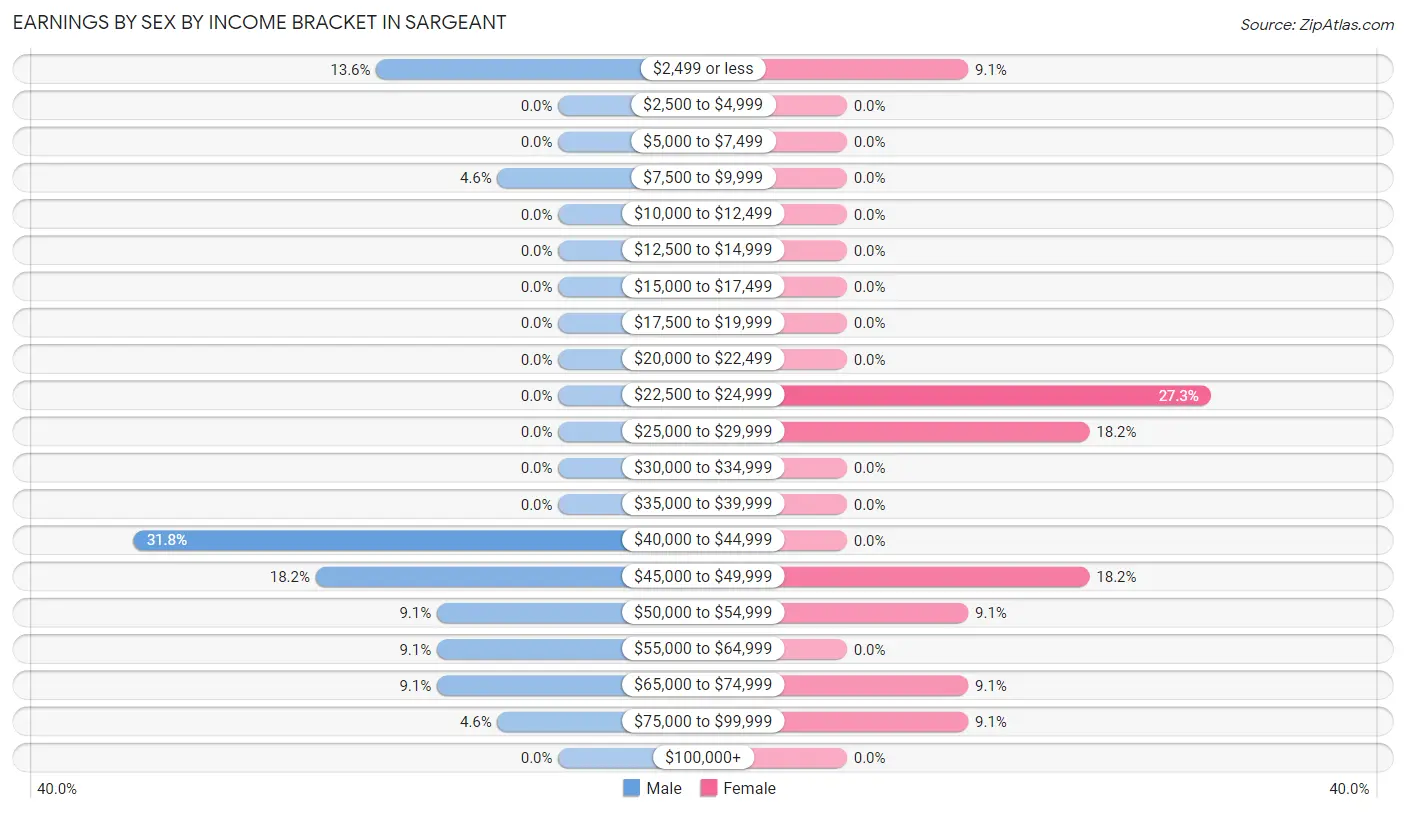
Earnings by Sex by Income Bracket in Sargeant
The most common earnings brackets in Sargeant are $40,000 to $44,999 for men (7 | 31.8%) and $22,500 to $24,999 for women (3 | 27.3%).
| Income | Male | Female |
| $2,499 or less | 3 (13.6%) | 1 (9.1%) |
| $2,500 to $4,999 | 0 (0.0%) | 0 (0.0%) |
| $5,000 to $7,499 | 0 (0.0%) | 0 (0.0%) |
| $7,500 to $9,999 | 1 (4.5%) | 0 (0.0%) |
| $10,000 to $12,499 | 0 (0.0%) | 0 (0.0%) |
| $12,500 to $14,999 | 0 (0.0%) | 0 (0.0%) |
| $15,000 to $17,499 | 0 (0.0%) | 0 (0.0%) |
| $17,500 to $19,999 | 0 (0.0%) | 0 (0.0%) |
| $20,000 to $22,499 | 0 (0.0%) | 0 (0.0%) |
| $22,500 to $24,999 | 0 (0.0%) | 3 (27.3%) |
| $25,000 to $29,999 | 0 (0.0%) | 2 (18.2%) |
| $30,000 to $34,999 | 0 (0.0%) | 0 (0.0%) |
| $35,000 to $39,999 | 0 (0.0%) | 0 (0.0%) |
| $40,000 to $44,999 | 7 (31.8%) | 0 (0.0%) |
| $45,000 to $49,999 | 4 (18.2%) | 2 (18.2%) |
| $50,000 to $54,999 | 2 (9.1%) | 1 (9.1%) |
| $55,000 to $64,999 | 2 (9.1%) | 0 (0.0%) |
| $65,000 to $74,999 | 2 (9.1%) | 1 (9.1%) |
| $75,000 to $99,999 | 1 (4.5%) | 1 (9.1%) |
| $100,000+ | 0 (0.0%) | 0 (0.0%) |
| Total | 22 (100.0%) | 11 (100.0%) |
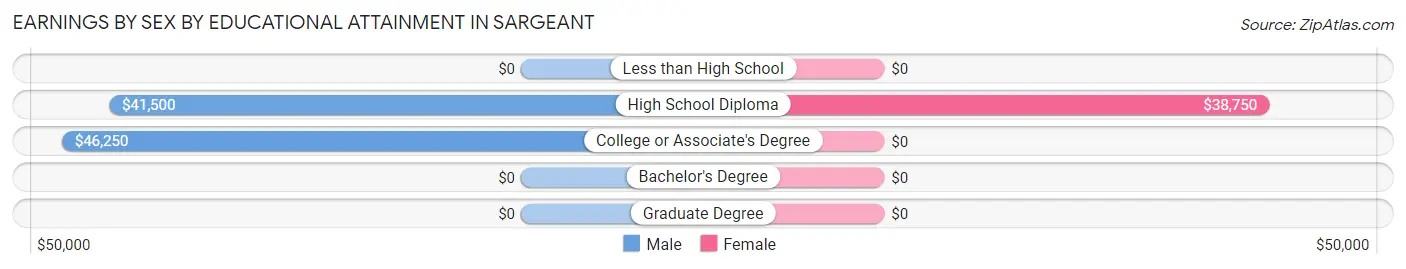
Earnings by Sex by Educational Attainment in Sargeant
Average earnings in Sargeant are $44,375 for men and $26,875 for women, a difference of 39.4%. Men with an educational attainment of college or associate's degree enjoy the highest average annual earnings of $46,250, while those with high school diploma education earn the least with $41,500. Women with an educational attainment of high school diploma earn the most with the average annual earnings of $38,750, while those with high school diploma education have the smallest earnings of $38,750.
| Educational Attainment | Male Income | Female Income |
| Less than High School | - | - |
| High School Diploma | $41,500 | $38,750 |
| College or Associate's Degree | $46,250 | $0 |
| Bachelor's Degree | - | - |
| Graduate Degree | - | - |
| Total | $44,375 | $26,875 |
Family Income in Sargeant
Family Income Brackets in Sargeant
According to the Sargeant family income data, there are 3 families falling into the $50,000 to $74,999 income range, which is the most common income bracket and makes up 30.0% of all families.
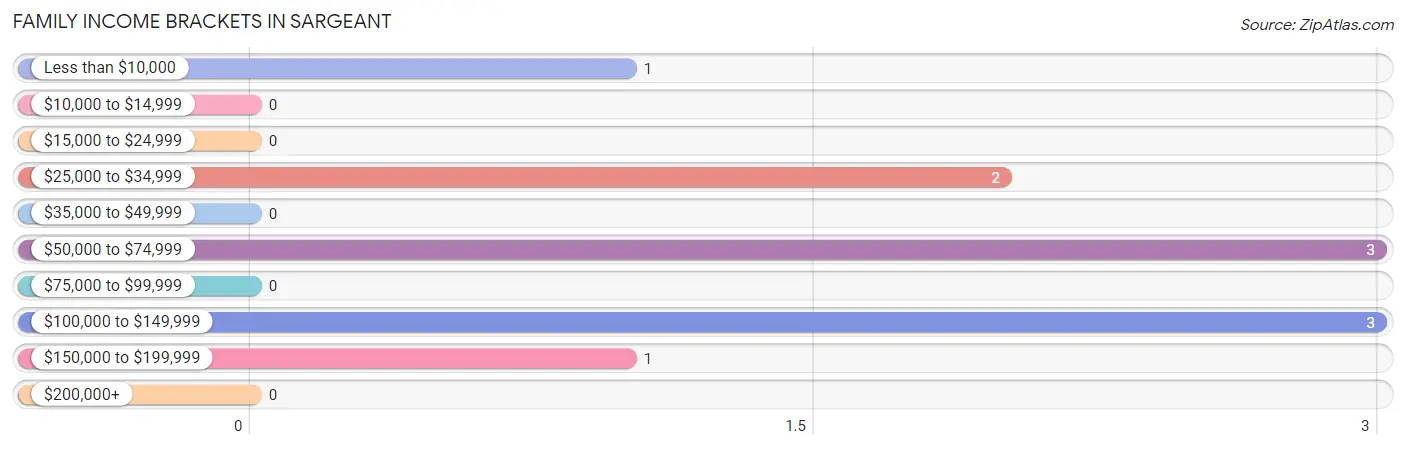
| Income Bracket | # Families | % Families |
| Less than $10,000 | 1 | 10.0% |
| $10,000 to $14,999 | 0 | 0.0% |
| $15,000 to $24,999 | 0 | 0.0% |
| $25,000 to $34,999 | 2 | 20.0% |
| $35,000 to $49,999 | 0 | 0.0% |
| $50,000 to $74,999 | 3 | 30.0% |
| $75,000 to $99,999 | 0 | 0.0% |
| $100,000 to $149,999 | 3 | 30.0% |
| $150,000 to $199,999 | 1 | 10.0% |
| $200,000+ | 0 | 0.0% |
Family Income by Famaliy Size in Sargeant
2-person families (7 | 70.0%) account for the highest median family income in Sargeant with $62,917 per family, while 2-person families (7 | 70.0%) have the highest median income of $31,458 per family member.
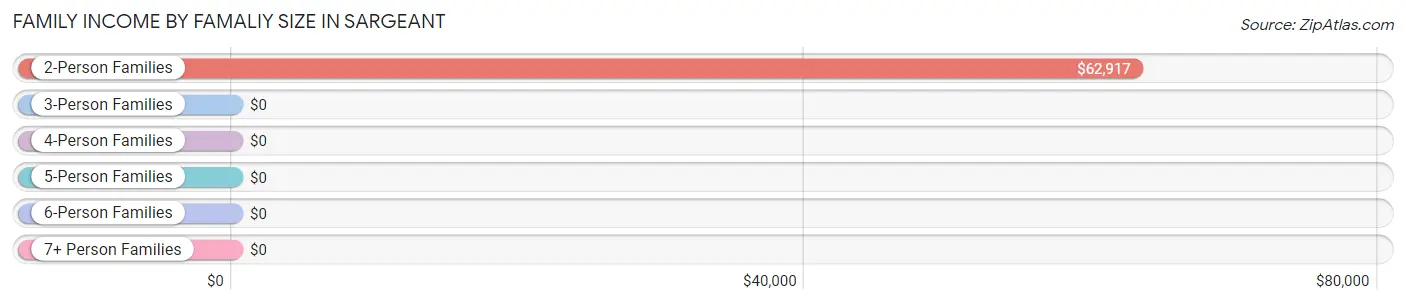
| Income Bracket | # Families | Median Income |
| 2-Person Families | 7 (70.0%) | $62,917 |
| 3-Person Families | 3 (30.0%) | $0 |
| 4-Person Families | 0 (0.0%) | $0 |
| 5-Person Families | 0 (0.0%) | $0 |
| 6-Person Families | 0 (0.0%) | $0 |
| 7+ Person Families | 0 (0.0%) | $0 |
| Total | 10 (100.0%) | $64,167 |
Family Income by Number of Earners in Sargeant
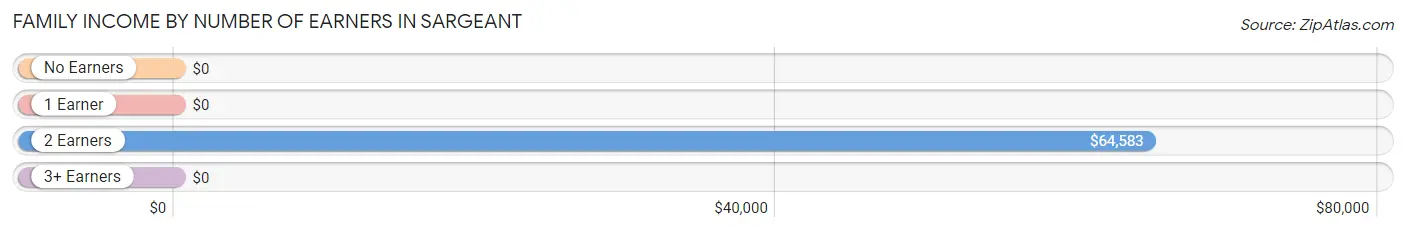
| Number of Earners | # Families | Median Income |
| No Earners | 1 (10.0%) | $0 |
| 1 Earner | 0 (0.0%) | $0 |
| 2 Earners | 9 (90.0%) | $64,583 |
| 3+ Earners | 0 (0.0%) | $0 |
| Total | 10 (100.0%) | $64,167 |
Household Income in Sargeant
Household Income Brackets in Sargeant
With 5 households falling in the category, the $50,000 to $74,999 income range is the most frequent in Sargeant, accounting for 26.3% of all households.
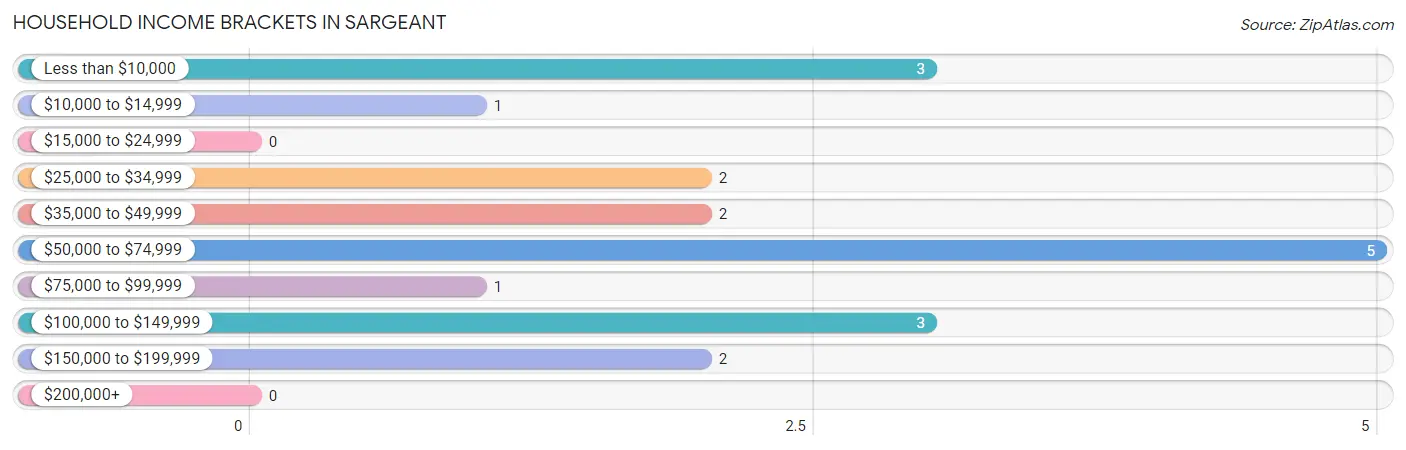
| Income Bracket | # Households | % Households |
| Less than $10,000 | 3 | 15.8% |
| $10,000 to $14,999 | 1 | 5.3% |
| $15,000 to $24,999 | 0 | 0.0% |
| $25,000 to $34,999 | 2 | 10.5% |
| $35,000 to $49,999 | 2 | 10.5% |
| $50,000 to $74,999 | 5 | 26.3% |
| $75,000 to $99,999 | 1 | 5.3% |
| $100,000 to $149,999 | 3 | 15.8% |
| $150,000 to $199,999 | 2 | 10.5% |
| $200,000+ | 0 | 0.0% |
Household Income by Householder Age in Sargeant
The median household income in Sargeant is $63,438, with the highest median household income of $88,750 found in the 45 to 64 years age bracket for the primary householder. A total of 4 households (21.0%) fall into this category.
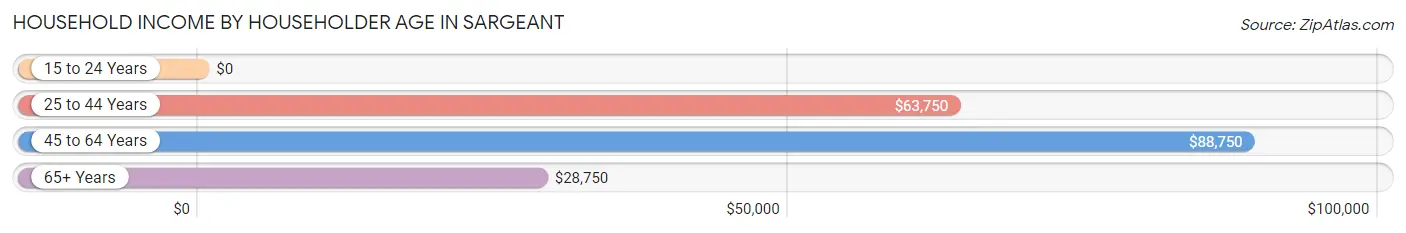
| Income Bracket | # Households | Median Income |
| 15 to 24 Years | 0 (0.0%) | $0 |
| 25 to 44 Years | 12 (63.2%) | $63,750 |
| 45 to 64 Years | 4 (21.0%) | $88,750 |
| 65+ Years | 3 (15.8%) | $28,750 |
| Total | 19 (100.0%) | $63,438 |
Poverty in Sargeant
Income Below Poverty by Sex and Age in Sargeant
With 17.9% poverty level for males and 15.4% for females among the residents of Sargeant, 55 to 64 year old males and 45 to 54 year old females are the most vulnerable to poverty, with 2 males (66.7%) and 1 females (100.0%) in their respective age groups living below the poverty level.
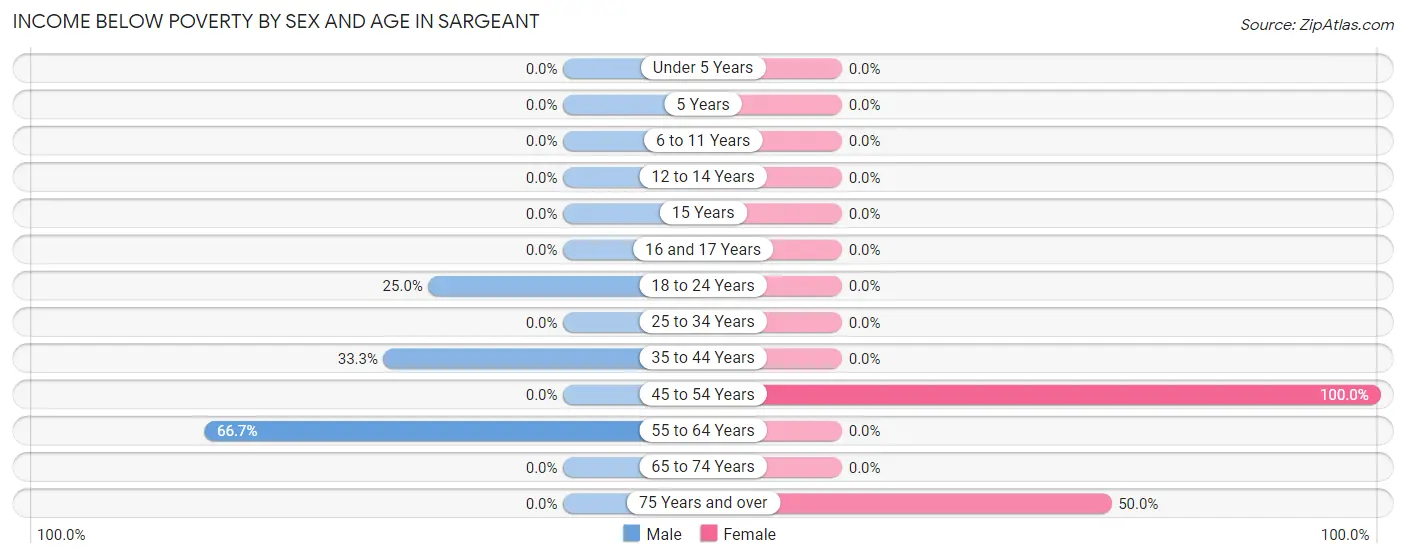
| Age Bracket | Male | Female |
| Under 5 Years | 0 (0.0%) | 0 (0.0%) |
| 5 Years | 0 (0.0%) | 0 (0.0%) |
| 6 to 11 Years | 0 (0.0%) | 0 (0.0%) |
| 12 to 14 Years | 0 (0.0%) | 0 (0.0%) |
| 15 Years | 0 (0.0%) | 0 (0.0%) |
| 16 and 17 Years | 0 (0.0%) | 0 (0.0%) |
| 18 to 24 Years | 1 (25.0%) | 0 (0.0%) |
| 25 to 34 Years | 0 (0.0%) | 0 (0.0%) |
| 35 to 44 Years | 2 (33.3%) | 0 (0.0%) |
| 45 to 54 Years | 0 (0.0%) | 1 (100.0%) |
| 55 to 64 Years | 2 (66.7%) | 0 (0.0%) |
| 65 to 74 Years | 0 (0.0%) | 0 (0.0%) |
| 75 Years and over | 0 (0.0%) | 1 (50.0%) |
| Total | 5 (17.9%) | 2 (15.4%) |
Income Above Poverty by Sex and Age in Sargeant
According to the poverty statistics in Sargeant, males aged under 5 years and females aged 25 to 34 years are the age groups that are most secure financially, with 100.0% of males and 100.0% of females in these age groups living above the poverty line.
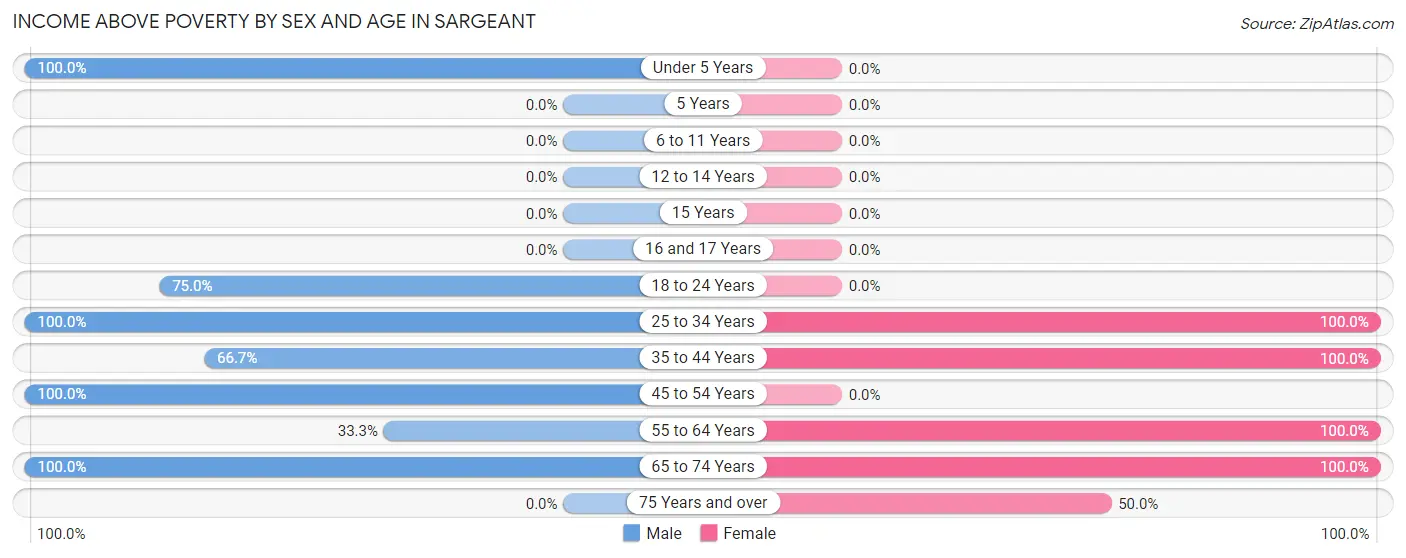
| Age Bracket | Male | Female |
| Under 5 Years | 2 (100.0%) | 0 (0.0%) |
| 5 Years | 0 (0.0%) | 0 (0.0%) |
| 6 to 11 Years | 0 (0.0%) | 0 (0.0%) |
| 12 to 14 Years | 0 (0.0%) | 0 (0.0%) |
| 15 Years | 0 (0.0%) | 0 (0.0%) |
| 16 and 17 Years | 0 (0.0%) | 0 (0.0%) |
| 18 to 24 Years | 3 (75.0%) | 0 (0.0%) |
| 25 to 34 Years | 10 (100.0%) | 5 (100.0%) |
| 35 to 44 Years | 4 (66.7%) | 1 (100.0%) |
| 45 to 54 Years | 2 (100.0%) | 0 (0.0%) |
| 55 to 64 Years | 1 (33.3%) | 2 (100.0%) |
| 65 to 74 Years | 1 (100.0%) | 2 (100.0%) |
| 75 Years and over | 0 (0.0%) | 1 (50.0%) |
| Total | 23 (82.1%) | 11 (84.6%) |
Income Below Poverty Among Married-Couple Families in Sargeant
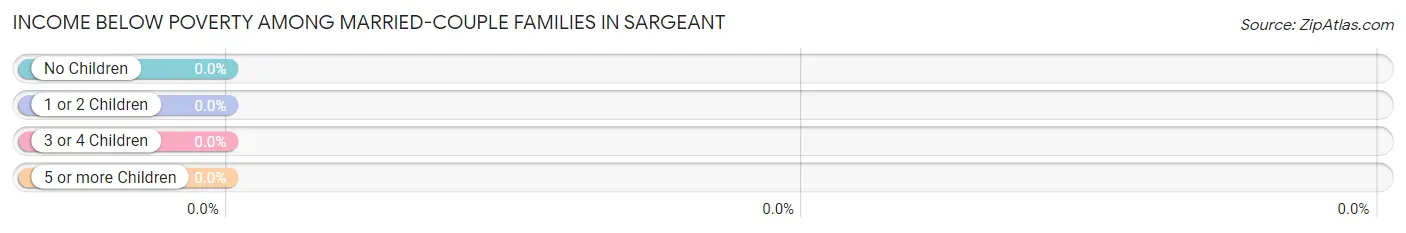
| Children | Above Poverty | Below Poverty |
| No Children | 3 (100.0%) | 0 (0.0%) |
| 1 or 2 Children | 2 (100.0%) | 0 (0.0%) |
| 3 or 4 Children | 0 (0.0%) | 0 (0.0%) |
| 5 or more Children | 0 (0.0%) | 0 (0.0%) |
| Total | 5 (100.0%) | 0 (0.0%) |
Income Below Poverty Among Single-Parent Households in Sargeant
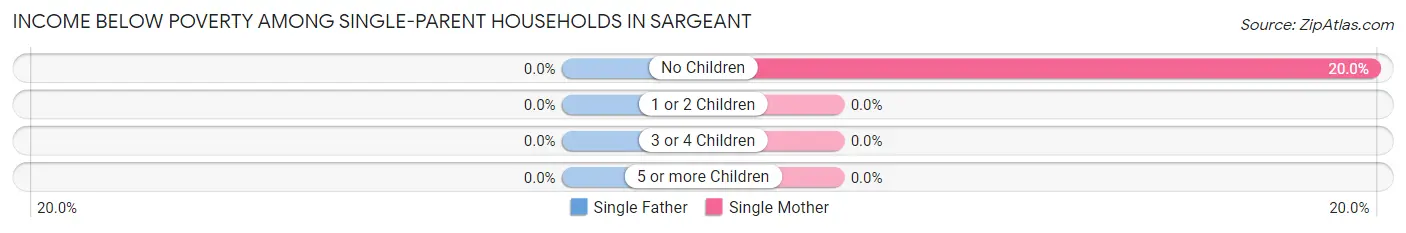
| Children | Single Father | Single Mother |
| No Children | 0 (0.0%) | 1 (20.0%) |
| 1 or 2 Children | 0 (0.0%) | 0 (0.0%) |
| 3 or 4 Children | 0 (0.0%) | 0 (0.0%) |
| 5 or more Children | 0 (0.0%) | 0 (0.0%) |
| Total | 0 (0.0%) | 1 (20.0%) |
Income Below Poverty Among Married-Couple vs Single-Parent Households in Sargeant
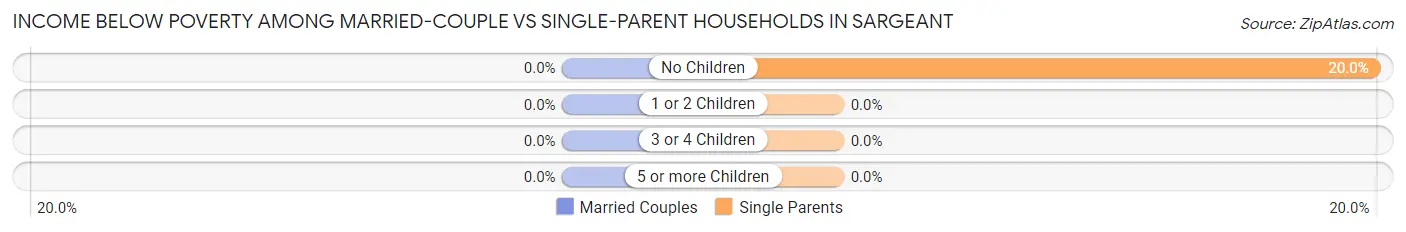
| Children | Married-Couple Families | Single-Parent Households |
| No Children | 0 (0.0%) | 1 (20.0%) |
| 1 or 2 Children | 0 (0.0%) | 0 (0.0%) |
| 3 or 4 Children | 0 (0.0%) | 0 (0.0%) |
| 5 or more Children | 0 (0.0%) | 0 (0.0%) |
| Total | 0 (0.0%) | 1 (20.0%) |
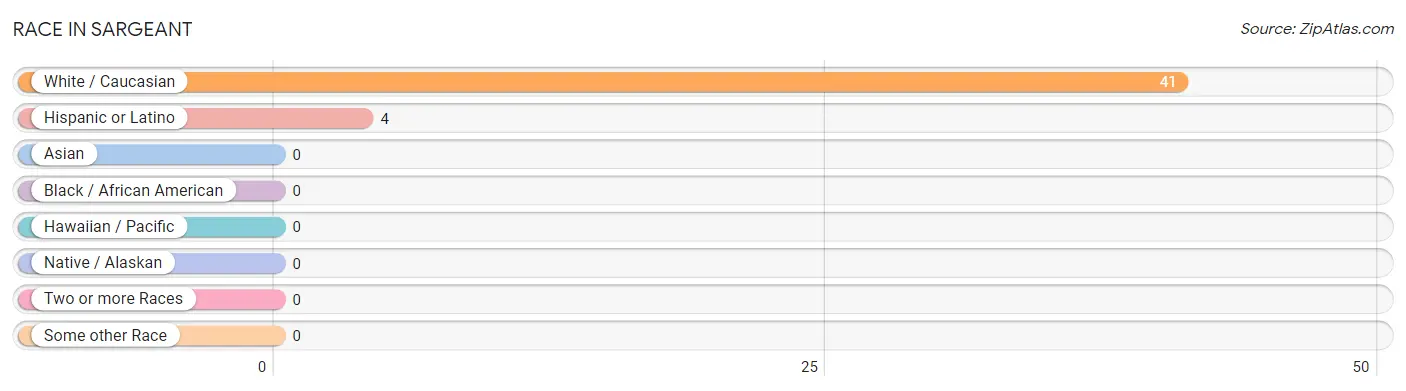
Race in Sargeant
The most populous races in Sargeant are White / Caucasian (41 | 100.0%), and Hispanic or Latino (4 | 9.8%).
| Race | # Population | % Population |
| Asian | 0 | 0.0% |
| Black / African American | 0 | 0.0% |
| Hawaiian / Pacific | 0 | 0.0% |
| Hispanic or Latino | 4 | 9.8% |
| Native / Alaskan | 0 | 0.0% |
| White / Caucasian | 41 | 100.0% |
| Two or more Races | 0 | 0.0% |
| Some other Race | 0 | 0.0% |
| Total | 41 | 100.0% |
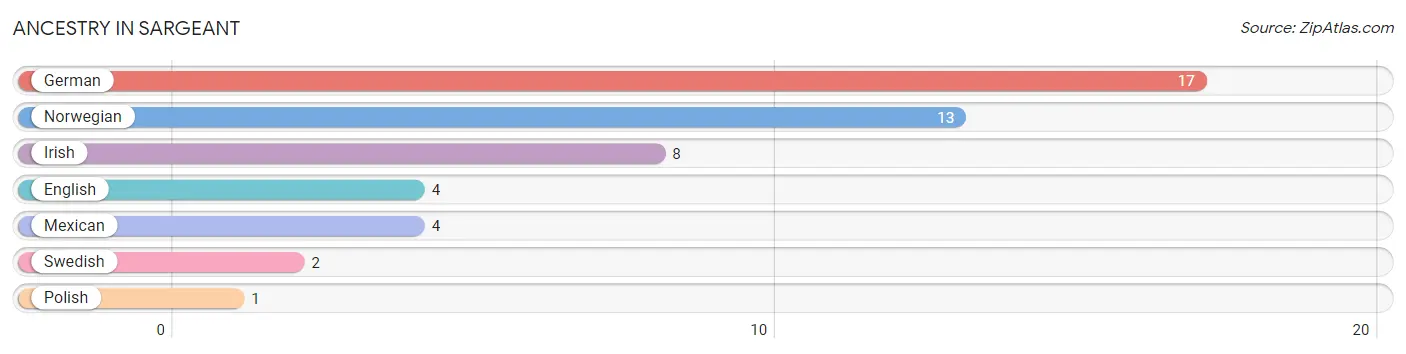
Ancestry in Sargeant
The most populous ancestries reported in Sargeant are German (17 | 41.5%), Norwegian (13 | 31.7%), Irish (8 | 19.5%), English (4 | 9.8%), and Mexican (4 | 9.8%), together accounting for 112.2% of all Sargeant residents.
| Ancestry | # Population | % Population |
| English | 4 | 9.8% |
| German | 17 | 41.5% |
| Irish | 8 | 19.5% |
| Mexican | 4 | 9.8% |
| Norwegian | 13 | 31.7% |
| Polish | 1 | 2.4% |
| Swedish | 2 | 4.9% | View All 7 Rows |
Immigrants in Sargeant

| Immigration Origin | # Population | % Population | View All 0 Rows |
Sex and Age in Sargeant
Sex and Age in Sargeant
The most populous age groups in Sargeant are 30 to 34 Years (6 | 21.4%) for men and 30 to 34 Years (3 | 23.1%) for women.
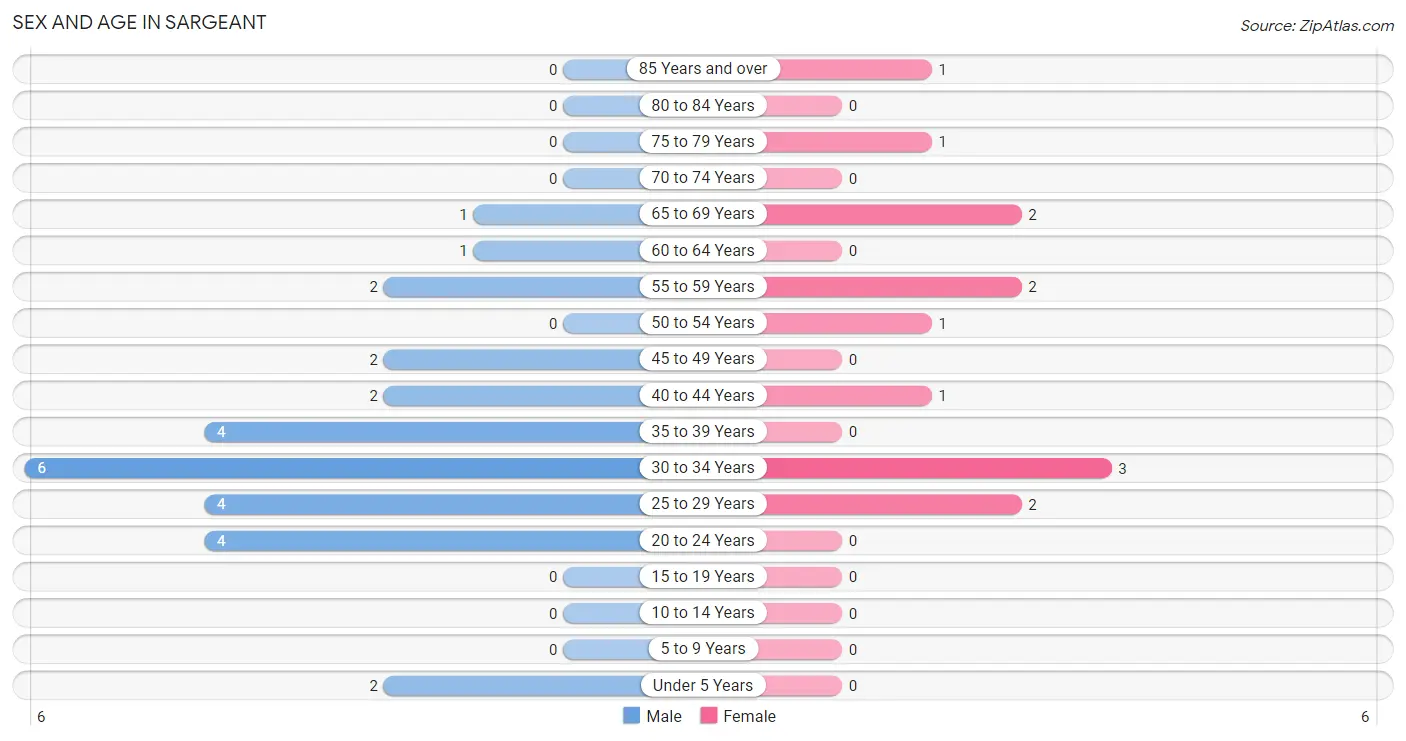
| Age Bracket | Male | Female |
| Under 5 Years | 2 (7.1%) | 0 (0.0%) |
| 5 to 9 Years | 0 (0.0%) | 0 (0.0%) |
| 10 to 14 Years | 0 (0.0%) | 0 (0.0%) |
| 15 to 19 Years | 0 (0.0%) | 0 (0.0%) |
| 20 to 24 Years | 4 (14.3%) | 0 (0.0%) |
| 25 to 29 Years | 4 (14.3%) | 2 (15.4%) |
| 30 to 34 Years | 6 (21.4%) | 3 (23.1%) |
| 35 to 39 Years | 4 (14.3%) | 0 (0.0%) |
| 40 to 44 Years | 2 (7.1%) | 1 (7.7%) |
| 45 to 49 Years | 2 (7.1%) | 0 (0.0%) |
| 50 to 54 Years | 0 (0.0%) | 1 (7.7%) |
| 55 to 59 Years | 2 (7.1%) | 2 (15.4%) |
| 60 to 64 Years | 1 (3.6%) | 0 (0.0%) |
| 65 to 69 Years | 1 (3.6%) | 2 (15.4%) |
| 70 to 74 Years | 0 (0.0%) | 0 (0.0%) |
| 75 to 79 Years | 0 (0.0%) | 1 (7.7%) |
| 80 to 84 Years | 0 (0.0%) | 0 (0.0%) |
| 85 Years and over | 0 (0.0%) | 1 (7.7%) |
| Total | 28 (100.0%) | 13 (100.0%) |
Families and Households in Sargeant
Median Family Size in Sargeant
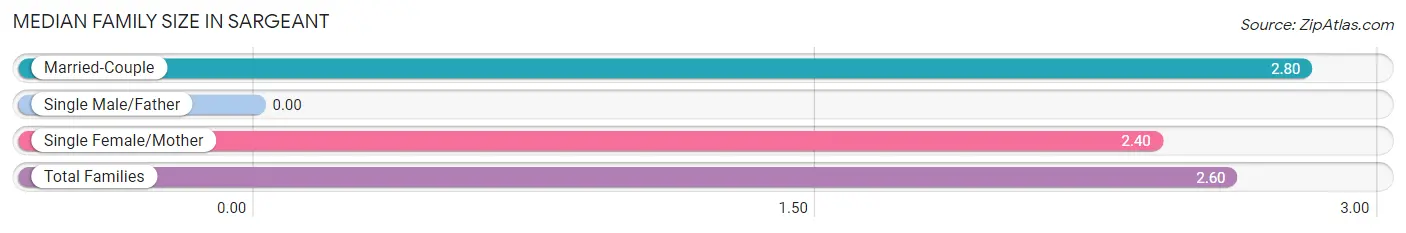
| Family Type | # Families | Family Size |
| Married-Couple | 5 (50.0%) | 2.80 |
| Single Male/Father | 0 (0.0%) | - |
| Single Female/Mother | 5 (50.0%) | 2.40 |
| Total Families | 10 (100.0%) | 2.60 |
Median Household Size in Sargeant
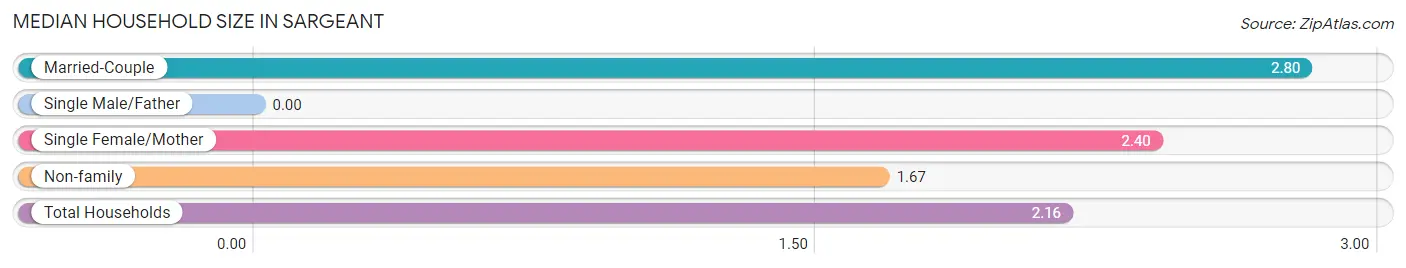
| Household Type | # Households | Household Size |
| Married-Couple | 5 (26.3%) | 2.80 |
| Single Male/Father | 0 (0.0%) | - |
| Single Female/Mother | 5 (26.3%) | 2.40 |
| Non-family | 9 (47.4%) | 1.67 |
| Total Households | 19 (100.0%) | 2.16 |
Household Size by Marriage Status in Sargeant
Out of a total of 19 households in Sargeant, 10 (52.6%) are family households, while 9 (47.4%) are nonfamily households. The most numerous type of family households are 2-person households, comprising 7, and the most common type of nonfamily households are 1-person households, comprising 8.
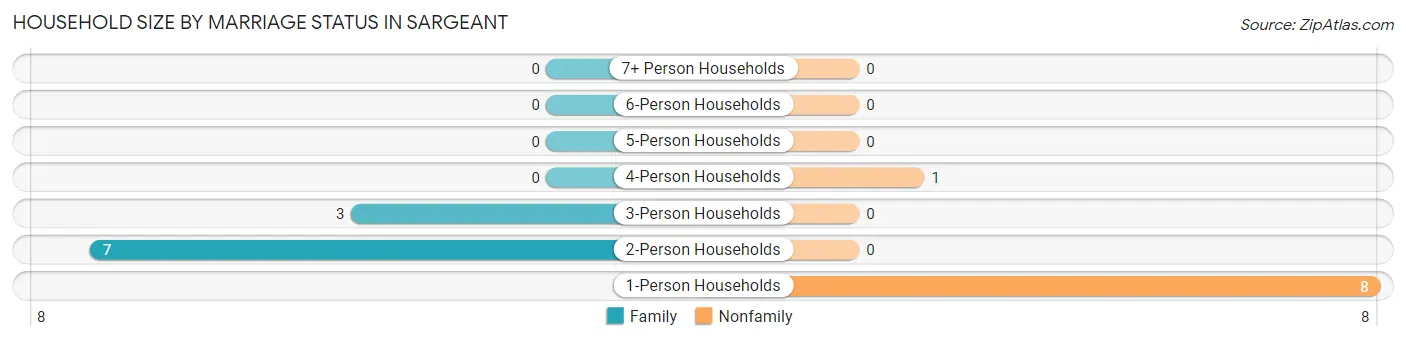
| Household Size | Family Households | Nonfamily Households |
| 1-Person Households | - | 8 (42.1%) |
| 2-Person Households | 7 (36.8%) | 0 (0.0%) |
| 3-Person Households | 3 (15.8%) | 0 (0.0%) |
| 4-Person Households | 0 (0.0%) | 1 (5.3%) |
| 5-Person Households | 0 (0.0%) | 0 (0.0%) |
| 6-Person Households | 0 (0.0%) | 0 (0.0%) |
| 7+ Person Households | 0 (0.0%) | 0 (0.0%) |
| Total | 10 (52.6%) | 9 (47.4%) |
Female Fertility in Sargeant
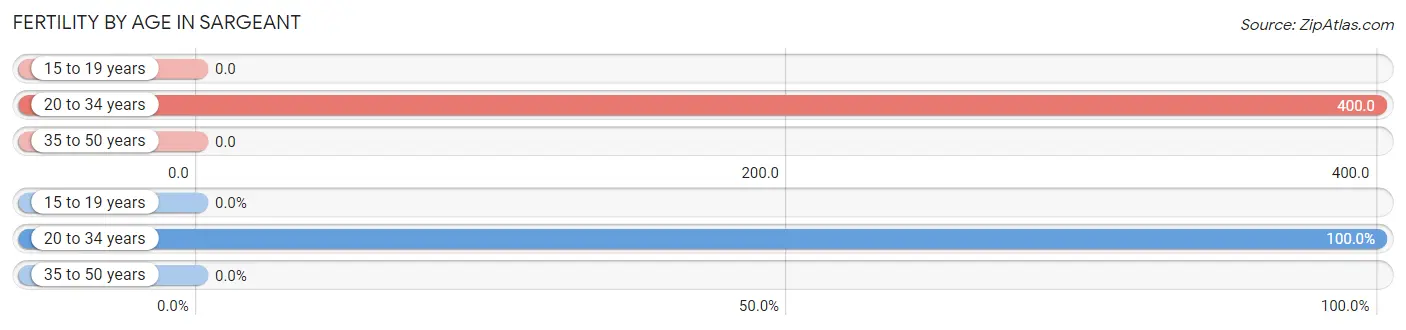
Fertility by Age in Sargeant
Average fertility rate in Sargeant is 333.0 births per 1,000 women. Women in the age bracket of 20 to 34 years have the highest fertility rate with 400.0 births per 1,000 women. Women in the age bracket of 20 to 34 years acount for 100.0% of all women with births.
| Age Bracket | Women with Births | Births / 1,000 Women |
| 15 to 19 years | 0 (0.0%) | 0.0 |
| 20 to 34 years | 2 (100.0%) | 400.0 |
| 35 to 50 years | 0 (0.0%) | 0.0 |
| Total | 2 (100.0%) | 333.0 |
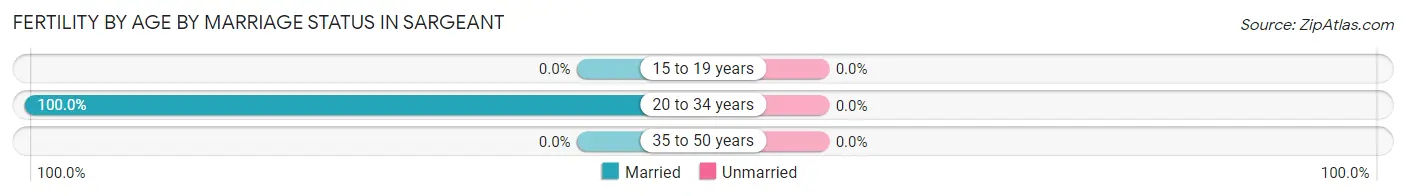
Fertility by Age by Marriage Status in Sargeant
| Age Bracket | Married | Unmarried |
| 15 to 19 years | 0 (0.0%) | 0 (0.0%) |
| 20 to 34 years | 2 (100.0%) | 0 (0.0%) |
| 35 to 50 years | 0 (0.0%) | 0 (0.0%) |
| Total | 2 (100.0%) | 0 (0.0%) |
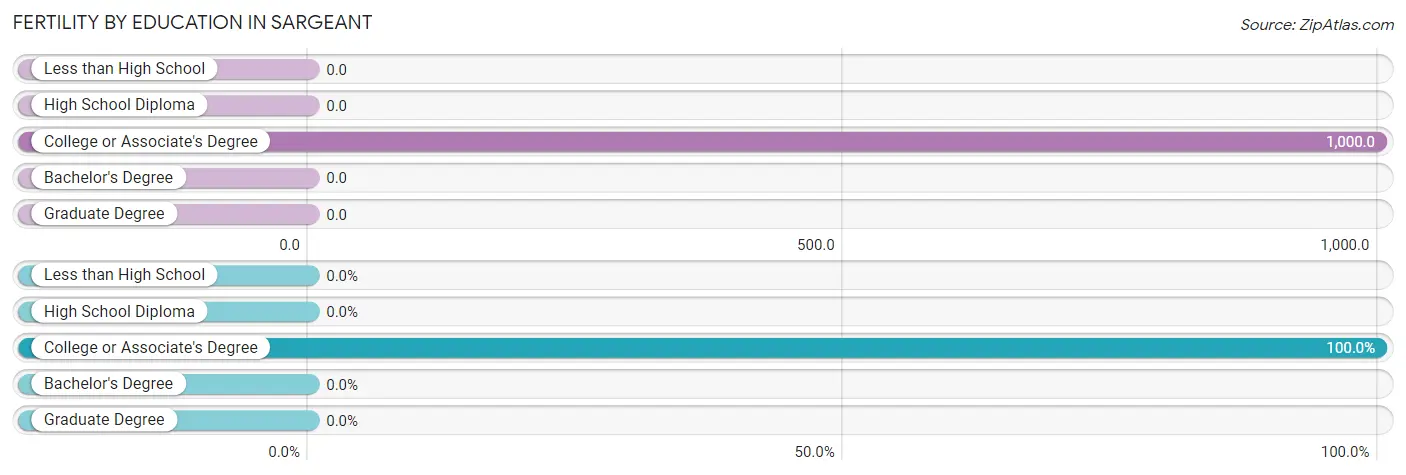
Fertility by Education in Sargeant
| Educational Attainment | Women with Births | Births / 1,000 Women |
| Less than High School | 0 (0.0%) | 0.0 |
| High School Diploma | 0 (0.0%) | 0.0 |
| College or Associate's Degree | 2 (100.0%) | 1,000.0 |
| Bachelor's Degree | 0 (0.0%) | 0.0 |
| Graduate Degree | 0 (0.0%) | 0.0 |
| Total | 2 (100.0%) | 333.0 |
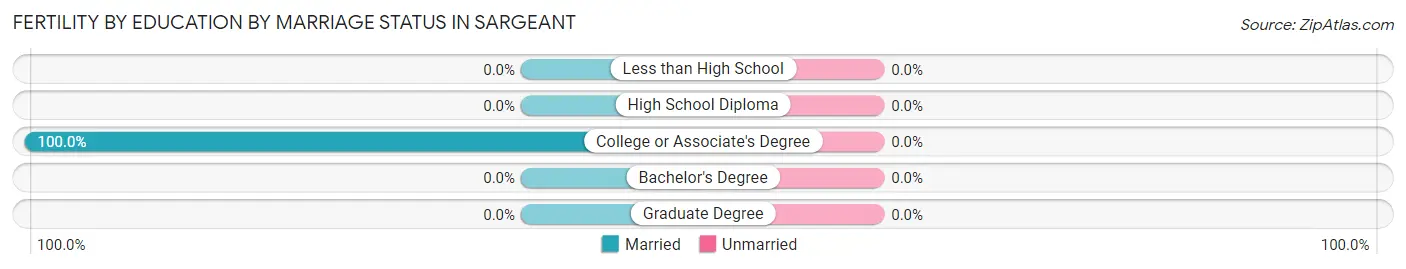
Fertility by Education by Marriage Status in Sargeant
| Educational Attainment | Married | Unmarried |
| Less than High School | 0 (0.0%) | 0 (0.0%) |
| High School Diploma | 0 (0.0%) | 0 (0.0%) |
| College or Associate's Degree | 2 (100.0%) | 0 (0.0%) |
| Bachelor's Degree | 0 (0.0%) | 0 (0.0%) |
| Graduate Degree | 0 (0.0%) | 0 (0.0%) |
| Total | 2 (100.0%) | 0 (0.0%) |
Employment Characteristics in Sargeant
Employment by Class of Employer in Sargeant
Among the 30 employed individuals in Sargeant, private company employees (20 | 66.7%), not-for-profit organizations (7 | 23.3%), and self-employed (not incorporated) (3 | 10.0%) make up the most common classes of employment.
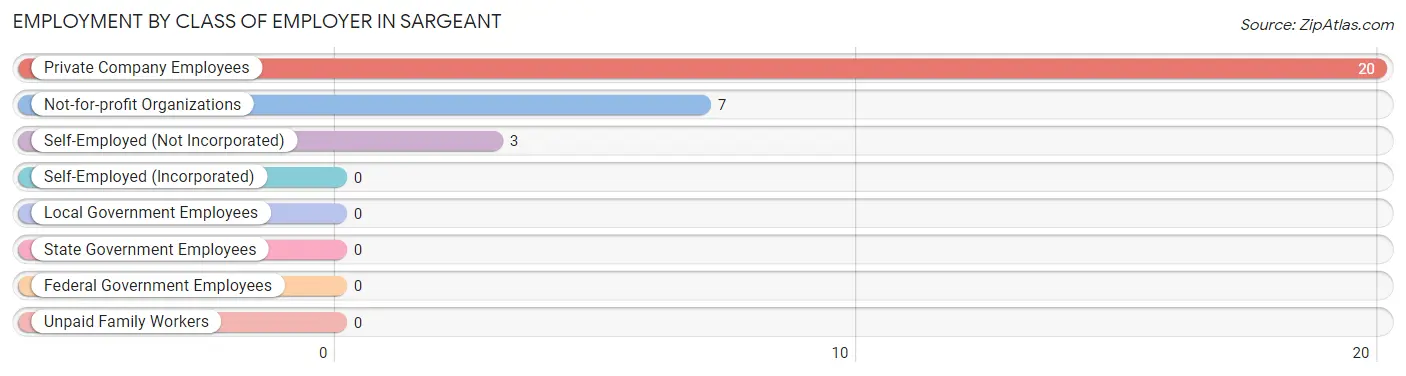
| Employer Class | # Employees | % Employees |
| Private Company Employees | 20 | 66.7% |
| Self-Employed (Incorporated) | 0 | 0.0% |
| Self-Employed (Not Incorporated) | 3 | 10.0% |
| Not-for-profit Organizations | 7 | 23.3% |
| Local Government Employees | 0 | 0.0% |
| State Government Employees | 0 | 0.0% |
| Federal Government Employees | 0 | 0.0% |
| Unpaid Family Workers | 0 | 0.0% |
| Total | 30 | 100.0% |
Employment Status by Age in Sargeant
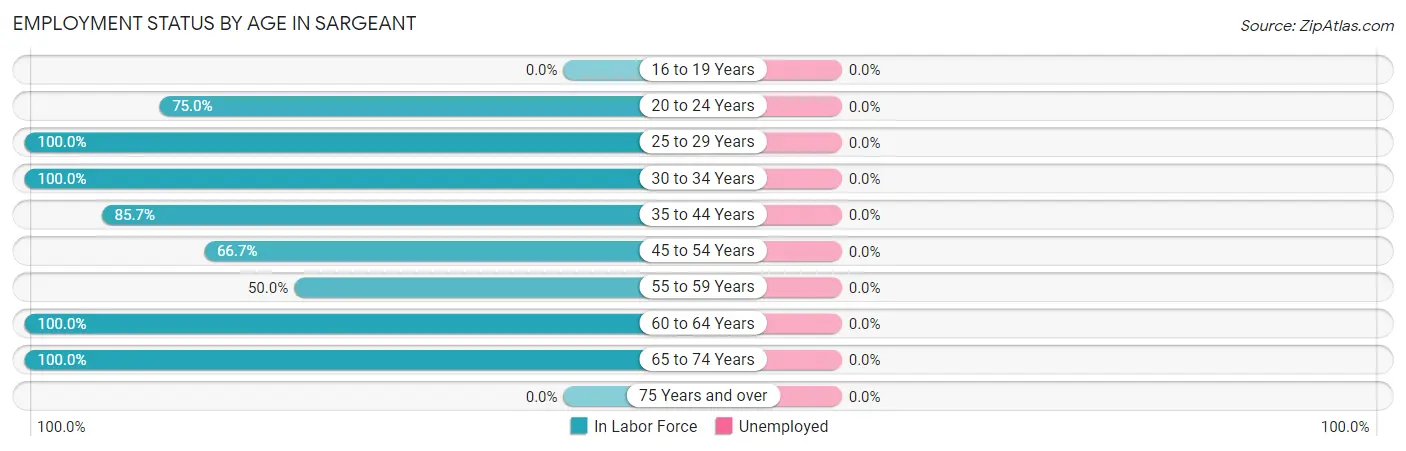
| Age Bracket | In Labor Force | Unemployed |
| 16 to 19 Years | 0 (0.0%) | 0 (0.0%) |
| 20 to 24 Years | 3 (75.0%) | 0 (0.0%) |
| 25 to 29 Years | 6 (100.0%) | 0 (0.0%) |
| 30 to 34 Years | 9 (100.0%) | 0 (0.0%) |
| 35 to 44 Years | 6 (85.7%) | 0 (0.0%) |
| 45 to 54 Years | 2 (66.7%) | 0 (0.0%) |
| 55 to 59 Years | 2 (50.0%) | 0 (0.0%) |
| 60 to 64 Years | 1 (100.0%) | 0 (0.0%) |
| 65 to 74 Years | 3 (100.0%) | 0 (0.0%) |
| 75 Years and over | 0 (0.0%) | 0 (0.0%) |
| Total | 32 (82.1%) | 0 (0.0%) |
Employment Status by Educational Attainment in Sargeant
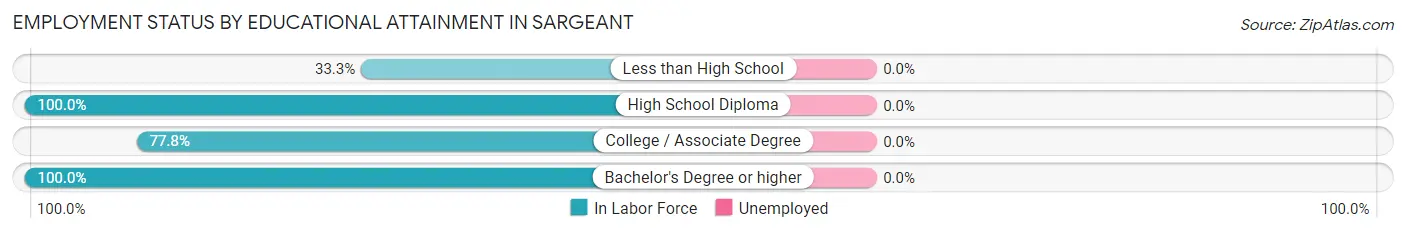
| Educational Attainment | In Labor Force | Unemployed |
| Less than High School | 1 (33.3%) | 0 (0.0%) |
| High School Diploma | 13 (100.0%) | 0 (0.0%) |
| College / Associate Degree | 7 (77.8%) | 0 (0.0%) |
| Bachelor's Degree or higher | 5 (100.0%) | 0 (0.0%) |
| Total | 26 (86.7%) | 0 (0.0%) |
Employment Occupations by Sex in Sargeant
Management, Business, Science and Arts Occupations
The most common Management, Business, Science and Arts occupations in Sargeant are Health Diagnosing & Treating (3 | 9.4%), Community & Social Service (2 | 6.2%), Education, Arts & Media (2 | 6.2%), Computers, Engineering & Science (1 | 3.1%), and Computers & Mathematics (1 | 3.1%).
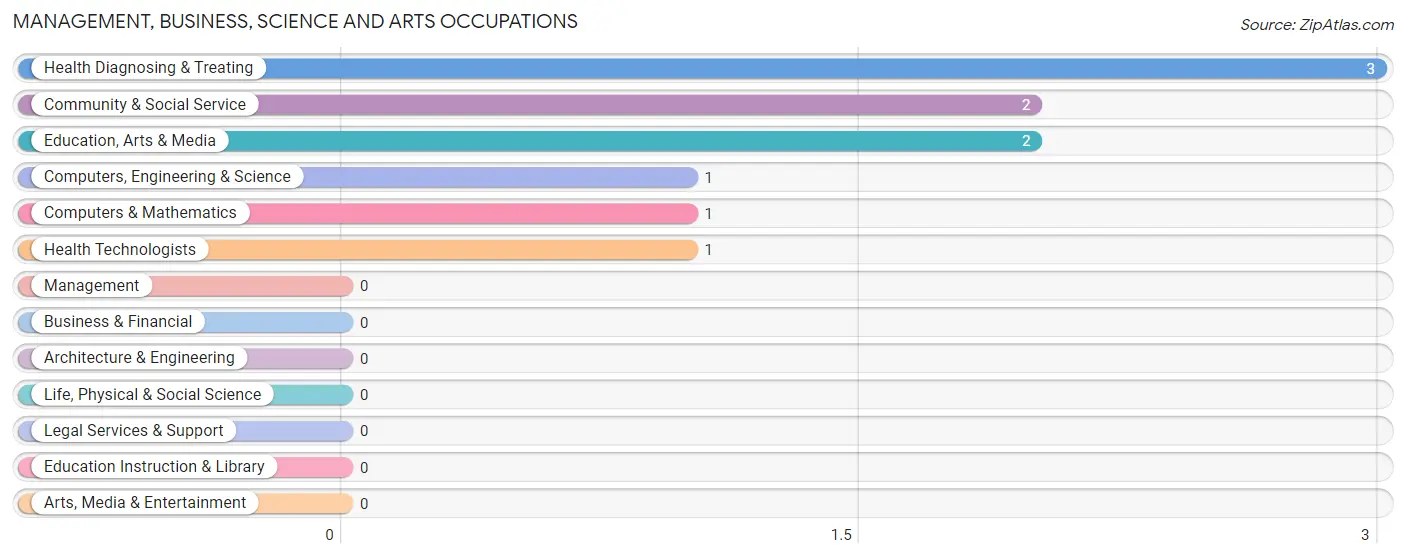
Management, Business, Science and Arts Occupations by Sex
Within the Management, Business, Science and Arts occupations in Sargeant, the most male-oriented occupations are Computers, Engineering & Science (100.0%), Computers & Mathematics (100.0%), and Community & Social Service (100.0%), while the most female-oriented occupations are Health Diagnosing & Treating (100.0%), and Health Technologists (100.0%).
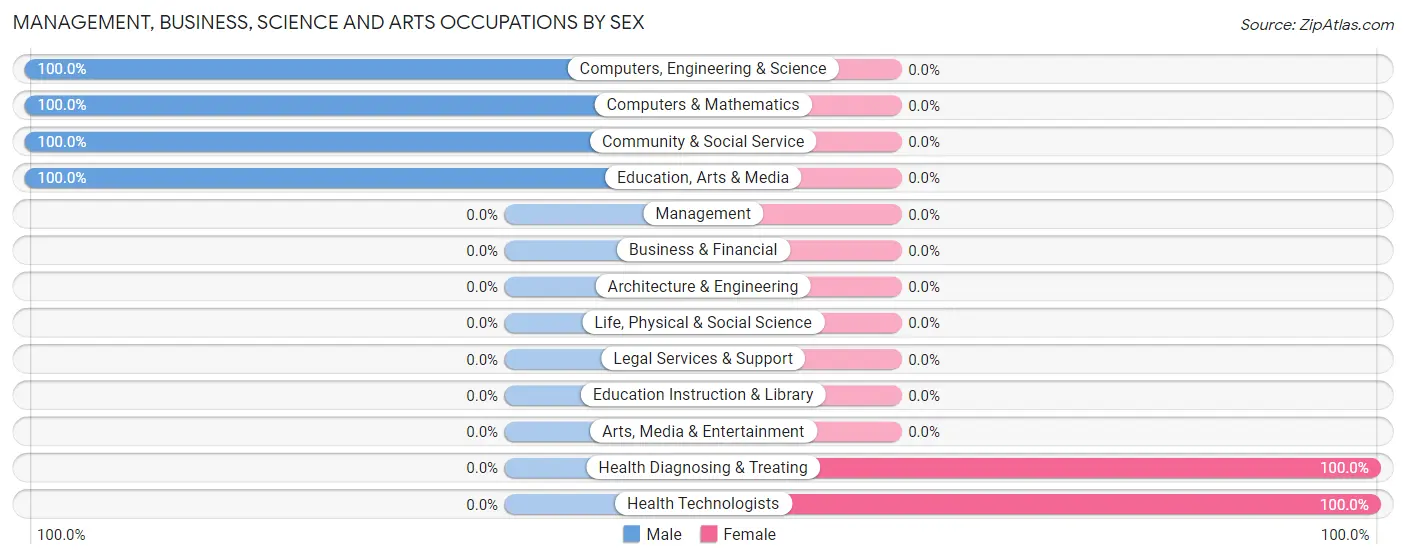
| Occupation | Male | Female |
| Management | 0 (0.0%) | 0 (0.0%) |
| Business & Financial | 0 (0.0%) | 0 (0.0%) |
| Computers, Engineering & Science | 1 (100.0%) | 0 (0.0%) |
| Computers & Mathematics | 1 (100.0%) | 0 (0.0%) |
| Architecture & Engineering | 0 (0.0%) | 0 (0.0%) |
| Life, Physical & Social Science | 0 (0.0%) | 0 (0.0%) |
| Community & Social Service | 2 (100.0%) | 0 (0.0%) |
| Education, Arts & Media | 2 (100.0%) | 0 (0.0%) |
| Legal Services & Support | 0 (0.0%) | 0 (0.0%) |
| Education Instruction & Library | 0 (0.0%) | 0 (0.0%) |
| Arts, Media & Entertainment | 0 (0.0%) | 0 (0.0%) |
| Health Diagnosing & Treating | 0 (0.0%) | 3 (100.0%) |
| Health Technologists | 0 (0.0%) | 1 (100.0%) |
| Total (Category) | 3 (50.0%) | 3 (50.0%) |
| Total (Overall) | 22 (68.8%) | 10 (31.2%) |
Services Occupations
The most common Services occupations in Sargeant are , and Food Preparation & Serving (4 | 12.5%).
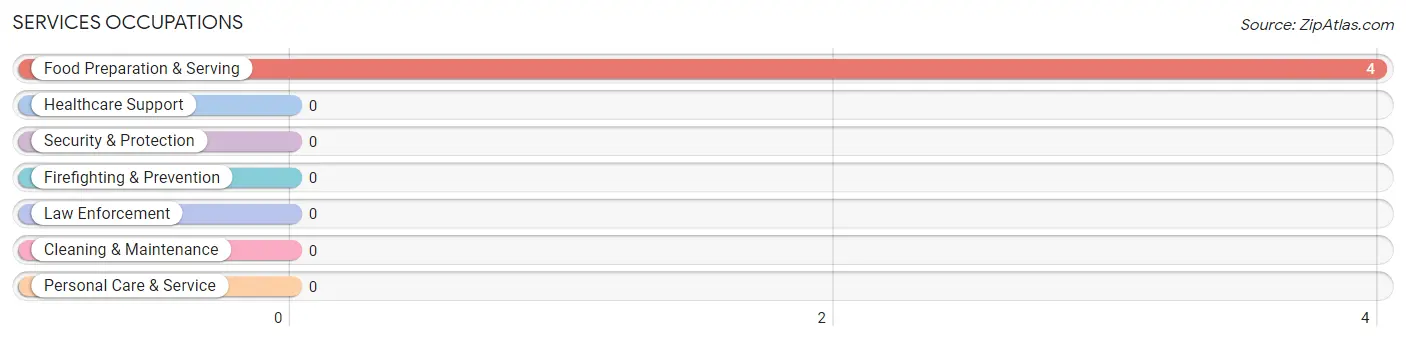
Services Occupations by Sex
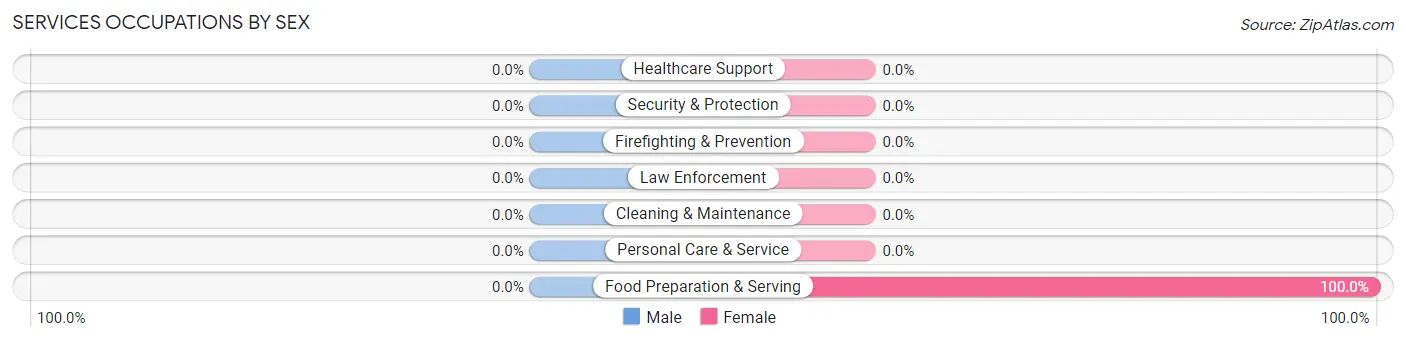
| Occupation | Male | Female |
| Healthcare Support | 0 (0.0%) | 0 (0.0%) |
| Security & Protection | 0 (0.0%) | 0 (0.0%) |
| Firefighting & Prevention | 0 (0.0%) | 0 (0.0%) |
| Law Enforcement | 0 (0.0%) | 0 (0.0%) |
| Food Preparation & Serving | 0 (0.0%) | 4 (100.0%) |
| Cleaning & Maintenance | 0 (0.0%) | 0 (0.0%) |
| Personal Care & Service | 0 (0.0%) | 0 (0.0%) |
| Total (Category) | 0 (0.0%) | 4 (100.0%) |
| Total (Overall) | 22 (68.8%) | 10 (31.2%) |
Sales and Office Occupations
The most common Sales and Office occupations in Sargeant are Office & Administration (4 | 12.5%), and Sales & Related (1 | 3.1%).
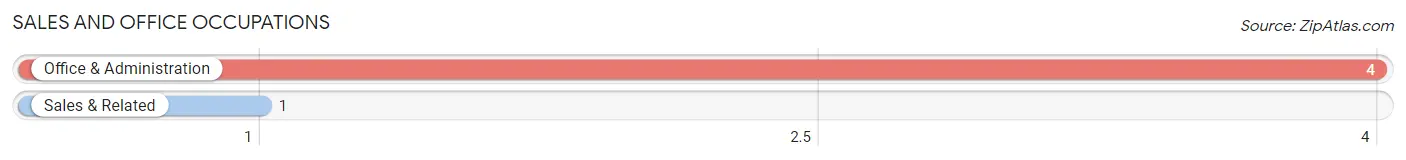
Sales and Office Occupations by Sex

| Occupation | Male | Female |
| Sales & Related | 1 (100.0%) | 0 (0.0%) |
| Office & Administration | 3 (75.0%) | 1 (25.0%) |
| Total (Category) | 4 (80.0%) | 1 (20.0%) |
| Total (Overall) | 22 (68.8%) | 10 (31.2%) |
Natural Resources, Construction and Maintenance Occupations
The most common Natural Resources, Construction and Maintenance occupations in Sargeant are Construction & Extraction (5 | 15.6%), and Installation, Maintenance & Repair (3 | 9.4%).
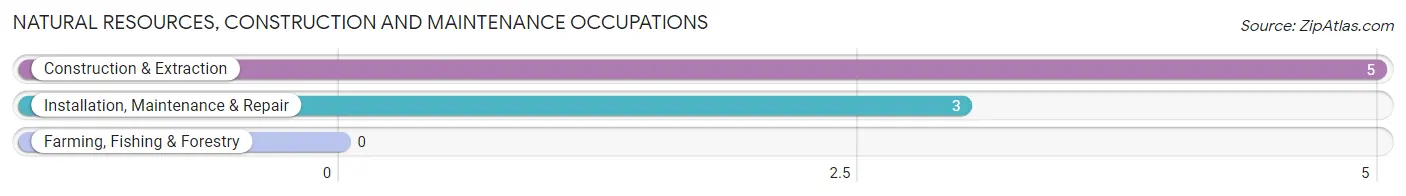
Natural Resources, Construction and Maintenance Occupations by Sex

| Occupation | Male | Female |
| Farming, Fishing & Forestry | 0 (0.0%) | 0 (0.0%) |
| Construction & Extraction | 3 (60.0%) | 2 (40.0%) |
| Installation, Maintenance & Repair | 3 (100.0%) | 0 (0.0%) |
| Total (Category) | 6 (75.0%) | 2 (25.0%) |
| Total (Overall) | 22 (68.8%) | 10 (31.2%) |
Production, Transportation and Moving Occupations
The most common Production, Transportation and Moving occupations in Sargeant are Material Moving (6 | 18.8%), Transportation (2 | 6.2%), and Production (1 | 3.1%).
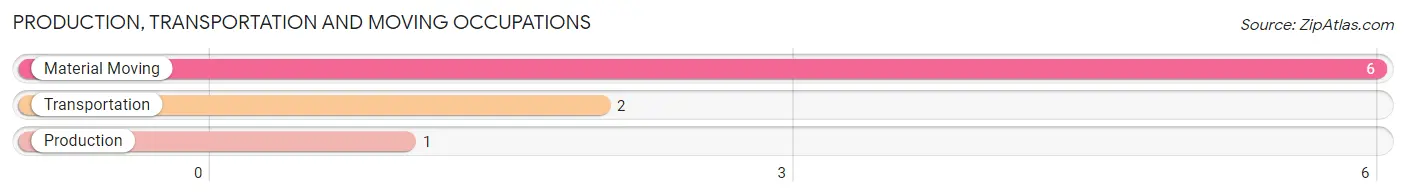
Production, Transportation and Moving Occupations by Sex
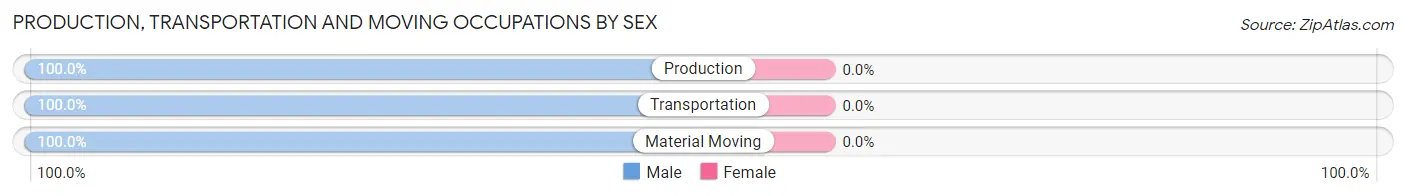
| Occupation | Male | Female |
| Production | 1 (100.0%) | 0 (0.0%) |
| Transportation | 2 (100.0%) | 0 (0.0%) |
| Material Moving | 6 (100.0%) | 0 (0.0%) |
| Total (Category) | 9 (100.0%) | 0 (0.0%) |
| Total (Overall) | 22 (68.8%) | 10 (31.2%) |
Employment Industries by Sex in Sargeant
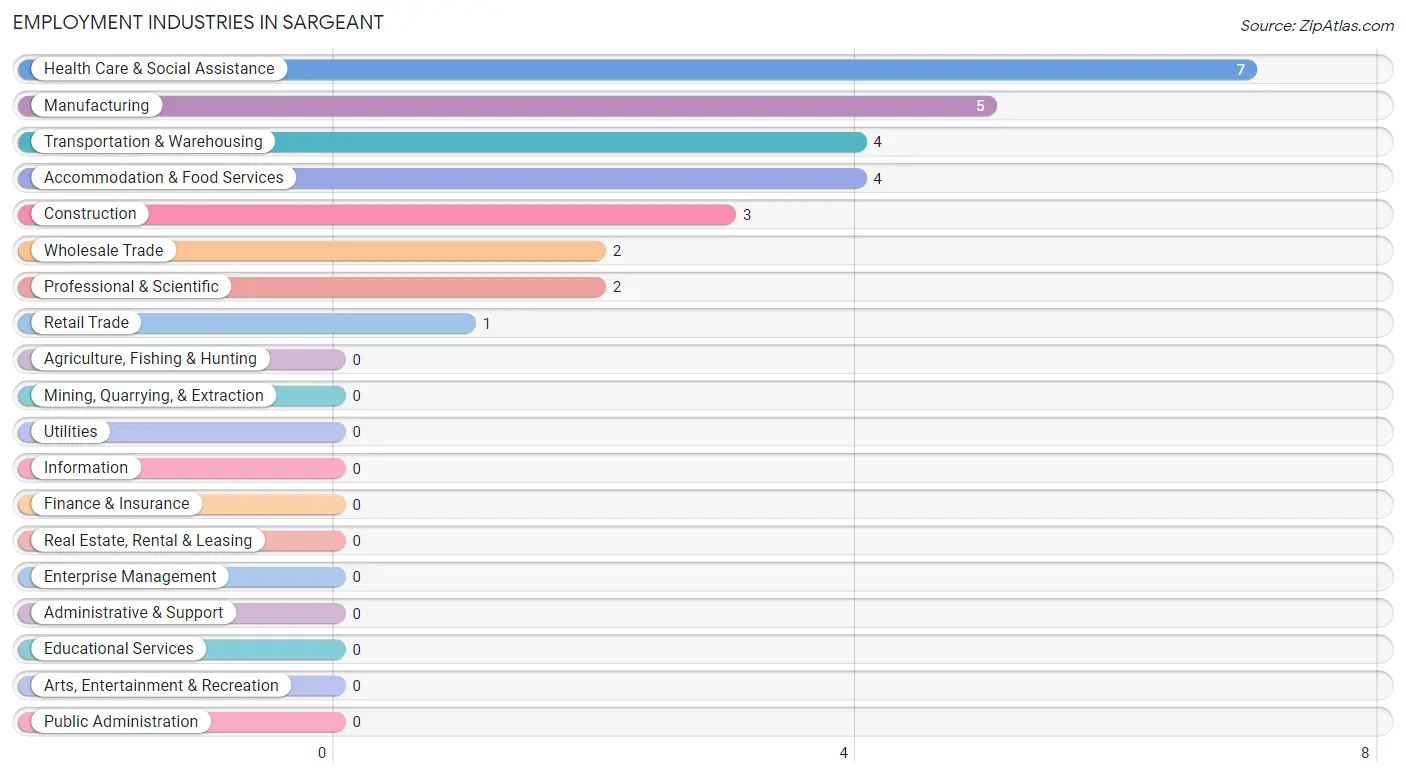
Employment Industries in Sargeant
The major employment industries in Sargeant include Health Care & Social Assistance (7 | 21.9%), Manufacturing (5 | 15.6%), Transportation & Warehousing (4 | 12.5%), Accommodation & Food Services (4 | 12.5%), and Construction (3 | 9.4%).
Employment Industries by Sex in Sargeant
The Sargeant industries that see more men than women are Construction (100.0%), Manufacturing (100.0%), and Retail Trade (100.0%), whereas the industries that tend to have a higher number of women are Professional & Scientific (100.0%), Accommodation & Food Services (100.0%), and Wholesale Trade (50.0%).
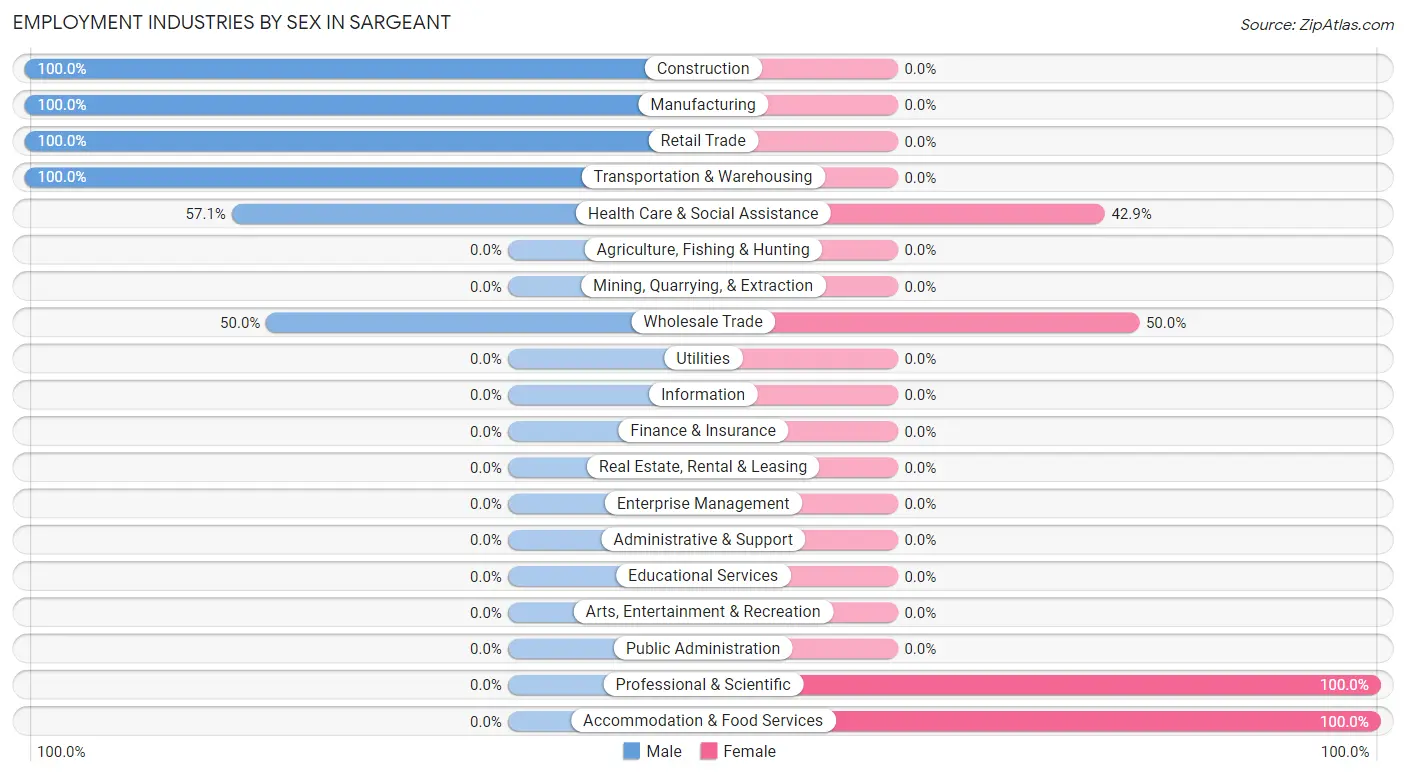
| Industry | Male | Female |
| Agriculture, Fishing & Hunting | 0 (0.0%) | 0 (0.0%) |
| Mining, Quarrying, & Extraction | 0 (0.0%) | 0 (0.0%) |
| Construction | 3 (100.0%) | 0 (0.0%) |
| Manufacturing | 5 (100.0%) | 0 (0.0%) |
| Wholesale Trade | 1 (50.0%) | 1 (50.0%) |
| Retail Trade | 1 (100.0%) | 0 (0.0%) |
| Transportation & Warehousing | 4 (100.0%) | 0 (0.0%) |
| Utilities | 0 (0.0%) | 0 (0.0%) |
| Information | 0 (0.0%) | 0 (0.0%) |
| Finance & Insurance | 0 (0.0%) | 0 (0.0%) |
| Real Estate, Rental & Leasing | 0 (0.0%) | 0 (0.0%) |
| Professional & Scientific | 0 (0.0%) | 2 (100.0%) |
| Enterprise Management | 0 (0.0%) | 0 (0.0%) |
| Administrative & Support | 0 (0.0%) | 0 (0.0%) |
| Educational Services | 0 (0.0%) | 0 (0.0%) |
| Health Care & Social Assistance | 4 (57.1%) | 3 (42.9%) |
| Arts, Entertainment & Recreation | 0 (0.0%) | 0 (0.0%) |
| Accommodation & Food Services | 0 (0.0%) | 4 (100.0%) |
| Public Administration | 0 (0.0%) | 0 (0.0%) |
| Total | 22 (68.8%) | 10 (31.2%) |
Education in Sargeant
School Enrollment in Sargeant
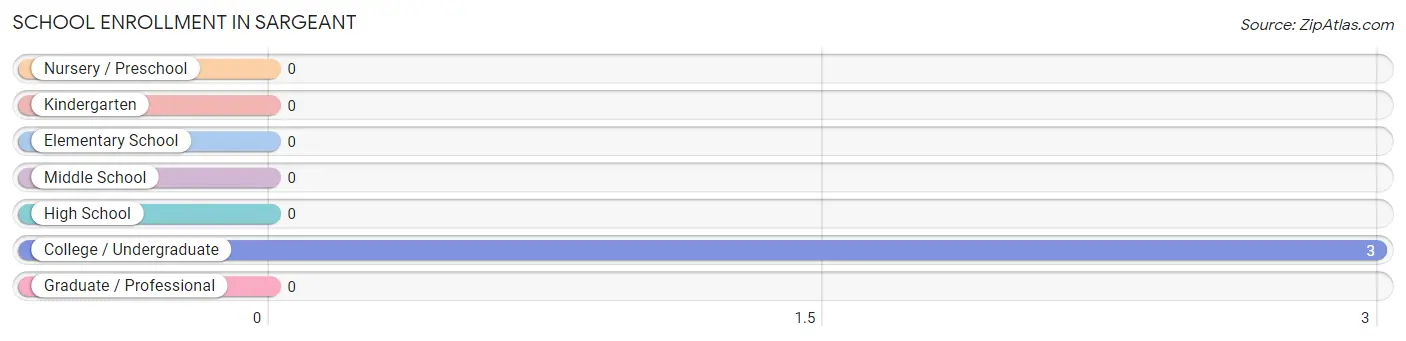
| School Level | # Students | % Students |
| Nursery / Preschool | 0 | 0.0% |
| Kindergarten | 0 | 0.0% |
| Elementary School | 0 | 0.0% |
| Middle School | 0 | 0.0% |
| High School | 0 | 0.0% |
| College / Undergraduate | 3 | 100.0% |
| Graduate / Professional | 0 | 0.0% |
| Total | 3 | 100.0% |
School Enrollment by Age by Funding Source in Sargeant
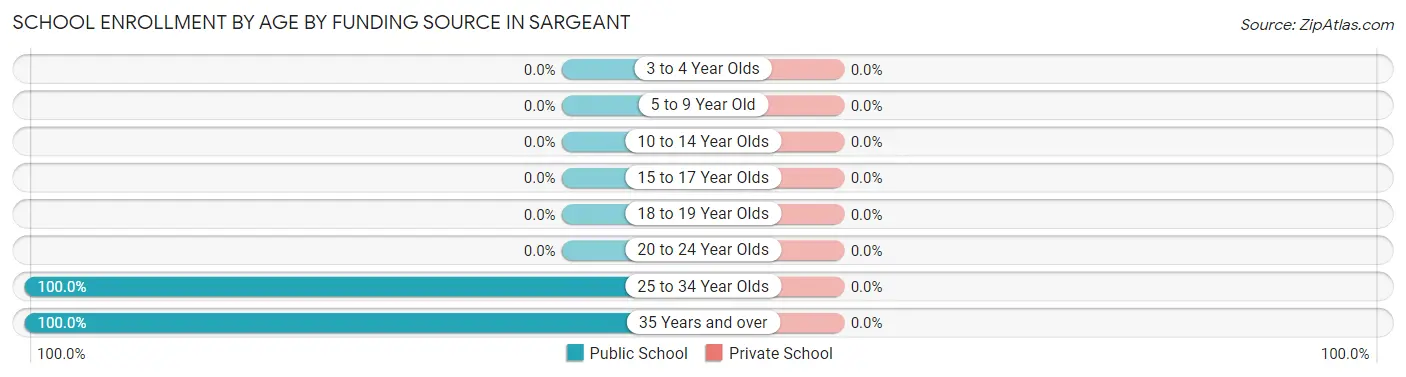
| Age Bracket | Public School | Private School |
| 3 to 4 Year Olds | 0 (0.0%) | 0 (0.0%) |
| 5 to 9 Year Old | 0 (0.0%) | 0 (0.0%) |
| 10 to 14 Year Olds | 0 (0.0%) | 0 (0.0%) |
| 15 to 17 Year Olds | 0 (0.0%) | 0 (0.0%) |
| 18 to 19 Year Olds | 0 (0.0%) | 0 (0.0%) |
| 20 to 24 Year Olds | 0 (0.0%) | 0 (0.0%) |
| 25 to 34 Year Olds | 2 (100.0%) | 0 (0.0%) |
| 35 Years and over | 1 (100.0%) | 0 (0.0%) |
| Total | 3 (100.0%) | 0 (0.0%) |
Educational Attainment by Field of Study in Sargeant
Arts & humanities (3 | 60.0%), business (1 | 20.0%), and communications (1 | 20.0%) are the most common fields of study among 5 individuals in Sargeant who have obtained a bachelor's degree or higher.
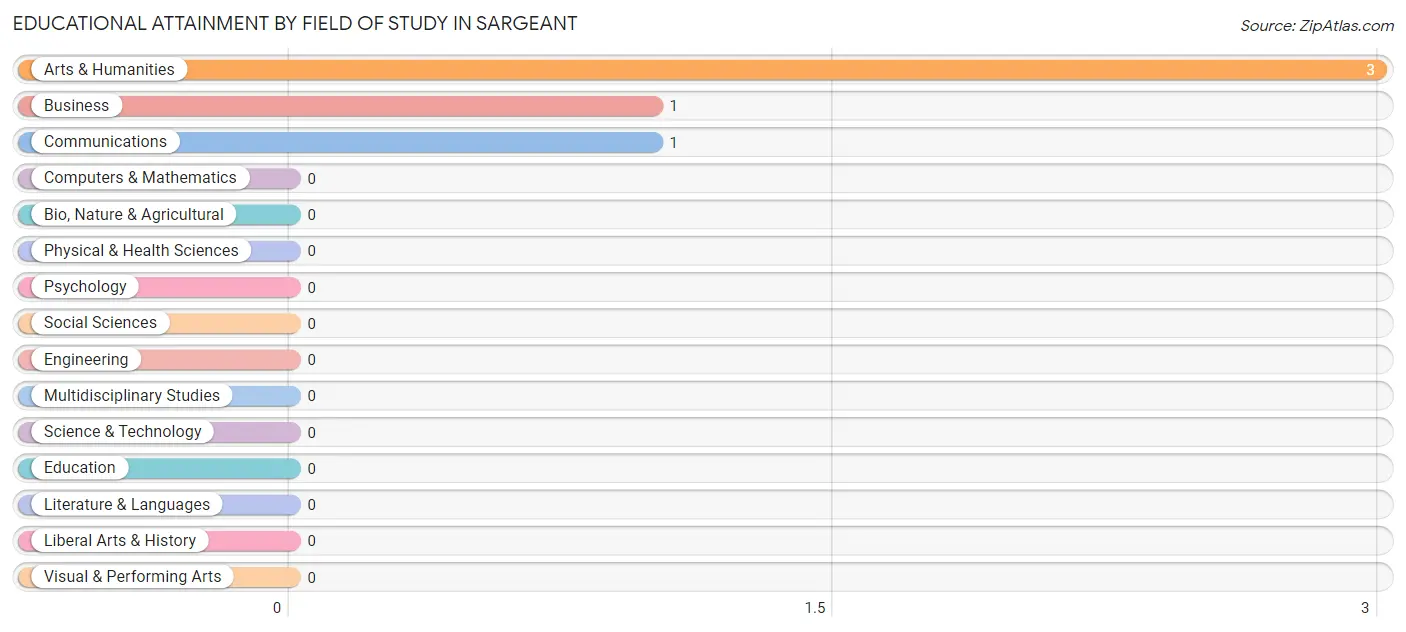
| Field of Study | # Graduates | % Graduates |
| Computers & Mathematics | 0 | 0.0% |
| Bio, Nature & Agricultural | 0 | 0.0% |
| Physical & Health Sciences | 0 | 0.0% |
| Psychology | 0 | 0.0% |
| Social Sciences | 0 | 0.0% |
| Engineering | 0 | 0.0% |
| Multidisciplinary Studies | 0 | 0.0% |
| Science & Technology | 0 | 0.0% |
| Business | 1 | 20.0% |
| Education | 0 | 0.0% |
| Literature & Languages | 0 | 0.0% |
| Liberal Arts & History | 0 | 0.0% |
| Visual & Performing Arts | 0 | 0.0% |
| Communications | 1 | 20.0% |
| Arts & Humanities | 3 | 60.0% |
| Total | 5 | 100.0% |
Transportation & Commute in Sargeant
Vehicle Availability by Sex in Sargeant
The most prevalent vehicle ownership categories in Sargeant are males with 3 vehicles (8, accounting for 36.4%) and females with 3 vehicles (4, making up 100.0%).
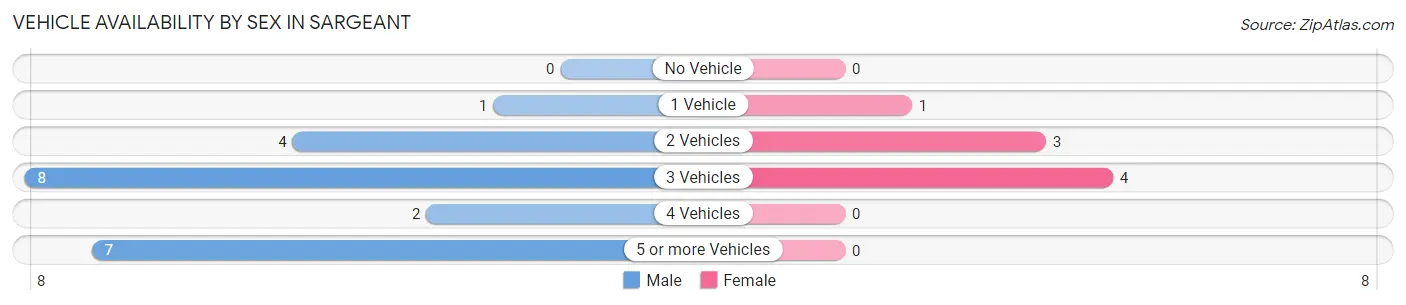
| Vehicles Available | Male | Female |
| No Vehicle | 0 (0.0%) | 0 (0.0%) |
| 1 Vehicle | 1 (4.5%) | 1 (12.5%) |
| 2 Vehicles | 4 (18.2%) | 3 (37.5%) |
| 3 Vehicles | 8 (36.4%) | 4 (50.0%) |
| 4 Vehicles | 2 (9.1%) | 0 (0.0%) |
| 5 or more Vehicles | 7 (31.8%) | 0 (0.0%) |
| Total | 22 (100.0%) | 8 (100.0%) |
Commute Time in Sargeant
The most frequently occuring commute durations in Sargeant are 25 to 29 minutes (6 commuters, 22.2%), 40 to 44 minutes (6 commuters, 22.2%), and 45 to 59 minutes (5 commuters, 18.5%).
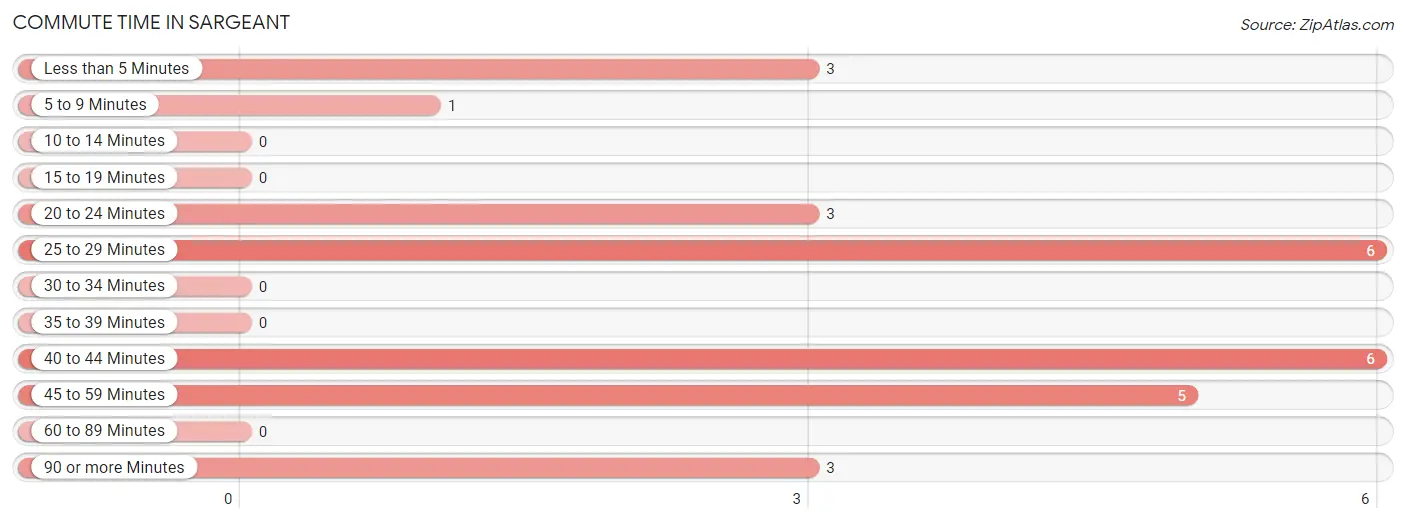
| Commute Time | # Commuters | % Commuters |
| Less than 5 Minutes | 3 | 11.1% |
| 5 to 9 Minutes | 1 | 3.7% |
| 10 to 14 Minutes | 0 | 0.0% |
| 15 to 19 Minutes | 0 | 0.0% |
| 20 to 24 Minutes | 3 | 11.1% |
| 25 to 29 Minutes | 6 | 22.2% |
| 30 to 34 Minutes | 0 | 0.0% |
| 35 to 39 Minutes | 0 | 0.0% |
| 40 to 44 Minutes | 6 | 22.2% |
| 45 to 59 Minutes | 5 | 18.5% |
| 60 to 89 Minutes | 0 | 0.0% |
| 90 or more Minutes | 3 | 11.1% |
Commute Time by Sex in Sargeant
The most common commute times in Sargeant are 45 to 59 minutes (5 commuters, 26.3%) for males and 25 to 29 minutes (3 commuters, 37.5%) for females.
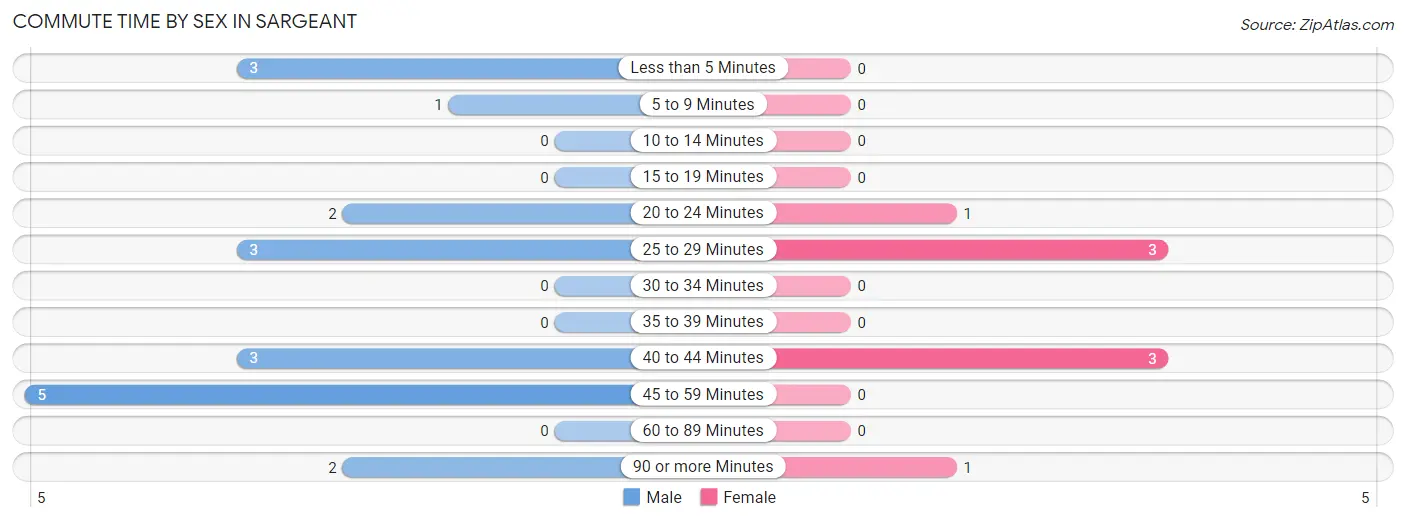
| Commute Time | Male | Female |
| Less than 5 Minutes | 3 (15.8%) | 0 (0.0%) |
| 5 to 9 Minutes | 1 (5.3%) | 0 (0.0%) |
| 10 to 14 Minutes | 0 (0.0%) | 0 (0.0%) |
| 15 to 19 Minutes | 0 (0.0%) | 0 (0.0%) |
| 20 to 24 Minutes | 2 (10.5%) | 1 (12.5%) |
| 25 to 29 Minutes | 3 (15.8%) | 3 (37.5%) |
| 30 to 34 Minutes | 0 (0.0%) | 0 (0.0%) |
| 35 to 39 Minutes | 0 (0.0%) | 0 (0.0%) |
| 40 to 44 Minutes | 3 (15.8%) | 3 (37.5%) |
| 45 to 59 Minutes | 5 (26.3%) | 0 (0.0%) |
| 60 to 89 Minutes | 0 (0.0%) | 0 (0.0%) |
| 90 or more Minutes | 2 (10.5%) | 1 (12.5%) |
Time of Departure to Work by Sex in Sargeant
The most frequent times of departure to work in Sargeant are 4:00 PM to 11:59 PM (5, 26.3%) for males and 4:00 PM to 11:59 PM (3, 37.5%) for females.
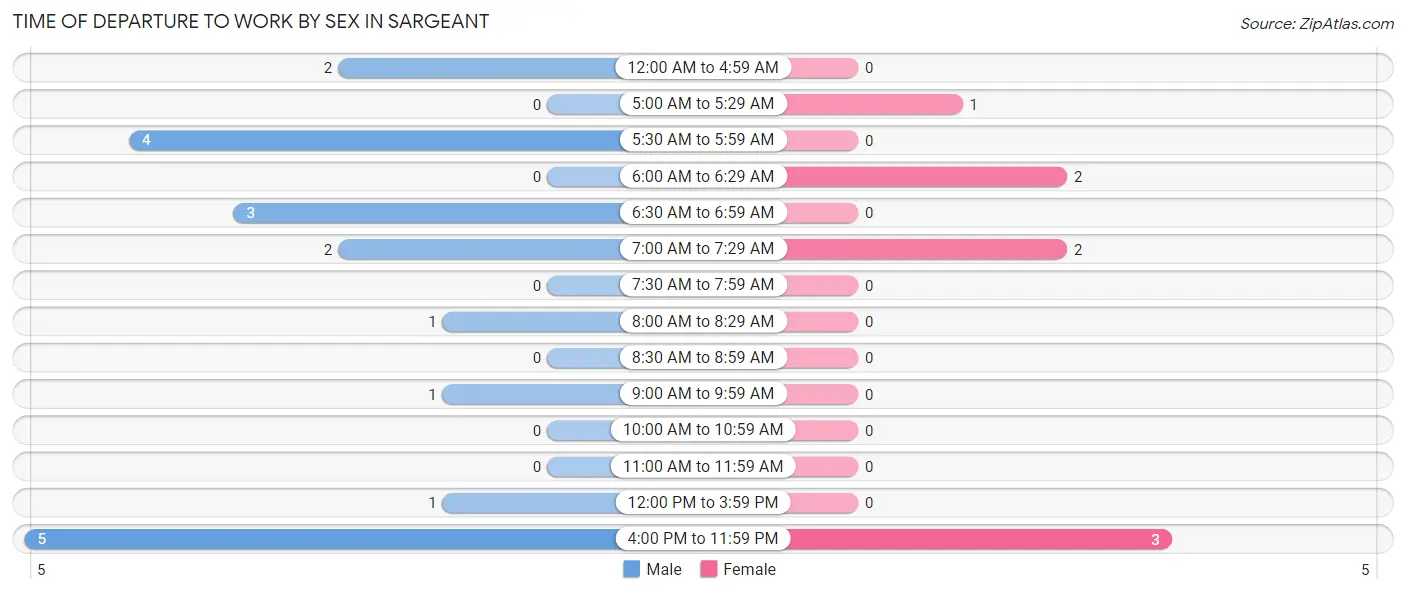
| Time of Departure | Male | Female |
| 12:00 AM to 4:59 AM | 2 (10.5%) | 0 (0.0%) |
| 5:00 AM to 5:29 AM | 0 (0.0%) | 1 (12.5%) |
| 5:30 AM to 5:59 AM | 4 (21.0%) | 0 (0.0%) |
| 6:00 AM to 6:29 AM | 0 (0.0%) | 2 (25.0%) |
| 6:30 AM to 6:59 AM | 3 (15.8%) | 0 (0.0%) |
| 7:00 AM to 7:29 AM | 2 (10.5%) | 2 (25.0%) |
| 7:30 AM to 7:59 AM | 0 (0.0%) | 0 (0.0%) |
| 8:00 AM to 8:29 AM | 1 (5.3%) | 0 (0.0%) |
| 8:30 AM to 8:59 AM | 0 (0.0%) | 0 (0.0%) |
| 9:00 AM to 9:59 AM | 1 (5.3%) | 0 (0.0%) |
| 10:00 AM to 10:59 AM | 0 (0.0%) | 0 (0.0%) |
| 11:00 AM to 11:59 AM | 0 (0.0%) | 0 (0.0%) |
| 12:00 PM to 3:59 PM | 1 (5.3%) | 0 (0.0%) |
| 4:00 PM to 11:59 PM | 5 (26.3%) | 3 (37.5%) |
| Total | 19 (100.0%) | 8 (100.0%) |
Housing Occupancy in Sargeant
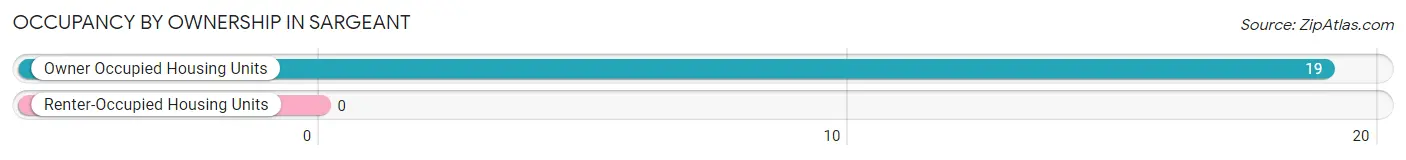
Occupancy by Ownership in Sargeant
Of the total 19 dwellings in Sargeant, owner-occupied units account for 19 (100.0%), while renter-occupied units make up 0 (0.0%).
| Occupancy | # Housing Units | % Housing Units |
| Owner Occupied Housing Units | 19 | 100.0% |
| Renter-Occupied Housing Units | 0 | 0.0% |
| Total Occupied Housing Units | 19 | 100.0% |
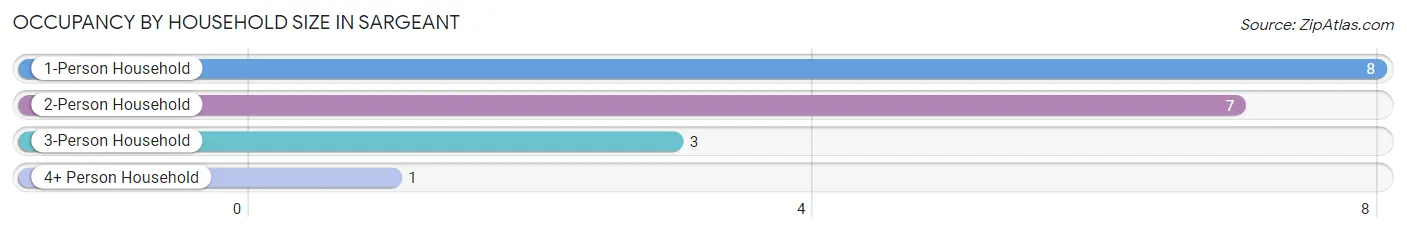
Occupancy by Household Size in Sargeant
| Household Size | # Housing Units | % Housing Units |
| 1-Person Household | 8 | 42.1% |
| 2-Person Household | 7 | 36.8% |
| 3-Person Household | 3 | 15.8% |
| 4+ Person Household | 1 | 5.3% |
| Total Housing Units | 19 | 100.0% |
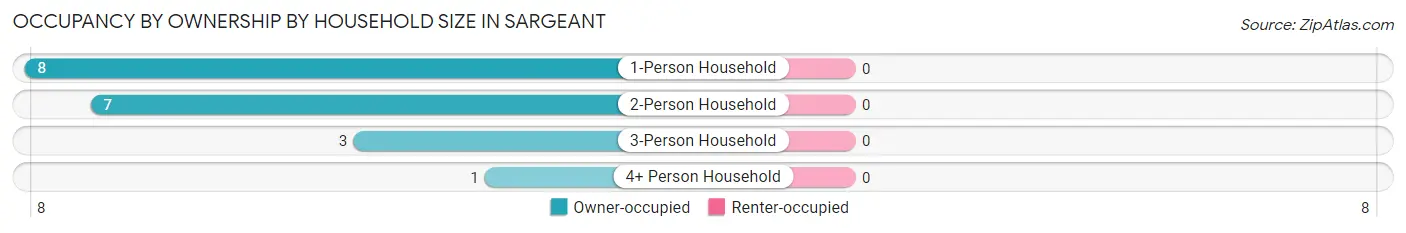
Occupancy by Ownership by Household Size in Sargeant
| Household Size | Owner-occupied | Renter-occupied |
| 1-Person Household | 8 (100.0%) | 0 (0.0%) |
| 2-Person Household | 7 (100.0%) | 0 (0.0%) |
| 3-Person Household | 3 (100.0%) | 0 (0.0%) |
| 4+ Person Household | 1 (100.0%) | 0 (0.0%) |
| Total Housing Units | 19 (100.0%) | 0 (0.0%) |
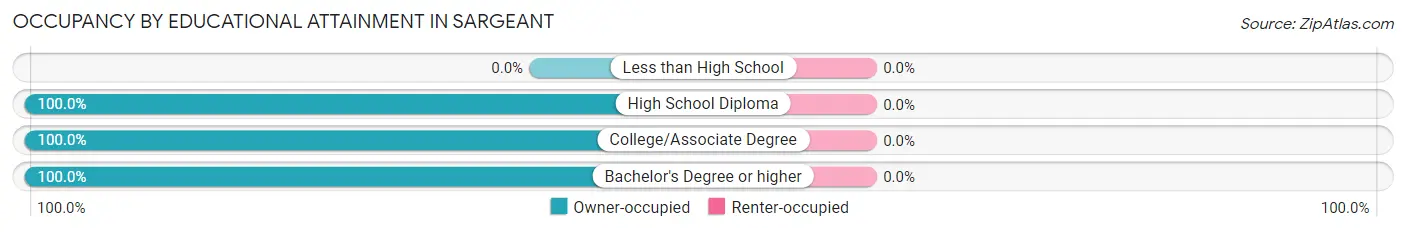
Occupancy by Educational Attainment in Sargeant
| Household Size | Owner-occupied | Renter-occupied |
| Less than High School | 0 (0.0%) | 0 (0.0%) |
| High School Diploma | 9 (100.0%) | 0 (0.0%) |
| College/Associate Degree | 6 (100.0%) | 0 (0.0%) |
| Bachelor's Degree or higher | 4 (100.0%) | 0 (0.0%) |
Occupancy by Age of Householder in Sargeant
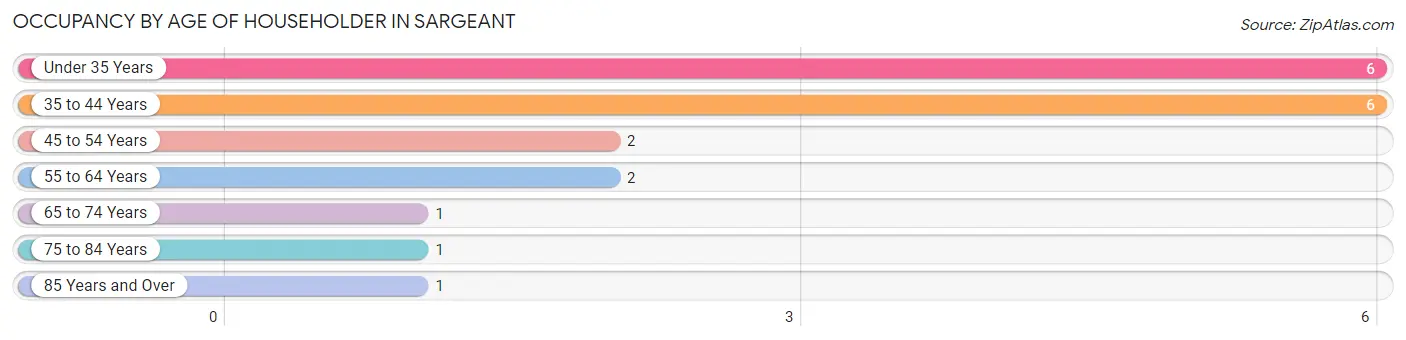
| Age Bracket | # Households | % Households |
| Under 35 Years | 6 | 31.6% |
| 35 to 44 Years | 6 | 31.6% |
| 45 to 54 Years | 2 | 10.5% |
| 55 to 64 Years | 2 | 10.5% |
| 65 to 74 Years | 1 | 5.3% |
| 75 to 84 Years | 1 | 5.3% |
| 85 Years and Over | 1 | 5.3% |
| Total | 19 | 100.0% |
Housing Finances in Sargeant
Median Income by Occupancy in Sargeant
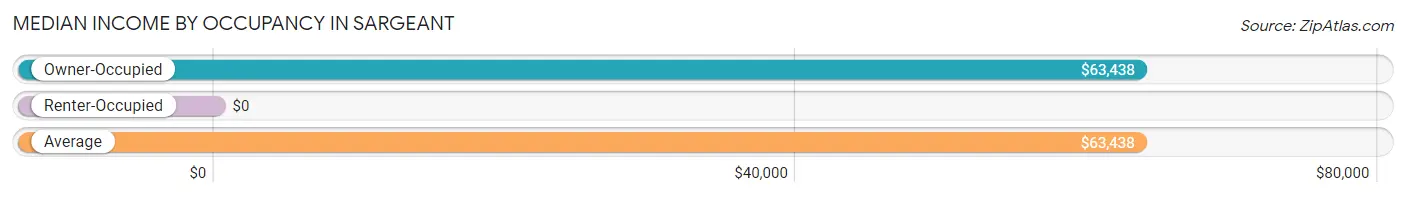
| Occupancy Type | # Households | Median Income |
| Owner-Occupied | 19 (100.0%) | $63,438 |
| Renter-Occupied | 0 (0.0%) | $0 |
| Average | 19 (100.0%) | $63,438 |
Occupancy by Householder Income Bracket in Sargeant
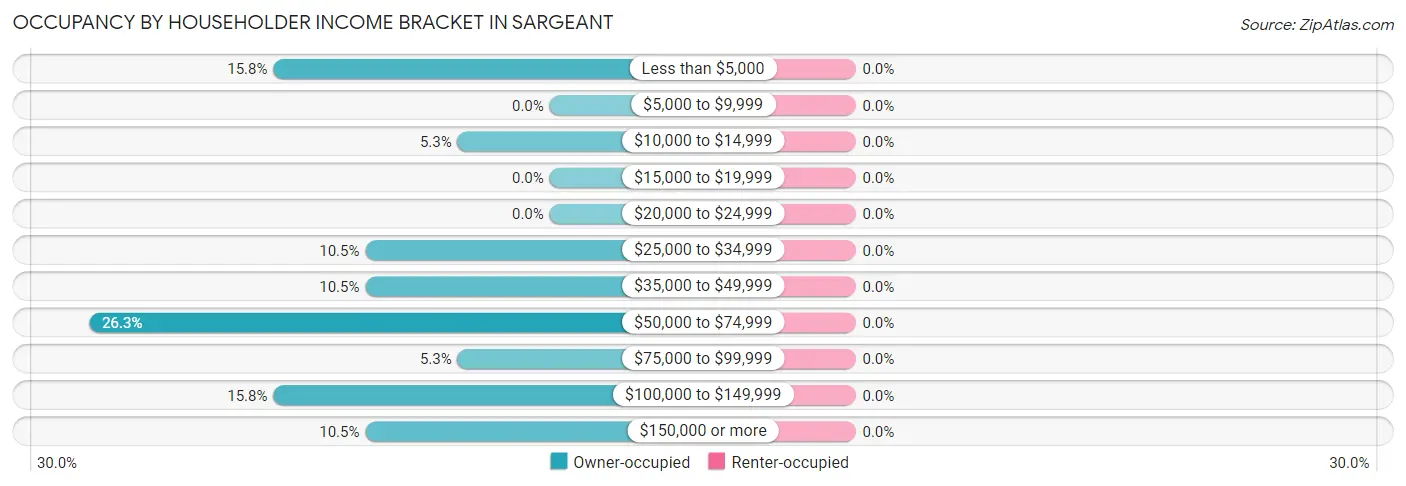
| Income Bracket | Owner-occupied | Renter-occupied |
| Less than $5,000 | 3 (15.8%) | 0 (0.0%) |
| $5,000 to $9,999 | 0 (0.0%) | 0 (0.0%) |
| $10,000 to $14,999 | 1 (5.3%) | 0 (0.0%) |
| $15,000 to $19,999 | 0 (0.0%) | 0 (0.0%) |
| $20,000 to $24,999 | 0 (0.0%) | 0 (0.0%) |
| $25,000 to $34,999 | 2 (10.5%) | 0 (0.0%) |
| $35,000 to $49,999 | 2 (10.5%) | 0 (0.0%) |
| $50,000 to $74,999 | 5 (26.3%) | 0 (0.0%) |
| $75,000 to $99,999 | 1 (5.3%) | 0 (0.0%) |
| $100,000 to $149,999 | 3 (15.8%) | 0 (0.0%) |
| $150,000 or more | 2 (10.5%) | 0 (0.0%) |
| Total | 19 (100.0%) | 0 (0.0%) |
Monthly Housing Cost Tiers in Sargeant
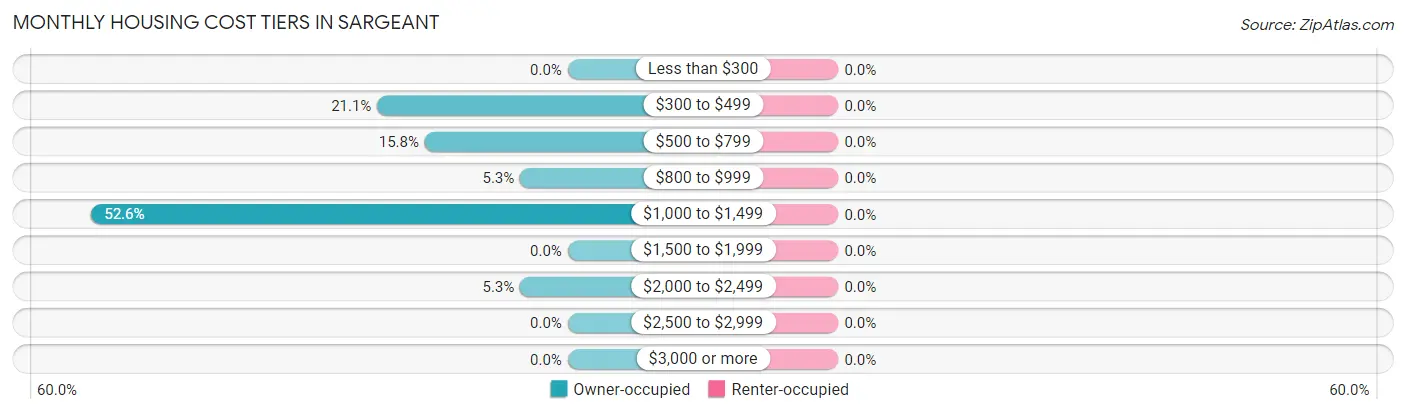
| Monthly Cost | Owner-occupied | Renter-occupied |
| Less than $300 | 0 (0.0%) | 0 (0.0%) |
| $300 to $499 | 4 (21.0%) | 0 (0.0%) |
| $500 to $799 | 3 (15.8%) | 0 (0.0%) |
| $800 to $999 | 1 (5.3%) | 0 (0.0%) |
| $1,000 to $1,499 | 10 (52.6%) | 0 (0.0%) |
| $1,500 to $1,999 | 0 (0.0%) | 0 (0.0%) |
| $2,000 to $2,499 | 1 (5.3%) | 0 (0.0%) |
| $2,500 to $2,999 | 0 (0.0%) | 0 (0.0%) |
| $3,000 or more | 0 (0.0%) | 0 (0.0%) |
| Total | 19 (100.0%) | 0 (0.0%) |
Physical Housing Characteristics in Sargeant
Housing Structures in Sargeant
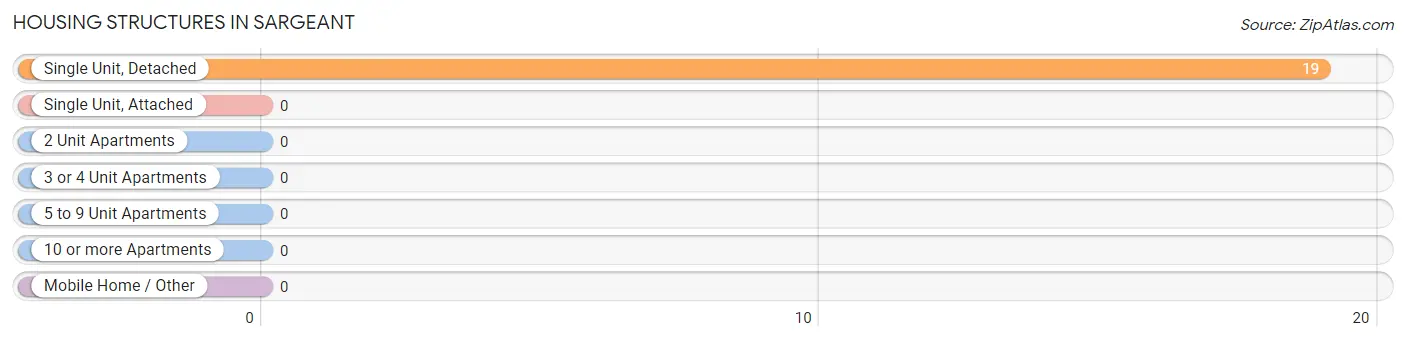
| Structure Type | # Housing Units | % Housing Units |
| Single Unit, Detached | 19 | 100.0% |
| Single Unit, Attached | 0 | 0.0% |
| 2 Unit Apartments | 0 | 0.0% |
| 3 or 4 Unit Apartments | 0 | 0.0% |
| 5 to 9 Unit Apartments | 0 | 0.0% |
| 10 or more Apartments | 0 | 0.0% |
| Mobile Home / Other | 0 | 0.0% |
| Total | 19 | 100.0% |
Housing Structures by Occupancy in Sargeant
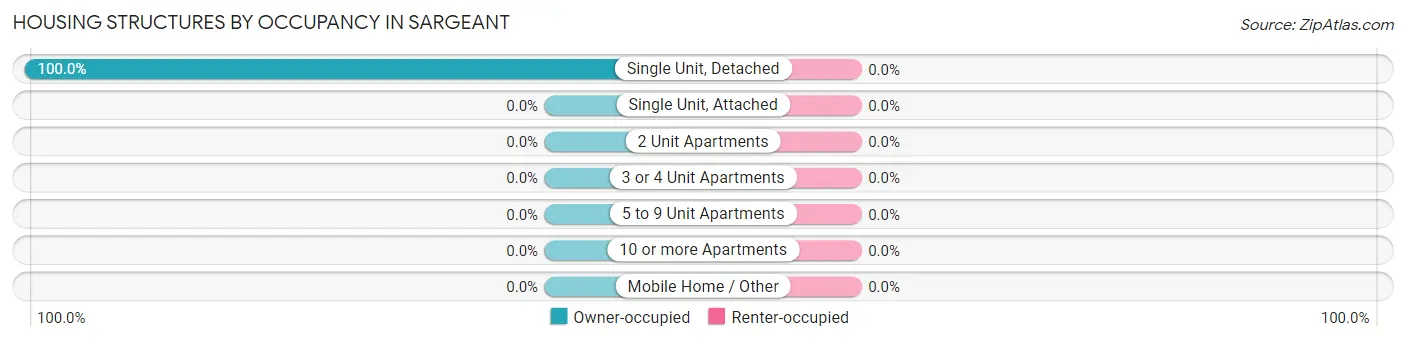
| Structure Type | Owner-occupied | Renter-occupied |
| Single Unit, Detached | 19 (100.0%) | 0 (0.0%) |
| Single Unit, Attached | 0 (0.0%) | 0 (0.0%) |
| 2 Unit Apartments | 0 (0.0%) | 0 (0.0%) |
| 3 or 4 Unit Apartments | 0 (0.0%) | 0 (0.0%) |
| 5 to 9 Unit Apartments | 0 (0.0%) | 0 (0.0%) |
| 10 or more Apartments | 0 (0.0%) | 0 (0.0%) |
| Mobile Home / Other | 0 (0.0%) | 0 (0.0%) |
| Total | 19 (100.0%) | 0 (0.0%) |
Housing Structures by Number of Rooms in Sargeant
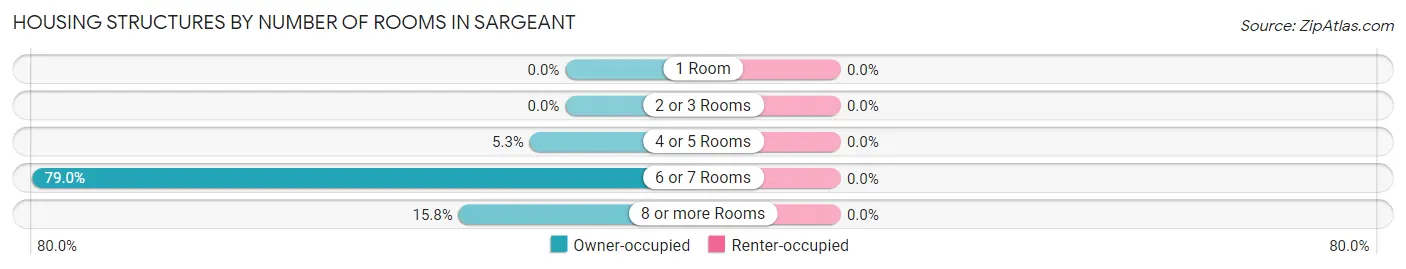
| Number of Rooms | Owner-occupied | Renter-occupied |
| 1 Room | 0 (0.0%) | 0 (0.0%) |
| 2 or 3 Rooms | 0 (0.0%) | 0 (0.0%) |
| 4 or 5 Rooms | 1 (5.3%) | 0 (0.0%) |
| 6 or 7 Rooms | 15 (78.9%) | 0 (0.0%) |
| 8 or more Rooms | 3 (15.8%) | 0 (0.0%) |
| Total | 19 (100.0%) | 0 (0.0%) |
Housing Structure by Heating Type in Sargeant
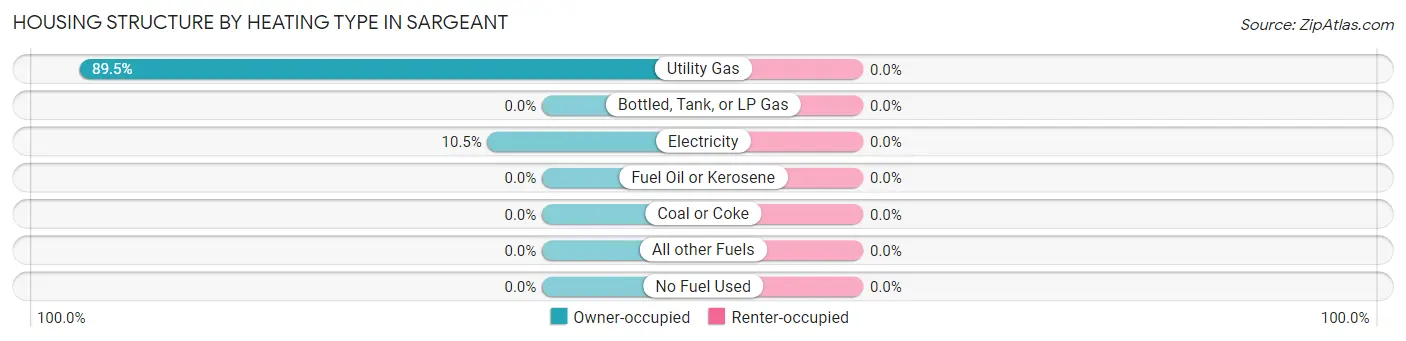
| Heating Type | Owner-occupied | Renter-occupied |
| Utility Gas | 17 (89.5%) | 0 (0.0%) |
| Bottled, Tank, or LP Gas | 0 (0.0%) | 0 (0.0%) |
| Electricity | 2 (10.5%) | 0 (0.0%) |
| Fuel Oil or Kerosene | 0 (0.0%) | 0 (0.0%) |
| Coal or Coke | 0 (0.0%) | 0 (0.0%) |
| All other Fuels | 0 (0.0%) | 0 (0.0%) |
| No Fuel Used | 0 (0.0%) | 0 (0.0%) |
| Total | 19 (100.0%) | 0 (0.0%) |
Household Vehicle Usage in Sargeant
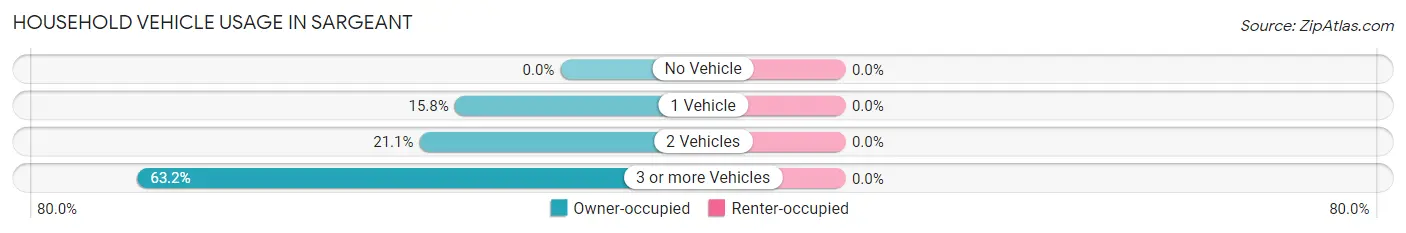
| Vehicles per Household | Owner-occupied | Renter-occupied |
| No Vehicle | 0 (0.0%) | 0 (0.0%) |
| 1 Vehicle | 3 (15.8%) | 0 (0.0%) |
| 2 Vehicles | 4 (21.0%) | 0 (0.0%) |
| 3 or more Vehicles | 12 (63.2%) | 0 (0.0%) |
| Total | 19 (100.0%) | 0 (0.0%) |
Real Estate & Mortgages in Sargeant
Real Estate and Mortgage Overview in Sargeant
| Characteristic | Without Mortgage | With Mortgage |
| Housing Units | 6 | 13 |
| Median Property Value | $107,500 | $122,500 |
| Median Household Income | $31,250 | $2 |
| Monthly Housing Costs | $450 | $0 |
| Real Estate Taxes | $900 | $0 |
Property Value by Mortgage Status in Sargeant
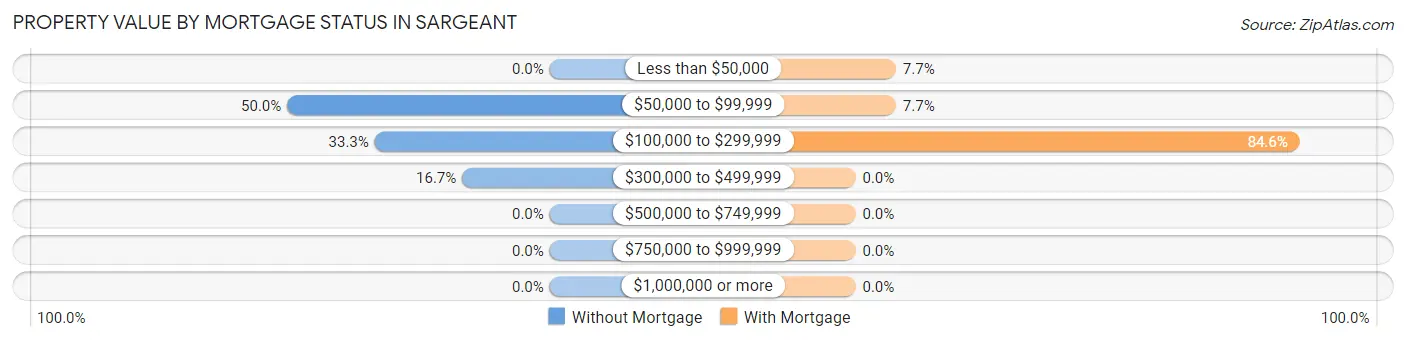
| Property Value | Without Mortgage | With Mortgage |
| Less than $50,000 | 0 (0.0%) | 1 (7.7%) |
| $50,000 to $99,999 | 3 (50.0%) | 1 (7.7%) |
| $100,000 to $299,999 | 2 (33.3%) | 11 (84.6%) |
| $300,000 to $499,999 | 1 (16.7%) | 0 (0.0%) |
| $500,000 to $749,999 | 0 (0.0%) | 0 (0.0%) |
| $750,000 to $999,999 | 0 (0.0%) | 0 (0.0%) |
| $1,000,000 or more | 0 (0.0%) | 0 (0.0%) |
| Total | 6 (100.0%) | 13 (100.0%) |
Household Income by Mortgage Status in Sargeant
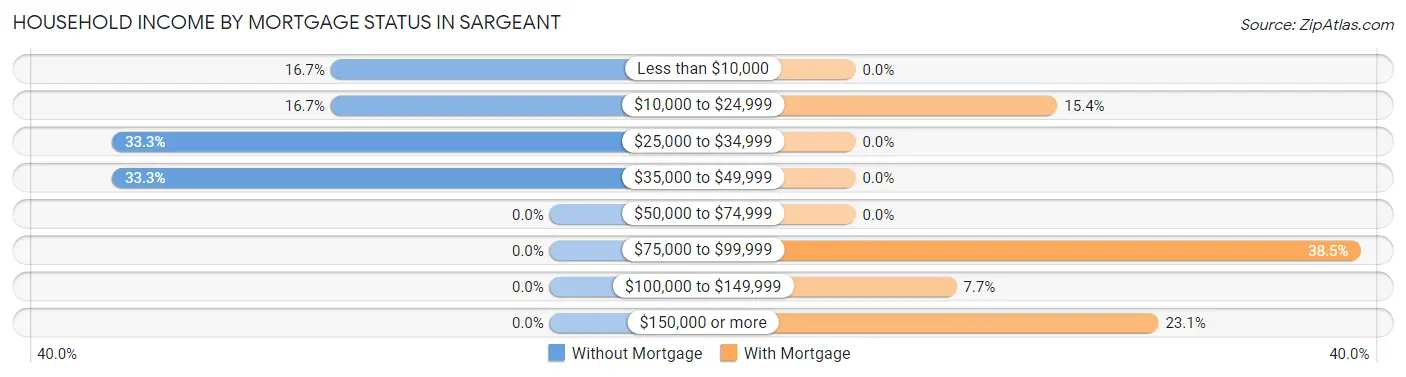
| Household Income | Without Mortgage | With Mortgage |
| Less than $10,000 | 1 (16.7%) | 0 (0.0%) |
| $10,000 to $24,999 | 1 (16.7%) | 2 (15.4%) |
| $25,000 to $34,999 | 2 (33.3%) | 0 (0.0%) |
| $35,000 to $49,999 | 2 (33.3%) | 0 (0.0%) |
| $50,000 to $74,999 | 0 (0.0%) | 0 (0.0%) |
| $75,000 to $99,999 | 0 (0.0%) | 5 (38.5%) |
| $100,000 to $149,999 | 0 (0.0%) | 1 (7.7%) |
| $150,000 or more | 0 (0.0%) | 3 (23.1%) |
| Total | 6 (100.0%) | 13 (100.0%) |
Property Value to Household Income Ratio in Sargeant
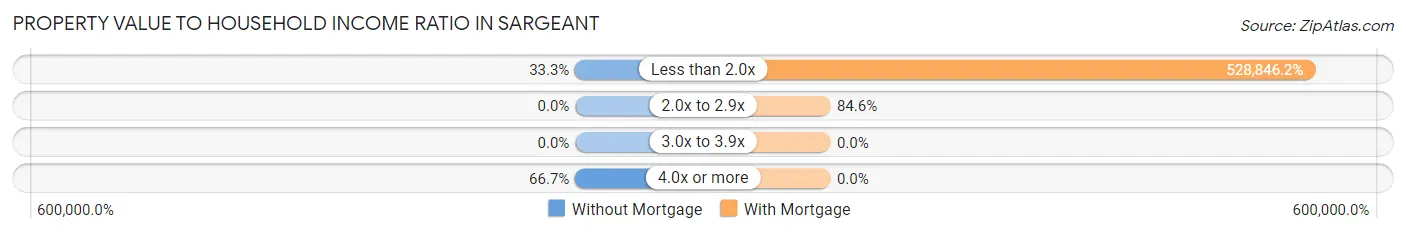
| Value-to-Income Ratio | Without Mortgage | With Mortgage |
| Less than 2.0x | 2 (33.3%) | 68,750 (528,846.2%) |
| 2.0x to 2.9x | 0 (0.0%) | 11 (84.6%) |
| 3.0x to 3.9x | 0 (0.0%) | 0 (0.0%) |
| 4.0x or more | 4 (66.7%) | 0 (0.0%) |
| Total | 6 (100.0%) | 13 (100.0%) |
Real Estate Taxes by Mortgage Status in Sargeant
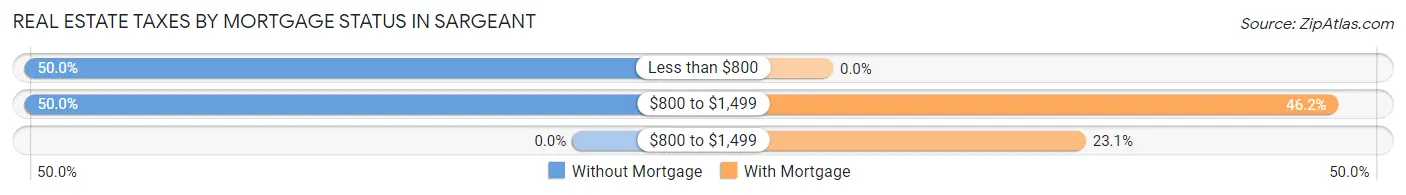
| Property Taxes | Without Mortgage | With Mortgage |
| Less than $800 | 3 (50.0%) | 0 (0.0%) |
| $800 to $1,499 | 3 (50.0%) | 6 (46.2%) |
| $800 to $1,499 | 0 (0.0%) | 3 (23.1%) |
| Total | 6 (100.0%) | 13 (100.0%) |
Health & Disability in Sargeant
Health Insurance Coverage by Age in Sargeant
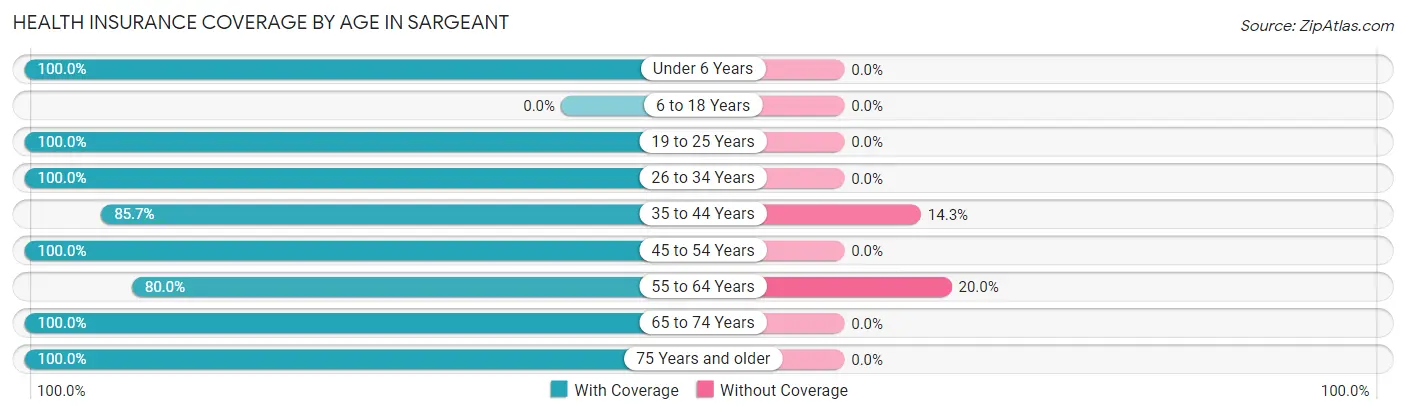
| Age Bracket | With Coverage | Without Coverage |
| Under 6 Years | 2 (100.0%) | 0 (0.0%) |
| 6 to 18 Years | 0 (0.0%) | 0 (0.0%) |
| 19 to 25 Years | 6 (100.0%) | 0 (0.0%) |
| 26 to 34 Years | 13 (100.0%) | 0 (0.0%) |
| 35 to 44 Years | 6 (85.7%) | 1 (14.3%) |
| 45 to 54 Years | 3 (100.0%) | 0 (0.0%) |
| 55 to 64 Years | 4 (80.0%) | 1 (20.0%) |
| 65 to 74 Years | 3 (100.0%) | 0 (0.0%) |
| 75 Years and older | 2 (100.0%) | 0 (0.0%) |
| Total | 39 (95.1%) | 2 (4.9%) |
Health Insurance Coverage by Citizenship Status in Sargeant
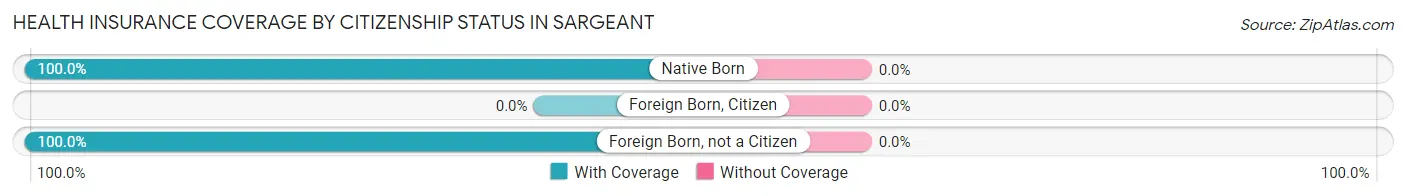
| Citizenship Status | With Coverage | Without Coverage |
| Native Born | 2 (100.0%) | 0 (0.0%) |
| Foreign Born, Citizen | 0 (0.0%) | 0 (0.0%) |
| Foreign Born, not a Citizen | 6 (100.0%) | 0 (0.0%) |
Health Insurance Coverage by Household Income in Sargeant
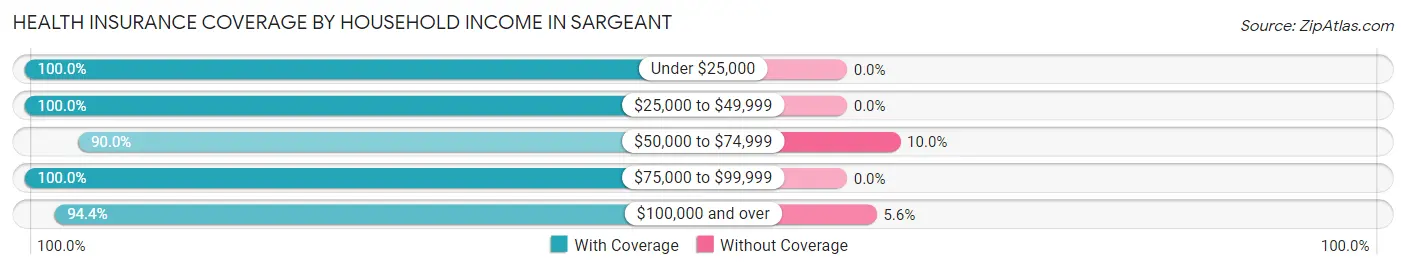
| Household Income | With Coverage | Without Coverage |
| Under $25,000 | 5 (100.0%) | 0 (0.0%) |
| $25,000 to $49,999 | 7 (100.0%) | 0 (0.0%) |
| $50,000 to $74,999 | 9 (90.0%) | 1 (10.0%) |
| $75,000 to $99,999 | 1 (100.0%) | 0 (0.0%) |
| $100,000 and over | 17 (94.4%) | 1 (5.6%) |
Public vs Private Health Insurance Coverage by Age in Sargeant
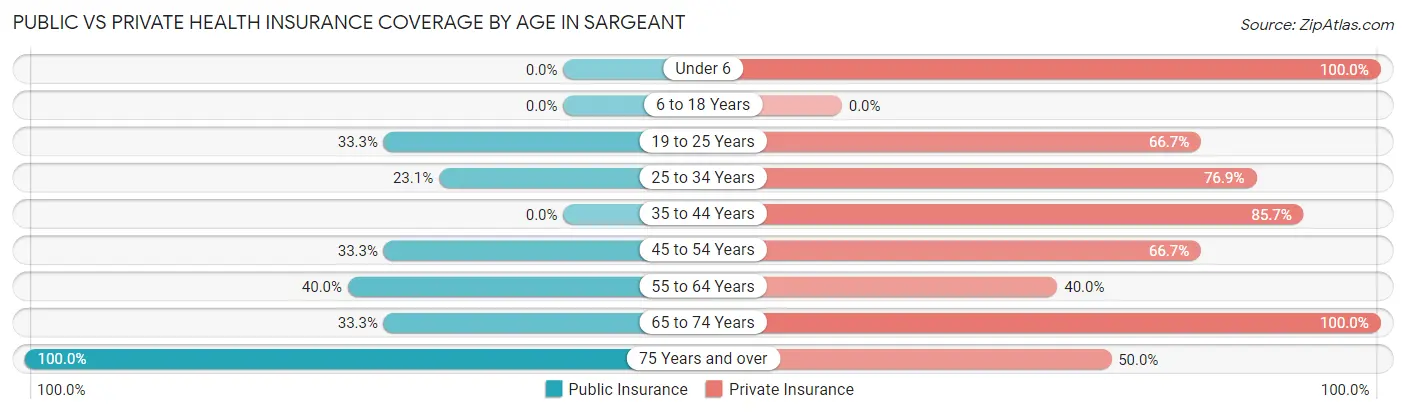
| Age Bracket | Public Insurance | Private Insurance |
| Under 6 | 0 (0.0%) | 2 (100.0%) |
| 6 to 18 Years | 0 (0.0%) | 0 (0.0%) |
| 19 to 25 Years | 2 (33.3%) | 4 (66.7%) |
| 25 to 34 Years | 3 (23.1%) | 10 (76.9%) |
| 35 to 44 Years | 0 (0.0%) | 6 (85.7%) |
| 45 to 54 Years | 1 (33.3%) | 2 (66.7%) |
| 55 to 64 Years | 2 (40.0%) | 2 (40.0%) |
| 65 to 74 Years | 1 (33.3%) | 3 (100.0%) |
| 75 Years and over | 2 (100.0%) | 1 (50.0%) |
| Total | 11 (26.8%) | 30 (73.2%) |
Disability Status by Sex by Age in Sargeant
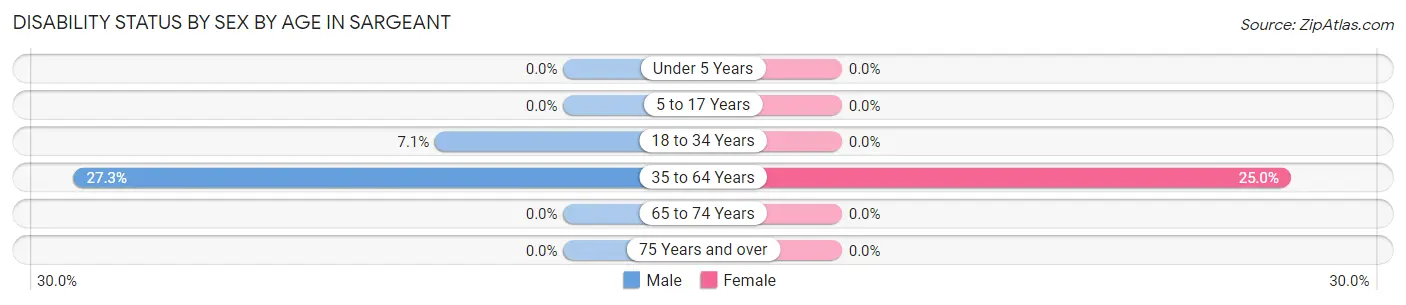
| Age Bracket | Male | Female |
| Under 5 Years | 0 (0.0%) | 0 (0.0%) |
| 5 to 17 Years | 0 (0.0%) | 0 (0.0%) |
| 18 to 34 Years | 1 (7.1%) | 0 (0.0%) |
| 35 to 64 Years | 3 (27.3%) | 1 (25.0%) |
| 65 to 74 Years | 0 (0.0%) | 0 (0.0%) |
| 75 Years and over | 0 (0.0%) | 0 (0.0%) |
Disability Class by Sex by Age in Sargeant
Disability Class: Hearing Difficulty
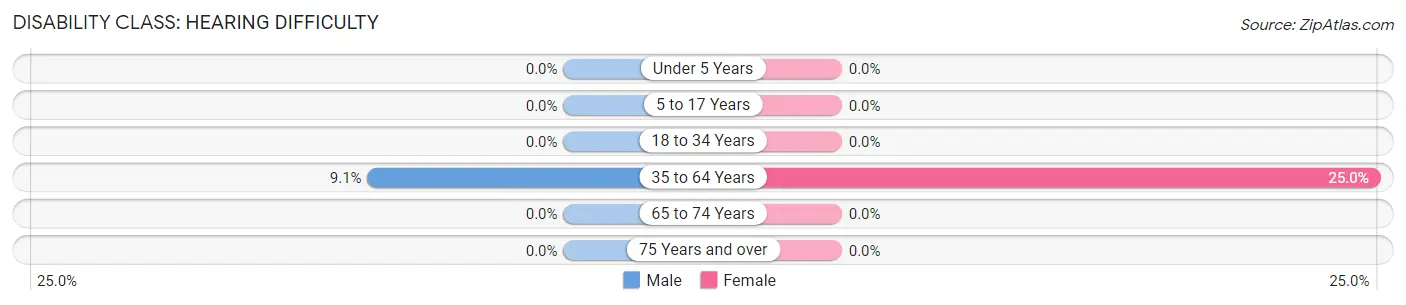
| Age Bracket | Male | Female |
| Under 5 Years | 0 (0.0%) | 0 (0.0%) |
| 5 to 17 Years | 0 (0.0%) | 0 (0.0%) |
| 18 to 34 Years | 0 (0.0%) | 0 (0.0%) |
| 35 to 64 Years | 1 (9.1%) | 1 (25.0%) |
| 65 to 74 Years | 0 (0.0%) | 0 (0.0%) |
| 75 Years and over | 0 (0.0%) | 0 (0.0%) |
Disability Class: Vision Difficulty
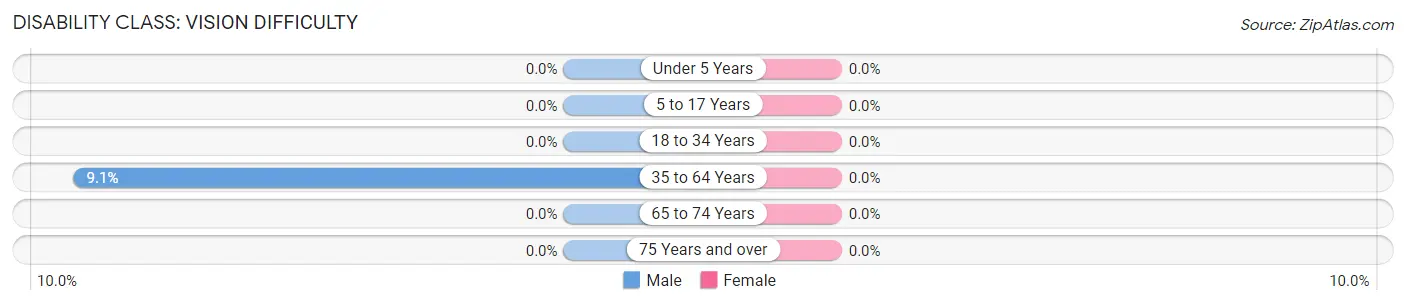
| Age Bracket | Male | Female |
| Under 5 Years | 0 (0.0%) | 0 (0.0%) |
| 5 to 17 Years | 0 (0.0%) | 0 (0.0%) |
| 18 to 34 Years | 0 (0.0%) | 0 (0.0%) |
| 35 to 64 Years | 1 (9.1%) | 0 (0.0%) |
| 65 to 74 Years | 0 (0.0%) | 0 (0.0%) |
| 75 Years and over | 0 (0.0%) | 0 (0.0%) |
Disability Class: Cognitive Difficulty
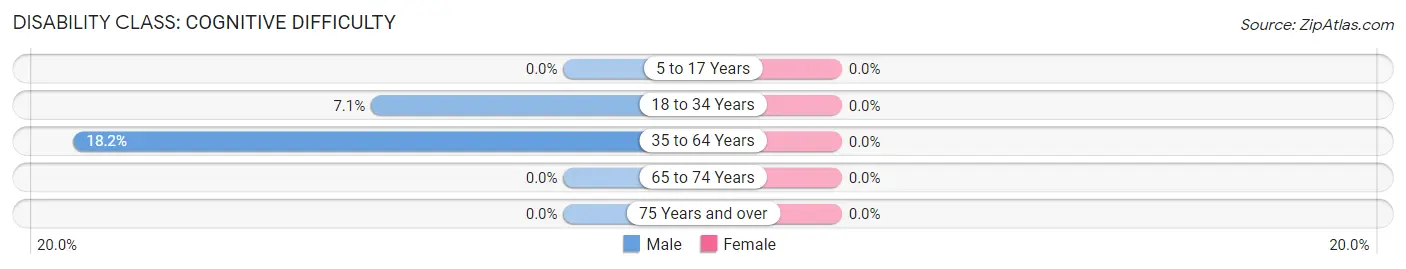
| Age Bracket | Male | Female |
| 5 to 17 Years | 0 (0.0%) | 0 (0.0%) |
| 18 to 34 Years | 1 (7.1%) | 0 (0.0%) |
| 35 to 64 Years | 2 (18.2%) | 0 (0.0%) |
| 65 to 74 Years | 0 (0.0%) | 0 (0.0%) |
| 75 Years and over | 0 (0.0%) | 0 (0.0%) |
Disability Class: Ambulatory Difficulty
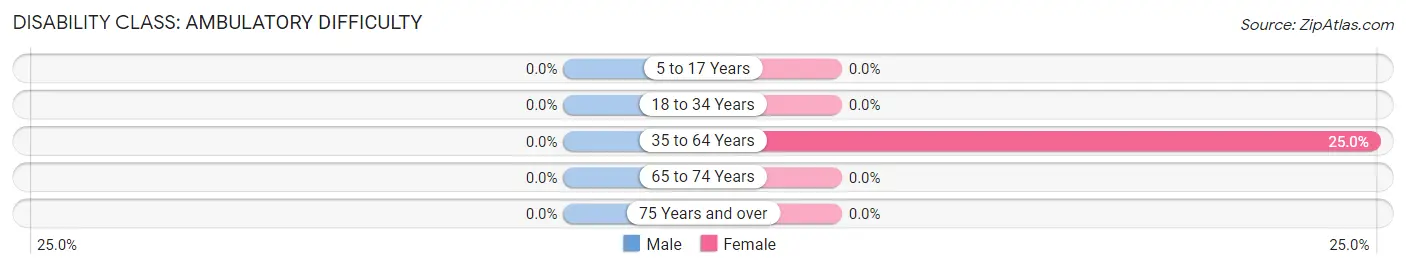
| Age Bracket | Male | Female |
| 5 to 17 Years | 0 (0.0%) | 0 (0.0%) |
| 18 to 34 Years | 0 (0.0%) | 0 (0.0%) |
| 35 to 64 Years | 0 (0.0%) | 1 (25.0%) |
| 65 to 74 Years | 0 (0.0%) | 0 (0.0%) |
| 75 Years and over | 0 (0.0%) | 0 (0.0%) |
Disability Class: Self-Care Difficulty
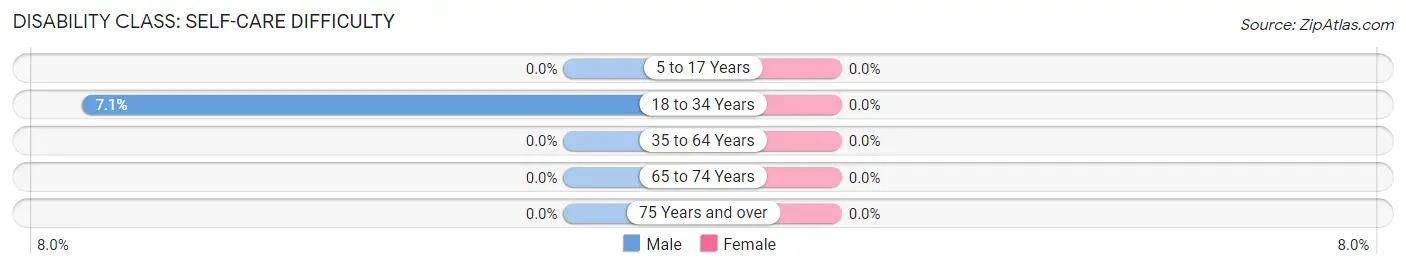
| Age Bracket | Male | Female |
| 5 to 17 Years | 0 (0.0%) | 0 (0.0%) |
| 18 to 34 Years | 1 (7.1%) | 0 (0.0%) |
| 35 to 64 Years | 0 (0.0%) | 0 (0.0%) |
| 65 to 74 Years | 0 (0.0%) | 0 (0.0%) |
| 75 Years and over | 0 (0.0%) | 0 (0.0%) |
Technology Access in Sargeant
Computing Device Access in Sargeant
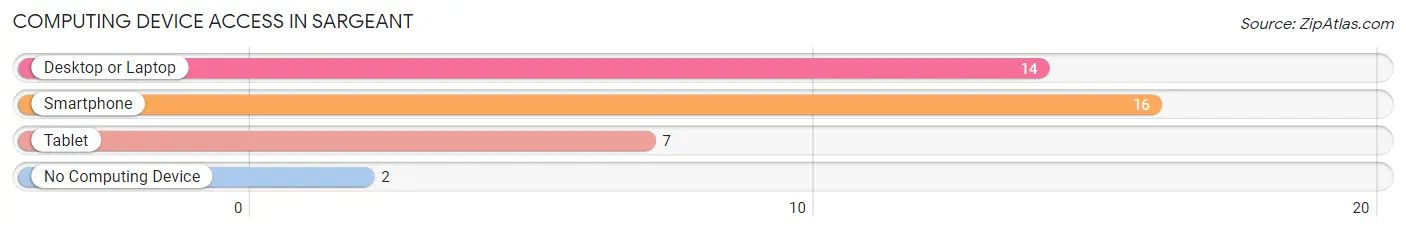
| Device Type | # Households | % Households |
| Desktop or Laptop | 14 | 73.7% |
| Smartphone | 16 | 84.2% |
| Tablet | 7 | 36.8% |
| No Computing Device | 2 | 10.5% |
| Total | 19 | 100.0% |
Internet Access in Sargeant
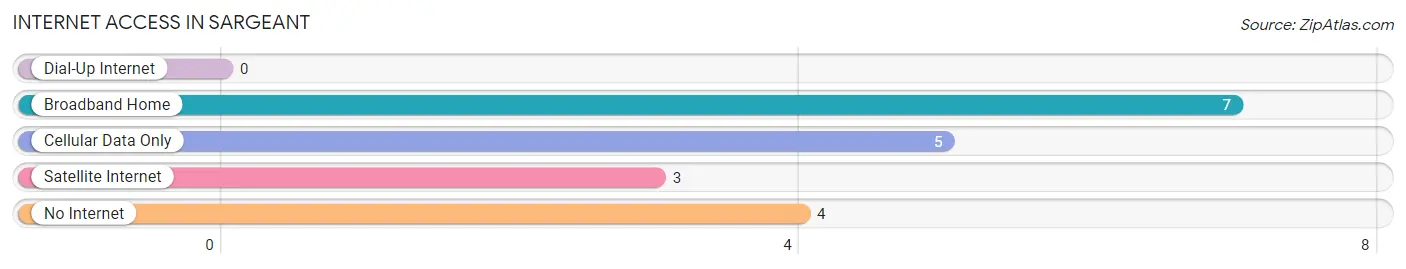
| Internet Type | # Households | % Households |
| Dial-Up Internet | 0 | 0.0% |
| Broadband Home | 7 | 36.8% |
| Cellular Data Only | 5 | 26.3% |
| Satellite Internet | 3 | 15.8% |
| No Internet | 4 | 21.0% |
| Total | 19 | 100.0% |
Sargeant Summary
Sargeant is a small city located in Minnesota, United States. It is situated in Wabasha County, and is part of the Rochester, MN Metropolitan Statistical Area. The city has a population of 1,093 as of the 2010 census.
History
Sargeant was founded in 1856 by a group of settlers from New York. The city was named after the first settler, John Sargeant. The city was originally a farming community, but it soon developed into a small industrial center. The city was incorporated in 1887.
In the early 1900s, Sargeant was home to a number of small businesses, including a flour mill, a sawmill, a creamery, and a brickyard. The city also had a number of churches, including the Methodist Episcopal Church, the Congregational Church, and the Catholic Church.
In the 1950s, Sargeant began to experience a decline in population as many of its residents moved away to larger cities. However, the city has since experienced a resurgence in population, and is now home to a number of small businesses and industries.
Geography
Sargeant is located in southeastern Minnesota, in Wabasha County. The city is situated on the banks of the Mississippi River, and is surrounded by rolling hills and wooded areas. The city has a total area of 1.2 square miles, all of which is land.
The climate in Sargeant is humid continental, with cold winters and hot summers. The average annual temperature is around 40 degrees Fahrenheit, and the average annual precipitation is around 30 inches.
Economy
The economy of Sargeant is largely based on agriculture and manufacturing. The city is home to a number of small businesses, including a lumber mill, a grain elevator, and a feed mill. The city also has a number of small manufacturing companies, including a plastics manufacturer and a metal fabrication company.
The city is also home to a number of retail stores, including a grocery store, a hardware store, and a variety of specialty shops. The city also has a number of restaurants, including a pizza parlor and a Mexican restaurant.
Demographics
As of the 2010 census, the population of Sargeant was 1,093. The racial makeup of the city was 97.3% White, 0.7% African American, 0.3% Native American, 0.2% Asian, 0.1% Pacific Islander, and 1.4% from other races. The median household income was $41,250, and the median family income was $50,000.
The city has a number of educational institutions, including a public elementary school, a public middle school, and a public high school. The city also has a number of private schools, including a Catholic school and a Lutheran school.
Conclusion
Sargeant is a small city located in Minnesota, United States. It is situated in Wabasha County, and is part of the Rochester, MN Metropolitan Statistical Area. The city has a population of 1,093 as of the 2010 census. The city was founded in 1856 by a group of settlers from New York, and was originally a farming community. The economy of Sargeant is largely based on agriculture and manufacturing, and the city is home to a number of small businesses and industries. The racial makeup of the city is 97.3% White, 0.7% African American, 0.3% Native American, 0.2% Asian, 0.1% Pacific Islander, and 1.4% from other races. The city has a number of educational institutions, including a public elementary school, a public middle school, and a public high school.
Common Questions
What is Per Capita Income in Sargeant?
Per Capita income in Sargeant is $35,261.
What is the Median Family Income in Sargeant?
Median Family Income in Sargeant is $64,167.
What is the Median Household income in Sargeant?
Median Household Income in Sargeant is $63,438.
What is Income or Wage Gap in Sargeant?
Income or Wage Gap in Sargeant is 40.3%.
Women in Sargeant earn 59.7 cents for every dollar earned by a man.
What is Inequality or Gini Index in Sargeant?
Inequality or Gini Index in Sargeant is 0.41.
What is the Total Population of Sargeant?
Total Population of Sargeant is 41.
What is the Total Male Population of Sargeant?
Total Male Population of Sargeant is 28.
What is the Total Female Population of Sargeant?
Total Female Population of Sargeant is 13.
What is the Ratio of Males per 100 Females in Sargeant?
There are 215.38 Males per 100 Females in Sargeant.
What is the Ratio of Females per 100 Males in Sargeant?
There are 46.43 Females per 100 Males in Sargeant.
What is the Median Population Age in Sargeant?
Median Population Age in Sargeant is 34.9 Years.
What is the Average Family Size in Sargeant
Average Family Size in Sargeant is 2.6 People.
What is the Average Household Size in Sargeant
Average Household Size in Sargeant is 2.2 People.
How Large is the Labor Force in Sargeant?
There are 32 People in the Labor Forcein in Sargeant.
What is the Percentage of People in the Labor Force in Sargeant?
82.1% of People are in the Labor Force in Sargeant.