Kingston, MN Map & Demographics
Kingston Map
Kingston Overview
$30,057
PER CAPITA INCOME
$96,429
AVG FAMILY INCOME
$90,625
AVG HOUSEHOLD INCOME
47.1%
WAGE / INCOME GAP [ % ]
52.9¢/ $1
WAGE / INCOME GAP [ $ ]
0.27
INEQUALITY / GINI INDEX
215
TOTAL POPULATION
110
MALE POPULATION
105
FEMALE POPULATION
104.76
MALES / 100 FEMALES
95.45
FEMALES / 100 MALES
31.5
MEDIAN AGE
3.2
AVG FAMILY SIZE
2.7
AVG HOUSEHOLD SIZE
106
LABOR FORCE [ PEOPLE ]
65.0%
PERCENT IN LABOR FORCE
1.0%
UNEMPLOYMENT RATE
Kingston Area Codes
Income in Kingston
Income Overview in Kingston
Per Capita Income in Kingston is $30,057, while median incomes of families and households are $96,429 and $90,625 respectively.
| Characteristic | Number | Measure |
| Per Capita Income | 215 | $30,057 |
| Median Family Income | 58 | $96,429 |
| Mean Family Income | 58 | $97,150 |
| Median Household Income | 80 | $90,625 |
| Mean Household Income | 80 | $83,513 |
| Income Deficit | 58 | $0 |
| Wage / Income Gap (%) | 215 | 47.13% |
| Wage / Income Gap ($) | 215 | 52.87¢ per $1 |
| Gini / Inequality Index | 215 | 0.27 |
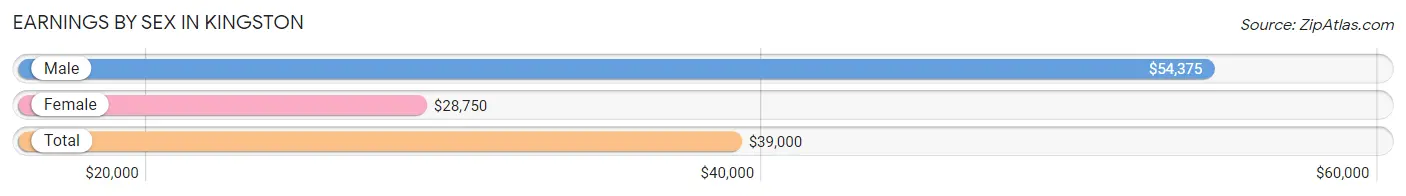
Earnings by Sex in Kingston
Average Earnings in Kingston are $39,000, $54,375 for men and $28,750 for women, a difference of 47.1%.
| Sex | Number | Average Earnings |
| Male | 71 (59.2%) | $54,375 |
| Female | 49 (40.8%) | $28,750 |
| Total | 120 (100.0%) | $39,000 |
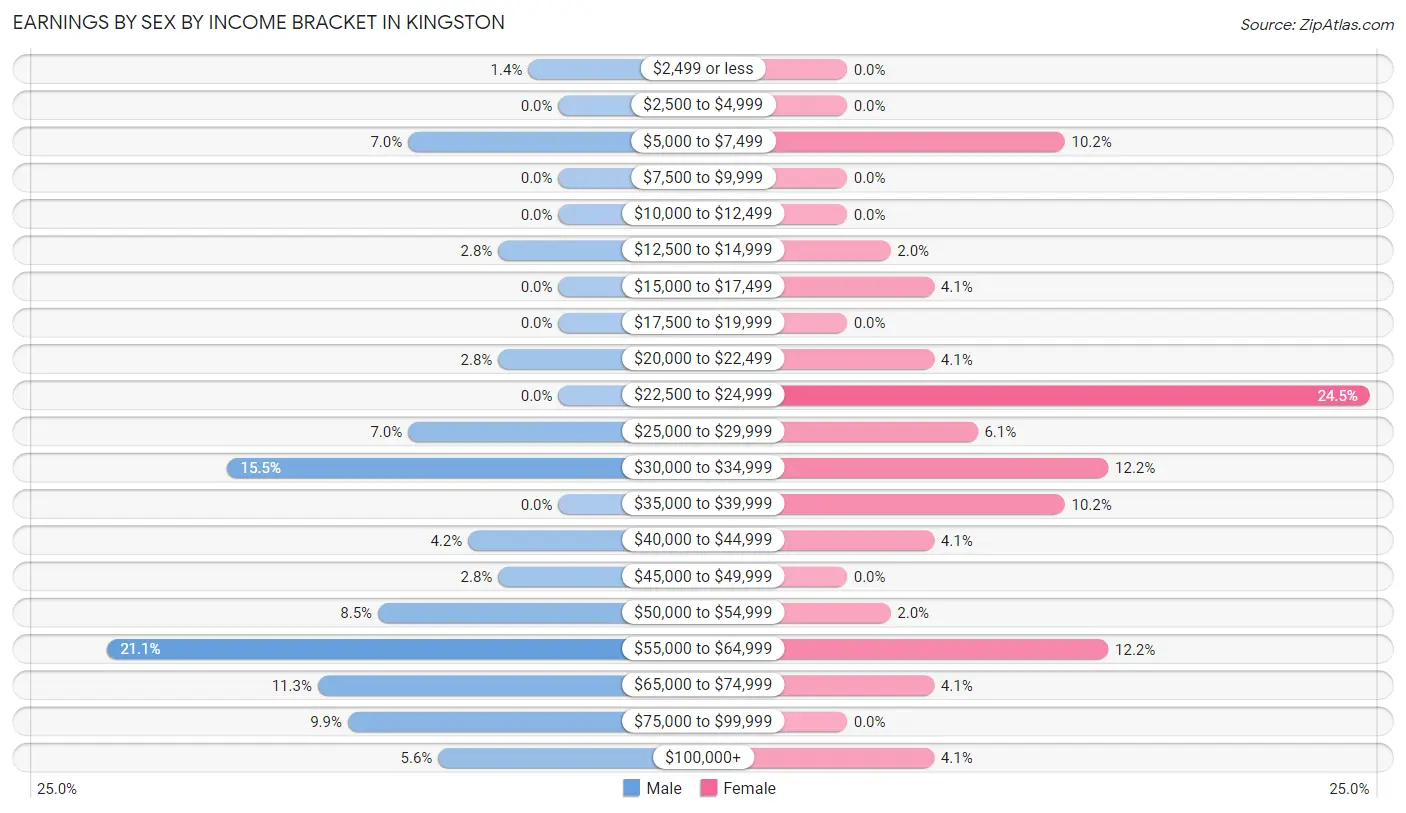
Earnings by Sex by Income Bracket in Kingston
The most common earnings brackets in Kingston are $55,000 to $64,999 for men (15 | 21.1%) and $22,500 to $24,999 for women (12 | 24.5%).
| Income | Male | Female |
| $2,499 or less | 1 (1.4%) | 0 (0.0%) |
| $2,500 to $4,999 | 0 (0.0%) | 0 (0.0%) |
| $5,000 to $7,499 | 5 (7.0%) | 5 (10.2%) |
| $7,500 to $9,999 | 0 (0.0%) | 0 (0.0%) |
| $10,000 to $12,499 | 0 (0.0%) | 0 (0.0%) |
| $12,500 to $14,999 | 2 (2.8%) | 1 (2.0%) |
| $15,000 to $17,499 | 0 (0.0%) | 2 (4.1%) |
| $17,500 to $19,999 | 0 (0.0%) | 0 (0.0%) |
| $20,000 to $22,499 | 2 (2.8%) | 2 (4.1%) |
| $22,500 to $24,999 | 0 (0.0%) | 12 (24.5%) |
| $25,000 to $29,999 | 5 (7.0%) | 3 (6.1%) |
| $30,000 to $34,999 | 11 (15.5%) | 6 (12.2%) |
| $35,000 to $39,999 | 0 (0.0%) | 5 (10.2%) |
| $40,000 to $44,999 | 3 (4.2%) | 2 (4.1%) |
| $45,000 to $49,999 | 2 (2.8%) | 0 (0.0%) |
| $50,000 to $54,999 | 6 (8.5%) | 1 (2.0%) |
| $55,000 to $64,999 | 15 (21.1%) | 6 (12.2%) |
| $65,000 to $74,999 | 8 (11.3%) | 2 (4.1%) |
| $75,000 to $99,999 | 7 (9.9%) | 0 (0.0%) |
| $100,000+ | 4 (5.6%) | 2 (4.1%) |
| Total | 71 (100.0%) | 49 (100.0%) |
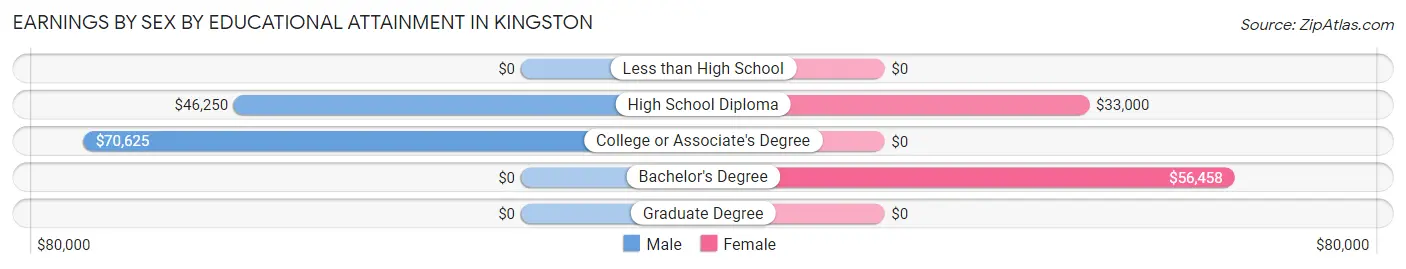
Earnings by Sex by Educational Attainment in Kingston
Average earnings in Kingston are $56,875 for men and $34,583 for women, a difference of 39.2%. Men with an educational attainment of college or associate's degree enjoy the highest average annual earnings of $70,625, while those with high school diploma education earn the least with $46,250. Women with an educational attainment of bachelor's degree earn the most with the average annual earnings of $56,458, while those with high school diploma education have the smallest earnings of $33,000.
| Educational Attainment | Male Income | Female Income |
| Less than High School | - | - |
| High School Diploma | $46,250 | $33,000 |
| College or Associate's Degree | $70,625 | $0 |
| Bachelor's Degree | - | - |
| Graduate Degree | - | - |
| Total | $56,875 | $34,583 |
Family Income in Kingston
Family Income Brackets in Kingston
According to the Kingston family income data, there are 23 families falling into the $100,000 to $149,999 income range, which is the most common income bracket and makes up 39.7% of all families.
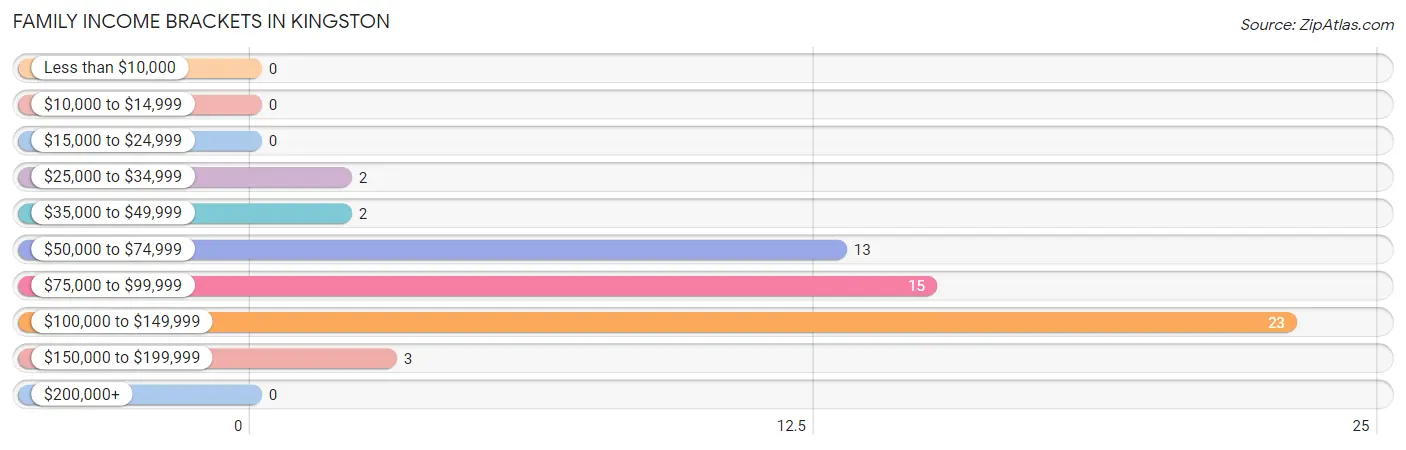
| Income Bracket | # Families | % Families |
| Less than $10,000 | 0 | 0.0% |
| $10,000 to $14,999 | 0 | 0.0% |
| $15,000 to $24,999 | 0 | 0.0% |
| $25,000 to $34,999 | 2 | 3.4% |
| $35,000 to $49,999 | 2 | 3.4% |
| $50,000 to $74,999 | 13 | 22.4% |
| $75,000 to $99,999 | 15 | 25.9% |
| $100,000 to $149,999 | 23 | 39.7% |
| $150,000 to $199,999 | 3 | 5.2% |
| $200,000+ | 0 | 0.0% |
Family Income by Famaliy Size in Kingston
3-person families (6 | 10.3%) account for the highest median family income in Kingston with $135,000 per family, while 2-person families (27 | 46.6%) have the highest median income of $47,590 per family member.
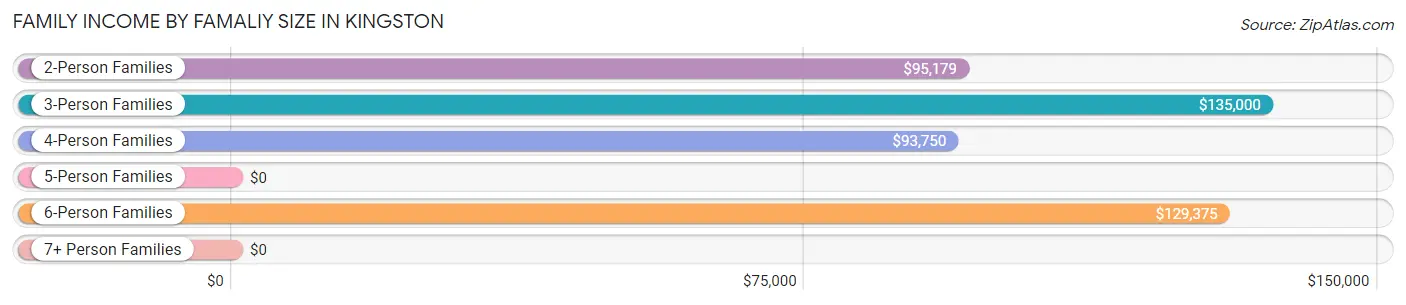
| Income Bracket | # Families | Median Income |
| 2-Person Families | 27 (46.6%) | $95,179 |
| 3-Person Families | 6 (10.3%) | $135,000 |
| 4-Person Families | 10 (17.2%) | $93,750 |
| 5-Person Families | 2 (3.5%) | $0 |
| 6-Person Families | 12 (20.7%) | $129,375 |
| 7+ Person Families | 1 (1.7%) | $0 |
| Total | 58 (100.0%) | $96,429 |
Family Income by Number of Earners in Kingston
The median family income in Kingston is $96,429, with families comprising 3+ earners (7) having the highest median family income of $128,438, while families with no earners (10) have the lowest median family income of $68,750, accounting for 12.1% and 17.2% of families, respectively.
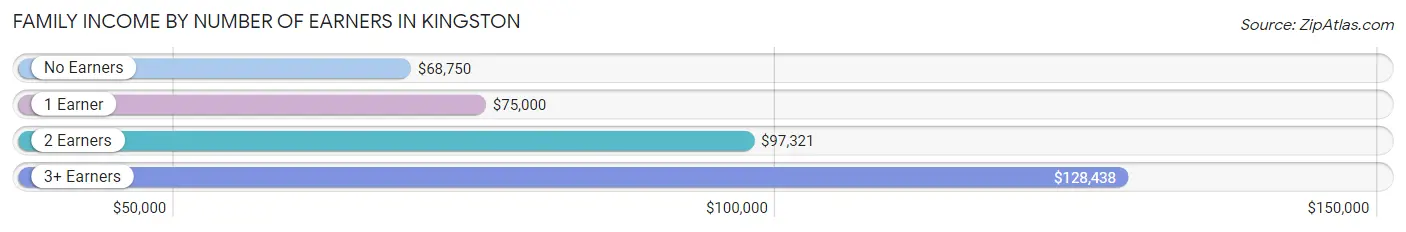
| Number of Earners | # Families | Median Income |
| No Earners | 10 (17.2%) | $68,750 |
| 1 Earner | 8 (13.8%) | $75,000 |
| 2 Earners | 33 (56.9%) | $97,321 |
| 3+ Earners | 7 (12.1%) | $128,438 |
| Total | 58 (100.0%) | $96,429 |
Household Income in Kingston
Household Income Brackets in Kingston
With 26 households falling in the category, the $100,000 to $149,999 income range is the most frequent in Kingston, accounting for 32.5% of all households.
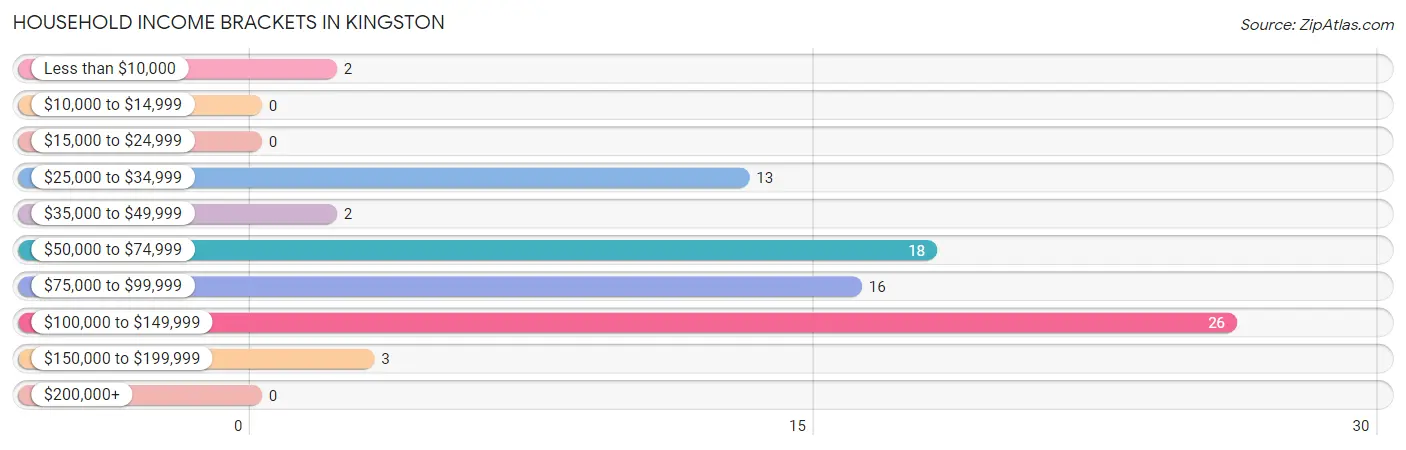
| Income Bracket | # Households | % Households |
| Less than $10,000 | 2 | 2.5% |
| $10,000 to $14,999 | 0 | 0.0% |
| $15,000 to $24,999 | 0 | 0.0% |
| $25,000 to $34,999 | 13 | 16.3% |
| $35,000 to $49,999 | 2 | 2.5% |
| $50,000 to $74,999 | 18 | 22.5% |
| $75,000 to $99,999 | 16 | 20.0% |
| $100,000 to $149,999 | 26 | 32.5% |
| $150,000 to $199,999 | 3 | 3.8% |
| $200,000+ | 0 | 0.0% |
Household Income by Householder Age in Kingston
The median household income in Kingston is $90,625, with the highest median household income of $108,750 found in the 45 to 64 years age bracket for the primary householder. A total of 9 households (11.3%) fall into this category. Meanwhile, the 15 to 24 years age bracket for the primary householder has the lowest median household income of $0, with 5 households (6.2%) in this group.
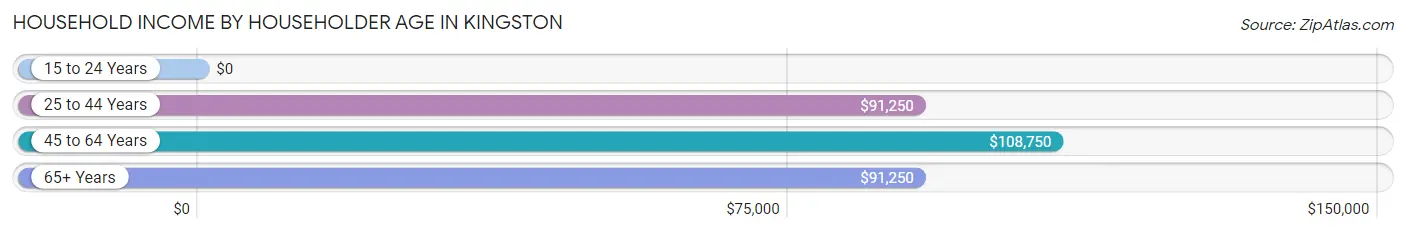
| Income Bracket | # Households | Median Income |
| 15 to 24 Years | 5 (6.2%) | $0 |
| 25 to 44 Years | 52 (65.0%) | $91,250 |
| 45 to 64 Years | 9 (11.3%) | $108,750 |
| 65+ Years | 14 (17.5%) | $91,250 |
| Total | 80 (100.0%) | $90,625 |
Poverty in Kingston
Income Below Poverty by Sex and Age in Kingston
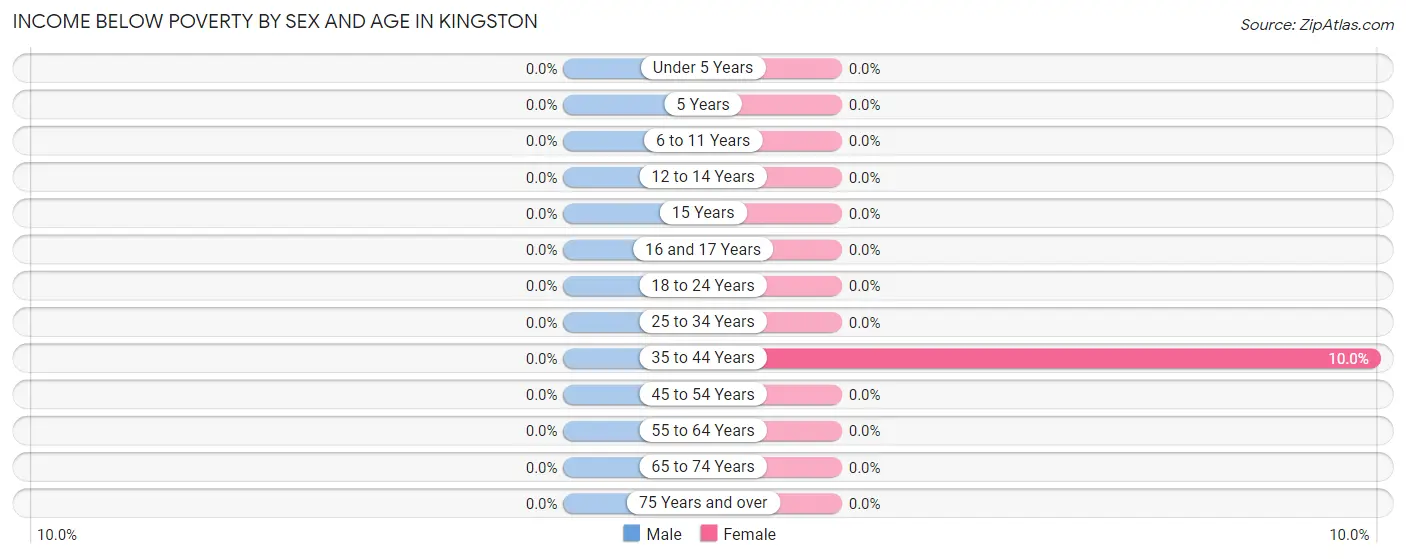
| Age Bracket | Male | Female |
| Under 5 Years | 0 (0.0%) | 0 (0.0%) |
| 5 Years | 0 (0.0%) | 0 (0.0%) |
| 6 to 11 Years | 0 (0.0%) | 0 (0.0%) |
| 12 to 14 Years | 0 (0.0%) | 0 (0.0%) |
| 15 Years | 0 (0.0%) | 0 (0.0%) |
| 16 and 17 Years | 0 (0.0%) | 0 (0.0%) |
| 18 to 24 Years | 0 (0.0%) | 0 (0.0%) |
| 25 to 34 Years | 0 (0.0%) | 0 (0.0%) |
| 35 to 44 Years | 0 (0.0%) | 2 (10.0%) |
| 45 to 54 Years | 0 (0.0%) | 0 (0.0%) |
| 55 to 64 Years | 0 (0.0%) | 0 (0.0%) |
| 65 to 74 Years | 0 (0.0%) | 0 (0.0%) |
| 75 Years and over | 0 (0.0%) | 0 (0.0%) |
| Total | 0 (0.0%) | 2 (1.9%) |
Income Above Poverty by Sex and Age in Kingston
According to the poverty statistics in Kingston, males aged under 5 years and females aged under 5 years are the age groups that are most secure financially, with 100.0% of males and 100.0% of females in these age groups living above the poverty line.
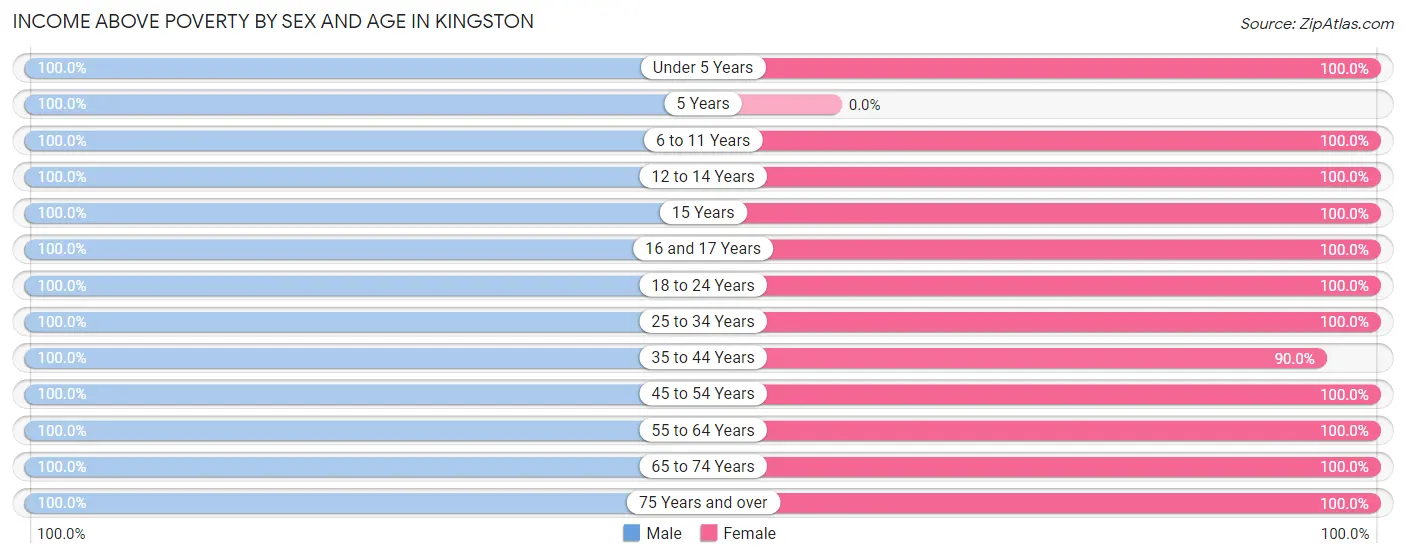
| Age Bracket | Male | Female |
| Under 5 Years | 6 (100.0%) | 17 (100.0%) |
| 5 Years | 3 (100.0%) | 0 (0.0%) |
| 6 to 11 Years | 9 (100.0%) | 9 (100.0%) |
| 12 to 14 Years | 3 (100.0%) | 2 (100.0%) |
| 15 Years | 2 (100.0%) | 1 (100.0%) |
| 16 and 17 Years | 2 (100.0%) | 8 (100.0%) |
| 18 to 24 Years | 15 (100.0%) | 11 (100.0%) |
| 25 to 34 Years | 22 (100.0%) | 16 (100.0%) |
| 35 to 44 Years | 23 (100.0%) | 18 (90.0%) |
| 45 to 54 Years | 5 (100.0%) | 4 (100.0%) |
| 55 to 64 Years | 7 (100.0%) | 4 (100.0%) |
| 65 to 74 Years | 7 (100.0%) | 10 (100.0%) |
| 75 Years and over | 6 (100.0%) | 3 (100.0%) |
| Total | 110 (100.0%) | 103 (98.1%) |
Income Below Poverty Among Married-Couple Families in Kingston
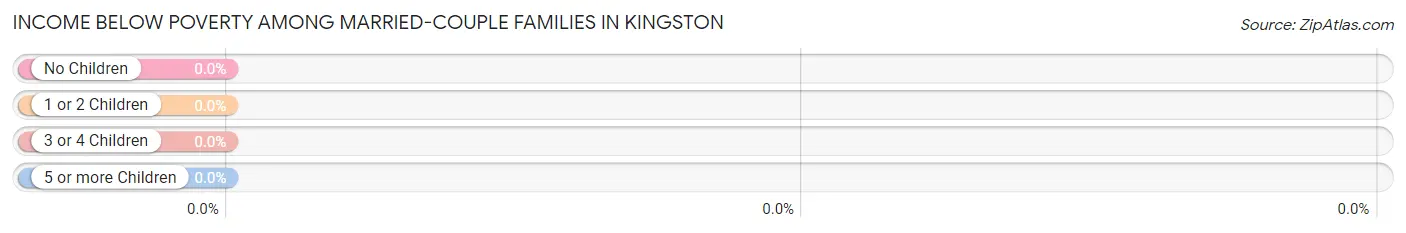
| Children | Above Poverty | Below Poverty |
| No Children | 26 (100.0%) | 0 (0.0%) |
| 1 or 2 Children | 11 (100.0%) | 0 (0.0%) |
| 3 or 4 Children | 14 (100.0%) | 0 (0.0%) |
| 5 or more Children | 1 (100.0%) | 0 (0.0%) |
| Total | 52 (100.0%) | 0 (0.0%) |
Income Below Poverty Among Single-Parent Households in Kingston
| Children | Single Father | Single Mother |
| No Children | 0 (0.0%) | 0 (0.0%) |
| 1 or 2 Children | 0 (0.0%) | 0 (0.0%) |
| 3 or 4 Children | 0 (0.0%) | 0 (0.0%) |
| 5 or more Children | 0 (0.0%) | 0 (0.0%) |
| Total | 0 (0.0%) | 0 (0.0%) |
Income Below Poverty Among Married-Couple vs Single-Parent Households in Kingston
| Children | Married-Couple Families | Single-Parent Households |
| No Children | 0 (0.0%) | 0 (0.0%) |
| 1 or 2 Children | 0 (0.0%) | 0 (0.0%) |
| 3 or 4 Children | 0 (0.0%) | 0 (0.0%) |
| 5 or more Children | 0 (0.0%) | 0 (0.0%) |
| Total | 0 (0.0%) | 0 (0.0%) |
Race in Kingston
The most populous races in Kingston are White / Caucasian (208 | 96.7%), Hispanic or Latino (14 | 6.5%), and Two or more Races (7 | 3.3%).
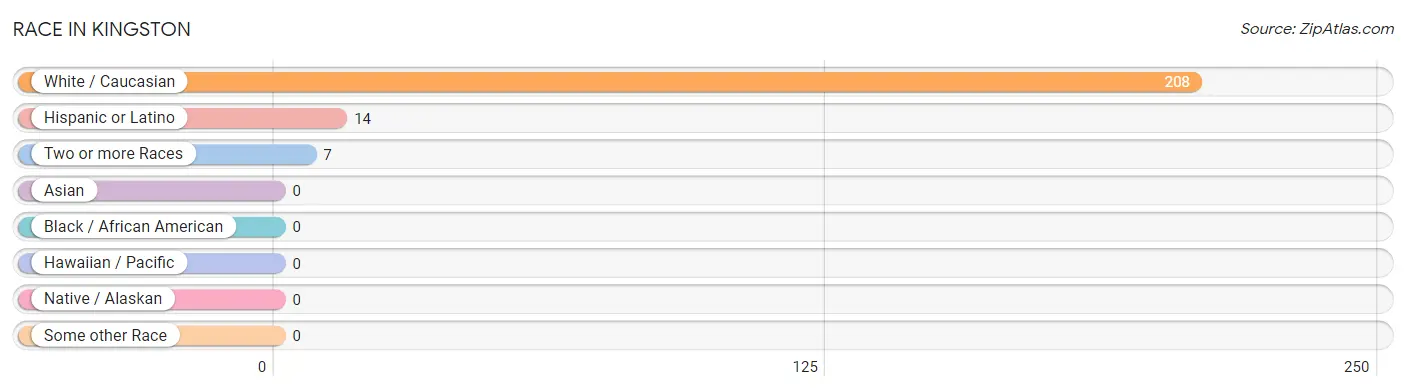
| Race | # Population | % Population |
| Asian | 0 | 0.0% |
| Black / African American | 0 | 0.0% |
| Hawaiian / Pacific | 0 | 0.0% |
| Hispanic or Latino | 14 | 6.5% |
| Native / Alaskan | 0 | 0.0% |
| White / Caucasian | 208 | 96.7% |
| Two or more Races | 7 | 3.3% |
| Some other Race | 0 | 0.0% |
| Total | 215 | 100.0% |
Ancestry in Kingston
The most populous ancestries reported in Kingston are German (83 | 38.6%), Finnish (58 | 27.0%), Scandinavian (31 | 14.4%), Swedish (24 | 11.2%), and Norwegian (19 | 8.8%), together accounting for 100.0% of all Kingston residents.
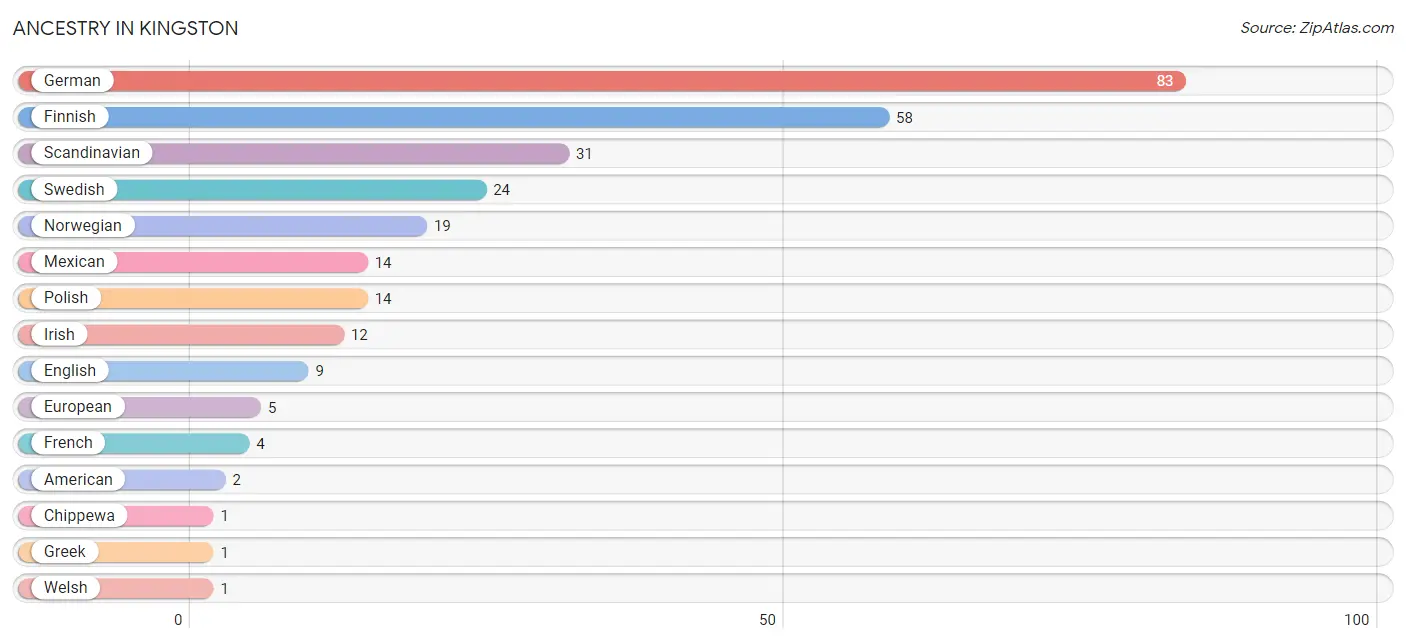
| Ancestry | # Population | % Population |
| American | 2 | 0.9% |
| Chippewa | 1 | 0.5% |
| English | 9 | 4.2% |
| European | 5 | 2.3% |
| Finnish | 58 | 27.0% |
| French | 4 | 1.9% |
| German | 83 | 38.6% |
| Greek | 1 | 0.5% |
| Irish | 12 | 5.6% |
| Mexican | 14 | 6.5% |
| Norwegian | 19 | 8.8% |
| Polish | 14 | 6.5% |
| Scandinavian | 31 | 14.4% |
| Swedish | 24 | 11.2% |
| Welsh | 1 | 0.5% | View All 15 Rows |
Immigrants in Kingston
The most numerous immigrant groups reported in Kingston came from , and Canada (1 | 0.5%), together accounting for 0.5% of all Kingston residents.

| Immigration Origin | # Population | % Population |
| Canada | 1 | 0.5% | View All 1 Rows |
Sex and Age in Kingston
Sex and Age in Kingston
The most populous age groups in Kingston are 35 to 39 Years (20 | 18.2%) for men and Under 5 Years (17 | 16.2%) for women.
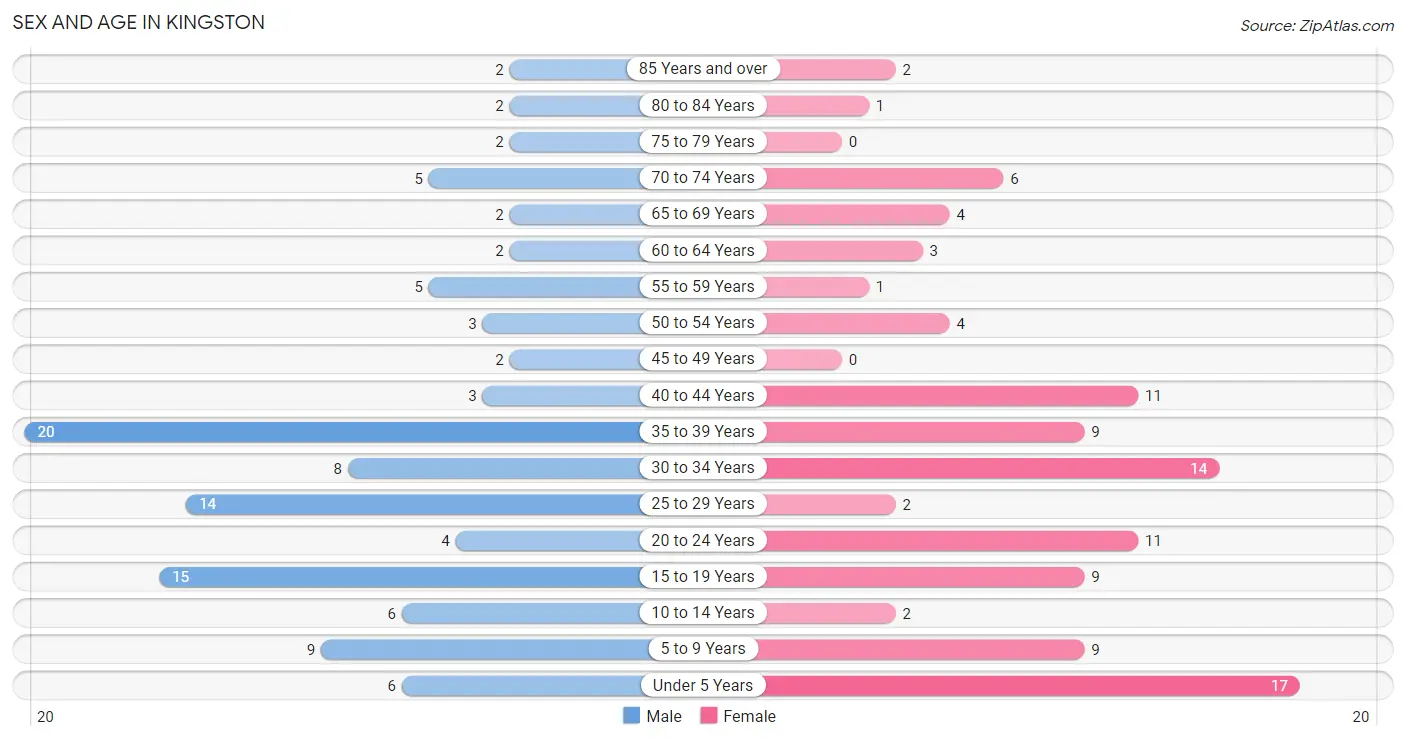
| Age Bracket | Male | Female |
| Under 5 Years | 6 (5.4%) | 17 (16.2%) |
| 5 to 9 Years | 9 (8.2%) | 9 (8.6%) |
| 10 to 14 Years | 6 (5.4%) | 2 (1.9%) |
| 15 to 19 Years | 15 (13.6%) | 9 (8.6%) |
| 20 to 24 Years | 4 (3.6%) | 11 (10.5%) |
| 25 to 29 Years | 14 (12.7%) | 2 (1.9%) |
| 30 to 34 Years | 8 (7.3%) | 14 (13.3%) |
| 35 to 39 Years | 20 (18.2%) | 9 (8.6%) |
| 40 to 44 Years | 3 (2.7%) | 11 (10.5%) |
| 45 to 49 Years | 2 (1.8%) | 0 (0.0%) |
| 50 to 54 Years | 3 (2.7%) | 4 (3.8%) |
| 55 to 59 Years | 5 (4.5%) | 1 (0.9%) |
| 60 to 64 Years | 2 (1.8%) | 3 (2.9%) |
| 65 to 69 Years | 2 (1.8%) | 4 (3.8%) |
| 70 to 74 Years | 5 (4.5%) | 6 (5.7%) |
| 75 to 79 Years | 2 (1.8%) | 0 (0.0%) |
| 80 to 84 Years | 2 (1.8%) | 1 (0.9%) |
| 85 Years and over | 2 (1.8%) | 2 (1.9%) |
| Total | 110 (100.0%) | 105 (100.0%) |
Families and Households in Kingston
Median Family Size in Kingston
The median family size in Kingston is 3.21 persons per family, with married-couple families (52 | 89.7%) accounting for the largest median family size of 3.29 persons per family. On the other hand, single female/mother families (2 | 3.5%) represent the smallest median family size with 2.00 persons per family.
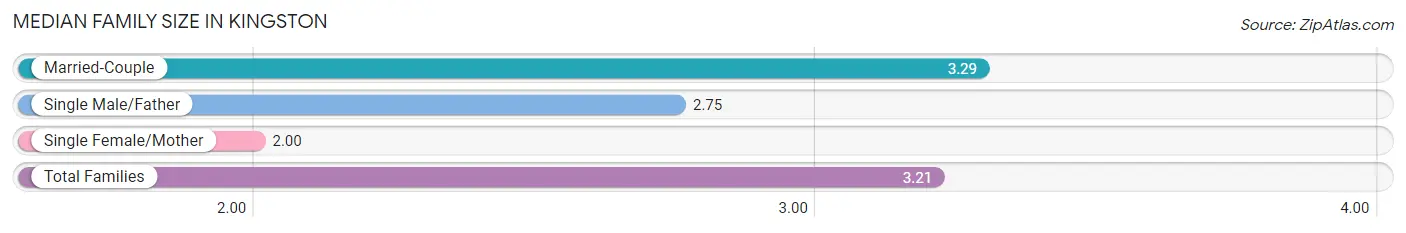
| Family Type | # Families | Family Size |
| Married-Couple | 52 (89.7%) | 3.29 |
| Single Male/Father | 4 (6.9%) | 2.75 |
| Single Female/Mother | 2 (3.5%) | 2.00 |
| Total Families | 58 (100.0%) | 3.21 |
Median Household Size in Kingston
The median household size in Kingston is 2.69 persons per household, with married-couple households (52 | 65.0%) accounting for the largest median household size of 3.29 persons per household. non-family households (22 | 27.5%) represent the smallest median household size with 1.23 persons per household.
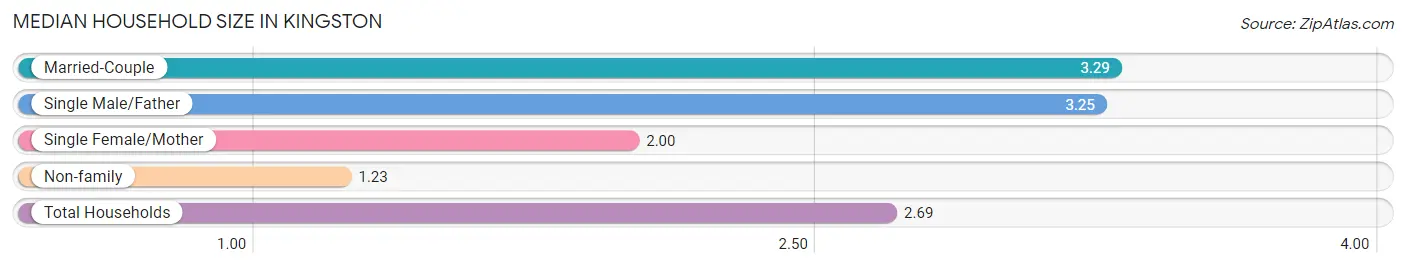
| Household Type | # Households | Household Size |
| Married-Couple | 52 (65.0%) | 3.29 |
| Single Male/Father | 4 (5.0%) | 3.25 |
| Single Female/Mother | 2 (2.5%) | 2.00 |
| Non-family | 22 (27.5%) | 1.23 |
| Total Households | 80 (100.0%) | 2.69 |
Household Size by Marriage Status in Kingston
Out of a total of 80 households in Kingston, 58 (72.5%) are family households, while 22 (27.5%) are nonfamily households. The most numerous type of family households are 2-person households, comprising 27, and the most common type of nonfamily households are 1-person households, comprising 19.
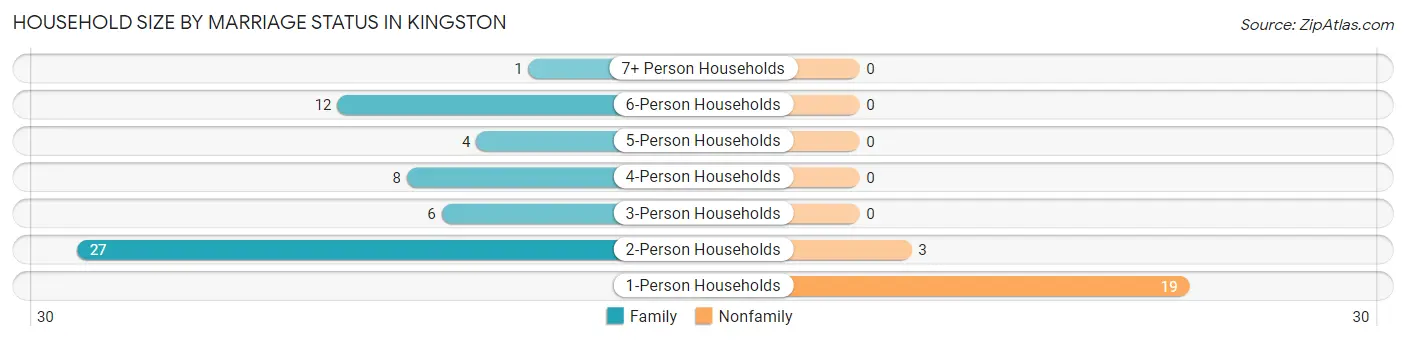
| Household Size | Family Households | Nonfamily Households |
| 1-Person Households | - | 19 (23.7%) |
| 2-Person Households | 27 (33.8%) | 3 (3.7%) |
| 3-Person Households | 6 (7.5%) | 0 (0.0%) |
| 4-Person Households | 8 (10.0%) | 0 (0.0%) |
| 5-Person Households | 4 (5.0%) | 0 (0.0%) |
| 6-Person Households | 12 (15.0%) | 0 (0.0%) |
| 7+ Person Households | 1 (1.3%) | 0 (0.0%) |
| Total | 58 (72.5%) | 22 (27.5%) |
Female Fertility in Kingston
Fertility by Age in Kingston
Average fertility rate in Kingston is 105.0 births per 1,000 women. Women in the age bracket of 20 to 34 years have the highest fertility rate with 222.0 births per 1,000 women. Women in the age bracket of 20 to 34 years acount for 100.0% of all women with births.
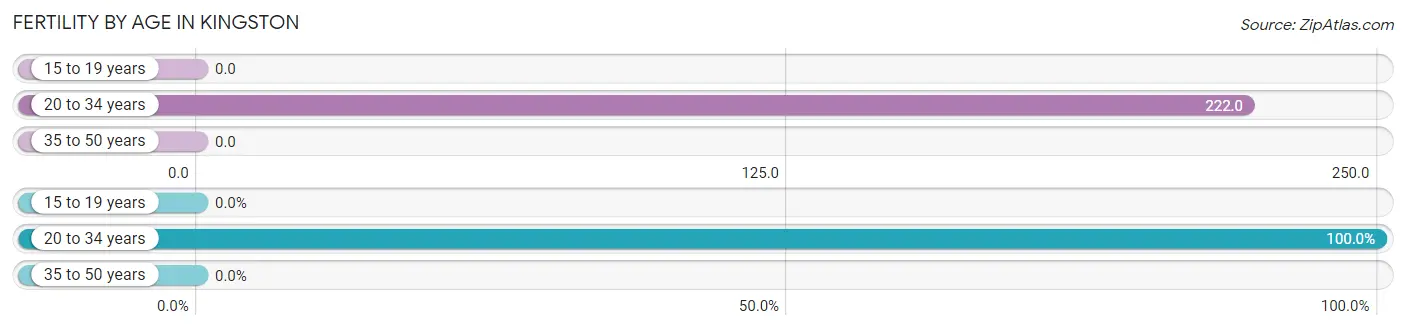
| Age Bracket | Women with Births | Births / 1,000 Women |
| 15 to 19 years | 0 (0.0%) | 0.0 |
| 20 to 34 years | 6 (100.0%) | 222.0 |
| 35 to 50 years | 0 (0.0%) | 0.0 |
| Total | 6 (100.0%) | 105.0 |
Fertility by Age by Marriage Status in Kingston
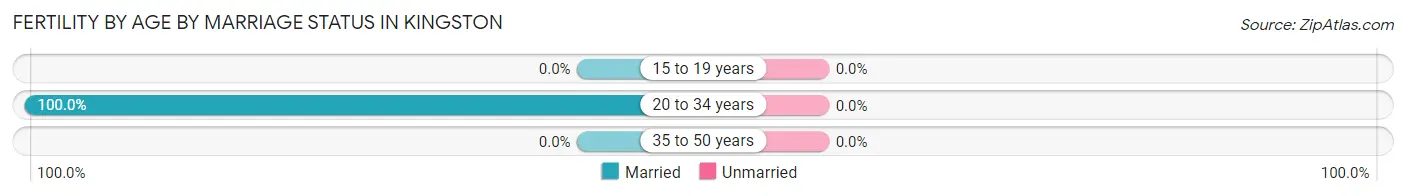
| Age Bracket | Married | Unmarried |
| 15 to 19 years | 0 (0.0%) | 0 (0.0%) |
| 20 to 34 years | 6 (100.0%) | 0 (0.0%) |
| 35 to 50 years | 0 (0.0%) | 0 (0.0%) |
| Total | 6 (100.0%) | 0 (0.0%) |
Fertility by Education in Kingston
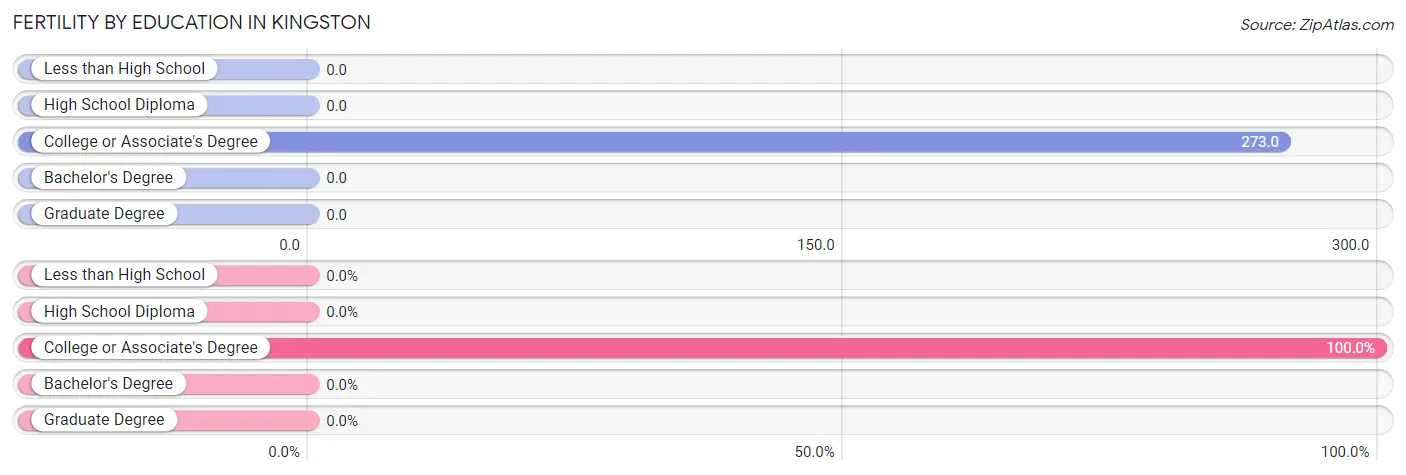
| Educational Attainment | Women with Births | Births / 1,000 Women |
| Less than High School | 0 (0.0%) | 0.0 |
| High School Diploma | 0 (0.0%) | 0.0 |
| College or Associate's Degree | 6 (100.0%) | 273.0 |
| Bachelor's Degree | 0 (0.0%) | 0.0 |
| Graduate Degree | 0 (0.0%) | 0.0 |
| Total | 6 (100.0%) | 105.0 |
Fertility by Education by Marriage Status in Kingston
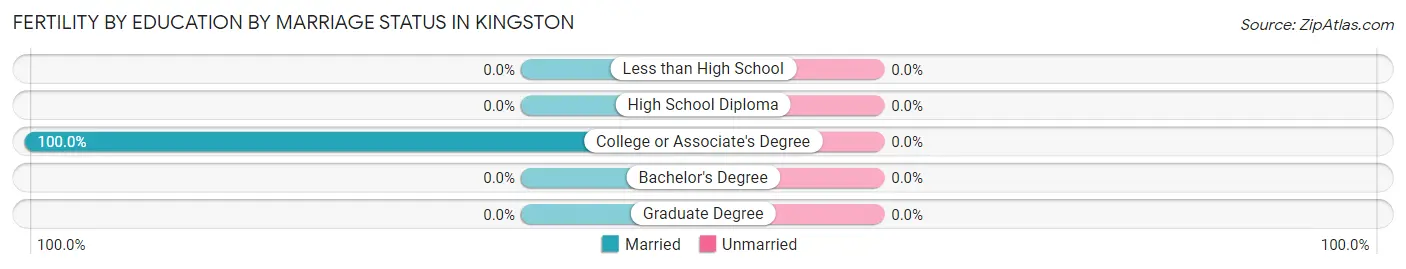
| Educational Attainment | Married | Unmarried |
| Less than High School | 0 (0.0%) | 0 (0.0%) |
| High School Diploma | 0 (0.0%) | 0 (0.0%) |
| College or Associate's Degree | 6 (100.0%) | 0 (0.0%) |
| Bachelor's Degree | 0 (0.0%) | 0 (0.0%) |
| Graduate Degree | 0 (0.0%) | 0 (0.0%) |
| Total | 6 (100.0%) | 0 (0.0%) |
Employment Characteristics in Kingston
Employment by Class of Employer in Kingston
Among the 100 employed individuals in Kingston, private company employees (74 | 74.0%), not-for-profit organizations (10 | 10.0%), and self-employed (not incorporated) (5 | 5.0%) make up the most common classes of employment.
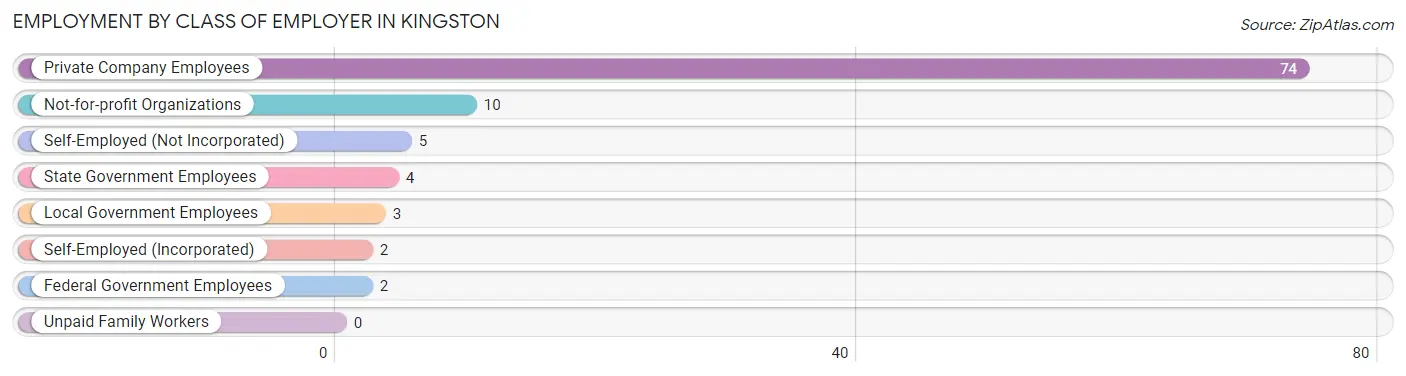
| Employer Class | # Employees | % Employees |
| Private Company Employees | 74 | 74.0% |
| Self-Employed (Incorporated) | 2 | 2.0% |
| Self-Employed (Not Incorporated) | 5 | 5.0% |
| Not-for-profit Organizations | 10 | 10.0% |
| Local Government Employees | 3 | 3.0% |
| State Government Employees | 4 | 4.0% |
| Federal Government Employees | 2 | 2.0% |
| Unpaid Family Workers | 0 | 0.0% |
| Total | 100 | 100.0% |
Employment Status by Age in Kingston
According to the labor force statistics for Kingston, out of the total population over 16 years of age (163), 65.0% or 106 individuals are in the labor force, with 1.0% or 1 of them unemployed. The age group with the highest labor force participation rate is 45 to 54 years, with 100.0% or 9 individuals in the labor force. Within the labor force, the 60 to 64 years age range has the highest percentage of unemployed individuals, with 25.0% or 1 of them being unemployed.
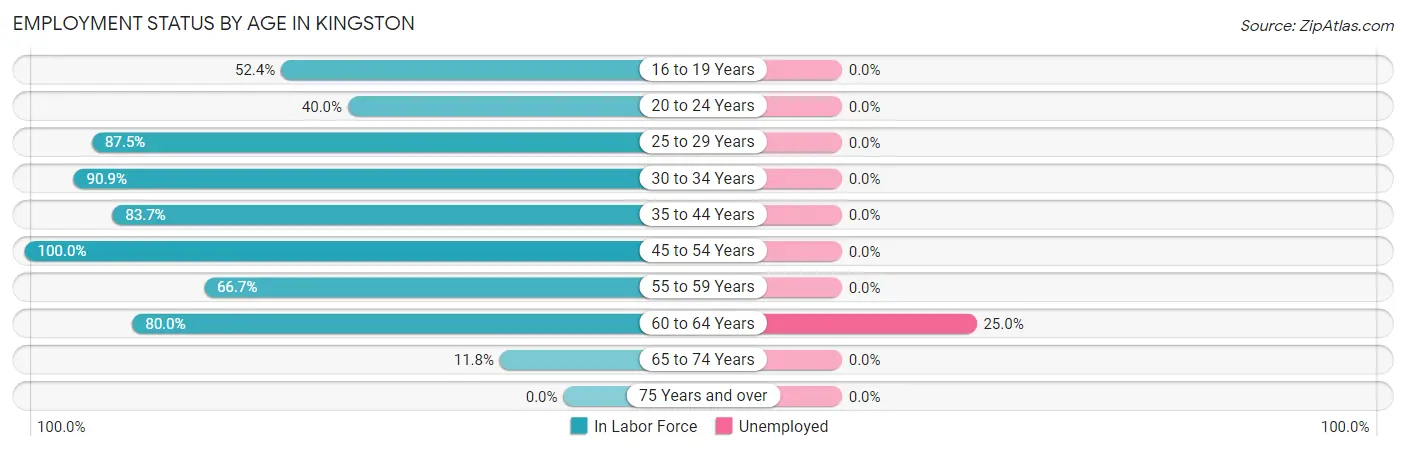
| Age Bracket | In Labor Force | Unemployed |
| 16 to 19 Years | 11 (52.4%) | 0 (0.0%) |
| 20 to 24 Years | 6 (40.0%) | 0 (0.0%) |
| 25 to 29 Years | 14 (87.5%) | 0 (0.0%) |
| 30 to 34 Years | 20 (90.9%) | 0 (0.0%) |
| 35 to 44 Years | 36 (83.7%) | 0 (0.0%) |
| 45 to 54 Years | 9 (100.0%) | 0 (0.0%) |
| 55 to 59 Years | 4 (66.7%) | 0 (0.0%) |
| 60 to 64 Years | 4 (80.0%) | 1 (25.0%) |
| 65 to 74 Years | 2 (11.8%) | 0 (0.0%) |
| 75 Years and over | 0 (0.0%) | 0 (0.0%) |
| Total | 106 (65.0%) | 1 (1.0%) |
Employment Status by Educational Attainment in Kingston
According to labor force statistics for Kingston, 86.1% of individuals (87) out of the total population between 25 and 64 years of age (101) are in the labor force, with 1.1% or 1 of them being unemployed. The group with the highest labor force participation rate are those with the educational attainment of less than high school, with 100.0% or 3 individuals in the labor force. Within the labor force, individuals with less than high school education have the highest percentage of unemployment, with 33.3% or 1 of them being unemployed.
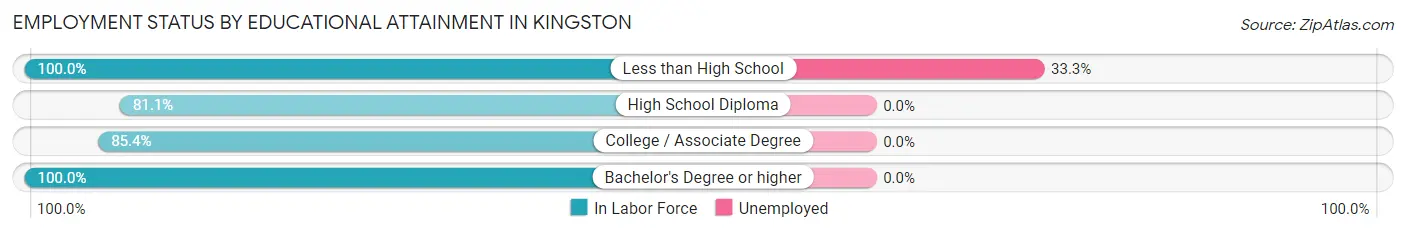
| Educational Attainment | In Labor Force | Unemployed |
| Less than High School | 3 (100.0%) | 1 (33.3%) |
| High School Diploma | 30 (81.1%) | 0 (0.0%) |
| College / Associate Degree | 41 (85.4%) | 0 (0.0%) |
| Bachelor's Degree or higher | 13 (100.0%) | 0 (0.0%) |
| Total | 87 (86.1%) | 1 (1.1%) |
Employment Occupations by Sex in Kingston
Management, Business, Science and Arts Occupations
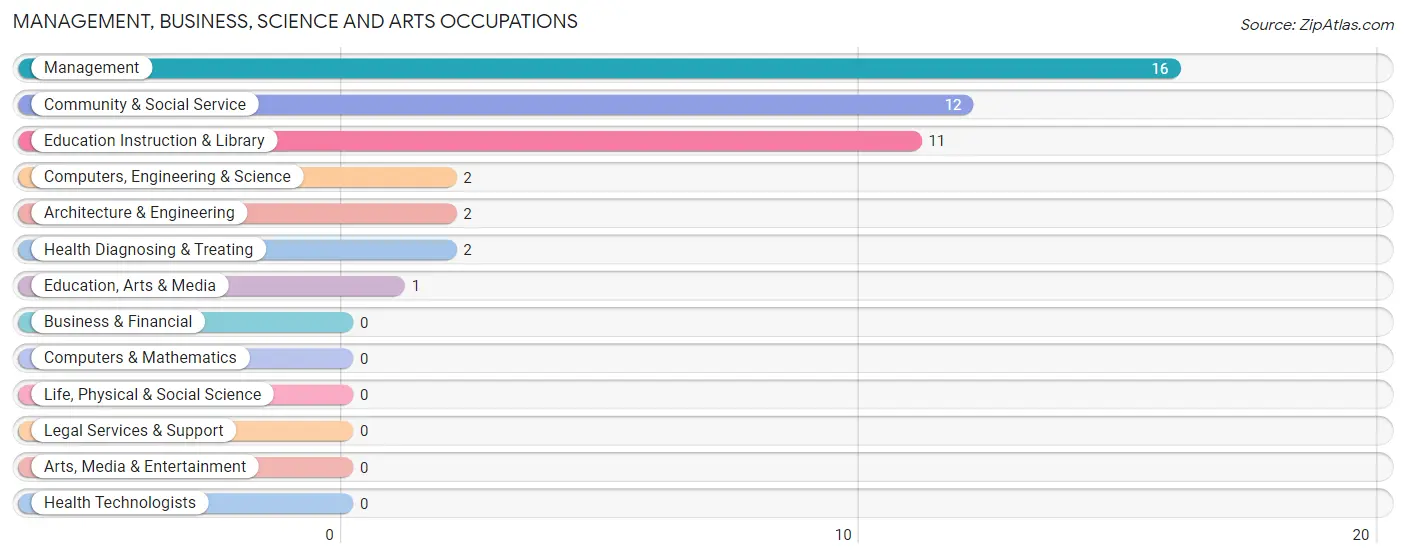
The most common Management, Business, Science and Arts occupations in Kingston are Management (16 | 15.5%), Community & Social Service (12 | 11.7%), Education Instruction & Library (11 | 10.7%), Computers, Engineering & Science (2 | 1.9%), and Architecture & Engineering (2 | 1.9%).
Management, Business, Science and Arts Occupations by Sex
Within the Management, Business, Science and Arts occupations in Kingston, the most male-oriented occupations are Computers, Engineering & Science (100.0%), Architecture & Engineering (100.0%), and Management (87.5%), while the most female-oriented occupations are Community & Social Service (100.0%), Education, Arts & Media (100.0%), and Education Instruction & Library (100.0%).
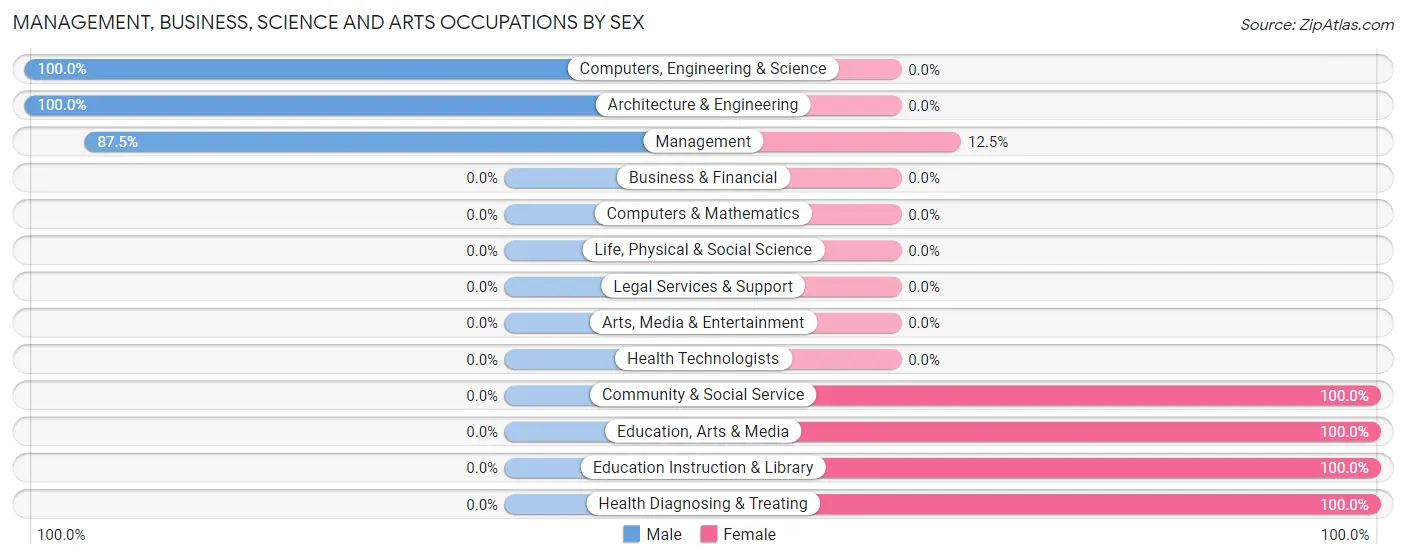
| Occupation | Male | Female |
| Management | 14 (87.5%) | 2 (12.5%) |
| Business & Financial | 0 (0.0%) | 0 (0.0%) |
| Computers, Engineering & Science | 2 (100.0%) | 0 (0.0%) |
| Computers & Mathematics | 0 (0.0%) | 0 (0.0%) |
| Architecture & Engineering | 2 (100.0%) | 0 (0.0%) |
| Life, Physical & Social Science | 0 (0.0%) | 0 (0.0%) |
| Community & Social Service | 0 (0.0%) | 12 (100.0%) |
| Education, Arts & Media | 0 (0.0%) | 1 (100.0%) |
| Legal Services & Support | 0 (0.0%) | 0 (0.0%) |
| Education Instruction & Library | 0 (0.0%) | 11 (100.0%) |
| Arts, Media & Entertainment | 0 (0.0%) | 0 (0.0%) |
| Health Diagnosing & Treating | 0 (0.0%) | 2 (100.0%) |
| Health Technologists | 0 (0.0%) | 0 (0.0%) |
| Total (Category) | 16 (50.0%) | 16 (50.0%) |
| Total (Overall) | 67 (65.0%) | 36 (34.9%) |
Services Occupations
The most common Services occupations in Kingston are Healthcare Support (5 | 4.9%), Food Preparation & Serving (5 | 4.9%), and Cleaning & Maintenance (2 | 1.9%).
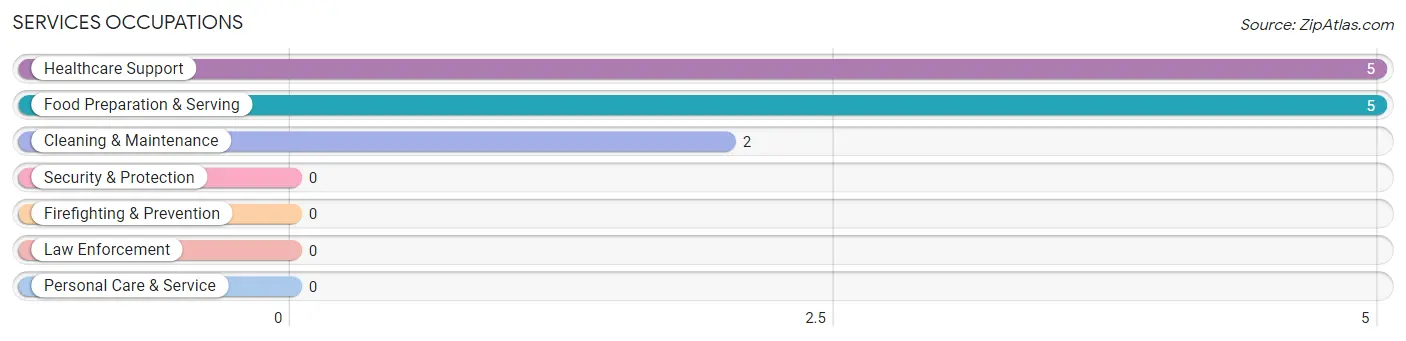
Services Occupations by Sex
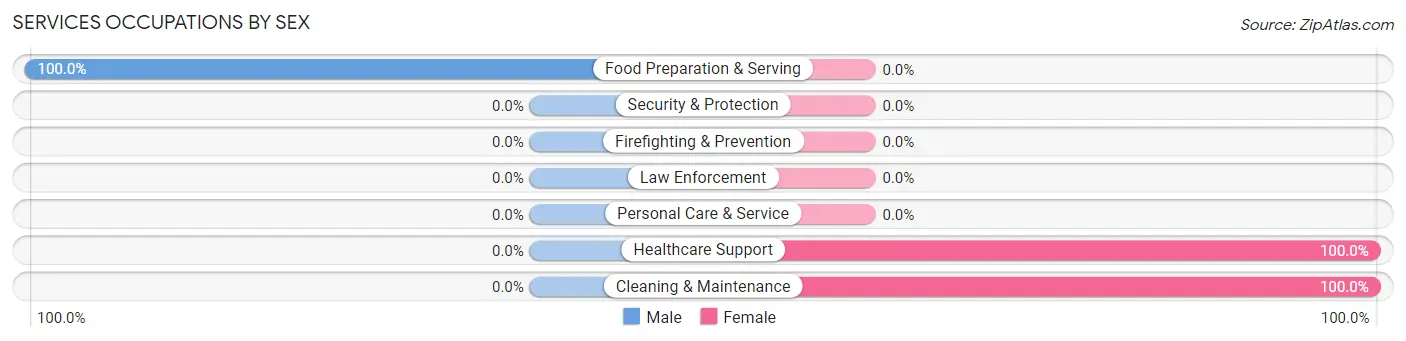
| Occupation | Male | Female |
| Healthcare Support | 0 (0.0%) | 5 (100.0%) |
| Security & Protection | 0 (0.0%) | 0 (0.0%) |
| Firefighting & Prevention | 0 (0.0%) | 0 (0.0%) |
| Law Enforcement | 0 (0.0%) | 0 (0.0%) |
| Food Preparation & Serving | 5 (100.0%) | 0 (0.0%) |
| Cleaning & Maintenance | 0 (0.0%) | 2 (100.0%) |
| Personal Care & Service | 0 (0.0%) | 0 (0.0%) |
| Total (Category) | 5 (41.7%) | 7 (58.3%) |
| Total (Overall) | 67 (65.0%) | 36 (34.9%) |
Sales and Office Occupations
The most common Sales and Office occupations in Kingston are Office & Administration (13 | 12.6%), and Sales & Related (3 | 2.9%).
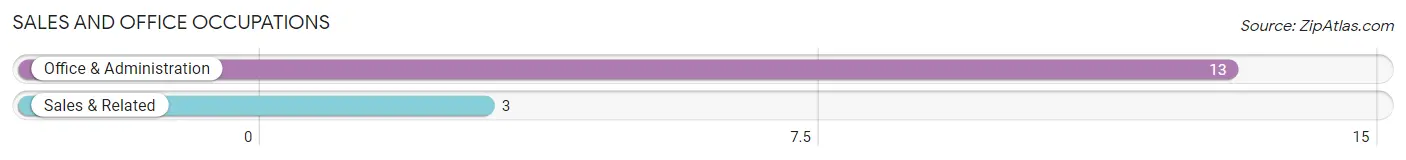
Sales and Office Occupations by Sex
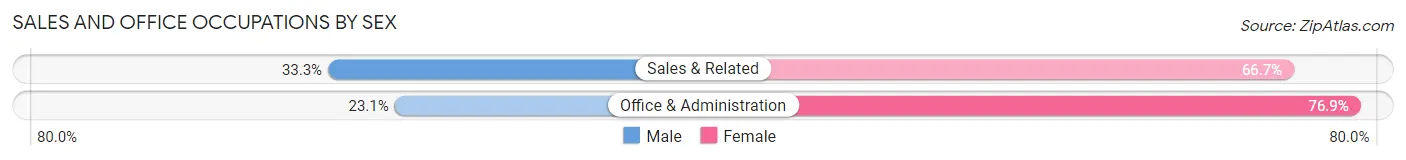
| Occupation | Male | Female |
| Sales & Related | 1 (33.3%) | 2 (66.7%) |
| Office & Administration | 3 (23.1%) | 10 (76.9%) |
| Total (Category) | 4 (25.0%) | 12 (75.0%) |
| Total (Overall) | 67 (65.0%) | 36 (34.9%) |
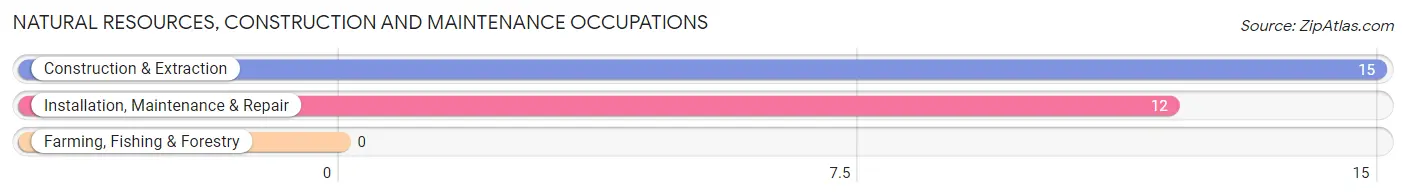
Natural Resources, Construction and Maintenance Occupations
The most common Natural Resources, Construction and Maintenance occupations in Kingston are Construction & Extraction (15 | 14.6%), and Installation, Maintenance & Repair (12 | 11.7%).
Natural Resources, Construction and Maintenance Occupations by Sex
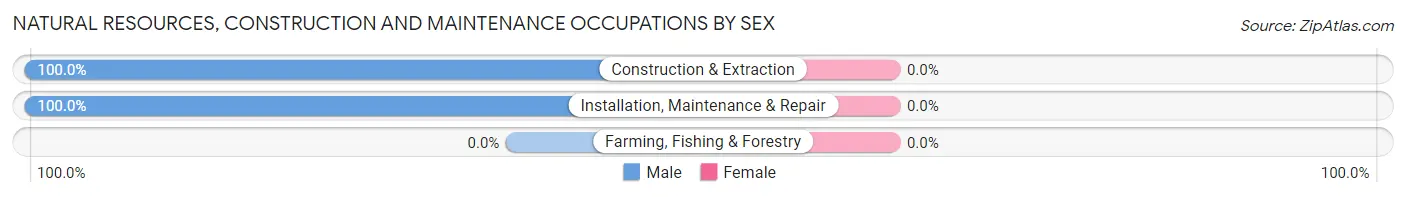
| Occupation | Male | Female |
| Farming, Fishing & Forestry | 0 (0.0%) | 0 (0.0%) |
| Construction & Extraction | 15 (100.0%) | 0 (0.0%) |
| Installation, Maintenance & Repair | 12 (100.0%) | 0 (0.0%) |
| Total (Category) | 27 (100.0%) | 0 (0.0%) |
| Total (Overall) | 67 (65.0%) | 36 (34.9%) |
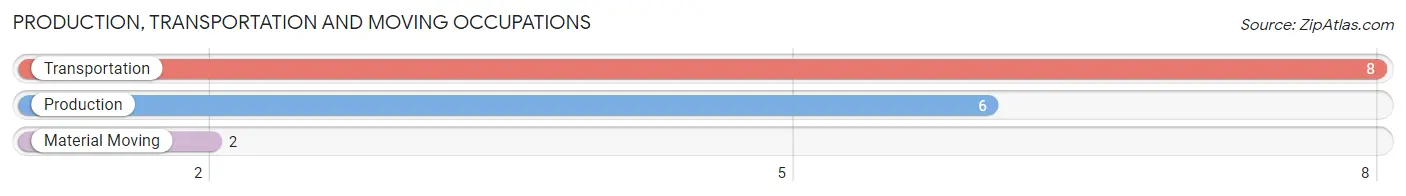
Production, Transportation and Moving Occupations
The most common Production, Transportation and Moving occupations in Kingston are Transportation (8 | 7.8%), Production (6 | 5.8%), and Material Moving (2 | 1.9%).
Production, Transportation and Moving Occupations by Sex
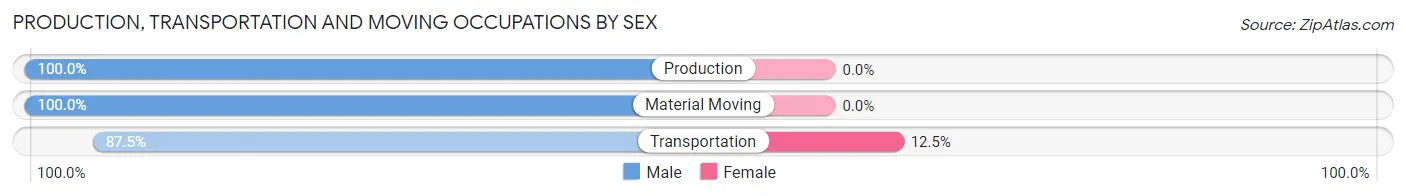
| Occupation | Male | Female |
| Production | 6 (100.0%) | 0 (0.0%) |
| Transportation | 7 (87.5%) | 1 (12.5%) |
| Material Moving | 2 (100.0%) | 0 (0.0%) |
| Total (Category) | 15 (93.8%) | 1 (6.2%) |
| Total (Overall) | 67 (65.0%) | 36 (34.9%) |
Employment Industries by Sex in Kingston
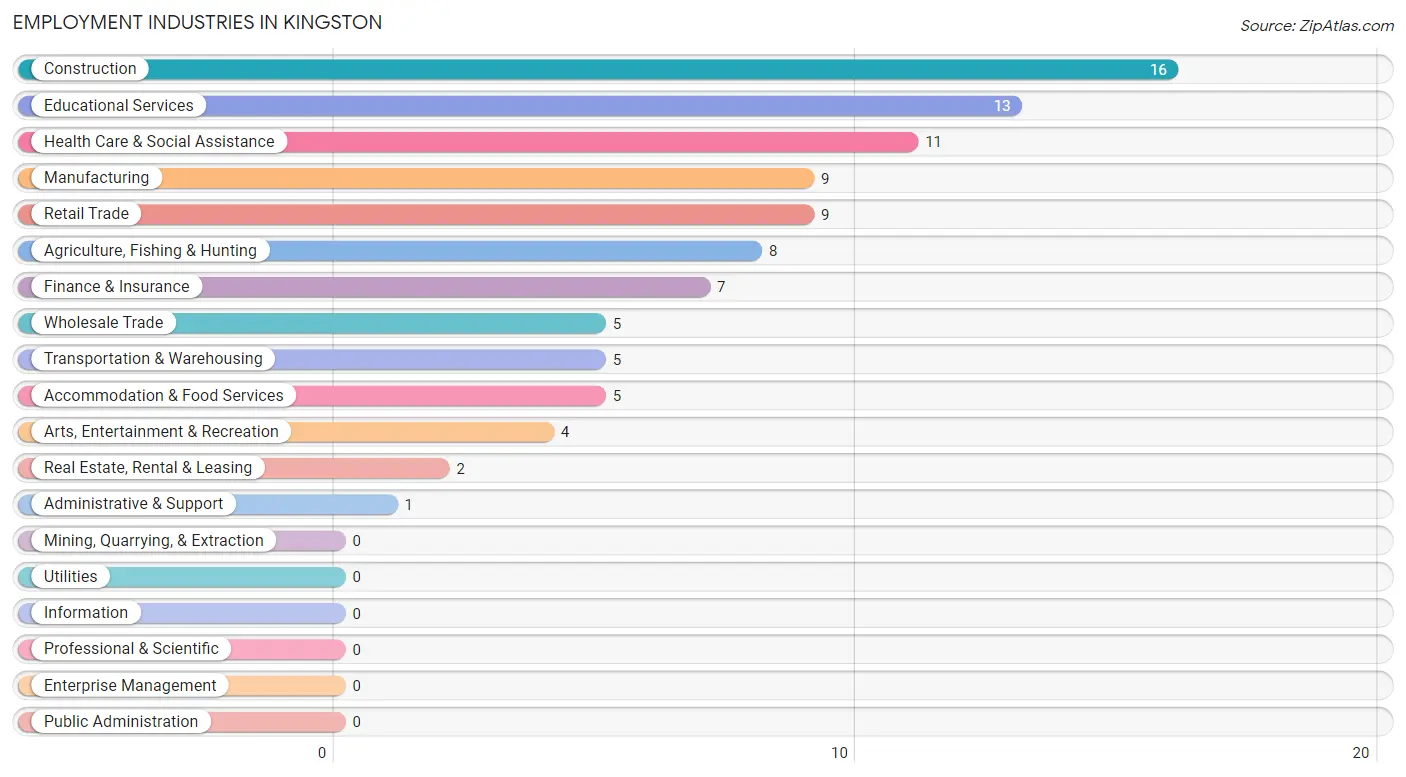
Employment Industries in Kingston
The major employment industries in Kingston include Construction (16 | 15.5%), Educational Services (13 | 12.6%), Health Care & Social Assistance (11 | 10.7%), Manufacturing (9 | 8.7%), and Retail Trade (9 | 8.7%).
Employment Industries by Sex in Kingston
The Kingston industries that see more men than women are Agriculture, Fishing & Hunting (100.0%), Construction (100.0%), and Manufacturing (100.0%), whereas the industries that tend to have a higher number of women are Finance & Insurance (100.0%), Real Estate, Rental & Leasing (100.0%), and Health Care & Social Assistance (100.0%).
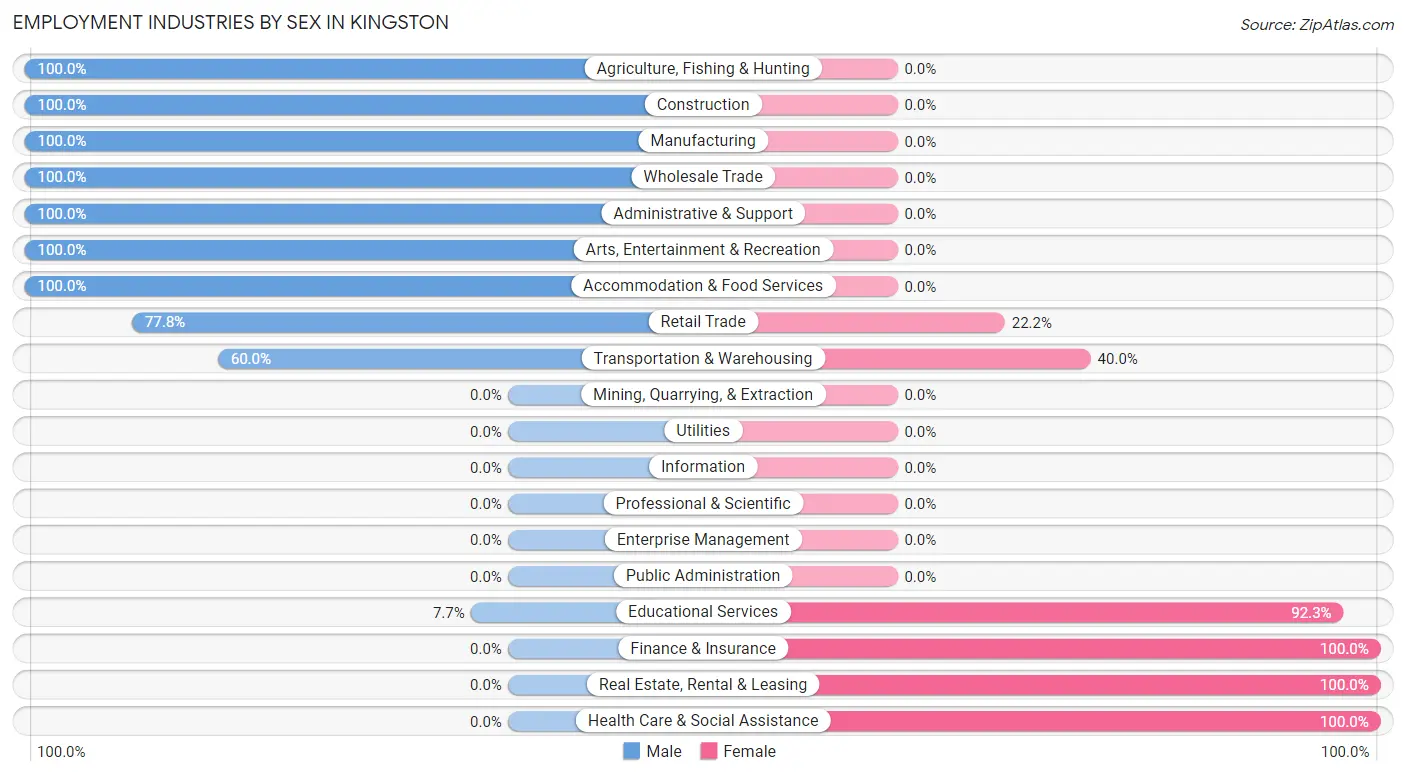
| Industry | Male | Female |
| Agriculture, Fishing & Hunting | 8 (100.0%) | 0 (0.0%) |
| Mining, Quarrying, & Extraction | 0 (0.0%) | 0 (0.0%) |
| Construction | 16 (100.0%) | 0 (0.0%) |
| Manufacturing | 9 (100.0%) | 0 (0.0%) |
| Wholesale Trade | 5 (100.0%) | 0 (0.0%) |
| Retail Trade | 7 (77.8%) | 2 (22.2%) |
| Transportation & Warehousing | 3 (60.0%) | 2 (40.0%) |
| Utilities | 0 (0.0%) | 0 (0.0%) |
| Information | 0 (0.0%) | 0 (0.0%) |
| Finance & Insurance | 0 (0.0%) | 7 (100.0%) |
| Real Estate, Rental & Leasing | 0 (0.0%) | 2 (100.0%) |
| Professional & Scientific | 0 (0.0%) | 0 (0.0%) |
| Enterprise Management | 0 (0.0%) | 0 (0.0%) |
| Administrative & Support | 1 (100.0%) | 0 (0.0%) |
| Educational Services | 1 (7.7%) | 12 (92.3%) |
| Health Care & Social Assistance | 0 (0.0%) | 11 (100.0%) |
| Arts, Entertainment & Recreation | 4 (100.0%) | 0 (0.0%) |
| Accommodation & Food Services | 5 (100.0%) | 0 (0.0%) |
| Public Administration | 0 (0.0%) | 0 (0.0%) |
| Total | 67 (65.0%) | 36 (34.9%) |
Education in Kingston
School Enrollment in Kingston
The most common levels of schooling among the 40 students in Kingston are elementary school (15 | 37.5%), high school (13 | 32.5%), and middle school (8 | 20.0%).
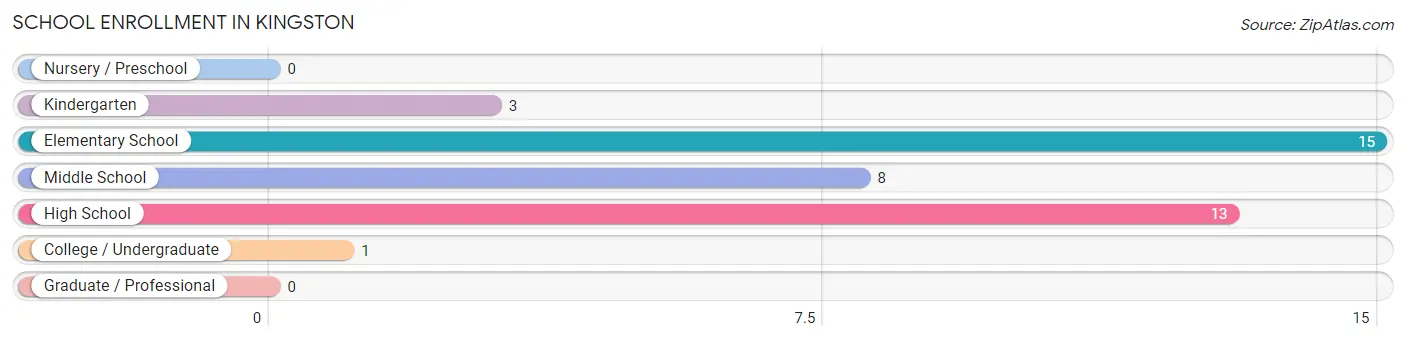
| School Level | # Students | % Students |
| Nursery / Preschool | 0 | 0.0% |
| Kindergarten | 3 | 7.5% |
| Elementary School | 15 | 37.5% |
| Middle School | 8 | 20.0% |
| High School | 13 | 32.5% |
| College / Undergraduate | 1 | 2.5% |
| Graduate / Professional | 0 | 0.0% |
| Total | 40 | 100.0% |
School Enrollment by Age by Funding Source in Kingston
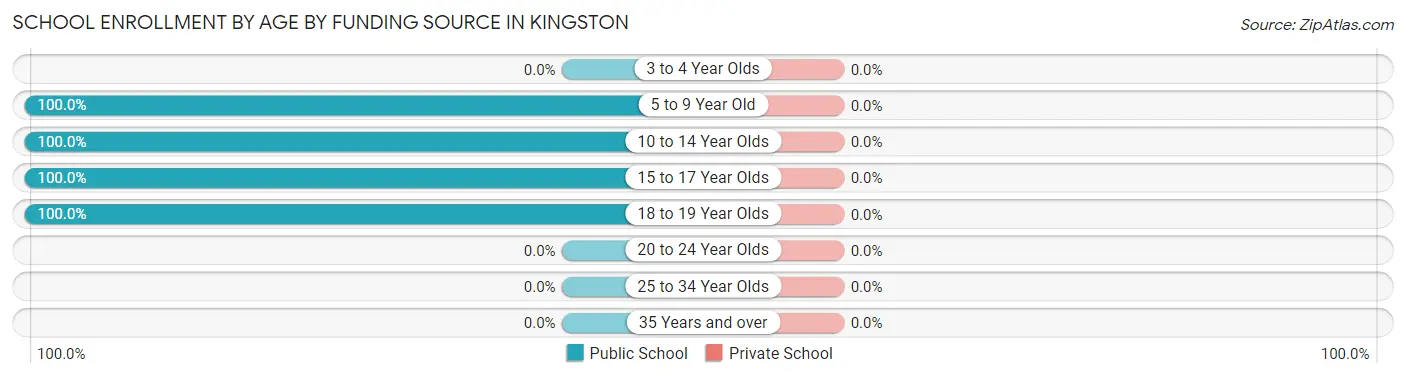
| Age Bracket | Public School | Private School |
| 3 to 4 Year Olds | 0 (0.0%) | 0 (0.0%) |
| 5 to 9 Year Old | 18 (100.0%) | 0 (0.0%) |
| 10 to 14 Year Olds | 8 (100.0%) | 0 (0.0%) |
| 15 to 17 Year Olds | 13 (100.0%) | 0 (0.0%) |
| 18 to 19 Year Olds | 1 (100.0%) | 0 (0.0%) |
| 20 to 24 Year Olds | 0 (0.0%) | 0 (0.0%) |
| 25 to 34 Year Olds | 0 (0.0%) | 0 (0.0%) |
| 35 Years and over | 0 (0.0%) | 0 (0.0%) |
| Total | 40 (100.0%) | 0 (0.0%) |
Educational Attainment by Field of Study in Kingston
Education (5 | 35.7%), business (4 | 28.6%), science & technology (2 | 14.3%), literature & languages (1 | 7.1%), and liberal arts & history (1 | 7.1%) are the most common fields of study among 14 individuals in Kingston who have obtained a bachelor's degree or higher.
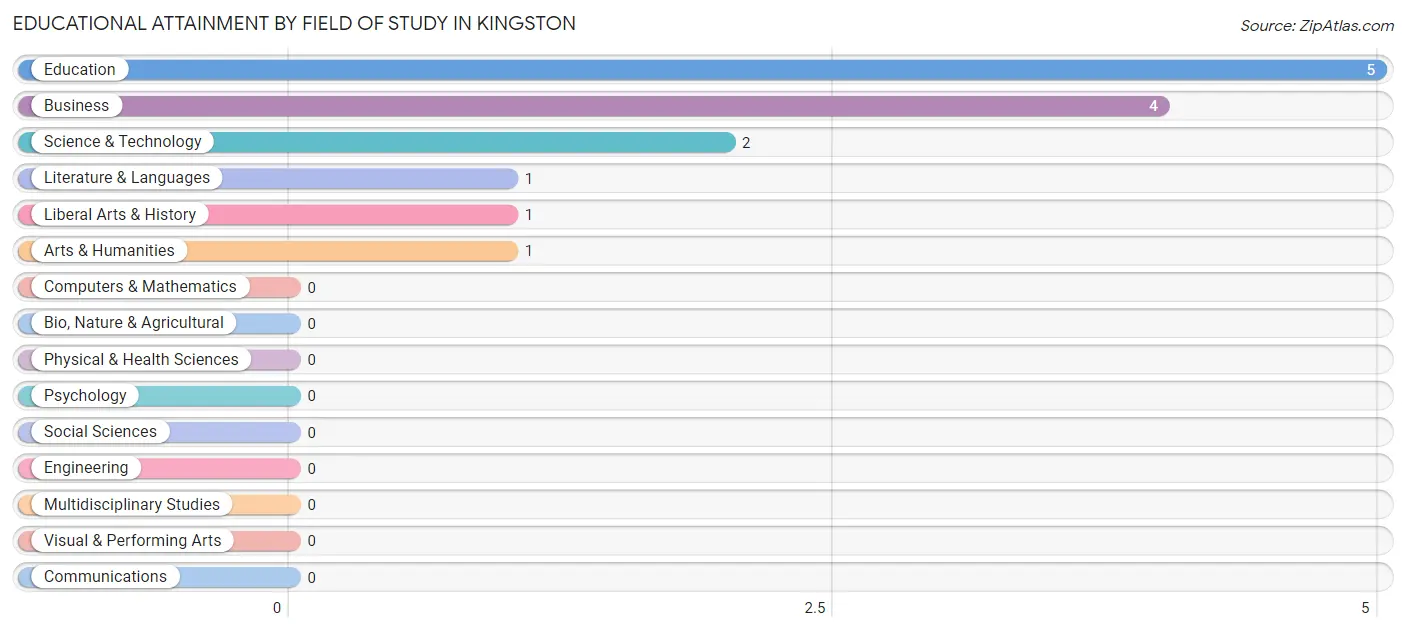
| Field of Study | # Graduates | % Graduates |
| Computers & Mathematics | 0 | 0.0% |
| Bio, Nature & Agricultural | 0 | 0.0% |
| Physical & Health Sciences | 0 | 0.0% |
| Psychology | 0 | 0.0% |
| Social Sciences | 0 | 0.0% |
| Engineering | 0 | 0.0% |
| Multidisciplinary Studies | 0 | 0.0% |
| Science & Technology | 2 | 14.3% |
| Business | 4 | 28.6% |
| Education | 5 | 35.7% |
| Literature & Languages | 1 | 7.1% |
| Liberal Arts & History | 1 | 7.1% |
| Visual & Performing Arts | 0 | 0.0% |
| Communications | 0 | 0.0% |
| Arts & Humanities | 1 | 7.1% |
| Total | 14 | 100.0% |
Transportation & Commute in Kingston
Vehicle Availability by Sex in Kingston
The most prevalent vehicle ownership categories in Kingston are males with 3 vehicles (26, accounting for 37.7%) and females with 3 vehicles (21, making up 83.9%).
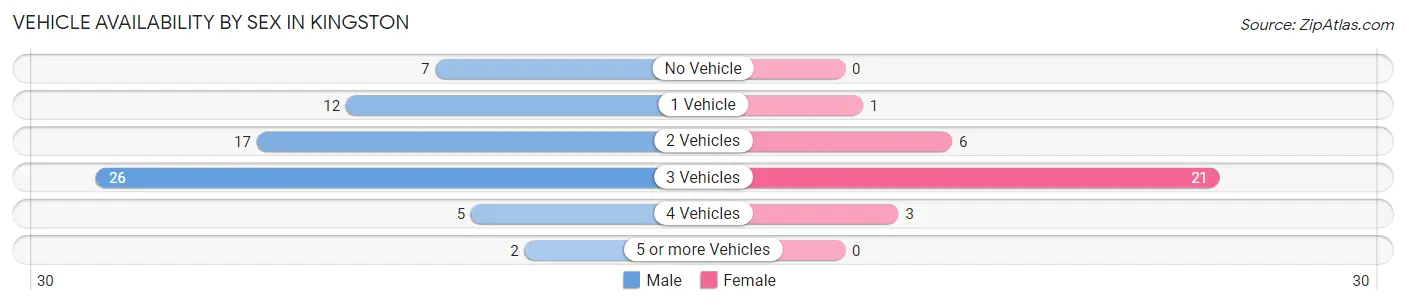
| Vehicles Available | Male | Female |
| No Vehicle | 7 (10.1%) | 0 (0.0%) |
| 1 Vehicle | 12 (17.4%) | 1 (3.2%) |
| 2 Vehicles | 17 (24.6%) | 6 (19.4%) |
| 3 Vehicles | 26 (37.7%) | 21 (67.7%) |
| 4 Vehicles | 5 (7.2%) | 3 (9.7%) |
| 5 or more Vehicles | 2 (2.9%) | 0 (0.0%) |
| Total | 69 (100.0%) | 31 (100.0%) |
Commute Time in Kingston
The most frequently occuring commute durations in Kingston are 20 to 24 minutes (25 commuters, 25.0%), 30 to 34 minutes (16 commuters, 16.0%), and 60 to 89 minutes (14 commuters, 14.0%).
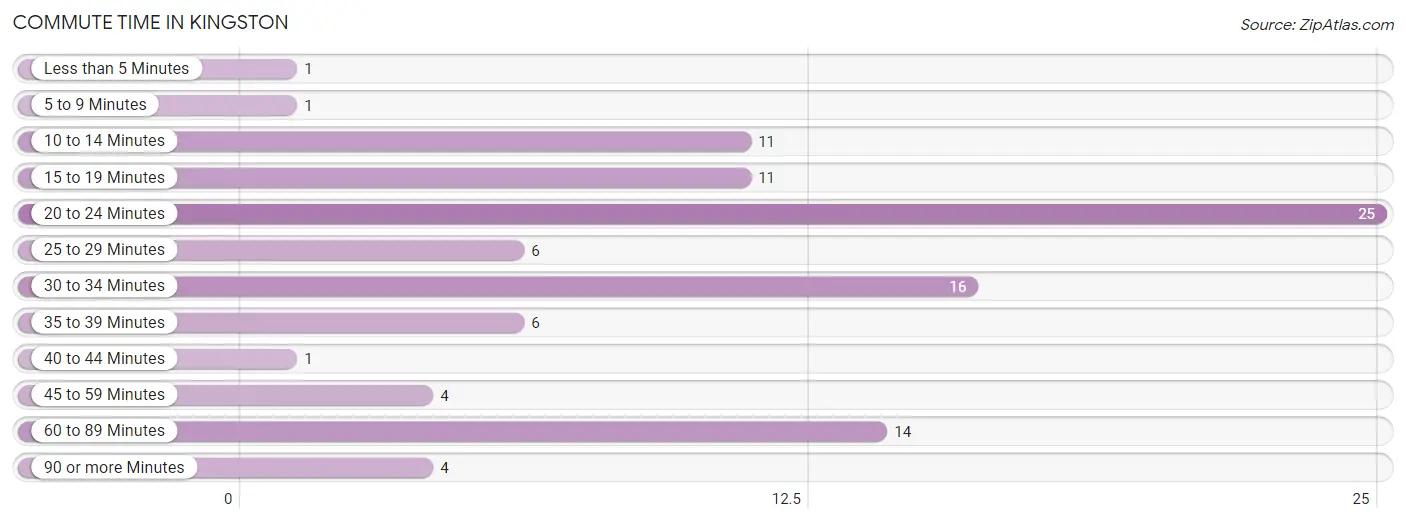
| Commute Time | # Commuters | % Commuters |
| Less than 5 Minutes | 1 | 1.0% |
| 5 to 9 Minutes | 1 | 1.0% |
| 10 to 14 Minutes | 11 | 11.0% |
| 15 to 19 Minutes | 11 | 11.0% |
| 20 to 24 Minutes | 25 | 25.0% |
| 25 to 29 Minutes | 6 | 6.0% |
| 30 to 34 Minutes | 16 | 16.0% |
| 35 to 39 Minutes | 6 | 6.0% |
| 40 to 44 Minutes | 1 | 1.0% |
| 45 to 59 Minutes | 4 | 4.0% |
| 60 to 89 Minutes | 14 | 14.0% |
| 90 or more Minutes | 4 | 4.0% |
Commute Time by Sex in Kingston
The most common commute times in Kingston are 20 to 24 minutes (15 commuters, 21.7%) for males and 20 to 24 minutes (10 commuters, 32.3%) for females.
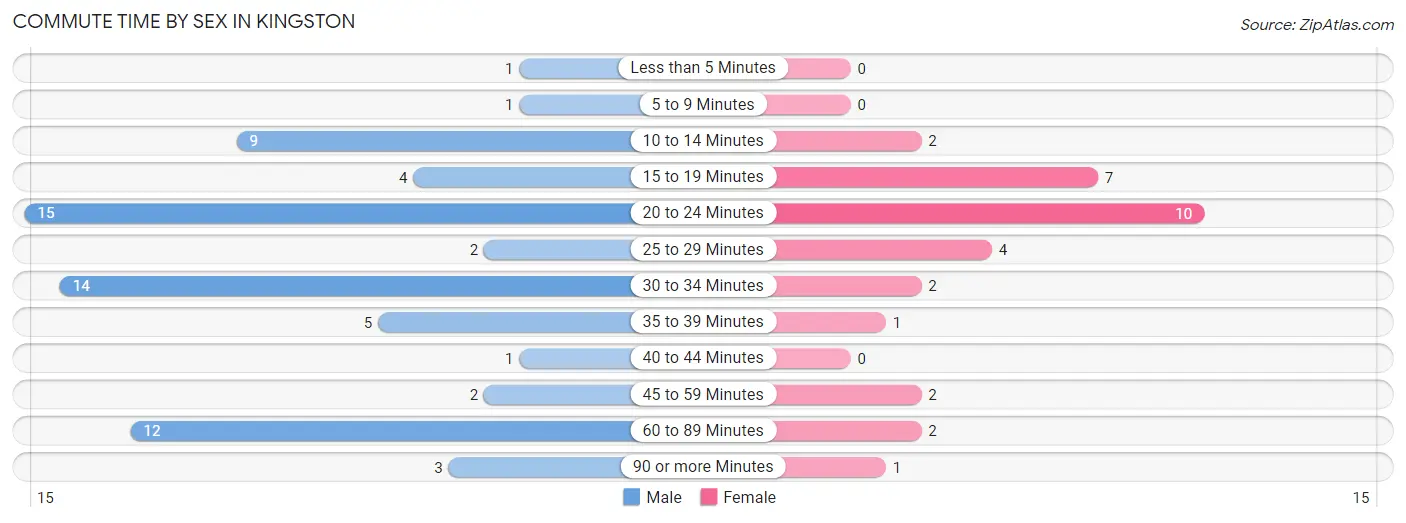
| Commute Time | Male | Female |
| Less than 5 Minutes | 1 (1.5%) | 0 (0.0%) |
| 5 to 9 Minutes | 1 (1.5%) | 0 (0.0%) |
| 10 to 14 Minutes | 9 (13.0%) | 2 (6.5%) |
| 15 to 19 Minutes | 4 (5.8%) | 7 (22.6%) |
| 20 to 24 Minutes | 15 (21.7%) | 10 (32.3%) |
| 25 to 29 Minutes | 2 (2.9%) | 4 (12.9%) |
| 30 to 34 Minutes | 14 (20.3%) | 2 (6.5%) |
| 35 to 39 Minutes | 5 (7.2%) | 1 (3.2%) |
| 40 to 44 Minutes | 1 (1.5%) | 0 (0.0%) |
| 45 to 59 Minutes | 2 (2.9%) | 2 (6.5%) |
| 60 to 89 Minutes | 12 (17.4%) | 2 (6.5%) |
| 90 or more Minutes | 3 (4.3%) | 1 (3.2%) |
Time of Departure to Work by Sex in Kingston
The most frequent times of departure to work in Kingston are 6:30 AM to 6:59 AM (13, 18.8%) for males and 7:00 AM to 7:29 AM (11, 35.5%) for females.
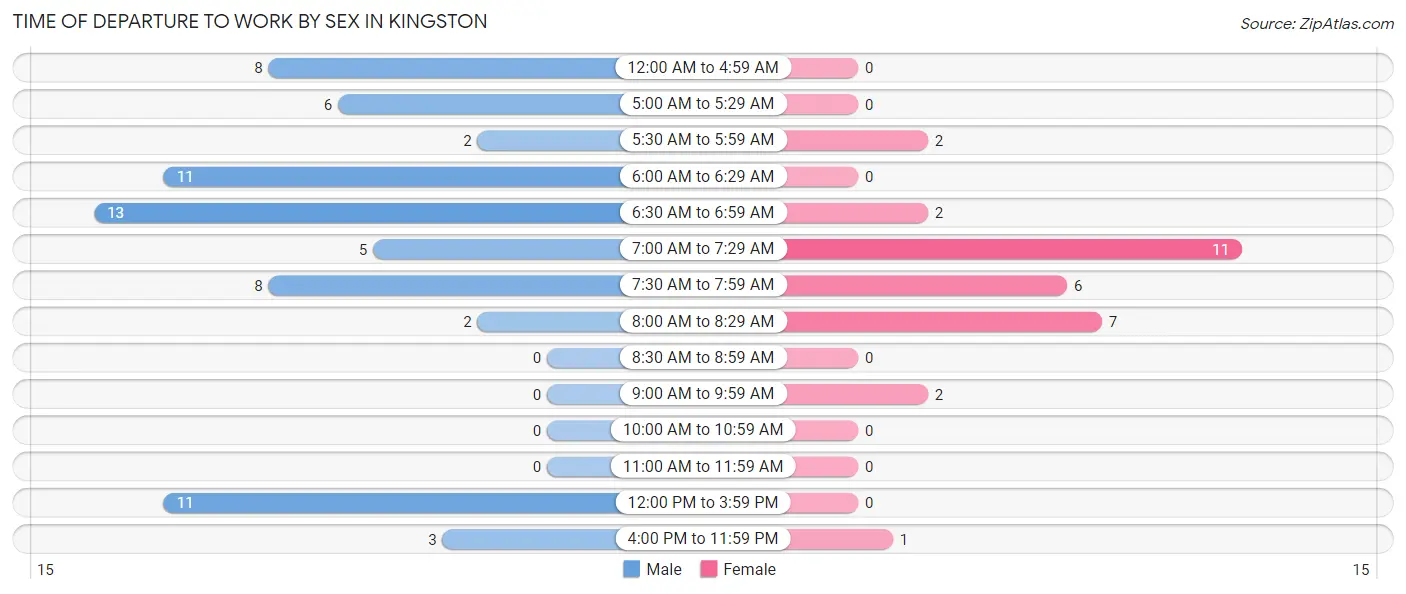
| Time of Departure | Male | Female |
| 12:00 AM to 4:59 AM | 8 (11.6%) | 0 (0.0%) |
| 5:00 AM to 5:29 AM | 6 (8.7%) | 0 (0.0%) |
| 5:30 AM to 5:59 AM | 2 (2.9%) | 2 (6.5%) |
| 6:00 AM to 6:29 AM | 11 (15.9%) | 0 (0.0%) |
| 6:30 AM to 6:59 AM | 13 (18.8%) | 2 (6.5%) |
| 7:00 AM to 7:29 AM | 5 (7.2%) | 11 (35.5%) |
| 7:30 AM to 7:59 AM | 8 (11.6%) | 6 (19.4%) |
| 8:00 AM to 8:29 AM | 2 (2.9%) | 7 (22.6%) |
| 8:30 AM to 8:59 AM | 0 (0.0%) | 0 (0.0%) |
| 9:00 AM to 9:59 AM | 0 (0.0%) | 2 (6.5%) |
| 10:00 AM to 10:59 AM | 0 (0.0%) | 0 (0.0%) |
| 11:00 AM to 11:59 AM | 0 (0.0%) | 0 (0.0%) |
| 12:00 PM to 3:59 PM | 11 (15.9%) | 0 (0.0%) |
| 4:00 PM to 11:59 PM | 3 (4.3%) | 1 (3.2%) |
| Total | 69 (100.0%) | 31 (100.0%) |
Housing Occupancy in Kingston
Occupancy by Ownership in Kingston
Of the total 80 dwellings in Kingston, owner-occupied units account for 63 (78.7%), while renter-occupied units make up 17 (21.2%).
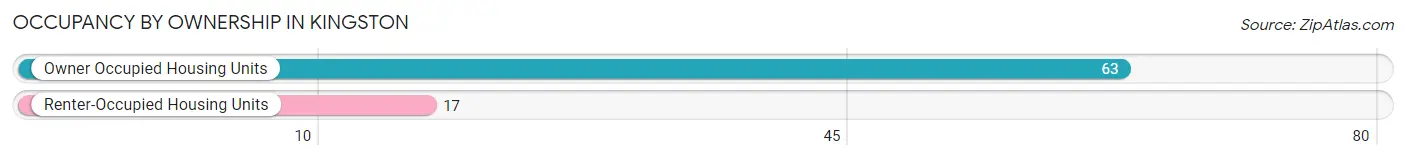
| Occupancy | # Housing Units | % Housing Units |
| Owner Occupied Housing Units | 63 | 78.7% |
| Renter-Occupied Housing Units | 17 | 21.2% |
| Total Occupied Housing Units | 80 | 100.0% |
Occupancy by Household Size in Kingston
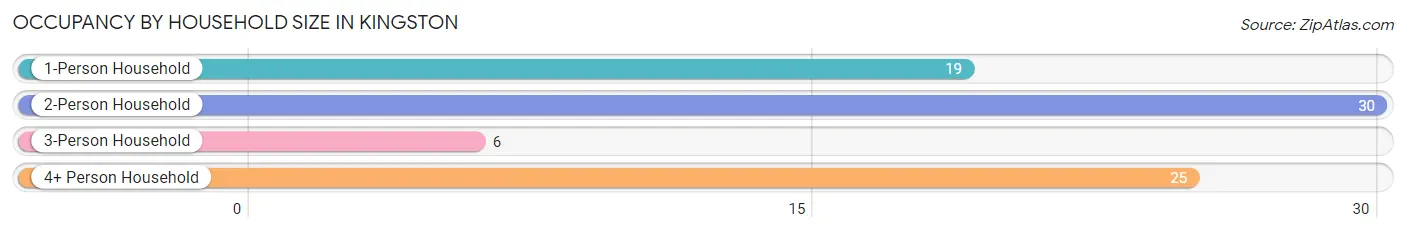
| Household Size | # Housing Units | % Housing Units |
| 1-Person Household | 19 | 23.7% |
| 2-Person Household | 30 | 37.5% |
| 3-Person Household | 6 | 7.5% |
| 4+ Person Household | 25 | 31.2% |
| Total Housing Units | 80 | 100.0% |
Occupancy by Ownership by Household Size in Kingston
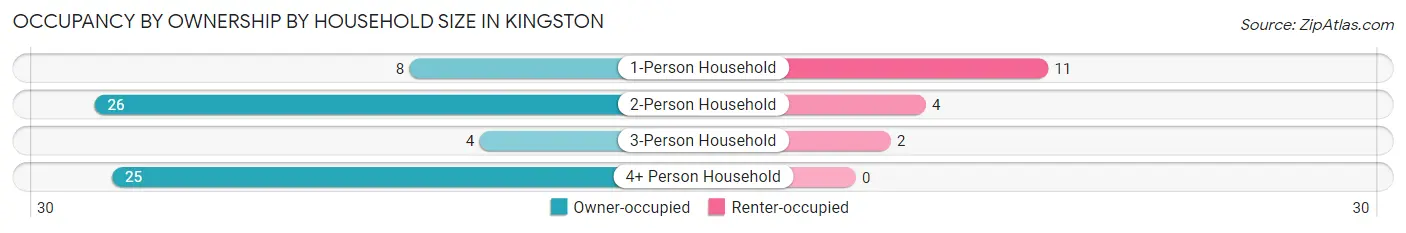
| Household Size | Owner-occupied | Renter-occupied |
| 1-Person Household | 8 (42.1%) | 11 (57.9%) |
| 2-Person Household | 26 (86.7%) | 4 (13.3%) |
| 3-Person Household | 4 (66.7%) | 2 (33.3%) |
| 4+ Person Household | 25 (100.0%) | 0 (0.0%) |
| Total Housing Units | 63 (78.7%) | 17 (21.2%) |
Occupancy by Educational Attainment in Kingston
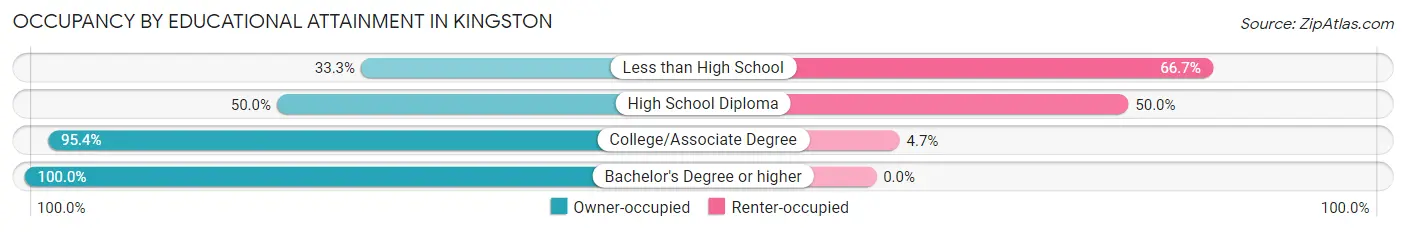
| Household Size | Owner-occupied | Renter-occupied |
| Less than High School | 2 (33.3%) | 4 (66.7%) |
| High School Diploma | 11 (50.0%) | 11 (50.0%) |
| College/Associate Degree | 41 (95.4%) | 2 (4.6%) |
| Bachelor's Degree or higher | 9 (100.0%) | 0 (0.0%) |
Occupancy by Age of Householder in Kingston
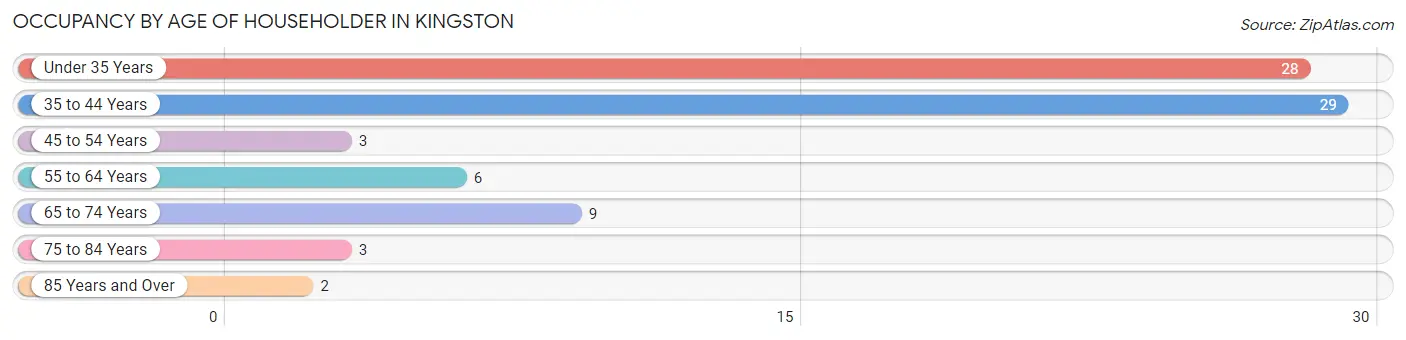
| Age Bracket | # Households | % Households |
| Under 35 Years | 28 | 35.0% |
| 35 to 44 Years | 29 | 36.2% |
| 45 to 54 Years | 3 | 3.7% |
| 55 to 64 Years | 6 | 7.5% |
| 65 to 74 Years | 9 | 11.3% |
| 75 to 84 Years | 3 | 3.7% |
| 85 Years and Over | 2 | 2.5% |
| Total | 80 | 100.0% |
Housing Finances in Kingston
Median Income by Occupancy in Kingston
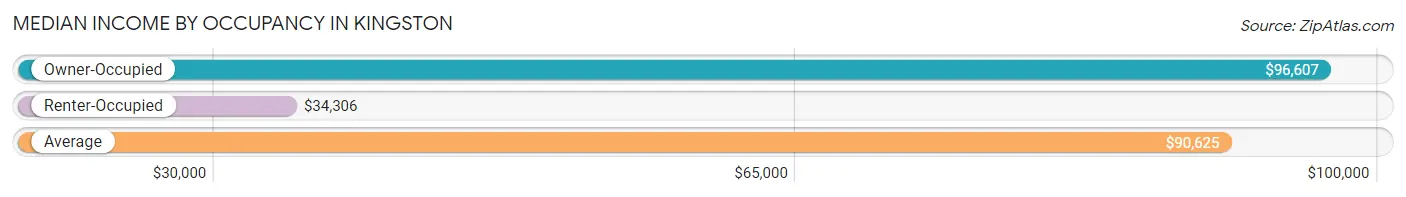
| Occupancy Type | # Households | Median Income |
| Owner-Occupied | 63 (78.7%) | $96,607 |
| Renter-Occupied | 17 (21.2%) | $34,306 |
| Average | 80 (100.0%) | $90,625 |
Occupancy by Householder Income Bracket in Kingston
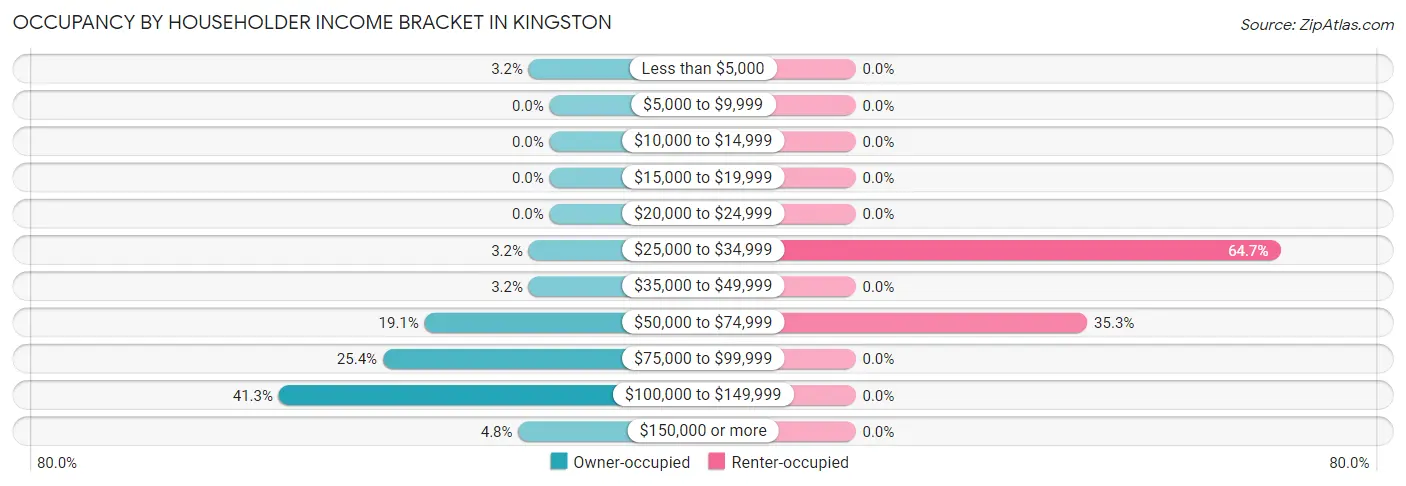
| Income Bracket | Owner-occupied | Renter-occupied |
| Less than $5,000 | 2 (3.2%) | 0 (0.0%) |
| $5,000 to $9,999 | 0 (0.0%) | 0 (0.0%) |
| $10,000 to $14,999 | 0 (0.0%) | 0 (0.0%) |
| $15,000 to $19,999 | 0 (0.0%) | 0 (0.0%) |
| $20,000 to $24,999 | 0 (0.0%) | 0 (0.0%) |
| $25,000 to $34,999 | 2 (3.2%) | 11 (64.7%) |
| $35,000 to $49,999 | 2 (3.2%) | 0 (0.0%) |
| $50,000 to $74,999 | 12 (19.1%) | 6 (35.3%) |
| $75,000 to $99,999 | 16 (25.4%) | 0 (0.0%) |
| $100,000 to $149,999 | 26 (41.3%) | 0 (0.0%) |
| $150,000 or more | 3 (4.8%) | 0 (0.0%) |
| Total | 63 (100.0%) | 17 (100.0%) |
Monthly Housing Cost Tiers in Kingston
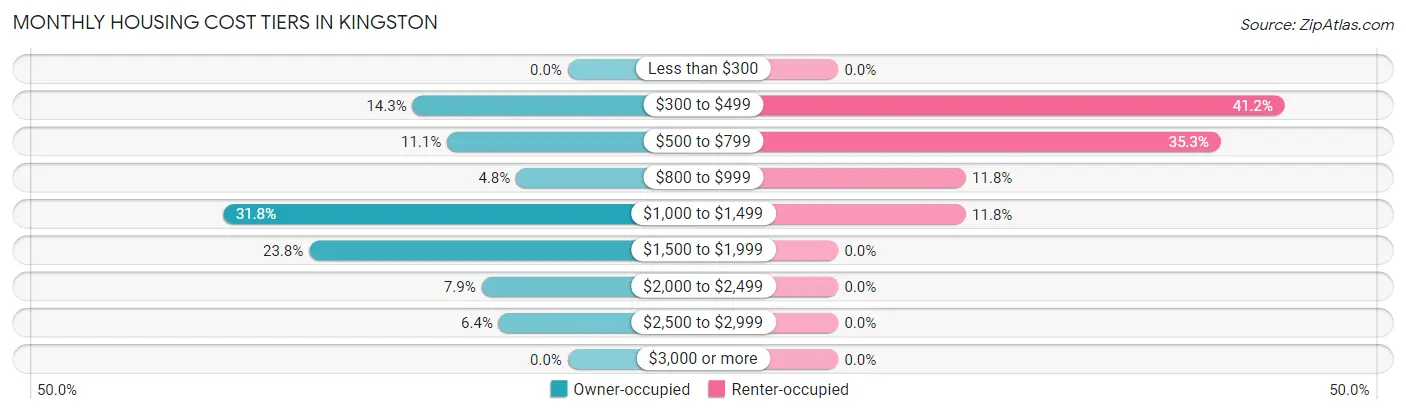
| Monthly Cost | Owner-occupied | Renter-occupied |
| Less than $300 | 0 (0.0%) | 0 (0.0%) |
| $300 to $499 | 9 (14.3%) | 7 (41.2%) |
| $500 to $799 | 7 (11.1%) | 6 (35.3%) |
| $800 to $999 | 3 (4.8%) | 2 (11.8%) |
| $1,000 to $1,499 | 20 (31.8%) | 2 (11.8%) |
| $1,500 to $1,999 | 15 (23.8%) | 0 (0.0%) |
| $2,000 to $2,499 | 5 (7.9%) | 0 (0.0%) |
| $2,500 to $2,999 | 4 (6.4%) | 0 (0.0%) |
| $3,000 or more | 0 (0.0%) | 0 (0.0%) |
| Total | 63 (100.0%) | 17 (100.0%) |
Physical Housing Characteristics in Kingston
Housing Structures in Kingston
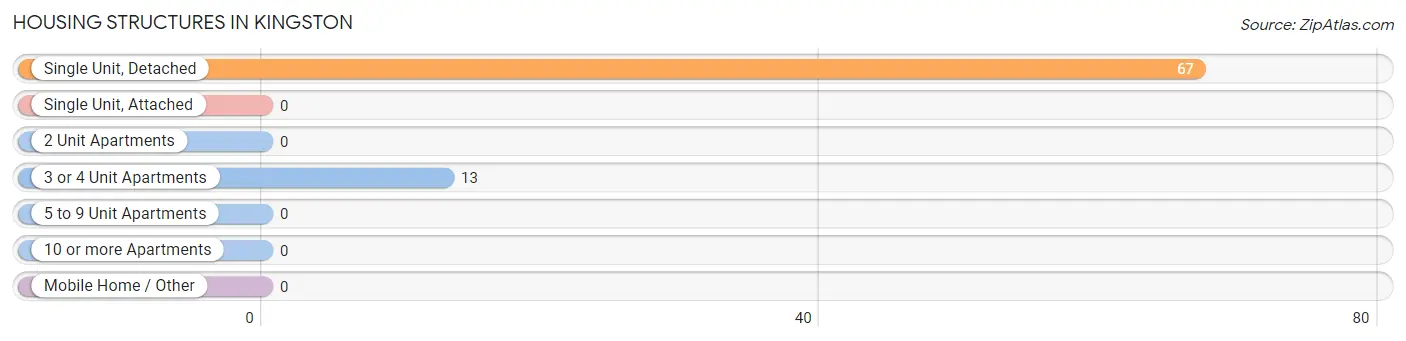
| Structure Type | # Housing Units | % Housing Units |
| Single Unit, Detached | 67 | 83.8% |
| Single Unit, Attached | 0 | 0.0% |
| 2 Unit Apartments | 0 | 0.0% |
| 3 or 4 Unit Apartments | 13 | 16.3% |
| 5 to 9 Unit Apartments | 0 | 0.0% |
| 10 or more Apartments | 0 | 0.0% |
| Mobile Home / Other | 0 | 0.0% |
| Total | 80 | 100.0% |
Housing Structures by Occupancy in Kingston
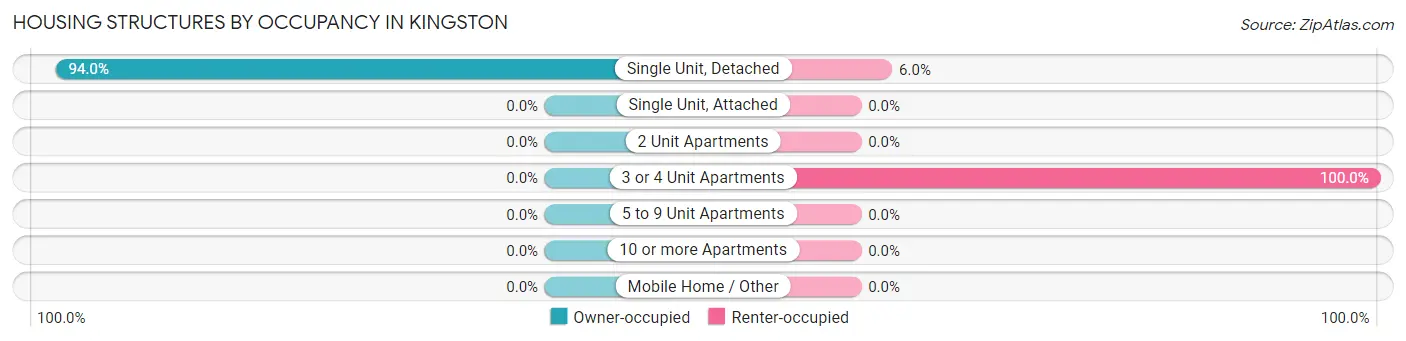
| Structure Type | Owner-occupied | Renter-occupied |
| Single Unit, Detached | 63 (94.0%) | 4 (6.0%) |
| Single Unit, Attached | 0 (0.0%) | 0 (0.0%) |
| 2 Unit Apartments | 0 (0.0%) | 0 (0.0%) |
| 3 or 4 Unit Apartments | 0 (0.0%) | 13 (100.0%) |
| 5 to 9 Unit Apartments | 0 (0.0%) | 0 (0.0%) |
| 10 or more Apartments | 0 (0.0%) | 0 (0.0%) |
| Mobile Home / Other | 0 (0.0%) | 0 (0.0%) |
| Total | 63 (78.7%) | 17 (21.2%) |
Housing Structures by Number of Rooms in Kingston
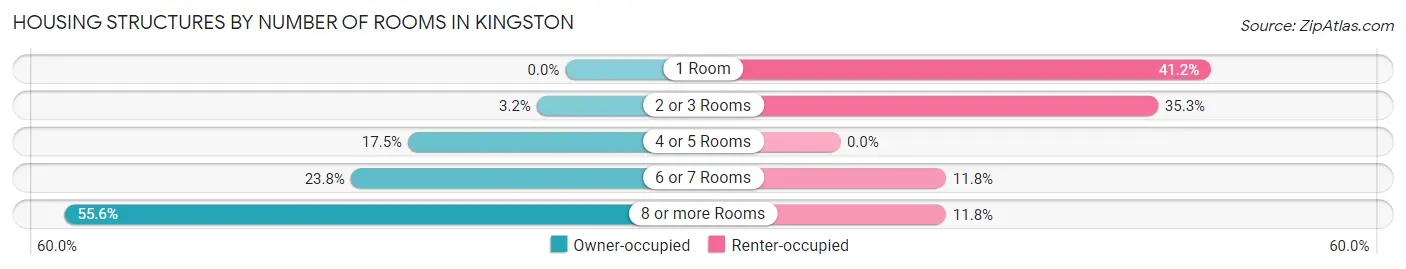
| Number of Rooms | Owner-occupied | Renter-occupied |
| 1 Room | 0 (0.0%) | 7 (41.2%) |
| 2 or 3 Rooms | 2 (3.2%) | 6 (35.3%) |
| 4 or 5 Rooms | 11 (17.5%) | 0 (0.0%) |
| 6 or 7 Rooms | 15 (23.8%) | 2 (11.8%) |
| 8 or more Rooms | 35 (55.6%) | 2 (11.8%) |
| Total | 63 (100.0%) | 17 (100.0%) |
Housing Structure by Heating Type in Kingston
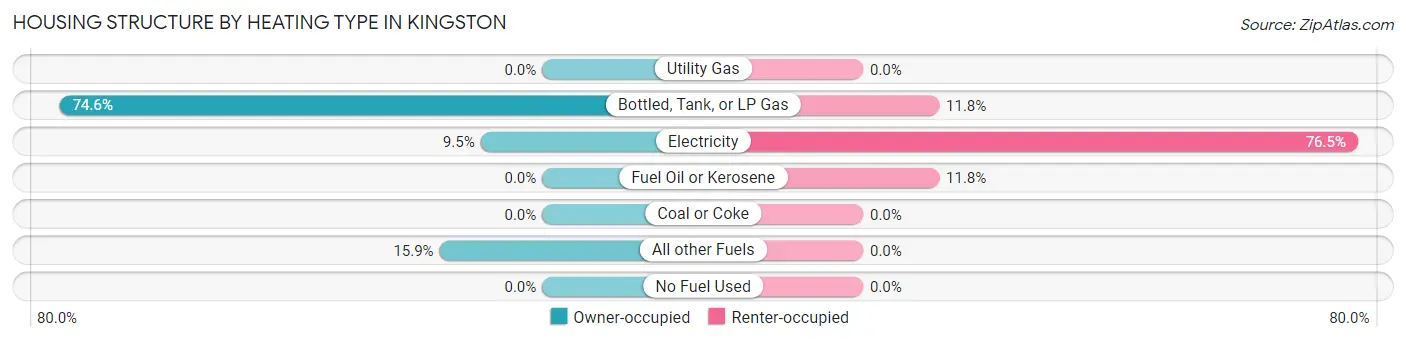
| Heating Type | Owner-occupied | Renter-occupied |
| Utility Gas | 0 (0.0%) | 0 (0.0%) |
| Bottled, Tank, or LP Gas | 47 (74.6%) | 2 (11.8%) |
| Electricity | 6 (9.5%) | 13 (76.5%) |
| Fuel Oil or Kerosene | 0 (0.0%) | 2 (11.8%) |
| Coal or Coke | 0 (0.0%) | 0 (0.0%) |
| All other Fuels | 10 (15.9%) | 0 (0.0%) |
| No Fuel Used | 0 (0.0%) | 0 (0.0%) |
| Total | 63 (100.0%) | 17 (100.0%) |
Household Vehicle Usage in Kingston
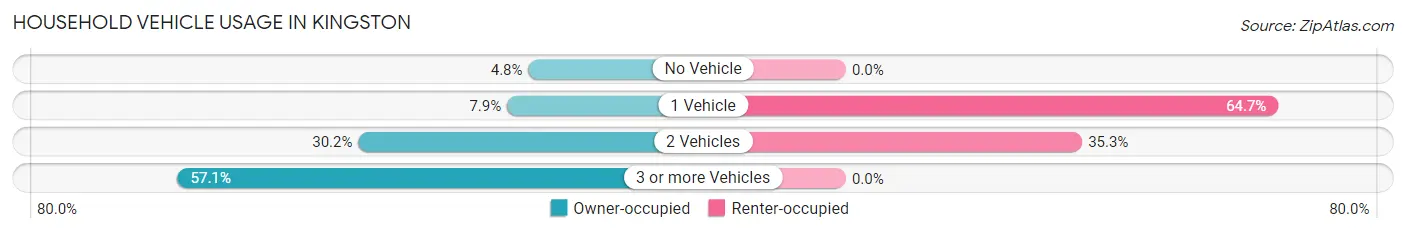
| Vehicles per Household | Owner-occupied | Renter-occupied |
| No Vehicle | 3 (4.8%) | 0 (0.0%) |
| 1 Vehicle | 5 (7.9%) | 11 (64.7%) |
| 2 Vehicles | 19 (30.2%) | 6 (35.3%) |
| 3 or more Vehicles | 36 (57.1%) | 0 (0.0%) |
| Total | 63 (100.0%) | 17 (100.0%) |
Real Estate & Mortgages in Kingston
Real Estate and Mortgage Overview in Kingston
| Characteristic | Without Mortgage | With Mortgage |
| Housing Units | 14 | 49 |
| Median Property Value | $118,800 | $222,900 |
| Median Household Income | $70,000 | $3 |
| Monthly Housing Costs | $467 | $0 |
| Real Estate Taxes | $1,438 | $2 |
Property Value by Mortgage Status in Kingston
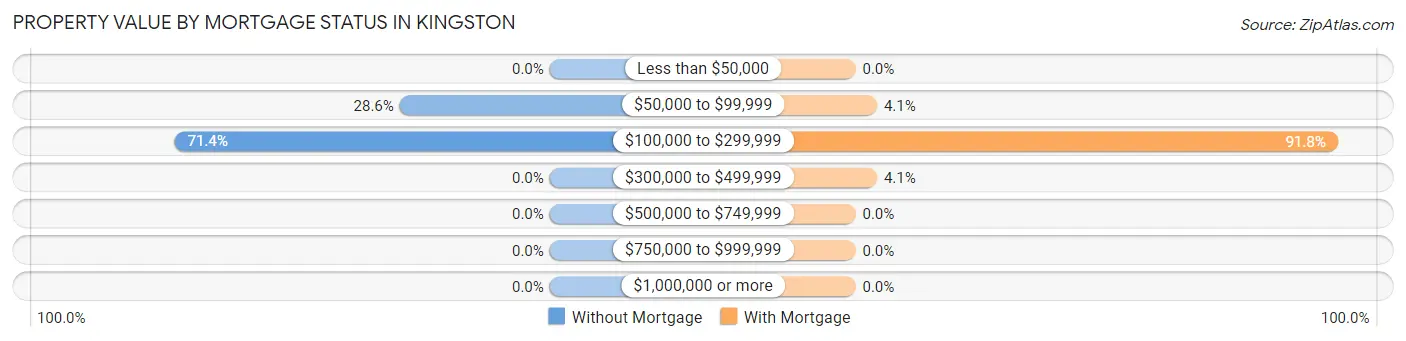
| Property Value | Without Mortgage | With Mortgage |
| Less than $50,000 | 0 (0.0%) | 0 (0.0%) |
| $50,000 to $99,999 | 4 (28.6%) | 2 (4.1%) |
| $100,000 to $299,999 | 10 (71.4%) | 45 (91.8%) |
| $300,000 to $499,999 | 0 (0.0%) | 2 (4.1%) |
| $500,000 to $749,999 | 0 (0.0%) | 0 (0.0%) |
| $750,000 to $999,999 | 0 (0.0%) | 0 (0.0%) |
| $1,000,000 or more | 0 (0.0%) | 0 (0.0%) |
| Total | 14 (100.0%) | 49 (100.0%) |
Household Income by Mortgage Status in Kingston
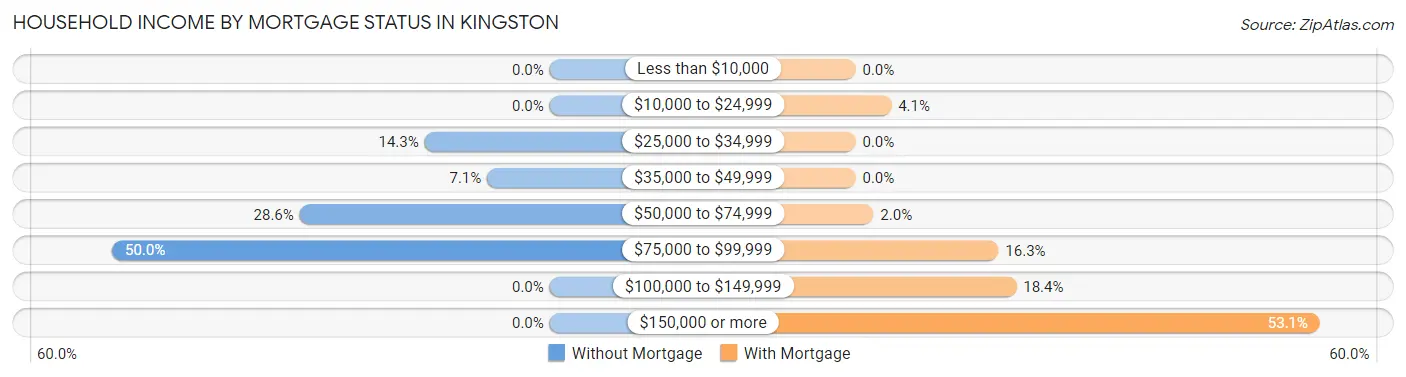
| Household Income | Without Mortgage | With Mortgage |
| Less than $10,000 | 0 (0.0%) | 0 (0.0%) |
| $10,000 to $24,999 | 0 (0.0%) | 2 (4.1%) |
| $25,000 to $34,999 | 2 (14.3%) | 0 (0.0%) |
| $35,000 to $49,999 | 1 (7.1%) | 0 (0.0%) |
| $50,000 to $74,999 | 4 (28.6%) | 1 (2.0%) |
| $75,000 to $99,999 | 7 (50.0%) | 8 (16.3%) |
| $100,000 to $149,999 | 0 (0.0%) | 9 (18.4%) |
| $150,000 or more | 0 (0.0%) | 26 (53.1%) |
| Total | 14 (100.0%) | 49 (100.0%) |
Property Value to Household Income Ratio in Kingston
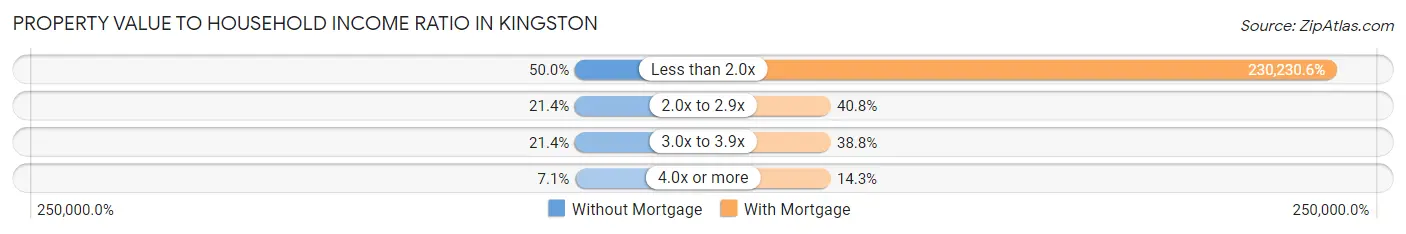
| Value-to-Income Ratio | Without Mortgage | With Mortgage |
| Less than 2.0x | 7 (50.0%) | 112,813 (230,230.6%) |
| 2.0x to 2.9x | 3 (21.4%) | 20 (40.8%) |
| 3.0x to 3.9x | 3 (21.4%) | 19 (38.8%) |
| 4.0x or more | 1 (7.1%) | 7 (14.3%) |
| Total | 14 (100.0%) | 49 (100.0%) |
Real Estate Taxes by Mortgage Status in Kingston
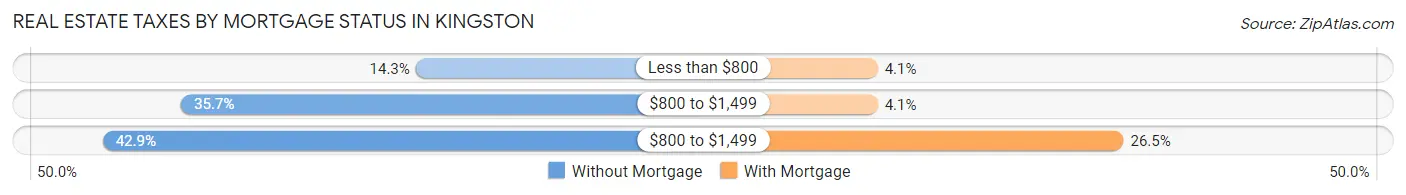
| Property Taxes | Without Mortgage | With Mortgage |
| Less than $800 | 2 (14.3%) | 2 (4.1%) |
| $800 to $1,499 | 5 (35.7%) | 2 (4.1%) |
| $800 to $1,499 | 6 (42.9%) | 13 (26.5%) |
| Total | 14 (100.0%) | 49 (100.0%) |
Health & Disability in Kingston
Health Insurance Coverage by Age in Kingston
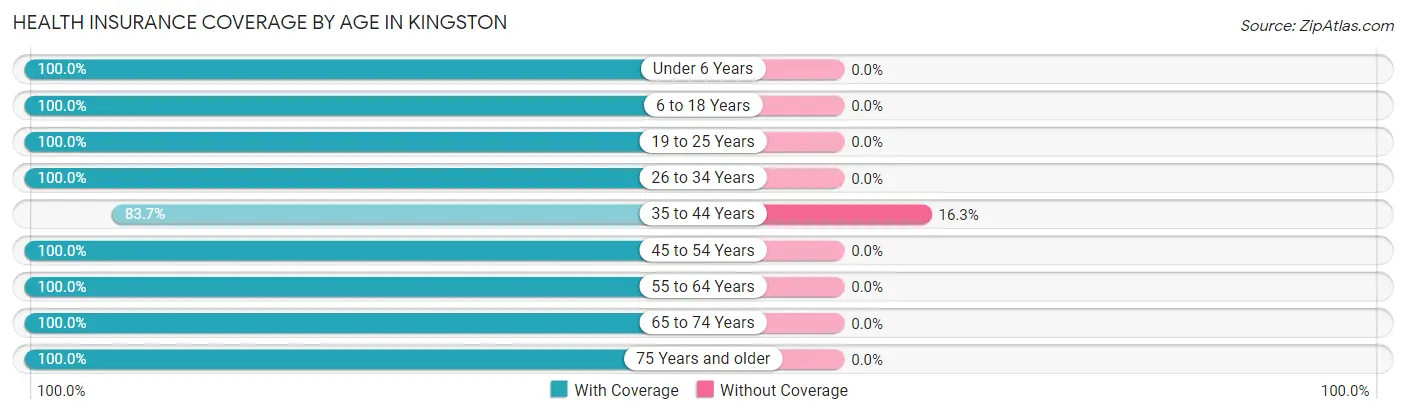
| Age Bracket | With Coverage | Without Coverage |
| Under 6 Years | 26 (100.0%) | 0 (0.0%) |
| 6 to 18 Years | 38 (100.0%) | 0 (0.0%) |
| 19 to 25 Years | 28 (100.0%) | 0 (0.0%) |
| 26 to 34 Years | 32 (100.0%) | 0 (0.0%) |
| 35 to 44 Years | 36 (83.7%) | 7 (16.3%) |
| 45 to 54 Years | 9 (100.0%) | 0 (0.0%) |
| 55 to 64 Years | 11 (100.0%) | 0 (0.0%) |
| 65 to 74 Years | 17 (100.0%) | 0 (0.0%) |
| 75 Years and older | 9 (100.0%) | 0 (0.0%) |
| Total | 206 (96.7%) | 7 (3.3%) |
Health Insurance Coverage by Citizenship Status in Kingston
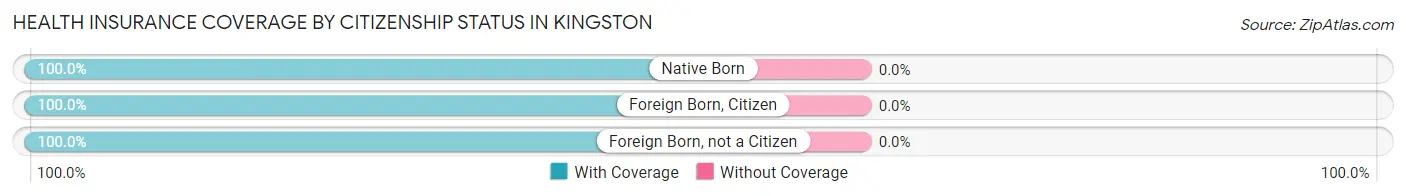
| Citizenship Status | With Coverage | Without Coverage |
| Native Born | 26 (100.0%) | 0 (0.0%) |
| Foreign Born, Citizen | 38 (100.0%) | 0 (0.0%) |
| Foreign Born, not a Citizen | 28 (100.0%) | 0 (0.0%) |
Health Insurance Coverage by Household Income in Kingston
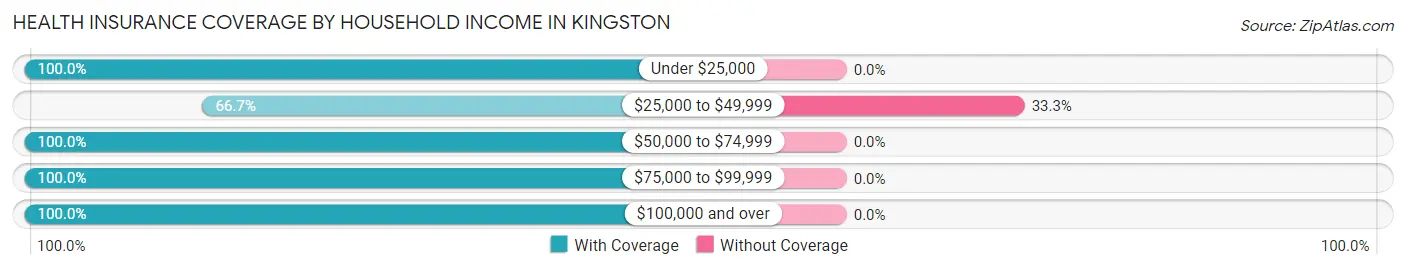
| Household Income | With Coverage | Without Coverage |
| Under $25,000 | 2 (100.0%) | 0 (0.0%) |
| $25,000 to $49,999 | 14 (66.7%) | 7 (33.3%) |
| $50,000 to $74,999 | 40 (100.0%) | 0 (0.0%) |
| $75,000 to $99,999 | 42 (100.0%) | 0 (0.0%) |
| $100,000 and over | 108 (100.0%) | 0 (0.0%) |
Public vs Private Health Insurance Coverage by Age in Kingston
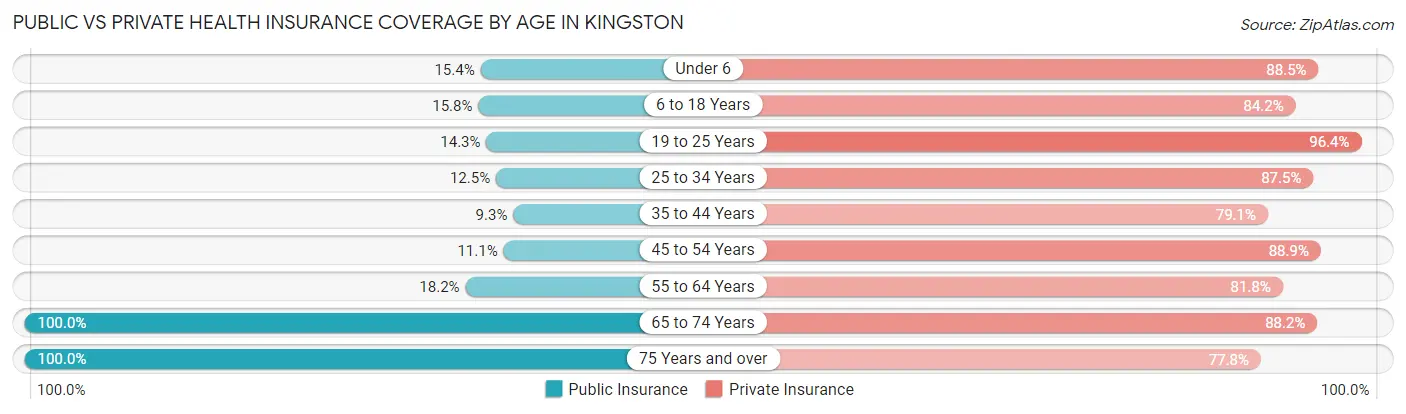
| Age Bracket | Public Insurance | Private Insurance |
| Under 6 | 4 (15.4%) | 23 (88.5%) |
| 6 to 18 Years | 6 (15.8%) | 32 (84.2%) |
| 19 to 25 Years | 4 (14.3%) | 27 (96.4%) |
| 25 to 34 Years | 4 (12.5%) | 28 (87.5%) |
| 35 to 44 Years | 4 (9.3%) | 34 (79.1%) |
| 45 to 54 Years | 1 (11.1%) | 8 (88.9%) |
| 55 to 64 Years | 2 (18.2%) | 9 (81.8%) |
| 65 to 74 Years | 17 (100.0%) | 15 (88.2%) |
| 75 Years and over | 9 (100.0%) | 7 (77.8%) |
| Total | 51 (23.9%) | 183 (85.9%) |
Disability Status by Sex by Age in Kingston
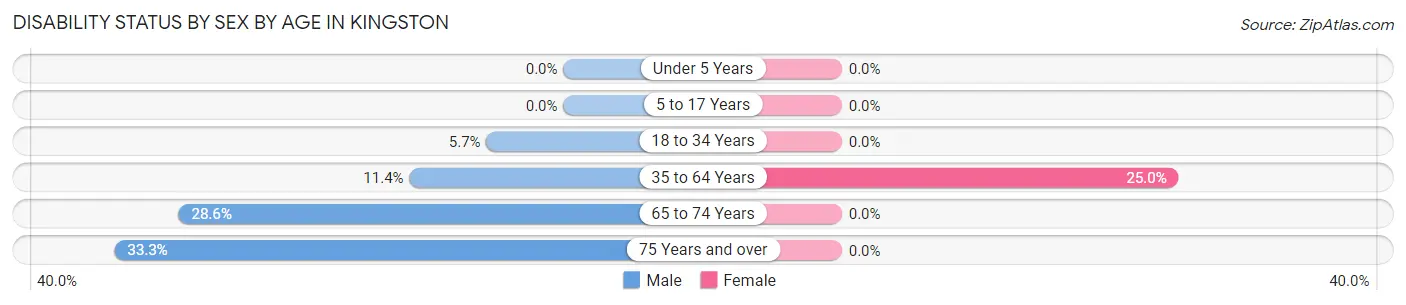
| Age Bracket | Male | Female |
| Under 5 Years | 0 (0.0%) | 0 (0.0%) |
| 5 to 17 Years | 0 (0.0%) | 0 (0.0%) |
| 18 to 34 Years | 2 (5.7%) | 0 (0.0%) |
| 35 to 64 Years | 4 (11.4%) | 7 (25.0%) |
| 65 to 74 Years | 2 (28.6%) | 0 (0.0%) |
| 75 Years and over | 2 (33.3%) | 0 (0.0%) |
Disability Class by Sex by Age in Kingston
Disability Class: Hearing Difficulty
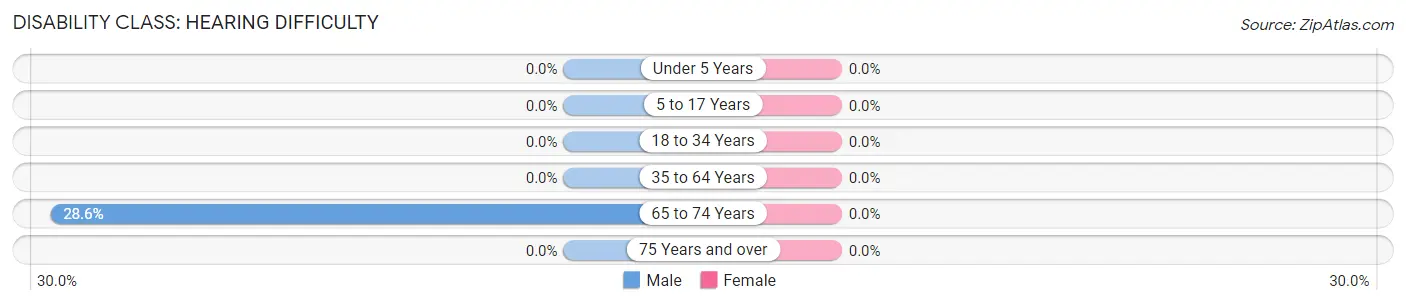
| Age Bracket | Male | Female |
| Under 5 Years | 0 (0.0%) | 0 (0.0%) |
| 5 to 17 Years | 0 (0.0%) | 0 (0.0%) |
| 18 to 34 Years | 0 (0.0%) | 0 (0.0%) |
| 35 to 64 Years | 0 (0.0%) | 0 (0.0%) |
| 65 to 74 Years | 2 (28.6%) | 0 (0.0%) |
| 75 Years and over | 0 (0.0%) | 0 (0.0%) |
Disability Class: Vision Difficulty
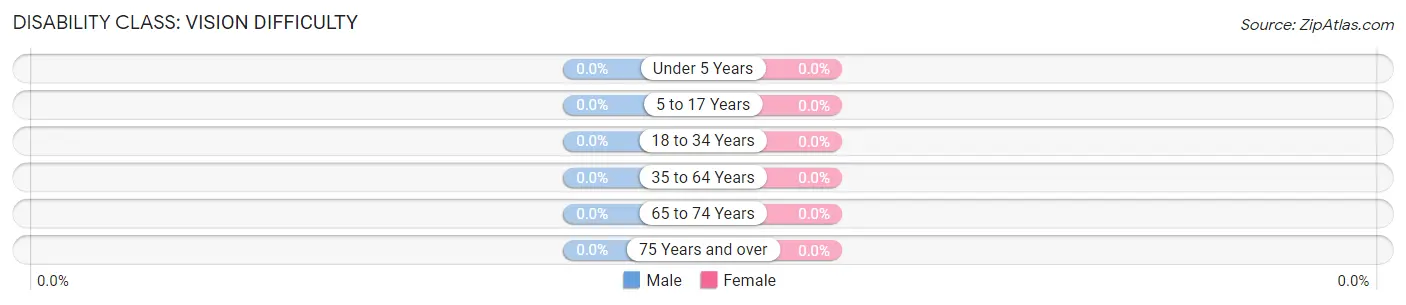
| Age Bracket | Male | Female |
| Under 5 Years | 0 (0.0%) | 0 (0.0%) |
| 5 to 17 Years | 0 (0.0%) | 0 (0.0%) |
| 18 to 34 Years | 0 (0.0%) | 0 (0.0%) |
| 35 to 64 Years | 0 (0.0%) | 0 (0.0%) |
| 65 to 74 Years | 0 (0.0%) | 0 (0.0%) |
| 75 Years and over | 0 (0.0%) | 0 (0.0%) |
Disability Class: Cognitive Difficulty
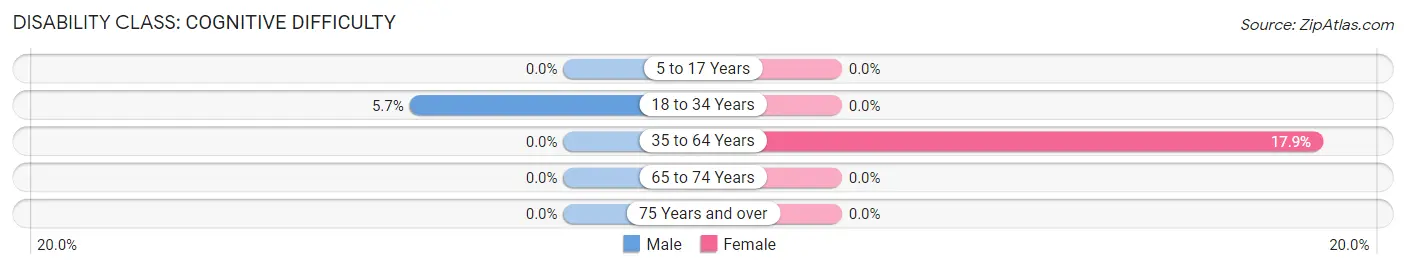
| Age Bracket | Male | Female |
| 5 to 17 Years | 0 (0.0%) | 0 (0.0%) |
| 18 to 34 Years | 2 (5.7%) | 0 (0.0%) |
| 35 to 64 Years | 0 (0.0%) | 5 (17.9%) |
| 65 to 74 Years | 0 (0.0%) | 0 (0.0%) |
| 75 Years and over | 0 (0.0%) | 0 (0.0%) |
Disability Class: Ambulatory Difficulty
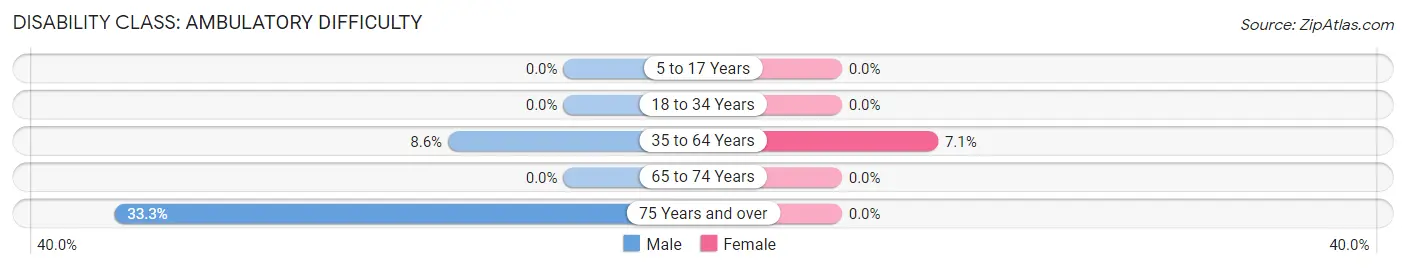
| Age Bracket | Male | Female |
| 5 to 17 Years | 0 (0.0%) | 0 (0.0%) |
| 18 to 34 Years | 0 (0.0%) | 0 (0.0%) |
| 35 to 64 Years | 3 (8.6%) | 2 (7.1%) |
| 65 to 74 Years | 0 (0.0%) | 0 (0.0%) |
| 75 Years and over | 2 (33.3%) | 0 (0.0%) |
Disability Class: Self-Care Difficulty
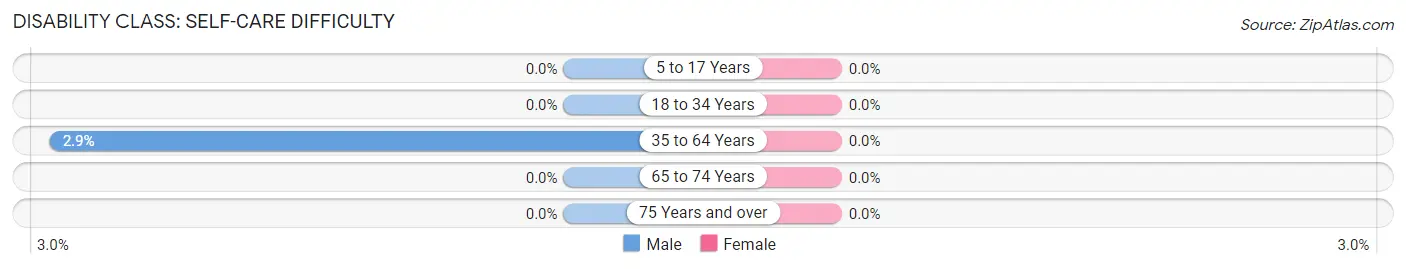
| Age Bracket | Male | Female |
| 5 to 17 Years | 0 (0.0%) | 0 (0.0%) |
| 18 to 34 Years | 0 (0.0%) | 0 (0.0%) |
| 35 to 64 Years | 1 (2.9%) | 0 (0.0%) |
| 65 to 74 Years | 0 (0.0%) | 0 (0.0%) |
| 75 Years and over | 0 (0.0%) | 0 (0.0%) |
Technology Access in Kingston
Computing Device Access in Kingston
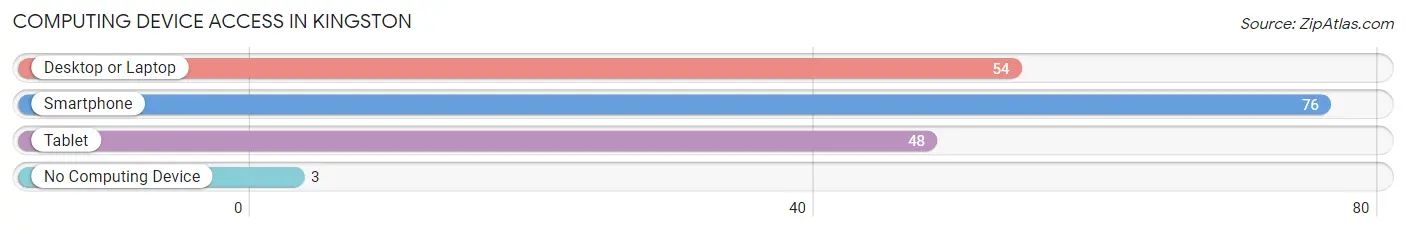
| Device Type | # Households | % Households |
| Desktop or Laptop | 54 | 67.5% |
| Smartphone | 76 | 95.0% |
| Tablet | 48 | 60.0% |
| No Computing Device | 3 | 3.7% |
| Total | 80 | 100.0% |
Internet Access in Kingston
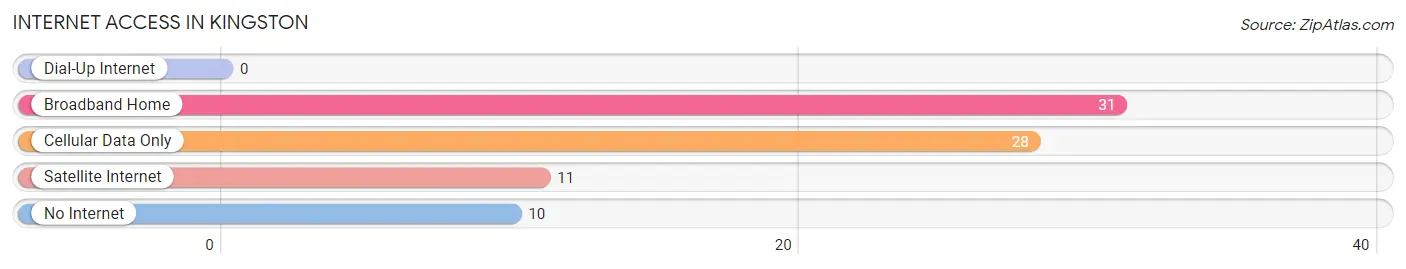
| Internet Type | # Households | % Households |
| Dial-Up Internet | 0 | 0.0% |
| Broadband Home | 31 | 38.8% |
| Cellular Data Only | 28 | 35.0% |
| Satellite Internet | 11 | 13.8% |
| No Internet | 10 | 12.5% |
| Total | 80 | 100.0% |
Kingston Summary
Kingston is a small city located in the state of Minnesota, United States. It is situated in the southeastern corner of the state, in the county of Goodhue. The city is located on the banks of the Mississippi River, and is part of the Twin Cities metropolitan area. As of the 2010 census, the population of Kingston was 1,845.
History
The area that is now Kingston was first settled in 1854 by a group of Swedish immigrants. The settlement was originally known as Swede Town, and was located on the banks of the Mississippi River. The settlers were attracted to the area due to its fertile soil and abundant natural resources. The settlement was officially incorporated as the city of Kingston in 1858.
In the late 19th century, Kingston was a thriving agricultural community. The city was home to several grain mills, a sawmill, and a brickyard. The city also had a thriving lumber industry, and was home to several lumber yards.
In the early 20th century, Kingston began to experience a decline in its economy. The city’s population began to decline, and many of the businesses in the city closed. In the 1950s, the city began to experience a resurgence in its economy, as new businesses began to open in the city.
Geography
Kingston is located in the southeastern corner of Minnesota, in the county of Goodhue. The city is situated on the banks of the Mississippi River, and is part of the Twin Cities metropolitan area. The city has a total area of 1.2 square miles, all of which is land.
The city is located in a region of rolling hills and valleys. The terrain is mostly flat, with some areas of higher elevation. The city is located in a temperate climate, with warm summers and cold winters.
Economy
The economy of Kingston is largely based on agriculture and tourism. The city is home to several farms, which produce a variety of crops, including corn, soybeans, and wheat. The city is also home to several wineries, which produce a variety of wines.
The city is also home to several businesses, including a lumber yard, a hardware store, and a grocery store. The city is also home to several restaurants, bars, and other businesses.
Demographics
As of the 2010 census, the population of Kingston was 1,845. The population is largely white, with a small percentage of African Americans, Hispanics, and Asians. The median household income in the city is $50,000, and the median home value is $150,000.
The city is home to several churches, including the First Baptist Church, the United Methodist Church, and the Church of the Nazarene. The city is also home to several schools, including Kingston Elementary School, Kingston Middle School, and Kingston High School.
Conclusion
Kingston is a small city located in the southeastern corner of Minnesota. The city is situated on the banks of the Mississippi River, and is part of the Twin Cities metropolitan area. The city has a population of 1,845, and is largely white. The economy of Kingston is largely based on agriculture and tourism, and the city is home to several businesses, churches, and schools.
Common Questions
What is Per Capita Income in Kingston?
Per Capita income in Kingston is $30,057.
What is the Median Family Income in Kingston?
Median Family Income in Kingston is $96,429.
What is the Median Household income in Kingston?
Median Household Income in Kingston is $90,625.
What is Income or Wage Gap in Kingston?
Income or Wage Gap in Kingston is 47.1%.
Women in Kingston earn 52.9 cents for every dollar earned by a man.
What is Inequality or Gini Index in Kingston?
Inequality or Gini Index in Kingston is 0.27.
What is the Total Population of Kingston?
Total Population of Kingston is 215.
What is the Total Male Population of Kingston?
Total Male Population of Kingston is 110.
What is the Total Female Population of Kingston?
Total Female Population of Kingston is 105.
What is the Ratio of Males per 100 Females in Kingston?
There are 104.76 Males per 100 Females in Kingston.
What is the Ratio of Females per 100 Males in Kingston?
There are 95.45 Females per 100 Males in Kingston.
What is the Median Population Age in Kingston?
Median Population Age in Kingston is 31.5 Years.
What is the Average Family Size in Kingston
Average Family Size in Kingston is 3.2 People.
What is the Average Household Size in Kingston
Average Household Size in Kingston is 2.7 People.
How Large is the Labor Force in Kingston?
There are 106 People in the Labor Forcein in Kingston.
What is the Percentage of People in the Labor Force in Kingston?
65.0% of People are in the Labor Force in Kingston.
What is the Unemployment Rate in Kingston?
Unemployment Rate in Kingston is 1.0%.