Trosky, MN Map & Demographics
Trosky Map
Trosky Overview
$28,897
PER CAPITA INCOME
$58,750
AVG FAMILY INCOME
$56,875
AVG HOUSEHOLD INCOME
12.0%
WAGE / INCOME GAP [ % ]
88.0¢/ $1
WAGE / INCOME GAP [ $ ]
0.39
INEQUALITY / GINI INDEX
68
TOTAL POPULATION
28
MALE POPULATION
40
FEMALE POPULATION
70.00
MALES / 100 FEMALES
142.86
FEMALES / 100 MALES
43.5
MEDIAN AGE
2.9
AVG FAMILY SIZE
2.5
AVG HOUSEHOLD SIZE
42
LABOR FORCE [ PEOPLE ]
77.8%
PERCENT IN LABOR FORCE
Trosky Area Codes
Income in Trosky
Income Overview in Trosky
Per Capita Income in Trosky is $28,897, while median incomes of families and households are $58,750 and $56,875 respectively.
| Characteristic | Number | Measure |
| Per Capita Income | 68 | $28,897 |
| Median Family Income | 20 | $58,750 |
| Mean Family Income | 20 | $76,440 |
| Median Household Income | 27 | $56,875 |
| Mean Household Income | 27 | $76,737 |
| Income Deficit | 20 | $0 |
| Wage / Income Gap (%) | 68 | 11.96% |
| Wage / Income Gap ($) | 68 | 88.04¢ per $1 |
| Gini / Inequality Index | 68 | 0.39 |
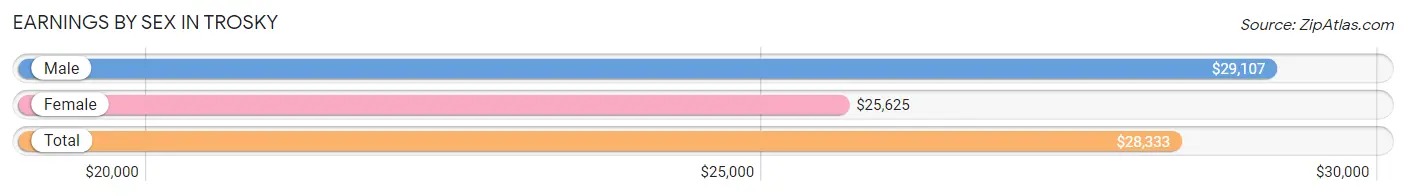
Earnings by Sex in Trosky
Average Earnings in Trosky are $28,333, $29,107 for men and $25,625 for women, a difference of 12.0%.
| Sex | Number | Average Earnings |
| Male | 25 (54.3%) | $29,107 |
| Female | 21 (45.7%) | $25,625 |
| Total | 46 (100.0%) | $28,333 |
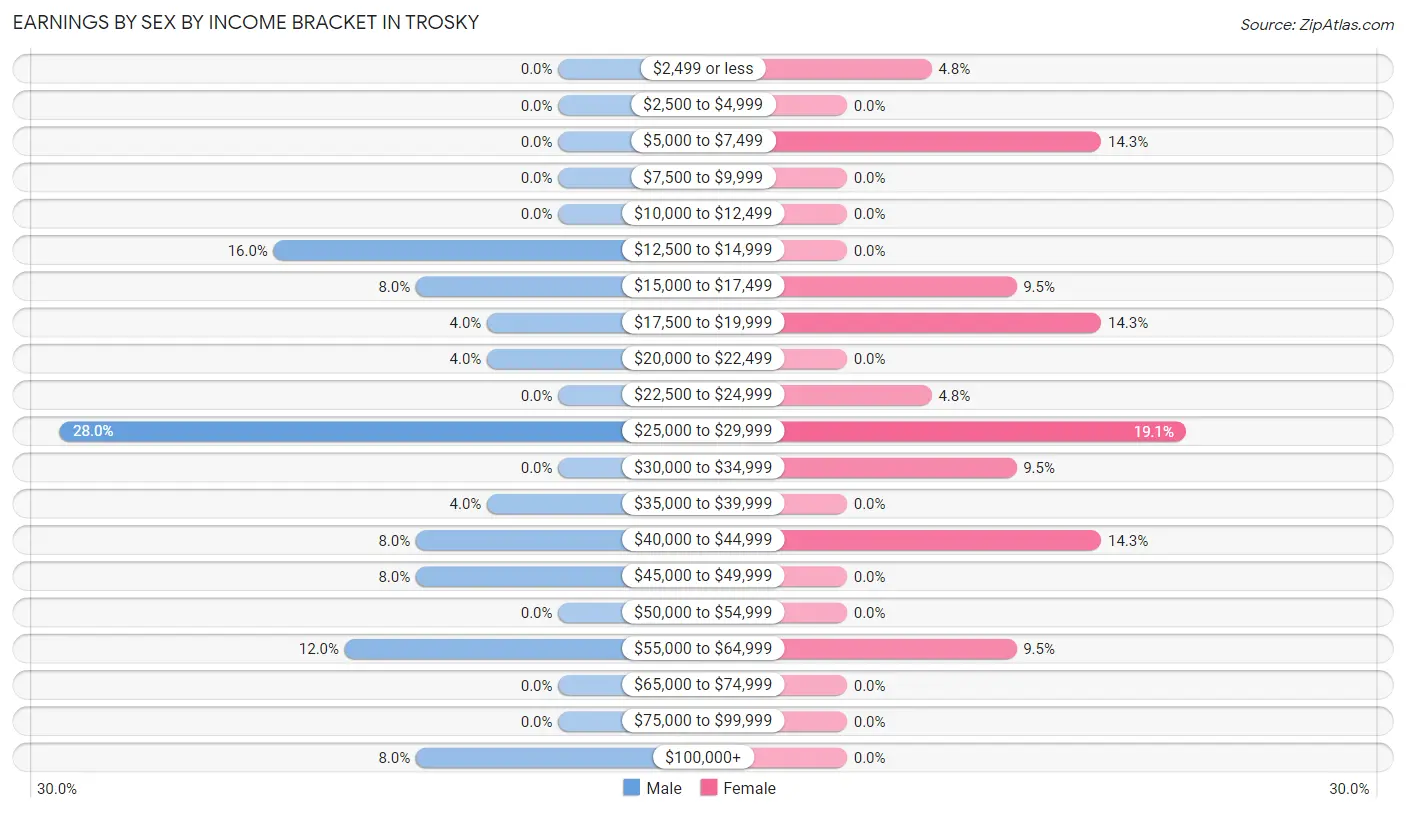
Earnings by Sex by Income Bracket in Trosky
The most common earnings brackets in Trosky are $25,000 to $29,999 for men (7 | 28.0%) and $25,000 to $29,999 for women (4 | 19.1%).
| Income | Male | Female |
| $2,499 or less | 0 (0.0%) | 1 (4.8%) |
| $2,500 to $4,999 | 0 (0.0%) | 0 (0.0%) |
| $5,000 to $7,499 | 0 (0.0%) | 3 (14.3%) |
| $7,500 to $9,999 | 0 (0.0%) | 0 (0.0%) |
| $10,000 to $12,499 | 0 (0.0%) | 0 (0.0%) |
| $12,500 to $14,999 | 4 (16.0%) | 0 (0.0%) |
| $15,000 to $17,499 | 2 (8.0%) | 2 (9.5%) |
| $17,500 to $19,999 | 1 (4.0%) | 3 (14.3%) |
| $20,000 to $22,499 | 1 (4.0%) | 0 (0.0%) |
| $22,500 to $24,999 | 0 (0.0%) | 1 (4.8%) |
| $25,000 to $29,999 | 7 (28.0%) | 4 (19.1%) |
| $30,000 to $34,999 | 0 (0.0%) | 2 (9.5%) |
| $35,000 to $39,999 | 1 (4.0%) | 0 (0.0%) |
| $40,000 to $44,999 | 2 (8.0%) | 3 (14.3%) |
| $45,000 to $49,999 | 2 (8.0%) | 0 (0.0%) |
| $50,000 to $54,999 | 0 (0.0%) | 0 (0.0%) |
| $55,000 to $64,999 | 3 (12.0%) | 2 (9.5%) |
| $65,000 to $74,999 | 0 (0.0%) | 0 (0.0%) |
| $75,000 to $99,999 | 0 (0.0%) | 0 (0.0%) |
| $100,000+ | 2 (8.0%) | 0 (0.0%) |
| Total | 25 (100.0%) | 21 (100.0%) |
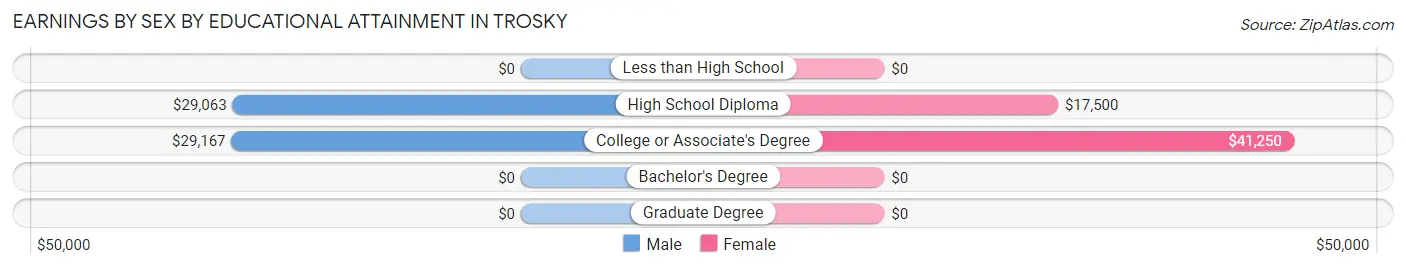
Earnings by Sex by Educational Attainment in Trosky
Average earnings in Trosky are $29,107 for men and $26,250 for women, a difference of 9.8%. Men with an educational attainment of college or associate's degree enjoy the highest average annual earnings of $29,167, while those with high school diploma education earn the least with $29,063. Women with an educational attainment of college or associate's degree earn the most with the average annual earnings of $41,250, while those with high school diploma education have the smallest earnings of $17,500.
| Educational Attainment | Male Income | Female Income |
| Less than High School | - | - |
| High School Diploma | $29,063 | $17,500 |
| College or Associate's Degree | $29,167 | $41,250 |
| Bachelor's Degree | - | - |
| Graduate Degree | - | - |
| Total | $29,107 | $26,250 |
Family Income in Trosky
Family Income Brackets in Trosky
According to the Trosky family income data, there are 9 families falling into the $50,000 to $74,999 income range, which is the most common income bracket and makes up 45.0% of all families.
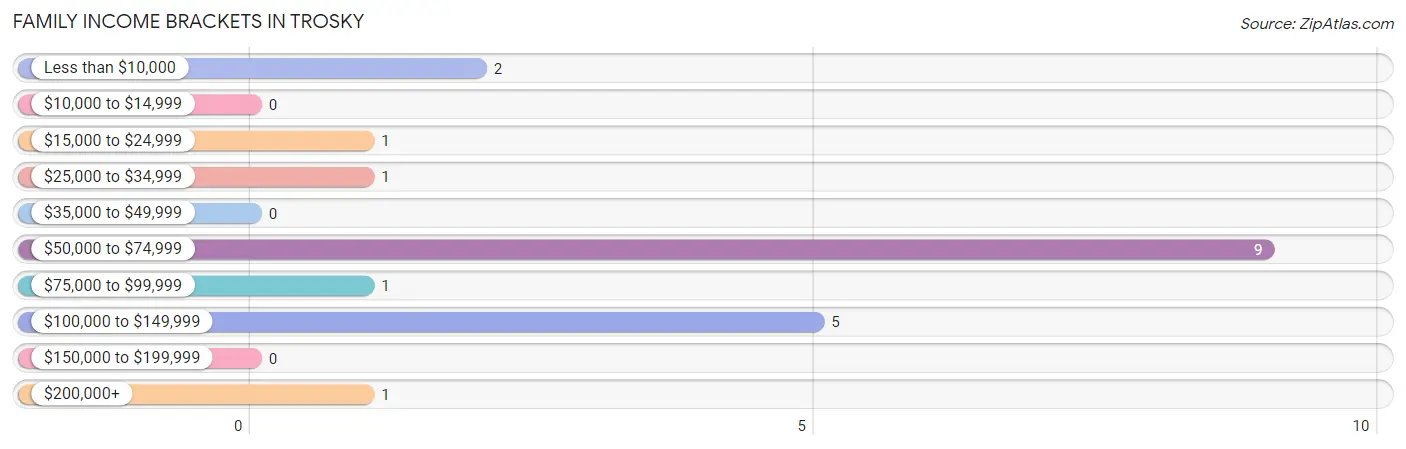
| Income Bracket | # Families | % Families |
| Less than $10,000 | 2 | 10.0% |
| $10,000 to $14,999 | 0 | 0.0% |
| $15,000 to $24,999 | 1 | 5.0% |
| $25,000 to $34,999 | 1 | 5.0% |
| $35,000 to $49,999 | 0 | 0.0% |
| $50,000 to $74,999 | 9 | 45.0% |
| $75,000 to $99,999 | 1 | 5.0% |
| $100,000 to $149,999 | 5 | 25.0% |
| $150,000 to $199,999 | 0 | 0.0% |
| $200,000+ | 1 | 5.0% |
Family Income by Famaliy Size in Trosky
4-person families (8 | 40.0%) account for the highest median family income in Trosky with $80,000 per family, while 2-person families (12 | 60.0%) have the highest median income of $27,084 per family member.
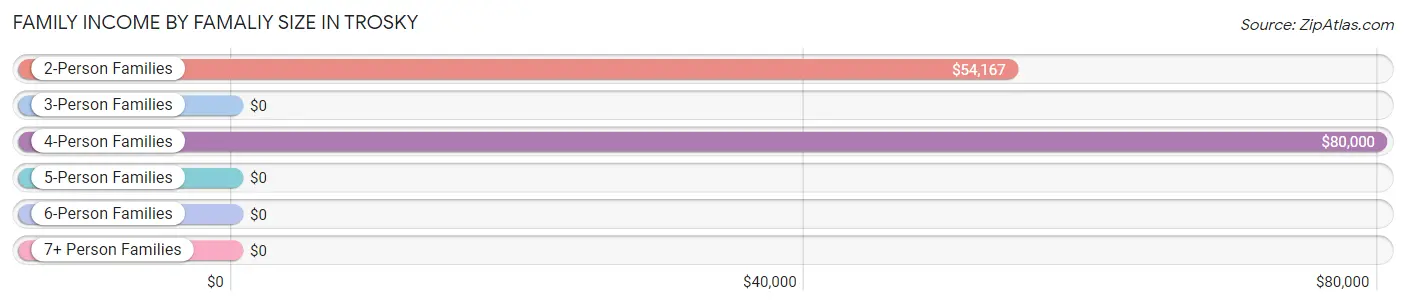
| Income Bracket | # Families | Median Income |
| 2-Person Families | 12 (60.0%) | $54,167 |
| 3-Person Families | 0 (0.0%) | $0 |
| 4-Person Families | 8 (40.0%) | $80,000 |
| 5-Person Families | 0 (0.0%) | $0 |
| 6-Person Families | 0 (0.0%) | $0 |
| 7+ Person Families | 0 (0.0%) | $0 |
| Total | 20 (100.0%) | $58,750 |
Family Income by Number of Earners in Trosky
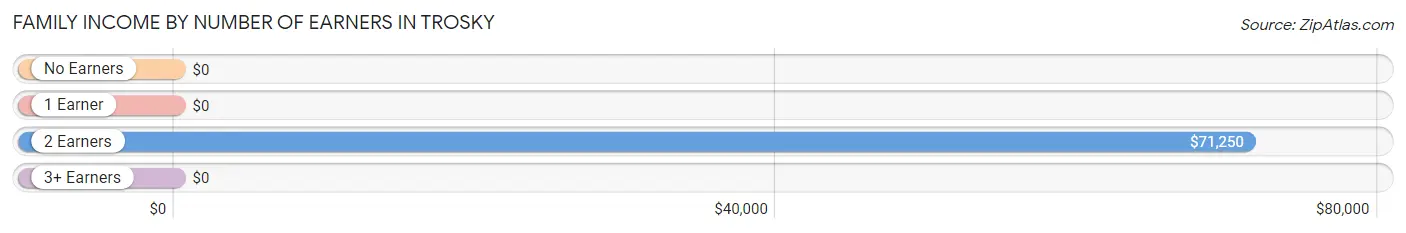
| Number of Earners | # Families | Median Income |
| No Earners | 1 (5.0%) | $0 |
| 1 Earner | 7 (35.0%) | $0 |
| 2 Earners | 10 (50.0%) | $71,250 |
| 3+ Earners | 2 (10.0%) | $0 |
| Total | 20 (100.0%) | $58,750 |
Household Income in Trosky
Household Income Brackets in Trosky
With 9 households falling in the category, the $50,000 to $74,999 income range is the most frequent in Trosky, accounting for 33.3% of all households.
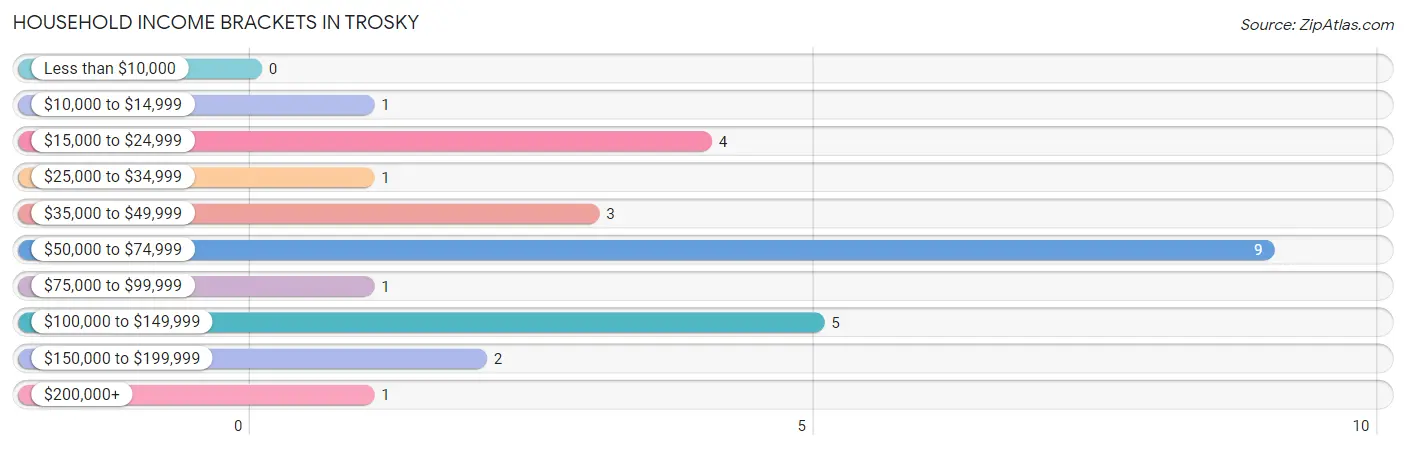
| Income Bracket | # Households | % Households |
| Less than $10,000 | 0 | 0.0% |
| $10,000 to $14,999 | 1 | 3.7% |
| $15,000 to $24,999 | 4 | 14.8% |
| $25,000 to $34,999 | 1 | 3.7% |
| $35,000 to $49,999 | 3 | 11.1% |
| $50,000 to $74,999 | 9 | 33.3% |
| $75,000 to $99,999 | 1 | 3.7% |
| $100,000 to $149,999 | 5 | 18.5% |
| $150,000 to $199,999 | 2 | 7.4% |
| $200,000+ | 1 | 3.7% |
Household Income by Householder Age in Trosky
The median household income in Trosky is $56,875, with the highest median household income of $100,625 found in the 45 to 64 years age bracket for the primary householder. A total of 9 households (33.3%) fall into this category.
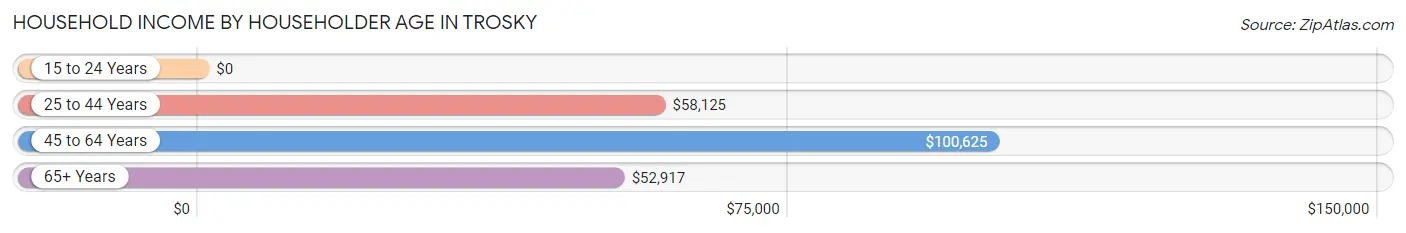
| Income Bracket | # Households | Median Income |
| 15 to 24 Years | 0 (0.0%) | $0 |
| 25 to 44 Years | 11 (40.7%) | $58,125 |
| 45 to 64 Years | 9 (33.3%) | $100,625 |
| 65+ Years | 7 (25.9%) | $52,917 |
| Total | 27 (100.0%) | $56,875 |
Poverty in Trosky
Income Below Poverty by Sex and Age in Trosky
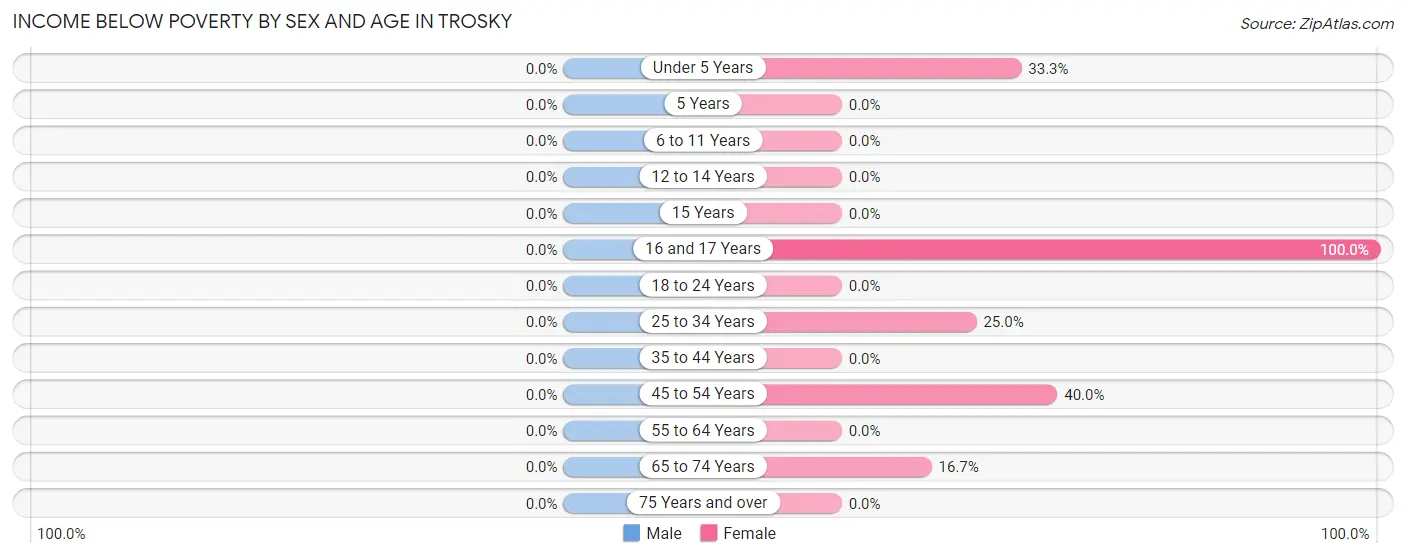
| Age Bracket | Male | Female |
| Under 5 Years | 0 (0.0%) | 1 (33.3%) |
| 5 Years | 0 (0.0%) | 0 (0.0%) |
| 6 to 11 Years | 0 (0.0%) | 0 (0.0%) |
| 12 to 14 Years | 0 (0.0%) | 0 (0.0%) |
| 15 Years | 0 (0.0%) | 0 (0.0%) |
| 16 and 17 Years | 0 (0.0%) | 3 (100.0%) |
| 18 to 24 Years | 0 (0.0%) | 0 (0.0%) |
| 25 to 34 Years | 0 (0.0%) | 1 (25.0%) |
| 35 to 44 Years | 0 (0.0%) | 0 (0.0%) |
| 45 to 54 Years | 0 (0.0%) | 2 (40.0%) |
| 55 to 64 Years | 0 (0.0%) | 0 (0.0%) |
| 65 to 74 Years | 0 (0.0%) | 1 (16.7%) |
| 75 Years and over | 0 (0.0%) | 0 (0.0%) |
| Total | 0 (0.0%) | 8 (20.0%) |
Income Above Poverty by Sex and Age in Trosky
According to the poverty statistics in Trosky, males aged 5 years and females aged 6 to 11 years are the age groups that are most secure financially, with 100.0% of males and 100.0% of females in these age groups living above the poverty line.
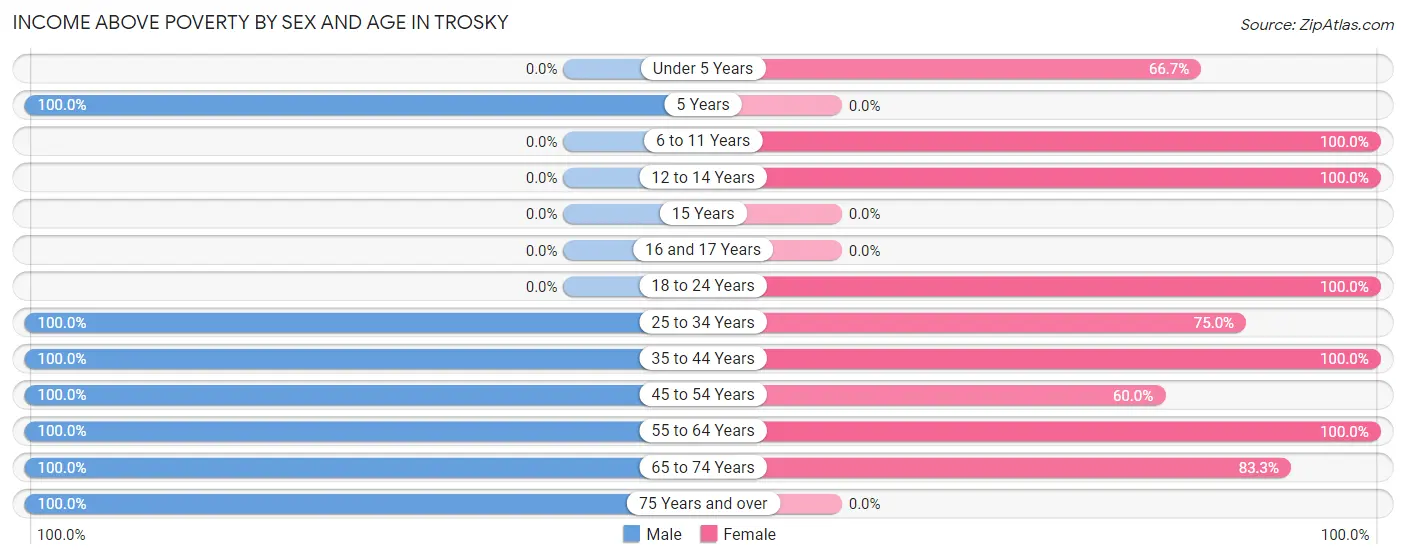
| Age Bracket | Male | Female |
| Under 5 Years | 0 (0.0%) | 2 (66.7%) |
| 5 Years | 2 (100.0%) | 0 (0.0%) |
| 6 to 11 Years | 0 (0.0%) | 5 (100.0%) |
| 12 to 14 Years | 0 (0.0%) | 4 (100.0%) |
| 15 Years | 0 (0.0%) | 0 (0.0%) |
| 16 and 17 Years | 0 (0.0%) | 0 (0.0%) |
| 18 to 24 Years | 0 (0.0%) | 2 (100.0%) |
| 25 to 34 Years | 3 (100.0%) | 3 (75.0%) |
| 35 to 44 Years | 4 (100.0%) | 6 (100.0%) |
| 45 to 54 Years | 4 (100.0%) | 3 (60.0%) |
| 55 to 64 Years | 8 (100.0%) | 2 (100.0%) |
| 65 to 74 Years | 6 (100.0%) | 5 (83.3%) |
| 75 Years and over | 1 (100.0%) | 0 (0.0%) |
| Total | 28 (100.0%) | 32 (80.0%) |
Income Below Poverty Among Married-Couple Families in Trosky
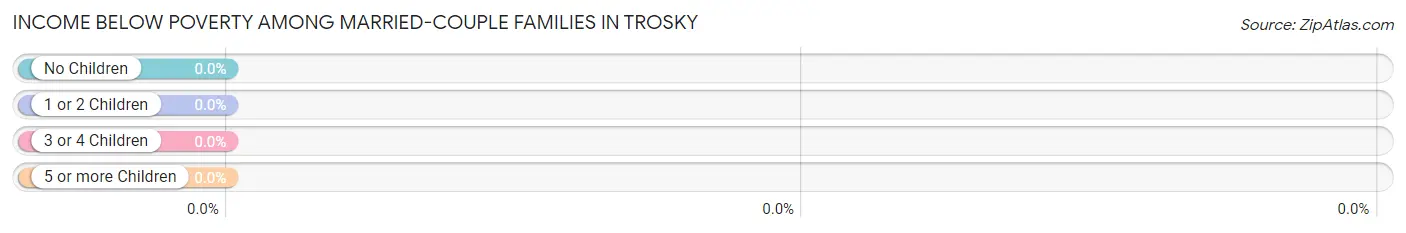
| Children | Above Poverty | Below Poverty |
| No Children | 10 (100.0%) | 0 (0.0%) |
| 1 or 2 Children | 6 (100.0%) | 0 (0.0%) |
| 3 or 4 Children | 0 (0.0%) | 0 (0.0%) |
| 5 or more Children | 0 (0.0%) | 0 (0.0%) |
| Total | 16 (100.0%) | 0 (0.0%) |
Income Below Poverty Among Single-Parent Households in Trosky
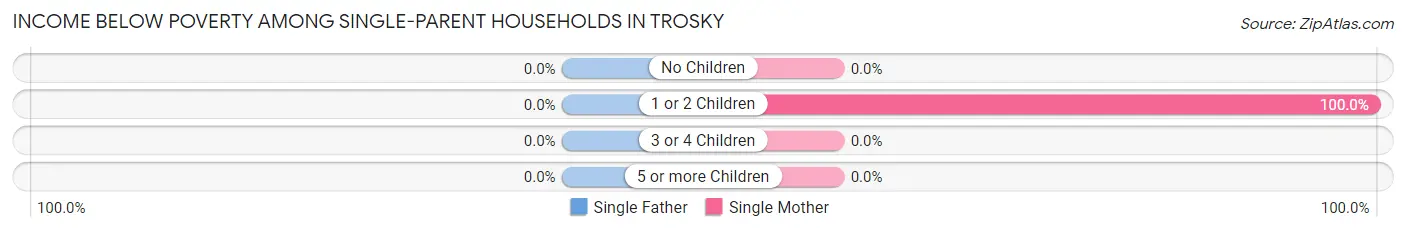
| Children | Single Father | Single Mother |
| No Children | 0 (0.0%) | 0 (0.0%) |
| 1 or 2 Children | 0 (0.0%) | 3 (100.0%) |
| 3 or 4 Children | 0 (0.0%) | 0 (0.0%) |
| 5 or more Children | 0 (0.0%) | 0 (0.0%) |
| Total | 0 (0.0%) | 3 (100.0%) |
Income Below Poverty Among Married-Couple vs Single-Parent Households in Trosky
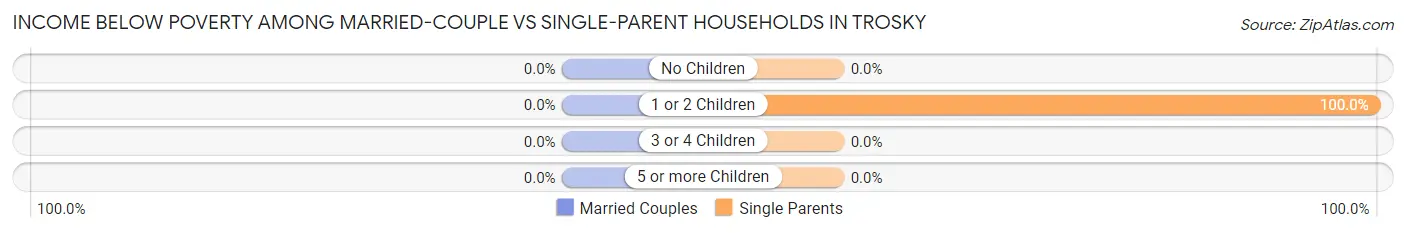
| Children | Married-Couple Families | Single-Parent Households |
| No Children | 0 (0.0%) | 0 (0.0%) |
| 1 or 2 Children | 0 (0.0%) | 3 (100.0%) |
| 3 or 4 Children | 0 (0.0%) | 0 (0.0%) |
| 5 or more Children | 0 (0.0%) | 0 (0.0%) |
| Total | 0 (0.0%) | 3 (75.0%) |
Race in Trosky
The most populous races in Trosky are White / Caucasian (66 | 97.1%), Asian (1 | 1.5%), and Two or more Races (1 | 1.5%).
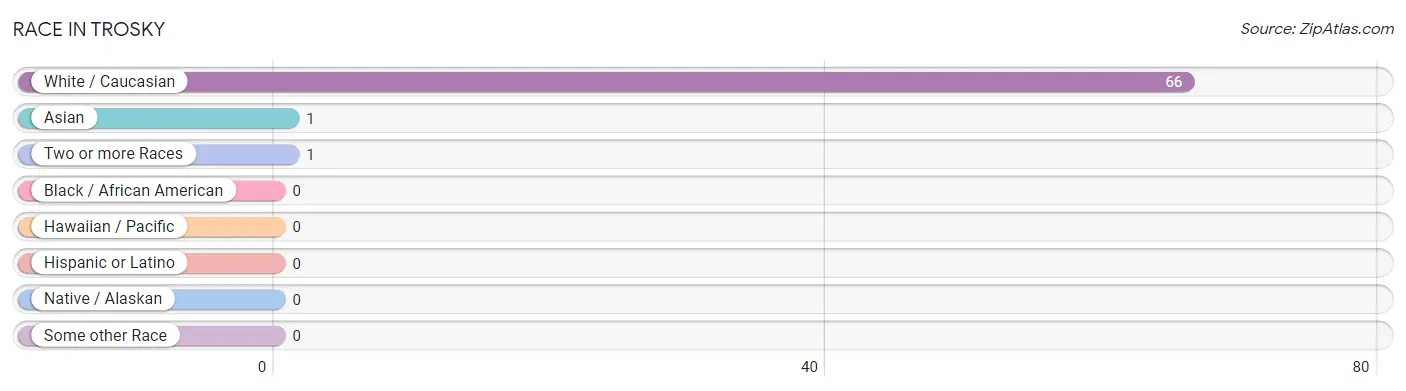
| Race | # Population | % Population |
| Asian | 1 | 1.5% |
| Black / African American | 0 | 0.0% |
| Hawaiian / Pacific | 0 | 0.0% |
| Hispanic or Latino | 0 | 0.0% |
| Native / Alaskan | 0 | 0.0% |
| White / Caucasian | 66 | 97.1% |
| Two or more Races | 1 | 1.5% |
| Some other Race | 0 | 0.0% |
| Total | 68 | 100.0% |
Ancestry in Trosky
The most populous ancestries reported in Trosky are German (31 | 45.6%), Dutch (22 | 32.4%), Norwegian (8 | 11.8%), Irish (5 | 7.3%), and Russian (2 | 2.9%), together accounting for 100.0% of all Trosky residents.
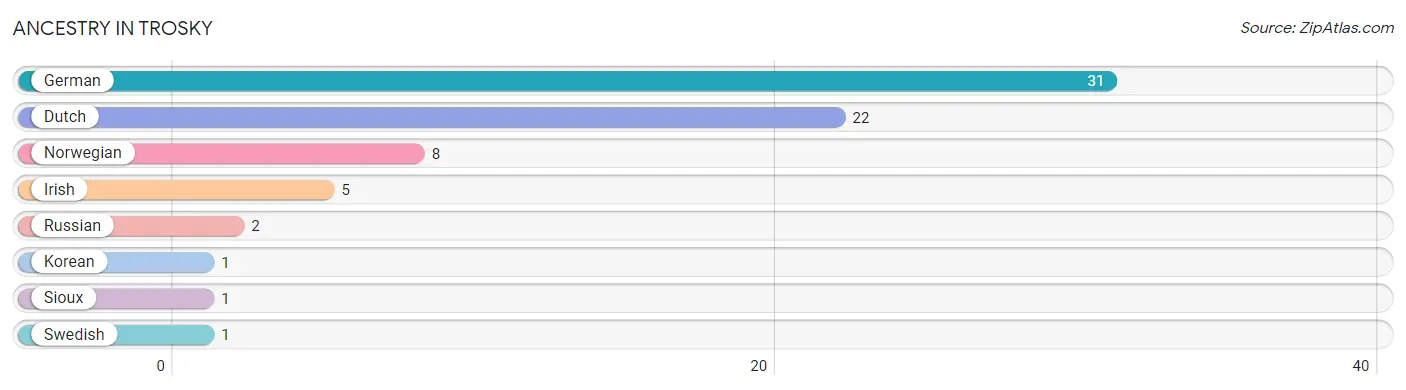
| Ancestry | # Population | % Population |
| Dutch | 22 | 32.4% |
| German | 31 | 45.6% |
| Irish | 5 | 7.3% |
| Korean | 1 | 1.5% |
| Norwegian | 8 | 11.8% |
| Russian | 2 | 2.9% |
| Sioux | 1 | 1.5% |
| Swedish | 1 | 1.5% | View All 8 Rows |
Immigrants in Trosky
The most numerous immigrant groups reported in Trosky came from Asia (1 | 1.5%), Philippines (1 | 1.5%), and South Eastern Asia (1 | 1.5%), together accounting for 4.4% of all Trosky residents.
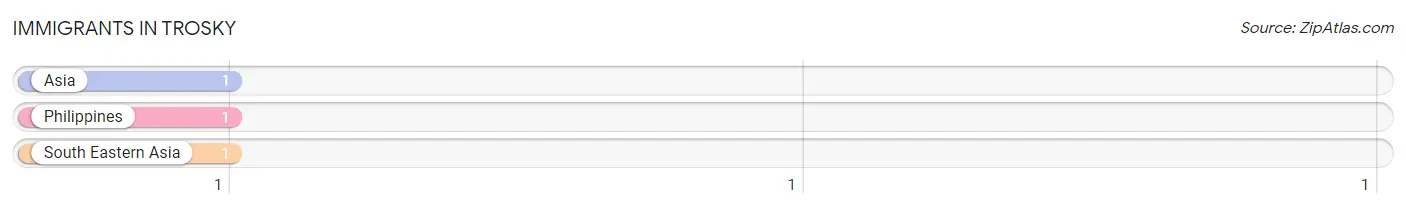
| Immigration Origin | # Population | % Population |
| Asia | 1 | 1.5% |
| Philippines | 1 | 1.5% |
| South Eastern Asia | 1 | 1.5% | View All 3 Rows |
Sex and Age in Trosky
Sex and Age in Trosky
The most populous age groups in Trosky are 55 to 59 Years (5 | 17.9%) for men and 10 to 14 Years (7 | 17.5%) for women.
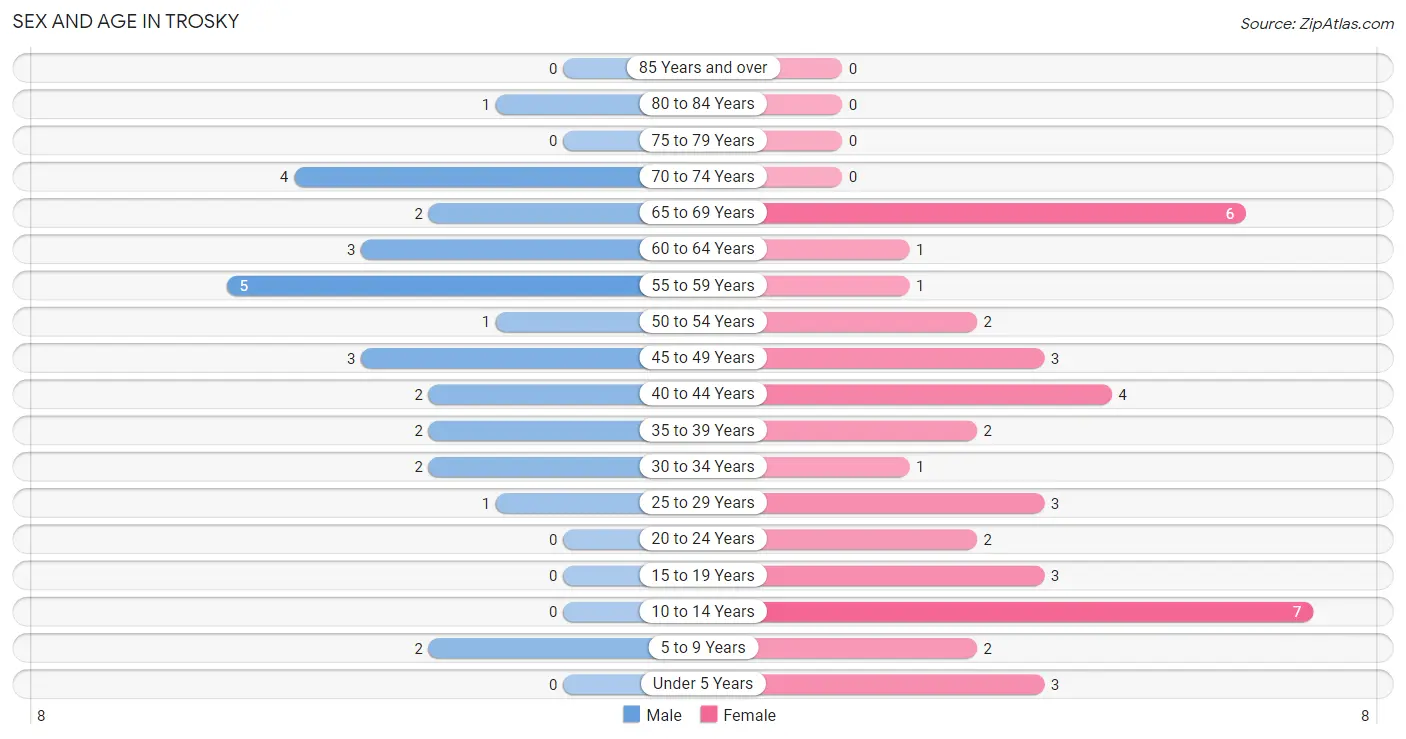
| Age Bracket | Male | Female |
| Under 5 Years | 0 (0.0%) | 3 (7.5%) |
| 5 to 9 Years | 2 (7.1%) | 2 (5.0%) |
| 10 to 14 Years | 0 (0.0%) | 7 (17.5%) |
| 15 to 19 Years | 0 (0.0%) | 3 (7.5%) |
| 20 to 24 Years | 0 (0.0%) | 2 (5.0%) |
| 25 to 29 Years | 1 (3.6%) | 3 (7.5%) |
| 30 to 34 Years | 2 (7.1%) | 1 (2.5%) |
| 35 to 39 Years | 2 (7.1%) | 2 (5.0%) |
| 40 to 44 Years | 2 (7.1%) | 4 (10.0%) |
| 45 to 49 Years | 3 (10.7%) | 3 (7.5%) |
| 50 to 54 Years | 1 (3.6%) | 2 (5.0%) |
| 55 to 59 Years | 5 (17.9%) | 1 (2.5%) |
| 60 to 64 Years | 3 (10.7%) | 1 (2.5%) |
| 65 to 69 Years | 2 (7.1%) | 6 (15.0%) |
| 70 to 74 Years | 4 (14.3%) | 0 (0.0%) |
| 75 to 79 Years | 0 (0.0%) | 0 (0.0%) |
| 80 to 84 Years | 1 (3.6%) | 0 (0.0%) |
| 85 Years and over | 0 (0.0%) | 0 (0.0%) |
| Total | 28 (100.0%) | 40 (100.0%) |
Families and Households in Trosky
Median Family Size in Trosky
The median family size in Trosky is 2.90 persons per family, with married-couple families (16 | 80.0%) accounting for the largest median family size of 3.06 persons per family. On the other hand, single male/father families (1 | 5.0%) represent the smallest median family size with 2.00 persons per family.
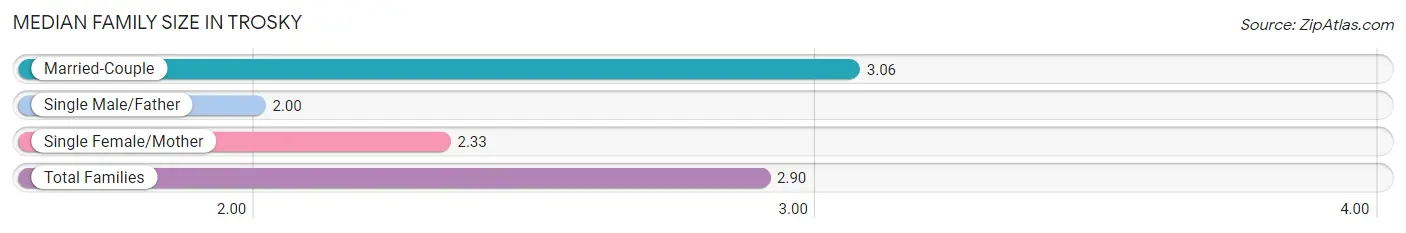
| Family Type | # Families | Family Size |
| Married-Couple | 16 (80.0%) | 3.06 |
| Single Male/Father | 1 (5.0%) | 2.00 |
| Single Female/Mother | 3 (15.0%) | 2.33 |
| Total Families | 20 (100.0%) | 2.90 |
Median Household Size in Trosky
The median household size in Trosky is 2.52 persons per household, with married-couple households (16 | 59.3%) accounting for the largest median household size of 3.06 persons per household. non-family households (7 | 25.9%) represent the smallest median household size with 1.14 persons per household.
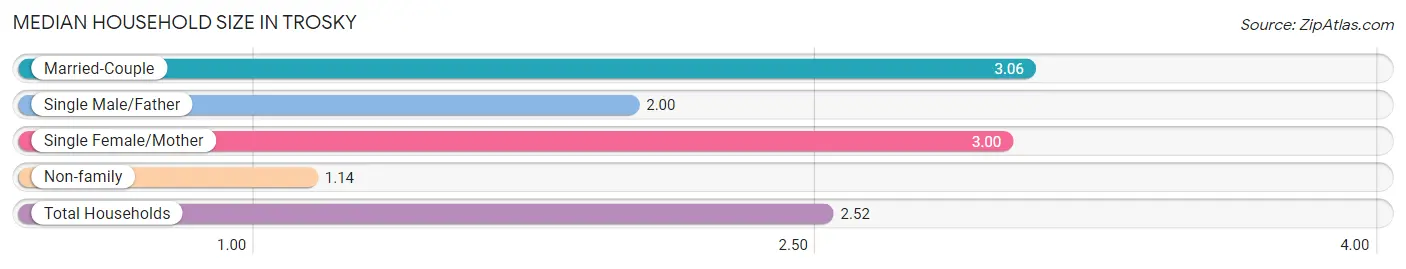
| Household Type | # Households | Household Size |
| Married-Couple | 16 (59.3%) | 3.06 |
| Single Male/Father | 1 (3.7%) | 2.00 |
| Single Female/Mother | 3 (11.1%) | 3.00 |
| Non-family | 7 (25.9%) | 1.14 |
| Total Households | 27 (100.0%) | 2.52 |
Household Size by Marriage Status in Trosky
Out of a total of 27 households in Trosky, 20 (74.1%) are family households, while 7 (25.9%) are nonfamily households. The most numerous type of family households are 2-person households, comprising 10, and the most common type of nonfamily households are 1-person households, comprising 5.
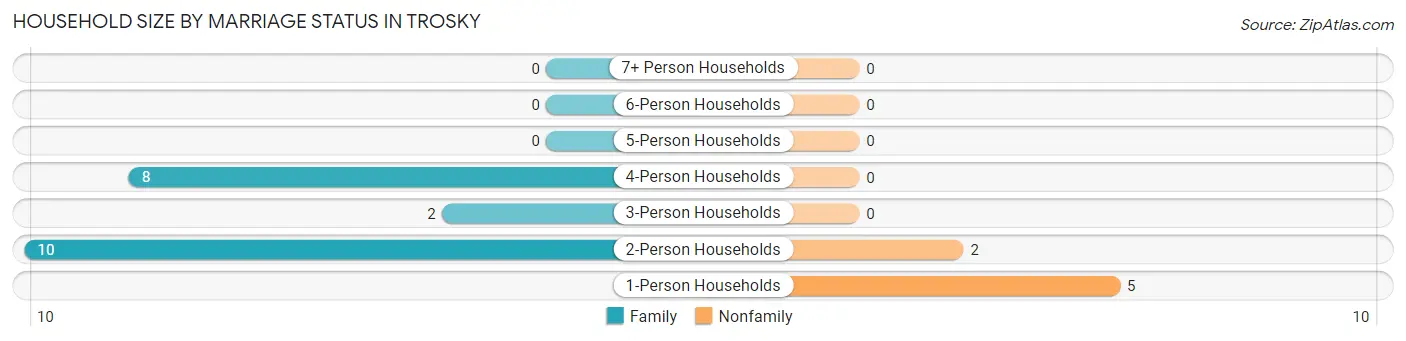
| Household Size | Family Households | Nonfamily Households |
| 1-Person Households | - | 5 (18.5%) |
| 2-Person Households | 10 (37.0%) | 2 (7.4%) |
| 3-Person Households | 2 (7.4%) | 0 (0.0%) |
| 4-Person Households | 8 (29.6%) | 0 (0.0%) |
| 5-Person Households | 0 (0.0%) | 0 (0.0%) |
| 6-Person Households | 0 (0.0%) | 0 (0.0%) |
| 7+ Person Households | 0 (0.0%) | 0 (0.0%) |
| Total | 20 (74.1%) | 7 (25.9%) |
Female Fertility in Trosky
Fertility by Age in Trosky
Average fertility rate in Trosky is 100.0 births per 1,000 women. Women in the age bracket of 20 to 34 years have the highest fertility rate with 333.0 births per 1,000 women. Women in the age bracket of 20 to 34 years acount for 100.0% of all women with births.
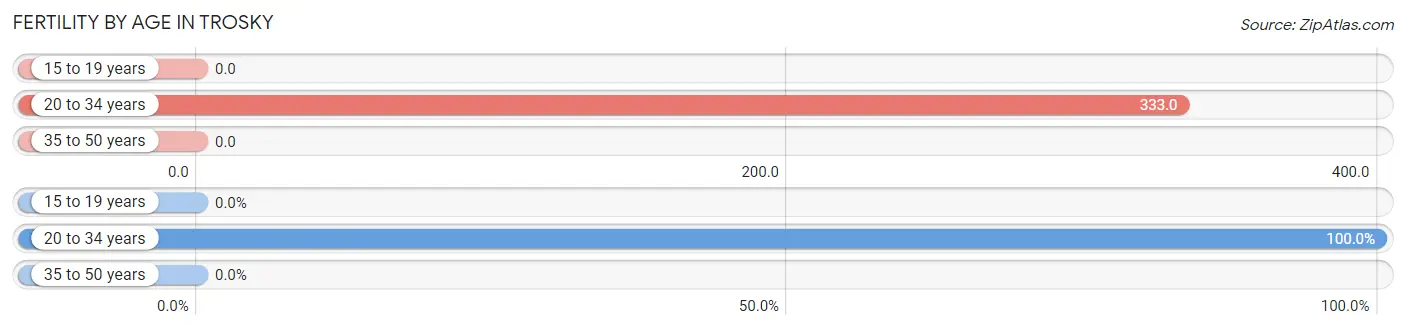
| Age Bracket | Women with Births | Births / 1,000 Women |
| 15 to 19 years | 0 (0.0%) | 0.0 |
| 20 to 34 years | 2 (100.0%) | 333.0 |
| 35 to 50 years | 0 (0.0%) | 0.0 |
| Total | 2 (100.0%) | 100.0 |
Fertility by Age by Marriage Status in Trosky
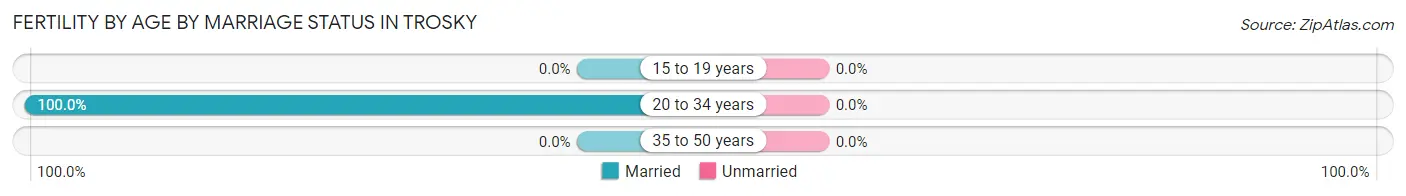
| Age Bracket | Married | Unmarried |
| 15 to 19 years | 0 (0.0%) | 0 (0.0%) |
| 20 to 34 years | 2 (100.0%) | 0 (0.0%) |
| 35 to 50 years | 0 (0.0%) | 0 (0.0%) |
| Total | 2 (100.0%) | 0 (0.0%) |
Fertility by Education in Trosky
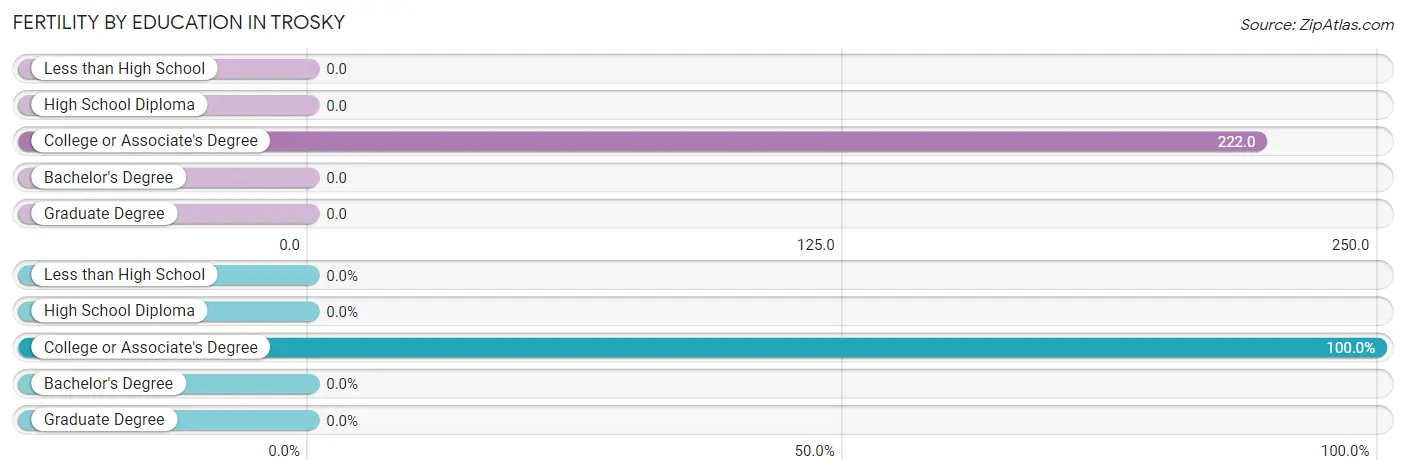
| Educational Attainment | Women with Births | Births / 1,000 Women |
| Less than High School | 0 (0.0%) | 0.0 |
| High School Diploma | 0 (0.0%) | 0.0 |
| College or Associate's Degree | 2 (100.0%) | 222.0 |
| Bachelor's Degree | 0 (0.0%) | 0.0 |
| Graduate Degree | 0 (0.0%) | 0.0 |
| Total | 2 (100.0%) | 100.0 |
Fertility by Education by Marriage Status in Trosky
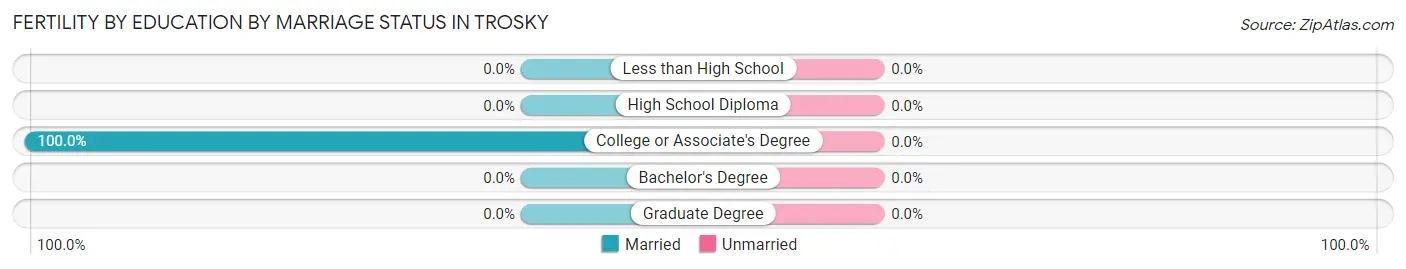
| Educational Attainment | Married | Unmarried |
| Less than High School | 0 (0.0%) | 0 (0.0%) |
| High School Diploma | 0 (0.0%) | 0 (0.0%) |
| College or Associate's Degree | 2 (100.0%) | 0 (0.0%) |
| Bachelor's Degree | 0 (0.0%) | 0 (0.0%) |
| Graduate Degree | 0 (0.0%) | 0 (0.0%) |
| Total | 2 (100.0%) | 0 (0.0%) |
Employment Characteristics in Trosky
Employment by Class of Employer in Trosky
Among the 37 employed individuals in Trosky, private company employees (31 | 83.8%), self-employed (not incorporated) (4 | 10.8%), and self-employed (incorporated) (1 | 2.7%) make up the most common classes of employment.
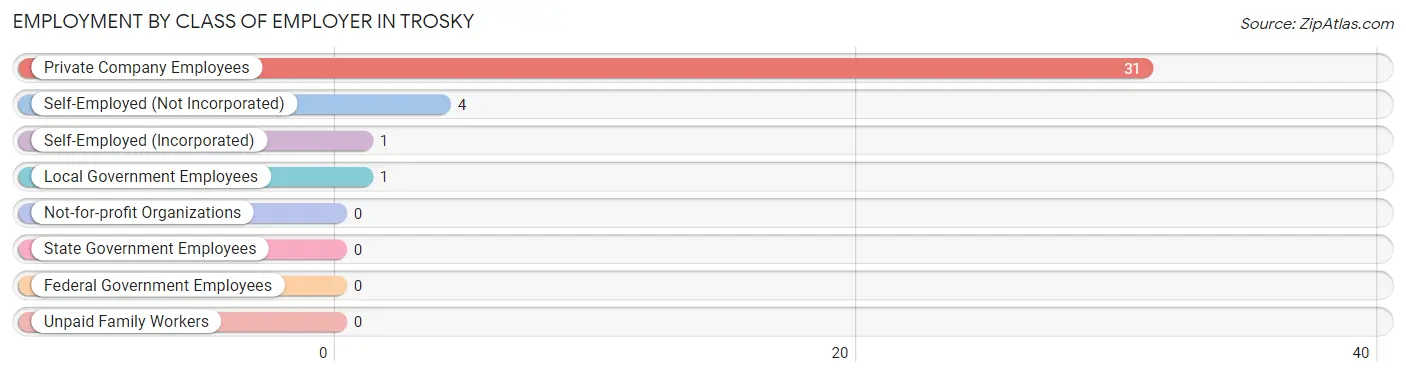
| Employer Class | # Employees | % Employees |
| Private Company Employees | 31 | 83.8% |
| Self-Employed (Incorporated) | 1 | 2.7% |
| Self-Employed (Not Incorporated) | 4 | 10.8% |
| Not-for-profit Organizations | 0 | 0.0% |
| Local Government Employees | 1 | 2.7% |
| State Government Employees | 0 | 0.0% |
| Federal Government Employees | 0 | 0.0% |
| Unpaid Family Workers | 0 | 0.0% |
| Total | 37 | 100.0% |
Employment Status by Age in Trosky
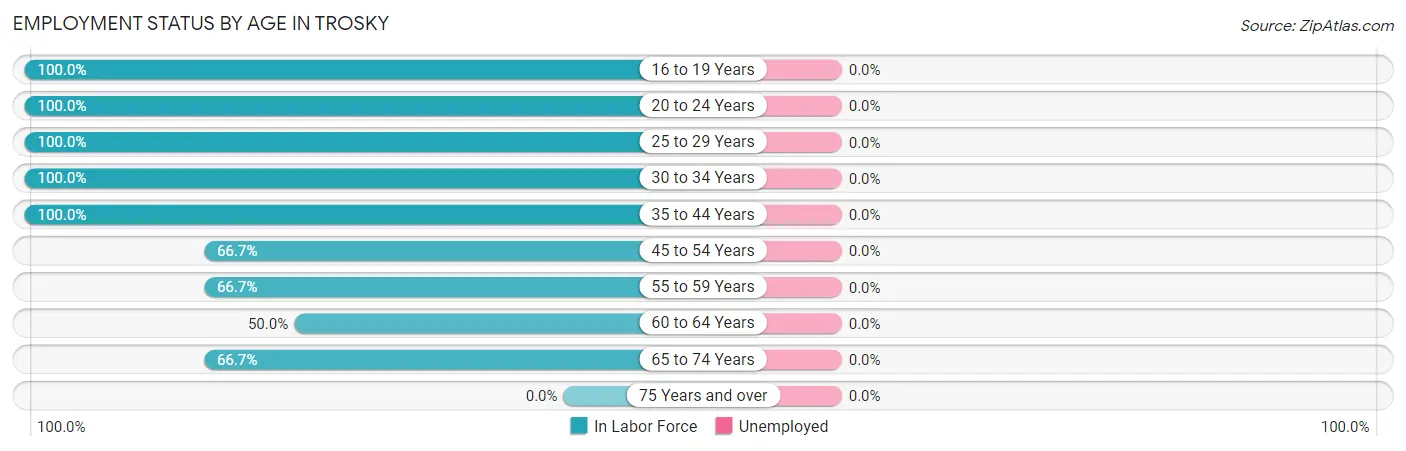
| Age Bracket | In Labor Force | Unemployed |
| 16 to 19 Years | 3 (100.0%) | 0 (0.0%) |
| 20 to 24 Years | 2 (100.0%) | 0 (0.0%) |
| 25 to 29 Years | 4 (100.0%) | 0 (0.0%) |
| 30 to 34 Years | 3 (100.0%) | 0 (0.0%) |
| 35 to 44 Years | 10 (100.0%) | 0 (0.0%) |
| 45 to 54 Years | 6 (66.7%) | 0 (0.0%) |
| 55 to 59 Years | 4 (66.7%) | 0 (0.0%) |
| 60 to 64 Years | 2 (50.0%) | 0 (0.0%) |
| 65 to 74 Years | 8 (66.7%) | 0 (0.0%) |
| 75 Years and over | 0 (0.0%) | 0 (0.0%) |
| Total | 42 (77.8%) | 0 (0.0%) |
Employment Status by Educational Attainment in Trosky
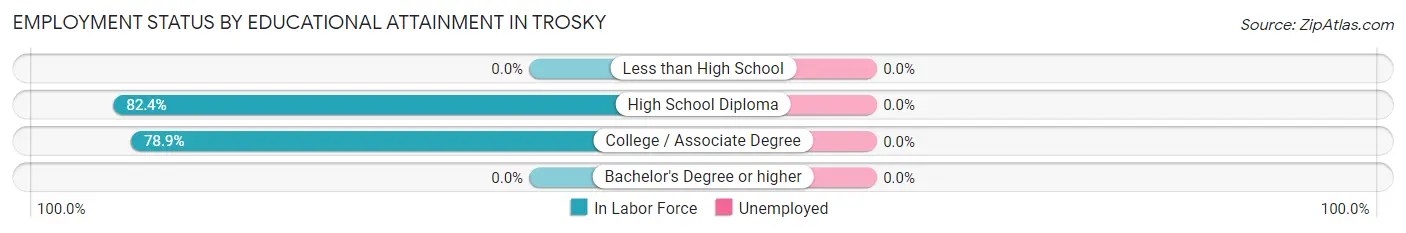
| Educational Attainment | In Labor Force | Unemployed |
| Less than High School | 0 (0.0%) | 0 (0.0%) |
| High School Diploma | 14 (82.4%) | 0 (0.0%) |
| College / Associate Degree | 15 (78.9%) | 0 (0.0%) |
| Bachelor's Degree or higher | 0 (0.0%) | 0 (0.0%) |
| Total | 29 (80.6%) | 0 (0.0%) |
Employment Occupations by Sex in Trosky
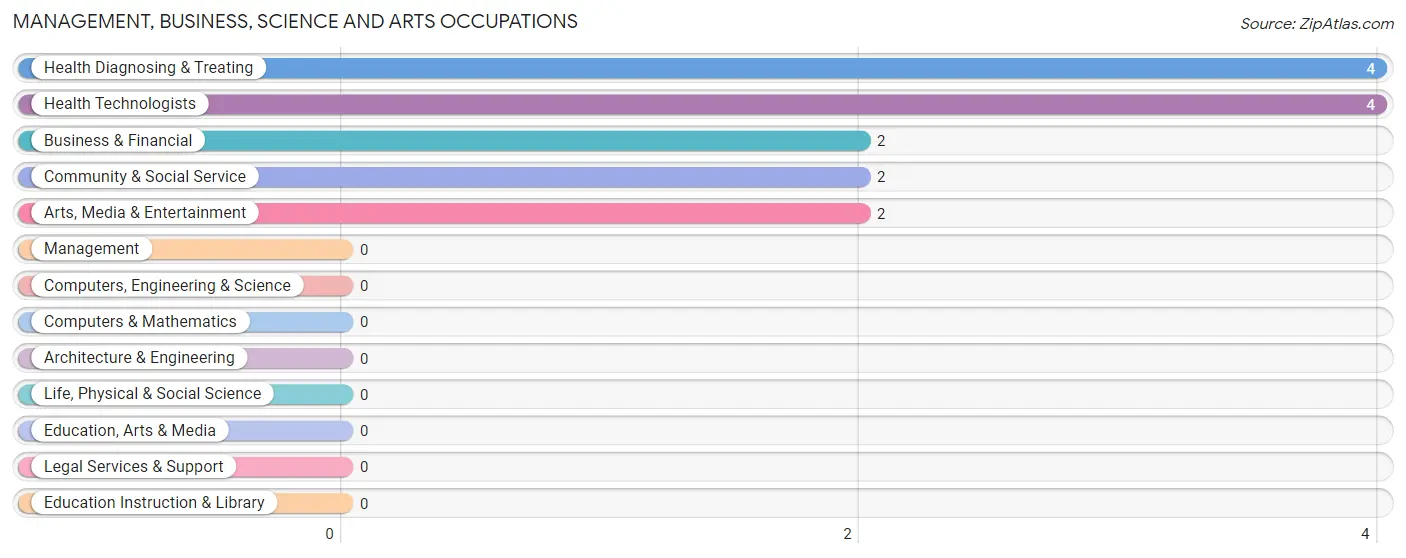
Management, Business, Science and Arts Occupations
The most common Management, Business, Science and Arts occupations in Trosky are Health Diagnosing & Treating (4 | 9.5%), Health Technologists (4 | 9.5%), Business & Financial (2 | 4.8%), Community & Social Service (2 | 4.8%), and Arts, Media & Entertainment (2 | 4.8%).
Management, Business, Science and Arts Occupations by Sex
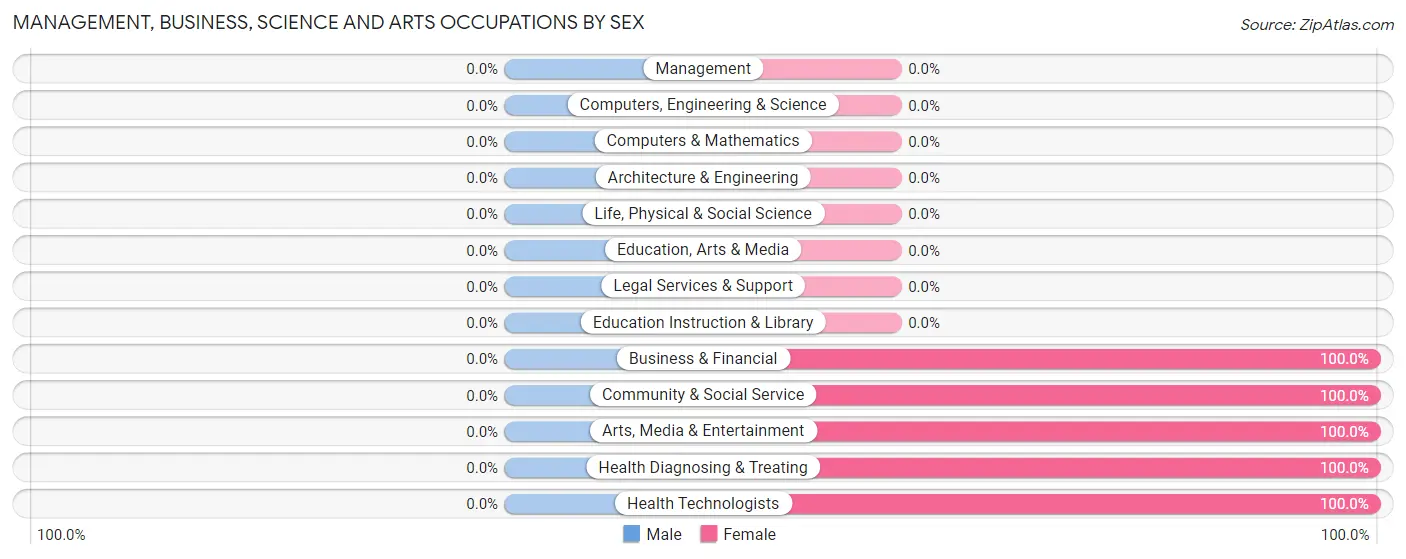
| Occupation | Male | Female |
| Management | 0 (0.0%) | 0 (0.0%) |
| Business & Financial | 0 (0.0%) | 2 (100.0%) |
| Computers, Engineering & Science | 0 (0.0%) | 0 (0.0%) |
| Computers & Mathematics | 0 (0.0%) | 0 (0.0%) |
| Architecture & Engineering | 0 (0.0%) | 0 (0.0%) |
| Life, Physical & Social Science | 0 (0.0%) | 0 (0.0%) |
| Community & Social Service | 0 (0.0%) | 2 (100.0%) |
| Education, Arts & Media | 0 (0.0%) | 0 (0.0%) |
| Legal Services & Support | 0 (0.0%) | 0 (0.0%) |
| Education Instruction & Library | 0 (0.0%) | 0 (0.0%) |
| Arts, Media & Entertainment | 0 (0.0%) | 2 (100.0%) |
| Health Diagnosing & Treating | 0 (0.0%) | 4 (100.0%) |
| Health Technologists | 0 (0.0%) | 4 (100.0%) |
| Total (Category) | 0 (0.0%) | 8 (100.0%) |
| Total (Overall) | 22 (52.4%) | 20 (47.6%) |
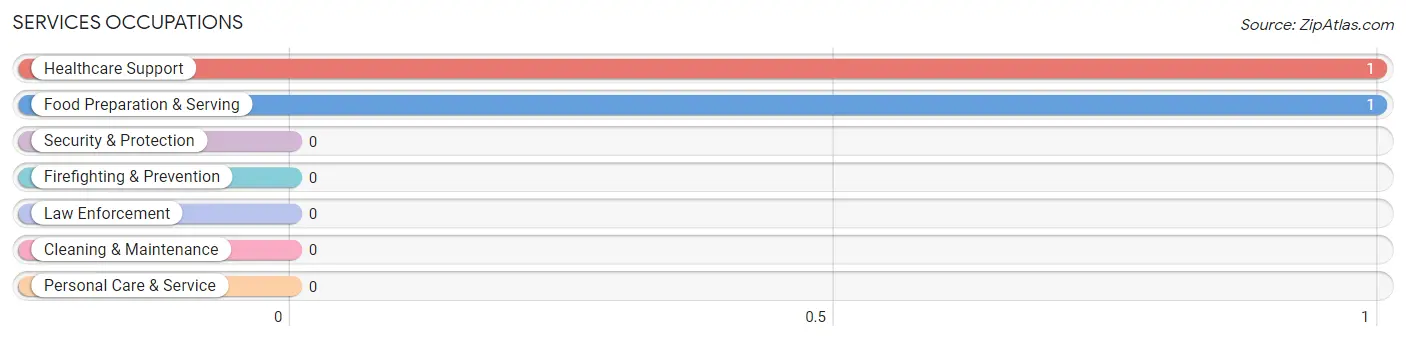
Services Occupations
The most common Services occupations in Trosky are Healthcare Support (1 | 2.4%), and Food Preparation & Serving (1 | 2.4%).
Services Occupations by Sex
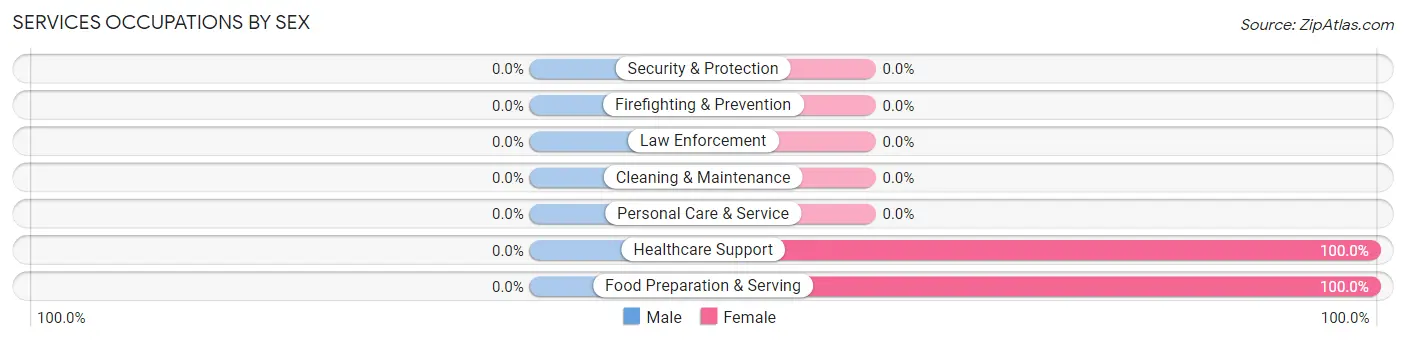
| Occupation | Male | Female |
| Healthcare Support | 0 (0.0%) | 1 (100.0%) |
| Security & Protection | 0 (0.0%) | 0 (0.0%) |
| Firefighting & Prevention | 0 (0.0%) | 0 (0.0%) |
| Law Enforcement | 0 (0.0%) | 0 (0.0%) |
| Food Preparation & Serving | 0 (0.0%) | 1 (100.0%) |
| Cleaning & Maintenance | 0 (0.0%) | 0 (0.0%) |
| Personal Care & Service | 0 (0.0%) | 0 (0.0%) |
| Total (Category) | 0 (0.0%) | 2 (100.0%) |
| Total (Overall) | 22 (52.4%) | 20 (47.6%) |
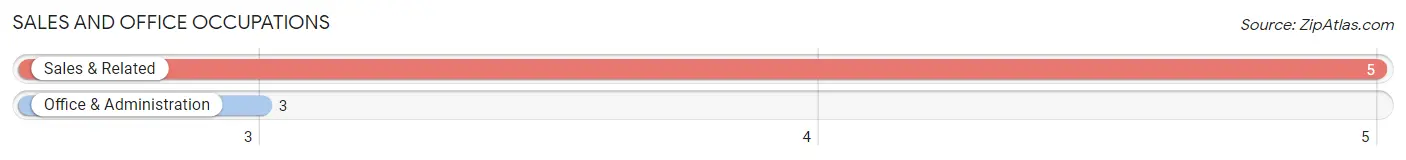
Sales and Office Occupations
The most common Sales and Office occupations in Trosky are Sales & Related (5 | 11.9%), and Office & Administration (3 | 7.1%).
Sales and Office Occupations by Sex

| Occupation | Male | Female |
| Sales & Related | 1 (20.0%) | 4 (80.0%) |
| Office & Administration | 0 (0.0%) | 3 (100.0%) |
| Total (Category) | 1 (12.5%) | 7 (87.5%) |
| Total (Overall) | 22 (52.4%) | 20 (47.6%) |
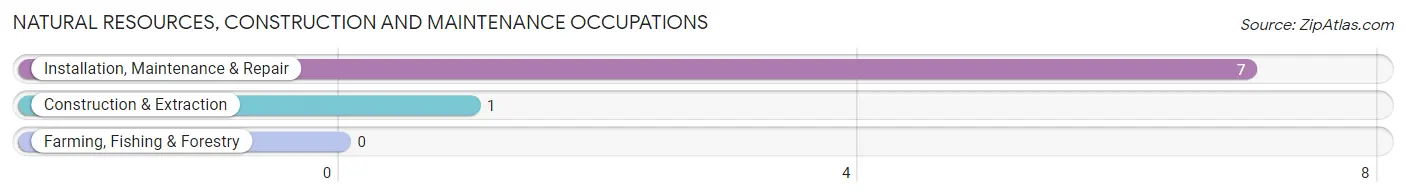
Natural Resources, Construction and Maintenance Occupations
The most common Natural Resources, Construction and Maintenance occupations in Trosky are Installation, Maintenance & Repair (7 | 16.7%), and Construction & Extraction (1 | 2.4%).
Natural Resources, Construction and Maintenance Occupations by Sex
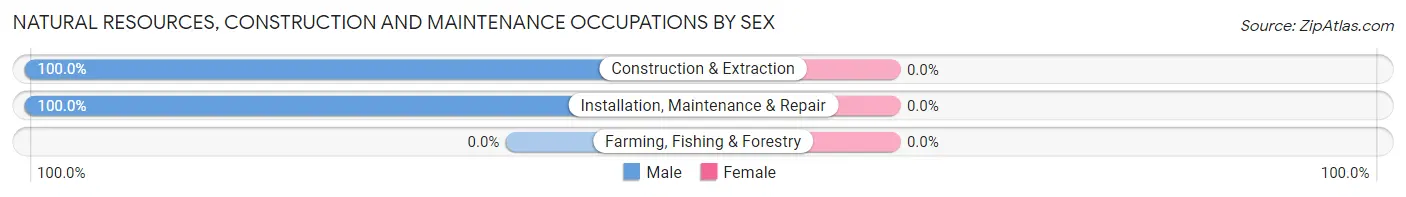
| Occupation | Male | Female |
| Farming, Fishing & Forestry | 0 (0.0%) | 0 (0.0%) |
| Construction & Extraction | 1 (100.0%) | 0 (0.0%) |
| Installation, Maintenance & Repair | 7 (100.0%) | 0 (0.0%) |
| Total (Category) | 8 (100.0%) | 0 (0.0%) |
| Total (Overall) | 22 (52.4%) | 20 (47.6%) |
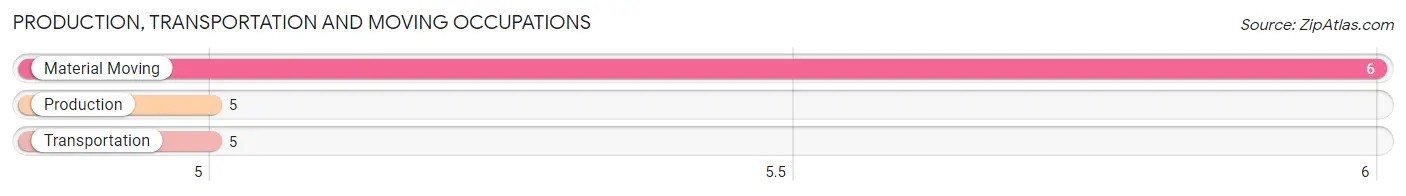
Production, Transportation and Moving Occupations
The most common Production, Transportation and Moving occupations in Trosky are Material Moving (6 | 14.3%), Production (5 | 11.9%), and Transportation (5 | 11.9%).
Production, Transportation and Moving Occupations by Sex
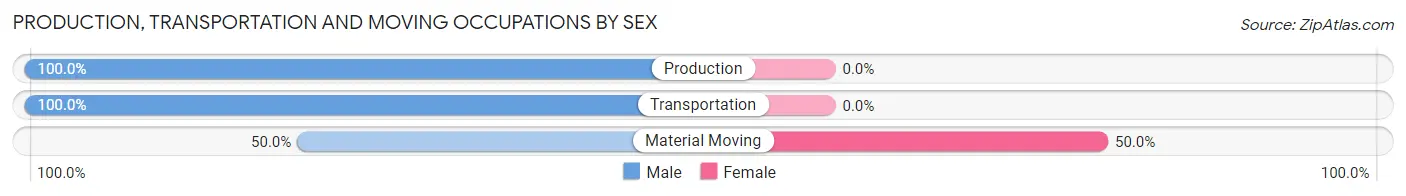
| Occupation | Male | Female |
| Production | 5 (100.0%) | 0 (0.0%) |
| Transportation | 5 (100.0%) | 0 (0.0%) |
| Material Moving | 3 (50.0%) | 3 (50.0%) |
| Total (Category) | 13 (81.2%) | 3 (18.8%) |
| Total (Overall) | 22 (52.4%) | 20 (47.6%) |
Employment Industries by Sex in Trosky
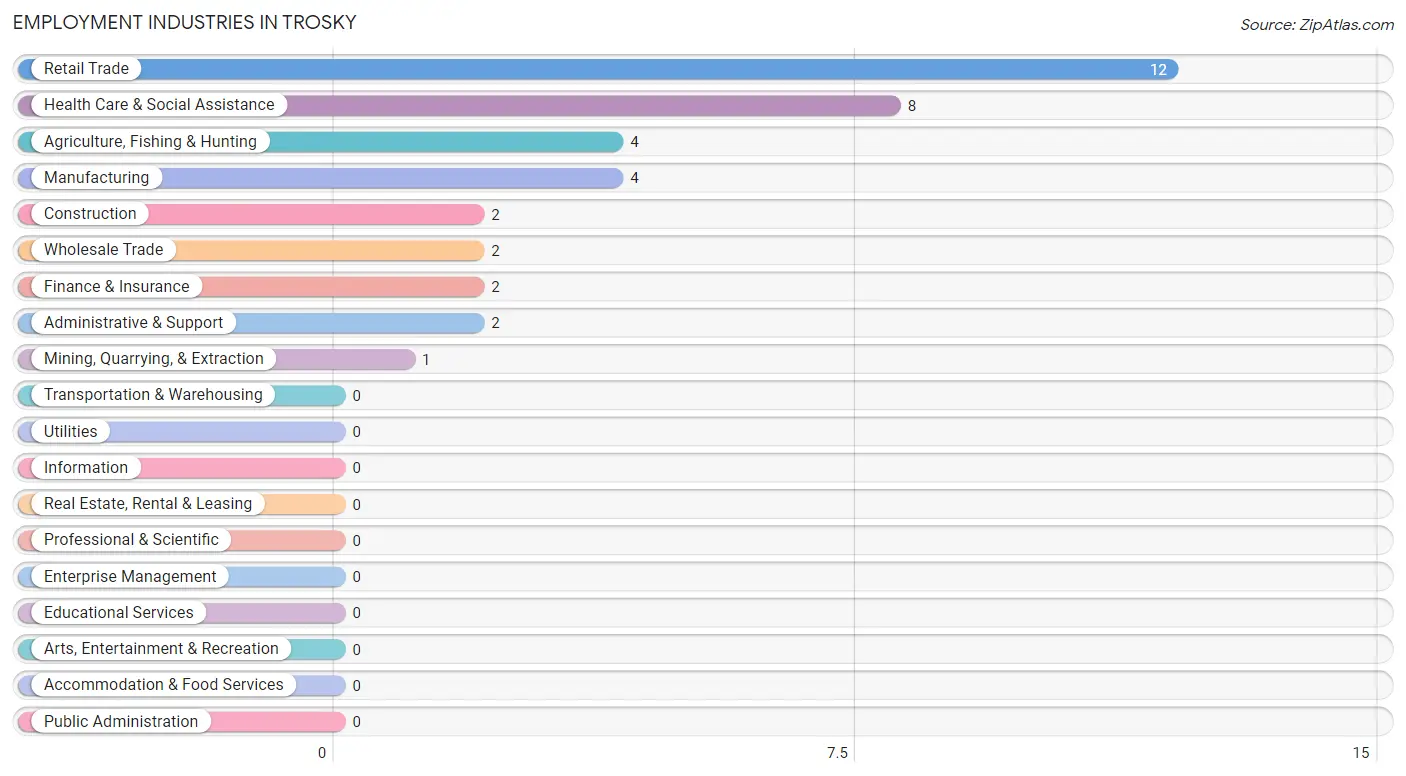
Employment Industries in Trosky
The major employment industries in Trosky include Retail Trade (12 | 28.6%), Health Care & Social Assistance (8 | 19.1%), Agriculture, Fishing & Hunting (4 | 9.5%), Manufacturing (4 | 9.5%), and Construction (2 | 4.8%).
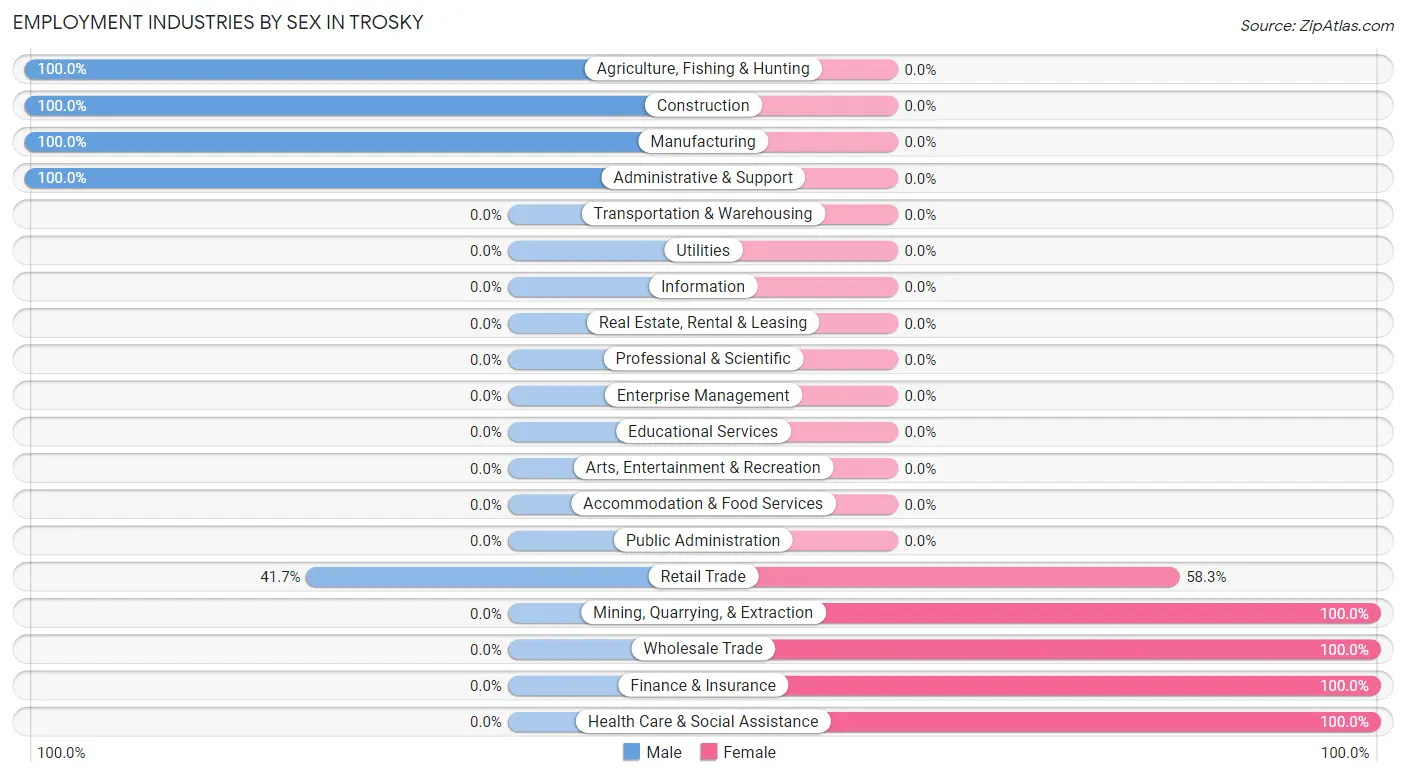
Employment Industries by Sex in Trosky
The Trosky industries that see more men than women are Agriculture, Fishing & Hunting (100.0%), Construction (100.0%), and Manufacturing (100.0%), whereas the industries that tend to have a higher number of women are Mining, Quarrying, & Extraction (100.0%), Wholesale Trade (100.0%), and Finance & Insurance (100.0%).
| Industry | Male | Female |
| Agriculture, Fishing & Hunting | 4 (100.0%) | 0 (0.0%) |
| Mining, Quarrying, & Extraction | 0 (0.0%) | 1 (100.0%) |
| Construction | 2 (100.0%) | 0 (0.0%) |
| Manufacturing | 4 (100.0%) | 0 (0.0%) |
| Wholesale Trade | 0 (0.0%) | 2 (100.0%) |
| Retail Trade | 5 (41.7%) | 7 (58.3%) |
| Transportation & Warehousing | 0 (0.0%) | 0 (0.0%) |
| Utilities | 0 (0.0%) | 0 (0.0%) |
| Information | 0 (0.0%) | 0 (0.0%) |
| Finance & Insurance | 0 (0.0%) | 2 (100.0%) |
| Real Estate, Rental & Leasing | 0 (0.0%) | 0 (0.0%) |
| Professional & Scientific | 0 (0.0%) | 0 (0.0%) |
| Enterprise Management | 0 (0.0%) | 0 (0.0%) |
| Administrative & Support | 2 (100.0%) | 0 (0.0%) |
| Educational Services | 0 (0.0%) | 0 (0.0%) |
| Health Care & Social Assistance | 0 (0.0%) | 8 (100.0%) |
| Arts, Entertainment & Recreation | 0 (0.0%) | 0 (0.0%) |
| Accommodation & Food Services | 0 (0.0%) | 0 (0.0%) |
| Public Administration | 0 (0.0%) | 0 (0.0%) |
| Total | 22 (52.4%) | 20 (47.6%) |
Education in Trosky
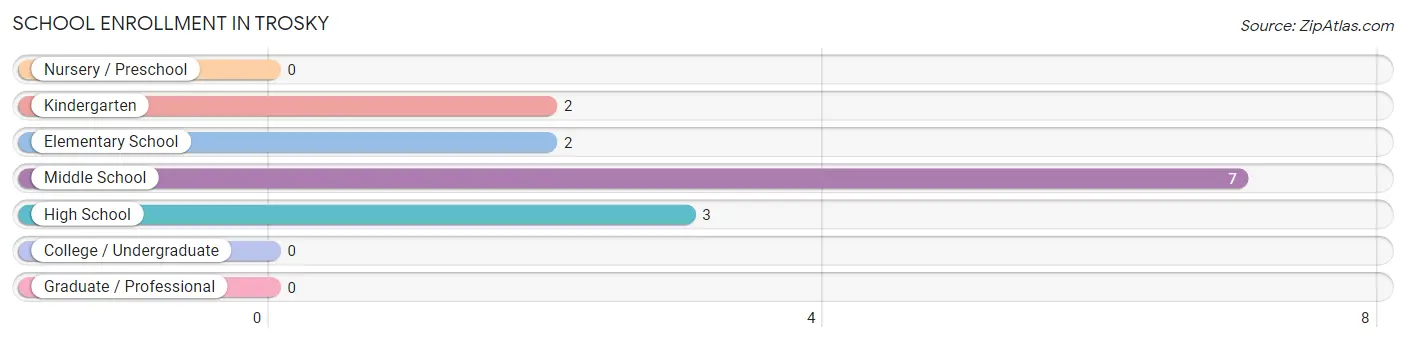
School Enrollment in Trosky
The most common levels of schooling among the 14 students in Trosky are middle school (7 | 50.0%), high school (3 | 21.4%), and kindergarten (2 | 14.3%).
| School Level | # Students | % Students |
| Nursery / Preschool | 0 | 0.0% |
| Kindergarten | 2 | 14.3% |
| Elementary School | 2 | 14.3% |
| Middle School | 7 | 50.0% |
| High School | 3 | 21.4% |
| College / Undergraduate | 0 | 0.0% |
| Graduate / Professional | 0 | 0.0% |
| Total | 14 | 100.0% |
School Enrollment by Age by Funding Source in Trosky
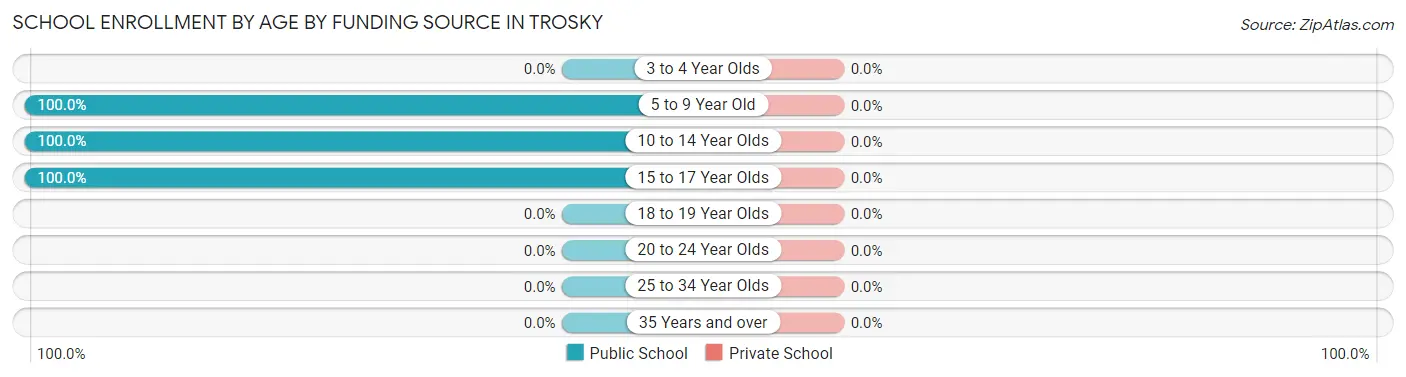
| Age Bracket | Public School | Private School |
| 3 to 4 Year Olds | 0 (0.0%) | 0 (0.0%) |
| 5 to 9 Year Old | 4 (100.0%) | 0 (0.0%) |
| 10 to 14 Year Olds | 7 (100.0%) | 0 (0.0%) |
| 15 to 17 Year Olds | 3 (100.0%) | 0 (0.0%) |
| 18 to 19 Year Olds | 0 (0.0%) | 0 (0.0%) |
| 20 to 24 Year Olds | 0 (0.0%) | 0 (0.0%) |
| 25 to 34 Year Olds | 0 (0.0%) | 0 (0.0%) |
| 35 Years and over | 0 (0.0%) | 0 (0.0%) |
| Total | 14 (100.0%) | 0 (0.0%) |
Educational Attainment by Field of Study in Trosky
, and arts & humanities (2 | 100.0%) are the most common fields of study among 2 individuals in Trosky who have obtained a bachelor's degree or higher.
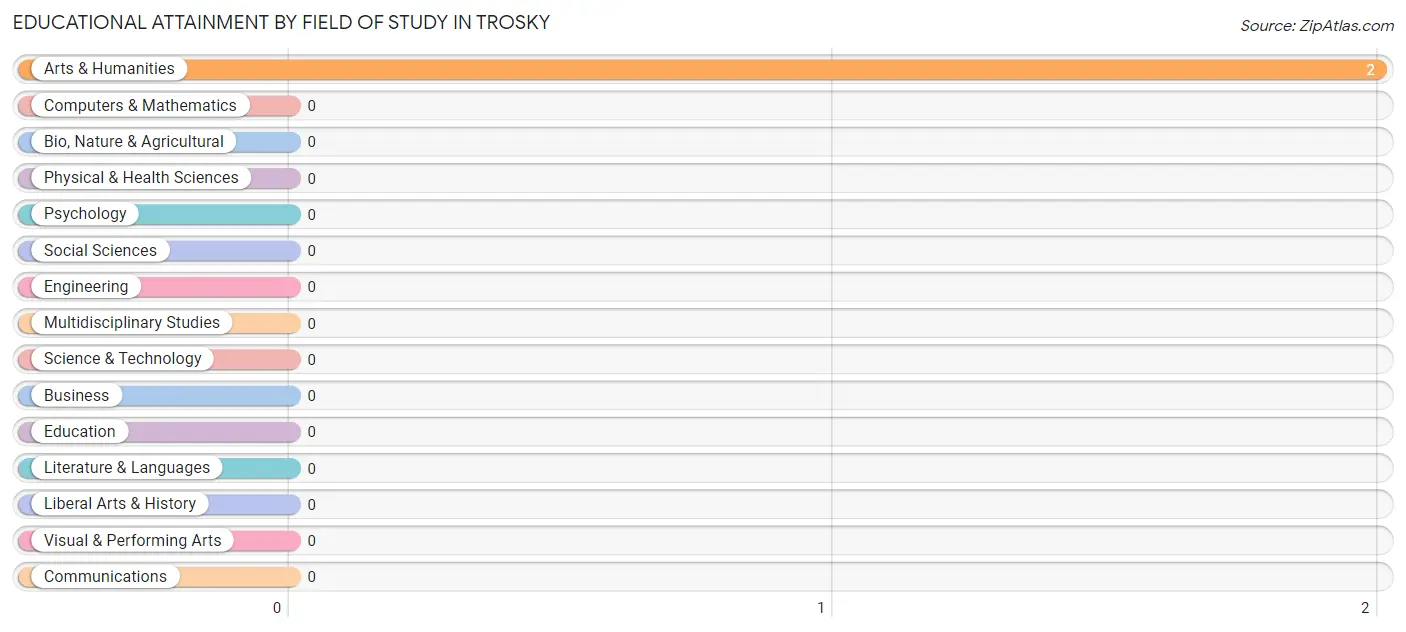
| Field of Study | # Graduates | % Graduates |
| Computers & Mathematics | 0 | 0.0% |
| Bio, Nature & Agricultural | 0 | 0.0% |
| Physical & Health Sciences | 0 | 0.0% |
| Psychology | 0 | 0.0% |
| Social Sciences | 0 | 0.0% |
| Engineering | 0 | 0.0% |
| Multidisciplinary Studies | 0 | 0.0% |
| Science & Technology | 0 | 0.0% |
| Business | 0 | 0.0% |
| Education | 0 | 0.0% |
| Literature & Languages | 0 | 0.0% |
| Liberal Arts & History | 0 | 0.0% |
| Visual & Performing Arts | 0 | 0.0% |
| Communications | 0 | 0.0% |
| Arts & Humanities | 2 | 100.0% |
| Total | 2 | 100.0% |
Transportation & Commute in Trosky
Vehicle Availability by Sex in Trosky
The most prevalent vehicle ownership categories in Trosky are males with 4 vehicles (8, accounting for 36.4%) and females with 4 vehicles (3, making up 53.3%).
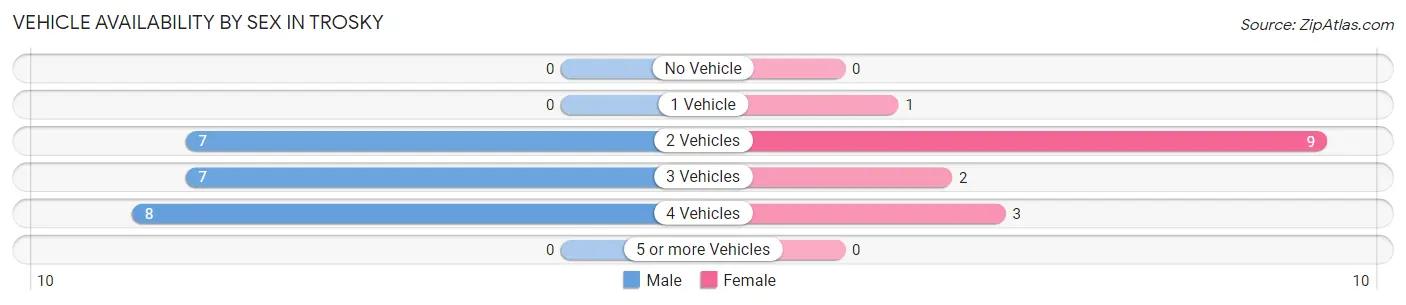
| Vehicles Available | Male | Female |
| No Vehicle | 0 (0.0%) | 0 (0.0%) |
| 1 Vehicle | 0 (0.0%) | 1 (6.7%) |
| 2 Vehicles | 7 (31.8%) | 9 (60.0%) |
| 3 Vehicles | 7 (31.8%) | 2 (13.3%) |
| 4 Vehicles | 8 (36.4%) | 3 (20.0%) |
| 5 or more Vehicles | 0 (0.0%) | 0 (0.0%) |
| Total | 22 (100.0%) | 15 (100.0%) |
Commute Time in Trosky
The most frequently occuring commute durations in Trosky are 15 to 19 minutes (18 commuters, 48.6%), 10 to 14 minutes (11 commuters, 29.7%), and 30 to 34 minutes (3 commuters, 8.1%).
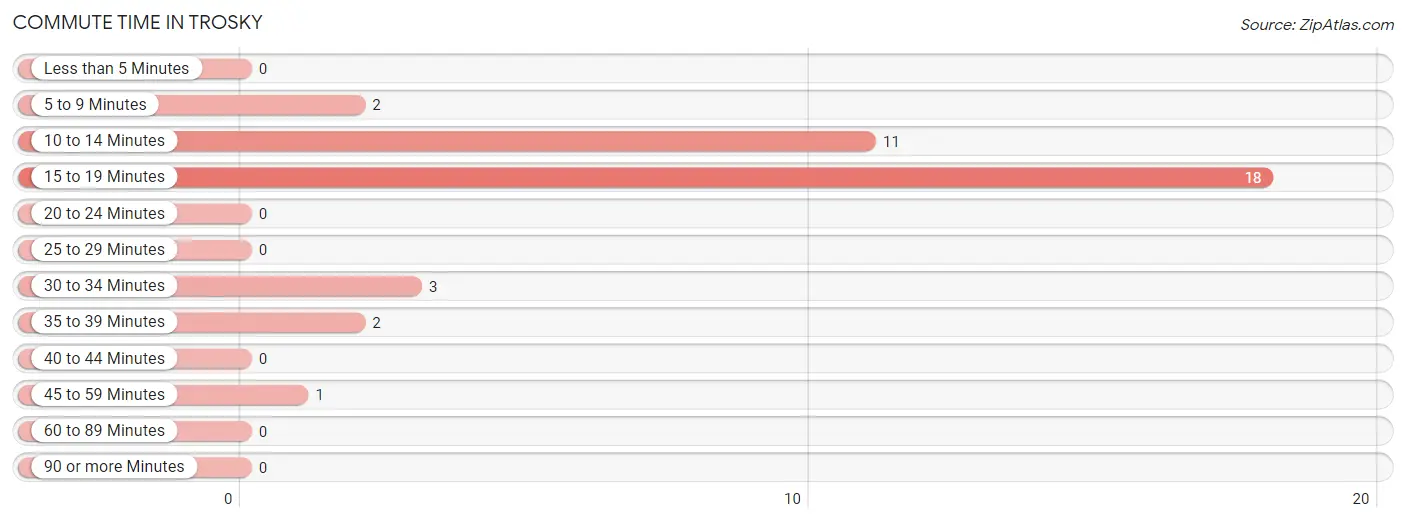
| Commute Time | # Commuters | % Commuters |
| Less than 5 Minutes | 0 | 0.0% |
| 5 to 9 Minutes | 2 | 5.4% |
| 10 to 14 Minutes | 11 | 29.7% |
| 15 to 19 Minutes | 18 | 48.6% |
| 20 to 24 Minutes | 0 | 0.0% |
| 25 to 29 Minutes | 0 | 0.0% |
| 30 to 34 Minutes | 3 | 8.1% |
| 35 to 39 Minutes | 2 | 5.4% |
| 40 to 44 Minutes | 0 | 0.0% |
| 45 to 59 Minutes | 1 | 2.7% |
| 60 to 89 Minutes | 0 | 0.0% |
| 90 or more Minutes | 0 | 0.0% |
Commute Time by Sex in Trosky
The most common commute times in Trosky are 15 to 19 minutes (11 commuters, 50.0%) for males and 15 to 19 minutes (7 commuters, 46.7%) for females.
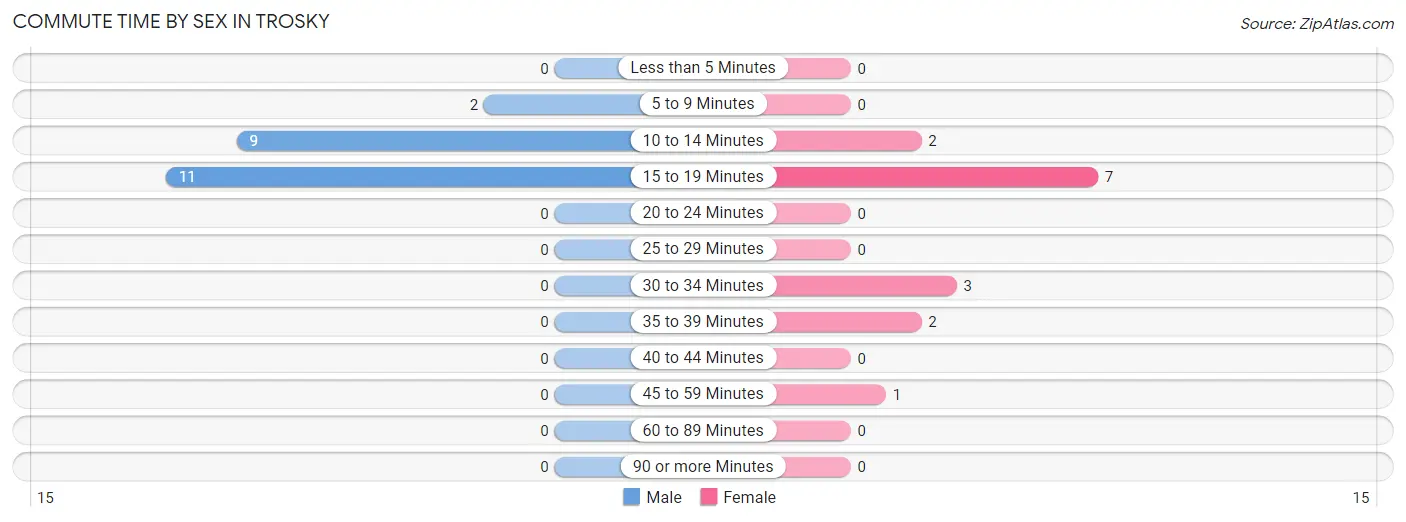
| Commute Time | Male | Female |
| Less than 5 Minutes | 0 (0.0%) | 0 (0.0%) |
| 5 to 9 Minutes | 2 (9.1%) | 0 (0.0%) |
| 10 to 14 Minutes | 9 (40.9%) | 2 (13.3%) |
| 15 to 19 Minutes | 11 (50.0%) | 7 (46.7%) |
| 20 to 24 Minutes | 0 (0.0%) | 0 (0.0%) |
| 25 to 29 Minutes | 0 (0.0%) | 0 (0.0%) |
| 30 to 34 Minutes | 0 (0.0%) | 3 (20.0%) |
| 35 to 39 Minutes | 0 (0.0%) | 2 (13.3%) |
| 40 to 44 Minutes | 0 (0.0%) | 0 (0.0%) |
| 45 to 59 Minutes | 0 (0.0%) | 1 (6.7%) |
| 60 to 89 Minutes | 0 (0.0%) | 0 (0.0%) |
| 90 or more Minutes | 0 (0.0%) | 0 (0.0%) |
Time of Departure to Work by Sex in Trosky
The most frequent times of departure to work in Trosky are 6:00 AM to 6:29 AM (8, 36.4%) for males and 7:30 AM to 7:59 AM (11, 73.3%) for females.
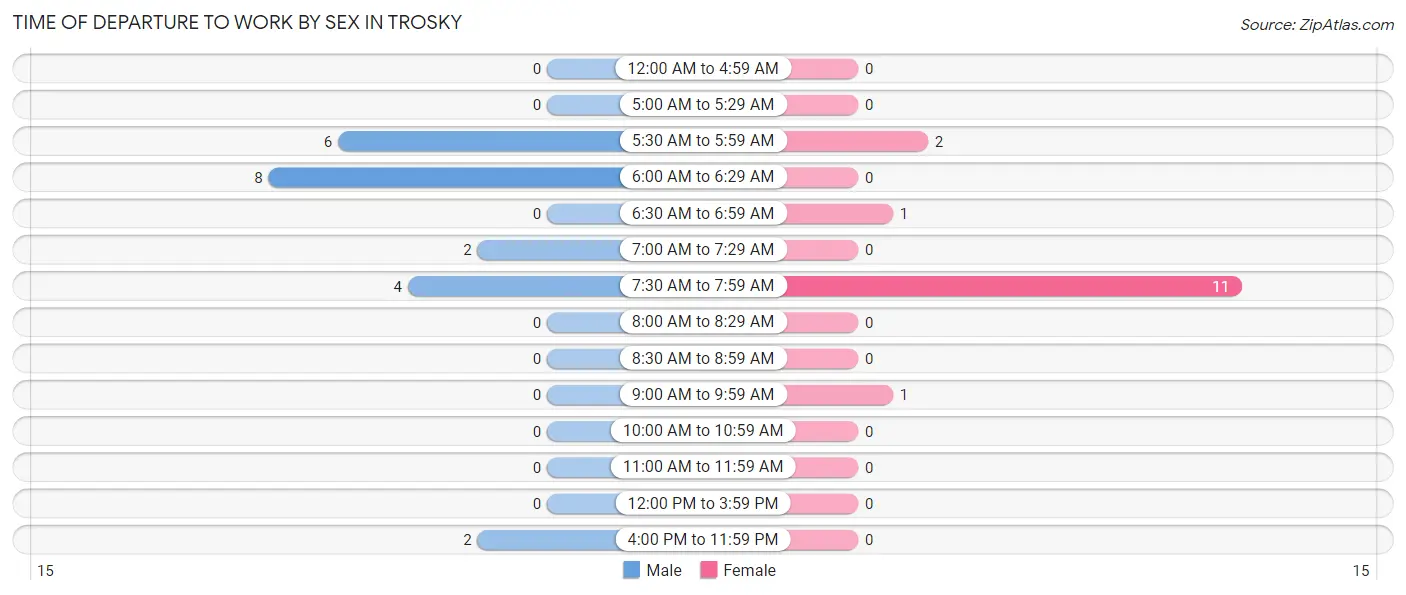
| Time of Departure | Male | Female |
| 12:00 AM to 4:59 AM | 0 (0.0%) | 0 (0.0%) |
| 5:00 AM to 5:29 AM | 0 (0.0%) | 0 (0.0%) |
| 5:30 AM to 5:59 AM | 6 (27.3%) | 2 (13.3%) |
| 6:00 AM to 6:29 AM | 8 (36.4%) | 0 (0.0%) |
| 6:30 AM to 6:59 AM | 0 (0.0%) | 1 (6.7%) |
| 7:00 AM to 7:29 AM | 2 (9.1%) | 0 (0.0%) |
| 7:30 AM to 7:59 AM | 4 (18.2%) | 11 (73.3%) |
| 8:00 AM to 8:29 AM | 0 (0.0%) | 0 (0.0%) |
| 8:30 AM to 8:59 AM | 0 (0.0%) | 0 (0.0%) |
| 9:00 AM to 9:59 AM | 0 (0.0%) | 1 (6.7%) |
| 10:00 AM to 10:59 AM | 0 (0.0%) | 0 (0.0%) |
| 11:00 AM to 11:59 AM | 0 (0.0%) | 0 (0.0%) |
| 12:00 PM to 3:59 PM | 0 (0.0%) | 0 (0.0%) |
| 4:00 PM to 11:59 PM | 2 (9.1%) | 0 (0.0%) |
| Total | 22 (100.0%) | 15 (100.0%) |
Housing Occupancy in Trosky
Occupancy by Ownership in Trosky
Of the total 27 dwellings in Trosky, owner-occupied units account for 27 (100.0%), while renter-occupied units make up 0 (0.0%).
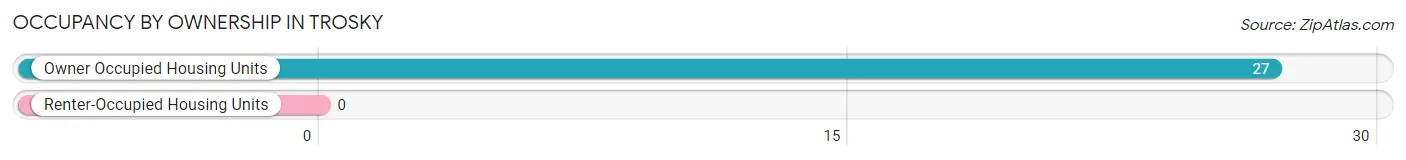
| Occupancy | # Housing Units | % Housing Units |
| Owner Occupied Housing Units | 27 | 100.0% |
| Renter-Occupied Housing Units | 0 | 0.0% |
| Total Occupied Housing Units | 27 | 100.0% |
Occupancy by Household Size in Trosky
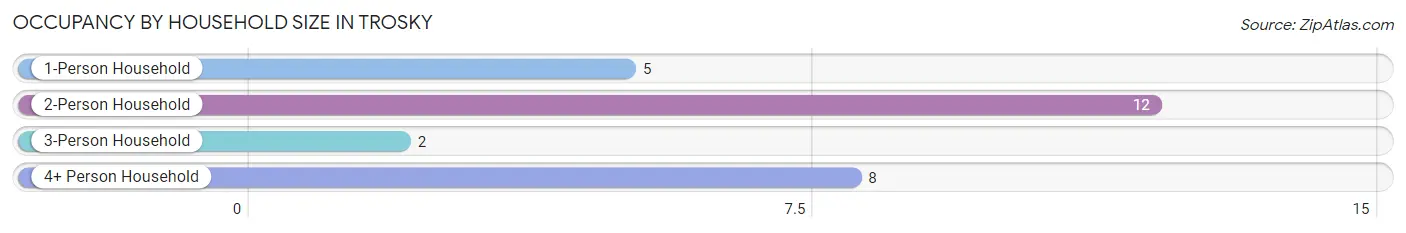
| Household Size | # Housing Units | % Housing Units |
| 1-Person Household | 5 | 18.5% |
| 2-Person Household | 12 | 44.4% |
| 3-Person Household | 2 | 7.4% |
| 4+ Person Household | 8 | 29.6% |
| Total Housing Units | 27 | 100.0% |
Occupancy by Ownership by Household Size in Trosky
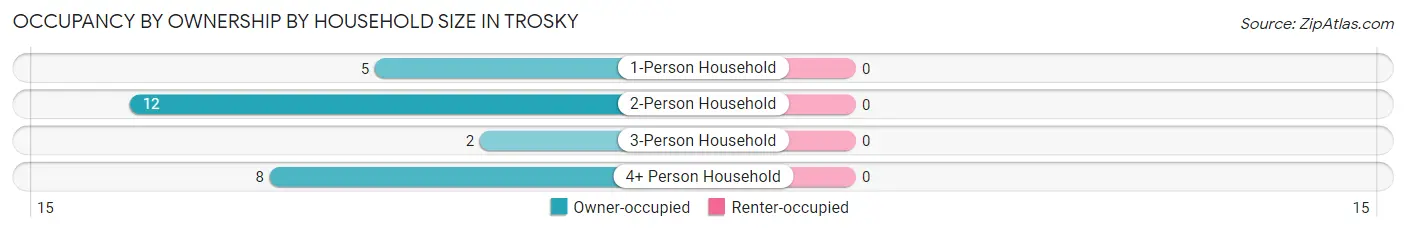
| Household Size | Owner-occupied | Renter-occupied |
| 1-Person Household | 5 (100.0%) | 0 (0.0%) |
| 2-Person Household | 12 (100.0%) | 0 (0.0%) |
| 3-Person Household | 2 (100.0%) | 0 (0.0%) |
| 4+ Person Household | 8 (100.0%) | 0 (0.0%) |
| Total Housing Units | 27 (100.0%) | 0 (0.0%) |
Occupancy by Educational Attainment in Trosky
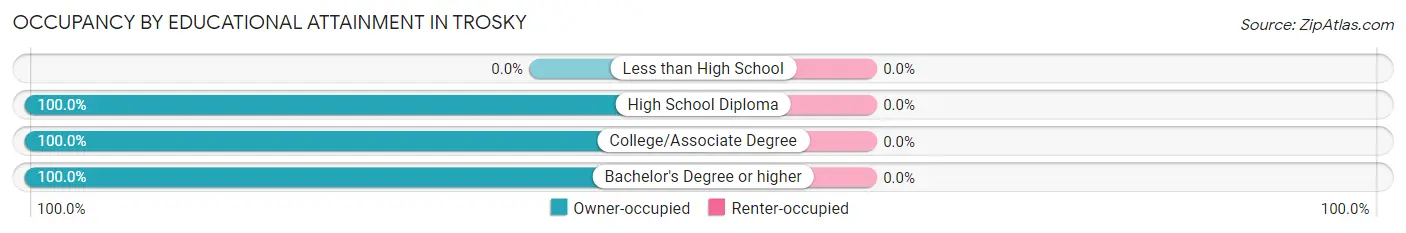
| Household Size | Owner-occupied | Renter-occupied |
| Less than High School | 0 (0.0%) | 0 (0.0%) |
| High School Diploma | 15 (100.0%) | 0 (0.0%) |
| College/Associate Degree | 10 (100.0%) | 0 (0.0%) |
| Bachelor's Degree or higher | 2 (100.0%) | 0 (0.0%) |
Occupancy by Age of Householder in Trosky
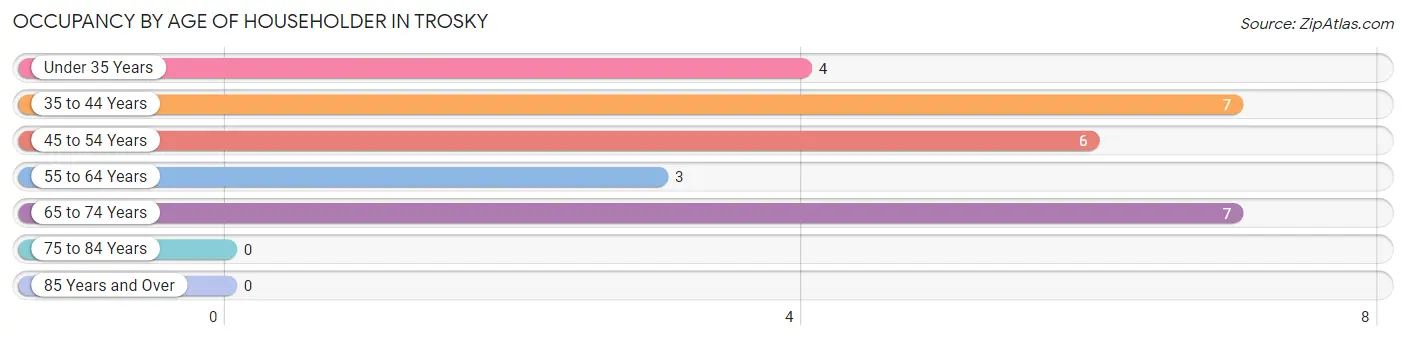
| Age Bracket | # Households | % Households |
| Under 35 Years | 4 | 14.8% |
| 35 to 44 Years | 7 | 25.9% |
| 45 to 54 Years | 6 | 22.2% |
| 55 to 64 Years | 3 | 11.1% |
| 65 to 74 Years | 7 | 25.9% |
| 75 to 84 Years | 0 | 0.0% |
| 85 Years and Over | 0 | 0.0% |
| Total | 27 | 100.0% |
Housing Finances in Trosky
Median Income by Occupancy in Trosky
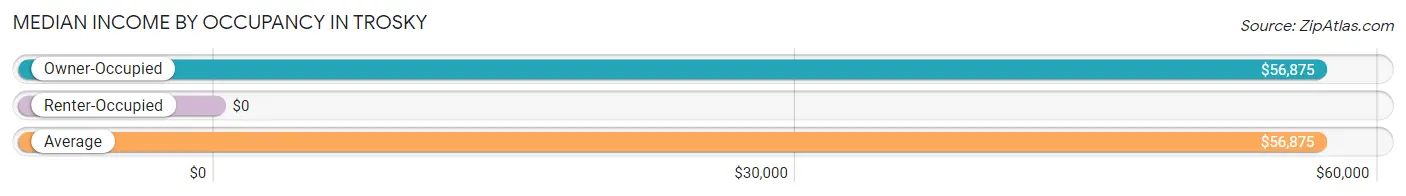
| Occupancy Type | # Households | Median Income |
| Owner-Occupied | 27 (100.0%) | $56,875 |
| Renter-Occupied | 0 (0.0%) | $0 |
| Average | 27 (100.0%) | $56,875 |
Occupancy by Householder Income Bracket in Trosky
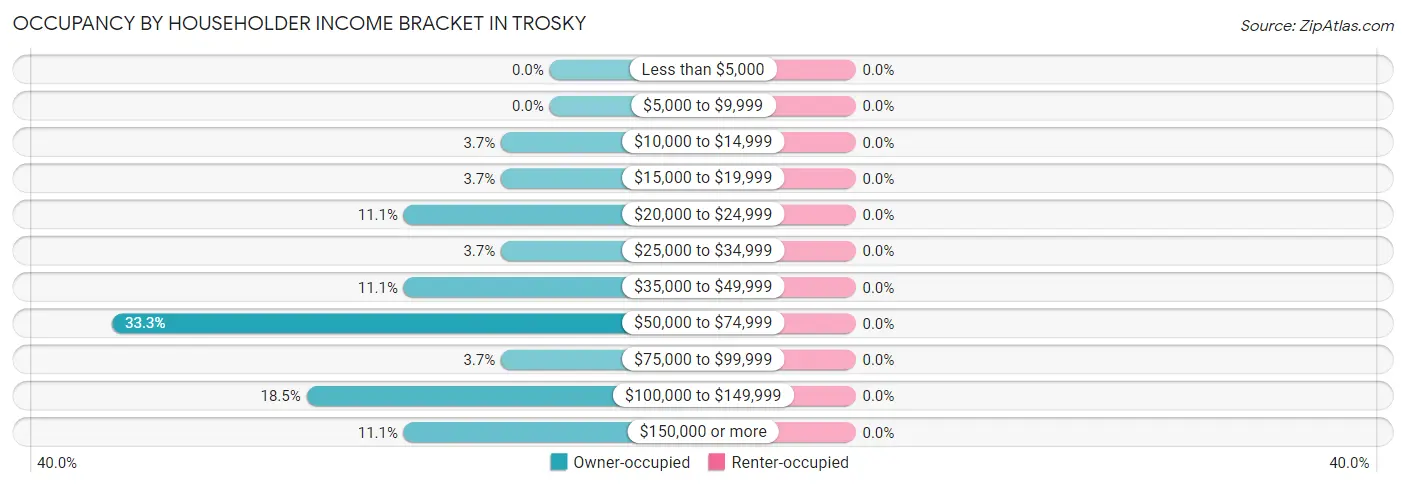
| Income Bracket | Owner-occupied | Renter-occupied |
| Less than $5,000 | 0 (0.0%) | 0 (0.0%) |
| $5,000 to $9,999 | 0 (0.0%) | 0 (0.0%) |
| $10,000 to $14,999 | 1 (3.7%) | 0 (0.0%) |
| $15,000 to $19,999 | 1 (3.7%) | 0 (0.0%) |
| $20,000 to $24,999 | 3 (11.1%) | 0 (0.0%) |
| $25,000 to $34,999 | 1 (3.7%) | 0 (0.0%) |
| $35,000 to $49,999 | 3 (11.1%) | 0 (0.0%) |
| $50,000 to $74,999 | 9 (33.3%) | 0 (0.0%) |
| $75,000 to $99,999 | 1 (3.7%) | 0 (0.0%) |
| $100,000 to $149,999 | 5 (18.5%) | 0 (0.0%) |
| $150,000 or more | 3 (11.1%) | 0 (0.0%) |
| Total | 27 (100.0%) | 0 (0.0%) |
Monthly Housing Cost Tiers in Trosky
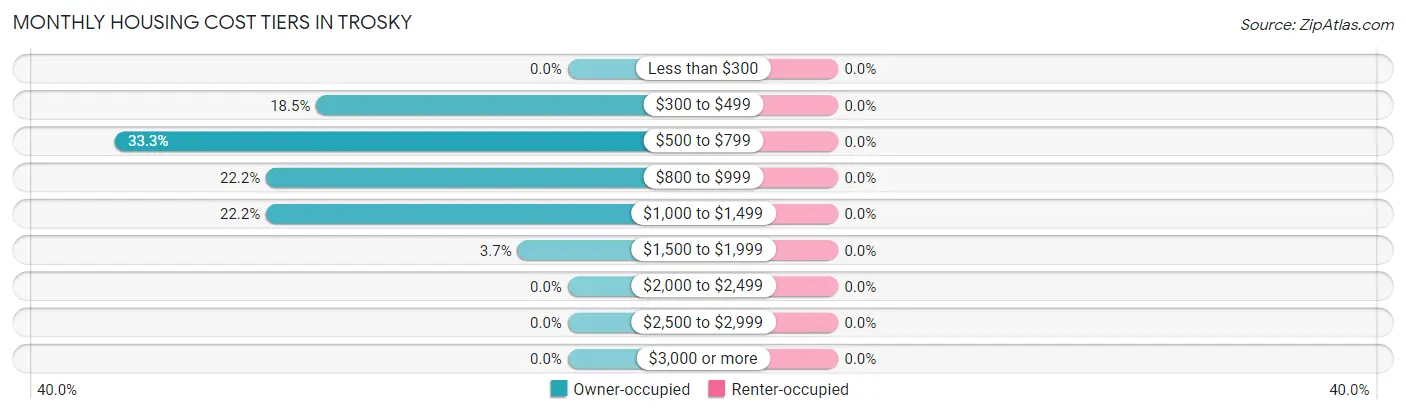
| Monthly Cost | Owner-occupied | Renter-occupied |
| Less than $300 | 0 (0.0%) | 0 (0.0%) |
| $300 to $499 | 5 (18.5%) | 0 (0.0%) |
| $500 to $799 | 9 (33.3%) | 0 (0.0%) |
| $800 to $999 | 6 (22.2%) | 0 (0.0%) |
| $1,000 to $1,499 | 6 (22.2%) | 0 (0.0%) |
| $1,500 to $1,999 | 1 (3.7%) | 0 (0.0%) |
| $2,000 to $2,499 | 0 (0.0%) | 0 (0.0%) |
| $2,500 to $2,999 | 0 (0.0%) | 0 (0.0%) |
| $3,000 or more | 0 (0.0%) | 0 (0.0%) |
| Total | 27 (100.0%) | 0 (0.0%) |
Physical Housing Characteristics in Trosky
Housing Structures in Trosky
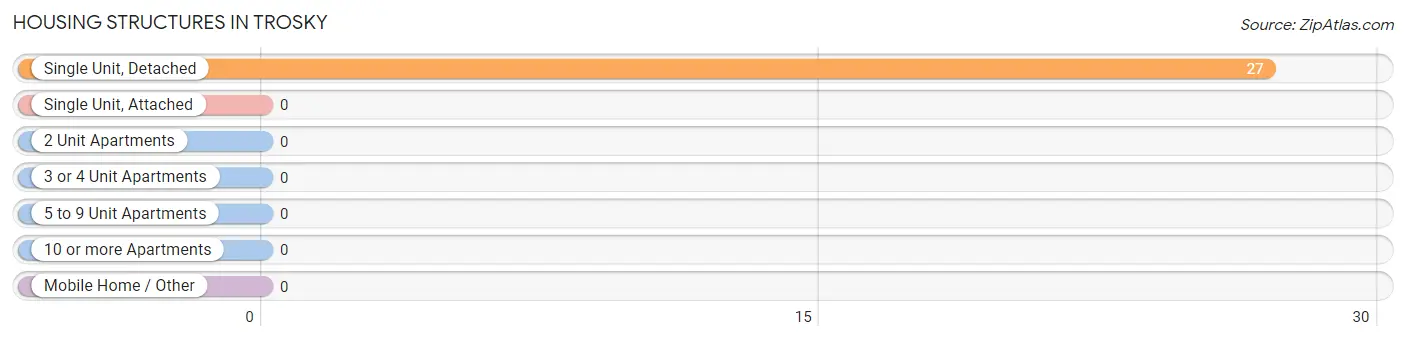
| Structure Type | # Housing Units | % Housing Units |
| Single Unit, Detached | 27 | 100.0% |
| Single Unit, Attached | 0 | 0.0% |
| 2 Unit Apartments | 0 | 0.0% |
| 3 or 4 Unit Apartments | 0 | 0.0% |
| 5 to 9 Unit Apartments | 0 | 0.0% |
| 10 or more Apartments | 0 | 0.0% |
| Mobile Home / Other | 0 | 0.0% |
| Total | 27 | 100.0% |
Housing Structures by Occupancy in Trosky
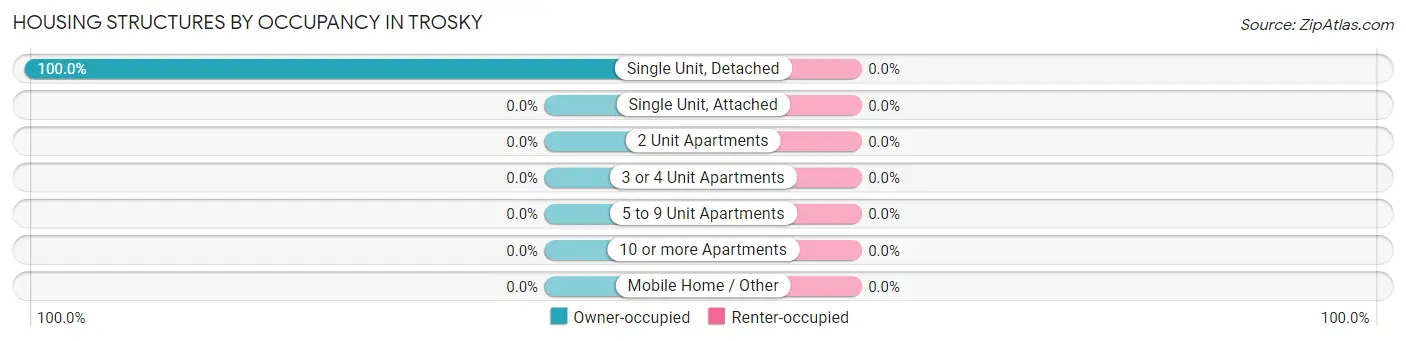
| Structure Type | Owner-occupied | Renter-occupied |
| Single Unit, Detached | 27 (100.0%) | 0 (0.0%) |
| Single Unit, Attached | 0 (0.0%) | 0 (0.0%) |
| 2 Unit Apartments | 0 (0.0%) | 0 (0.0%) |
| 3 or 4 Unit Apartments | 0 (0.0%) | 0 (0.0%) |
| 5 to 9 Unit Apartments | 0 (0.0%) | 0 (0.0%) |
| 10 or more Apartments | 0 (0.0%) | 0 (0.0%) |
| Mobile Home / Other | 0 (0.0%) | 0 (0.0%) |
| Total | 27 (100.0%) | 0 (0.0%) |
Housing Structures by Number of Rooms in Trosky
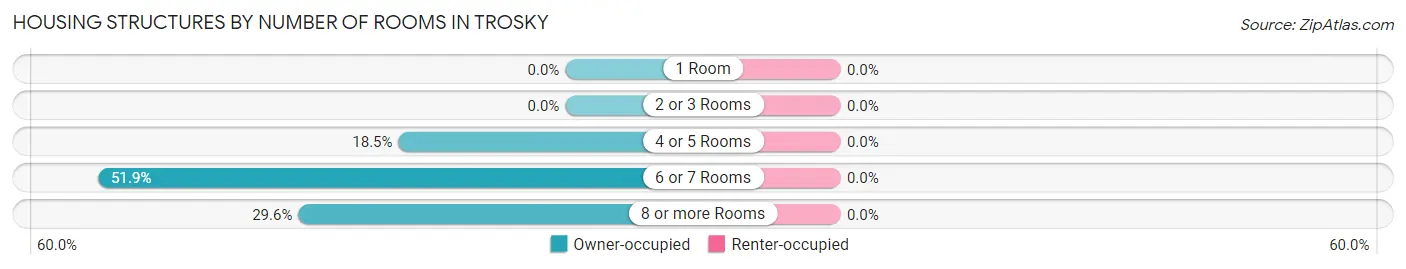
| Number of Rooms | Owner-occupied | Renter-occupied |
| 1 Room | 0 (0.0%) | 0 (0.0%) |
| 2 or 3 Rooms | 0 (0.0%) | 0 (0.0%) |
| 4 or 5 Rooms | 5 (18.5%) | 0 (0.0%) |
| 6 or 7 Rooms | 14 (51.8%) | 0 (0.0%) |
| 8 or more Rooms | 8 (29.6%) | 0 (0.0%) |
| Total | 27 (100.0%) | 0 (0.0%) |
Housing Structure by Heating Type in Trosky
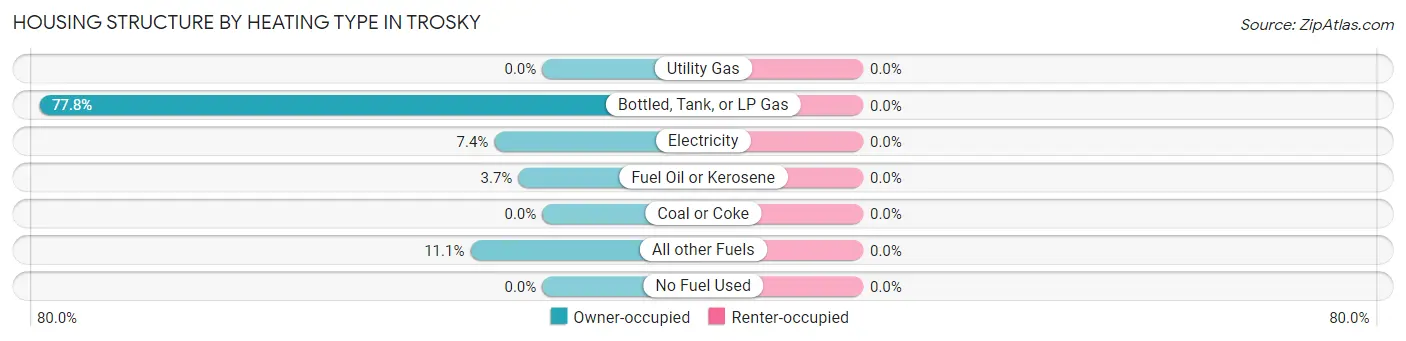
| Heating Type | Owner-occupied | Renter-occupied |
| Utility Gas | 0 (0.0%) | 0 (0.0%) |
| Bottled, Tank, or LP Gas | 21 (77.8%) | 0 (0.0%) |
| Electricity | 2 (7.4%) | 0 (0.0%) |
| Fuel Oil or Kerosene | 1 (3.7%) | 0 (0.0%) |
| Coal or Coke | 0 (0.0%) | 0 (0.0%) |
| All other Fuels | 3 (11.1%) | 0 (0.0%) |
| No Fuel Used | 0 (0.0%) | 0 (0.0%) |
| Total | 27 (100.0%) | 0 (0.0%) |
Household Vehicle Usage in Trosky
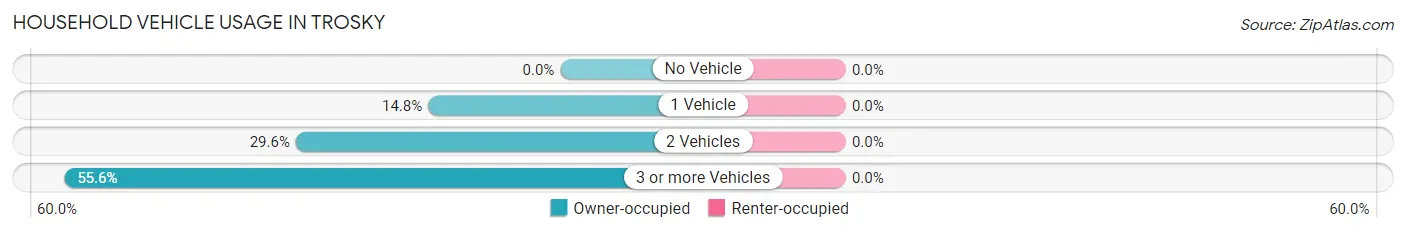
| Vehicles per Household | Owner-occupied | Renter-occupied |
| No Vehicle | 0 (0.0%) | 0 (0.0%) |
| 1 Vehicle | 4 (14.8%) | 0 (0.0%) |
| 2 Vehicles | 8 (29.6%) | 0 (0.0%) |
| 3 or more Vehicles | 15 (55.6%) | 0 (0.0%) |
| Total | 27 (100.0%) | 0 (0.0%) |
Real Estate & Mortgages in Trosky
Real Estate and Mortgage Overview in Trosky
| Characteristic | Without Mortgage | With Mortgage |
| Housing Units | 11 | 16 |
| Median Property Value | $104,200 | $86,700 |
| Median Household Income | $53,750 | $2 |
| Monthly Housing Costs | $513 | $0 |
| Real Estate Taxes | $833 | $0 |
Property Value by Mortgage Status in Trosky
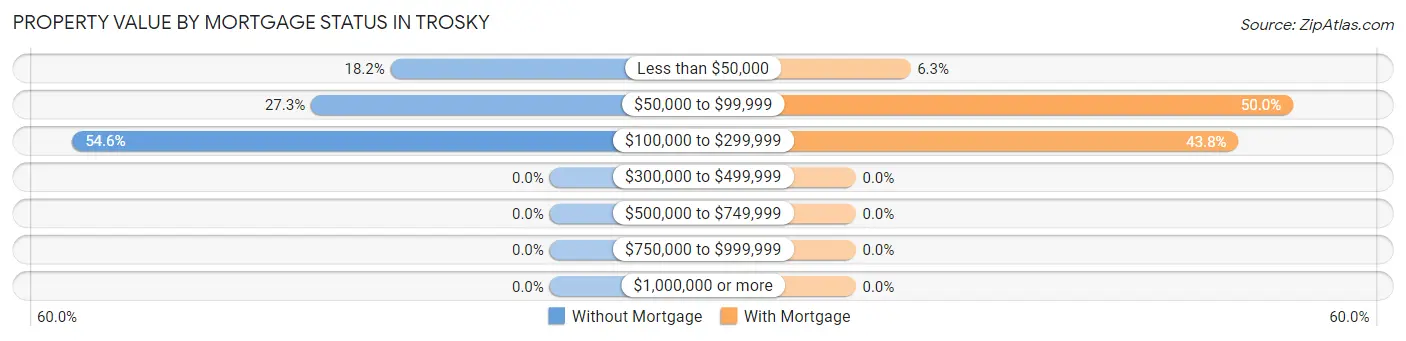
| Property Value | Without Mortgage | With Mortgage |
| Less than $50,000 | 2 (18.2%) | 1 (6.2%) |
| $50,000 to $99,999 | 3 (27.3%) | 8 (50.0%) |
| $100,000 to $299,999 | 6 (54.5%) | 7 (43.8%) |
| $300,000 to $499,999 | 0 (0.0%) | 0 (0.0%) |
| $500,000 to $749,999 | 0 (0.0%) | 0 (0.0%) |
| $750,000 to $999,999 | 0 (0.0%) | 0 (0.0%) |
| $1,000,000 or more | 0 (0.0%) | 0 (0.0%) |
| Total | 11 (100.0%) | 16 (100.0%) |
Household Income by Mortgage Status in Trosky
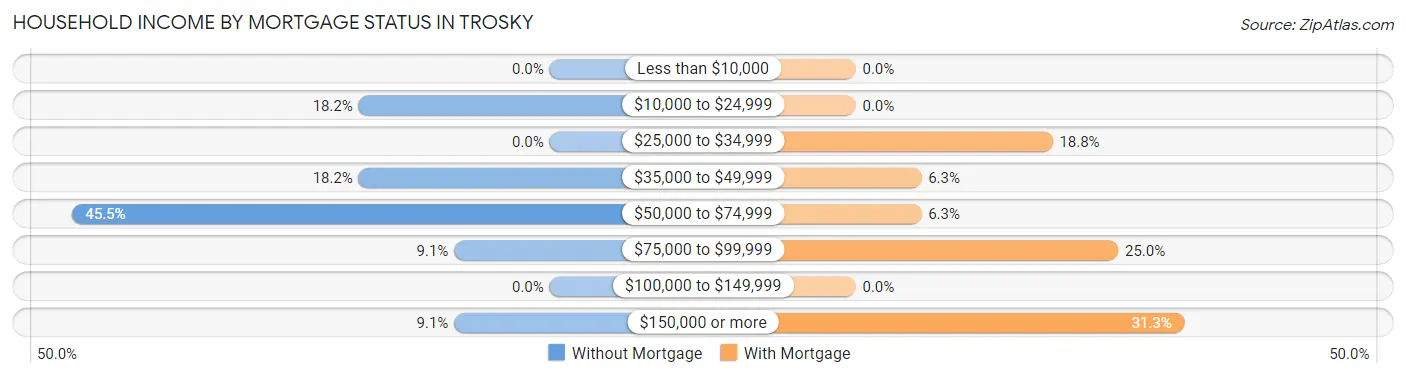
| Household Income | Without Mortgage | With Mortgage |
| Less than $10,000 | 0 (0.0%) | 0 (0.0%) |
| $10,000 to $24,999 | 2 (18.2%) | 0 (0.0%) |
| $25,000 to $34,999 | 0 (0.0%) | 3 (18.8%) |
| $35,000 to $49,999 | 2 (18.2%) | 1 (6.2%) |
| $50,000 to $74,999 | 5 (45.5%) | 1 (6.2%) |
| $75,000 to $99,999 | 1 (9.1%) | 4 (25.0%) |
| $100,000 to $149,999 | 0 (0.0%) | 0 (0.0%) |
| $150,000 or more | 1 (9.1%) | 5 (31.2%) |
| Total | 11 (100.0%) | 16 (100.0%) |
Property Value to Household Income Ratio in Trosky
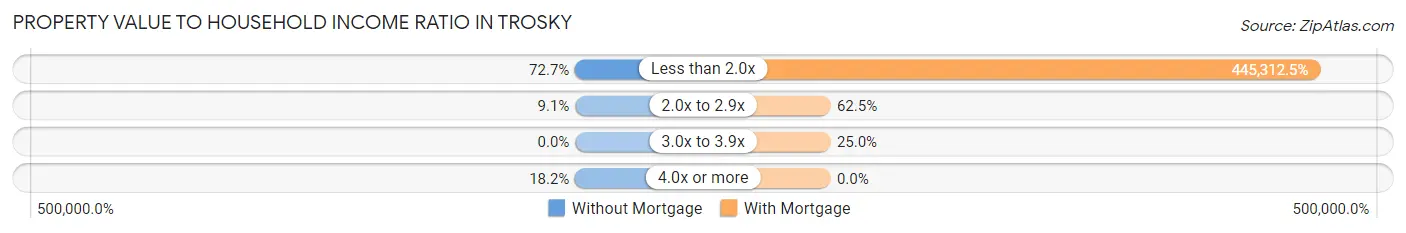
| Value-to-Income Ratio | Without Mortgage | With Mortgage |
| Less than 2.0x | 8 (72.7%) | 71,250 (445,312.5%) |
| 2.0x to 2.9x | 1 (9.1%) | 10 (62.5%) |
| 3.0x to 3.9x | 0 (0.0%) | 4 (25.0%) |
| 4.0x or more | 2 (18.2%) | 0 (0.0%) |
| Total | 11 (100.0%) | 16 (100.0%) |
Real Estate Taxes by Mortgage Status in Trosky
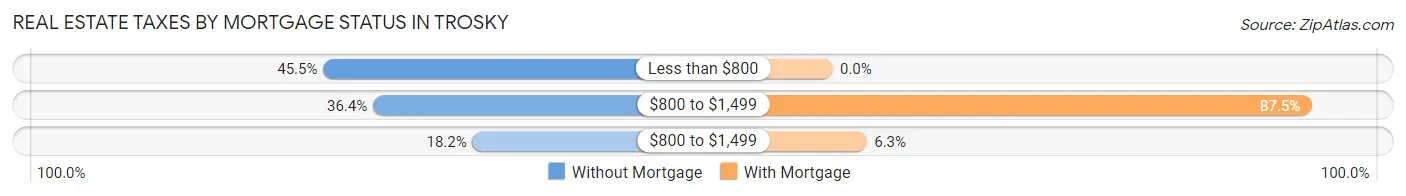
| Property Taxes | Without Mortgage | With Mortgage |
| Less than $800 | 5 (45.5%) | 0 (0.0%) |
| $800 to $1,499 | 4 (36.4%) | 14 (87.5%) |
| $800 to $1,499 | 2 (18.2%) | 1 (6.2%) |
| Total | 11 (100.0%) | 16 (100.0%) |
Health & Disability in Trosky
Health Insurance Coverage by Age in Trosky
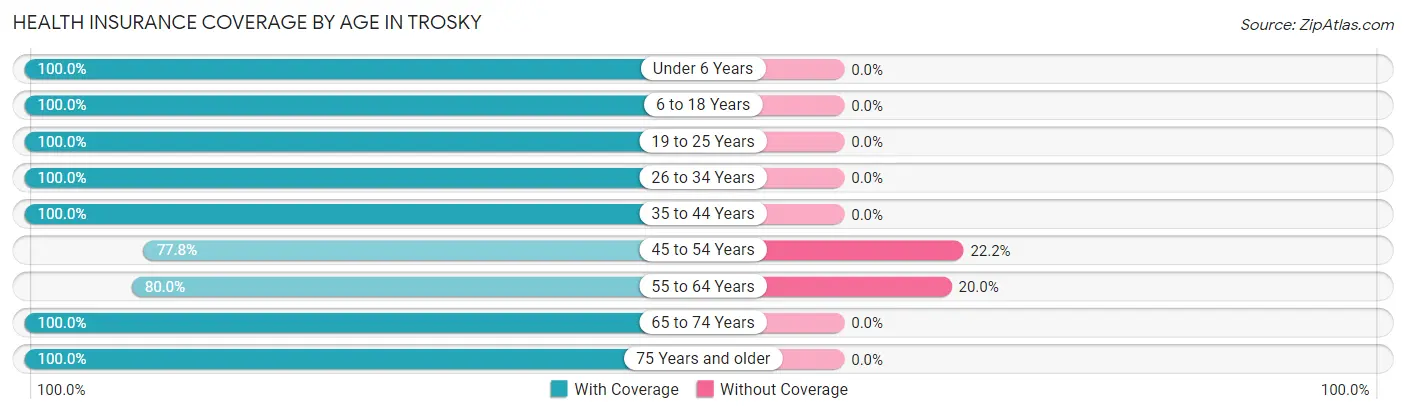
| Age Bracket | With Coverage | Without Coverage |
| Under 6 Years | 5 (100.0%) | 0 (0.0%) |
| 6 to 18 Years | 12 (100.0%) | 0 (0.0%) |
| 19 to 25 Years | 3 (100.0%) | 0 (0.0%) |
| 26 to 34 Years | 6 (100.0%) | 0 (0.0%) |
| 35 to 44 Years | 10 (100.0%) | 0 (0.0%) |
| 45 to 54 Years | 7 (77.8%) | 2 (22.2%) |
| 55 to 64 Years | 8 (80.0%) | 2 (20.0%) |
| 65 to 74 Years | 12 (100.0%) | 0 (0.0%) |
| 75 Years and older | 1 (100.0%) | 0 (0.0%) |
| Total | 64 (94.1%) | 4 (5.9%) |
Health Insurance Coverage by Citizenship Status in Trosky
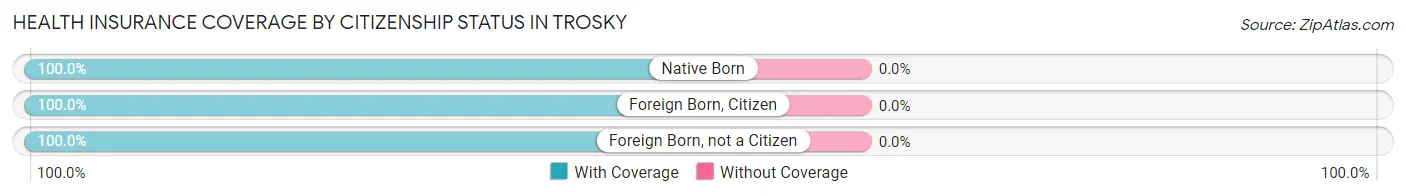
| Citizenship Status | With Coverage | Without Coverage |
| Native Born | 5 (100.0%) | 0 (0.0%) |
| Foreign Born, Citizen | 12 (100.0%) | 0 (0.0%) |
| Foreign Born, not a Citizen | 3 (100.0%) | 0 (0.0%) |
Health Insurance Coverage by Household Income in Trosky
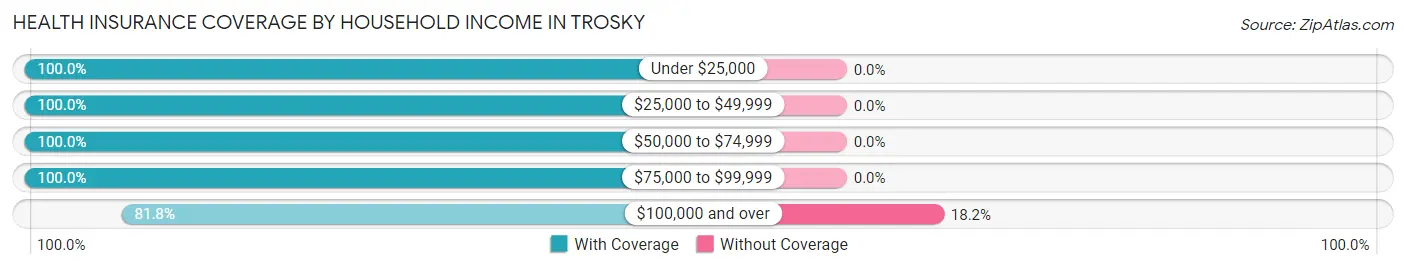
| Household Income | With Coverage | Without Coverage |
| Under $25,000 | 11 (100.0%) | 0 (0.0%) |
| $25,000 to $49,999 | 5 (100.0%) | 0 (0.0%) |
| $50,000 to $74,999 | 28 (100.0%) | 0 (0.0%) |
| $75,000 to $99,999 | 2 (100.0%) | 0 (0.0%) |
| $100,000 and over | 18 (81.8%) | 4 (18.2%) |
Public vs Private Health Insurance Coverage by Age in Trosky
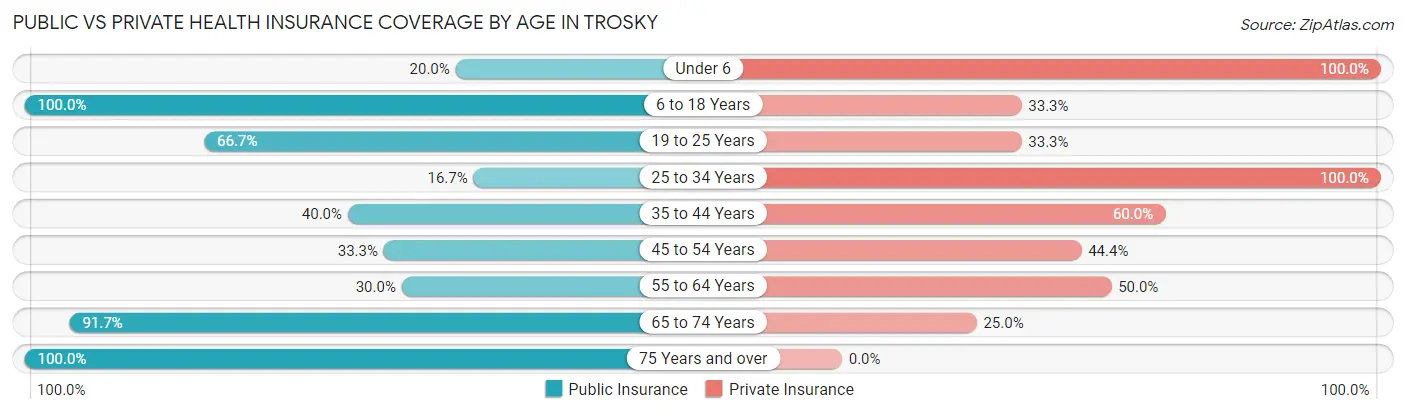
| Age Bracket | Public Insurance | Private Insurance |
| Under 6 | 1 (20.0%) | 5 (100.0%) |
| 6 to 18 Years | 12 (100.0%) | 4 (33.3%) |
| 19 to 25 Years | 2 (66.7%) | 1 (33.3%) |
| 25 to 34 Years | 1 (16.7%) | 6 (100.0%) |
| 35 to 44 Years | 4 (40.0%) | 6 (60.0%) |
| 45 to 54 Years | 3 (33.3%) | 4 (44.4%) |
| 55 to 64 Years | 3 (30.0%) | 5 (50.0%) |
| 65 to 74 Years | 11 (91.7%) | 3 (25.0%) |
| 75 Years and over | 1 (100.0%) | 0 (0.0%) |
| Total | 38 (55.9%) | 34 (50.0%) |
Disability Status by Sex by Age in Trosky
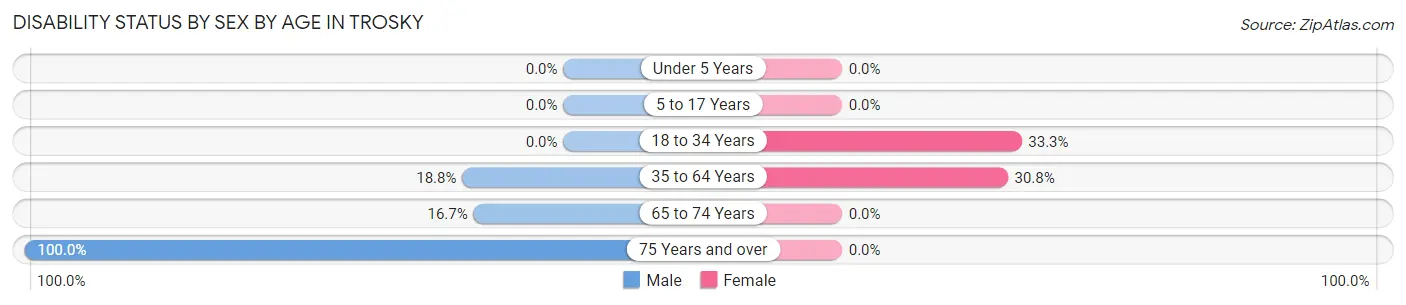
| Age Bracket | Male | Female |
| Under 5 Years | 0 (0.0%) | 0 (0.0%) |
| 5 to 17 Years | 0 (0.0%) | 0 (0.0%) |
| 18 to 34 Years | 0 (0.0%) | 2 (33.3%) |
| 35 to 64 Years | 3 (18.8%) | 4 (30.8%) |
| 65 to 74 Years | 1 (16.7%) | 0 (0.0%) |
| 75 Years and over | 1 (100.0%) | 0 (0.0%) |
Disability Class by Sex by Age in Trosky
Disability Class: Hearing Difficulty
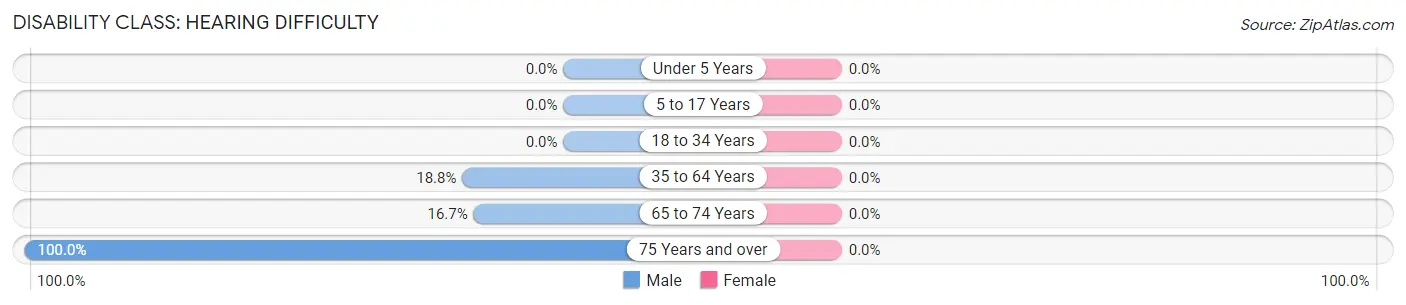
| Age Bracket | Male | Female |
| Under 5 Years | 0 (0.0%) | 0 (0.0%) |
| 5 to 17 Years | 0 (0.0%) | 0 (0.0%) |
| 18 to 34 Years | 0 (0.0%) | 0 (0.0%) |
| 35 to 64 Years | 3 (18.8%) | 0 (0.0%) |
| 65 to 74 Years | 1 (16.7%) | 0 (0.0%) |
| 75 Years and over | 1 (100.0%) | 0 (0.0%) |
Disability Class: Vision Difficulty
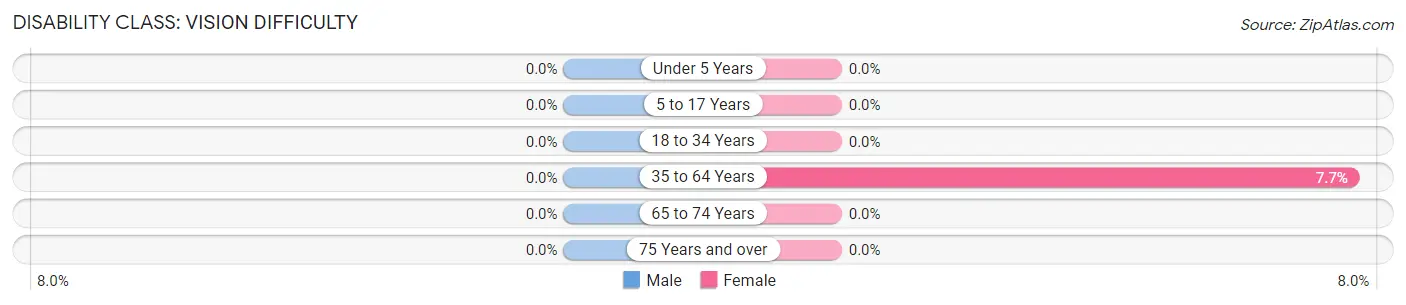
| Age Bracket | Male | Female |
| Under 5 Years | 0 (0.0%) | 0 (0.0%) |
| 5 to 17 Years | 0 (0.0%) | 0 (0.0%) |
| 18 to 34 Years | 0 (0.0%) | 0 (0.0%) |
| 35 to 64 Years | 0 (0.0%) | 1 (7.7%) |
| 65 to 74 Years | 0 (0.0%) | 0 (0.0%) |
| 75 Years and over | 0 (0.0%) | 0 (0.0%) |
Disability Class: Cognitive Difficulty
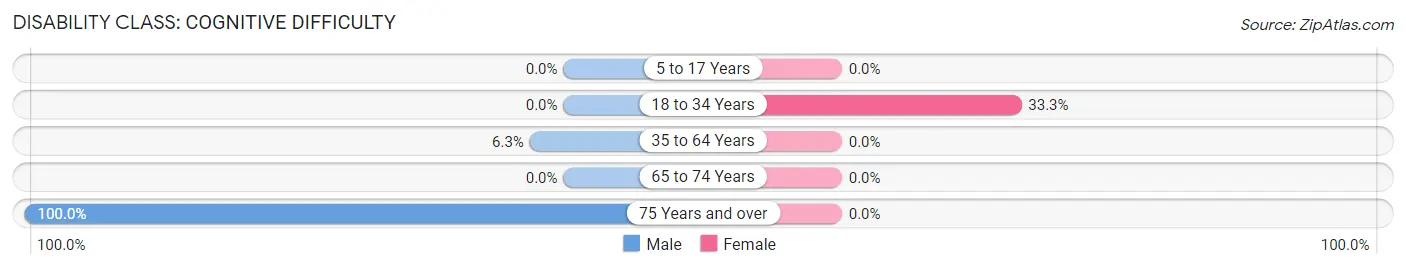
| Age Bracket | Male | Female |
| 5 to 17 Years | 0 (0.0%) | 0 (0.0%) |
| 18 to 34 Years | 0 (0.0%) | 2 (33.3%) |
| 35 to 64 Years | 1 (6.2%) | 0 (0.0%) |
| 65 to 74 Years | 0 (0.0%) | 0 (0.0%) |
| 75 Years and over | 1 (100.0%) | 0 (0.0%) |
Disability Class: Ambulatory Difficulty
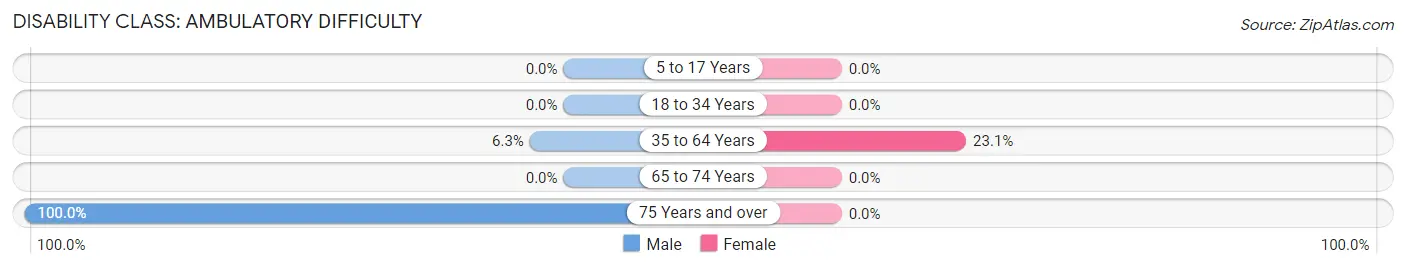
| Age Bracket | Male | Female |
| 5 to 17 Years | 0 (0.0%) | 0 (0.0%) |
| 18 to 34 Years | 0 (0.0%) | 0 (0.0%) |
| 35 to 64 Years | 1 (6.2%) | 3 (23.1%) |
| 65 to 74 Years | 0 (0.0%) | 0 (0.0%) |
| 75 Years and over | 1 (100.0%) | 0 (0.0%) |
Disability Class: Self-Care Difficulty
| Age Bracket | Male | Female |
| 5 to 17 Years | 0 (0.0%) | 0 (0.0%) |
| 18 to 34 Years | 0 (0.0%) | 0 (0.0%) |
| 35 to 64 Years | 0 (0.0%) | 0 (0.0%) |
| 65 to 74 Years | 0 (0.0%) | 0 (0.0%) |
| 75 Years and over | 0 (0.0%) | 0 (0.0%) |
Technology Access in Trosky
Computing Device Access in Trosky
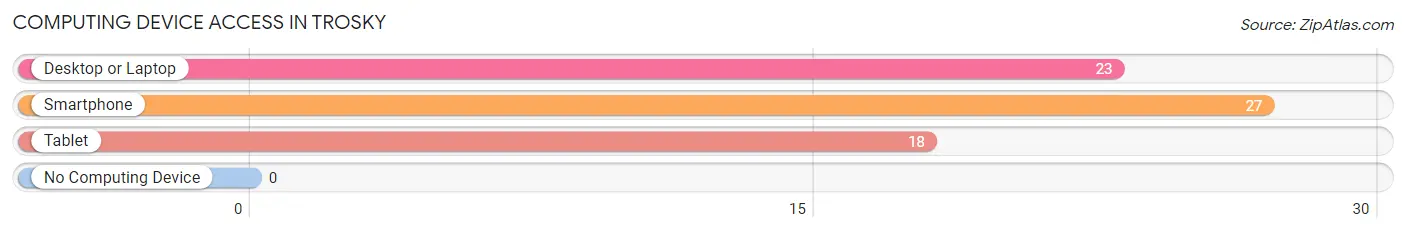
| Device Type | # Households | % Households |
| Desktop or Laptop | 23 | 85.2% |
| Smartphone | 27 | 100.0% |
| Tablet | 18 | 66.7% |
| No Computing Device | 0 | 0.0% |
| Total | 27 | 100.0% |
Internet Access in Trosky
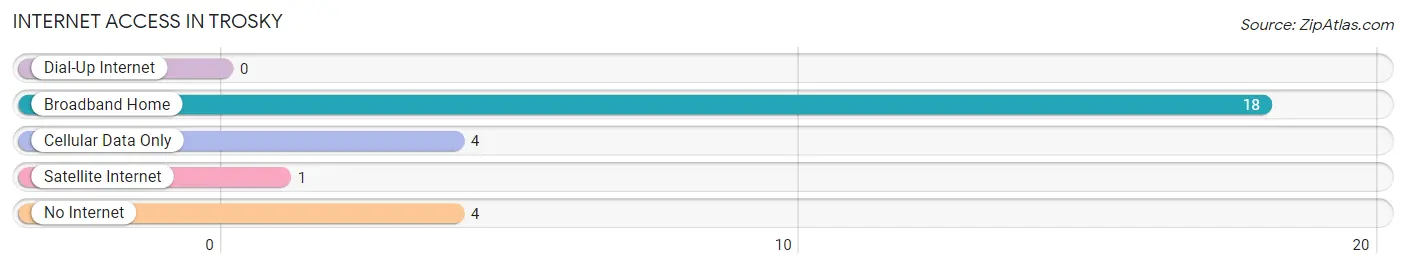
| Internet Type | # Households | % Households |
| Dial-Up Internet | 0 | 0.0% |
| Broadband Home | 18 | 66.7% |
| Cellular Data Only | 4 | 14.8% |
| Satellite Internet | 1 | 3.7% |
| No Internet | 4 | 14.8% |
| Total | 27 | 100.0% |
Trosky Summary
Trosky is a small town located in Pipestone County, Minnesota. It is situated in the southwestern corner of the state, near the border with South Dakota. The town was founded in 1881 and has a population of approximately 200 people.
The geography of Trosky is characterized by rolling hills and prairies. The town is located in the Minnesota River Valley, which is part of the larger Minnesota River Basin. The area is known for its fertile soil and abundant wildlife. The town is surrounded by a variety of natural features, including lakes, rivers, and wetlands.
The economy of Trosky is largely based on agriculture. The town is home to several farms, which produce a variety of crops, including corn, soybeans, and wheat. The town also has a small manufacturing sector, which produces a variety of products, including furniture and clothing.
The demographics of Trosky are largely homogeneous. The majority of the population is of German descent, with a small percentage of other European and Native American ancestry. The town has a median household income of $41,000, which is slightly lower than the state average. The town has a low unemployment rate, and the majority of the population is employed in the agricultural sector.
Trosky is a small, rural town with a rich history and a strong sense of community. The town is home to a variety of local businesses, including a grocery store, a hardware store, and a restaurant. The town also has a number of churches, which serve as a focal point for the community. The town is served by a local school district, which provides education to the town's children.
Trosky is a peaceful and welcoming place to live. The town is known for its friendly atmosphere and its commitment to preserving its rural character. The town is a great place to raise a family, and its residents take pride in their community and its history.
Common Questions
What is Per Capita Income in Trosky?
Per Capita income in Trosky is $28,897.
What is the Median Family Income in Trosky?
Median Family Income in Trosky is $58,750.
What is the Median Household income in Trosky?
Median Household Income in Trosky is $56,875.
What is Income or Wage Gap in Trosky?
Income or Wage Gap in Trosky is 12.0%.
Women in Trosky earn 88.0 cents for every dollar earned by a man.
What is Inequality or Gini Index in Trosky?
Inequality or Gini Index in Trosky is 0.39.
What is the Total Population of Trosky?
Total Population of Trosky is 68.
What is the Total Male Population of Trosky?
Total Male Population of Trosky is 28.
What is the Total Female Population of Trosky?
Total Female Population of Trosky is 40.
What is the Ratio of Males per 100 Females in Trosky?
There are 70.00 Males per 100 Females in Trosky.
What is the Ratio of Females per 100 Males in Trosky?
There are 142.86 Females per 100 Males in Trosky.
What is the Median Population Age in Trosky?
Median Population Age in Trosky is 43.5 Years.
What is the Average Family Size in Trosky
Average Family Size in Trosky is 2.9 People.
What is the Average Household Size in Trosky
Average Household Size in Trosky is 2.5 People.
How Large is the Labor Force in Trosky?
There are 42 People in the Labor Forcein in Trosky.
What is the Percentage of People in the Labor Force in Trosky?
77.8% of People are in the Labor Force in Trosky.