Middle River, MN Map & Demographics
Middle River Map
Middle River Overview
$35,772
PER CAPITA INCOME
$64,375
AVG FAMILY INCOME
$55,417
AVG HOUSEHOLD INCOME
74.0%
WAGE / INCOME GAP [ % ]
26.0¢/ $1
WAGE / INCOME GAP [ $ ]
0.40
INEQUALITY / GINI INDEX
272
TOTAL POPULATION
150
MALE POPULATION
122
FEMALE POPULATION
122.95
MALES / 100 FEMALES
81.33
FEMALES / 100 MALES
41.5
MEDIAN AGE
3.0
AVG FAMILY SIZE
2.0
AVG HOUSEHOLD SIZE
151
LABOR FORCE [ PEOPLE ]
69.3%
PERCENT IN LABOR FORCE
1.3%
UNEMPLOYMENT RATE
Middle River Zip Codes
Middle River Area Codes
Income in Middle River
Income Overview in Middle River
Per Capita Income in Middle River is $35,772, while median incomes of families and households are $64,375 and $55,417 respectively.
| Characteristic | Number | Measure |
| Per Capita Income | 272 | $35,772 |
| Median Family Income | 55 | $64,375 |
| Mean Family Income | 55 | $81,509 |
| Median Household Income | 137 | $55,417 |
| Mean Household Income | 137 | $67,765 |
| Income Deficit | 55 | $0 |
| Wage / Income Gap (%) | 272 | 74.03% |
| Wage / Income Gap ($) | 272 | 25.97¢ per $1 |
| Gini / Inequality Index | 272 | 0.40 |
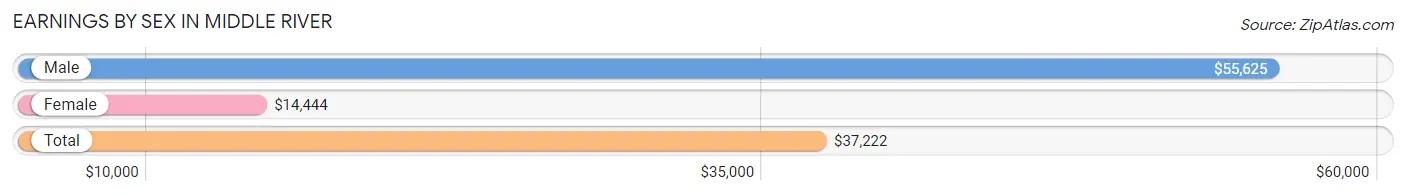
Earnings by Sex in Middle River
Average Earnings in Middle River are $37,222, $55,625 for men and $14,444 for women, a difference of 74.0%.
| Sex | Number | Average Earnings |
| Male | 100 (63.3%) | $55,625 |
| Female | 58 (36.7%) | $14,444 |
| Total | 158 (100.0%) | $37,222 |
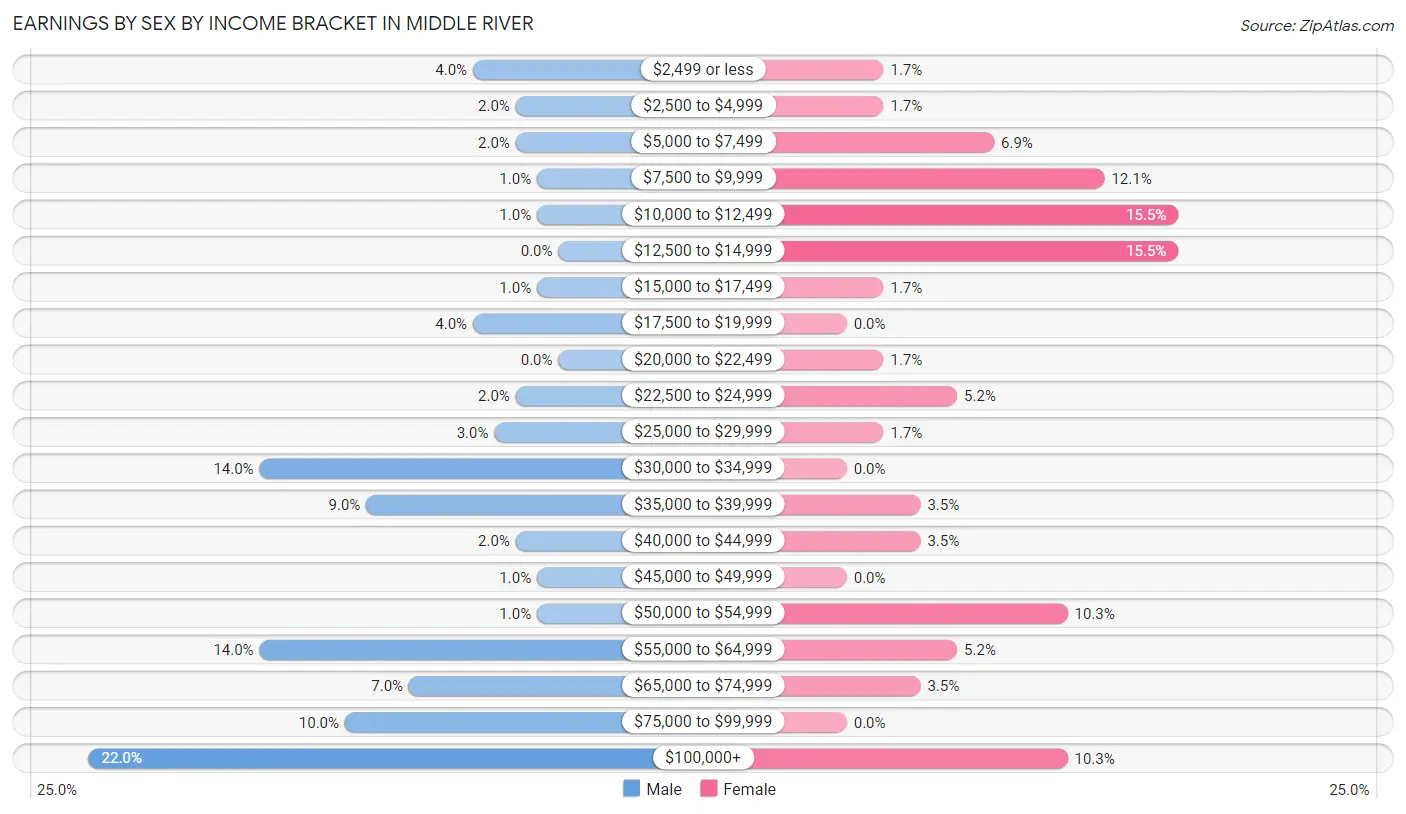
Earnings by Sex by Income Bracket in Middle River
The most common earnings brackets in Middle River are $100,000+ for men (22 | 22.0%) and $10,000 to $12,499 for women (9 | 15.5%).
| Income | Male | Female |
| $2,499 or less | 4 (4.0%) | 1 (1.7%) |
| $2,500 to $4,999 | 2 (2.0%) | 1 (1.7%) |
| $5,000 to $7,499 | 2 (2.0%) | 4 (6.9%) |
| $7,500 to $9,999 | 1 (1.0%) | 7 (12.1%) |
| $10,000 to $12,499 | 1 (1.0%) | 9 (15.5%) |
| $12,500 to $14,999 | 0 (0.0%) | 9 (15.5%) |
| $15,000 to $17,499 | 1 (1.0%) | 1 (1.7%) |
| $17,500 to $19,999 | 4 (4.0%) | 0 (0.0%) |
| $20,000 to $22,499 | 0 (0.0%) | 1 (1.7%) |
| $22,500 to $24,999 | 2 (2.0%) | 3 (5.2%) |
| $25,000 to $29,999 | 3 (3.0%) | 1 (1.7%) |
| $30,000 to $34,999 | 14 (14.0%) | 0 (0.0%) |
| $35,000 to $39,999 | 9 (9.0%) | 2 (3.5%) |
| $40,000 to $44,999 | 2 (2.0%) | 2 (3.5%) |
| $45,000 to $49,999 | 1 (1.0%) | 0 (0.0%) |
| $50,000 to $54,999 | 1 (1.0%) | 6 (10.3%) |
| $55,000 to $64,999 | 14 (14.0%) | 3 (5.2%) |
| $65,000 to $74,999 | 7 (7.0%) | 2 (3.5%) |
| $75,000 to $99,999 | 10 (10.0%) | 0 (0.0%) |
| $100,000+ | 22 (22.0%) | 6 (10.3%) |
| Total | 100 (100.0%) | 58 (100.0%) |
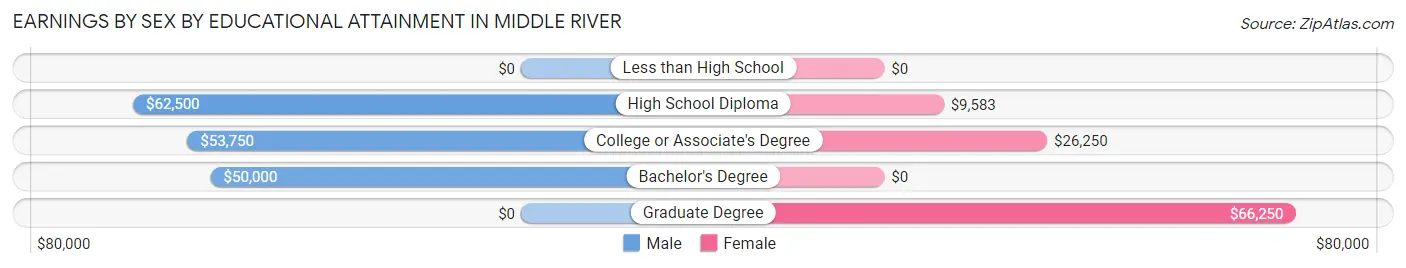
Earnings by Sex by Educational Attainment in Middle River
Average earnings in Middle River are $56,667 for men and $23,750 for women, a difference of 58.1%. Men with an educational attainment of high school diploma enjoy the highest average annual earnings of $62,500, while those with bachelor's degree education earn the least with $50,000. Women with an educational attainment of graduate degree earn the most with the average annual earnings of $66,250, while those with high school diploma education have the smallest earnings of $9,583.
| Educational Attainment | Male Income | Female Income |
| Less than High School | - | - |
| High School Diploma | $62,500 | $9,583 |
| College or Associate's Degree | $53,750 | $26,250 |
| Bachelor's Degree | $50,000 | $0 |
| Graduate Degree | - | - |
| Total | $56,667 | $23,750 |
Family Income in Middle River
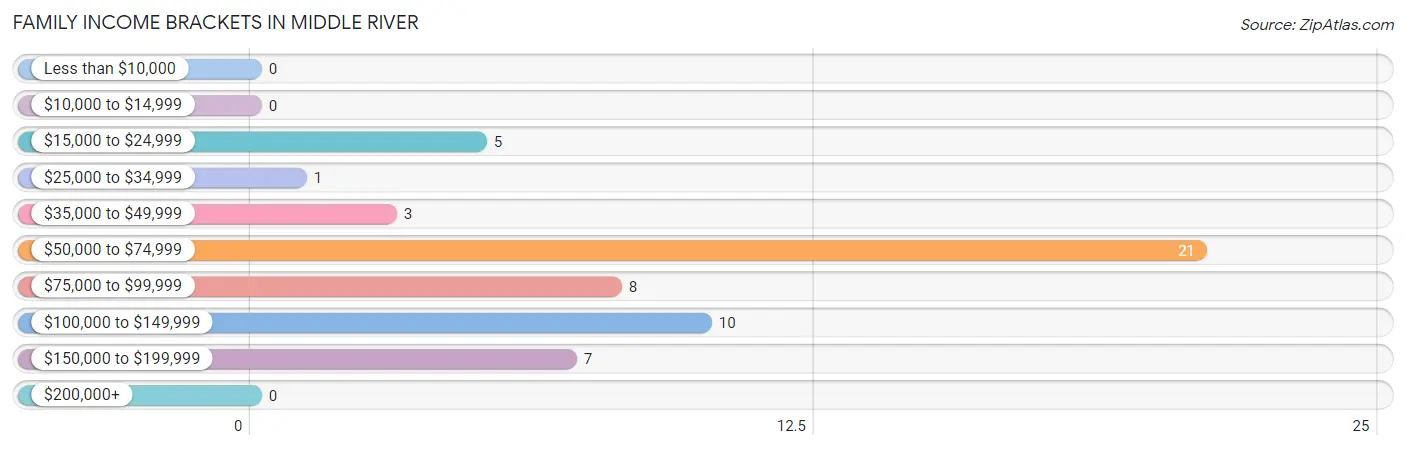
Family Income Brackets in Middle River
According to the Middle River family income data, there are 21 families falling into the $50,000 to $74,999 income range, which is the most common income bracket and makes up 38.2% of all families.
| Income Bracket | # Families | % Families |
| Less than $10,000 | 0 | 0.0% |
| $10,000 to $14,999 | 0 | 0.0% |
| $15,000 to $24,999 | 5 | 9.1% |
| $25,000 to $34,999 | 1 | 1.8% |
| $35,000 to $49,999 | 3 | 5.5% |
| $50,000 to $74,999 | 21 | 38.2% |
| $75,000 to $99,999 | 8 | 14.5% |
| $100,000 to $149,999 | 10 | 18.2% |
| $150,000 to $199,999 | 7 | 12.7% |
| $200,000+ | 0 | 0.0% |
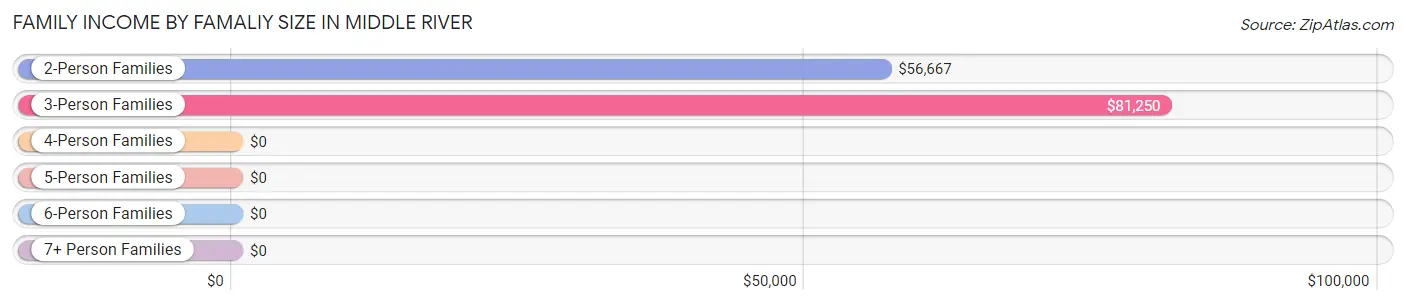
Family Income by Famaliy Size in Middle River
3-person families (13 | 23.6%) account for the highest median family income in Middle River with $81,250 per family, while 2-person families (28 | 50.9%) have the highest median income of $28,334 per family member.
| Income Bracket | # Families | Median Income |
| 2-Person Families | 28 (50.9%) | $56,667 |
| 3-Person Families | 13 (23.6%) | $81,250 |
| 4-Person Families | 12 (21.8%) | $0 |
| 5-Person Families | 2 (3.6%) | $0 |
| 6-Person Families | 0 (0.0%) | $0 |
| 7+ Person Families | 0 (0.0%) | $0 |
| Total | 55 (100.0%) | $64,375 |
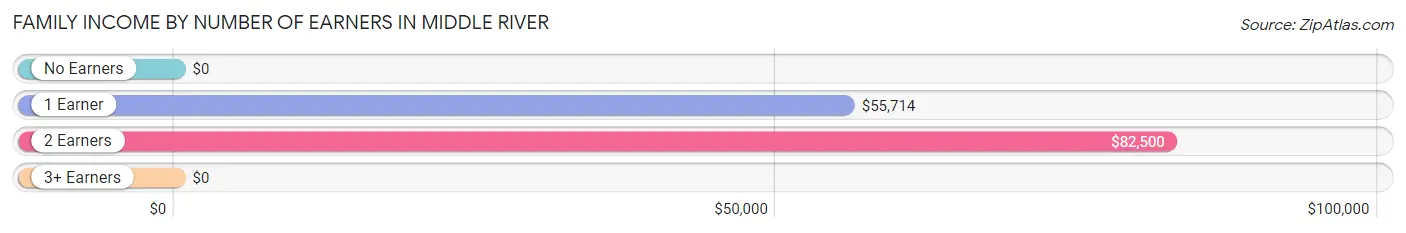
Family Income by Number of Earners in Middle River
| Number of Earners | # Families | Median Income |
| No Earners | 3 (5.4%) | $0 |
| 1 Earner | 20 (36.4%) | $55,714 |
| 2 Earners | 28 (50.9%) | $82,500 |
| 3+ Earners | 4 (7.3%) | $0 |
| Total | 55 (100.0%) | $64,375 |
Household Income in Middle River
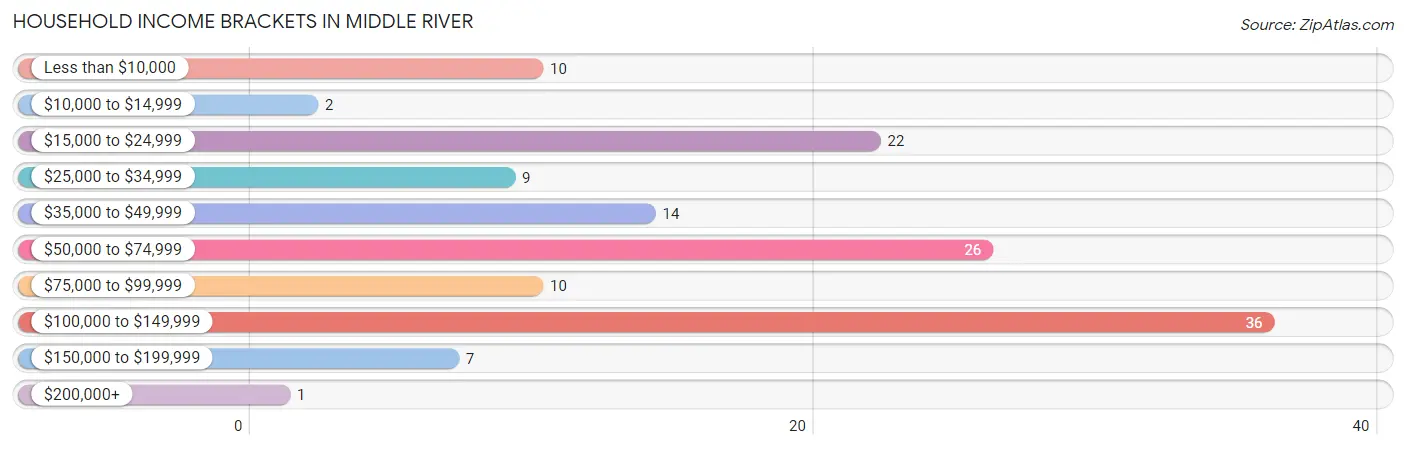
Household Income Brackets in Middle River
With 36 households falling in the category, the $100,000 to $149,999 income range is the most frequent in Middle River, accounting for 26.3% of all households. In contrast, only 1 households (0.7%) fall into the $200,000+ income bracket, making it the least populous group.
| Income Bracket | # Households | % Households |
| Less than $10,000 | 10 | 7.3% |
| $10,000 to $14,999 | 2 | 1.5% |
| $15,000 to $24,999 | 22 | 16.1% |
| $25,000 to $34,999 | 9 | 6.6% |
| $35,000 to $49,999 | 14 | 10.2% |
| $50,000 to $74,999 | 26 | 19.0% |
| $75,000 to $99,999 | 10 | 7.3% |
| $100,000 to $149,999 | 36 | 26.3% |
| $150,000 to $199,999 | 7 | 5.1% |
| $200,000+ | 1 | 0.7% |
Household Income by Householder Age in Middle River
The median household income in Middle River is $55,417, with the highest median household income of $117,697 found in the 25 to 44 years age bracket for the primary householder. A total of 51 households (37.2%) fall into this category. Meanwhile, the 15 to 24 years age bracket for the primary householder has the lowest median household income of $0, with 6 households (4.4%) in this group.
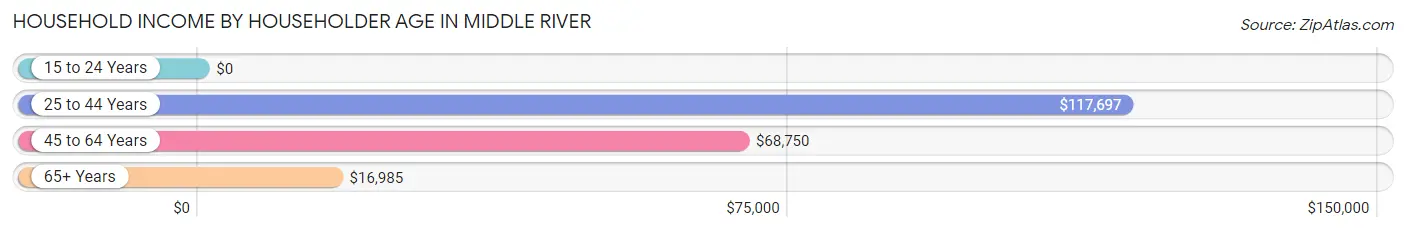
| Income Bracket | # Households | Median Income |
| 15 to 24 Years | 6 (4.4%) | $0 |
| 25 to 44 Years | 51 (37.2%) | $117,697 |
| 45 to 64 Years | 31 (22.6%) | $68,750 |
| 65+ Years | 49 (35.8%) | $16,985 |
| Total | 137 (100.0%) | $55,417 |
Poverty in Middle River
Income Below Poverty by Sex and Age in Middle River
With 10.2% poverty level for males and 18.0% for females among the residents of Middle River, 12 to 14 year old males and 5 year old females are the most vulnerable to poverty, with 4 males (66.7%) and 5 females (55.6%) in their respective age groups living below the poverty level.
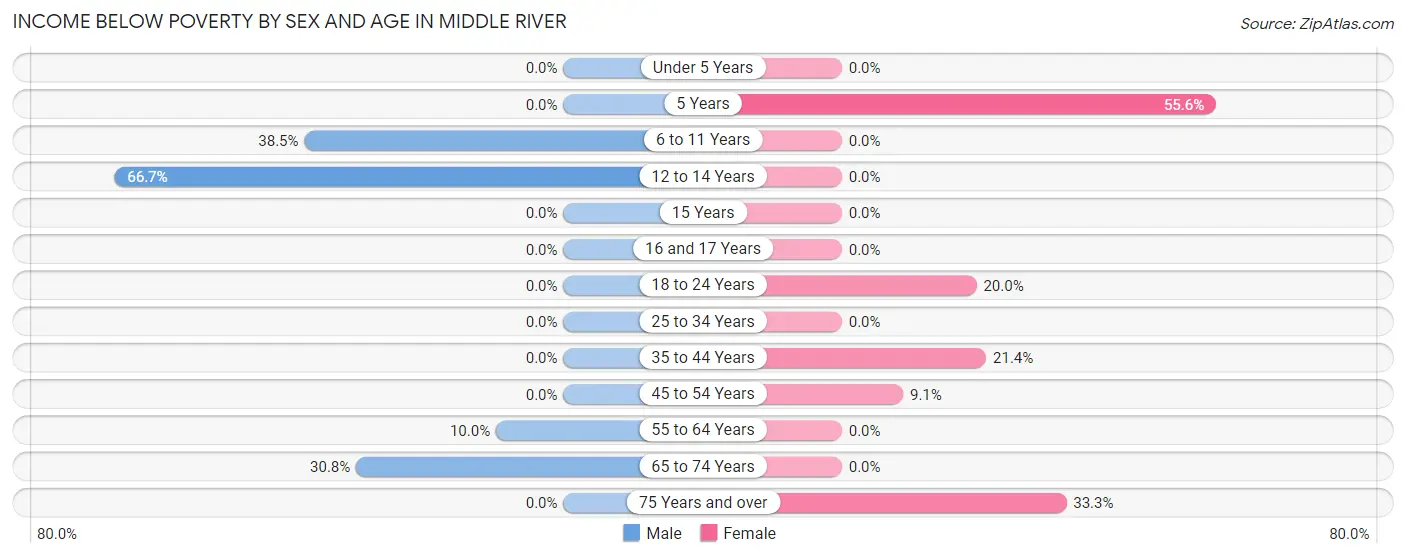
| Age Bracket | Male | Female |
| Under 5 Years | 0 (0.0%) | 0 (0.0%) |
| 5 Years | 0 (0.0%) | 5 (55.6%) |
| 6 to 11 Years | 5 (38.5%) | 0 (0.0%) |
| 12 to 14 Years | 4 (66.7%) | 0 (0.0%) |
| 15 Years | 0 (0.0%) | 0 (0.0%) |
| 16 and 17 Years | 0 (0.0%) | 0 (0.0%) |
| 18 to 24 Years | 0 (0.0%) | 3 (20.0%) |
| 25 to 34 Years | 0 (0.0%) | 0 (0.0%) |
| 35 to 44 Years | 0 (0.0%) | 3 (21.4%) |
| 45 to 54 Years | 0 (0.0%) | 1 (9.1%) |
| 55 to 64 Years | 2 (10.0%) | 0 (0.0%) |
| 65 to 74 Years | 4 (30.8%) | 0 (0.0%) |
| 75 Years and over | 0 (0.0%) | 10 (33.3%) |
| Total | 15 (10.2%) | 22 (18.0%) |
Income Above Poverty by Sex and Age in Middle River
According to the poverty statistics in Middle River, males aged under 5 years and females aged under 5 years are the age groups that are most secure financially, with 100.0% of males and 100.0% of females in these age groups living above the poverty line.
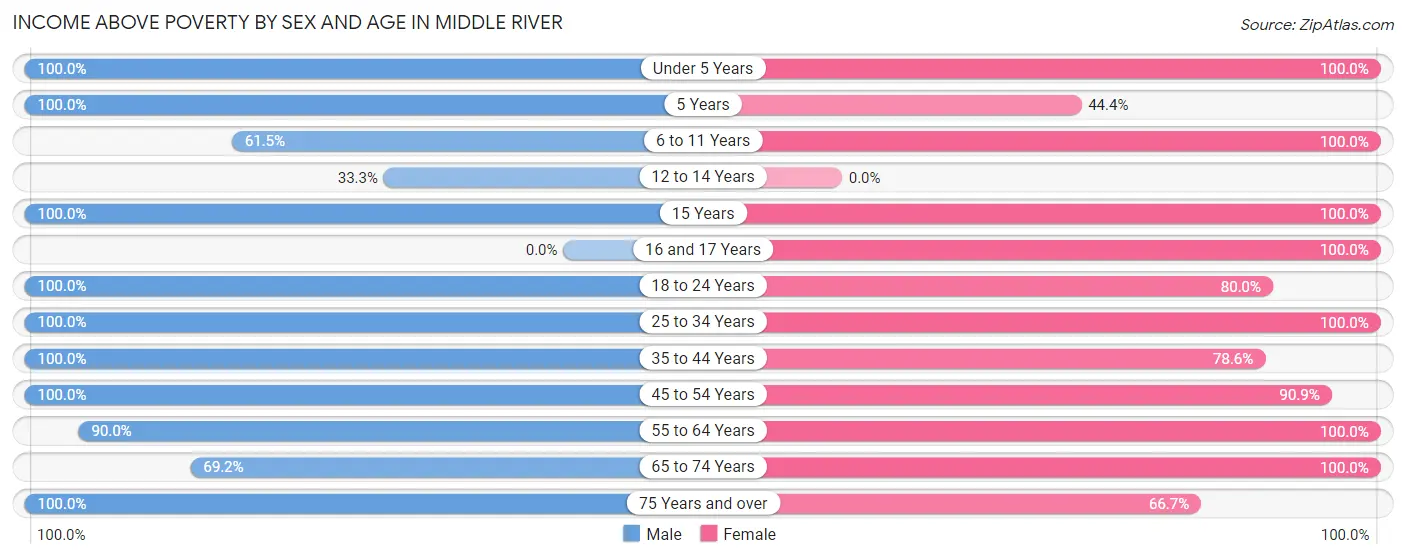
| Age Bracket | Male | Female |
| Under 5 Years | 5 (100.0%) | 3 (100.0%) |
| 5 Years | 2 (100.0%) | 4 (44.4%) |
| 6 to 11 Years | 8 (61.5%) | 9 (100.0%) |
| 12 to 14 Years | 2 (33.3%) | 0 (0.0%) |
| 15 Years | 2 (100.0%) | 2 (100.0%) |
| 16 and 17 Years | 0 (0.0%) | 4 (100.0%) |
| 18 to 24 Years | 10 (100.0%) | 12 (80.0%) |
| 25 to 34 Years | 14 (100.0%) | 6 (100.0%) |
| 35 to 44 Years | 41 (100.0%) | 11 (78.6%) |
| 45 to 54 Years | 11 (100.0%) | 10 (90.9%) |
| 55 to 64 Years | 18 (90.0%) | 8 (100.0%) |
| 65 to 74 Years | 9 (69.2%) | 11 (100.0%) |
| 75 Years and over | 10 (100.0%) | 20 (66.7%) |
| Total | 132 (89.8%) | 100 (82.0%) |
Income Below Poverty Among Married-Couple Families in Middle River
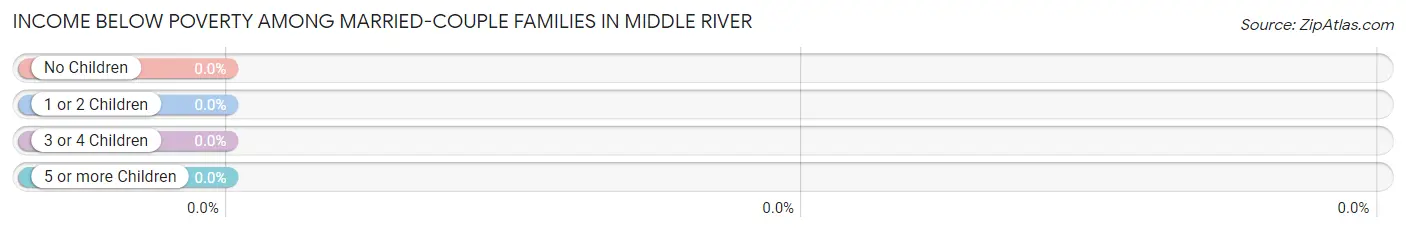
| Children | Above Poverty | Below Poverty |
| No Children | 25 (100.0%) | 0 (0.0%) |
| 1 or 2 Children | 14 (100.0%) | 0 (0.0%) |
| 3 or 4 Children | 2 (100.0%) | 0 (0.0%) |
| 5 or more Children | 0 (0.0%) | 0 (0.0%) |
| Total | 41 (100.0%) | 0 (0.0%) |
Income Below Poverty Among Single-Parent Households in Middle River
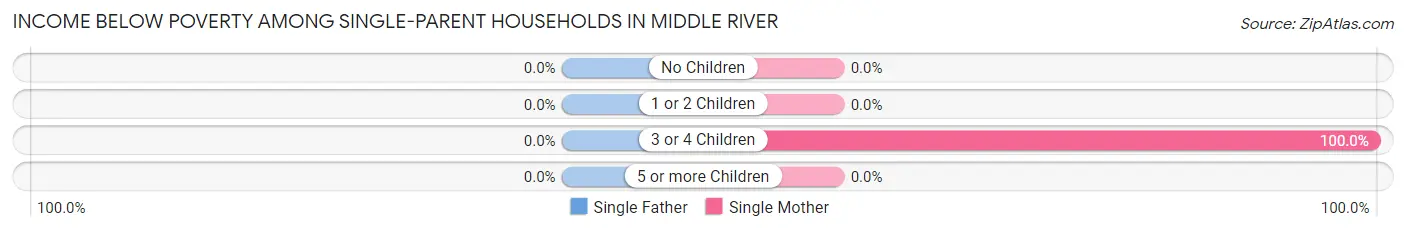
| Children | Single Father | Single Mother |
| No Children | 0 (0.0%) | 0 (0.0%) |
| 1 or 2 Children | 0 (0.0%) | 0 (0.0%) |
| 3 or 4 Children | 0 (0.0%) | 3 (100.0%) |
| 5 or more Children | 0 (0.0%) | 0 (0.0%) |
| Total | 0 (0.0%) | 3 (50.0%) |
Income Below Poverty Among Married-Couple vs Single-Parent Households in Middle River
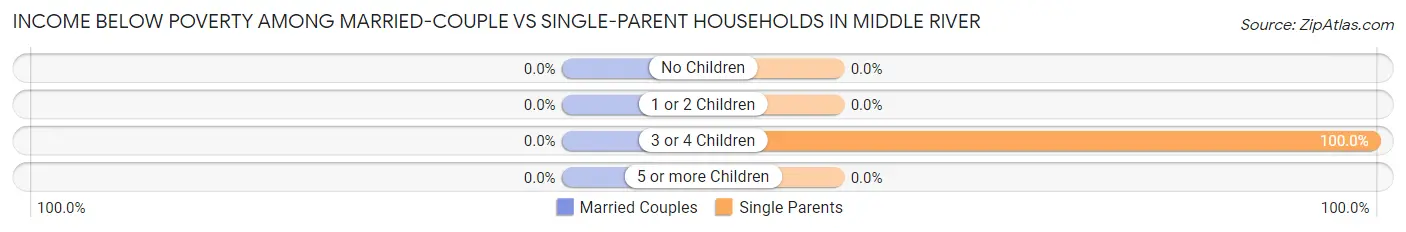
| Children | Married-Couple Families | Single-Parent Households |
| No Children | 0 (0.0%) | 0 (0.0%) |
| 1 or 2 Children | 0 (0.0%) | 0 (0.0%) |
| 3 or 4 Children | 0 (0.0%) | 3 (100.0%) |
| 5 or more Children | 0 (0.0%) | 0 (0.0%) |
| Total | 0 (0.0%) | 3 (21.4%) |
Race in Middle River
The most populous races in Middle River are White / Caucasian (267 | 98.2%), Hispanic or Latino (4 | 1.5%), and Two or more Races (4 | 1.5%).
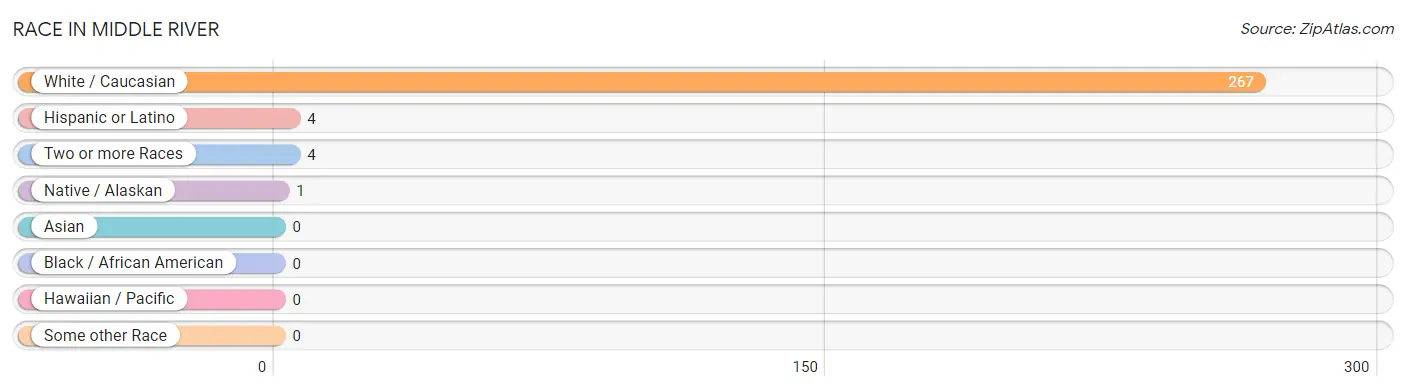
| Race | # Population | % Population |
| Asian | 0 | 0.0% |
| Black / African American | 0 | 0.0% |
| Hawaiian / Pacific | 0 | 0.0% |
| Hispanic or Latino | 4 | 1.5% |
| Native / Alaskan | 1 | 0.4% |
| White / Caucasian | 267 | 98.2% |
| Two or more Races | 4 | 1.5% |
| Some other Race | 0 | 0.0% |
| Total | 272 | 100.0% |
Ancestry in Middle River
The most populous ancestries reported in Middle River are Norwegian (151 | 55.5%), German (58 | 21.3%), Polish (24 | 8.8%), Finnish (18 | 6.6%), and English (17 | 6.2%), together accounting for 98.5% of all Middle River residents.
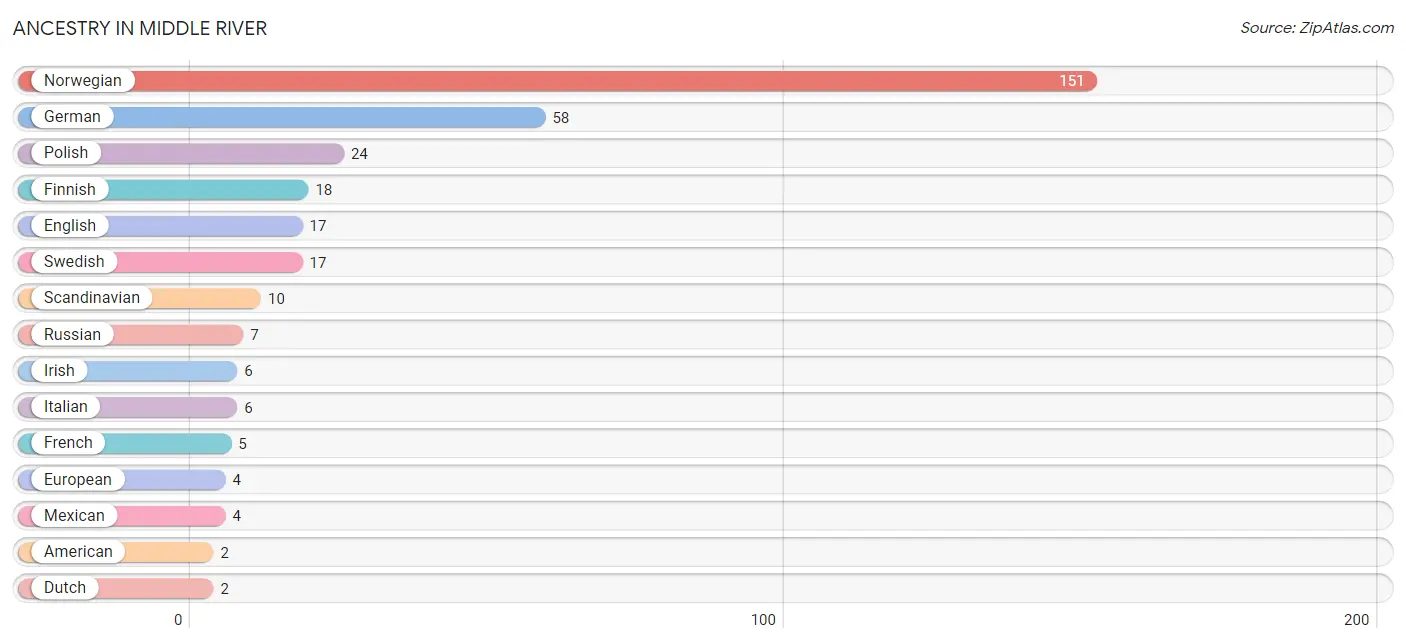
| Ancestry | # Population | % Population |
| American | 2 | 0.7% |
| Czechoslovakian | 1 | 0.4% |
| Dutch | 2 | 0.7% |
| English | 17 | 6.2% |
| European | 4 | 1.5% |
| Finnish | 18 | 6.6% |
| French | 5 | 1.8% |
| German | 58 | 21.3% |
| Irish | 6 | 2.2% |
| Italian | 6 | 2.2% |
| Mexican | 4 | 1.5% |
| New Zealander | 1 | 0.4% |
| Norwegian | 151 | 55.5% |
| Polish | 24 | 8.8% |
| Russian | 7 | 2.6% |
| Scandinavian | 10 | 3.7% |
| Scottish | 1 | 0.4% |
| Swedish | 17 | 6.2% | View All 18 Rows |
Immigrants in Middle River
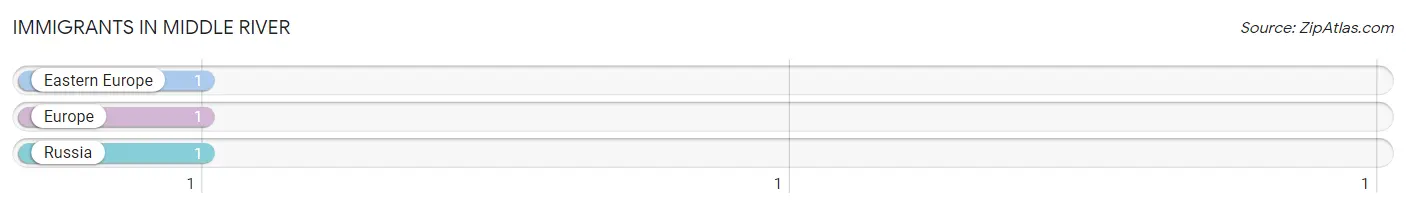
The most numerous immigrant groups reported in Middle River came from Eastern Europe (1 | 0.4%), Europe (1 | 0.4%), and Russia (1 | 0.4%), together accounting for 1.1% of all Middle River residents.
| Immigration Origin | # Population | % Population |
| Eastern Europe | 1 | 0.4% |
| Europe | 1 | 0.4% |
| Russia | 1 | 0.4% | View All 3 Rows |
Sex and Age in Middle River
Sex and Age in Middle River
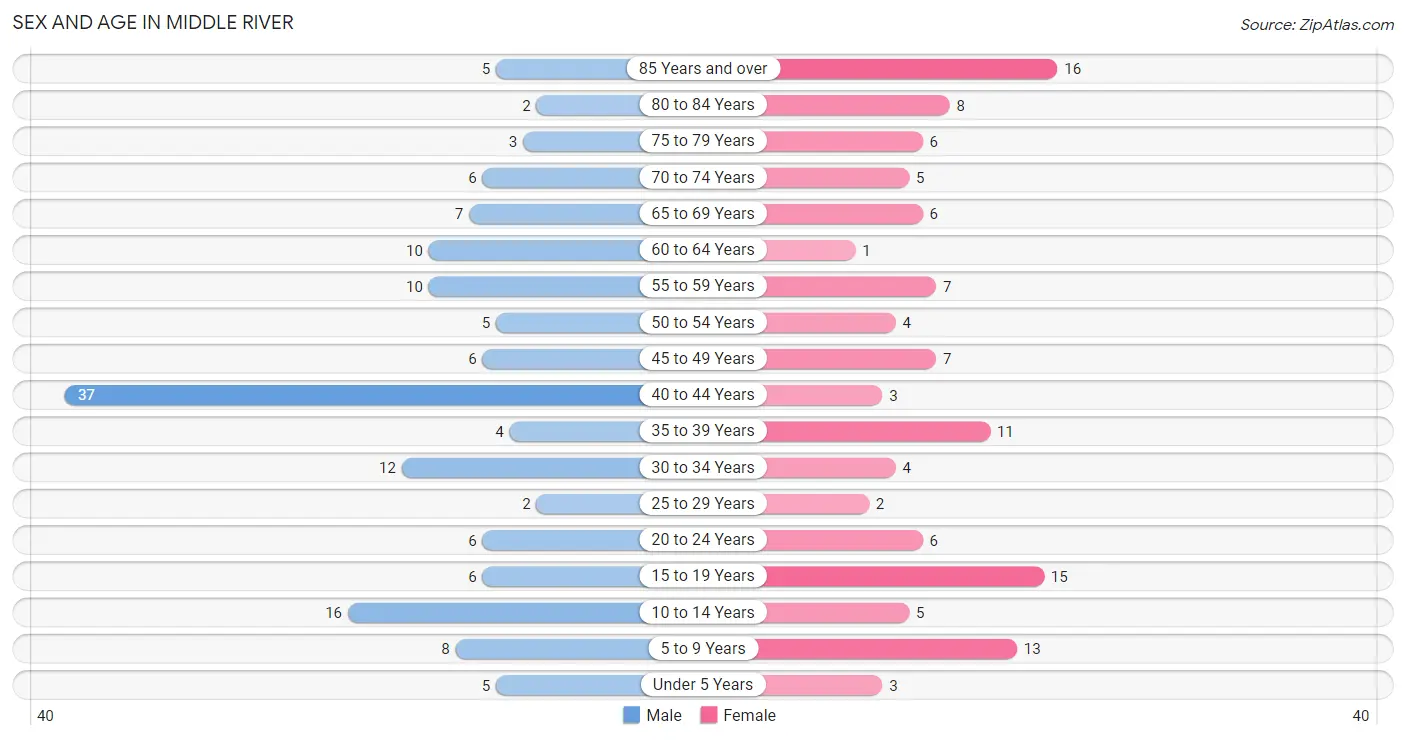
The most populous age groups in Middle River are 40 to 44 Years (37 | 24.7%) for men and 85 Years and over (16 | 13.1%) for women.
| Age Bracket | Male | Female |
| Under 5 Years | 5 (3.3%) | 3 (2.5%) |
| 5 to 9 Years | 8 (5.3%) | 13 (10.7%) |
| 10 to 14 Years | 16 (10.7%) | 5 (4.1%) |
| 15 to 19 Years | 6 (4.0%) | 15 (12.3%) |
| 20 to 24 Years | 6 (4.0%) | 6 (4.9%) |
| 25 to 29 Years | 2 (1.3%) | 2 (1.6%) |
| 30 to 34 Years | 12 (8.0%) | 4 (3.3%) |
| 35 to 39 Years | 4 (2.7%) | 11 (9.0%) |
| 40 to 44 Years | 37 (24.7%) | 3 (2.5%) |
| 45 to 49 Years | 6 (4.0%) | 7 (5.7%) |
| 50 to 54 Years | 5 (3.3%) | 4 (3.3%) |
| 55 to 59 Years | 10 (6.7%) | 7 (5.7%) |
| 60 to 64 Years | 10 (6.7%) | 1 (0.8%) |
| 65 to 69 Years | 7 (4.7%) | 6 (4.9%) |
| 70 to 74 Years | 6 (4.0%) | 5 (4.1%) |
| 75 to 79 Years | 3 (2.0%) | 6 (4.9%) |
| 80 to 84 Years | 2 (1.3%) | 8 (6.6%) |
| 85 Years and over | 5 (3.3%) | 16 (13.1%) |
| Total | 150 (100.0%) | 122 (100.0%) |
Families and Households in Middle River
Median Family Size in Middle River
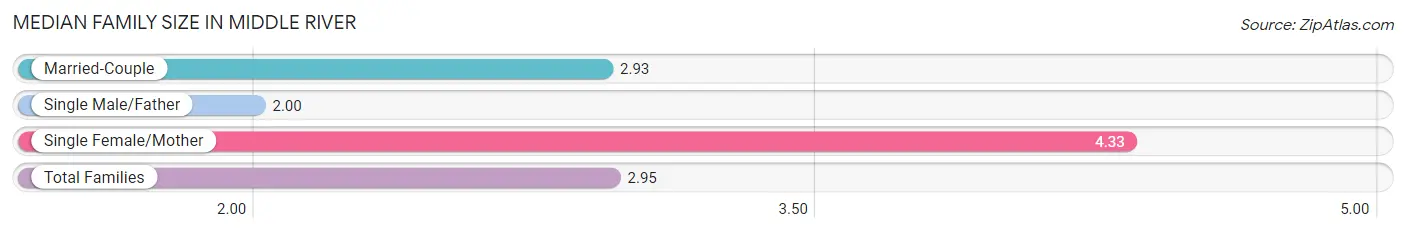
The median family size in Middle River is 2.95 persons per family, with single female/mother families (6 | 10.9%) accounting for the largest median family size of 4.33 persons per family. On the other hand, single male/father families (8 | 14.5%) represent the smallest median family size with 2.00 persons per family.
| Family Type | # Families | Family Size |
| Married-Couple | 41 (74.6%) | 2.93 |
| Single Male/Father | 8 (14.5%) | 2.00 |
| Single Female/Mother | 6 (10.9%) | 4.33 |
| Total Families | 55 (100.0%) | 2.95 |
Median Household Size in Middle River
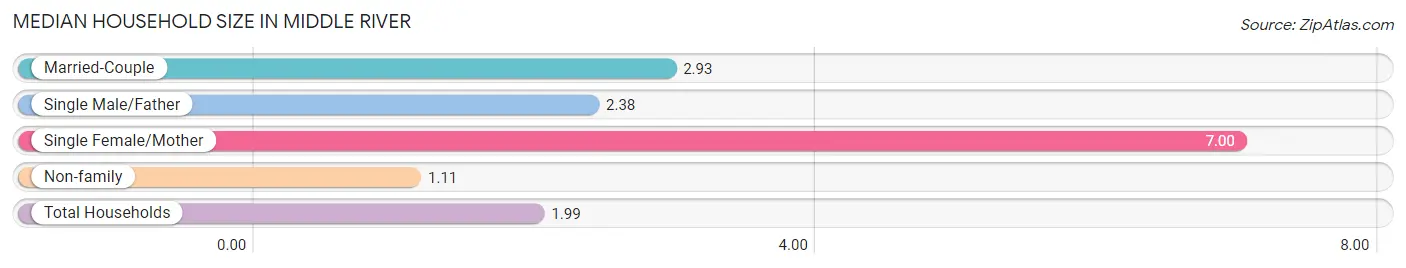
The median household size in Middle River is 1.99 persons per household, with single female/mother households (6 | 4.4%) accounting for the largest median household size of 7 persons per household. non-family households (82 | 59.9%) represent the smallest median household size with 1.11 persons per household.
| Household Type | # Households | Household Size |
| Married-Couple | 41 (29.9%) | 2.93 |
| Single Male/Father | 8 (5.8%) | 2.38 |
| Single Female/Mother | 6 (4.4%) | 7.00 |
| Non-family | 82 (59.9%) | 1.11 |
| Total Households | 137 (100.0%) | 1.99 |
Household Size by Marriage Status in Middle River
Out of a total of 137 households in Middle River, 55 (40.2%) are family households, while 82 (59.9%) are nonfamily households. The most numerous type of family households are 2-person households, comprising 27, and the most common type of nonfamily households are 1-person households, comprising 76.
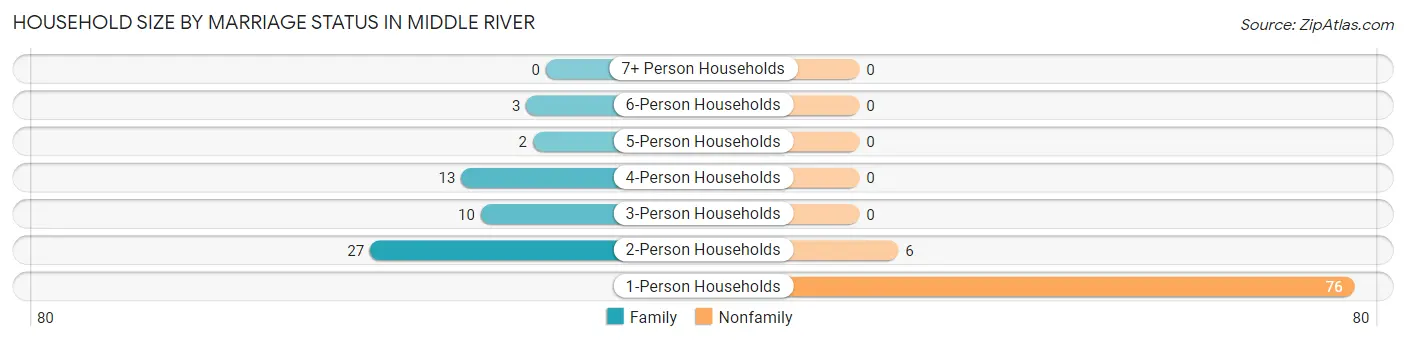
| Household Size | Family Households | Nonfamily Households |
| 1-Person Households | - | 76 (55.5%) |
| 2-Person Households | 27 (19.7%) | 6 (4.4%) |
| 3-Person Households | 10 (7.3%) | 0 (0.0%) |
| 4-Person Households | 13 (9.5%) | 0 (0.0%) |
| 5-Person Households | 2 (1.5%) | 0 (0.0%) |
| 6-Person Households | 3 (2.2%) | 0 (0.0%) |
| 7+ Person Households | 0 (0.0%) | 0 (0.0%) |
| Total | 55 (40.2%) | 82 (59.9%) |
Female Fertility in Middle River
Fertility by Age in Middle River
Average fertility rate in Middle River is 21.0 births per 1,000 women. Women in the age bracket of 20 to 34 years have the highest fertility rate with 83.0 births per 1,000 women. Women in the age bracket of 20 to 34 years acount for 100.0% of all women with births.
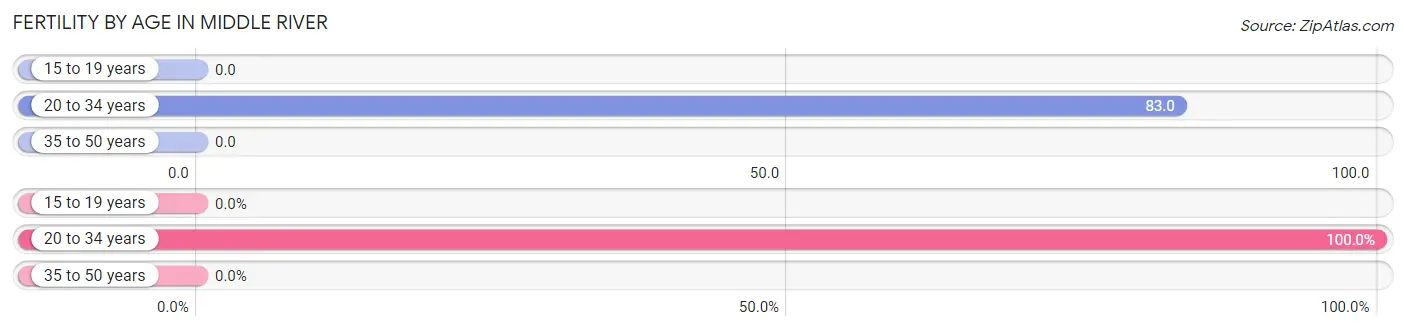
| Age Bracket | Women with Births | Births / 1,000 Women |
| 15 to 19 years | 0 (0.0%) | 0.0 |
| 20 to 34 years | 1 (100.0%) | 83.0 |
| 35 to 50 years | 0 (0.0%) | 0.0 |
| Total | 1 (100.0%) | 21.0 |
Fertility by Age by Marriage Status in Middle River
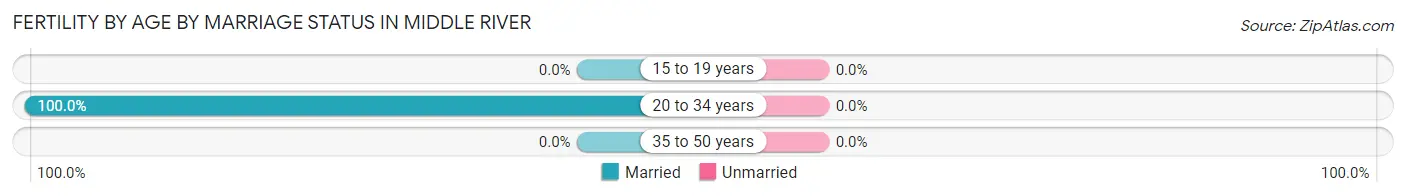
| Age Bracket | Married | Unmarried |
| 15 to 19 years | 0 (0.0%) | 0 (0.0%) |
| 20 to 34 years | 1 (100.0%) | 0 (0.0%) |
| 35 to 50 years | 0 (0.0%) | 0 (0.0%) |
| Total | 1 (100.0%) | 0 (0.0%) |
Fertility by Education in Middle River
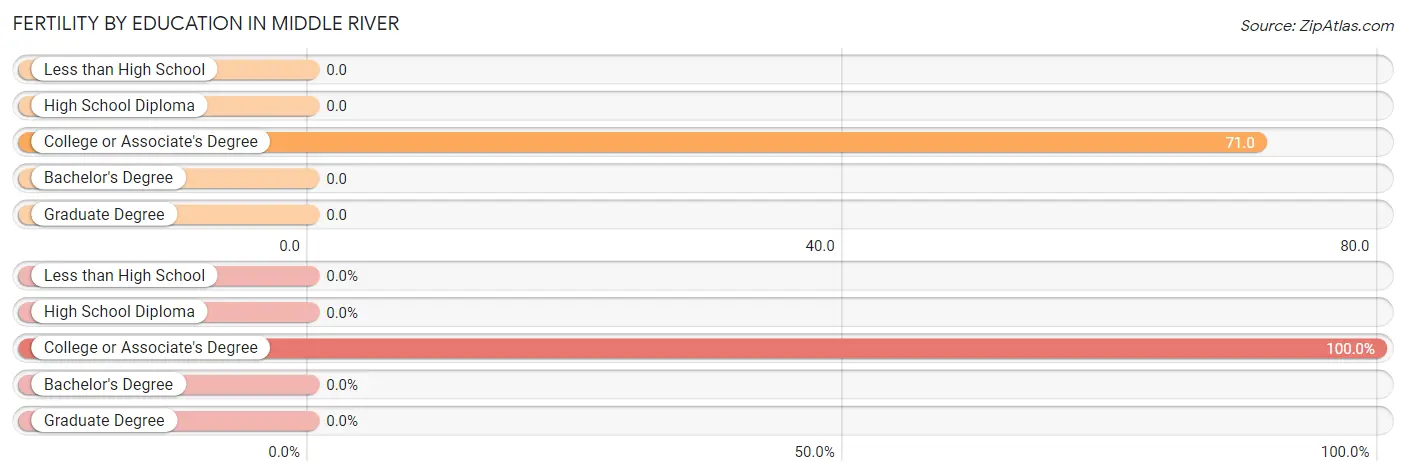
| Educational Attainment | Women with Births | Births / 1,000 Women |
| Less than High School | 0 (0.0%) | 0.0 |
| High School Diploma | 0 (0.0%) | 0.0 |
| College or Associate's Degree | 1 (100.0%) | 71.0 |
| Bachelor's Degree | 0 (0.0%) | 0.0 |
| Graduate Degree | 0 (0.0%) | 0.0 |
| Total | 1 (100.0%) | 21.0 |
Fertility by Education by Marriage Status in Middle River
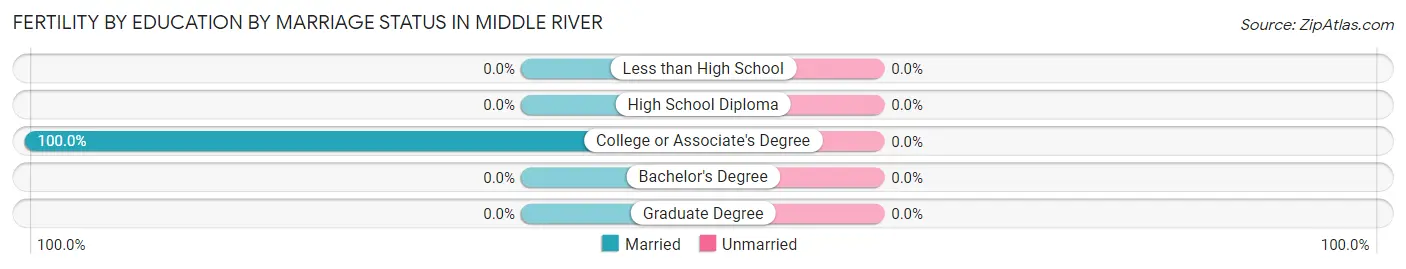
| Educational Attainment | Married | Unmarried |
| Less than High School | 0 (0.0%) | 0 (0.0%) |
| High School Diploma | 0 (0.0%) | 0 (0.0%) |
| College or Associate's Degree | 1 (100.0%) | 0 (0.0%) |
| Bachelor's Degree | 0 (0.0%) | 0 (0.0%) |
| Graduate Degree | 0 (0.0%) | 0 (0.0%) |
| Total | 1 (100.0%) | 0 (0.0%) |
Employment Characteristics in Middle River
Employment by Class of Employer in Middle River
Among the 146 employed individuals in Middle River, private company employees (121 | 82.9%), local government employees (13 | 8.9%), and not-for-profit organizations (8 | 5.5%) make up the most common classes of employment.
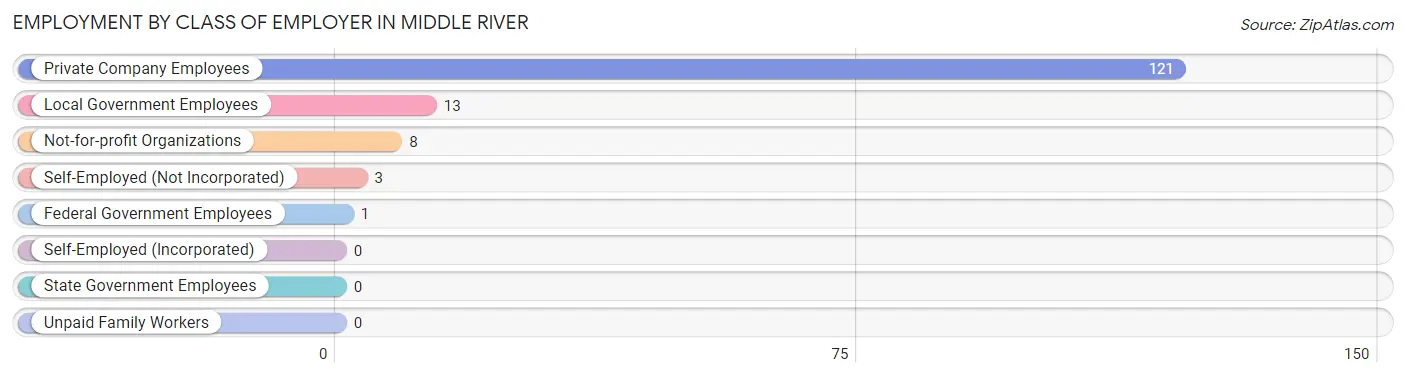
| Employer Class | # Employees | % Employees |
| Private Company Employees | 121 | 82.9% |
| Self-Employed (Incorporated) | 0 | 0.0% |
| Self-Employed (Not Incorporated) | 3 | 2.1% |
| Not-for-profit Organizations | 8 | 5.5% |
| Local Government Employees | 13 | 8.9% |
| State Government Employees | 0 | 0.0% |
| Federal Government Employees | 1 | 0.7% |
| Unpaid Family Workers | 0 | 0.0% |
| Total | 146 | 100.0% |
Employment Status by Age in Middle River
According to the labor force statistics for Middle River, out of the total population over 16 years of age (218), 69.3% or 151 individuals are in the labor force, with 1.3% or 2 of them unemployed. The age group with the highest labor force participation rate is 20 to 24 years, with 100.0% or 12 individuals in the labor force. Within the labor force, the 60 to 64 years age range has the highest percentage of unemployed individuals, with 14.3% or 1 of them being unemployed.
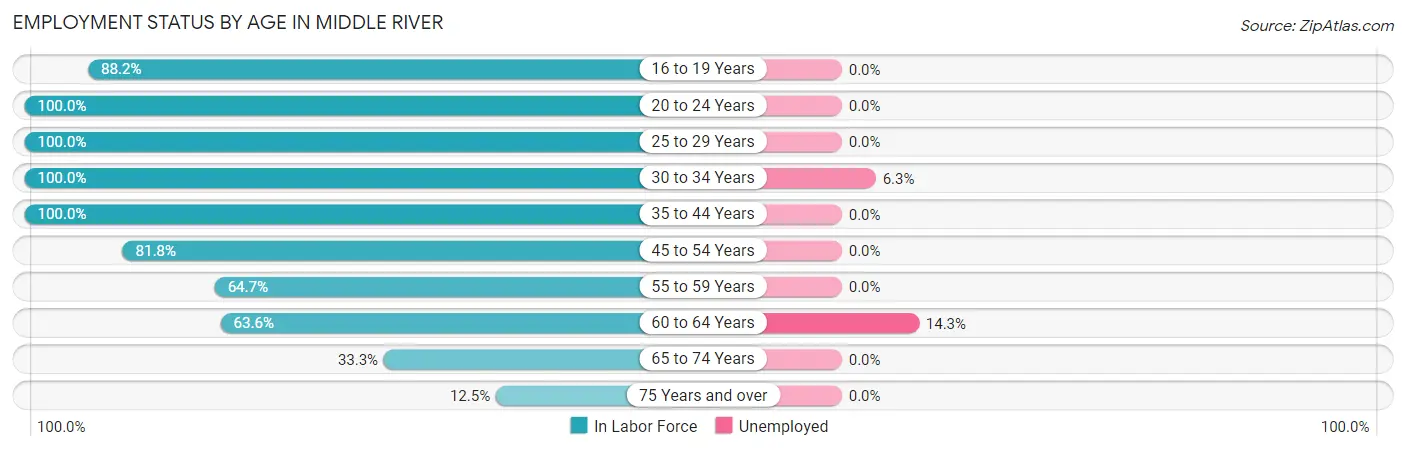
| Age Bracket | In Labor Force | Unemployed |
| 16 to 19 Years | 15 (88.2%) | 0 (0.0%) |
| 20 to 24 Years | 12 (100.0%) | 0 (0.0%) |
| 25 to 29 Years | 4 (100.0%) | 0 (0.0%) |
| 30 to 34 Years | 16 (100.0%) | 1 (6.3%) |
| 35 to 44 Years | 55 (100.0%) | 0 (0.0%) |
| 45 to 54 Years | 18 (81.8%) | 0 (0.0%) |
| 55 to 59 Years | 11 (64.7%) | 0 (0.0%) |
| 60 to 64 Years | 7 (63.6%) | 1 (14.3%) |
| 65 to 74 Years | 8 (33.3%) | 0 (0.0%) |
| 75 Years and over | 5 (12.5%) | 0 (0.0%) |
| Total | 151 (69.3%) | 2 (1.3%) |
Employment Status by Educational Attainment in Middle River
According to labor force statistics for Middle River, 88.8% of individuals (111) out of the total population between 25 and 64 years of age (125) are in the labor force, with 1.8% or 2 of them being unemployed. The group with the highest labor force participation rate are those with the educational attainment of less than high school, with 100.0% or 3 individuals in the labor force. Within the labor force, individuals with college / associate degree education have the highest percentage of unemployment, with 2.7% or 1 of them being unemployed.
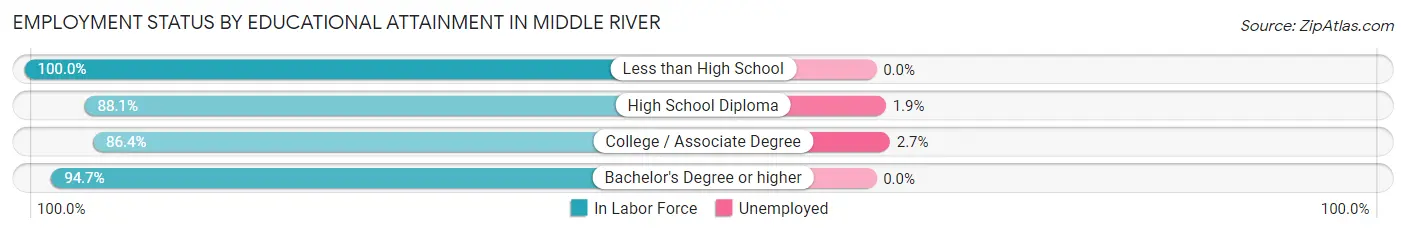
| Educational Attainment | In Labor Force | Unemployed |
| Less than High School | 3 (100.0%) | 0 (0.0%) |
| High School Diploma | 52 (88.1%) | 1 (1.9%) |
| College / Associate Degree | 38 (86.4%) | 1 (2.7%) |
| Bachelor's Degree or higher | 18 (94.7%) | 0 (0.0%) |
| Total | 111 (88.8%) | 2 (1.8%) |
Employment Occupations by Sex in Middle River
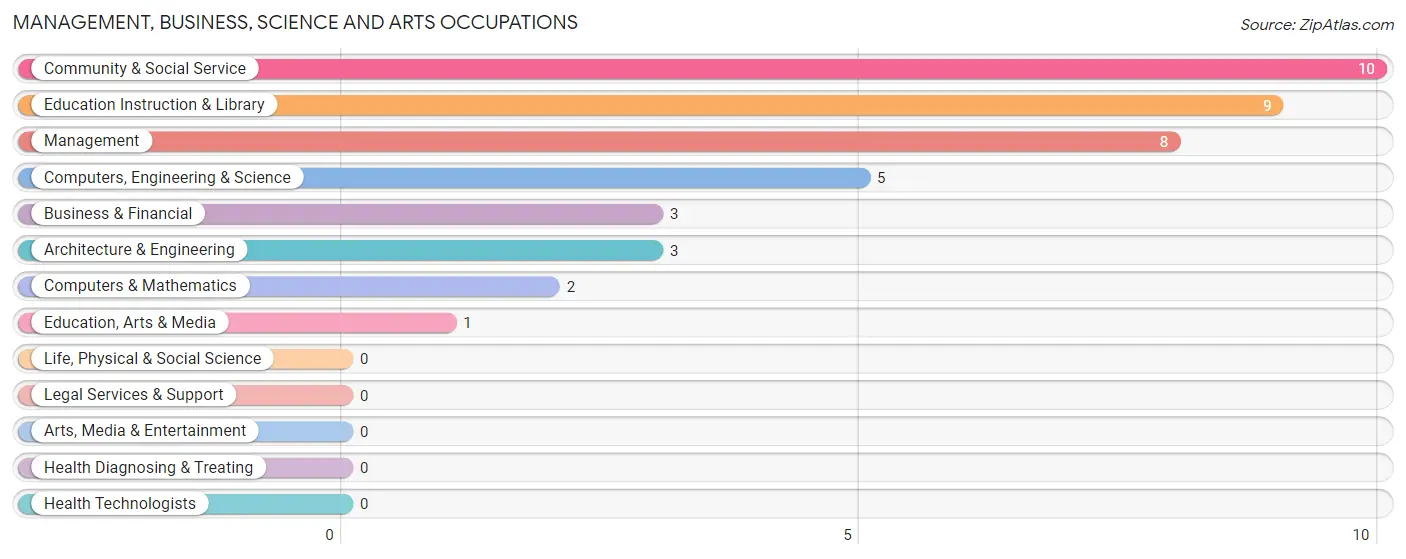
Management, Business, Science and Arts Occupations
The most common Management, Business, Science and Arts occupations in Middle River are Community & Social Service (10 | 6.8%), Education Instruction & Library (9 | 6.1%), Management (8 | 5.4%), Computers, Engineering & Science (5 | 3.4%), and Business & Financial (3 | 2.0%).
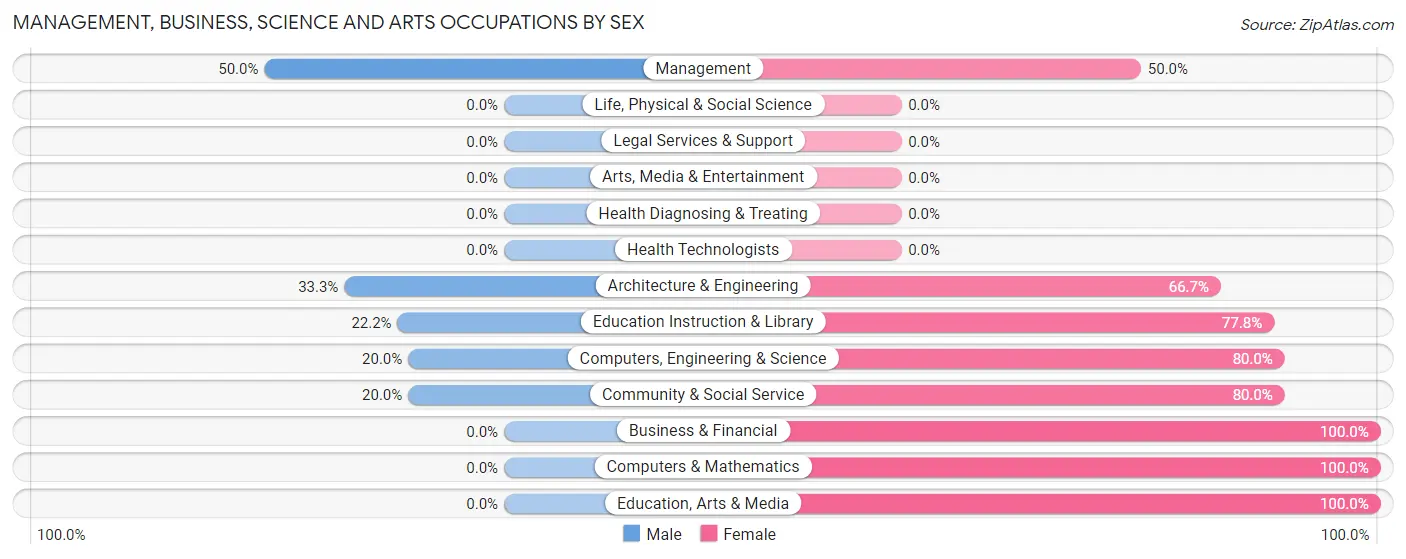
Management, Business, Science and Arts Occupations by Sex
Within the Management, Business, Science and Arts occupations in Middle River, the most male-oriented occupations are Management (50.0%), Architecture & Engineering (33.3%), and Education Instruction & Library (22.2%), while the most female-oriented occupations are Business & Financial (100.0%), Computers & Mathematics (100.0%), and Education, Arts & Media (100.0%).
| Occupation | Male | Female |
| Management | 4 (50.0%) | 4 (50.0%) |
| Business & Financial | 0 (0.0%) | 3 (100.0%) |
| Computers, Engineering & Science | 1 (20.0%) | 4 (80.0%) |
| Computers & Mathematics | 0 (0.0%) | 2 (100.0%) |
| Architecture & Engineering | 1 (33.3%) | 2 (66.7%) |
| Life, Physical & Social Science | 0 (0.0%) | 0 (0.0%) |
| Community & Social Service | 2 (20.0%) | 8 (80.0%) |
| Education, Arts & Media | 0 (0.0%) | 1 (100.0%) |
| Legal Services & Support | 0 (0.0%) | 0 (0.0%) |
| Education Instruction & Library | 2 (22.2%) | 7 (77.8%) |
| Arts, Media & Entertainment | 0 (0.0%) | 0 (0.0%) |
| Health Diagnosing & Treating | 0 (0.0%) | 0 (0.0%) |
| Health Technologists | 0 (0.0%) | 0 (0.0%) |
| Total (Category) | 7 (26.9%) | 19 (73.1%) |
| Total (Overall) | 91 (61.5%) | 57 (38.5%) |
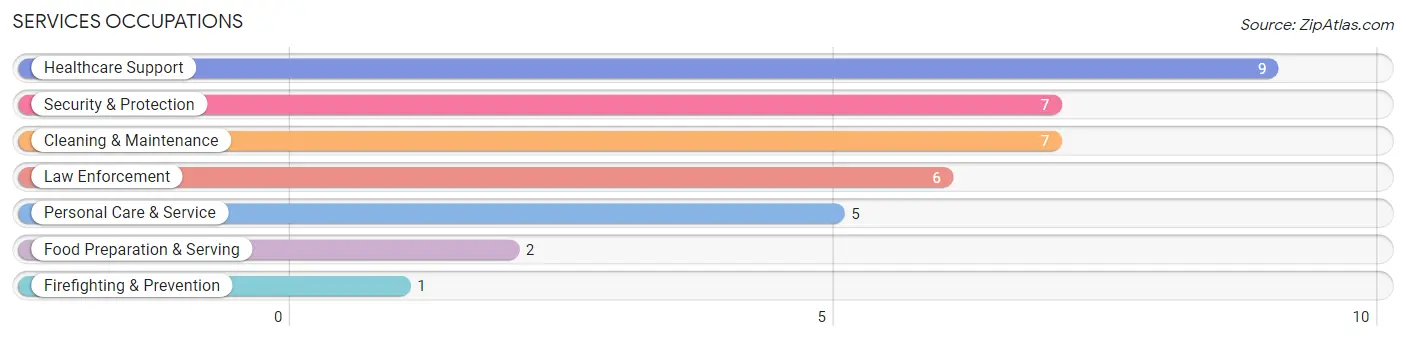
Services Occupations
The most common Services occupations in Middle River are Healthcare Support (9 | 6.1%), Security & Protection (7 | 4.7%), Cleaning & Maintenance (7 | 4.7%), Law Enforcement (6 | 4.1%), and Personal Care & Service (5 | 3.4%).
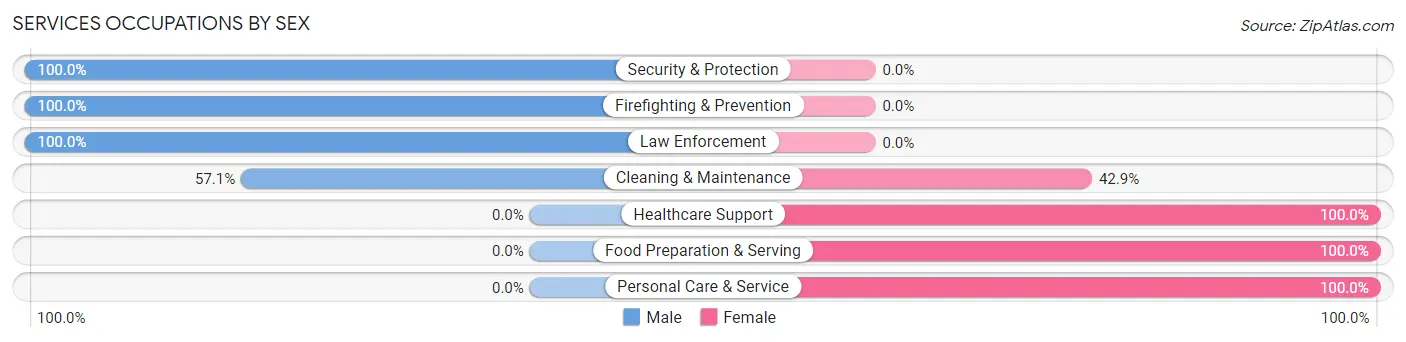
Services Occupations by Sex
Within the Services occupations in Middle River, the most male-oriented occupations are Security & Protection (100.0%), Firefighting & Prevention (100.0%), and Law Enforcement (100.0%), while the most female-oriented occupations are Healthcare Support (100.0%), Food Preparation & Serving (100.0%), and Personal Care & Service (100.0%).
| Occupation | Male | Female |
| Healthcare Support | 0 (0.0%) | 9 (100.0%) |
| Security & Protection | 7 (100.0%) | 0 (0.0%) |
| Firefighting & Prevention | 1 (100.0%) | 0 (0.0%) |
| Law Enforcement | 6 (100.0%) | 0 (0.0%) |
| Food Preparation & Serving | 0 (0.0%) | 2 (100.0%) |
| Cleaning & Maintenance | 4 (57.1%) | 3 (42.9%) |
| Personal Care & Service | 0 (0.0%) | 5 (100.0%) |
| Total (Category) | 11 (36.7%) | 19 (63.3%) |
| Total (Overall) | 91 (61.5%) | 57 (38.5%) |
Sales and Office Occupations
The most common Sales and Office occupations in Middle River are Sales & Related (11 | 7.4%), and Office & Administration (8 | 5.4%).
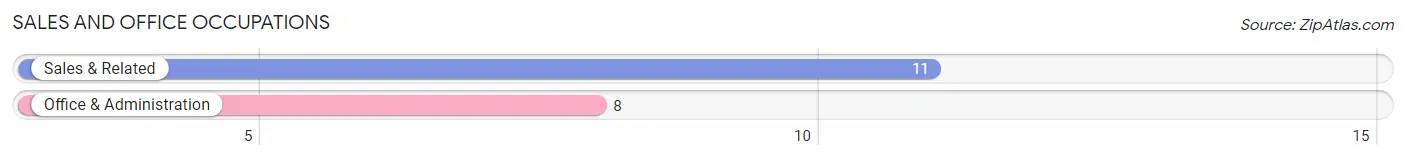
Sales and Office Occupations by Sex
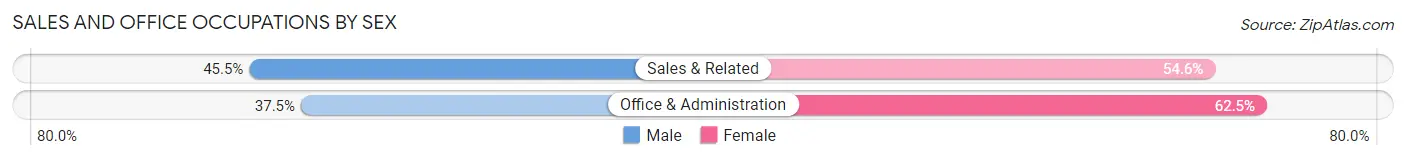
| Occupation | Male | Female |
| Sales & Related | 5 (45.5%) | 6 (54.5%) |
| Office & Administration | 3 (37.5%) | 5 (62.5%) |
| Total (Category) | 8 (42.1%) | 11 (57.9%) |
| Total (Overall) | 91 (61.5%) | 57 (38.5%) |
Natural Resources, Construction and Maintenance Occupations
The most common Natural Resources, Construction and Maintenance occupations in Middle River are Construction & Extraction (24 | 16.2%), Farming, Fishing & Forestry (5 | 3.4%), and Installation, Maintenance & Repair (3 | 2.0%).
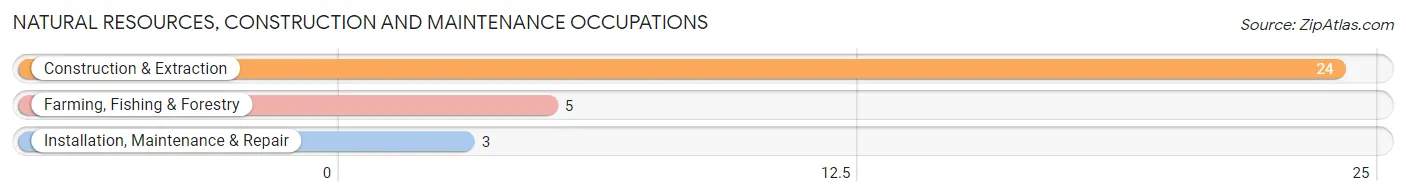
Natural Resources, Construction and Maintenance Occupations by Sex
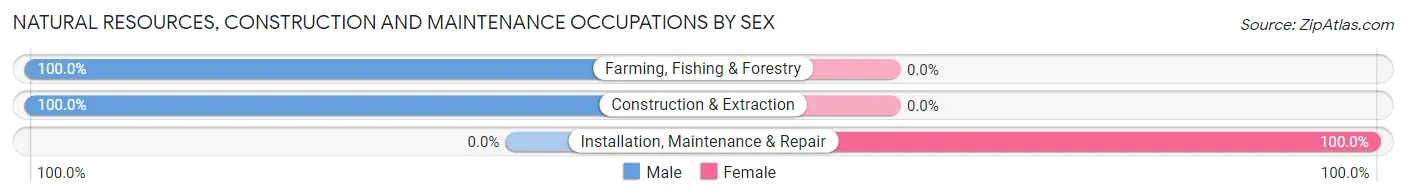
| Occupation | Male | Female |
| Farming, Fishing & Forestry | 5 (100.0%) | 0 (0.0%) |
| Construction & Extraction | 24 (100.0%) | 0 (0.0%) |
| Installation, Maintenance & Repair | 0 (0.0%) | 3 (100.0%) |
| Total (Category) | 29 (90.6%) | 3 (9.4%) |
| Total (Overall) | 91 (61.5%) | 57 (38.5%) |
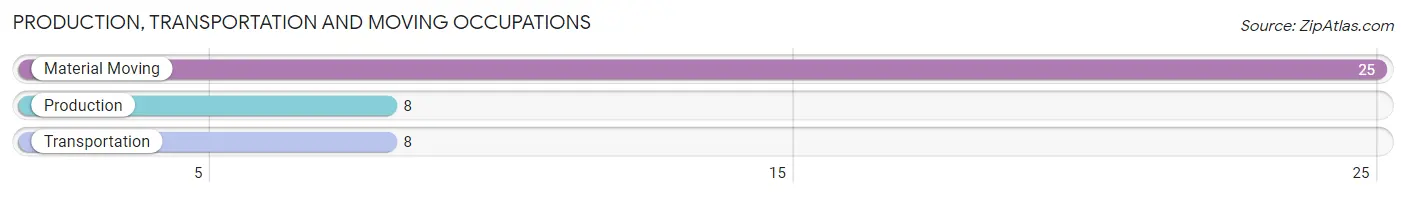
Production, Transportation and Moving Occupations
The most common Production, Transportation and Moving occupations in Middle River are Material Moving (25 | 16.9%), Production (8 | 5.4%), and Transportation (8 | 5.4%).
Production, Transportation and Moving Occupations by Sex
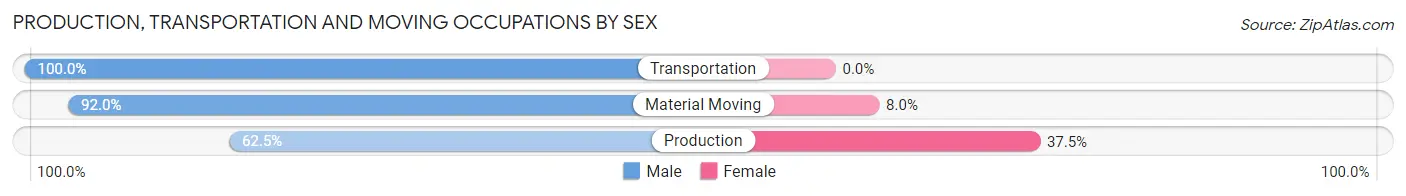
| Occupation | Male | Female |
| Production | 5 (62.5%) | 3 (37.5%) |
| Transportation | 8 (100.0%) | 0 (0.0%) |
| Material Moving | 23 (92.0%) | 2 (8.0%) |
| Total (Category) | 36 (87.8%) | 5 (12.2%) |
| Total (Overall) | 91 (61.5%) | 57 (38.5%) |
Employment Industries by Sex in Middle River
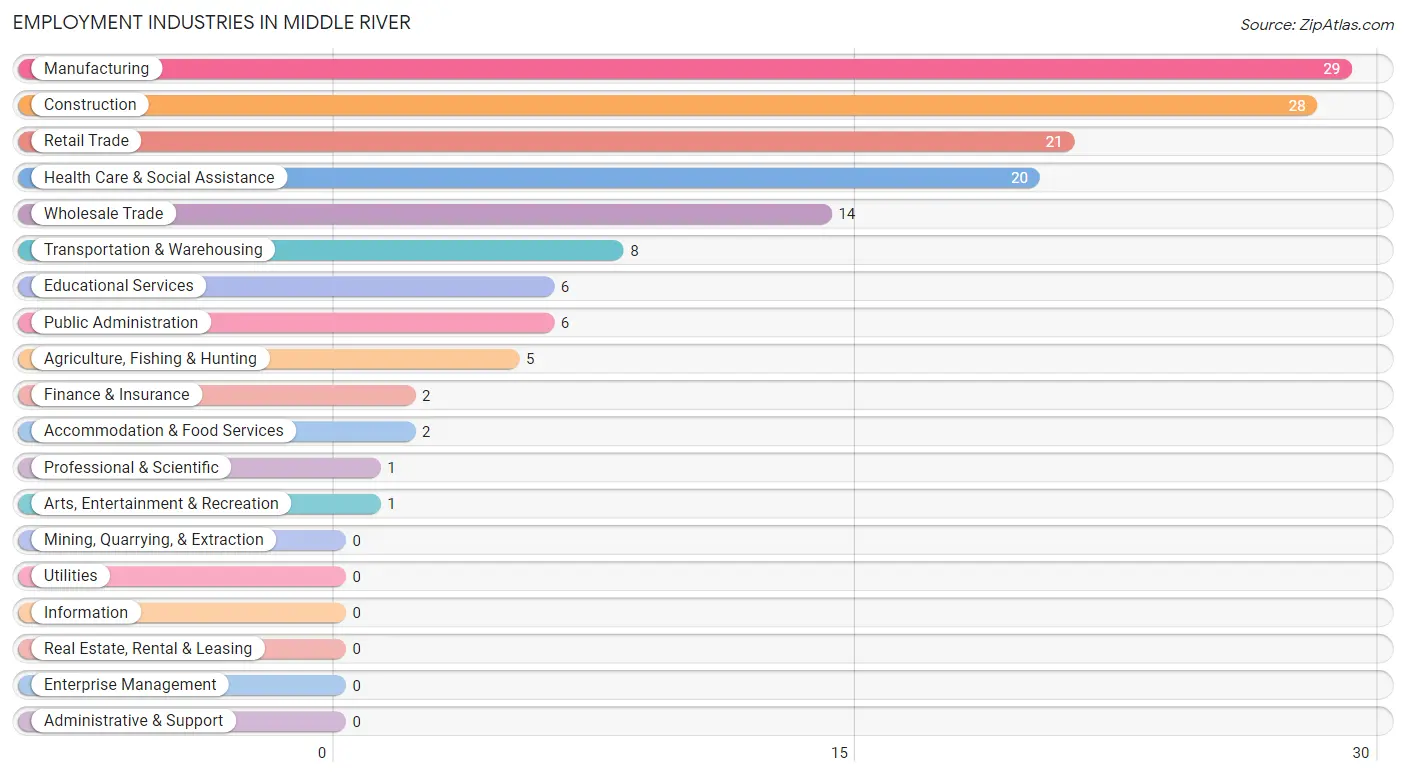
Employment Industries in Middle River
The major employment industries in Middle River include Manufacturing (29 | 19.6%), Construction (28 | 18.9%), Retail Trade (21 | 14.2%), Health Care & Social Assistance (20 | 13.5%), and Wholesale Trade (14 | 9.5%).
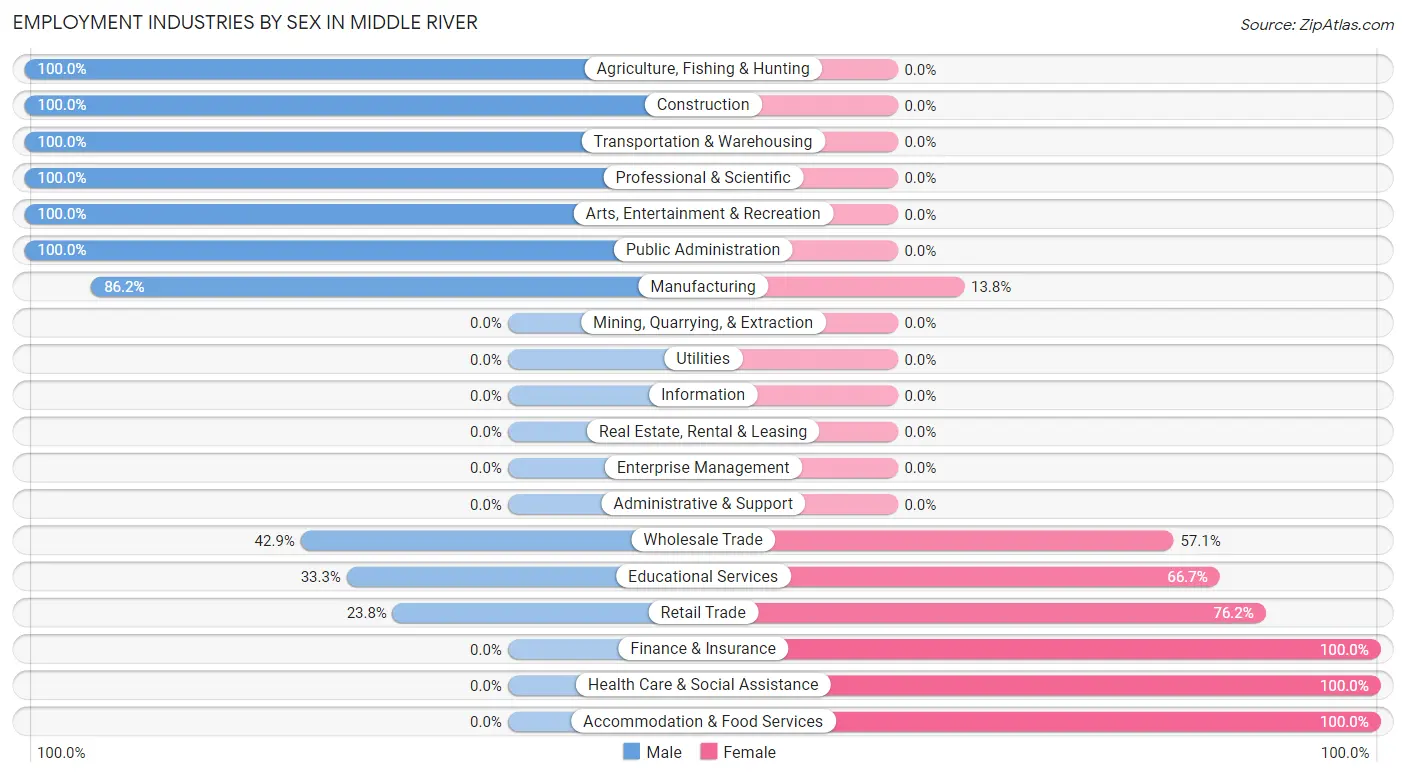
Employment Industries by Sex in Middle River
The Middle River industries that see more men than women are Agriculture, Fishing & Hunting (100.0%), Construction (100.0%), and Transportation & Warehousing (100.0%), whereas the industries that tend to have a higher number of women are Finance & Insurance (100.0%), Health Care & Social Assistance (100.0%), and Accommodation & Food Services (100.0%).
| Industry | Male | Female |
| Agriculture, Fishing & Hunting | 5 (100.0%) | 0 (0.0%) |
| Mining, Quarrying, & Extraction | 0 (0.0%) | 0 (0.0%) |
| Construction | 28 (100.0%) | 0 (0.0%) |
| Manufacturing | 25 (86.2%) | 4 (13.8%) |
| Wholesale Trade | 6 (42.9%) | 8 (57.1%) |
| Retail Trade | 5 (23.8%) | 16 (76.2%) |
| Transportation & Warehousing | 8 (100.0%) | 0 (0.0%) |
| Utilities | 0 (0.0%) | 0 (0.0%) |
| Information | 0 (0.0%) | 0 (0.0%) |
| Finance & Insurance | 0 (0.0%) | 2 (100.0%) |
| Real Estate, Rental & Leasing | 0 (0.0%) | 0 (0.0%) |
| Professional & Scientific | 1 (100.0%) | 0 (0.0%) |
| Enterprise Management | 0 (0.0%) | 0 (0.0%) |
| Administrative & Support | 0 (0.0%) | 0 (0.0%) |
| Educational Services | 2 (33.3%) | 4 (66.7%) |
| Health Care & Social Assistance | 0 (0.0%) | 20 (100.0%) |
| Arts, Entertainment & Recreation | 1 (100.0%) | 0 (0.0%) |
| Accommodation & Food Services | 0 (0.0%) | 2 (100.0%) |
| Public Administration | 6 (100.0%) | 0 (0.0%) |
| Total | 91 (61.5%) | 57 (38.5%) |
Education in Middle River
School Enrollment in Middle River
The most common levels of schooling among the 70 students in Middle River are college / undergraduate (16 | 22.9%), middle school (14 | 20.0%), and nursery / preschool (12 | 17.1%).
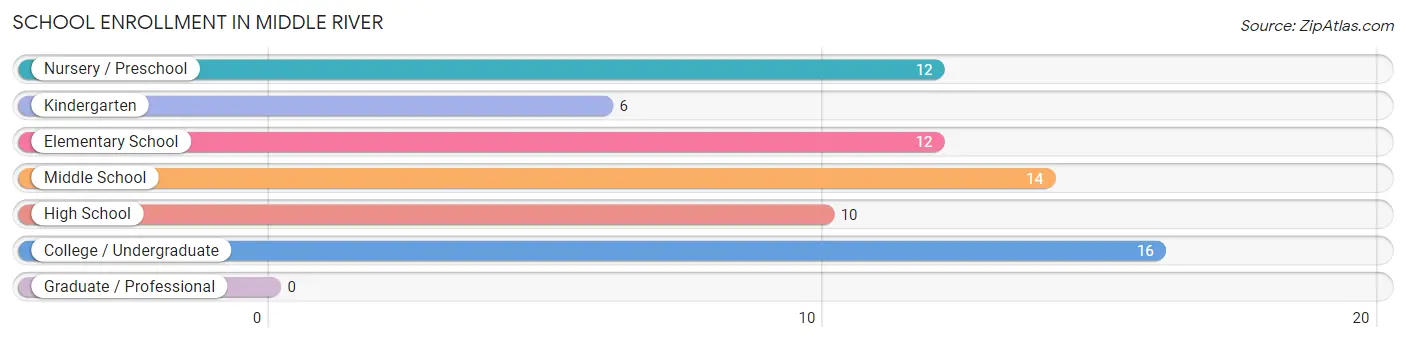
| School Level | # Students | % Students |
| Nursery / Preschool | 12 | 17.1% |
| Kindergarten | 6 | 8.6% |
| Elementary School | 12 | 17.1% |
| Middle School | 14 | 20.0% |
| High School | 10 | 14.3% |
| College / Undergraduate | 16 | 22.9% |
| Graduate / Professional | 0 | 0.0% |
| Total | 70 | 100.0% |
School Enrollment by Age by Funding Source in Middle River
Out of a total of 70 students who are enrolled in schools in Middle River, 6 (8.6%) attend a private institution, while the remaining 64 (91.4%) are enrolled in public schools. The age group of 5 to 9 year old has the highest likelihood of being enrolled in private schools, with 4 (19.1% in the age bracket) enrolled. Conversely, the age group of 3 to 4 year olds has the lowest likelihood of being enrolled in a private school, with 3 (100.0% in the age bracket) attending a public institution.
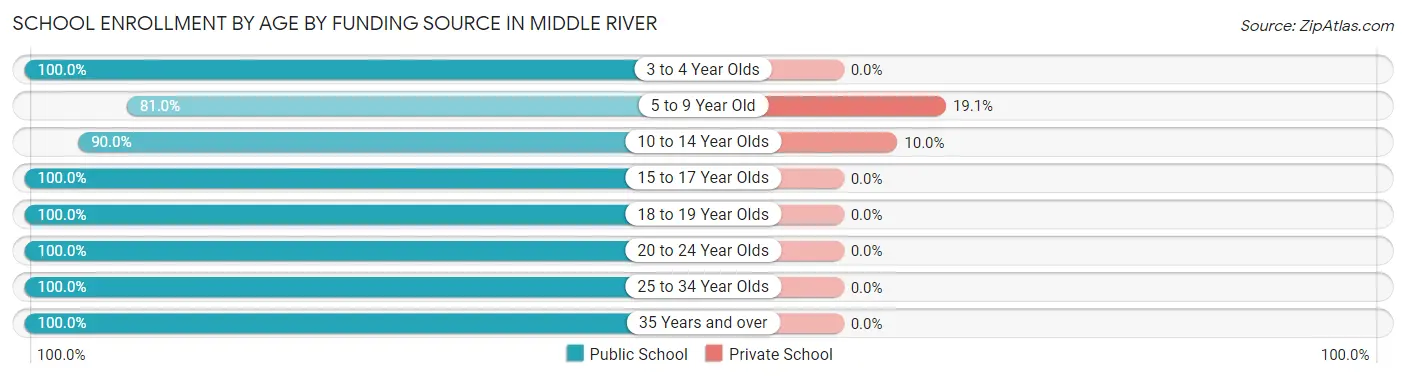
| Age Bracket | Public School | Private School |
| 3 to 4 Year Olds | 3 (100.0%) | 0 (0.0%) |
| 5 to 9 Year Old | 17 (80.9%) | 4 (19.1%) |
| 10 to 14 Year Olds | 18 (90.0%) | 2 (10.0%) |
| 15 to 17 Year Olds | 8 (100.0%) | 0 (0.0%) |
| 18 to 19 Year Olds | 10 (100.0%) | 0 (0.0%) |
| 20 to 24 Year Olds | 6 (100.0%) | 0 (0.0%) |
| 25 to 34 Year Olds | 1 (100.0%) | 0 (0.0%) |
| 35 Years and over | 1 (100.0%) | 0 (0.0%) |
| Total | 64 (91.4%) | 6 (8.6%) |
Educational Attainment by Field of Study in Middle River
Education (10 | 38.5%), business (7 | 26.9%), science & technology (5 | 19.2%), engineering (2 | 7.7%), and liberal arts & history (1 | 3.8%) are the most common fields of study among 26 individuals in Middle River who have obtained a bachelor's degree or higher.
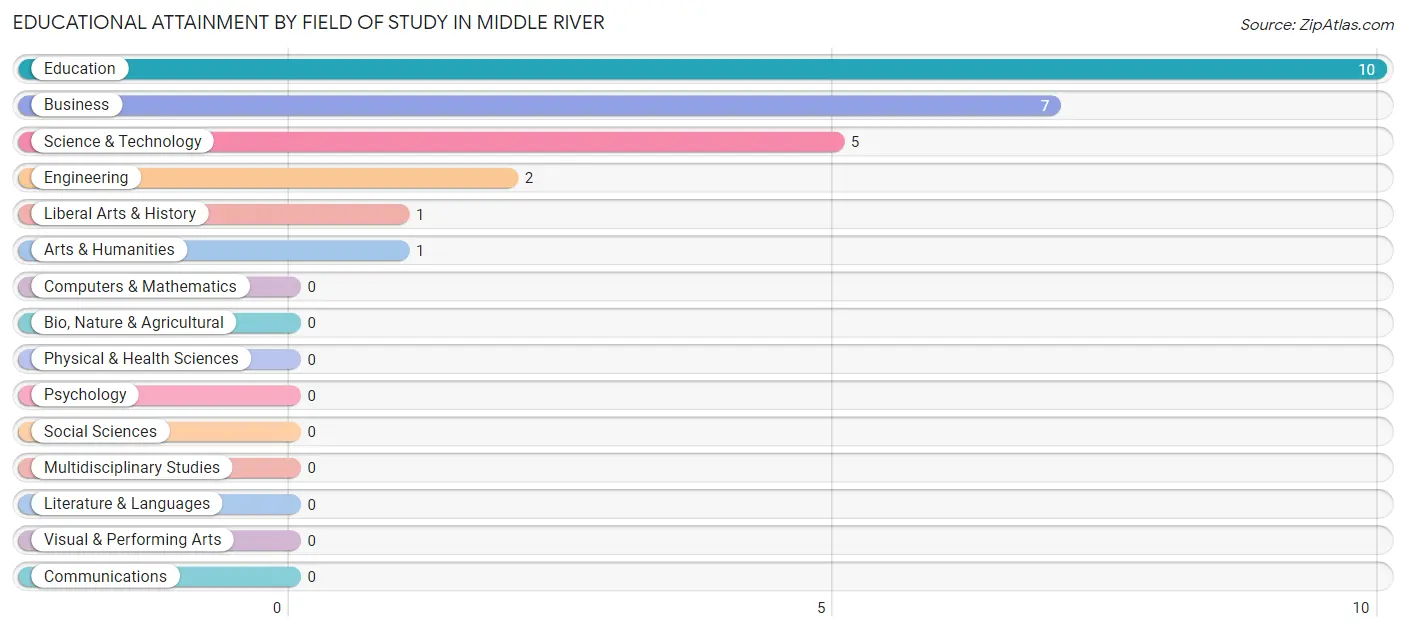
| Field of Study | # Graduates | % Graduates |
| Computers & Mathematics | 0 | 0.0% |
| Bio, Nature & Agricultural | 0 | 0.0% |
| Physical & Health Sciences | 0 | 0.0% |
| Psychology | 0 | 0.0% |
| Social Sciences | 0 | 0.0% |
| Engineering | 2 | 7.7% |
| Multidisciplinary Studies | 0 | 0.0% |
| Science & Technology | 5 | 19.2% |
| Business | 7 | 26.9% |
| Education | 10 | 38.5% |
| Literature & Languages | 0 | 0.0% |
| Liberal Arts & History | 1 | 3.8% |
| Visual & Performing Arts | 0 | 0.0% |
| Communications | 0 | 0.0% |
| Arts & Humanities | 1 | 3.8% |
| Total | 26 | 100.0% |
Transportation & Commute in Middle River
Vehicle Availability by Sex in Middle River
The most prevalent vehicle ownership categories in Middle River are males with 2 vehicles (38, accounting for 41.3%) and females with 2 vehicles (19, making up 70.4%).
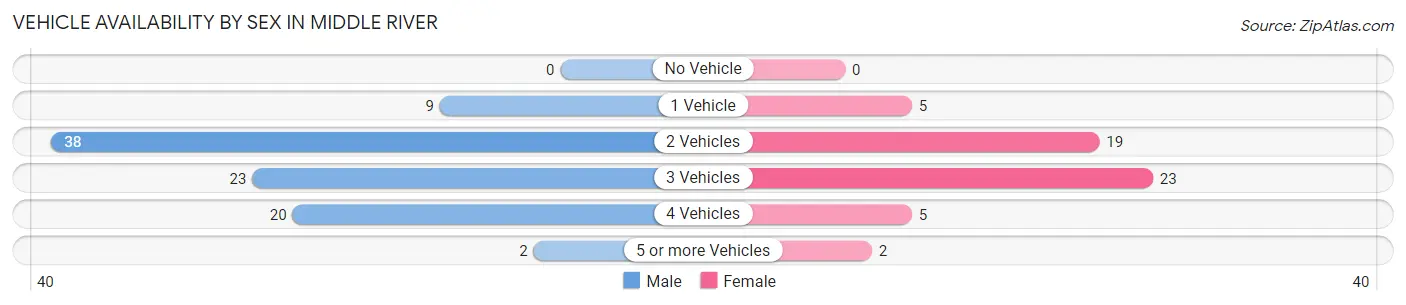
| Vehicles Available | Male | Female |
| No Vehicle | 0 (0.0%) | 0 (0.0%) |
| 1 Vehicle | 9 (9.8%) | 5 (9.3%) |
| 2 Vehicles | 38 (41.3%) | 19 (35.2%) |
| 3 Vehicles | 23 (25.0%) | 23 (42.6%) |
| 4 Vehicles | 20 (21.7%) | 5 (9.3%) |
| 5 or more Vehicles | 2 (2.2%) | 2 (3.7%) |
| Total | 92 (100.0%) | 54 (100.0%) |
Commute Time in Middle River
The most frequently occuring commute durations in Middle River are 5 to 9 minutes (27 commuters, 18.9%), 30 to 34 minutes (23 commuters, 16.1%), and 45 to 59 minutes (23 commuters, 16.1%).
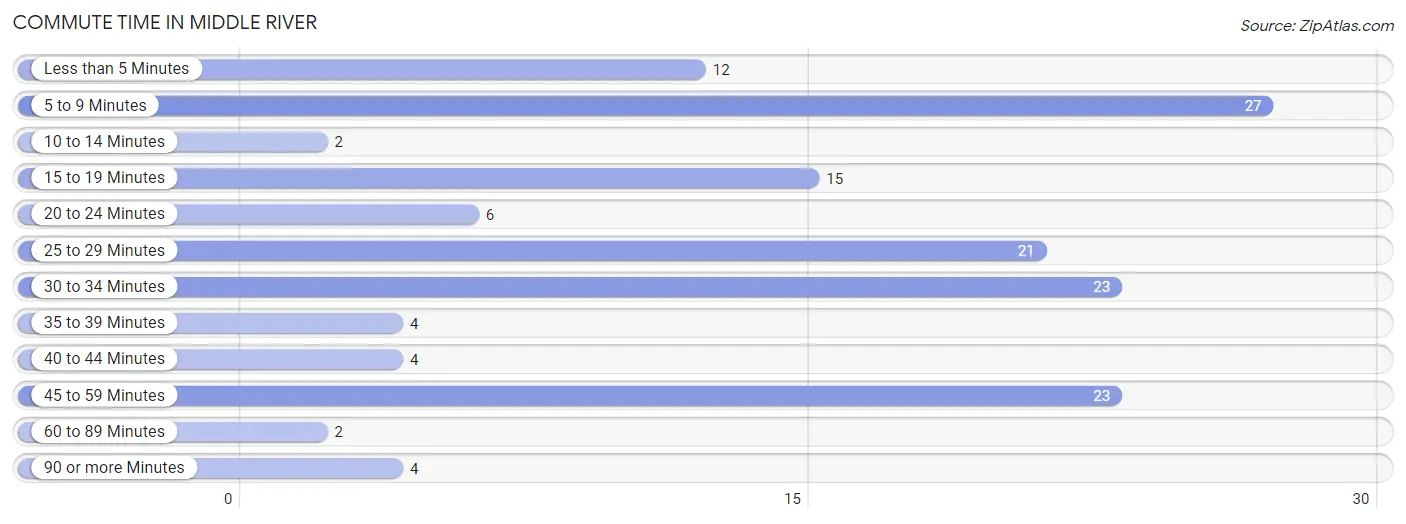
| Commute Time | # Commuters | % Commuters |
| Less than 5 Minutes | 12 | 8.4% |
| 5 to 9 Minutes | 27 | 18.9% |
| 10 to 14 Minutes | 2 | 1.4% |
| 15 to 19 Minutes | 15 | 10.5% |
| 20 to 24 Minutes | 6 | 4.2% |
| 25 to 29 Minutes | 21 | 14.7% |
| 30 to 34 Minutes | 23 | 16.1% |
| 35 to 39 Minutes | 4 | 2.8% |
| 40 to 44 Minutes | 4 | 2.8% |
| 45 to 59 Minutes | 23 | 16.1% |
| 60 to 89 Minutes | 2 | 1.4% |
| 90 or more Minutes | 4 | 2.8% |
Commute Time by Sex in Middle River
The most common commute times in Middle River are 45 to 59 minutes (23 commuters, 25.6%) for males and 25 to 29 minutes (17 commuters, 32.1%) for females.
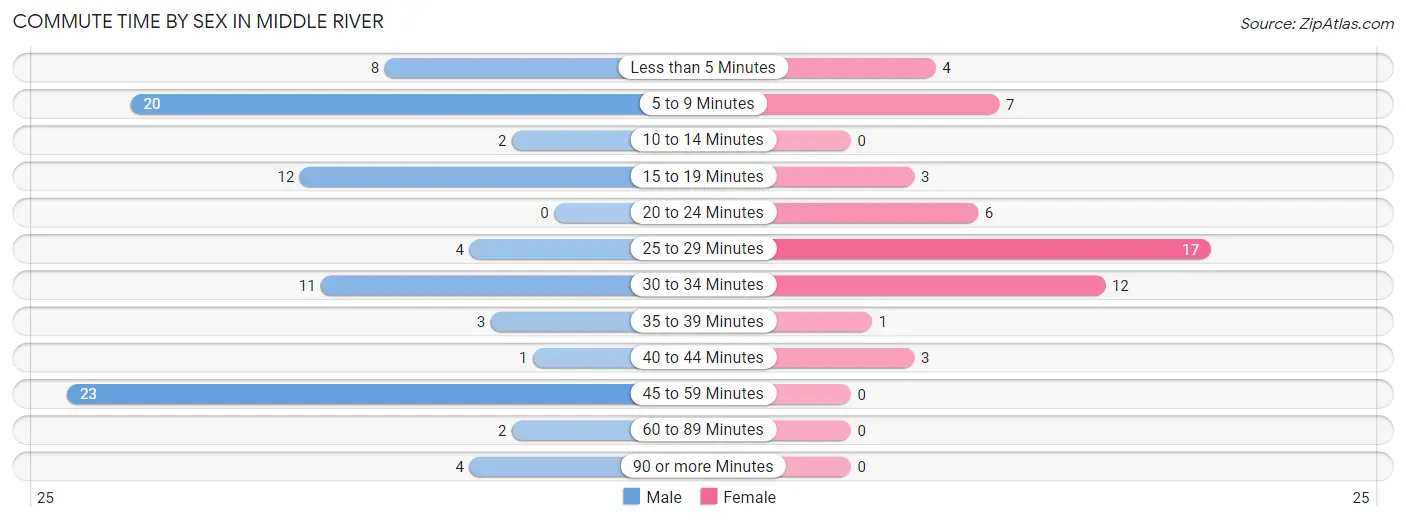
| Commute Time | Male | Female |
| Less than 5 Minutes | 8 (8.9%) | 4 (7.5%) |
| 5 to 9 Minutes | 20 (22.2%) | 7 (13.2%) |
| 10 to 14 Minutes | 2 (2.2%) | 0 (0.0%) |
| 15 to 19 Minutes | 12 (13.3%) | 3 (5.7%) |
| 20 to 24 Minutes | 0 (0.0%) | 6 (11.3%) |
| 25 to 29 Minutes | 4 (4.4%) | 17 (32.1%) |
| 30 to 34 Minutes | 11 (12.2%) | 12 (22.6%) |
| 35 to 39 Minutes | 3 (3.3%) | 1 (1.9%) |
| 40 to 44 Minutes | 1 (1.1%) | 3 (5.7%) |
| 45 to 59 Minutes | 23 (25.6%) | 0 (0.0%) |
| 60 to 89 Minutes | 2 (2.2%) | 0 (0.0%) |
| 90 or more Minutes | 4 (4.4%) | 0 (0.0%) |
Time of Departure to Work by Sex in Middle River
The most frequent times of departure to work in Middle River are 5:00 AM to 5:29 AM (19, 21.1%) for males and 7:00 AM to 7:29 AM (10, 18.9%) for females.
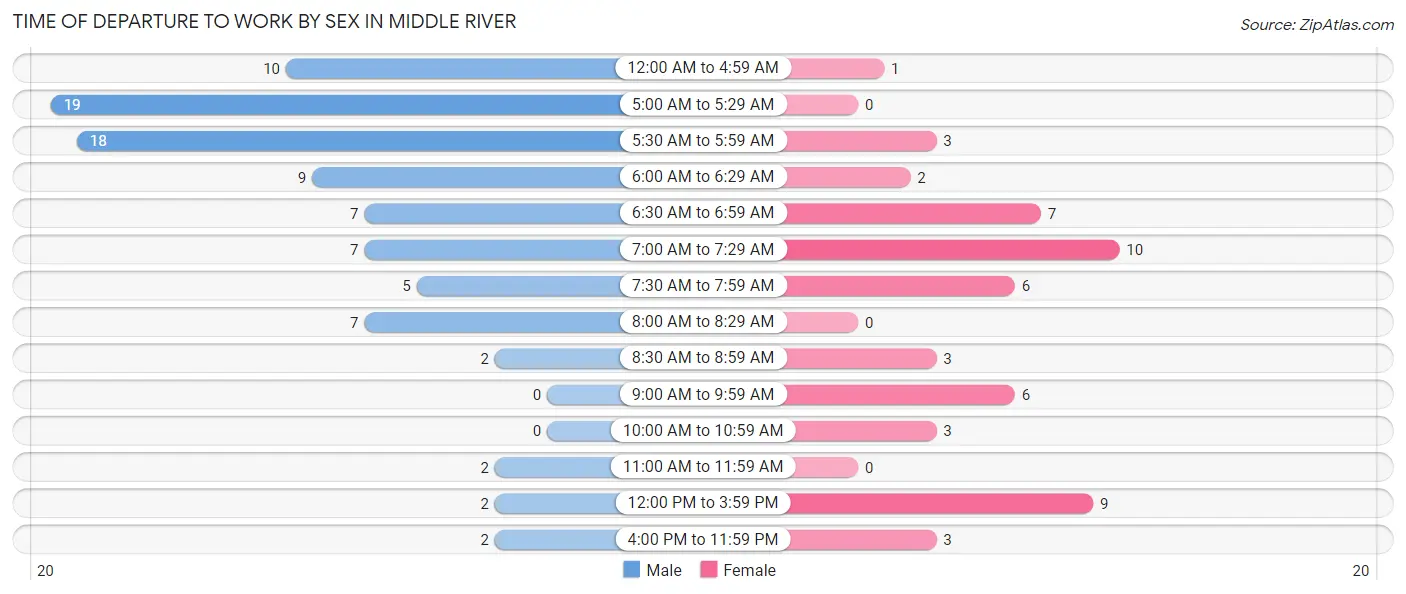
| Time of Departure | Male | Female |
| 12:00 AM to 4:59 AM | 10 (11.1%) | 1 (1.9%) |
| 5:00 AM to 5:29 AM | 19 (21.1%) | 0 (0.0%) |
| 5:30 AM to 5:59 AM | 18 (20.0%) | 3 (5.7%) |
| 6:00 AM to 6:29 AM | 9 (10.0%) | 2 (3.8%) |
| 6:30 AM to 6:59 AM | 7 (7.8%) | 7 (13.2%) |
| 7:00 AM to 7:29 AM | 7 (7.8%) | 10 (18.9%) |
| 7:30 AM to 7:59 AM | 5 (5.6%) | 6 (11.3%) |
| 8:00 AM to 8:29 AM | 7 (7.8%) | 0 (0.0%) |
| 8:30 AM to 8:59 AM | 2 (2.2%) | 3 (5.7%) |
| 9:00 AM to 9:59 AM | 0 (0.0%) | 6 (11.3%) |
| 10:00 AM to 10:59 AM | 0 (0.0%) | 3 (5.7%) |
| 11:00 AM to 11:59 AM | 2 (2.2%) | 0 (0.0%) |
| 12:00 PM to 3:59 PM | 2 (2.2%) | 9 (17.0%) |
| 4:00 PM to 11:59 PM | 2 (2.2%) | 3 (5.7%) |
| Total | 90 (100.0%) | 53 (100.0%) |
Housing Occupancy in Middle River
Occupancy by Ownership in Middle River
Of the total 137 dwellings in Middle River, owner-occupied units account for 104 (75.9%), while renter-occupied units make up 33 (24.1%).
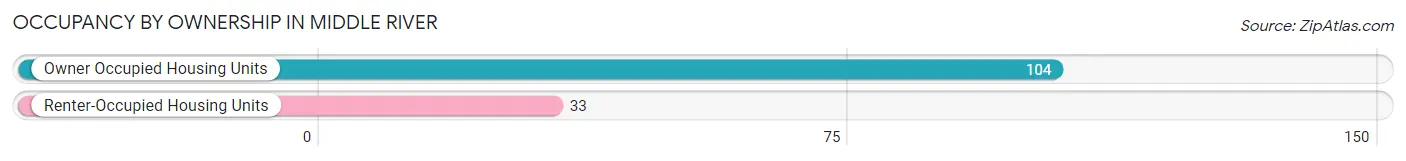
| Occupancy | # Housing Units | % Housing Units |
| Owner Occupied Housing Units | 104 | 75.9% |
| Renter-Occupied Housing Units | 33 | 24.1% |
| Total Occupied Housing Units | 137 | 100.0% |
Occupancy by Household Size in Middle River
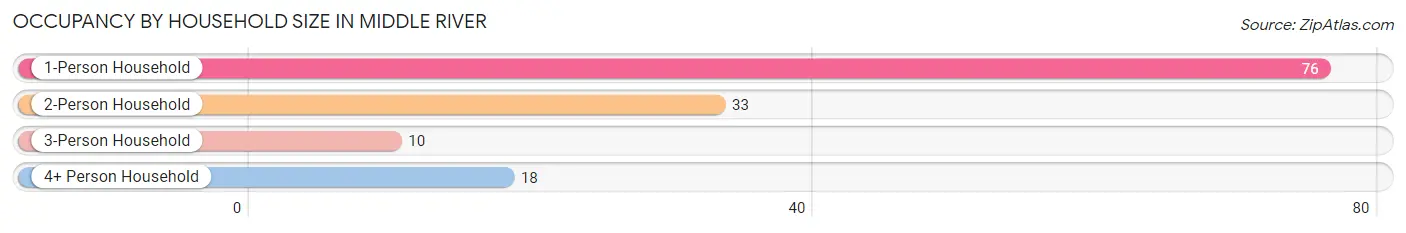
| Household Size | # Housing Units | % Housing Units |
| 1-Person Household | 76 | 55.5% |
| 2-Person Household | 33 | 24.1% |
| 3-Person Household | 10 | 7.3% |
| 4+ Person Household | 18 | 13.1% |
| Total Housing Units | 137 | 100.0% |
Occupancy by Ownership by Household Size in Middle River
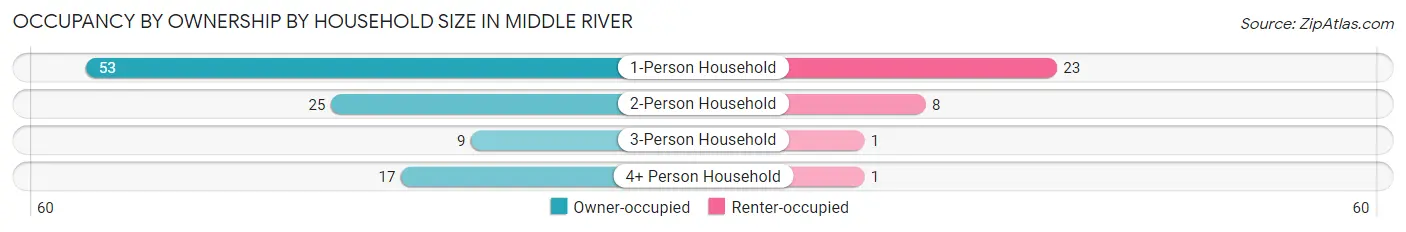
| Household Size | Owner-occupied | Renter-occupied |
| 1-Person Household | 53 (69.7%) | 23 (30.3%) |
| 2-Person Household | 25 (75.8%) | 8 (24.2%) |
| 3-Person Household | 9 (90.0%) | 1 (10.0%) |
| 4+ Person Household | 17 (94.4%) | 1 (5.6%) |
| Total Housing Units | 104 (75.9%) | 33 (24.1%) |
Occupancy by Educational Attainment in Middle River
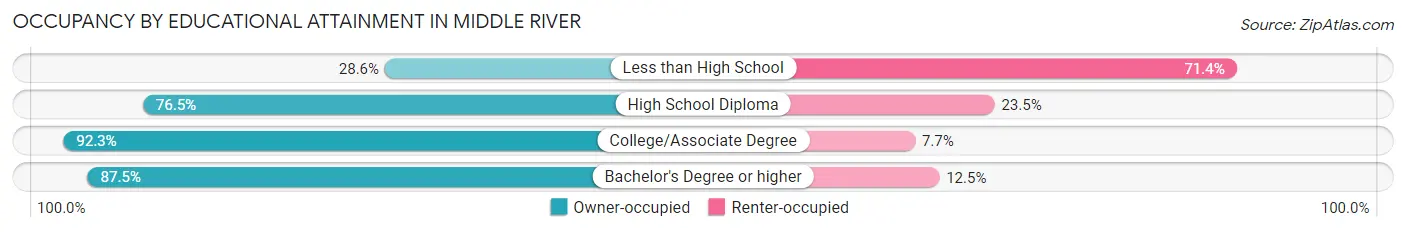
| Household Size | Owner-occupied | Renter-occupied |
| Less than High School | 4 (28.6%) | 10 (71.4%) |
| High School Diploma | 62 (76.5%) | 19 (23.5%) |
| College/Associate Degree | 24 (92.3%) | 2 (7.7%) |
| Bachelor's Degree or higher | 14 (87.5%) | 2 (12.5%) |
Occupancy by Age of Householder in Middle River
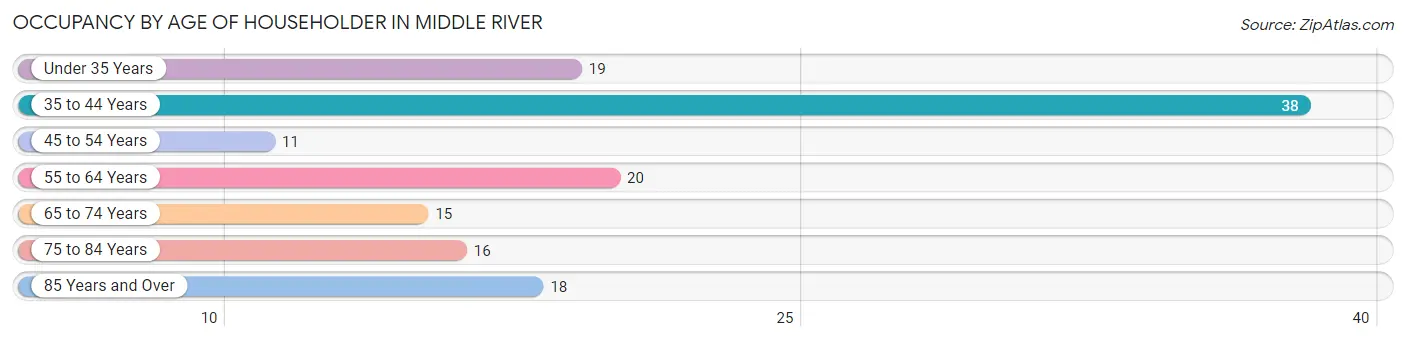
| Age Bracket | # Households | % Households |
| Under 35 Years | 19 | 13.9% |
| 35 to 44 Years | 38 | 27.7% |
| 45 to 54 Years | 11 | 8.0% |
| 55 to 64 Years | 20 | 14.6% |
| 65 to 74 Years | 15 | 11.0% |
| 75 to 84 Years | 16 | 11.7% |
| 85 Years and Over | 18 | 13.1% |
| Total | 137 | 100.0% |
Housing Finances in Middle River
Median Income by Occupancy in Middle River
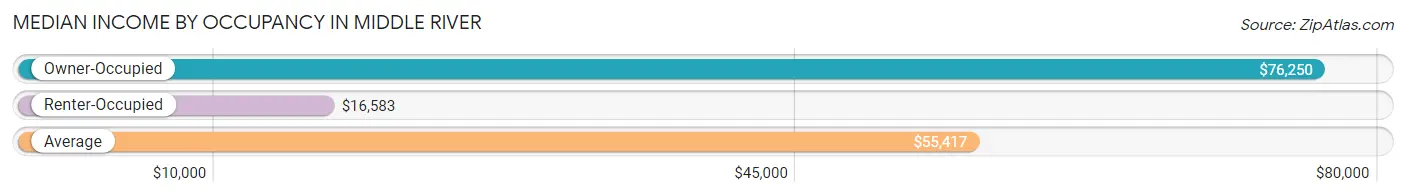
| Occupancy Type | # Households | Median Income |
| Owner-Occupied | 104 (75.9%) | $76,250 |
| Renter-Occupied | 33 (24.1%) | $16,583 |
| Average | 137 (100.0%) | $55,417 |
Occupancy by Householder Income Bracket in Middle River
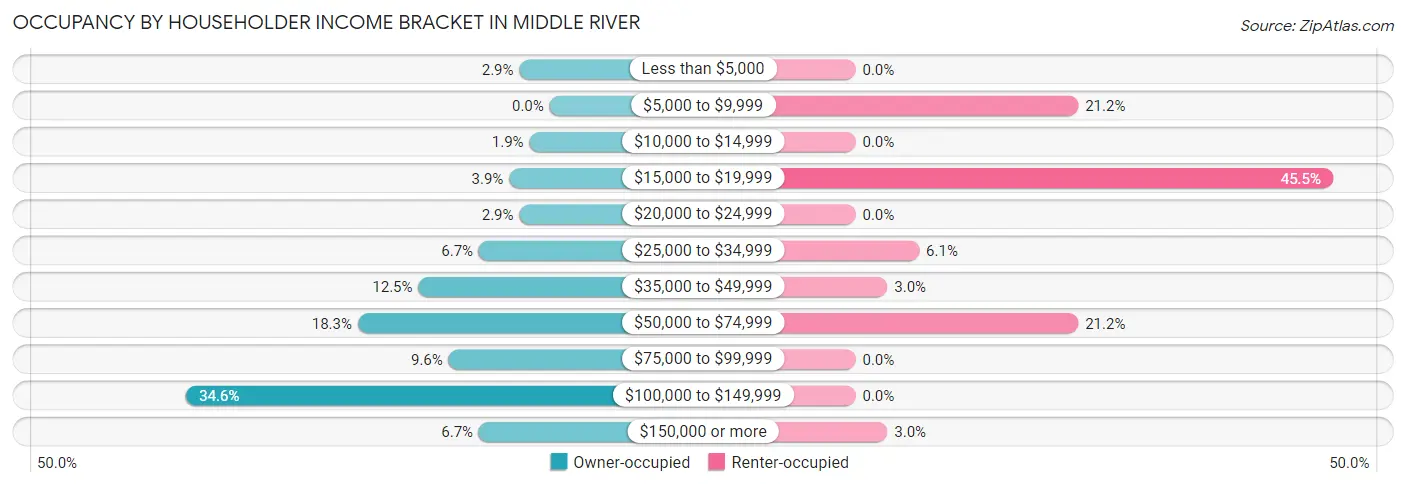
| Income Bracket | Owner-occupied | Renter-occupied |
| Less than $5,000 | 3 (2.9%) | 0 (0.0%) |
| $5,000 to $9,999 | 0 (0.0%) | 7 (21.2%) |
| $10,000 to $14,999 | 2 (1.9%) | 0 (0.0%) |
| $15,000 to $19,999 | 4 (3.8%) | 15 (45.5%) |
| $20,000 to $24,999 | 3 (2.9%) | 0 (0.0%) |
| $25,000 to $34,999 | 7 (6.7%) | 2 (6.1%) |
| $35,000 to $49,999 | 13 (12.5%) | 1 (3.0%) |
| $50,000 to $74,999 | 19 (18.3%) | 7 (21.2%) |
| $75,000 to $99,999 | 10 (9.6%) | 0 (0.0%) |
| $100,000 to $149,999 | 36 (34.6%) | 0 (0.0%) |
| $150,000 or more | 7 (6.7%) | 1 (3.0%) |
| Total | 104 (100.0%) | 33 (100.0%) |
Monthly Housing Cost Tiers in Middle River
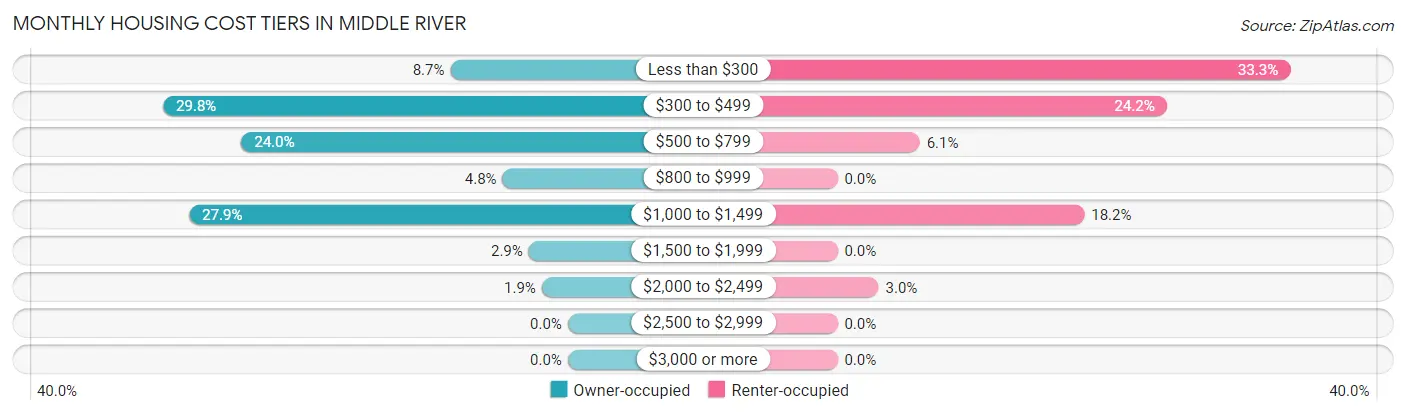
| Monthly Cost | Owner-occupied | Renter-occupied |
| Less than $300 | 9 (8.6%) | 11 (33.3%) |
| $300 to $499 | 31 (29.8%) | 8 (24.2%) |
| $500 to $799 | 25 (24.0%) | 2 (6.1%) |
| $800 to $999 | 5 (4.8%) | 0 (0.0%) |
| $1,000 to $1,499 | 29 (27.9%) | 6 (18.2%) |
| $1,500 to $1,999 | 3 (2.9%) | 0 (0.0%) |
| $2,000 to $2,499 | 2 (1.9%) | 1 (3.0%) |
| $2,500 to $2,999 | 0 (0.0%) | 0 (0.0%) |
| $3,000 or more | 0 (0.0%) | 0 (0.0%) |
| Total | 104 (100.0%) | 33 (100.0%) |
Physical Housing Characteristics in Middle River
Housing Structures in Middle River
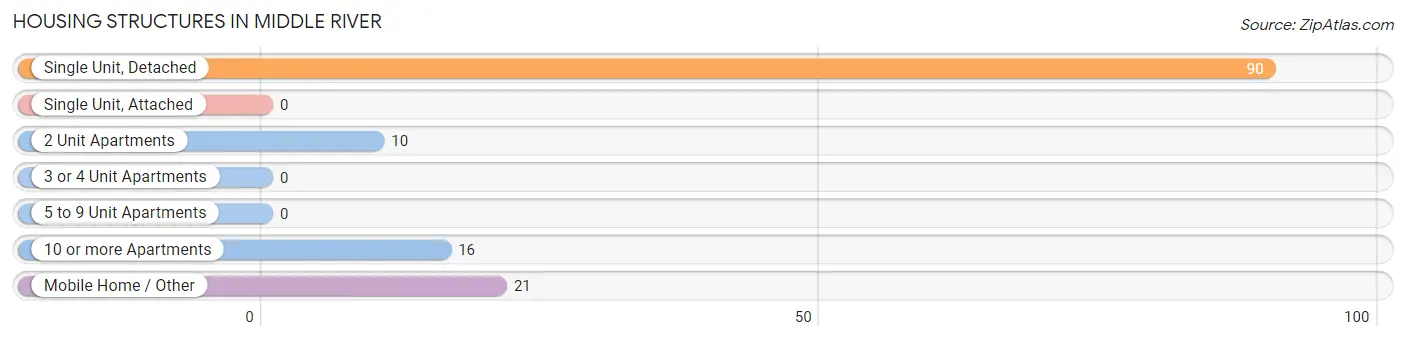
| Structure Type | # Housing Units | % Housing Units |
| Single Unit, Detached | 90 | 65.7% |
| Single Unit, Attached | 0 | 0.0% |
| 2 Unit Apartments | 10 | 7.3% |
| 3 or 4 Unit Apartments | 0 | 0.0% |
| 5 to 9 Unit Apartments | 0 | 0.0% |
| 10 or more Apartments | 16 | 11.7% |
| Mobile Home / Other | 21 | 15.3% |
| Total | 137 | 100.0% |
Housing Structures by Occupancy in Middle River
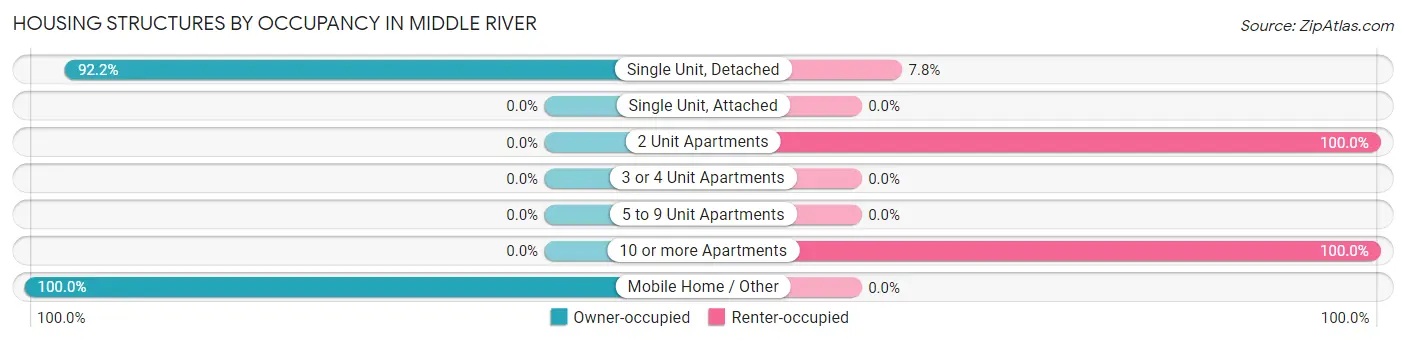
| Structure Type | Owner-occupied | Renter-occupied |
| Single Unit, Detached | 83 (92.2%) | 7 (7.8%) |
| Single Unit, Attached | 0 (0.0%) | 0 (0.0%) |
| 2 Unit Apartments | 0 (0.0%) | 10 (100.0%) |
| 3 or 4 Unit Apartments | 0 (0.0%) | 0 (0.0%) |
| 5 to 9 Unit Apartments | 0 (0.0%) | 0 (0.0%) |
| 10 or more Apartments | 0 (0.0%) | 16 (100.0%) |
| Mobile Home / Other | 21 (100.0%) | 0 (0.0%) |
| Total | 104 (75.9%) | 33 (24.1%) |
Housing Structures by Number of Rooms in Middle River
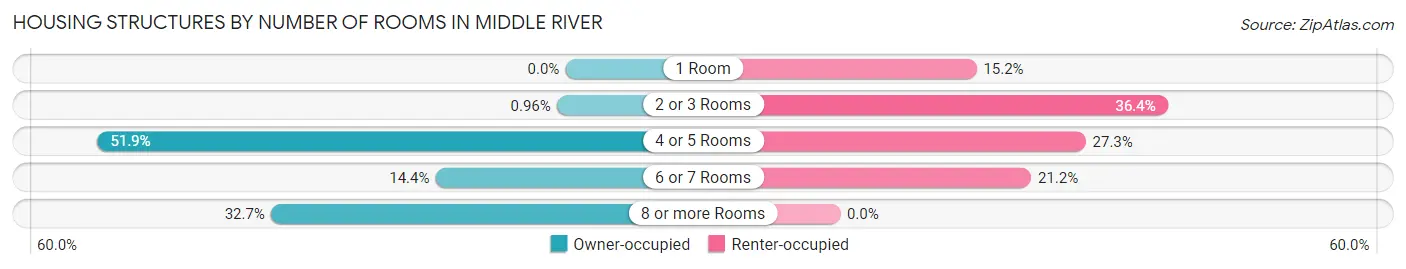
| Number of Rooms | Owner-occupied | Renter-occupied |
| 1 Room | 0 (0.0%) | 5 (15.1%) |
| 2 or 3 Rooms | 1 (1.0%) | 12 (36.4%) |
| 4 or 5 Rooms | 54 (51.9%) | 9 (27.3%) |
| 6 or 7 Rooms | 15 (14.4%) | 7 (21.2%) |
| 8 or more Rooms | 34 (32.7%) | 0 (0.0%) |
| Total | 104 (100.0%) | 33 (100.0%) |
Housing Structure by Heating Type in Middle River
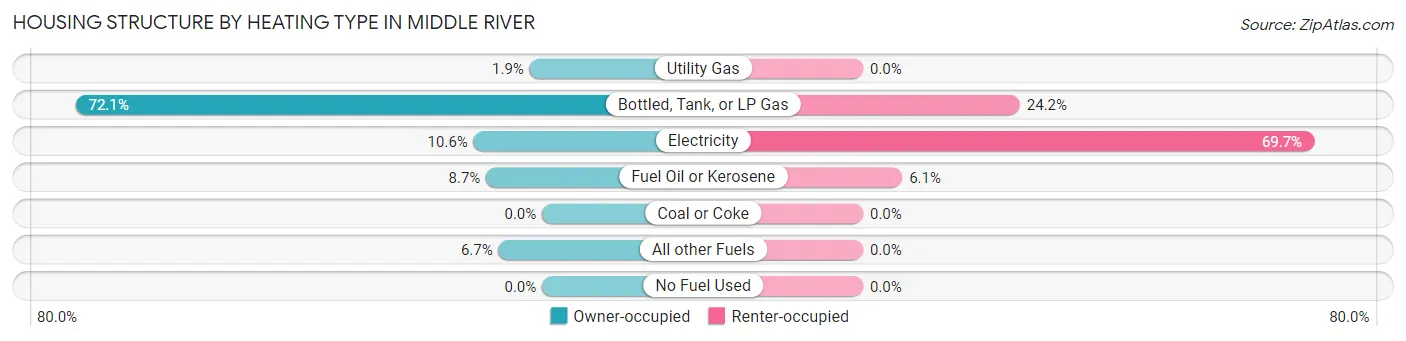
| Heating Type | Owner-occupied | Renter-occupied |
| Utility Gas | 2 (1.9%) | 0 (0.0%) |
| Bottled, Tank, or LP Gas | 75 (72.1%) | 8 (24.2%) |
| Electricity | 11 (10.6%) | 23 (69.7%) |
| Fuel Oil or Kerosene | 9 (8.6%) | 2 (6.1%) |
| Coal or Coke | 0 (0.0%) | 0 (0.0%) |
| All other Fuels | 7 (6.7%) | 0 (0.0%) |
| No Fuel Used | 0 (0.0%) | 0 (0.0%) |
| Total | 104 (100.0%) | 33 (100.0%) |
Household Vehicle Usage in Middle River
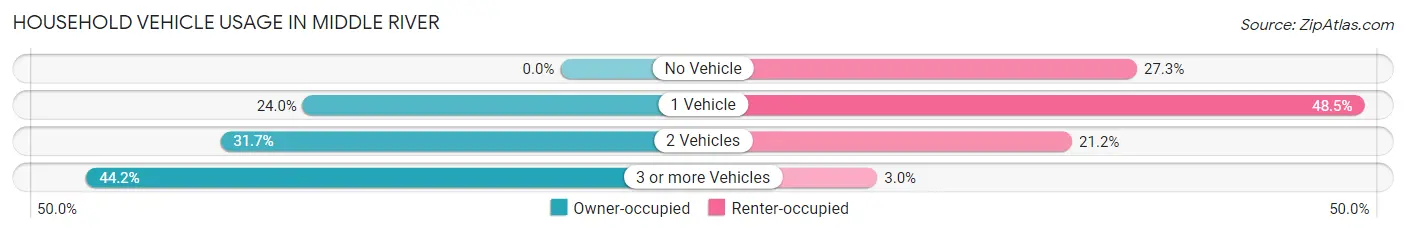
| Vehicles per Household | Owner-occupied | Renter-occupied |
| No Vehicle | 0 (0.0%) | 9 (27.3%) |
| 1 Vehicle | 25 (24.0%) | 16 (48.5%) |
| 2 Vehicles | 33 (31.7%) | 7 (21.2%) |
| 3 or more Vehicles | 46 (44.2%) | 1 (3.0%) |
| Total | 104 (100.0%) | 33 (100.0%) |
Real Estate & Mortgages in Middle River
Real Estate and Mortgage Overview in Middle River
| Characteristic | Without Mortgage | With Mortgage |
| Housing Units | 62 | 42 |
| Median Property Value | $57,600 | $118,200 |
| Median Household Income | $73,750 | $5 |
| Monthly Housing Costs | $395 | $0 |
| Real Estate Taxes | $868 | $2 |
Property Value by Mortgage Status in Middle River
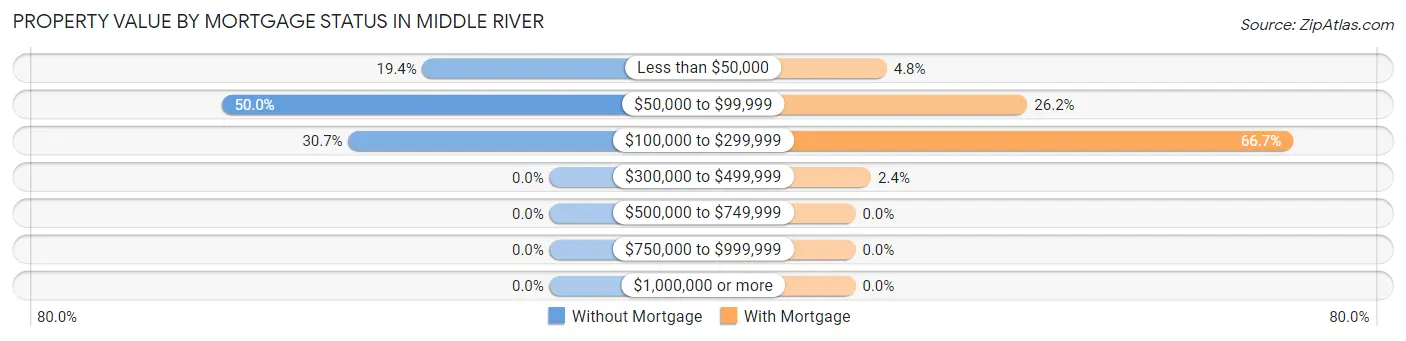
| Property Value | Without Mortgage | With Mortgage |
| Less than $50,000 | 12 (19.4%) | 2 (4.8%) |
| $50,000 to $99,999 | 31 (50.0%) | 11 (26.2%) |
| $100,000 to $299,999 | 19 (30.6%) | 28 (66.7%) |
| $300,000 to $499,999 | 0 (0.0%) | 1 (2.4%) |
| $500,000 to $749,999 | 0 (0.0%) | 0 (0.0%) |
| $750,000 to $999,999 | 0 (0.0%) | 0 (0.0%) |
| $1,000,000 or more | 0 (0.0%) | 0 (0.0%) |
| Total | 62 (100.0%) | 42 (100.0%) |
Household Income by Mortgage Status in Middle River
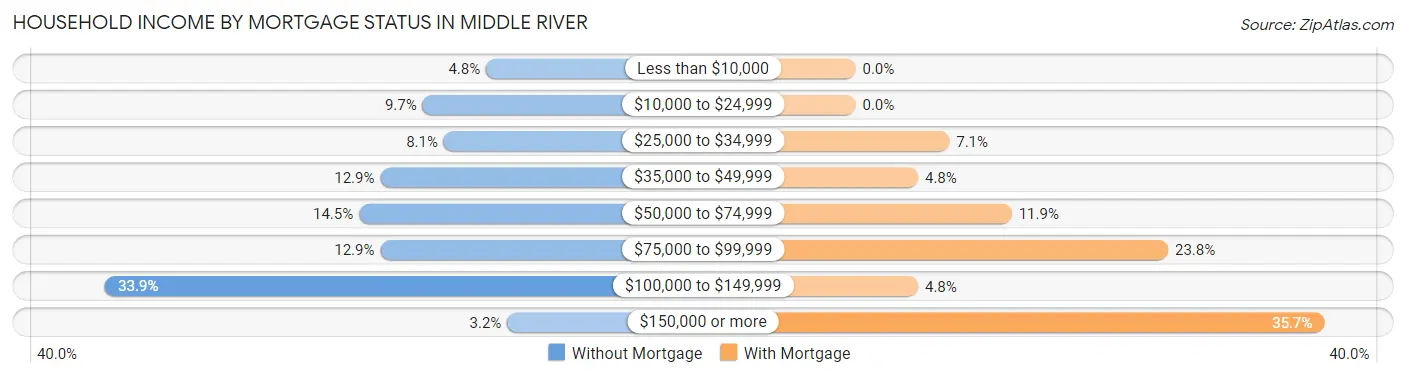
| Household Income | Without Mortgage | With Mortgage |
| Less than $10,000 | 3 (4.8%) | 0 (0.0%) |
| $10,000 to $24,999 | 6 (9.7%) | 0 (0.0%) |
| $25,000 to $34,999 | 5 (8.1%) | 3 (7.1%) |
| $35,000 to $49,999 | 8 (12.9%) | 2 (4.8%) |
| $50,000 to $74,999 | 9 (14.5%) | 5 (11.9%) |
| $75,000 to $99,999 | 8 (12.9%) | 10 (23.8%) |
| $100,000 to $149,999 | 21 (33.9%) | 2 (4.8%) |
| $150,000 or more | 2 (3.2%) | 15 (35.7%) |
| Total | 62 (100.0%) | 42 (100.0%) |
Property Value to Household Income Ratio in Middle River
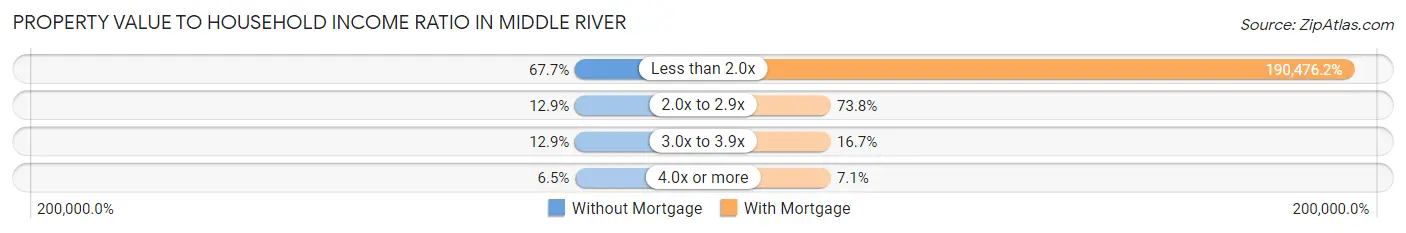
| Value-to-Income Ratio | Without Mortgage | With Mortgage |
| Less than 2.0x | 42 (67.7%) | 80,000 (190,476.2%) |
| 2.0x to 2.9x | 8 (12.9%) | 31 (73.8%) |
| 3.0x to 3.9x | 8 (12.9%) | 7 (16.7%) |
| 4.0x or more | 4 (6.5%) | 3 (7.1%) |
| Total | 62 (100.0%) | 42 (100.0%) |
Real Estate Taxes by Mortgage Status in Middle River
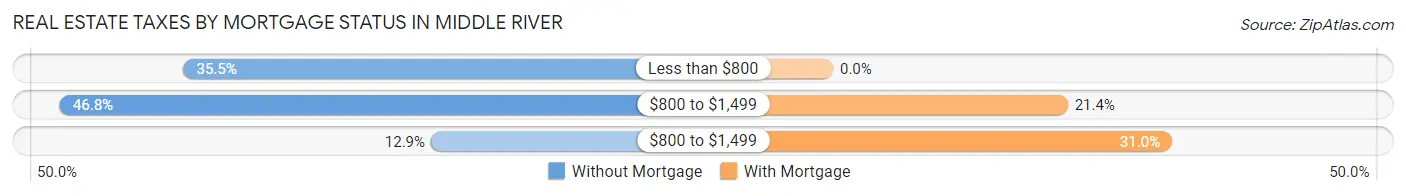
| Property Taxes | Without Mortgage | With Mortgage |
| Less than $800 | 22 (35.5%) | 0 (0.0%) |
| $800 to $1,499 | 29 (46.8%) | 9 (21.4%) |
| $800 to $1,499 | 8 (12.9%) | 13 (30.9%) |
| Total | 62 (100.0%) | 42 (100.0%) |
Health & Disability in Middle River
Health Insurance Coverage by Age in Middle River
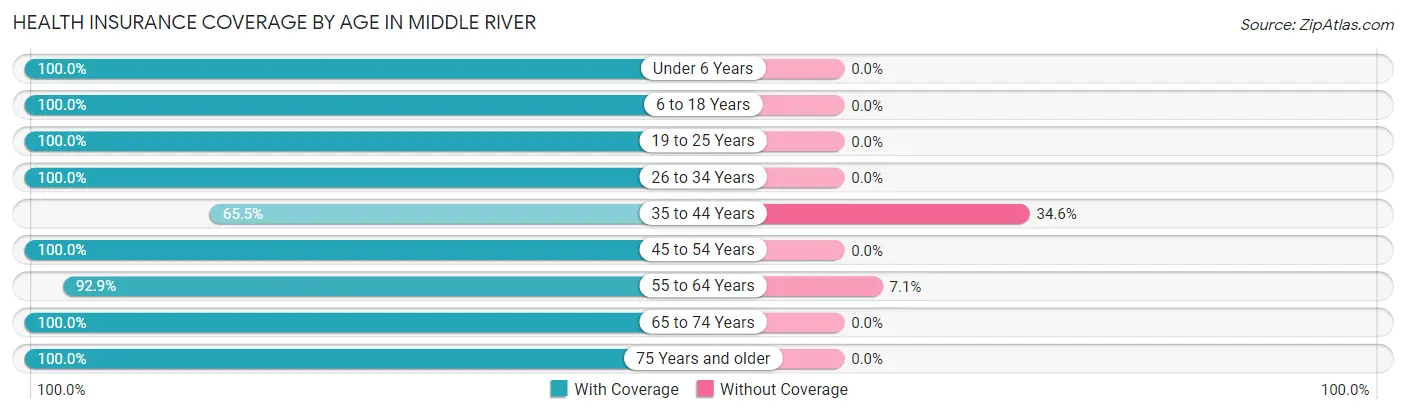
| Age Bracket | With Coverage | Without Coverage |
| Under 6 Years | 19 (100.0%) | 0 (0.0%) |
| 6 to 18 Years | 45 (100.0%) | 0 (0.0%) |
| 19 to 25 Years | 19 (100.0%) | 0 (0.0%) |
| 26 to 34 Years | 20 (100.0%) | 0 (0.0%) |
| 35 to 44 Years | 36 (65.4%) | 19 (34.5%) |
| 45 to 54 Years | 21 (100.0%) | 0 (0.0%) |
| 55 to 64 Years | 26 (92.9%) | 2 (7.1%) |
| 65 to 74 Years | 24 (100.0%) | 0 (0.0%) |
| 75 Years and older | 40 (100.0%) | 0 (0.0%) |
| Total | 250 (92.2%) | 21 (7.7%) |
Health Insurance Coverage by Citizenship Status in Middle River
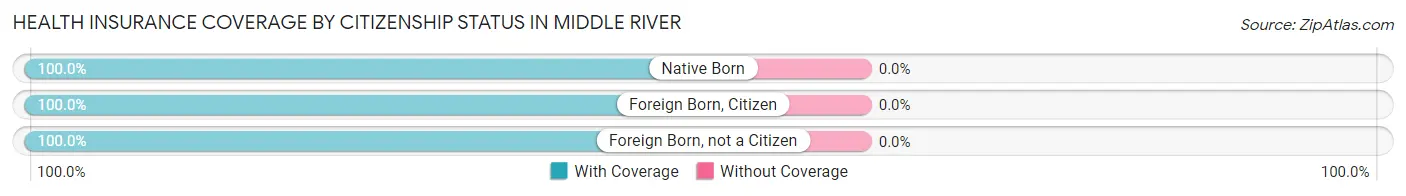
| Citizenship Status | With Coverage | Without Coverage |
| Native Born | 19 (100.0%) | 0 (0.0%) |
| Foreign Born, Citizen | 45 (100.0%) | 0 (0.0%) |
| Foreign Born, not a Citizen | 19 (100.0%) | 0 (0.0%) |
Health Insurance Coverage by Household Income in Middle River
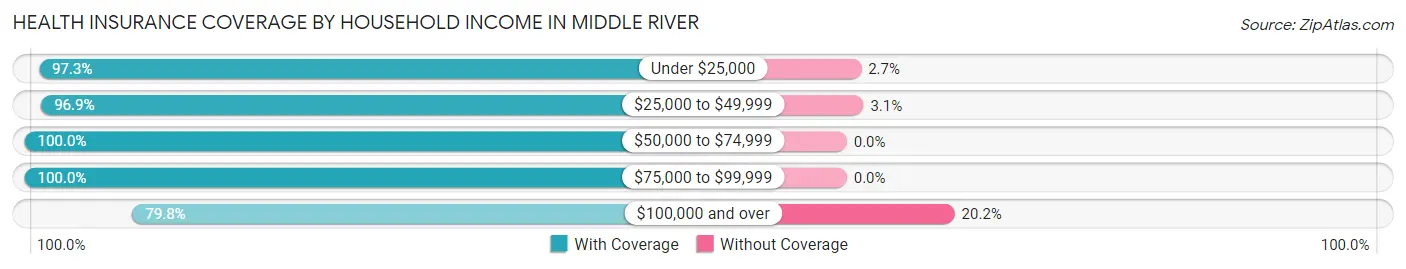
| Household Income | With Coverage | Without Coverage |
| Under $25,000 | 36 (97.3%) | 1 (2.7%) |
| $25,000 to $49,999 | 31 (96.9%) | 1 (3.1%) |
| $50,000 to $74,999 | 87 (100.0%) | 0 (0.0%) |
| $75,000 to $99,999 | 21 (100.0%) | 0 (0.0%) |
| $100,000 and over | 75 (79.8%) | 19 (20.2%) |
Public vs Private Health Insurance Coverage by Age in Middle River
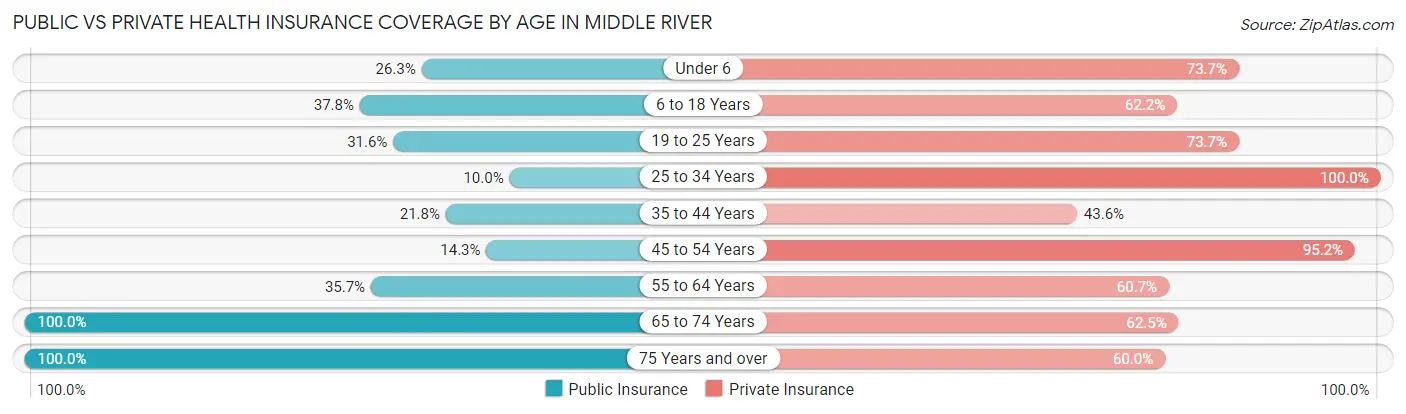
| Age Bracket | Public Insurance | Private Insurance |
| Under 6 | 5 (26.3%) | 14 (73.7%) |
| 6 to 18 Years | 17 (37.8%) | 28 (62.2%) |
| 19 to 25 Years | 6 (31.6%) | 14 (73.7%) |
| 25 to 34 Years | 2 (10.0%) | 20 (100.0%) |
| 35 to 44 Years | 12 (21.8%) | 24 (43.6%) |
| 45 to 54 Years | 3 (14.3%) | 20 (95.2%) |
| 55 to 64 Years | 10 (35.7%) | 17 (60.7%) |
| 65 to 74 Years | 24 (100.0%) | 15 (62.5%) |
| 75 Years and over | 40 (100.0%) | 24 (60.0%) |
| Total | 119 (43.9%) | 176 (64.9%) |
Disability Status by Sex by Age in Middle River
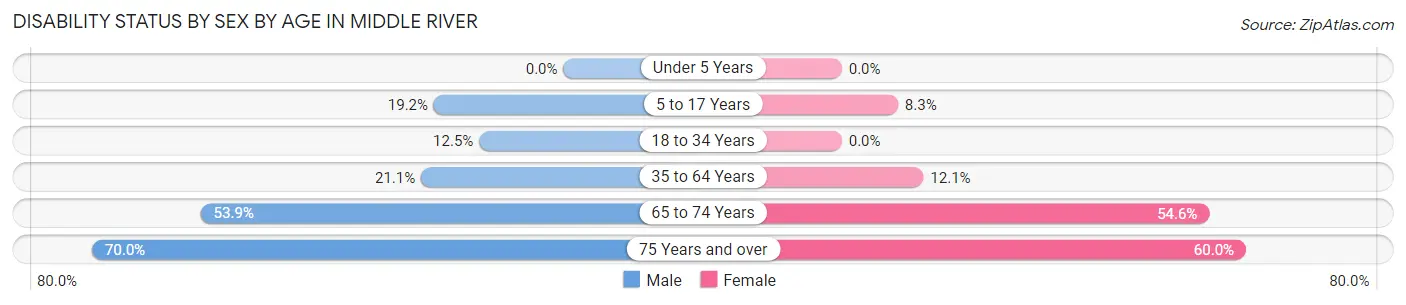
| Age Bracket | Male | Female |
| Under 5 Years | 0 (0.0%) | 0 (0.0%) |
| 5 to 17 Years | 5 (19.2%) | 2 (8.3%) |
| 18 to 34 Years | 3 (12.5%) | 0 (0.0%) |
| 35 to 64 Years | 15 (21.1%) | 4 (12.1%) |
| 65 to 74 Years | 7 (53.8%) | 6 (54.5%) |
| 75 Years and over | 7 (70.0%) | 18 (60.0%) |
Disability Class by Sex by Age in Middle River
Disability Class: Hearing Difficulty
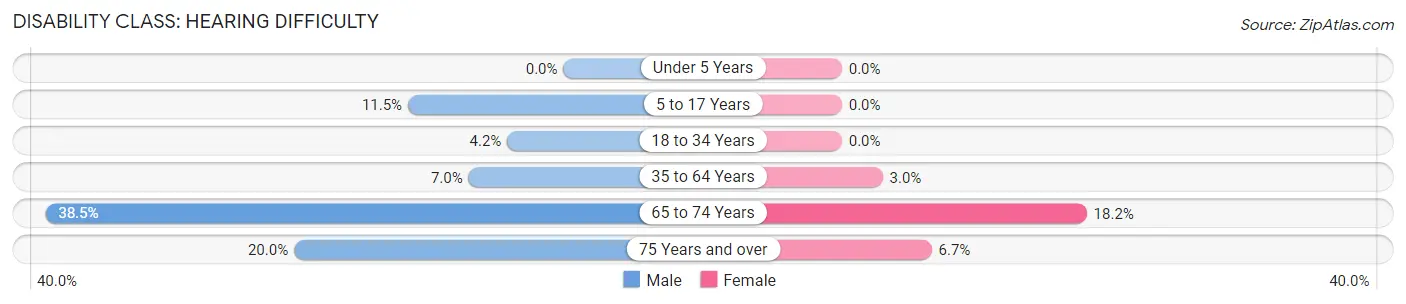
| Age Bracket | Male | Female |
| Under 5 Years | 0 (0.0%) | 0 (0.0%) |
| 5 to 17 Years | 3 (11.5%) | 0 (0.0%) |
| 18 to 34 Years | 1 (4.2%) | 0 (0.0%) |
| 35 to 64 Years | 5 (7.0%) | 1 (3.0%) |
| 65 to 74 Years | 5 (38.5%) | 2 (18.2%) |
| 75 Years and over | 2 (20.0%) | 2 (6.7%) |
Disability Class: Vision Difficulty
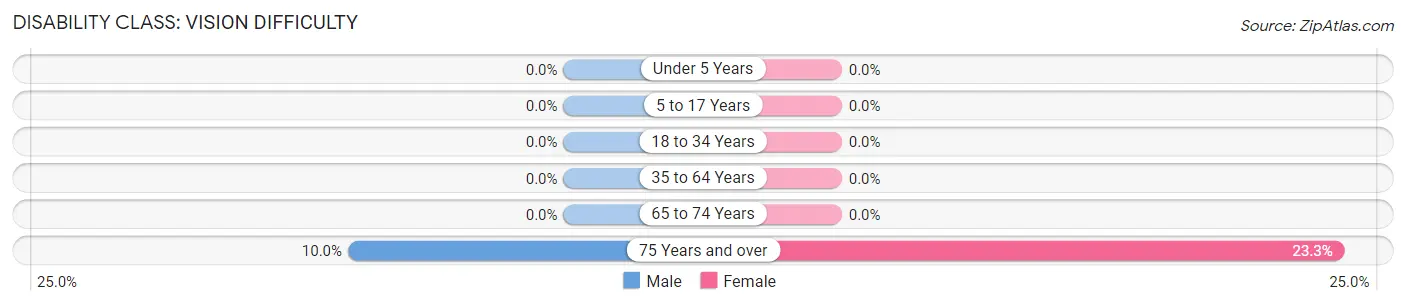
| Age Bracket | Male | Female |
| Under 5 Years | 0 (0.0%) | 0 (0.0%) |
| 5 to 17 Years | 0 (0.0%) | 0 (0.0%) |
| 18 to 34 Years | 0 (0.0%) | 0 (0.0%) |
| 35 to 64 Years | 0 (0.0%) | 0 (0.0%) |
| 65 to 74 Years | 0 (0.0%) | 0 (0.0%) |
| 75 Years and over | 1 (10.0%) | 7 (23.3%) |
Disability Class: Cognitive Difficulty
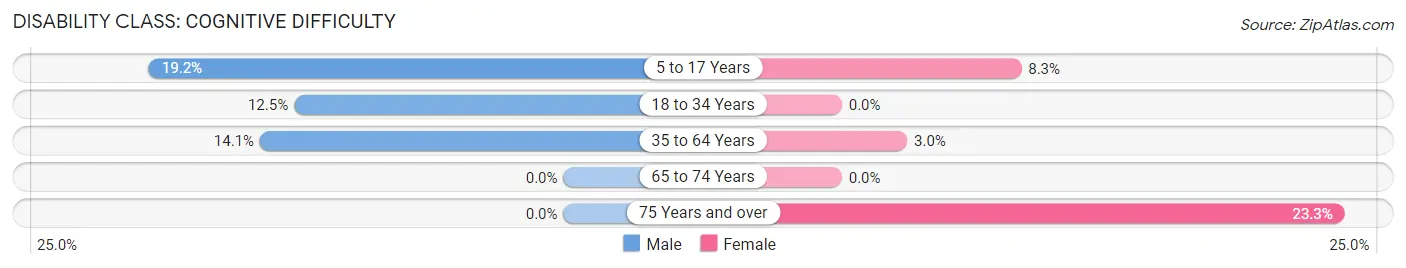
| Age Bracket | Male | Female |
| 5 to 17 Years | 5 (19.2%) | 2 (8.3%) |
| 18 to 34 Years | 3 (12.5%) | 0 (0.0%) |
| 35 to 64 Years | 10 (14.1%) | 1 (3.0%) |
| 65 to 74 Years | 0 (0.0%) | 0 (0.0%) |
| 75 Years and over | 0 (0.0%) | 7 (23.3%) |
Disability Class: Ambulatory Difficulty
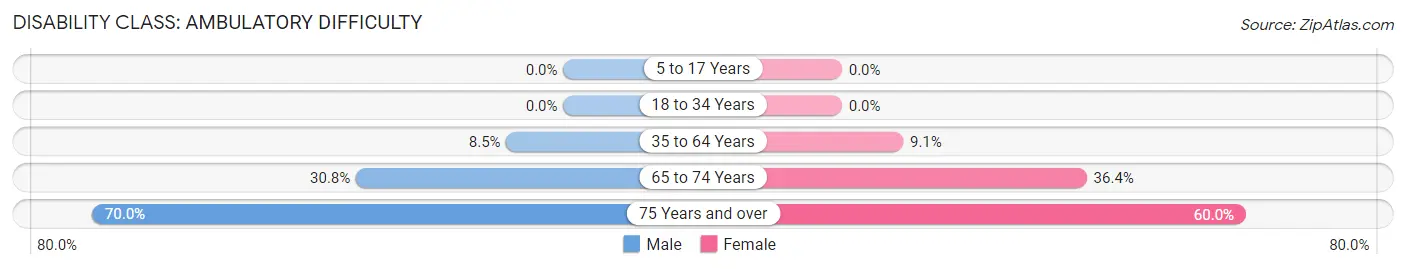
| Age Bracket | Male | Female |
| 5 to 17 Years | 0 (0.0%) | 0 (0.0%) |
| 18 to 34 Years | 0 (0.0%) | 0 (0.0%) |
| 35 to 64 Years | 6 (8.5%) | 3 (9.1%) |
| 65 to 74 Years | 4 (30.8%) | 4 (36.4%) |
| 75 Years and over | 7 (70.0%) | 18 (60.0%) |
Disability Class: Self-Care Difficulty
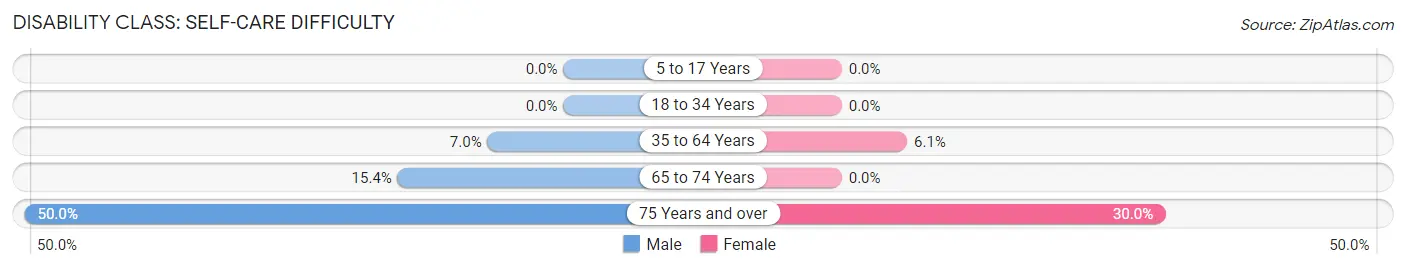
| Age Bracket | Male | Female |
| 5 to 17 Years | 0 (0.0%) | 0 (0.0%) |
| 18 to 34 Years | 0 (0.0%) | 0 (0.0%) |
| 35 to 64 Years | 5 (7.0%) | 2 (6.1%) |
| 65 to 74 Years | 2 (15.4%) | 0 (0.0%) |
| 75 Years and over | 5 (50.0%) | 9 (30.0%) |
Technology Access in Middle River
Computing Device Access in Middle River
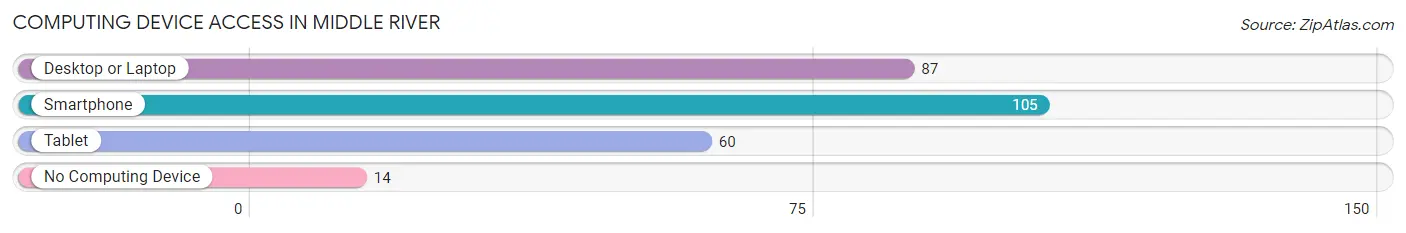
| Device Type | # Households | % Households |
| Desktop or Laptop | 87 | 63.5% |
| Smartphone | 105 | 76.6% |
| Tablet | 60 | 43.8% |
| No Computing Device | 14 | 10.2% |
| Total | 137 | 100.0% |
Internet Access in Middle River
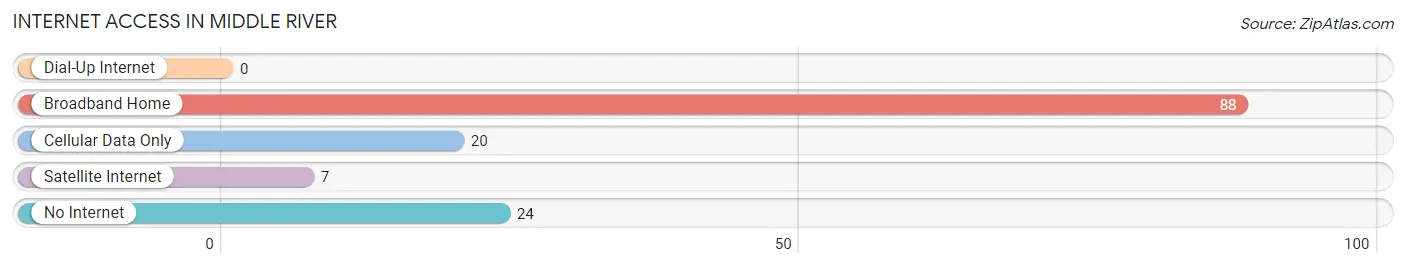
| Internet Type | # Households | % Households |
| Dial-Up Internet | 0 | 0.0% |
| Broadband Home | 88 | 64.2% |
| Cellular Data Only | 20 | 14.6% |
| Satellite Internet | 7 | 5.1% |
| No Internet | 24 | 17.5% |
| Total | 137 | 100.0% |
Middle River Summary
History
Middle River is a small city located in Marshall County, Minnesota. It is situated on the banks of the Middle River, which is a tributary of the Red River of the North. The city was founded in 1881 by a group of Norwegian settlers who were looking for a place to settle and farm. The city was named after the river, which was named by the Ojibwe Indians who lived in the area.
The first settlers in Middle River were mostly farmers, but the city soon became a center for logging and lumbering. The first sawmill was built in 1883, and the city quickly became a hub for the lumber industry. The city also became a center for the railroad industry, with the first railroad line being built in 1887.
The city continued to grow and prosper throughout the late 19th and early 20th centuries. In the 1920s, the city was home to a number of businesses, including a bank, a hotel, a movie theater, and a variety of stores. The city also had a number of churches, including the Norwegian Lutheran Church, which was founded in 1883.
In the 1950s, the city began to decline as the lumber industry moved away and the railroad industry declined. The city was also affected by the Great Depression, which caused many businesses to close. However, the city was able to survive and eventually began to grow again in the 1970s.
Today, Middle River is a small city with a population of just over 1,000 people. The city is still home to a number of businesses, including a bank, a hotel, a movie theater, and a variety of stores. The city also has a number of churches, including the Norwegian Lutheran Church, which is still active today.
Geography
Middle River is located in Marshall County, Minnesota, on the banks of the Middle River. The city is situated in the Red River Valley, which is a flat, fertile region of the state. The city is surrounded by rolling hills and forests, and is located about 30 miles north of Grand Forks, North Dakota.
The city has a total area of 1.2 square miles, all of which is land. The city is located at an elevation of 1,072 feet above sea level. The climate in Middle River is classified as humid continental, with cold winters and warm summers.
Economy
The economy of Middle River is largely based on agriculture and tourism. The city is home to a number of farms, which produce a variety of crops, including wheat, corn, soybeans, and hay. The city is also home to a number of tourist attractions, including the Middle River Museum, which is dedicated to the history of the city and the surrounding area.
The city is also home to a number of businesses, including a bank, a hotel, a movie theater, and a variety of stores. The city also has a number of churches, including the Norwegian Lutheran Church, which is still active today.
Demographics
As of the 2010 census, the population of Middle River was 1,072. The racial makeup of the city was 97.2% White, 0.7% African American, 0.3% Native American, 0.2% Asian, 0.1% Pacific Islander, 0.7% from other races, and 0.9% from two or more races. Hispanic or Latino of any race were 1.3% of the population.
The median income for a household in Middle River was $37,500, and the median income for a family was $45,000. The per capita income for the city was $18,945. About 10.2% of families and 13.2% of the population were below the poverty line, including 16.7% of those under age 18 and 8.3% of those age 65 or over.
Common Questions
What is Per Capita Income in Middle River?
Per Capita income in Middle River is $35,772.
What is the Median Family Income in Middle River?
Median Family Income in Middle River is $64,375.
What is the Median Household income in Middle River?
Median Household Income in Middle River is $55,417.
What is Income or Wage Gap in Middle River?
Income or Wage Gap in Middle River is 74.0%.
Women in Middle River earn 26.0 cents for every dollar earned by a man.
What is Inequality or Gini Index in Middle River?
Inequality or Gini Index in Middle River is 0.40.
What is the Total Population of Middle River?
Total Population of Middle River is 272.
What is the Total Male Population of Middle River?
Total Male Population of Middle River is 150.
What is the Total Female Population of Middle River?
Total Female Population of Middle River is 122.
What is the Ratio of Males per 100 Females in Middle River?
There are 122.95 Males per 100 Females in Middle River.
What is the Ratio of Females per 100 Males in Middle River?
There are 81.33 Females per 100 Males in Middle River.
What is the Median Population Age in Middle River?
Median Population Age in Middle River is 41.5 Years.
What is the Average Family Size in Middle River
Average Family Size in Middle River is 3.0 People.
What is the Average Household Size in Middle River
Average Household Size in Middle River is 2.0 People.
How Large is the Labor Force in Middle River?
There are 151 People in the Labor Forcein in Middle River.
What is the Percentage of People in the Labor Force in Middle River?
69.3% of People are in the Labor Force in Middle River.
What is the Unemployment Rate in Middle River?
Unemployment Rate in Middle River is 1.3%.