Merrifield, MN Map & Demographics
Merrifield Map
Merrifield Overview
$29,070
PER CAPITA INCOME
$61,509
AVG FAMILY INCOME
$61,168
AVG HOUSEHOLD INCOME
0.12
INEQUALITY / GINI INDEX
122
TOTAL POPULATION
57
MALE POPULATION
65
FEMALE POPULATION
87.69
MALES / 100 FEMALES
114.04
FEMALES / 100 MALES
55.4
MEDIAN AGE
2.7
AVG FAMILY SIZE
2.0
AVG HOUSEHOLD SIZE
102
LABOR FORCE [ PEOPLE ]
83.6%
PERCENT IN LABOR FORCE
Merrifield Zip Codes
Merrifield Area Codes
Income in Merrifield
Income Overview in Merrifield
Per Capita Income in Merrifield is $29,070, while median incomes of families and households are $61,509 and $61,168 respectively.
| Characteristic | Number | Measure |
| Per Capita Income | 122 | $29,070 |
| Median Family Income | 35 | $61,509 |
| Mean Family Income | 35 | $64,774 |
| Median Household Income | 61 | $61,168 |
| Mean Household Income | 61 | $57,243 |
| Income Deficit | 35 | $0 |
| Wage / Income Gap (%) | 122 | 0.00% |
| Wage / Income Gap ($) | 122 | 100.00¢ per $1 |
| Gini / Inequality Index | 122 | 0.12 |
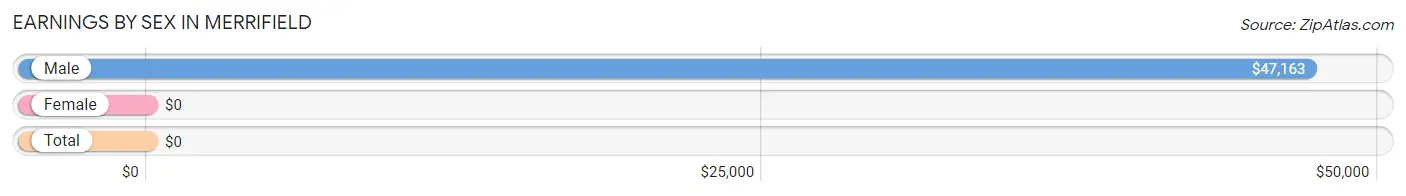
Earnings by Sex in Merrifield
| Sex | Number | Average Earnings |
| Male | 53 (52.0%) | $47,163 |
| Female | 49 (48.0%) | $0 |
| Total | 102 (100.0%) | $0 |
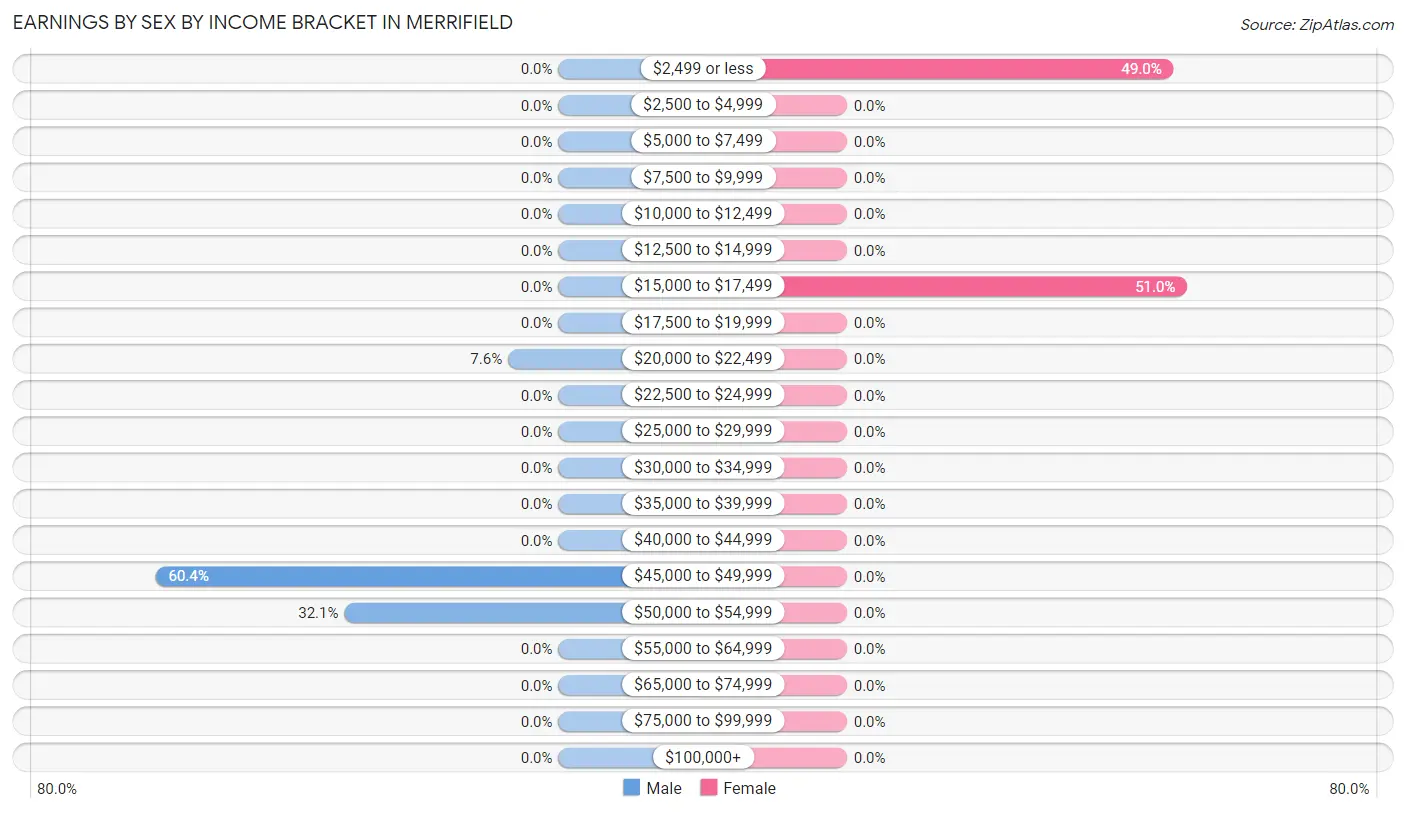
Earnings by Sex by Income Bracket in Merrifield
The most common earnings brackets in Merrifield are $45,000 to $49,999 for men (32 | 60.4%) and $15,000 to $17,499 for women (25 | 51.0%).
| Income | Male | Female |
| $2,499 or less | 0 (0.0%) | 24 (49.0%) |
| $2,500 to $4,999 | 0 (0.0%) | 0 (0.0%) |
| $5,000 to $7,499 | 0 (0.0%) | 0 (0.0%) |
| $7,500 to $9,999 | 0 (0.0%) | 0 (0.0%) |
| $10,000 to $12,499 | 0 (0.0%) | 0 (0.0%) |
| $12,500 to $14,999 | 0 (0.0%) | 0 (0.0%) |
| $15,000 to $17,499 | 0 (0.0%) | 25 (51.0%) |
| $17,500 to $19,999 | 0 (0.0%) | 0 (0.0%) |
| $20,000 to $22,499 | 4 (7.5%) | 0 (0.0%) |
| $22,500 to $24,999 | 0 (0.0%) | 0 (0.0%) |
| $25,000 to $29,999 | 0 (0.0%) | 0 (0.0%) |
| $30,000 to $34,999 | 0 (0.0%) | 0 (0.0%) |
| $35,000 to $39,999 | 0 (0.0%) | 0 (0.0%) |
| $40,000 to $44,999 | 0 (0.0%) | 0 (0.0%) |
| $45,000 to $49,999 | 32 (60.4%) | 0 (0.0%) |
| $50,000 to $54,999 | 17 (32.1%) | 0 (0.0%) |
| $55,000 to $64,999 | 0 (0.0%) | 0 (0.0%) |
| $65,000 to $74,999 | 0 (0.0%) | 0 (0.0%) |
| $75,000 to $99,999 | 0 (0.0%) | 0 (0.0%) |
| $100,000+ | 0 (0.0%) | 0 (0.0%) |
| Total | 53 (100.0%) | 49 (100.0%) |
Earnings by Sex by Educational Attainment in Merrifield
| Educational Attainment | Male Income | Female Income |
| Less than High School | - | - |
| High School Diploma | - | - |
| College or Associate's Degree | - | - |
| Bachelor's Degree | - | - |
| Graduate Degree | - | - |
| Total | $47,163 | $0 |
Family Income in Merrifield
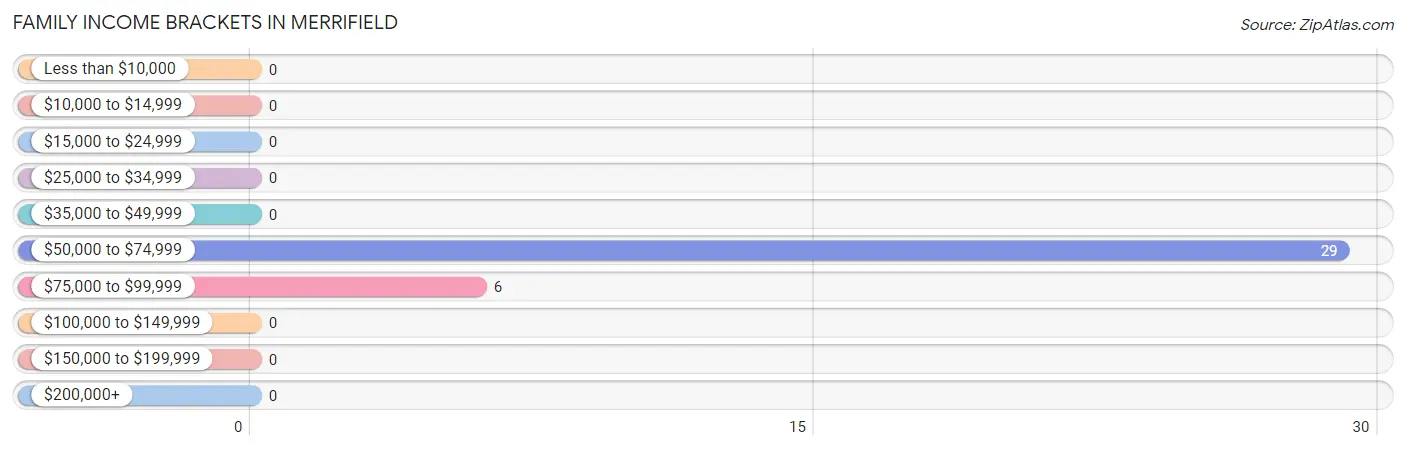
Family Income Brackets in Merrifield
According to the Merrifield family income data, there are 29 families falling into the $50,000 to $74,999 income range, which is the most common income bracket and makes up 82.9% of all families.
| Income Bracket | # Families | % Families |
| Less than $10,000 | 0 | 0.0% |
| $10,000 to $14,999 | 0 | 0.0% |
| $15,000 to $24,999 | 0 | 0.0% |
| $25,000 to $34,999 | 0 | 0.0% |
| $35,000 to $49,999 | 0 | 0.0% |
| $50,000 to $74,999 | 29 | 82.9% |
| $75,000 to $99,999 | 6 | 17.1% |
| $100,000 to $149,999 | 0 | 0.0% |
| $150,000 to $199,999 | 0 | 0.0% |
| $200,000+ | 0 | 0.0% |
Family Income by Famaliy Size in Merrifield
| Income Bracket | # Families | Median Income |
| 2-Person Families | 10 (28.6%) | $0 |
| 3-Person Families | 25 (71.4%) | $0 |
| 4-Person Families | 0 (0.0%) | $0 |
| 5-Person Families | 0 (0.0%) | $0 |
| 6-Person Families | 0 (0.0%) | $0 |
| 7+ Person Families | 0 (0.0%) | $0 |
| Total | 35 (100.0%) | $61,509 |
Family Income by Number of Earners in Merrifield
| Number of Earners | # Families | Median Income |
| No Earners | 4 (11.4%) | $0 |
| 1 Earner | 6 (17.1%) | $0 |
| 2 Earners | 0 (0.0%) | $0 |
| 3+ Earners | 25 (71.4%) | $0 |
| Total | 35 (100.0%) | $61,509 |
Household Income in Merrifield
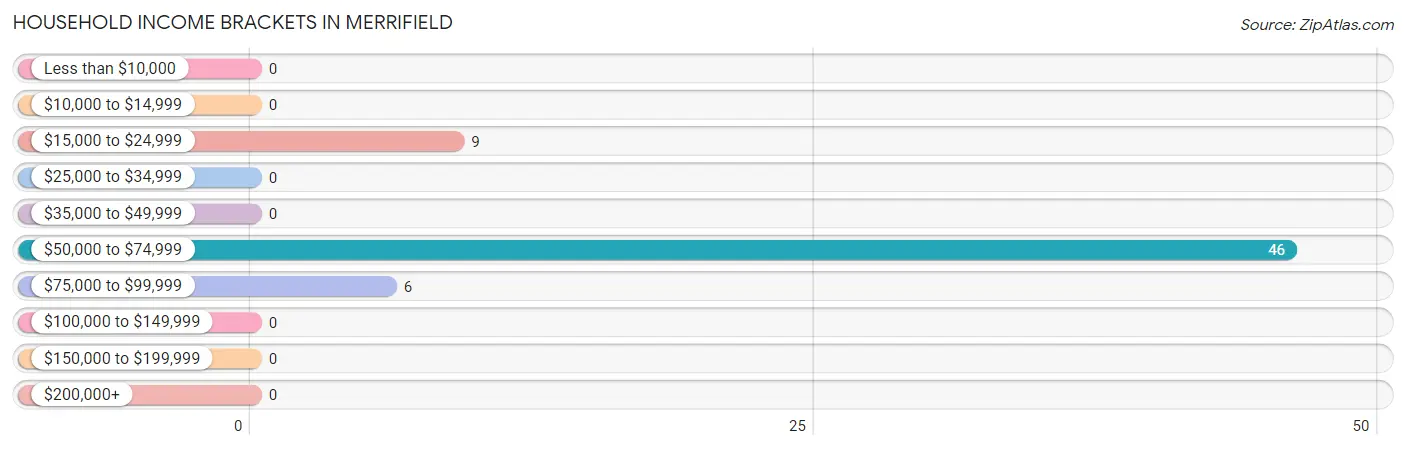
Household Income Brackets in Merrifield
With 46 households falling in the category, the $50,000 to $74,999 income range is the most frequent in Merrifield, accounting for 75.4% of all households.
| Income Bracket | # Households | % Households |
| Less than $10,000 | 0 | 0.0% |
| $10,000 to $14,999 | 0 | 0.0% |
| $15,000 to $24,999 | 9 | 14.8% |
| $25,000 to $34,999 | 0 | 0.0% |
| $35,000 to $49,999 | 0 | 0.0% |
| $50,000 to $74,999 | 46 | 75.4% |
| $75,000 to $99,999 | 6 | 9.8% |
| $100,000 to $149,999 | 0 | 0.0% |
| $150,000 to $199,999 | 0 | 0.0% |
| $200,000+ | 0 | 0.0% |
Household Income by Householder Age in Merrifield
The median household income in Merrifield is $61,168, with the highest median household income of $61,563 found in the 65+ years age bracket for the primary householder. A total of 15 households (24.6%) fall into this category.
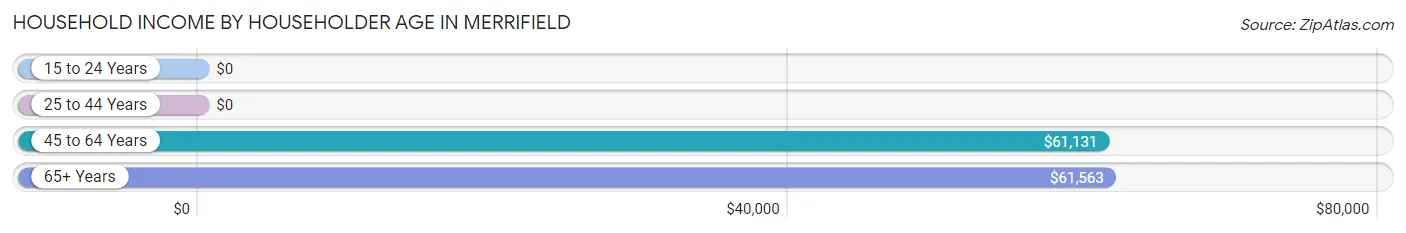
| Income Bracket | # Households | Median Income |
| 15 to 24 Years | 0 (0.0%) | $0 |
| 25 to 44 Years | 0 (0.0%) | $0 |
| 45 to 64 Years | 46 (75.4%) | $61,131 |
| 65+ Years | 15 (24.6%) | $61,563 |
| Total | 61 (100.0%) | $61,168 |
Poverty in Merrifield
Income Below Poverty by Sex and Age in Merrifield
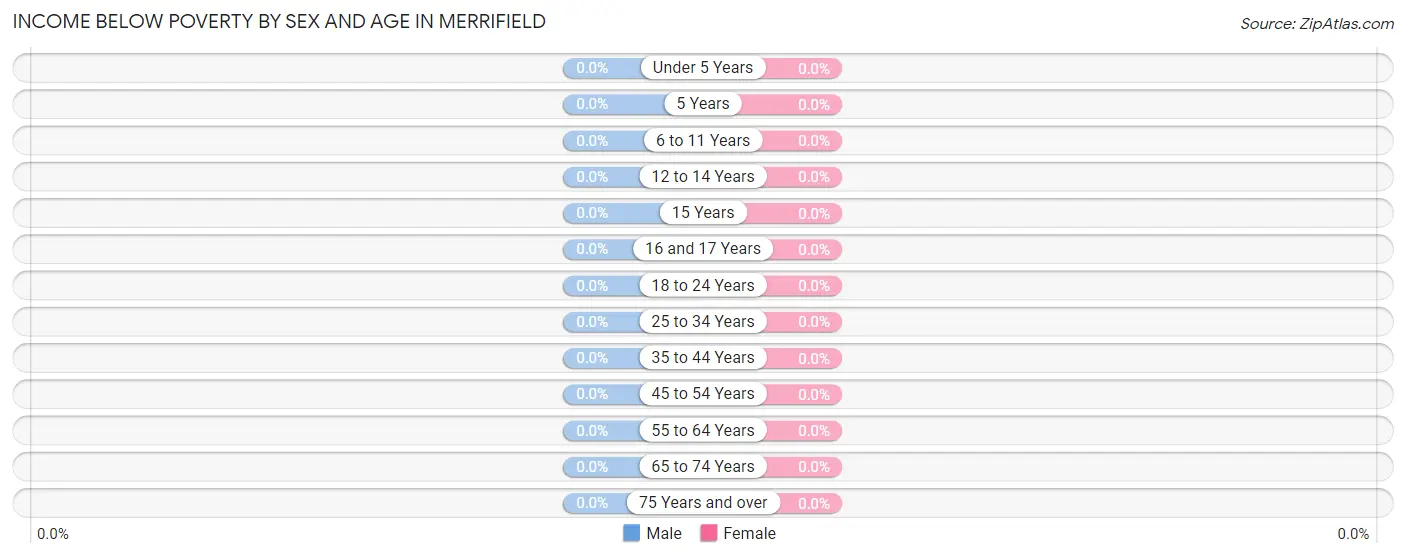
| Age Bracket | Male | Female |
| Under 5 Years | 0 (0.0%) | 0 (0.0%) |
| 5 Years | 0 (0.0%) | 0 (0.0%) |
| 6 to 11 Years | 0 (0.0%) | 0 (0.0%) |
| 12 to 14 Years | 0 (0.0%) | 0 (0.0%) |
| 15 Years | 0 (0.0%) | 0 (0.0%) |
| 16 and 17 Years | 0 (0.0%) | 0 (0.0%) |
| 18 to 24 Years | 0 (0.0%) | 0 (0.0%) |
| 25 to 34 Years | 0 (0.0%) | 0 (0.0%) |
| 35 to 44 Years | 0 (0.0%) | 0 (0.0%) |
| 45 to 54 Years | 0 (0.0%) | 0 (0.0%) |
| 55 to 64 Years | 0 (0.0%) | 0 (0.0%) |
| 65 to 74 Years | 0 (0.0%) | 0 (0.0%) |
| 75 Years and over | 0 (0.0%) | 0 (0.0%) |
| Total | 0 (0.0%) | 0 (0.0%) |
Income Above Poverty by Sex and Age in Merrifield
According to the poverty statistics in Merrifield, males aged 45 to 54 years and females aged 18 to 24 years are the age groups that are most secure financially, with 100.0% of males and 100.0% of females in these age groups living above the poverty line.
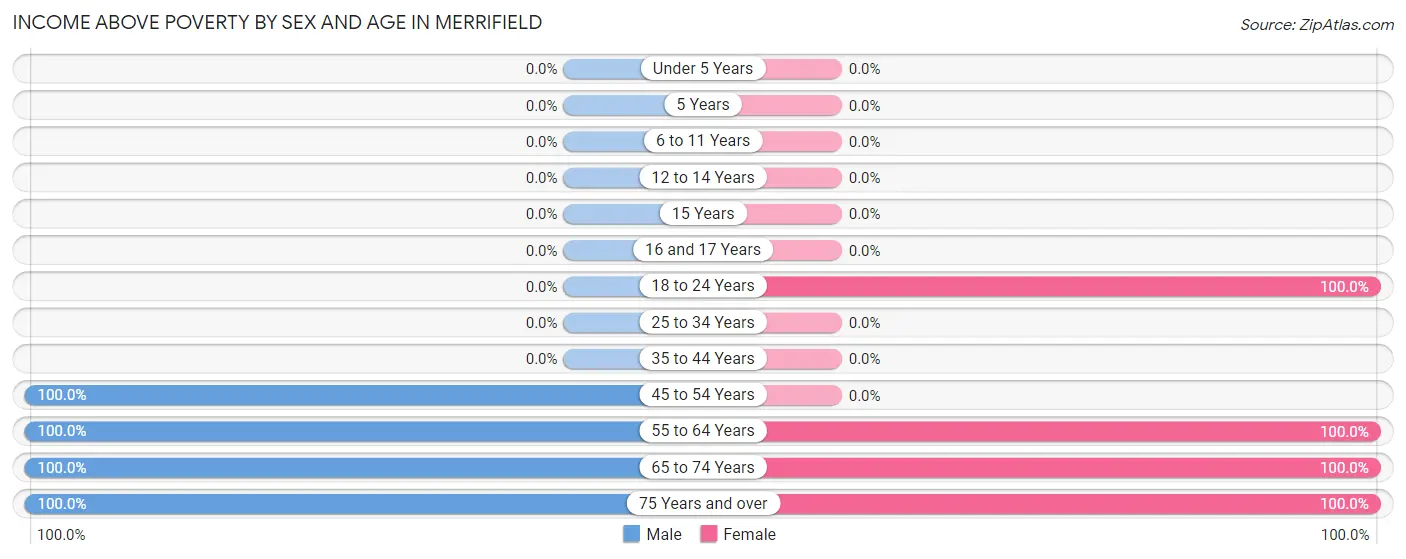
| Age Bracket | Male | Female |
| Under 5 Years | 0 (0.0%) | 0 (0.0%) |
| 5 Years | 0 (0.0%) | 0 (0.0%) |
| 6 to 11 Years | 0 (0.0%) | 0 (0.0%) |
| 12 to 14 Years | 0 (0.0%) | 0 (0.0%) |
| 15 Years | 0 (0.0%) | 0 (0.0%) |
| 16 and 17 Years | 0 (0.0%) | 0 (0.0%) |
| 18 to 24 Years | 0 (0.0%) | 24 (100.0%) |
| 25 to 34 Years | 0 (0.0%) | 0 (0.0%) |
| 35 to 44 Years | 0 (0.0%) | 0 (0.0%) |
| 45 to 54 Years | 26 (100.0%) | 0 (0.0%) |
| 55 to 64 Years | 21 (100.0%) | 25 (100.0%) |
| 65 to 74 Years | 4 (100.0%) | 4 (100.0%) |
| 75 Years and over | 6 (100.0%) | 12 (100.0%) |
| Total | 57 (100.0%) | 65 (100.0%) |
Income Below Poverty Among Married-Couple Families in Merrifield

| Children | Above Poverty | Below Poverty |
| No Children | 35 (100.0%) | 0 (0.0%) |
| 1 or 2 Children | 0 (0.0%) | 0 (0.0%) |
| 3 or 4 Children | 0 (0.0%) | 0 (0.0%) |
| 5 or more Children | 0 (0.0%) | 0 (0.0%) |
| Total | 35 (100.0%) | 0 (0.0%) |
Income Below Poverty Among Single-Parent Households in Merrifield
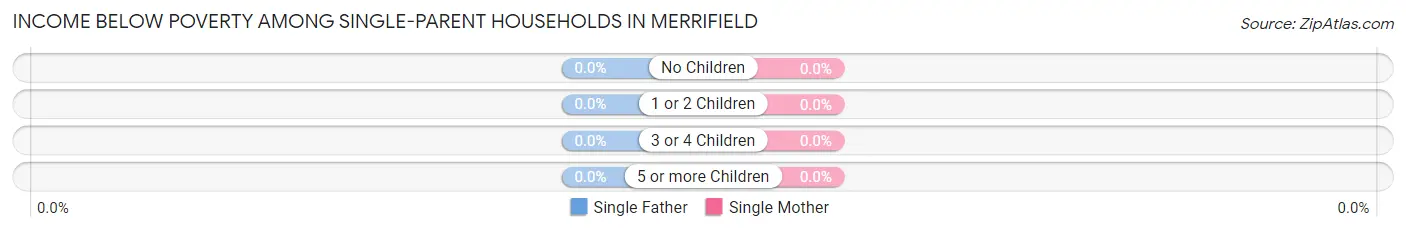
| Children | Single Father | Single Mother |
| No Children | 0 (0.0%) | 0 (0.0%) |
| 1 or 2 Children | 0 (0.0%) | 0 (0.0%) |
| 3 or 4 Children | 0 (0.0%) | 0 (0.0%) |
| 5 or more Children | 0 (0.0%) | 0 (0.0%) |
| Total | 0 (0.0%) | 0 (0.0%) |
Income Below Poverty Among Married-Couple vs Single-Parent Households in Merrifield
| Children | Married-Couple Families | Single-Parent Households |
| No Children | 0 (0.0%) | 0 (0.0%) |
| 1 or 2 Children | 0 (0.0%) | 0 (0.0%) |
| 3 or 4 Children | 0 (0.0%) | 0 (0.0%) |
| 5 or more Children | 0 (0.0%) | 0 (0.0%) |
| Total | 0 (0.0%) | 0 (0.0%) |
Race in Merrifield
The most populous races in Merrifield are , and White / Caucasian (122 | 100.0%).
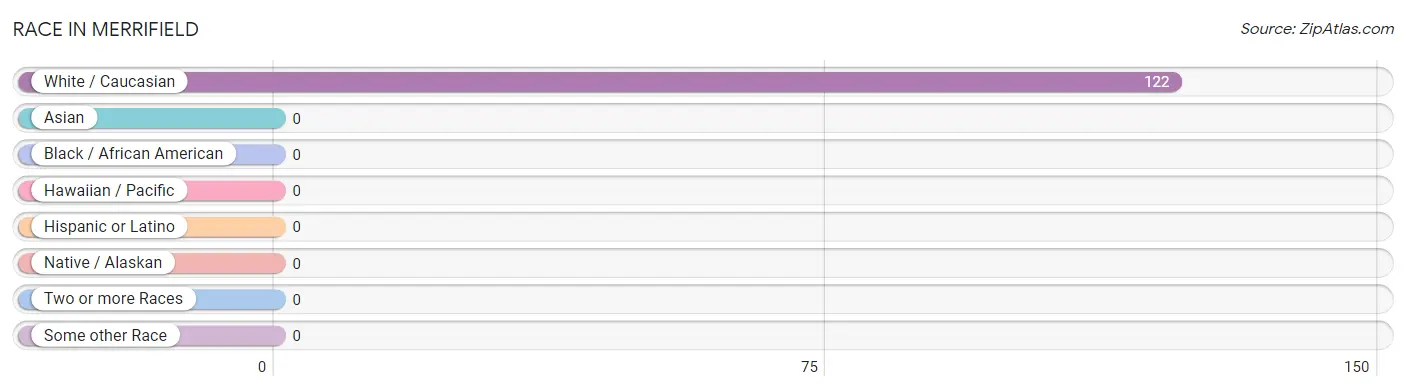
| Race | # Population | % Population |
| Asian | 0 | 0.0% |
| Black / African American | 0 | 0.0% |
| Hawaiian / Pacific | 0 | 0.0% |
| Hispanic or Latino | 0 | 0.0% |
| Native / Alaskan | 0 | 0.0% |
| White / Caucasian | 122 | 100.0% |
| Two or more Races | 0 | 0.0% |
| Some other Race | 0 | 0.0% |
| Total | 122 | 100.0% |
Ancestry in Merrifield
The most populous ancestries reported in Merrifield are German (54 | 44.3%), Polish (5 | 4.1%), American (4 | 3.3%), Irish (4 | 3.3%), and Norwegian (4 | 3.3%), together accounting for 58.2% of all Merrifield residents.
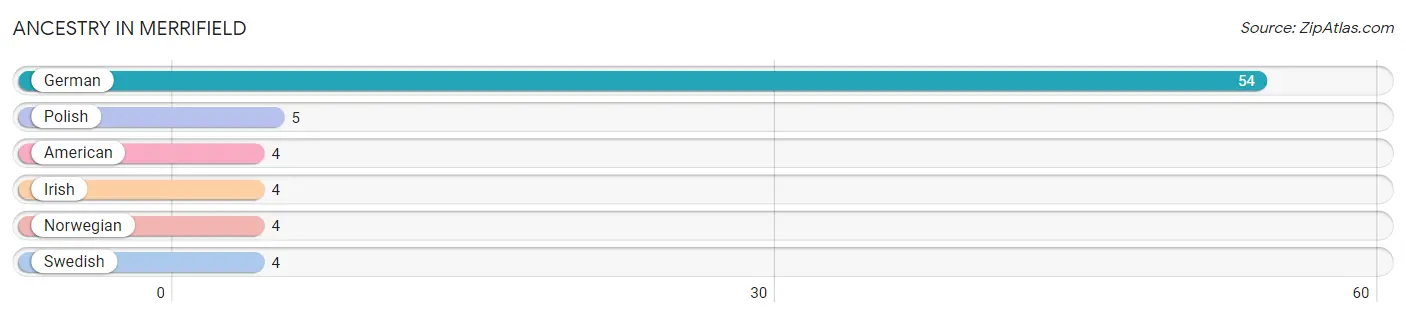
| Ancestry | # Population | % Population |
| American | 4 | 3.3% |
| German | 54 | 44.3% |
| Irish | 4 | 3.3% |
| Norwegian | 4 | 3.3% |
| Polish | 5 | 4.1% |
| Swedish | 4 | 3.3% | View All 6 Rows |
Immigrants in Merrifield

| Immigration Origin | # Population | % Population | View All 0 Rows |
Sex and Age in Merrifield
Sex and Age in Merrifield
The most populous age groups in Merrifield are 50 to 54 Years (26 | 45.6%) for men and 55 to 59 Years (25 | 38.5%) for women.
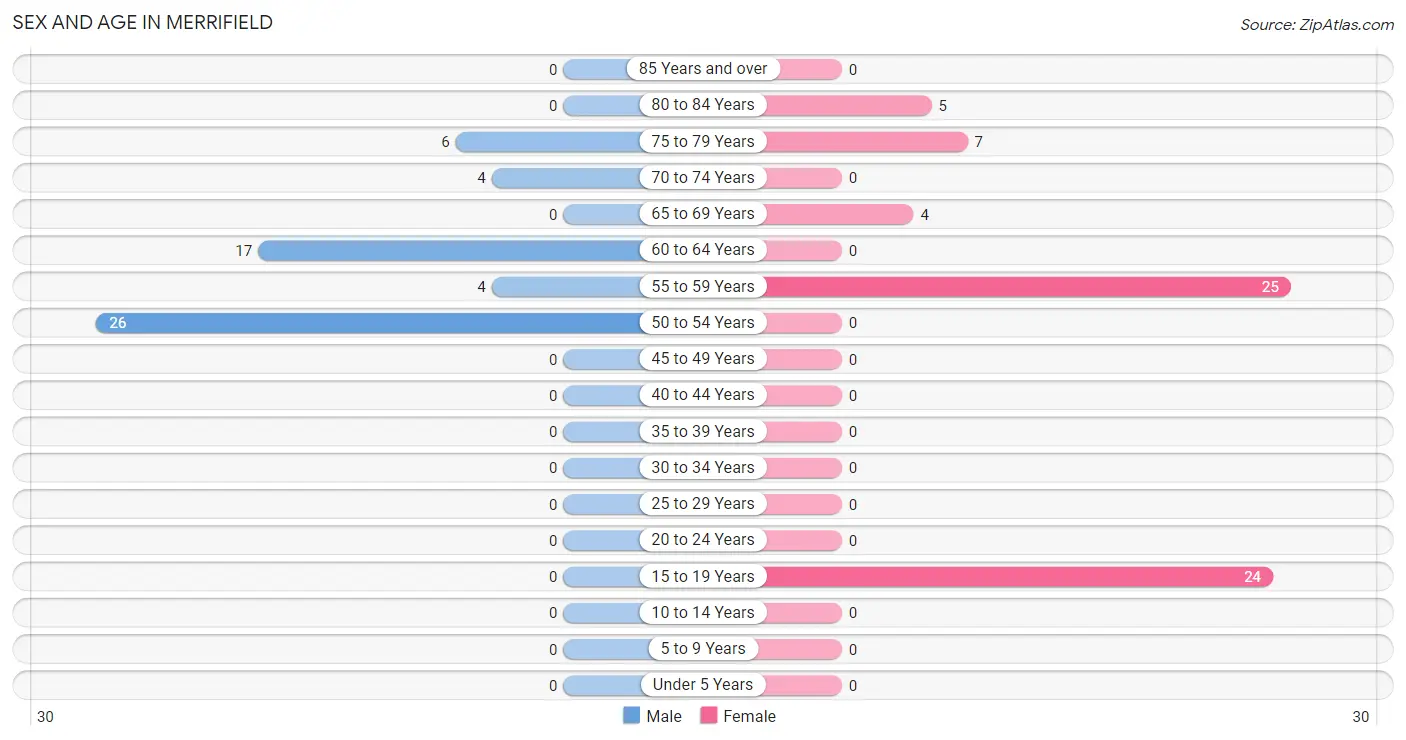
| Age Bracket | Male | Female |
| Under 5 Years | 0 (0.0%) | 0 (0.0%) |
| 5 to 9 Years | 0 (0.0%) | 0 (0.0%) |
| 10 to 14 Years | 0 (0.0%) | 0 (0.0%) |
| 15 to 19 Years | 0 (0.0%) | 24 (36.9%) |
| 20 to 24 Years | 0 (0.0%) | 0 (0.0%) |
| 25 to 29 Years | 0 (0.0%) | 0 (0.0%) |
| 30 to 34 Years | 0 (0.0%) | 0 (0.0%) |
| 35 to 39 Years | 0 (0.0%) | 0 (0.0%) |
| 40 to 44 Years | 0 (0.0%) | 0 (0.0%) |
| 45 to 49 Years | 0 (0.0%) | 0 (0.0%) |
| 50 to 54 Years | 26 (45.6%) | 0 (0.0%) |
| 55 to 59 Years | 4 (7.0%) | 25 (38.5%) |
| 60 to 64 Years | 17 (29.8%) | 0 (0.0%) |
| 65 to 69 Years | 0 (0.0%) | 4 (6.1%) |
| 70 to 74 Years | 4 (7.0%) | 0 (0.0%) |
| 75 to 79 Years | 6 (10.5%) | 7 (10.8%) |
| 80 to 84 Years | 0 (0.0%) | 5 (7.7%) |
| 85 Years and over | 0 (0.0%) | 0 (0.0%) |
| Total | 57 (100.0%) | 65 (100.0%) |
Families and Households in Merrifield
Median Family Size in Merrifield
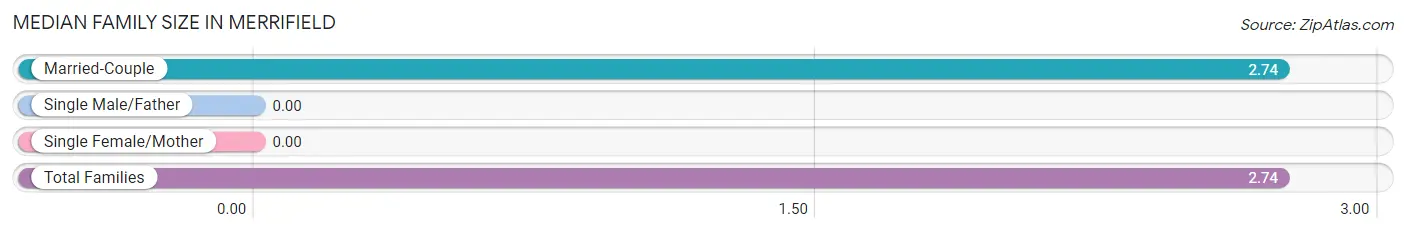
| Family Type | # Families | Family Size |
| Married-Couple | 35 (100.0%) | 2.74 |
| Single Male/Father | 0 (0.0%) | - |
| Single Female/Mother | 0 (0.0%) | - |
| Total Families | 35 (100.0%) | 2.74 |
Median Household Size in Merrifield
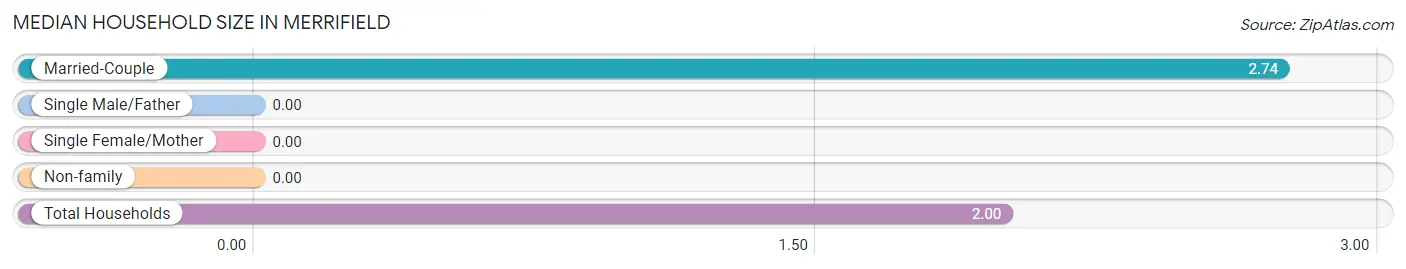
| Household Type | # Households | Household Size |
| Married-Couple | 35 (57.4%) | 2.74 |
| Single Male/Father | 0 (0.0%) | - |
| Single Female/Mother | 0 (0.0%) | - |
| Non-family | 26 (42.6%) | - |
| Total Households | 61 (100.0%) | 2.00 |
Household Size by Marriage Status in Merrifield
Out of a total of 61 households in Merrifield, 35 (57.4%) are family households, while 26 (42.6%) are nonfamily households. The most numerous type of family households are 3-person households, comprising 25, and the most common type of nonfamily households are 1-person households, comprising 26.
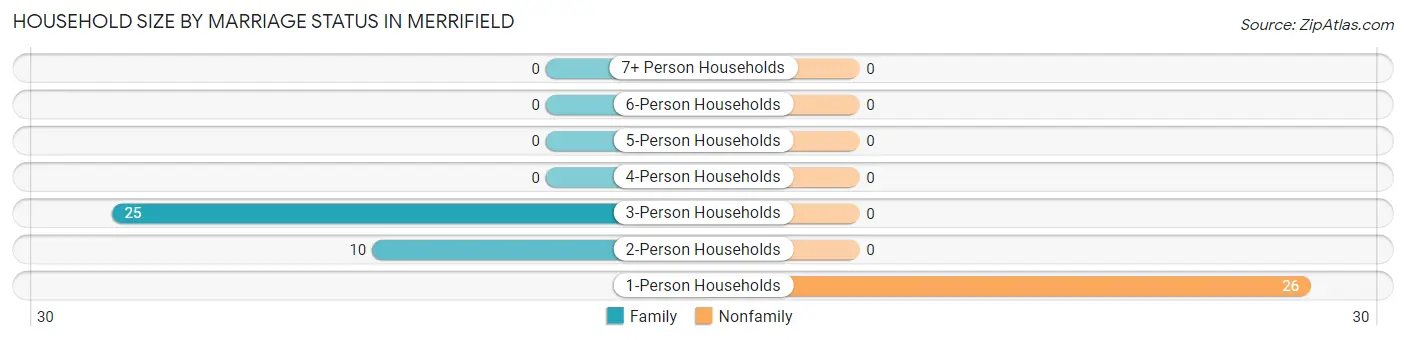
| Household Size | Family Households | Nonfamily Households |
| 1-Person Households | - | 26 (42.6%) |
| 2-Person Households | 10 (16.4%) | 0 (0.0%) |
| 3-Person Households | 25 (41.0%) | 0 (0.0%) |
| 4-Person Households | 0 (0.0%) | 0 (0.0%) |
| 5-Person Households | 0 (0.0%) | 0 (0.0%) |
| 6-Person Households | 0 (0.0%) | 0 (0.0%) |
| 7+ Person Households | 0 (0.0%) | 0 (0.0%) |
| Total | 35 (57.4%) | 26 (42.6%) |
Female Fertility in Merrifield
Fertility by Age in Merrifield
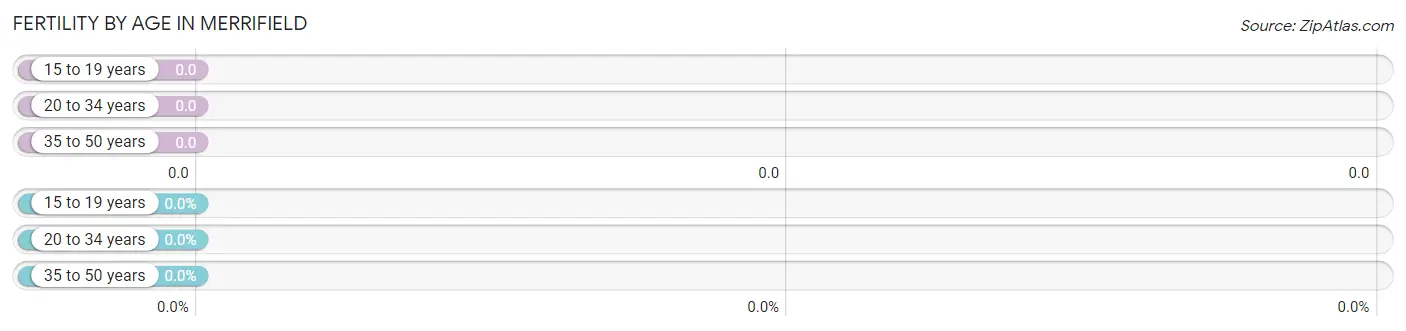
| Age Bracket | Women with Births | Births / 1,000 Women |
| 15 to 19 years | 0 (0.0%) | 0.0 |
| 20 to 34 years | 0 (0.0%) | 0.0 |
| 35 to 50 years | 0 (0.0%) | 0.0 |
| Total | 0 (0.0%) | 0.0 |
Fertility by Age by Marriage Status in Merrifield
| Age Bracket | Married | Unmarried |
| 15 to 19 years | 0 (0.0%) | 0 (0.0%) |
| 20 to 34 years | 0 (0.0%) | 0 (0.0%) |
| 35 to 50 years | 0 (0.0%) | 0 (0.0%) |
| Total | 0 (0.0%) | 0 (0.0%) |
Fertility by Education in Merrifield
| Educational Attainment | Women with Births | Births / 1,000 Women |
| Less than High School | 0 (0.0%) | 0.0 |
| High School Diploma | 0 (0.0%) | 0.0 |
| College or Associate's Degree | 0 (0.0%) | 0.0 |
| Bachelor's Degree | 0 (0.0%) | 0.0 |
| Graduate Degree | 0 (0.0%) | 0.0 |
| Total | 0 (0.0%) | 0.0 |
Fertility by Education by Marriage Status in Merrifield
| Educational Attainment | Married | Unmarried |
| Less than High School | 0 (0.0%) | 0 (0.0%) |
| High School Diploma | 0 (0.0%) | 0 (0.0%) |
| College or Associate's Degree | 0 (0.0%) | 0 (0.0%) |
| Bachelor's Degree | 0 (0.0%) | 0 (0.0%) |
| Graduate Degree | 0 (0.0%) | 0 (0.0%) |
| Total | 0 (0.0%) | 0 (0.0%) |
Employment Characteristics in Merrifield
Employment by Class of Employer in Merrifield
Among the 102 employed individuals in Merrifield, local government employees (49 | 48.0%), private company employees (32 | 31.4%), and not-for-profit organizations (17 | 16.7%) make up the most common classes of employment.
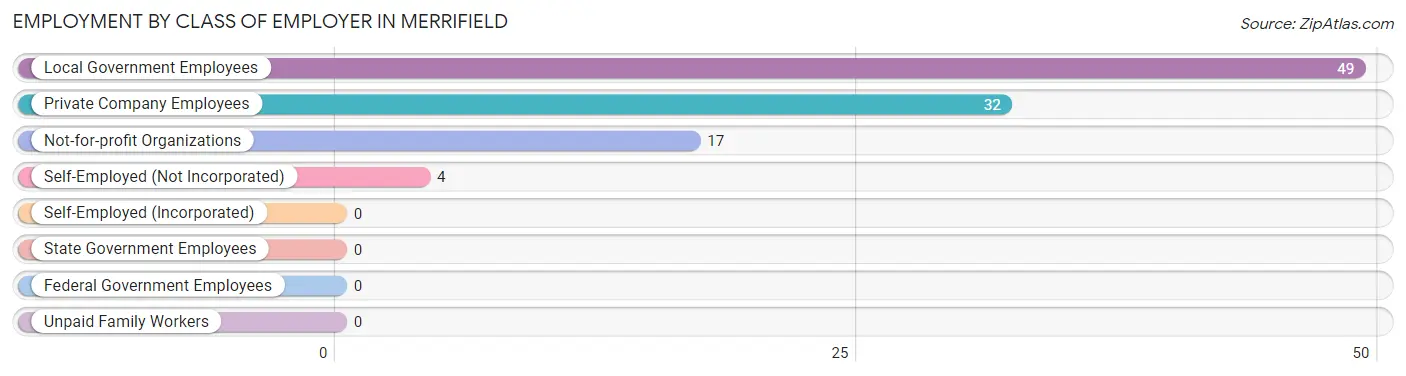
| Employer Class | # Employees | % Employees |
| Private Company Employees | 32 | 31.4% |
| Self-Employed (Incorporated) | 0 | 0.0% |
| Self-Employed (Not Incorporated) | 4 | 3.9% |
| Not-for-profit Organizations | 17 | 16.7% |
| Local Government Employees | 49 | 48.0% |
| State Government Employees | 0 | 0.0% |
| Federal Government Employees | 0 | 0.0% |
| Unpaid Family Workers | 0 | 0.0% |
| Total | 102 | 100.0% |
Employment Status by Age in Merrifield
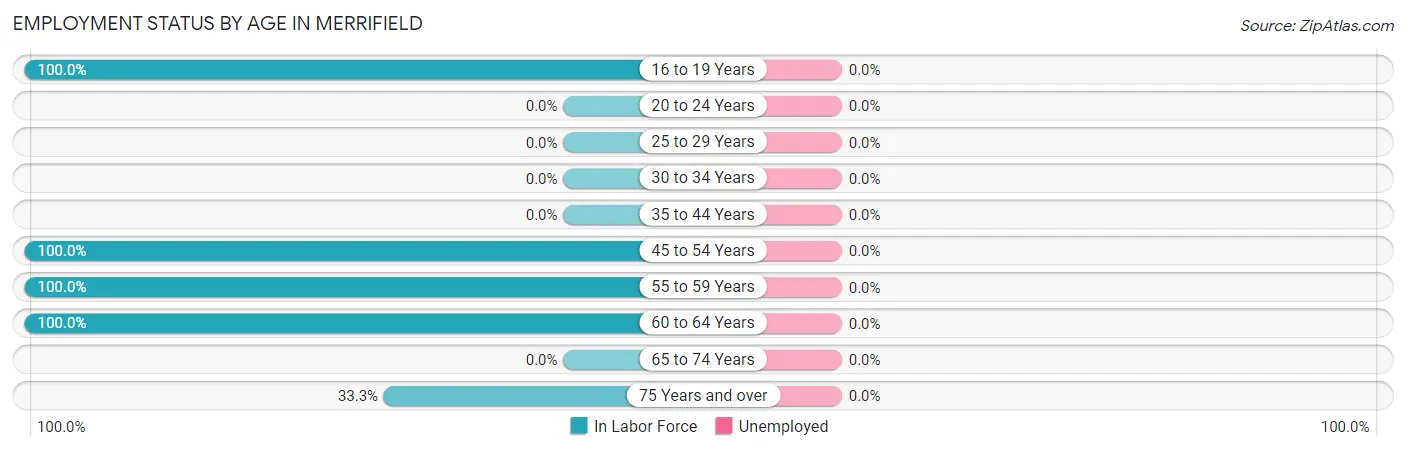
| Age Bracket | In Labor Force | Unemployed |
| 16 to 19 Years | 24 (100.0%) | 0 (0.0%) |
| 20 to 24 Years | 0 (0.0%) | 0 (0.0%) |
| 25 to 29 Years | 0 (0.0%) | 0 (0.0%) |
| 30 to 34 Years | 0 (0.0%) | 0 (0.0%) |
| 35 to 44 Years | 0 (0.0%) | 0 (0.0%) |
| 45 to 54 Years | 26 (100.0%) | 0 (0.0%) |
| 55 to 59 Years | 29 (100.0%) | 0 (0.0%) |
| 60 to 64 Years | 17 (100.0%) | 0 (0.0%) |
| 65 to 74 Years | 0 (0.0%) | 0 (0.0%) |
| 75 Years and over | 6 (33.3%) | 0 (0.0%) |
| Total | 102 (83.6%) | 0 (0.0%) |
Employment Status by Educational Attainment in Merrifield
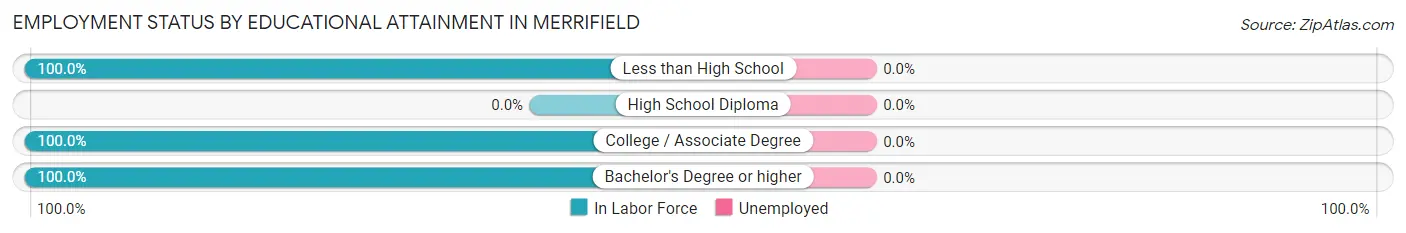
| Educational Attainment | In Labor Force | Unemployed |
| Less than High School | 4 (100.0%) | 0 (0.0%) |
| High School Diploma | 0 (0.0%) | 0 (0.0%) |
| College / Associate Degree | 42 (100.0%) | 0 (0.0%) |
| Bachelor's Degree or higher | 26 (100.0%) | 0 (0.0%) |
| Total | 72 (100.0%) | 0 (0.0%) |
Employment Occupations by Sex in Merrifield
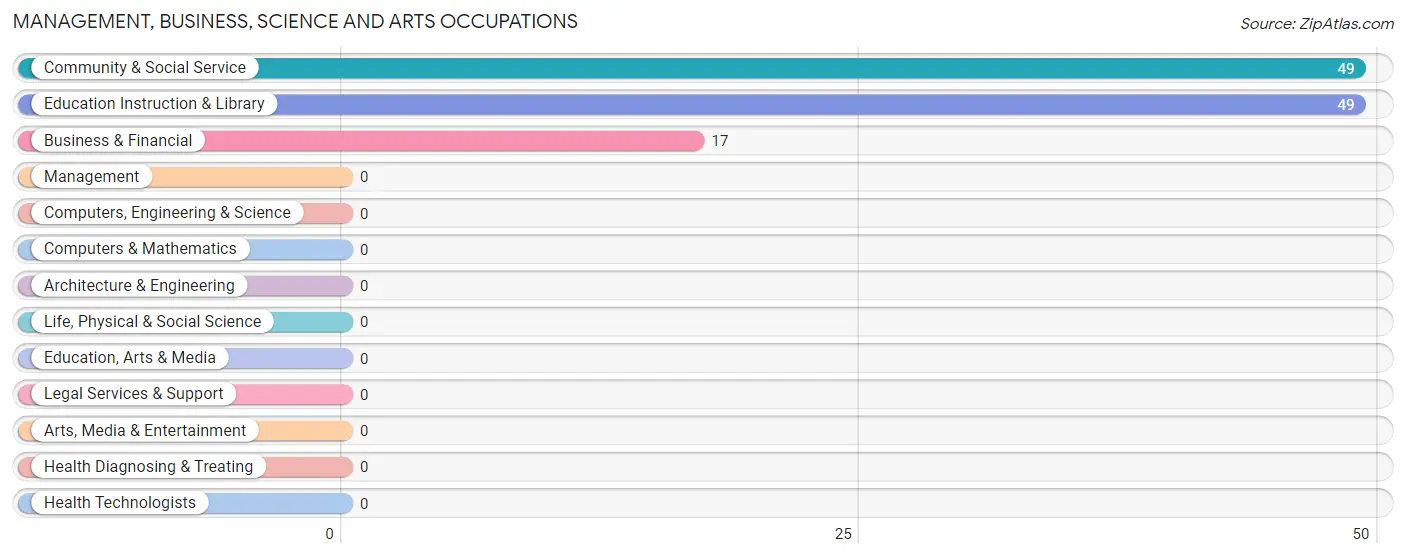
Management, Business, Science and Arts Occupations
The most common Management, Business, Science and Arts occupations in Merrifield are Community & Social Service (49 | 48.0%), Education Instruction & Library (49 | 48.0%), and Business & Financial (17 | 16.7%).
Management, Business, Science and Arts Occupations by Sex
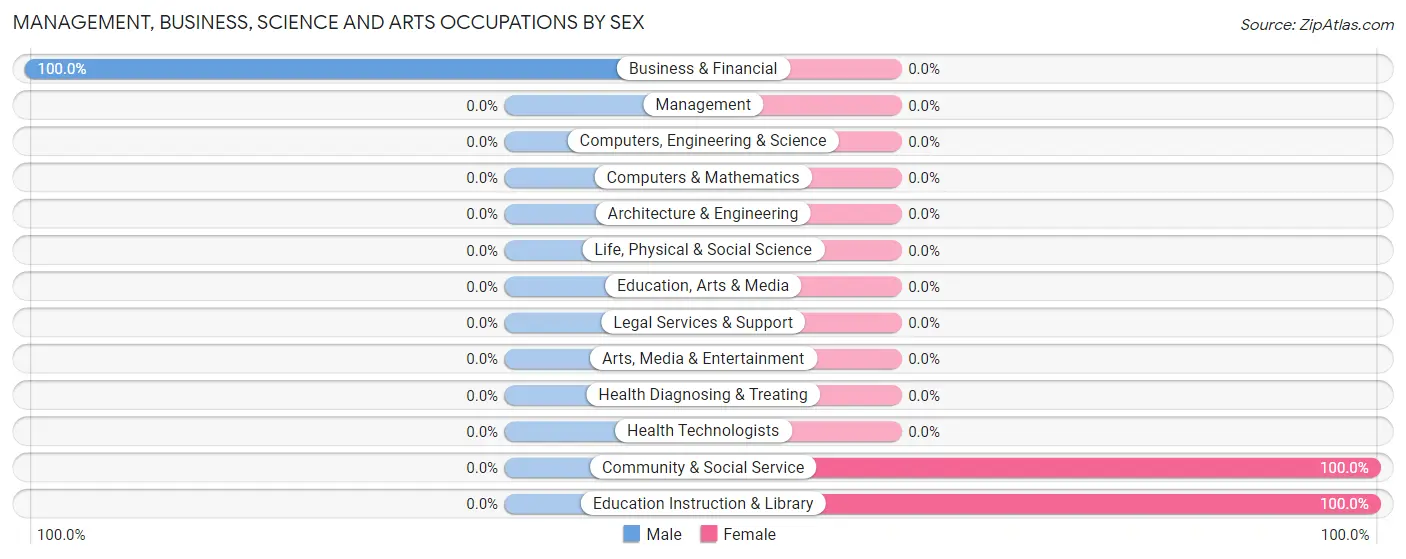
| Occupation | Male | Female |
| Management | 0 (0.0%) | 0 (0.0%) |
| Business & Financial | 17 (100.0%) | 0 (0.0%) |
| Computers, Engineering & Science | 0 (0.0%) | 0 (0.0%) |
| Computers & Mathematics | 0 (0.0%) | 0 (0.0%) |
| Architecture & Engineering | 0 (0.0%) | 0 (0.0%) |
| Life, Physical & Social Science | 0 (0.0%) | 0 (0.0%) |
| Community & Social Service | 0 (0.0%) | 49 (100.0%) |
| Education, Arts & Media | 0 (0.0%) | 0 (0.0%) |
| Legal Services & Support | 0 (0.0%) | 0 (0.0%) |
| Education Instruction & Library | 0 (0.0%) | 49 (100.0%) |
| Arts, Media & Entertainment | 0 (0.0%) | 0 (0.0%) |
| Health Diagnosing & Treating | 0 (0.0%) | 0 (0.0%) |
| Health Technologists | 0 (0.0%) | 0 (0.0%) |
| Total (Category) | 17 (25.8%) | 49 (74.2%) |
| Total (Overall) | 53 (52.0%) | 49 (48.0%) |
Services Occupations
Services Occupations by Sex
| Occupation | Male | Female |
| Healthcare Support | 0 (0.0%) | 0 (0.0%) |
| Security & Protection | 0 (0.0%) | 0 (0.0%) |
| Firefighting & Prevention | 0 (0.0%) | 0 (0.0%) |
| Law Enforcement | 0 (0.0%) | 0 (0.0%) |
| Food Preparation & Serving | 0 (0.0%) | 0 (0.0%) |
| Cleaning & Maintenance | 0 (0.0%) | 0 (0.0%) |
| Personal Care & Service | 0 (0.0%) | 0 (0.0%) |
| Total (Category) | 0 (0.0%) | 0 (0.0%) |
| Total (Overall) | 53 (52.0%) | 49 (48.0%) |
Sales and Office Occupations
The most common Sales and Office occupations in Merrifield are , and Sales & Related (6 | 5.9%).
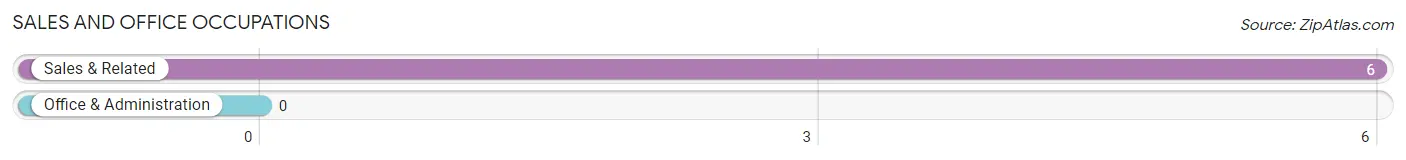
Sales and Office Occupations by Sex
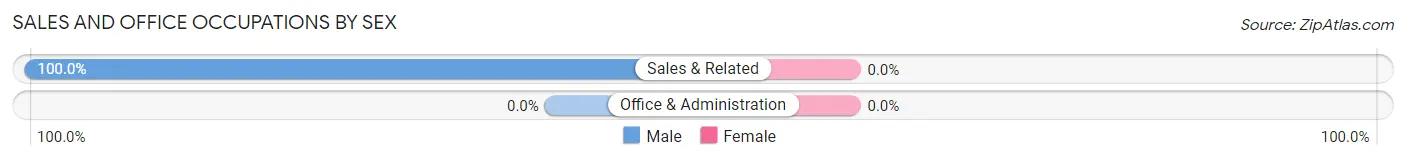
| Occupation | Male | Female |
| Sales & Related | 6 (100.0%) | 0 (0.0%) |
| Office & Administration | 0 (0.0%) | 0 (0.0%) |
| Total (Category) | 6 (100.0%) | 0 (0.0%) |
| Total (Overall) | 53 (52.0%) | 49 (48.0%) |
Natural Resources, Construction and Maintenance Occupations
The most common Natural Resources, Construction and Maintenance occupations in Merrifield are , and Construction & Extraction (4 | 3.9%).
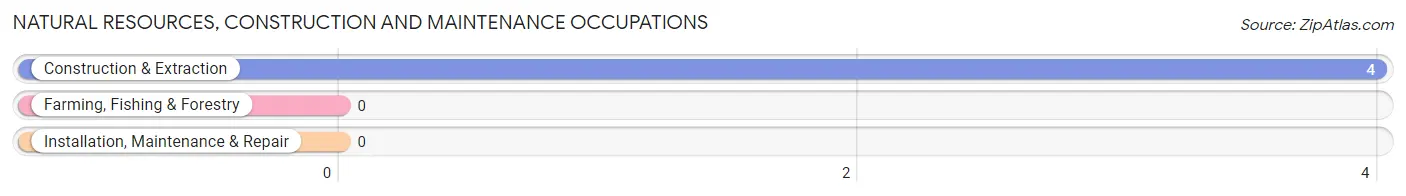
Natural Resources, Construction and Maintenance Occupations by Sex
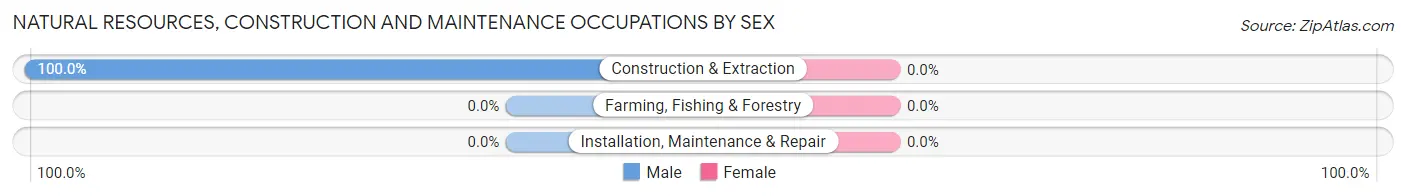
| Occupation | Male | Female |
| Farming, Fishing & Forestry | 0 (0.0%) | 0 (0.0%) |
| Construction & Extraction | 4 (100.0%) | 0 (0.0%) |
| Installation, Maintenance & Repair | 0 (0.0%) | 0 (0.0%) |
| Total (Category) | 4 (100.0%) | 0 (0.0%) |
| Total (Overall) | 53 (52.0%) | 49 (48.0%) |
Production, Transportation and Moving Occupations
The most common Production, Transportation and Moving occupations in Merrifield are , and Material Moving (26 | 25.5%).
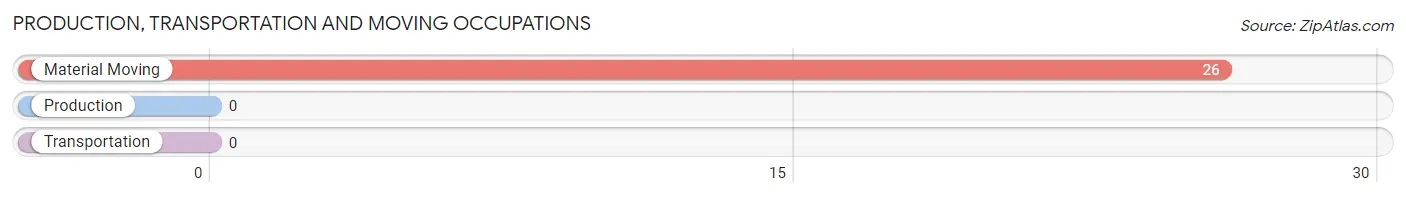
Production, Transportation and Moving Occupations by Sex
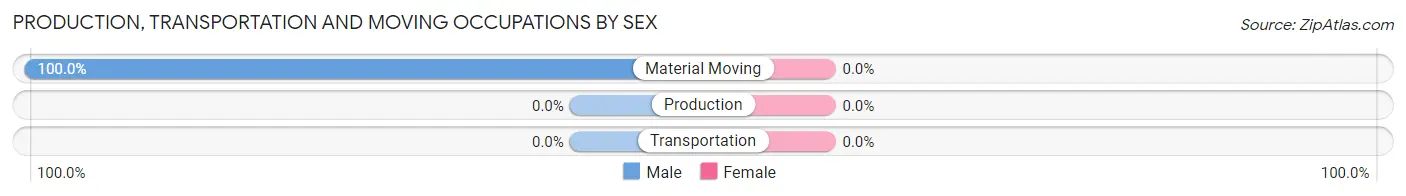
| Occupation | Male | Female |
| Production | 0 (0.0%) | 0 (0.0%) |
| Transportation | 0 (0.0%) | 0 (0.0%) |
| Material Moving | 26 (100.0%) | 0 (0.0%) |
| Total (Category) | 26 (100.0%) | 0 (0.0%) |
| Total (Overall) | 53 (52.0%) | 49 (48.0%) |
Employment Industries by Sex in Merrifield
Employment Industries in Merrifield
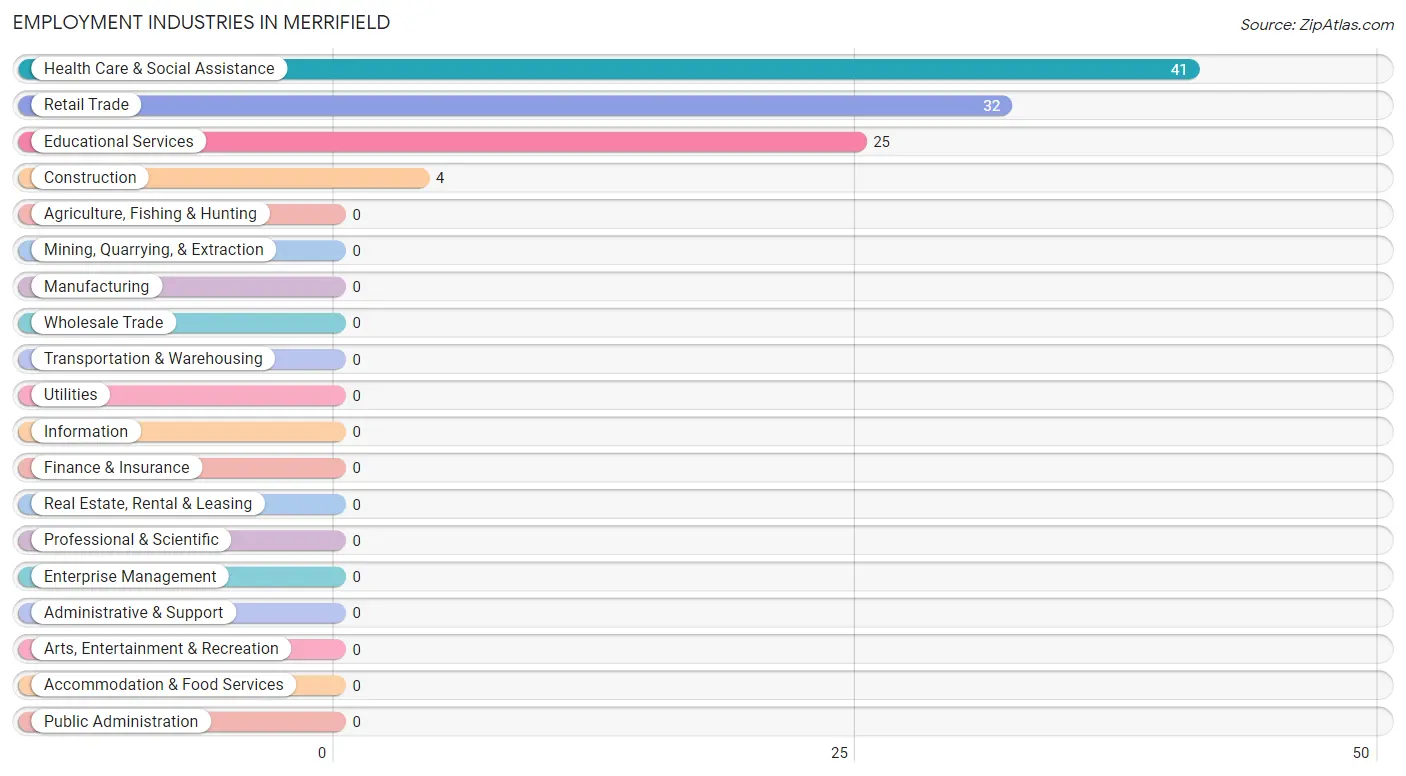
The major employment industries in Merrifield include Health Care & Social Assistance (41 | 40.2%), Retail Trade (32 | 31.4%), Educational Services (25 | 24.5%), and Construction (4 | 3.9%).
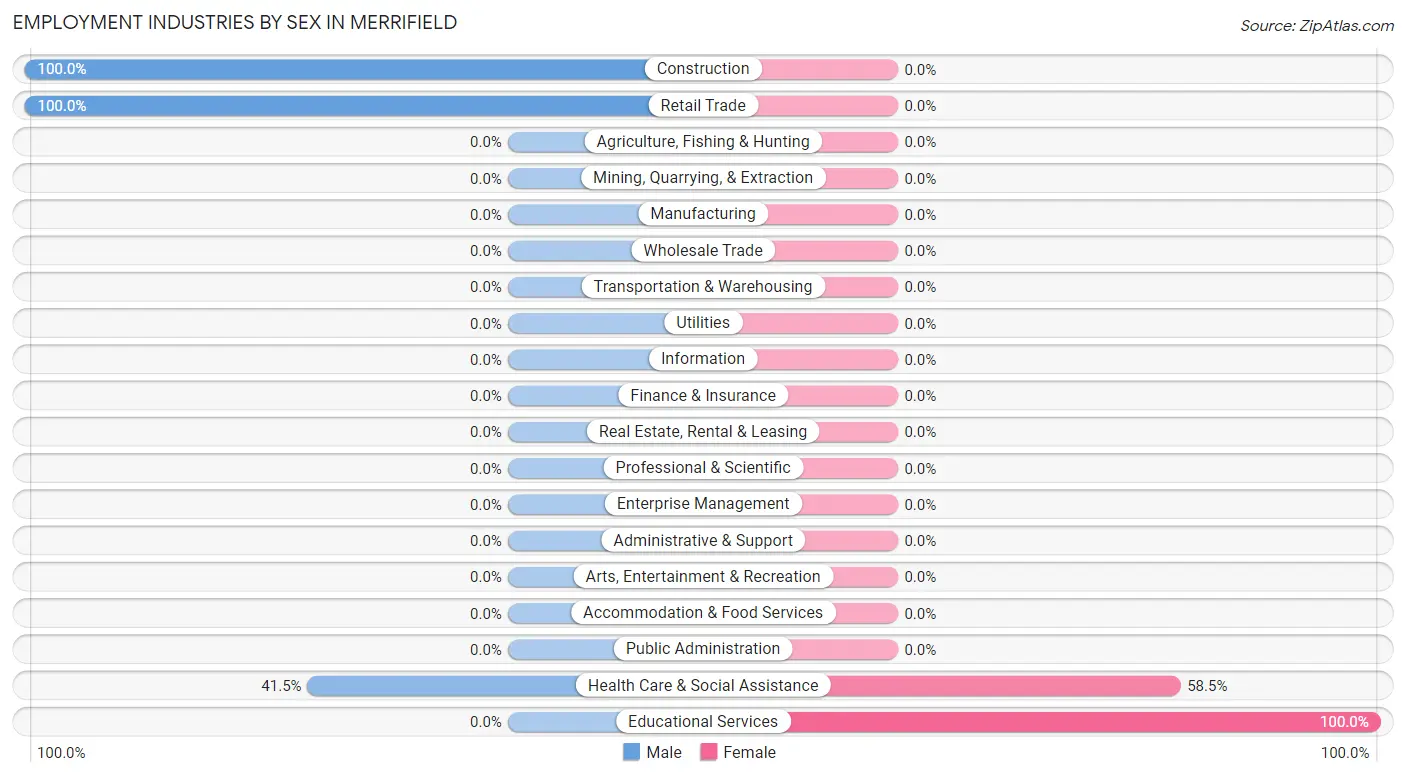
Employment Industries by Sex in Merrifield
The Merrifield industries that see more men than women are Construction (100.0%), Retail Trade (100.0%), and Health Care & Social Assistance (41.5%), whereas the industries that tend to have a higher number of women are Educational Services (100.0%), and Health Care & Social Assistance (58.5%).
| Industry | Male | Female |
| Agriculture, Fishing & Hunting | 0 (0.0%) | 0 (0.0%) |
| Mining, Quarrying, & Extraction | 0 (0.0%) | 0 (0.0%) |
| Construction | 4 (100.0%) | 0 (0.0%) |
| Manufacturing | 0 (0.0%) | 0 (0.0%) |
| Wholesale Trade | 0 (0.0%) | 0 (0.0%) |
| Retail Trade | 32 (100.0%) | 0 (0.0%) |
| Transportation & Warehousing | 0 (0.0%) | 0 (0.0%) |
| Utilities | 0 (0.0%) | 0 (0.0%) |
| Information | 0 (0.0%) | 0 (0.0%) |
| Finance & Insurance | 0 (0.0%) | 0 (0.0%) |
| Real Estate, Rental & Leasing | 0 (0.0%) | 0 (0.0%) |
| Professional & Scientific | 0 (0.0%) | 0 (0.0%) |
| Enterprise Management | 0 (0.0%) | 0 (0.0%) |
| Administrative & Support | 0 (0.0%) | 0 (0.0%) |
| Educational Services | 0 (0.0%) | 25 (100.0%) |
| Health Care & Social Assistance | 17 (41.5%) | 24 (58.5%) |
| Arts, Entertainment & Recreation | 0 (0.0%) | 0 (0.0%) |
| Accommodation & Food Services | 0 (0.0%) | 0 (0.0%) |
| Public Administration | 0 (0.0%) | 0 (0.0%) |
| Total | 53 (52.0%) | 49 (48.0%) |
Education in Merrifield
School Enrollment in Merrifield
| School Level | # Students | % Students |
| Nursery / Preschool | 0 | 0.0% |
| Kindergarten | 0 | 0.0% |
| Elementary School | 0 | 0.0% |
| Middle School | 0 | 0.0% |
| High School | 0 | 0.0% |
| College / Undergraduate | 0 | 0.0% |
| Graduate / Professional | 0 | 0.0% |
| Total | 0 | 0.0% |
School Enrollment by Age by Funding Source in Merrifield
| Age Bracket | Public School | Private School |
| 3 to 4 Year Olds | 0 (0.0%) | 0 (0.0%) |
| 5 to 9 Year Old | 0 (0.0%) | 0 (0.0%) |
| 10 to 14 Year Olds | 0 (0.0%) | 0 (0.0%) |
| 15 to 17 Year Olds | 0 (0.0%) | 0 (0.0%) |
| 18 to 19 Year Olds | 0 (0.0%) | 0 (0.0%) |
| 20 to 24 Year Olds | 0 (0.0%) | 0 (0.0%) |
| 25 to 34 Year Olds | 0 (0.0%) | 0 (0.0%) |
| 35 Years and over | 0 (0.0%) | 0 (0.0%) |
| Total | 0 (0.0%) | 0 (0.0%) |
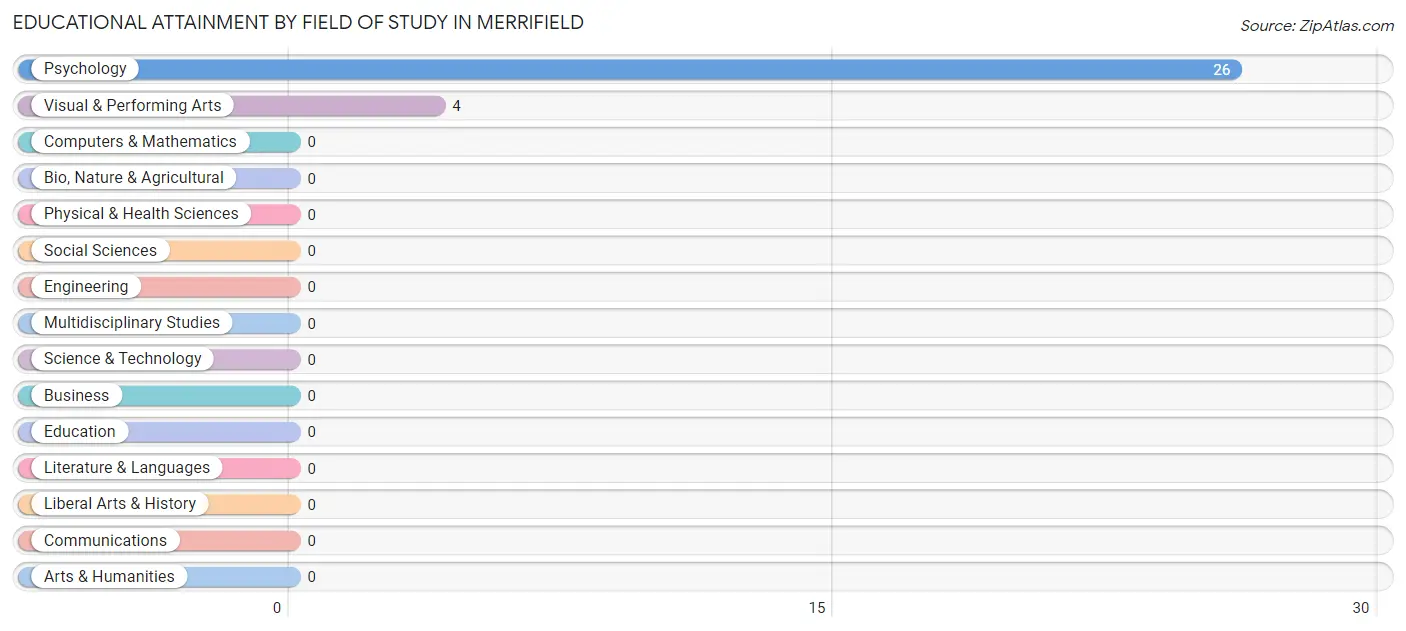
Educational Attainment by Field of Study in Merrifield
Psychology (26 | 86.7%), and visual & performing arts (4 | 13.3%) are the most common fields of study among 30 individuals in Merrifield who have obtained a bachelor's degree or higher.
| Field of Study | # Graduates | % Graduates |
| Computers & Mathematics | 0 | 0.0% |
| Bio, Nature & Agricultural | 0 | 0.0% |
| Physical & Health Sciences | 0 | 0.0% |
| Psychology | 26 | 86.7% |
| Social Sciences | 0 | 0.0% |
| Engineering | 0 | 0.0% |
| Multidisciplinary Studies | 0 | 0.0% |
| Science & Technology | 0 | 0.0% |
| Business | 0 | 0.0% |
| Education | 0 | 0.0% |
| Literature & Languages | 0 | 0.0% |
| Liberal Arts & History | 0 | 0.0% |
| Visual & Performing Arts | 4 | 13.3% |
| Communications | 0 | 0.0% |
| Arts & Humanities | 0 | 0.0% |
| Total | 30 | 100.0% |
Transportation & Commute in Merrifield
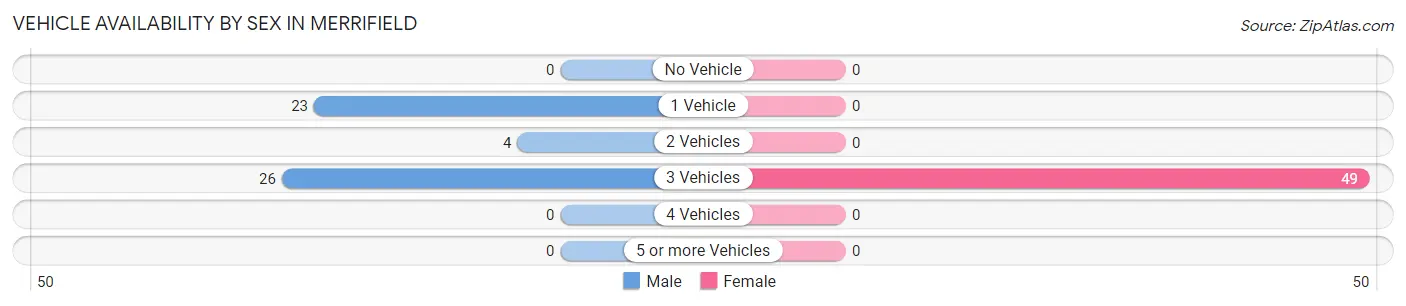
Vehicle Availability by Sex in Merrifield
The most prevalent vehicle ownership categories in Merrifield are males with 3 vehicles (26, accounting for 49.1%) and females with 3 vehicles (49, making up 53.1%).
| Vehicles Available | Male | Female |
| No Vehicle | 0 (0.0%) | 0 (0.0%) |
| 1 Vehicle | 23 (43.4%) | 0 (0.0%) |
| 2 Vehicles | 4 (7.5%) | 0 (0.0%) |
| 3 Vehicles | 26 (49.1%) | 49 (100.0%) |
| 4 Vehicles | 0 (0.0%) | 0 (0.0%) |
| 5 or more Vehicles | 0 (0.0%) | 0 (0.0%) |
| Total | 53 (100.0%) | 49 (100.0%) |
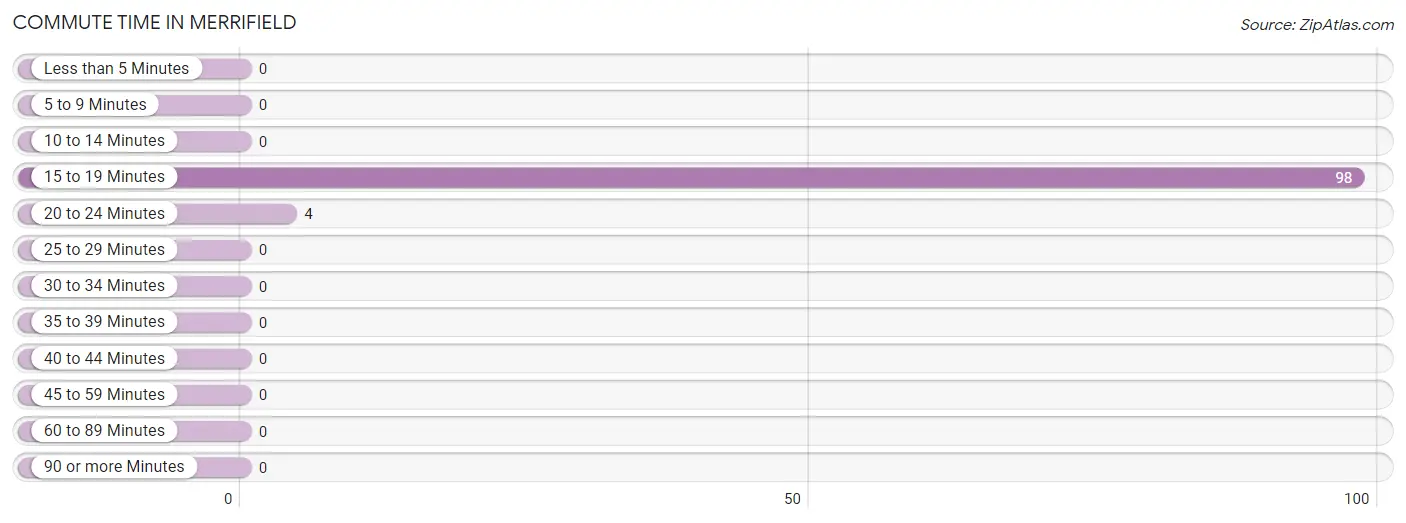
Commute Time in Merrifield
The most frequently occuring commute durations in Merrifield are 15 to 19 minutes (98 commuters, 96.1%), 20 to 24 minutes (4 commuters, 3.9%), and less than 5 minutes (0 commuters, 0.0%).
| Commute Time | # Commuters | % Commuters |
| Less than 5 Minutes | 0 | 0.0% |
| 5 to 9 Minutes | 0 | 0.0% |
| 10 to 14 Minutes | 0 | 0.0% |
| 15 to 19 Minutes | 98 | 96.1% |
| 20 to 24 Minutes | 4 | 3.9% |
| 25 to 29 Minutes | 0 | 0.0% |
| 30 to 34 Minutes | 0 | 0.0% |
| 35 to 39 Minutes | 0 | 0.0% |
| 40 to 44 Minutes | 0 | 0.0% |
| 45 to 59 Minutes | 0 | 0.0% |
| 60 to 89 Minutes | 0 | 0.0% |
| 90 or more Minutes | 0 | 0.0% |
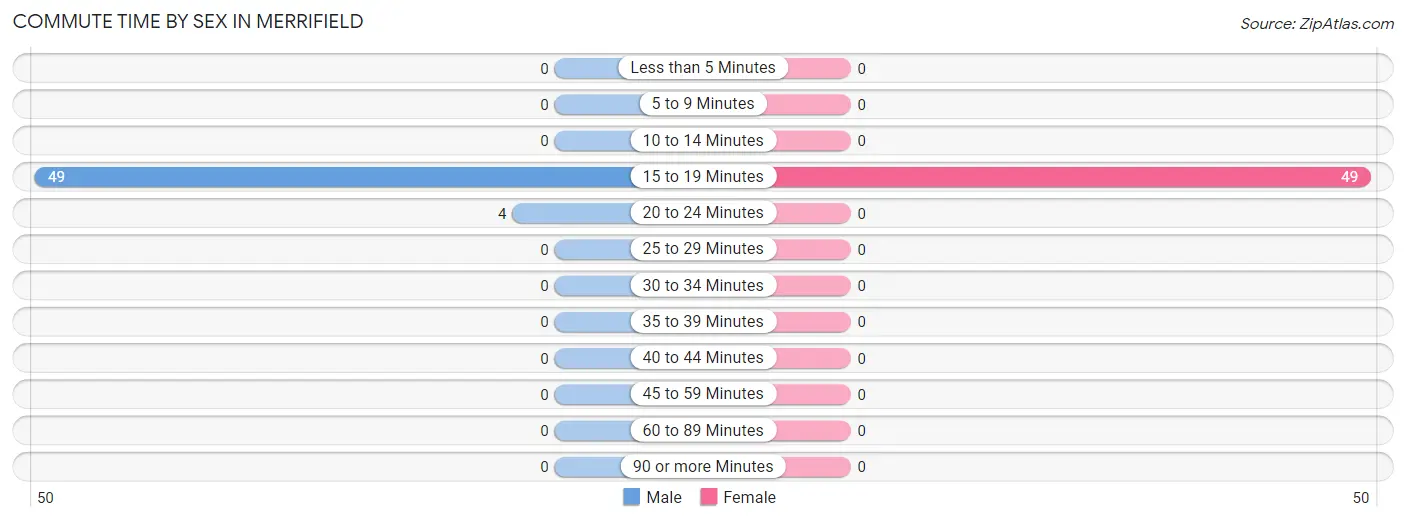
Commute Time by Sex in Merrifield
The most common commute times in Merrifield are 15 to 19 minutes (49 commuters, 92.4%) for males and 15 to 19 minutes (49 commuters, 100.0%) for females.
| Commute Time | Male | Female |
| Less than 5 Minutes | 0 (0.0%) | 0 (0.0%) |
| 5 to 9 Minutes | 0 (0.0%) | 0 (0.0%) |
| 10 to 14 Minutes | 0 (0.0%) | 0 (0.0%) |
| 15 to 19 Minutes | 49 (92.4%) | 49 (100.0%) |
| 20 to 24 Minutes | 4 (7.5%) | 0 (0.0%) |
| 25 to 29 Minutes | 0 (0.0%) | 0 (0.0%) |
| 30 to 34 Minutes | 0 (0.0%) | 0 (0.0%) |
| 35 to 39 Minutes | 0 (0.0%) | 0 (0.0%) |
| 40 to 44 Minutes | 0 (0.0%) | 0 (0.0%) |
| 45 to 59 Minutes | 0 (0.0%) | 0 (0.0%) |
| 60 to 89 Minutes | 0 (0.0%) | 0 (0.0%) |
| 90 or more Minutes | 0 (0.0%) | 0 (0.0%) |
Time of Departure to Work by Sex in Merrifield
The most frequent times of departure to work in Merrifield are 5:00 AM to 5:29 AM (43, 81.1%) for males and 7:00 AM to 7:29 AM (49, 100.0%) for females.
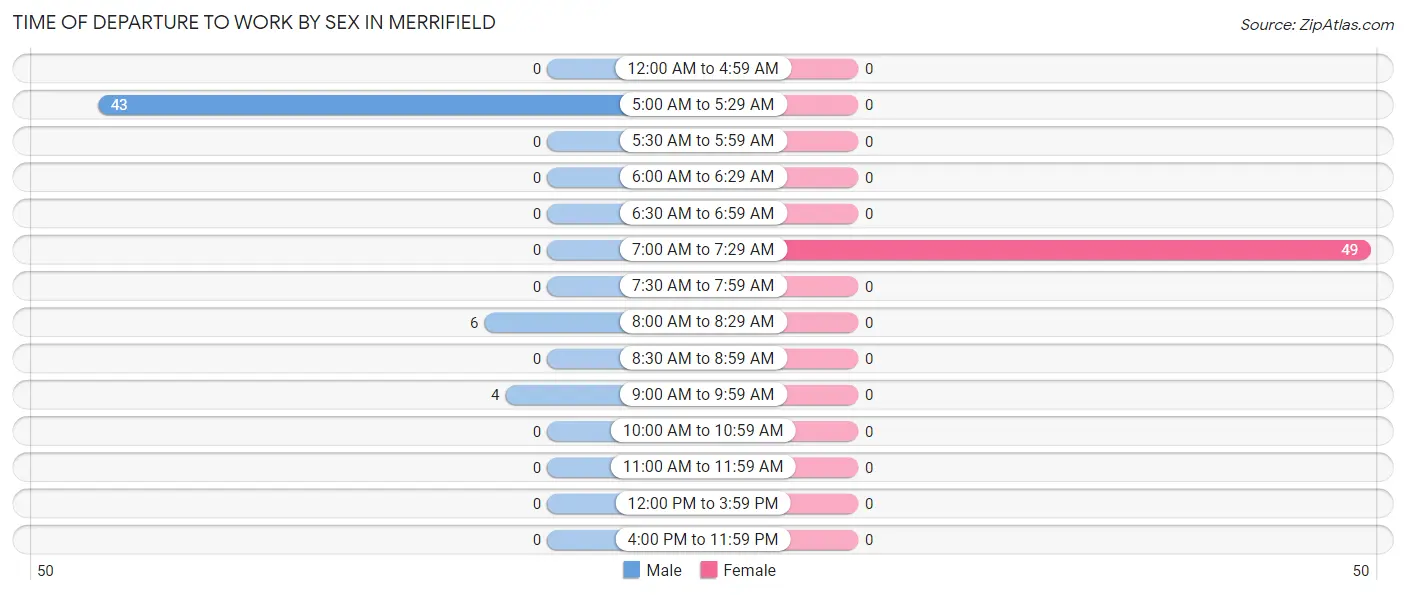
| Time of Departure | Male | Female |
| 12:00 AM to 4:59 AM | 0 (0.0%) | 0 (0.0%) |
| 5:00 AM to 5:29 AM | 43 (81.1%) | 0 (0.0%) |
| 5:30 AM to 5:59 AM | 0 (0.0%) | 0 (0.0%) |
| 6:00 AM to 6:29 AM | 0 (0.0%) | 0 (0.0%) |
| 6:30 AM to 6:59 AM | 0 (0.0%) | 0 (0.0%) |
| 7:00 AM to 7:29 AM | 0 (0.0%) | 49 (100.0%) |
| 7:30 AM to 7:59 AM | 0 (0.0%) | 0 (0.0%) |
| 8:00 AM to 8:29 AM | 6 (11.3%) | 0 (0.0%) |
| 8:30 AM to 8:59 AM | 0 (0.0%) | 0 (0.0%) |
| 9:00 AM to 9:59 AM | 4 (7.5%) | 0 (0.0%) |
| 10:00 AM to 10:59 AM | 0 (0.0%) | 0 (0.0%) |
| 11:00 AM to 11:59 AM | 0 (0.0%) | 0 (0.0%) |
| 12:00 PM to 3:59 PM | 0 (0.0%) | 0 (0.0%) |
| 4:00 PM to 11:59 PM | 0 (0.0%) | 0 (0.0%) |
| Total | 53 (100.0%) | 49 (100.0%) |
Housing Occupancy in Merrifield
Occupancy by Ownership in Merrifield
Of the total 61 dwellings in Merrifield, owner-occupied units account for 61 (100.0%), while renter-occupied units make up 0 (0.0%).
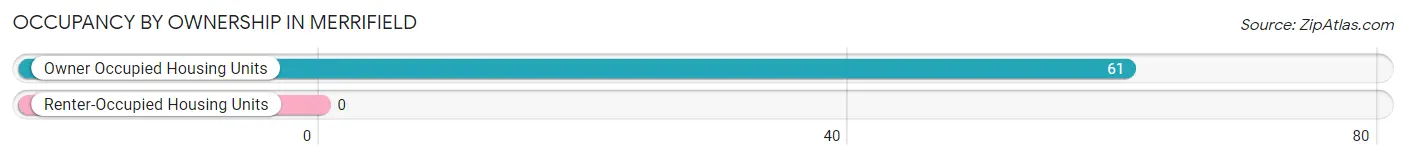
| Occupancy | # Housing Units | % Housing Units |
| Owner Occupied Housing Units | 61 | 100.0% |
| Renter-Occupied Housing Units | 0 | 0.0% |
| Total Occupied Housing Units | 61 | 100.0% |
Occupancy by Household Size in Merrifield
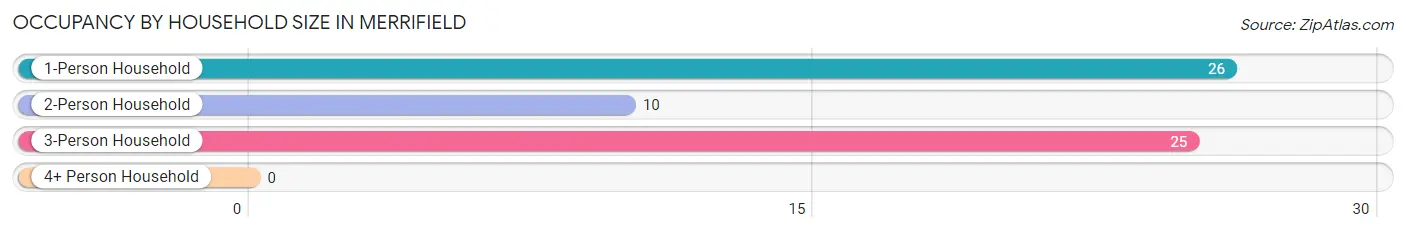
| Household Size | # Housing Units | % Housing Units |
| 1-Person Household | 26 | 42.6% |
| 2-Person Household | 10 | 16.4% |
| 3-Person Household | 25 | 41.0% |
| 4+ Person Household | 0 | 0.0% |
| Total Housing Units | 61 | 100.0% |
Occupancy by Ownership by Household Size in Merrifield
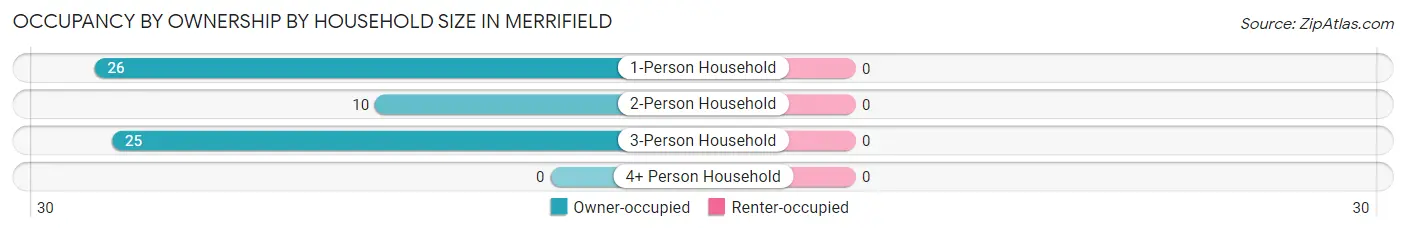
| Household Size | Owner-occupied | Renter-occupied |
| 1-Person Household | 26 (100.0%) | 0 (0.0%) |
| 2-Person Household | 10 (100.0%) | 0 (0.0%) |
| 3-Person Household | 25 (100.0%) | 0 (0.0%) |
| 4+ Person Household | 0 (0.0%) | 0 (0.0%) |
| Total Housing Units | 61 (100.0%) | 0 (0.0%) |
Occupancy by Educational Attainment in Merrifield
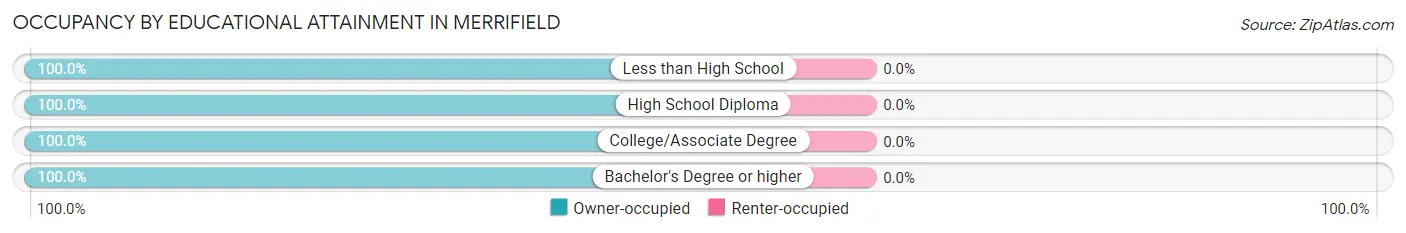
| Household Size | Owner-occupied | Renter-occupied |
| Less than High School | 4 (100.0%) | 0 (0.0%) |
| High School Diploma | 11 (100.0%) | 0 (0.0%) |
| College/Associate Degree | 42 (100.0%) | 0 (0.0%) |
| Bachelor's Degree or higher | 4 (100.0%) | 0 (0.0%) |
Occupancy by Age of Householder in Merrifield
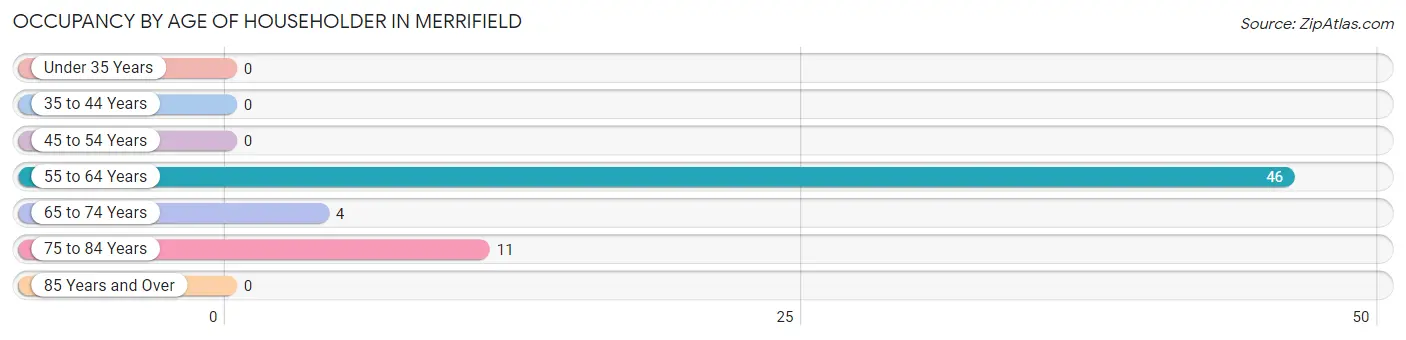
| Age Bracket | # Households | % Households |
| Under 35 Years | 0 | 0.0% |
| 35 to 44 Years | 0 | 0.0% |
| 45 to 54 Years | 0 | 0.0% |
| 55 to 64 Years | 46 | 75.4% |
| 65 to 74 Years | 4 | 6.6% |
| 75 to 84 Years | 11 | 18.0% |
| 85 Years and Over | 0 | 0.0% |
| Total | 61 | 100.0% |
Housing Finances in Merrifield
Median Income by Occupancy in Merrifield
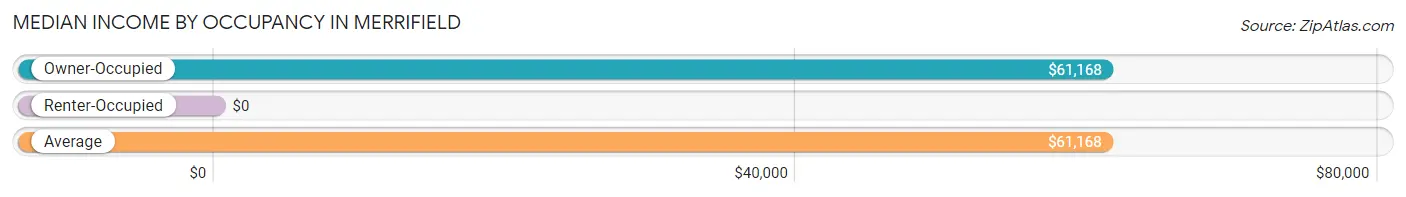
| Occupancy Type | # Households | Median Income |
| Owner-Occupied | 61 (100.0%) | $61,168 |
| Renter-Occupied | 0 (0.0%) | $0 |
| Average | 61 (100.0%) | $61,168 |
Occupancy by Householder Income Bracket in Merrifield
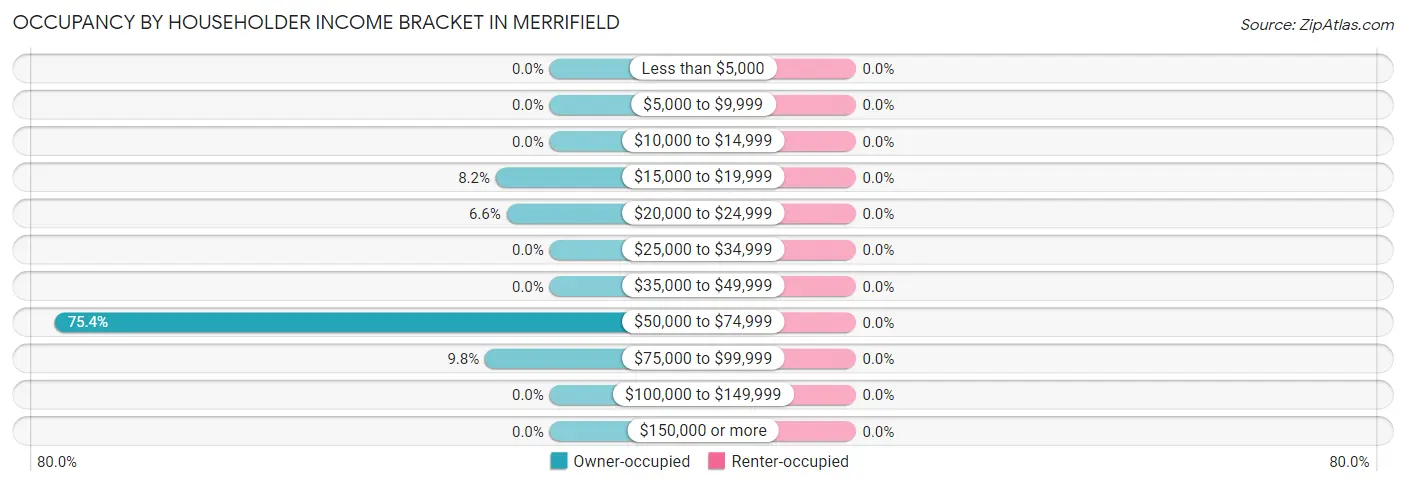
| Income Bracket | Owner-occupied | Renter-occupied |
| Less than $5,000 | 0 (0.0%) | 0 (0.0%) |
| $5,000 to $9,999 | 0 (0.0%) | 0 (0.0%) |
| $10,000 to $14,999 | 0 (0.0%) | 0 (0.0%) |
| $15,000 to $19,999 | 5 (8.2%) | 0 (0.0%) |
| $20,000 to $24,999 | 4 (6.6%) | 0 (0.0%) |
| $25,000 to $34,999 | 0 (0.0%) | 0 (0.0%) |
| $35,000 to $49,999 | 0 (0.0%) | 0 (0.0%) |
| $50,000 to $74,999 | 46 (75.4%) | 0 (0.0%) |
| $75,000 to $99,999 | 6 (9.8%) | 0 (0.0%) |
| $100,000 to $149,999 | 0 (0.0%) | 0 (0.0%) |
| $150,000 or more | 0 (0.0%) | 0 (0.0%) |
| Total | 61 (100.0%) | 0 (0.0%) |
Monthly Housing Cost Tiers in Merrifield
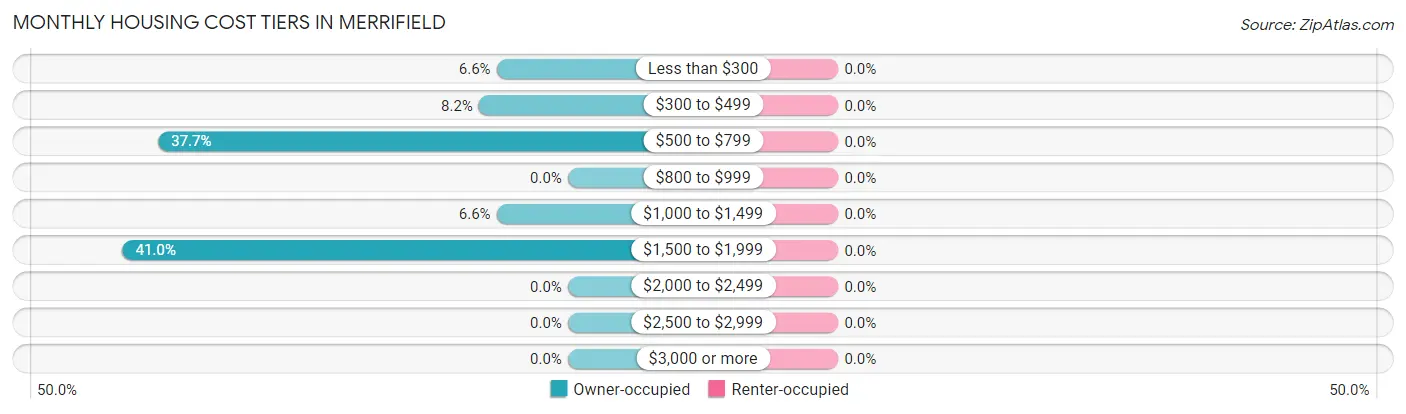
| Monthly Cost | Owner-occupied | Renter-occupied |
| Less than $300 | 4 (6.6%) | 0 (0.0%) |
| $300 to $499 | 5 (8.2%) | 0 (0.0%) |
| $500 to $799 | 23 (37.7%) | 0 (0.0%) |
| $800 to $999 | 0 (0.0%) | 0 (0.0%) |
| $1,000 to $1,499 | 4 (6.6%) | 0 (0.0%) |
| $1,500 to $1,999 | 25 (41.0%) | 0 (0.0%) |
| $2,000 to $2,499 | 0 (0.0%) | 0 (0.0%) |
| $2,500 to $2,999 | 0 (0.0%) | 0 (0.0%) |
| $3,000 or more | 0 (0.0%) | 0 (0.0%) |
| Total | 61 (100.0%) | 0 (0.0%) |
Physical Housing Characteristics in Merrifield
Housing Structures in Merrifield
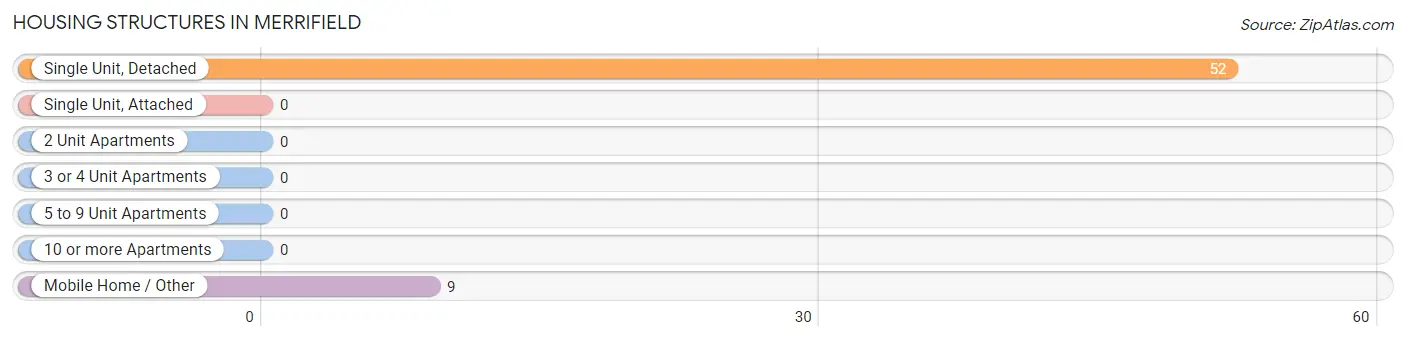
| Structure Type | # Housing Units | % Housing Units |
| Single Unit, Detached | 52 | 85.3% |
| Single Unit, Attached | 0 | 0.0% |
| 2 Unit Apartments | 0 | 0.0% |
| 3 or 4 Unit Apartments | 0 | 0.0% |
| 5 to 9 Unit Apartments | 0 | 0.0% |
| 10 or more Apartments | 0 | 0.0% |
| Mobile Home / Other | 9 | 14.7% |
| Total | 61 | 100.0% |
Housing Structures by Occupancy in Merrifield
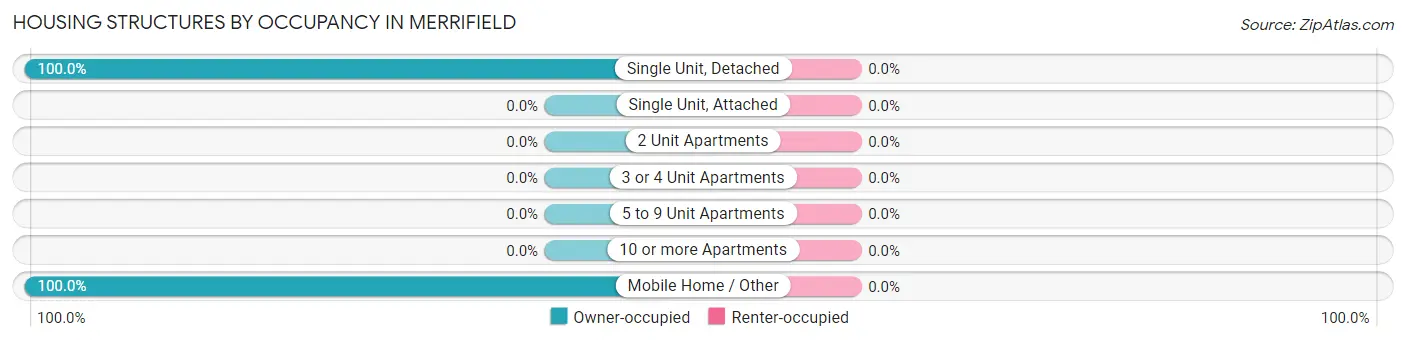
| Structure Type | Owner-occupied | Renter-occupied |
| Single Unit, Detached | 52 (100.0%) | 0 (0.0%) |
| Single Unit, Attached | 0 (0.0%) | 0 (0.0%) |
| 2 Unit Apartments | 0 (0.0%) | 0 (0.0%) |
| 3 or 4 Unit Apartments | 0 (0.0%) | 0 (0.0%) |
| 5 to 9 Unit Apartments | 0 (0.0%) | 0 (0.0%) |
| 10 or more Apartments | 0 (0.0%) | 0 (0.0%) |
| Mobile Home / Other | 9 (100.0%) | 0 (0.0%) |
| Total | 61 (100.0%) | 0 (0.0%) |
Housing Structures by Number of Rooms in Merrifield
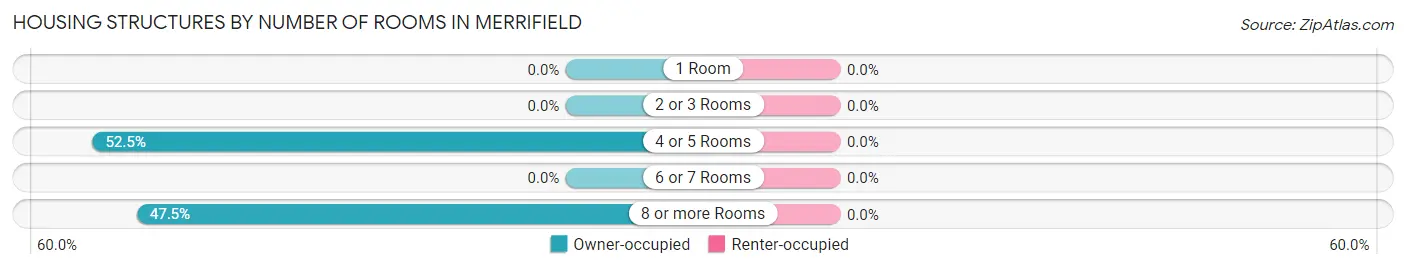
| Number of Rooms | Owner-occupied | Renter-occupied |
| 1 Room | 0 (0.0%) | 0 (0.0%) |
| 2 or 3 Rooms | 0 (0.0%) | 0 (0.0%) |
| 4 or 5 Rooms | 32 (52.5%) | 0 (0.0%) |
| 6 or 7 Rooms | 0 (0.0%) | 0 (0.0%) |
| 8 or more Rooms | 29 (47.5%) | 0 (0.0%) |
| Total | 61 (100.0%) | 0 (0.0%) |
Housing Structure by Heating Type in Merrifield
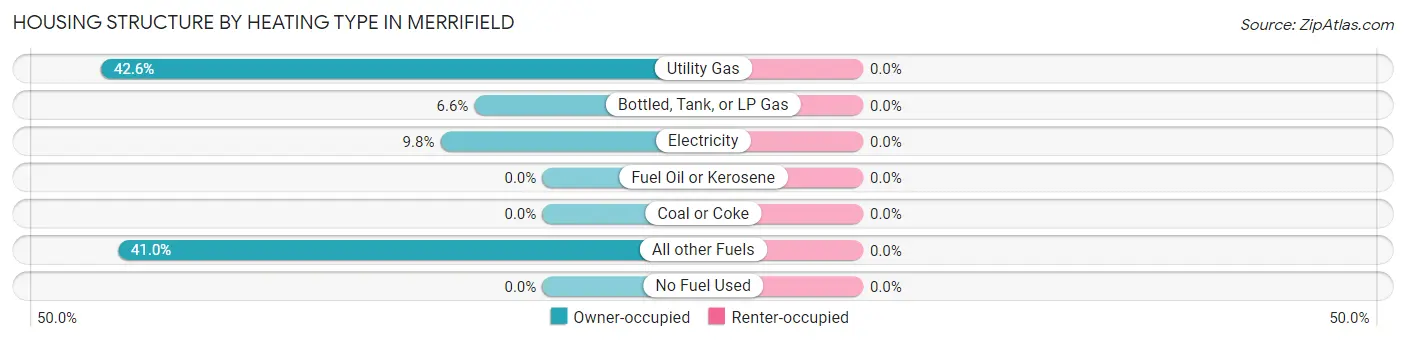
| Heating Type | Owner-occupied | Renter-occupied |
| Utility Gas | 26 (42.6%) | 0 (0.0%) |
| Bottled, Tank, or LP Gas | 4 (6.6%) | 0 (0.0%) |
| Electricity | 6 (9.8%) | 0 (0.0%) |
| Fuel Oil or Kerosene | 0 (0.0%) | 0 (0.0%) |
| Coal or Coke | 0 (0.0%) | 0 (0.0%) |
| All other Fuels | 25 (41.0%) | 0 (0.0%) |
| No Fuel Used | 0 (0.0%) | 0 (0.0%) |
| Total | 61 (100.0%) | 0 (0.0%) |
Household Vehicle Usage in Merrifield
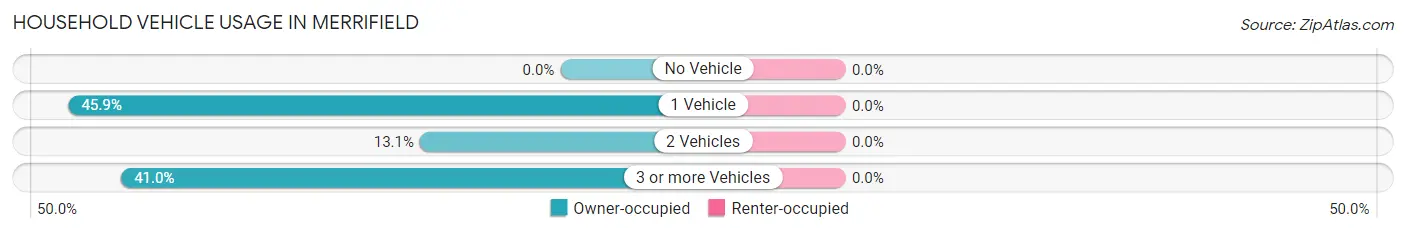
| Vehicles per Household | Owner-occupied | Renter-occupied |
| No Vehicle | 0 (0.0%) | 0 (0.0%) |
| 1 Vehicle | 28 (45.9%) | 0 (0.0%) |
| 2 Vehicles | 8 (13.1%) | 0 (0.0%) |
| 3 or more Vehicles | 25 (41.0%) | 0 (0.0%) |
| Total | 61 (100.0%) | 0 (0.0%) |
Real Estate & Mortgages in Merrifield
Real Estate and Mortgage Overview in Merrifield
| Characteristic | Without Mortgage | With Mortgage |
| Housing Units | 15 | 46 |
| Median Property Value | $142,500 | $520,000 |
| Median Household Income | - | - |
| Monthly Housing Costs | $470 | $0 |
| Real Estate Taxes | $864 | $0 |
Property Value by Mortgage Status in Merrifield
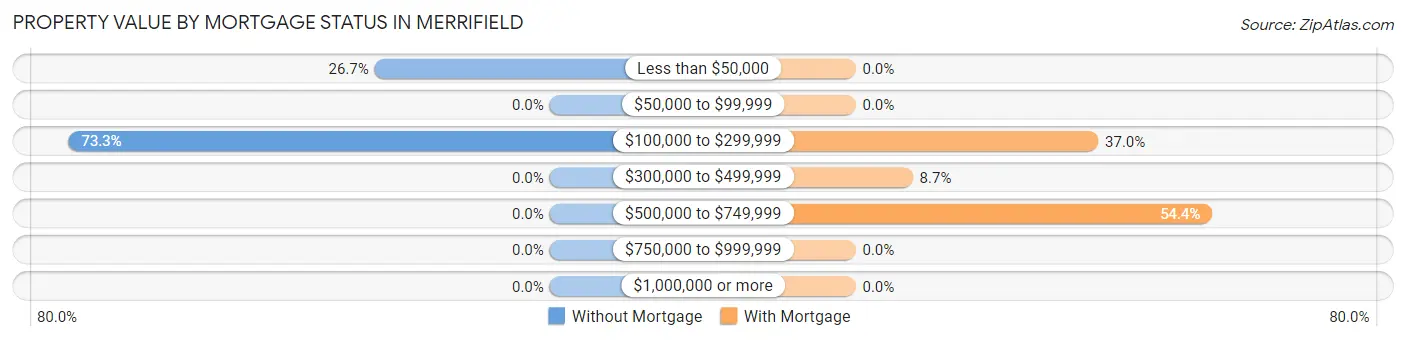
| Property Value | Without Mortgage | With Mortgage |
| Less than $50,000 | 4 (26.7%) | 0 (0.0%) |
| $50,000 to $99,999 | 0 (0.0%) | 0 (0.0%) |
| $100,000 to $299,999 | 11 (73.3%) | 17 (37.0%) |
| $300,000 to $499,999 | 0 (0.0%) | 4 (8.7%) |
| $500,000 to $749,999 | 0 (0.0%) | 25 (54.3%) |
| $750,000 to $999,999 | 0 (0.0%) | 0 (0.0%) |
| $1,000,000 or more | 0 (0.0%) | 0 (0.0%) |
| Total | 15 (100.0%) | 46 (100.0%) |
Household Income by Mortgage Status in Merrifield
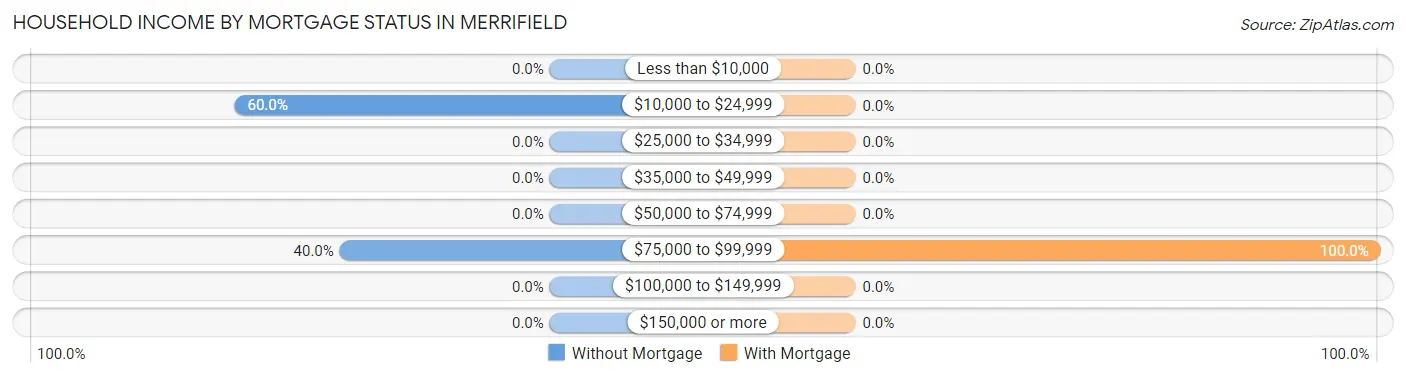
| Household Income | Without Mortgage | With Mortgage |
| Less than $10,000 | 0 (0.0%) | 0 (0.0%) |
| $10,000 to $24,999 | 9 (60.0%) | 0 (0.0%) |
| $25,000 to $34,999 | 0 (0.0%) | 0 (0.0%) |
| $35,000 to $49,999 | 0 (0.0%) | 0 (0.0%) |
| $50,000 to $74,999 | 0 (0.0%) | 0 (0.0%) |
| $75,000 to $99,999 | 6 (40.0%) | 46 (100.0%) |
| $100,000 to $149,999 | 0 (0.0%) | 0 (0.0%) |
| $150,000 or more | 0 (0.0%) | 0 (0.0%) |
| Total | 15 (100.0%) | 46 (100.0%) |
Property Value to Household Income Ratio in Merrifield
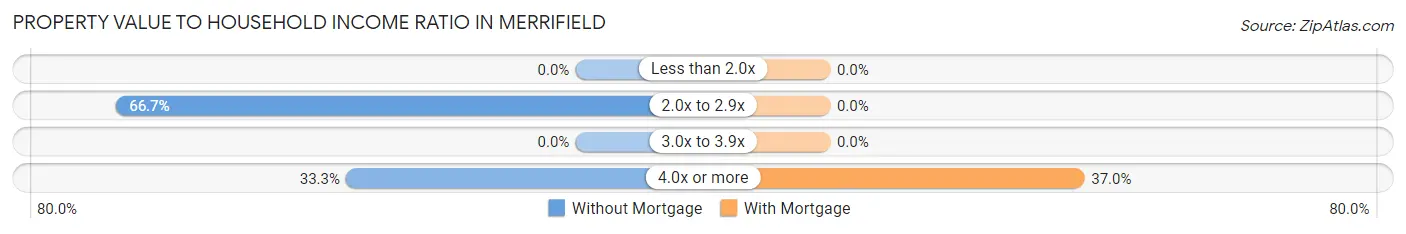
| Value-to-Income Ratio | Without Mortgage | With Mortgage |
| Less than 2.0x | 0 (0.0%) | 0 (0.0%) |
| 2.0x to 2.9x | 10 (66.7%) | 0 (0.0%) |
| 3.0x to 3.9x | 0 (0.0%) | 0 (0.0%) |
| 4.0x or more | 5 (33.3%) | 17 (37.0%) |
| Total | 15 (100.0%) | 46 (100.0%) |
Real Estate Taxes by Mortgage Status in Merrifield
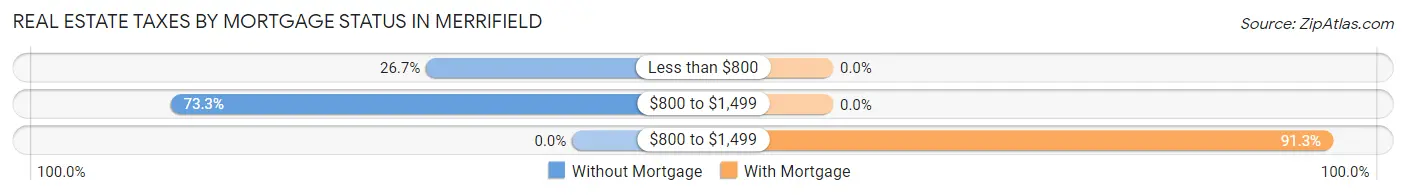
| Property Taxes | Without Mortgage | With Mortgage |
| Less than $800 | 4 (26.7%) | 0 (0.0%) |
| $800 to $1,499 | 11 (73.3%) | 0 (0.0%) |
| $800 to $1,499 | 0 (0.0%) | 42 (91.3%) |
| Total | 15 (100.0%) | 46 (100.0%) |
Health & Disability in Merrifield
Health Insurance Coverage by Age in Merrifield
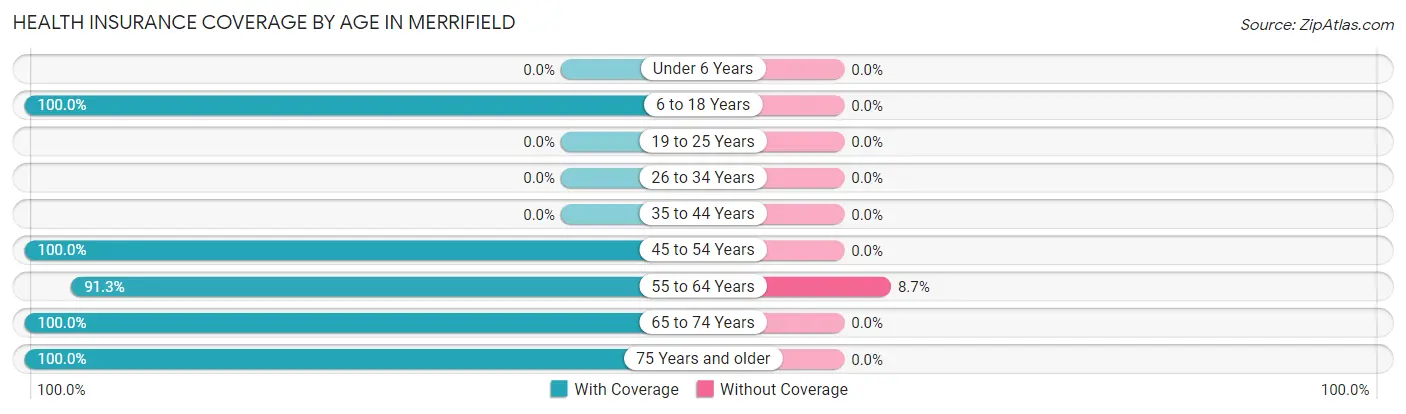
| Age Bracket | With Coverage | Without Coverage |
| Under 6 Years | 0 (0.0%) | 0 (0.0%) |
| 6 to 18 Years | 24 (100.0%) | 0 (0.0%) |
| 19 to 25 Years | 0 (0.0%) | 0 (0.0%) |
| 26 to 34 Years | 0 (0.0%) | 0 (0.0%) |
| 35 to 44 Years | 0 (0.0%) | 0 (0.0%) |
| 45 to 54 Years | 26 (100.0%) | 0 (0.0%) |
| 55 to 64 Years | 42 (91.3%) | 4 (8.7%) |
| 65 to 74 Years | 8 (100.0%) | 0 (0.0%) |
| 75 Years and older | 18 (100.0%) | 0 (0.0%) |
| Total | 118 (96.7%) | 4 (3.3%) |
Health Insurance Coverage by Citizenship Status in Merrifield
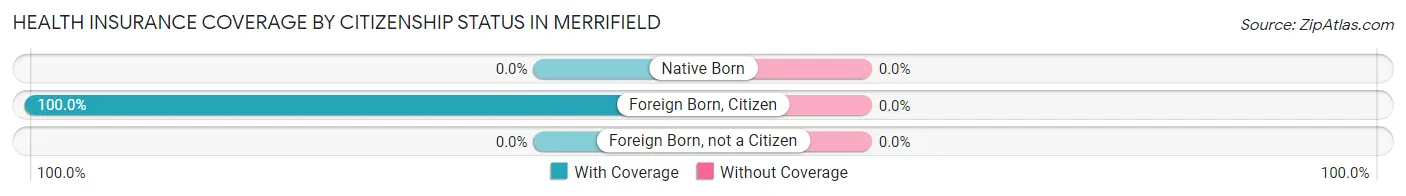
| Citizenship Status | With Coverage | Without Coverage |
| Native Born | 0 (0.0%) | 0 (0.0%) |
| Foreign Born, Citizen | 24 (100.0%) | 0 (0.0%) |
| Foreign Born, not a Citizen | 0 (0.0%) | 0 (0.0%) |
Health Insurance Coverage by Household Income in Merrifield
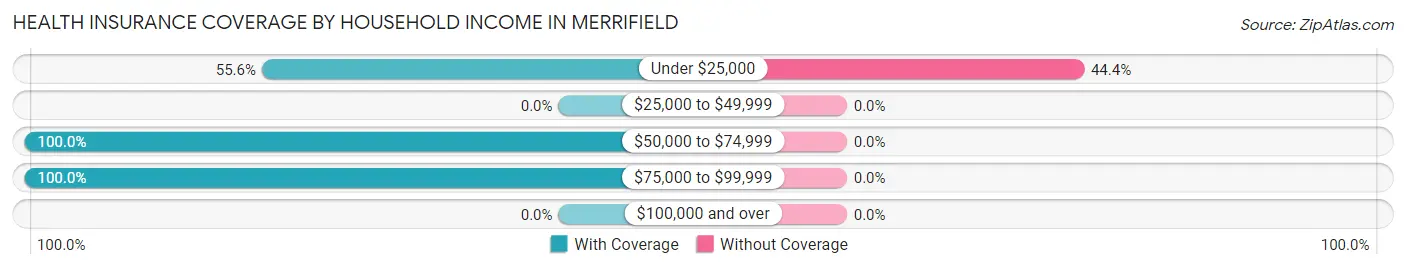
| Household Income | With Coverage | Without Coverage |
| Under $25,000 | 5 (55.6%) | 4 (44.4%) |
| $25,000 to $49,999 | 0 (0.0%) | 0 (0.0%) |
| $50,000 to $74,999 | 100 (100.0%) | 0 (0.0%) |
| $75,000 to $99,999 | 13 (100.0%) | 0 (0.0%) |
| $100,000 and over | 0 (0.0%) | 0 (0.0%) |
Public vs Private Health Insurance Coverage by Age in Merrifield
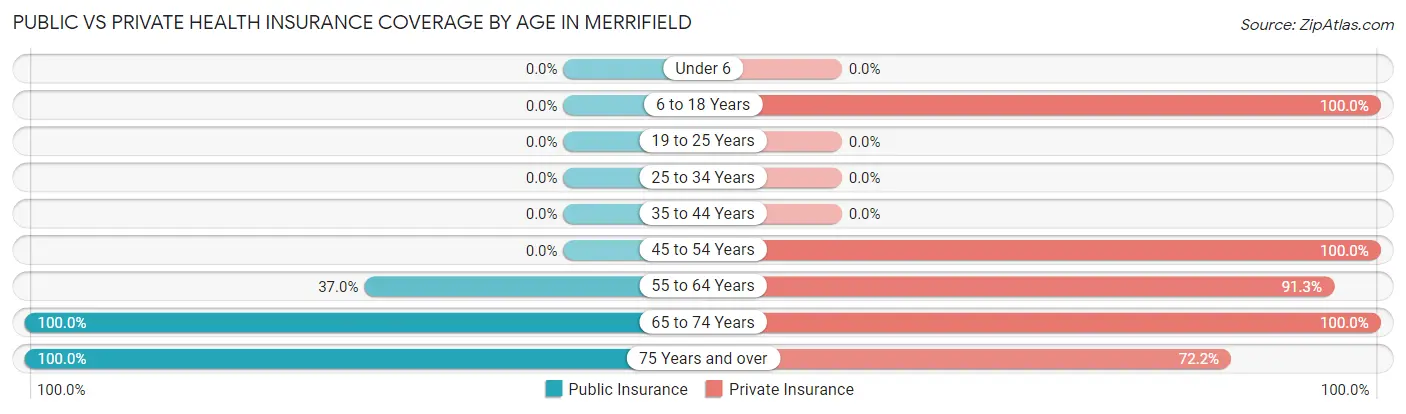
| Age Bracket | Public Insurance | Private Insurance |
| Under 6 | 0 (0.0%) | 0 (0.0%) |
| 6 to 18 Years | 0 (0.0%) | 24 (100.0%) |
| 19 to 25 Years | 0 (0.0%) | 0 (0.0%) |
| 25 to 34 Years | 0 (0.0%) | 0 (0.0%) |
| 35 to 44 Years | 0 (0.0%) | 0 (0.0%) |
| 45 to 54 Years | 0 (0.0%) | 26 (100.0%) |
| 55 to 64 Years | 17 (37.0%) | 42 (91.3%) |
| 65 to 74 Years | 8 (100.0%) | 8 (100.0%) |
| 75 Years and over | 18 (100.0%) | 13 (72.2%) |
| Total | 43 (35.2%) | 113 (92.6%) |
Disability Status by Sex by Age in Merrifield
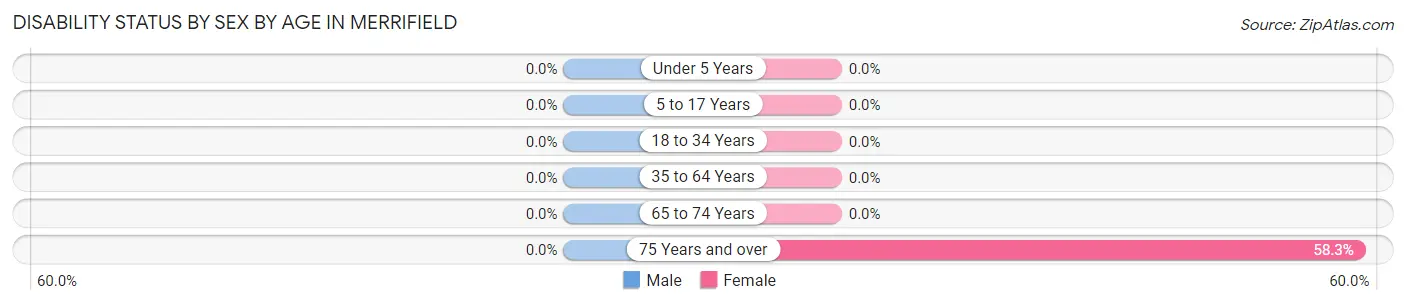
| Age Bracket | Male | Female |
| Under 5 Years | 0 (0.0%) | 0 (0.0%) |
| 5 to 17 Years | 0 (0.0%) | 0 (0.0%) |
| 18 to 34 Years | 0 (0.0%) | 0 (0.0%) |
| 35 to 64 Years | 0 (0.0%) | 0 (0.0%) |
| 65 to 74 Years | 0 (0.0%) | 0 (0.0%) |
| 75 Years and over | 0 (0.0%) | 7 (58.3%) |
Disability Class by Sex by Age in Merrifield
Disability Class: Hearing Difficulty
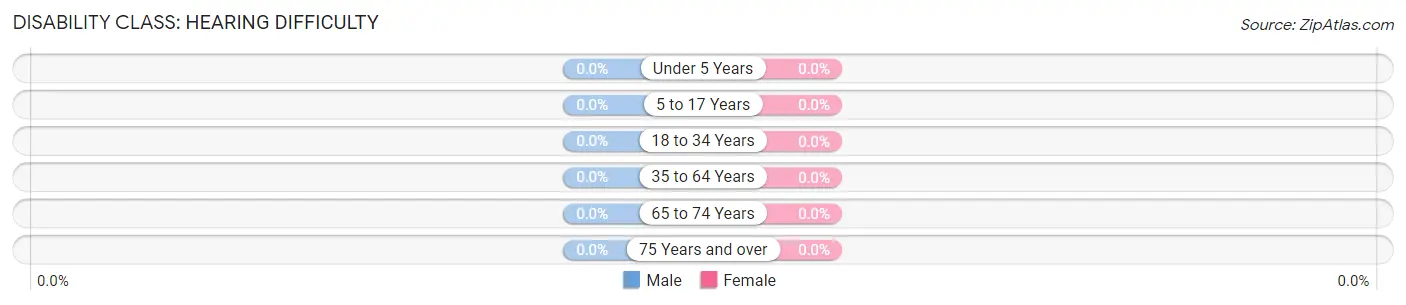
| Age Bracket | Male | Female |
| Under 5 Years | 0 (0.0%) | 0 (0.0%) |
| 5 to 17 Years | 0 (0.0%) | 0 (0.0%) |
| 18 to 34 Years | 0 (0.0%) | 0 (0.0%) |
| 35 to 64 Years | 0 (0.0%) | 0 (0.0%) |
| 65 to 74 Years | 0 (0.0%) | 0 (0.0%) |
| 75 Years and over | 0 (0.0%) | 0 (0.0%) |
Disability Class: Vision Difficulty
| Age Bracket | Male | Female |
| Under 5 Years | 0 (0.0%) | 0 (0.0%) |
| 5 to 17 Years | 0 (0.0%) | 0 (0.0%) |
| 18 to 34 Years | 0 (0.0%) | 0 (0.0%) |
| 35 to 64 Years | 0 (0.0%) | 0 (0.0%) |
| 65 to 74 Years | 0 (0.0%) | 0 (0.0%) |
| 75 Years and over | 0 (0.0%) | 0 (0.0%) |
Disability Class: Cognitive Difficulty
| Age Bracket | Male | Female |
| 5 to 17 Years | 0 (0.0%) | 0 (0.0%) |
| 18 to 34 Years | 0 (0.0%) | 0 (0.0%) |
| 35 to 64 Years | 0 (0.0%) | 0 (0.0%) |
| 65 to 74 Years | 0 (0.0%) | 0 (0.0%) |
| 75 Years and over | 0 (0.0%) | 0 (0.0%) |
Disability Class: Ambulatory Difficulty
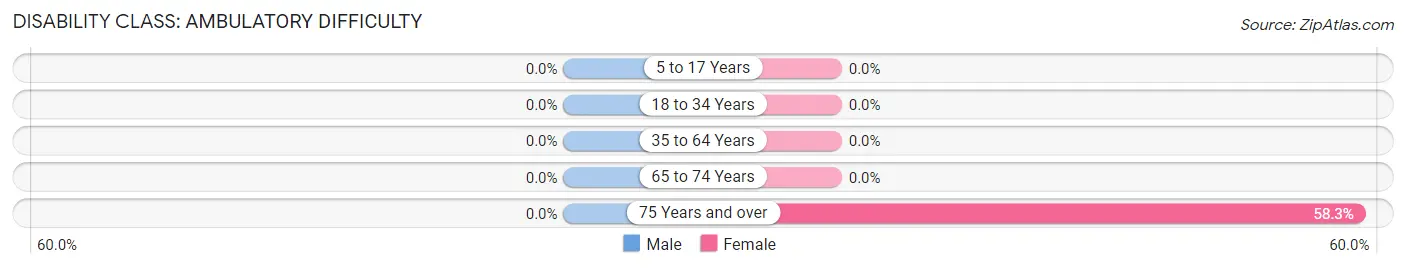
| Age Bracket | Male | Female |
| 5 to 17 Years | 0 (0.0%) | 0 (0.0%) |
| 18 to 34 Years | 0 (0.0%) | 0 (0.0%) |
| 35 to 64 Years | 0 (0.0%) | 0 (0.0%) |
| 65 to 74 Years | 0 (0.0%) | 0 (0.0%) |
| 75 Years and over | 0 (0.0%) | 7 (58.3%) |
Disability Class: Self-Care Difficulty

| Age Bracket | Male | Female |
| 5 to 17 Years | 0 (0.0%) | 0 (0.0%) |
| 18 to 34 Years | 0 (0.0%) | 0 (0.0%) |
| 35 to 64 Years | 0 (0.0%) | 0 (0.0%) |
| 65 to 74 Years | 0 (0.0%) | 0 (0.0%) |
| 75 Years and over | 0 (0.0%) | 0 (0.0%) |
Technology Access in Merrifield
Computing Device Access in Merrifield
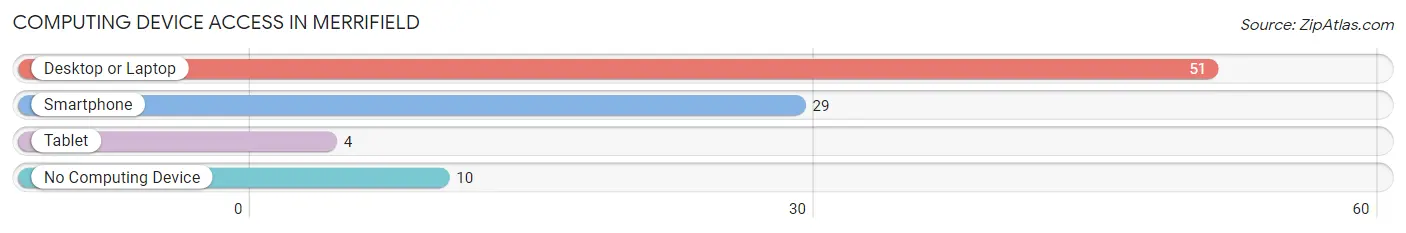
| Device Type | # Households | % Households |
| Desktop or Laptop | 51 | 83.6% |
| Smartphone | 29 | 47.5% |
| Tablet | 4 | 6.6% |
| No Computing Device | 10 | 16.4% |
| Total | 61 | 100.0% |
Internet Access in Merrifield
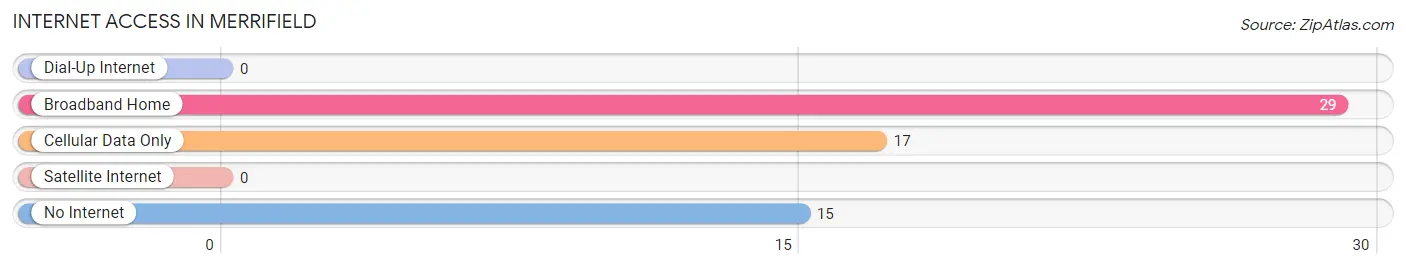
| Internet Type | # Households | % Households |
| Dial-Up Internet | 0 | 0.0% |
| Broadband Home | 29 | 47.5% |
| Cellular Data Only | 17 | 27.9% |
| Satellite Internet | 0 | 0.0% |
| No Internet | 15 | 24.6% |
| Total | 61 | 100.0% |
Merrifield Summary
Merrifield is a small unincorporated community located in Crow Wing County, Minnesota, United States. It is situated on the south shore of the Whitefish Chain of Lakes, and is part of the Brainerd Micropolitan Statistical Area. The population of Merrifield was estimated to be around 1,000 in 2000.
History
Merrifield was first settled in the late 1800s by a group of settlers from Wisconsin. The town was named after the Merrifield family, who were among the first settlers. The town was officially incorporated in 1891.
In the early 1900s, Merrifield was a thriving logging and farming community. The town was home to several sawmills, a grist mill, a creamery, and a general store. The town also had a post office, a school, and a church.
In the 1950s, the town began to decline as the logging industry moved away from the area. The population of Merrifield decreased significantly, and many of the businesses closed.
Geography
Merrifield is located in the north-central part of Crow Wing County, Minnesota. It is situated on the south shore of the Whitefish Chain of Lakes, which is a chain of 14 interconnected lakes. The town is located approximately 10 miles north of Brainerd, the county seat.
The terrain around Merrifield is mostly flat, with some rolling hills. The town is surrounded by forests and lakes, and is a popular destination for outdoor recreation.
Economy
Merrifield’s economy is largely based on tourism and recreation. The town is a popular destination for fishing, boating, and other outdoor activities. There are several resorts and campgrounds in the area, as well as a marina.
The town also has several small businesses, including a grocery store, a hardware store, and a gas station.
Demographics
As of the 2000 census, the population of Merrifield was estimated to be around 1,000. The racial makeup of the town was 97.7% White, 0.3% African American, 0.2% Native American, 0.2% Asian, and 1.6% from other races.
The median household income in Merrifield was $37,500, and the median family income was $41,250. The per capita income was $17,818. About 8.3% of families and 10.2% of the population were below the poverty line.
Common Questions
What is Per Capita Income in Merrifield?
Per Capita income in Merrifield is $29,070.
What is the Median Family Income in Merrifield?
Median Family Income in Merrifield is $61,509.
What is the Median Household income in Merrifield?
Median Household Income in Merrifield is $61,168.
What is Inequality or Gini Index in Merrifield?
Inequality or Gini Index in Merrifield is 0.12.
What is the Total Population of Merrifield?
Total Population of Merrifield is 122.
What is the Total Male Population of Merrifield?
Total Male Population of Merrifield is 57.
What is the Total Female Population of Merrifield?
Total Female Population of Merrifield is 65.
What is the Ratio of Males per 100 Females in Merrifield?
There are 87.69 Males per 100 Females in Merrifield.
What is the Ratio of Females per 100 Males in Merrifield?
There are 114.04 Females per 100 Males in Merrifield.
What is the Median Population Age in Merrifield?
Median Population Age in Merrifield is 55.4 Years.
What is the Average Family Size in Merrifield
Average Family Size in Merrifield is 2.7 People.
What is the Average Household Size in Merrifield
Average Household Size in Merrifield is 2.0 People.
How Large is the Labor Force in Merrifield?
There are 102 People in the Labor Forcein in Merrifield.
What is the Percentage of People in the Labor Force in Merrifield?
83.6% of People are in the Labor Force in Merrifield.