Miesville, MN Map & Demographics
Miesville Map
Miesville Overview
$36,779
PER CAPITA INCOME
$111,250
AVG FAMILY INCOME
$89,063
AVG HOUSEHOLD INCOME
0.33
INEQUALITY / GINI INDEX
114
TOTAL POPULATION
53
MALE POPULATION
61
FEMALE POPULATION
86.89
MALES / 100 FEMALES
115.09
FEMALES / 100 MALES
38.8
MEDIAN AGE
3.1
AVG FAMILY SIZE
2.2
AVG HOUSEHOLD SIZE
53
LABOR FORCE [ PEOPLE ]
68.8%
PERCENT IN LABOR FORCE
3.8%
UNEMPLOYMENT RATE
Income in Miesville
Income Overview in Miesville
Per Capita Income in Miesville is $36,779, while median incomes of families and households are $111,250 and $89,063 respectively.
| Characteristic | Number | Measure |
| Per Capita Income | 114 | $36,779 |
| Median Family Income | 28 | $111,250 |
| Mean Family Income | 28 | $118,061 |
| Median Household Income | 51 | $89,063 |
| Mean Household Income | 51 | $99,549 |
| Income Deficit | 28 | $0 |
| Wage / Income Gap (%) | 114 | 0.00% |
| Wage / Income Gap ($) | 114 | 100.00¢ per $1 |
| Gini / Inequality Index | 114 | 0.33 |
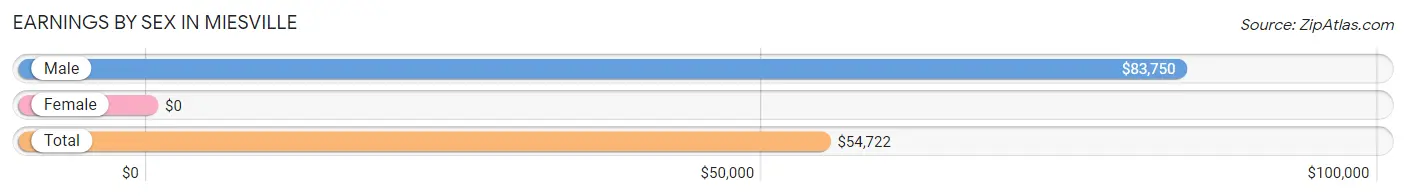
Earnings by Sex in Miesville
| Sex | Number | Average Earnings |
| Male | 32 (55.2%) | $83,750 |
| Female | 26 (44.8%) | $0 |
| Total | 58 (100.0%) | $54,722 |
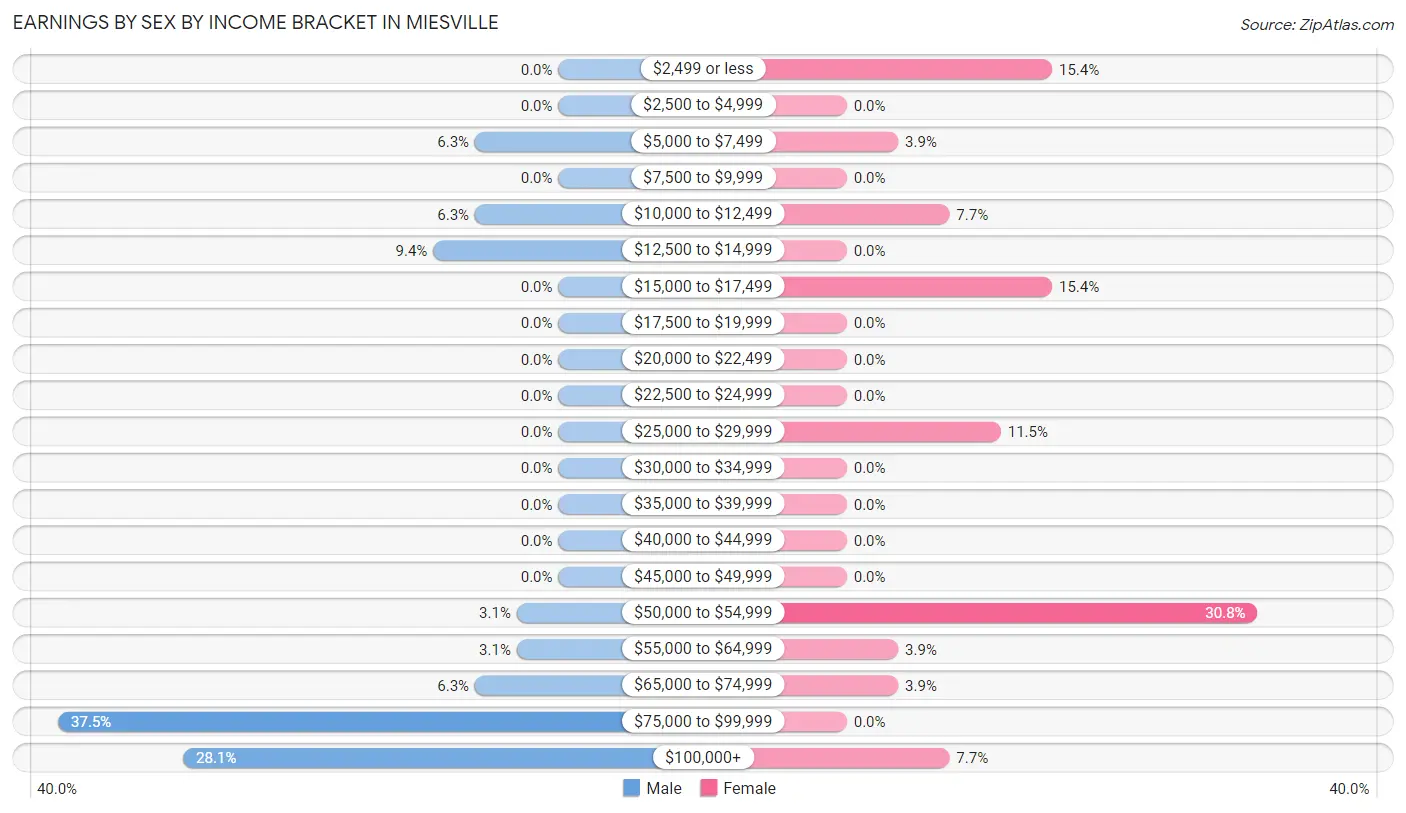
Earnings by Sex by Income Bracket in Miesville
The most common earnings brackets in Miesville are $75,000 to $99,999 for men (12 | 37.5%) and $50,000 to $54,999 for women (8 | 30.8%).
| Income | Male | Female |
| $2,499 or less | 0 (0.0%) | 4 (15.4%) |
| $2,500 to $4,999 | 0 (0.0%) | 0 (0.0%) |
| $5,000 to $7,499 | 2 (6.2%) | 1 (3.8%) |
| $7,500 to $9,999 | 0 (0.0%) | 0 (0.0%) |
| $10,000 to $12,499 | 2 (6.2%) | 2 (7.7%) |
| $12,500 to $14,999 | 3 (9.4%) | 0 (0.0%) |
| $15,000 to $17,499 | 0 (0.0%) | 4 (15.4%) |
| $17,500 to $19,999 | 0 (0.0%) | 0 (0.0%) |
| $20,000 to $22,499 | 0 (0.0%) | 0 (0.0%) |
| $22,500 to $24,999 | 0 (0.0%) | 0 (0.0%) |
| $25,000 to $29,999 | 0 (0.0%) | 3 (11.5%) |
| $30,000 to $34,999 | 0 (0.0%) | 0 (0.0%) |
| $35,000 to $39,999 | 0 (0.0%) | 0 (0.0%) |
| $40,000 to $44,999 | 0 (0.0%) | 0 (0.0%) |
| $45,000 to $49,999 | 0 (0.0%) | 0 (0.0%) |
| $50,000 to $54,999 | 1 (3.1%) | 8 (30.8%) |
| $55,000 to $64,999 | 1 (3.1%) | 1 (3.8%) |
| $65,000 to $74,999 | 2 (6.2%) | 1 (3.8%) |
| $75,000 to $99,999 | 12 (37.5%) | 0 (0.0%) |
| $100,000+ | 9 (28.1%) | 2 (7.7%) |
| Total | 32 (100.0%) | 26 (100.0%) |
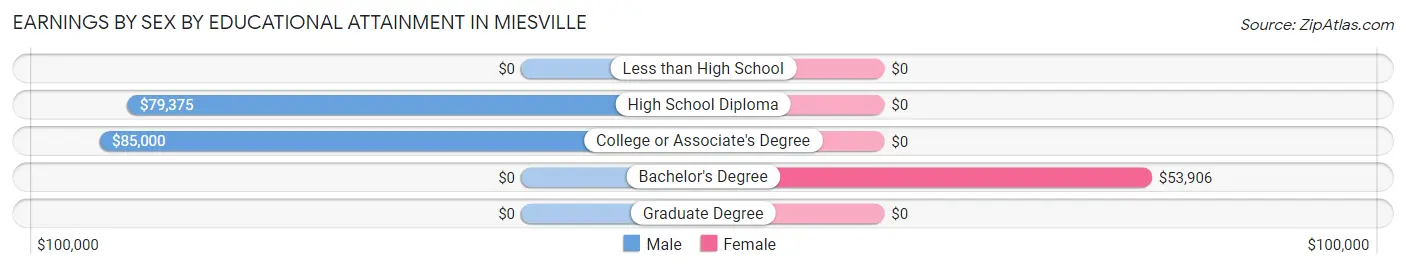
Earnings by Sex by Educational Attainment in Miesville
| Educational Attainment | Male Income | Female Income |
| Less than High School | - | - |
| High School Diploma | $79,375 | $0 |
| College or Associate's Degree | $85,000 | $0 |
| Bachelor's Degree | - | - |
| Graduate Degree | - | - |
| Total | $85,313 | $0 |
Family Income in Miesville
Family Income Brackets in Miesville
According to the Miesville family income data, there are 13 families falling into the $150,000 to $199,999 income range, which is the most common income bracket and makes up 46.4% of all families.
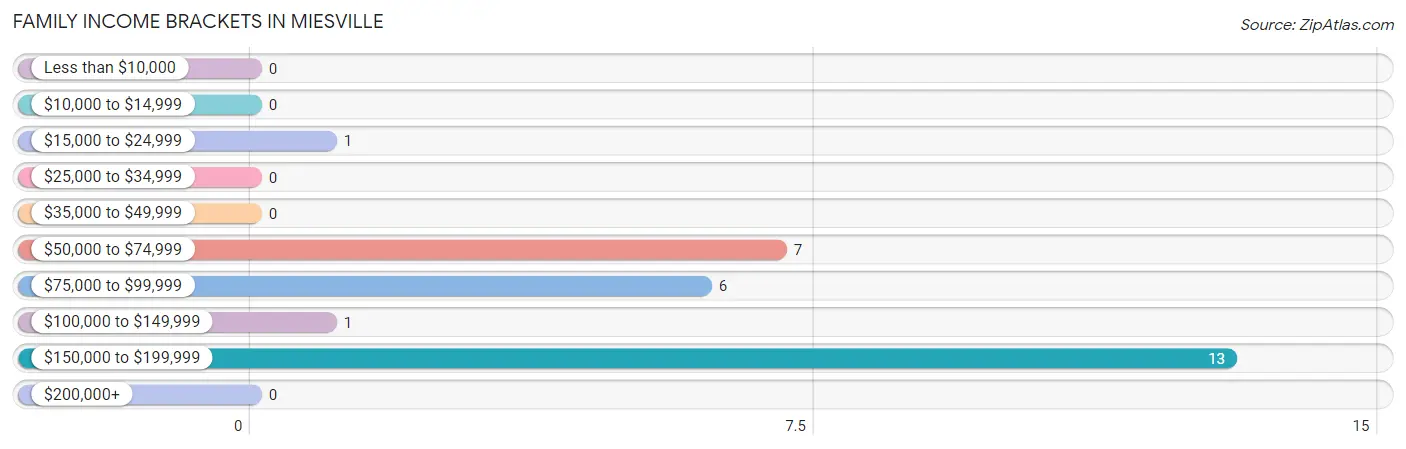
| Income Bracket | # Families | % Families |
| Less than $10,000 | 0 | 0.0% |
| $10,000 to $14,999 | 0 | 0.0% |
| $15,000 to $24,999 | 1 | 3.6% |
| $25,000 to $34,999 | 0 | 0.0% |
| $35,000 to $49,999 | 0 | 0.0% |
| $50,000 to $74,999 | 7 | 25.0% |
| $75,000 to $99,999 | 6 | 21.4% |
| $100,000 to $149,999 | 1 | 3.6% |
| $150,000 to $199,999 | 13 | 46.4% |
| $200,000+ | 0 | 0.0% |
Family Income by Famaliy Size in Miesville
5-person families (13 | 46.4%) account for the highest median family income in Miesville with $167,969 per family, while 5-person families (13 | 46.4%) have the highest median income of $33,594 per family member.
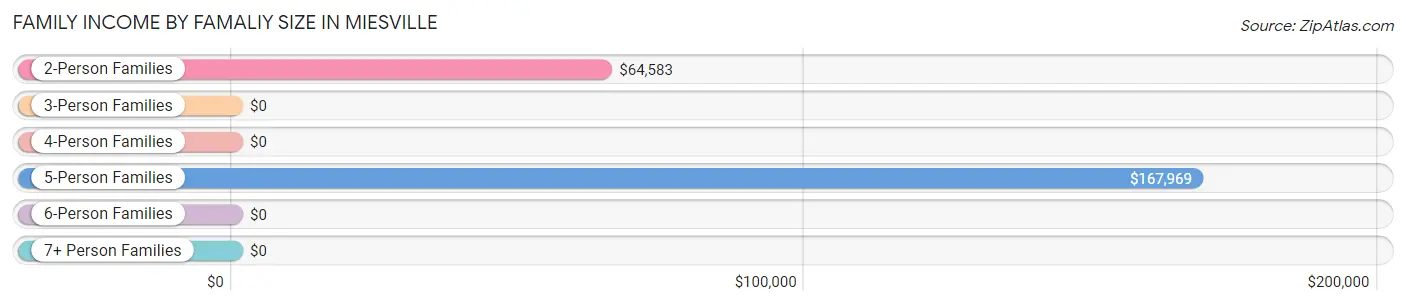
| Income Bracket | # Families | Median Income |
| 2-Person Families | 13 (46.4%) | $64,583 |
| 3-Person Families | 2 (7.1%) | $0 |
| 4-Person Families | 0 (0.0%) | $0 |
| 5-Person Families | 13 (46.4%) | $167,969 |
| 6-Person Families | 0 (0.0%) | $0 |
| 7+ Person Families | 0 (0.0%) | $0 |
| Total | 28 (100.0%) | $111,250 |
Family Income by Number of Earners in Miesville
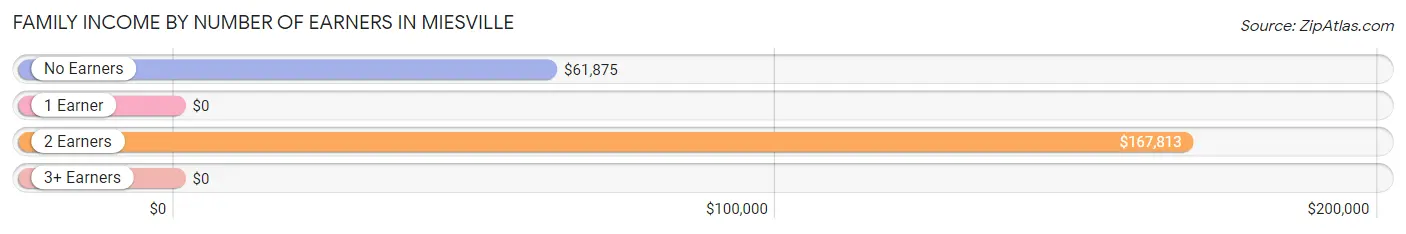
| Number of Earners | # Families | Median Income |
| No Earners | 5 (17.9%) | $61,875 |
| 1 Earner | 2 (7.1%) | $0 |
| 2 Earners | 18 (64.3%) | $167,813 |
| 3+ Earners | 3 (10.7%) | $0 |
| Total | 28 (100.0%) | $111,250 |
Household Income in Miesville
Household Income Brackets in Miesville
With 13 households falling in the category, the $150,000 to $199,999 income range is the most frequent in Miesville, accounting for 25.5% of all households.
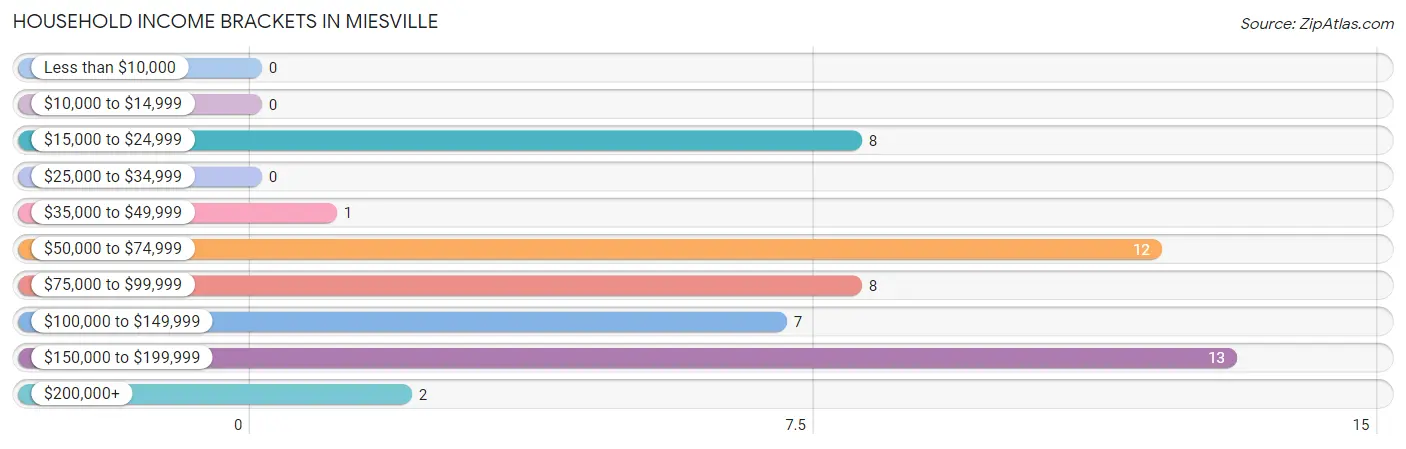
| Income Bracket | # Households | % Households |
| Less than $10,000 | 0 | 0.0% |
| $10,000 to $14,999 | 0 | 0.0% |
| $15,000 to $24,999 | 8 | 15.7% |
| $25,000 to $34,999 | 0 | 0.0% |
| $35,000 to $49,999 | 1 | 2.0% |
| $50,000 to $74,999 | 12 | 23.5% |
| $75,000 to $99,999 | 8 | 15.7% |
| $100,000 to $149,999 | 7 | 13.7% |
| $150,000 to $199,999 | 13 | 25.5% |
| $200,000+ | 2 | 3.9% |
Household Income by Householder Age in Miesville
The median household income in Miesville is $89,063, with the highest median household income of $141,250 found in the 45 to 64 years age bracket for the primary householder. A total of 10 households (19.6%) fall into this category. Meanwhile, the 15 to 24 years age bracket for the primary householder has the lowest median household income of $0, with 3 households (5.9%) in this group.
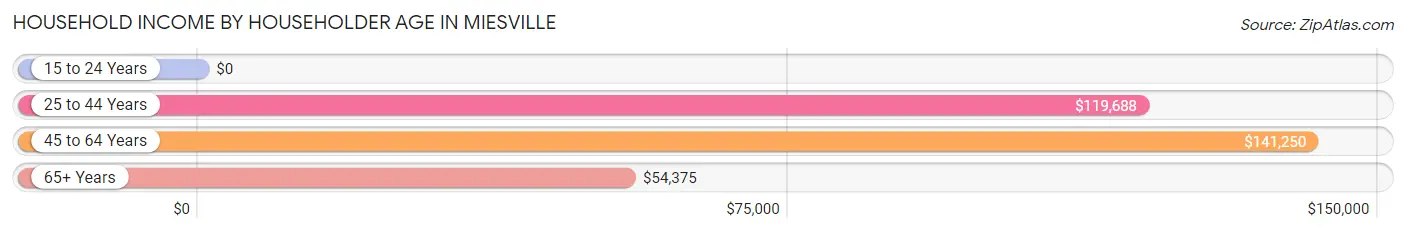
| Income Bracket | # Households | Median Income |
| 15 to 24 Years | 3 (5.9%) | $0 |
| 25 to 44 Years | 21 (41.2%) | $119,688 |
| 45 to 64 Years | 10 (19.6%) | $141,250 |
| 65+ Years | 17 (33.3%) | $54,375 |
| Total | 51 (100.0%) | $89,063 |
Poverty in Miesville
Income Below Poverty by Sex and Age in Miesville
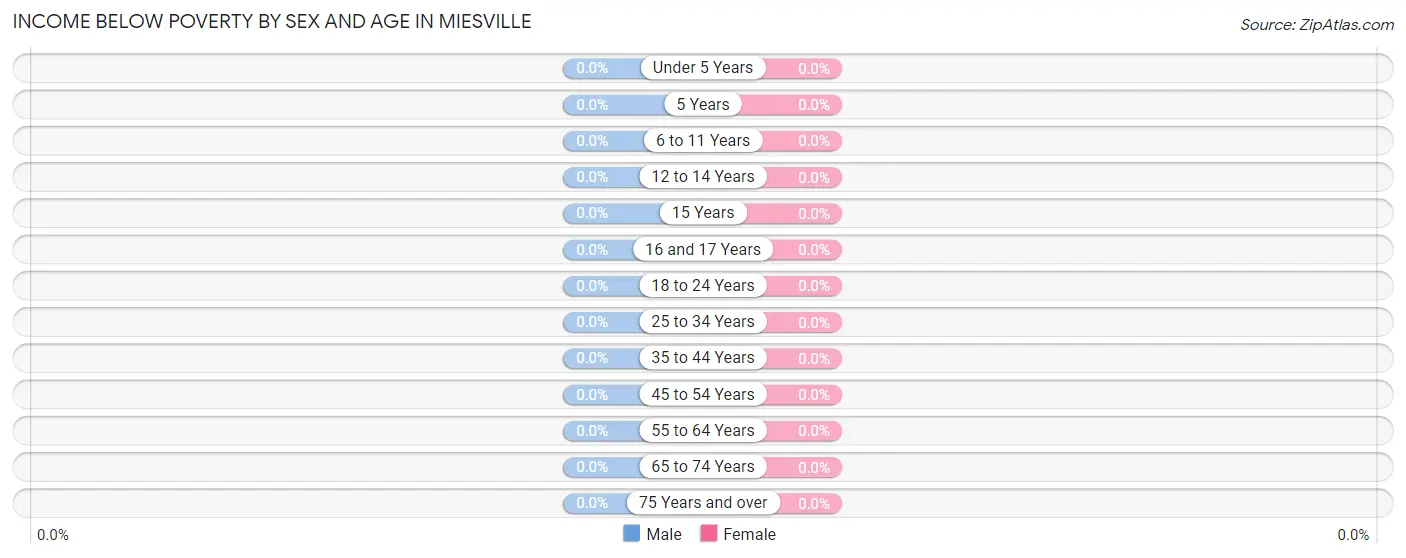
| Age Bracket | Male | Female |
| Under 5 Years | 0 (0.0%) | 0 (0.0%) |
| 5 Years | 0 (0.0%) | 0 (0.0%) |
| 6 to 11 Years | 0 (0.0%) | 0 (0.0%) |
| 12 to 14 Years | 0 (0.0%) | 0 (0.0%) |
| 15 Years | 0 (0.0%) | 0 (0.0%) |
| 16 and 17 Years | 0 (0.0%) | 0 (0.0%) |
| 18 to 24 Years | 0 (0.0%) | 0 (0.0%) |
| 25 to 34 Years | 0 (0.0%) | 0 (0.0%) |
| 35 to 44 Years | 0 (0.0%) | 0 (0.0%) |
| 45 to 54 Years | 0 (0.0%) | 0 (0.0%) |
| 55 to 64 Years | 0 (0.0%) | 0 (0.0%) |
| 65 to 74 Years | 0 (0.0%) | 0 (0.0%) |
| 75 Years and over | 0 (0.0%) | 0 (0.0%) |
| Total | 0 (0.0%) | 0 (0.0%) |
Income Above Poverty by Sex and Age in Miesville
According to the poverty statistics in Miesville, males aged under 5 years and females aged under 5 years are the age groups that are most secure financially, with 100.0% of males and 100.0% of females in these age groups living above the poverty line.
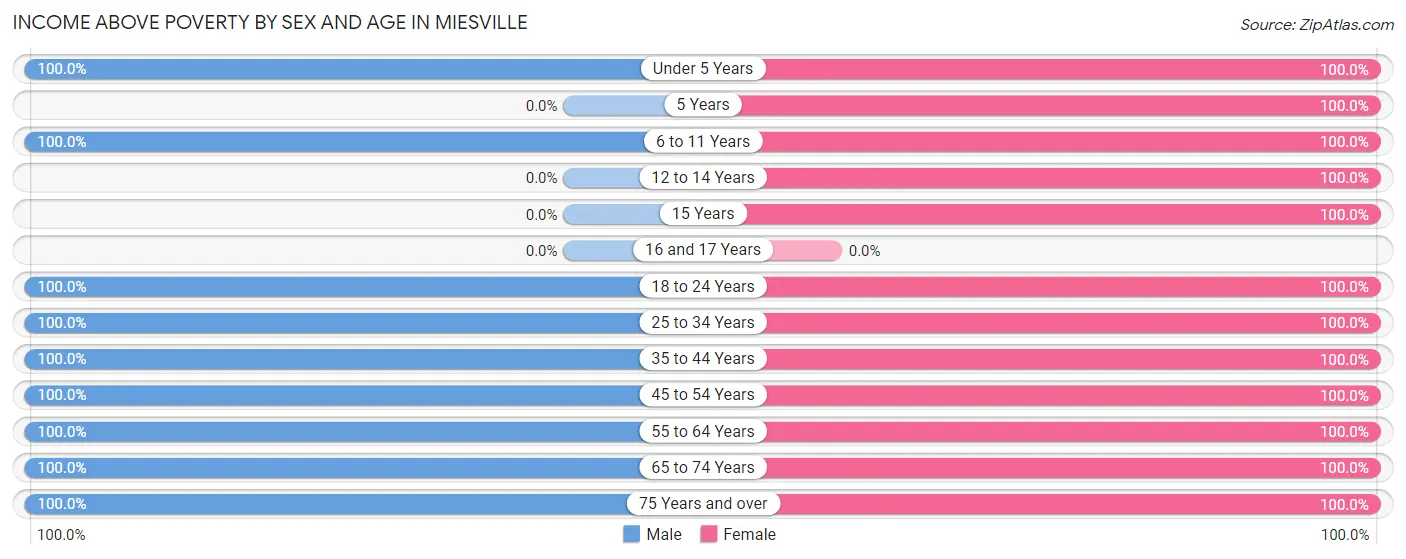
| Age Bracket | Male | Female |
| Under 5 Years | 4 (100.0%) | 6 (100.0%) |
| 5 Years | 0 (0.0%) | 9 (100.0%) |
| 6 to 11 Years | 8 (100.0%) | 8 (100.0%) |
| 12 to 14 Years | 0 (0.0%) | 1 (100.0%) |
| 15 Years | 0 (0.0%) | 1 (100.0%) |
| 16 and 17 Years | 0 (0.0%) | 0 (0.0%) |
| 18 to 24 Years | 3 (100.0%) | 3 (100.0%) |
| 25 to 34 Years | 5 (100.0%) | 2 (100.0%) |
| 35 to 44 Years | 8 (100.0%) | 12 (100.0%) |
| 45 to 54 Years | 6 (100.0%) | 1 (100.0%) |
| 55 to 64 Years | 5 (100.0%) | 5 (100.0%) |
| 65 to 74 Years | 8 (100.0%) | 5 (100.0%) |
| 75 Years and over | 6 (100.0%) | 8 (100.0%) |
| Total | 53 (100.0%) | 61 (100.0%) |
Income Below Poverty Among Married-Couple Families in Miesville
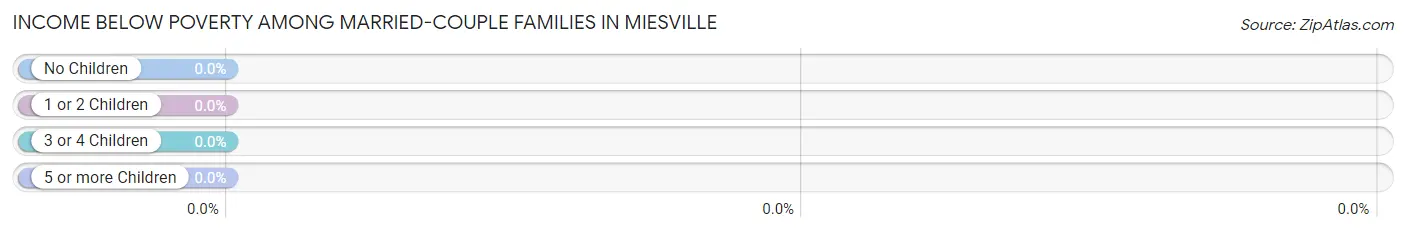
| Children | Above Poverty | Below Poverty |
| No Children | 13 (100.0%) | 0 (0.0%) |
| 1 or 2 Children | 1 (100.0%) | 0 (0.0%) |
| 3 or 4 Children | 12 (100.0%) | 0 (0.0%) |
| 5 or more Children | 0 (0.0%) | 0 (0.0%) |
| Total | 26 (100.0%) | 0 (0.0%) |
Income Below Poverty Among Single-Parent Households in Miesville
| Children | Single Father | Single Mother |
| No Children | 0 (0.0%) | 0 (0.0%) |
| 1 or 2 Children | 0 (0.0%) | 0 (0.0%) |
| 3 or 4 Children | 0 (0.0%) | 0 (0.0%) |
| 5 or more Children | 0 (0.0%) | 0 (0.0%) |
| Total | 0 (0.0%) | 0 (0.0%) |
Income Below Poverty Among Married-Couple vs Single-Parent Households in Miesville
| Children | Married-Couple Families | Single-Parent Households |
| No Children | 0 (0.0%) | 0 (0.0%) |
| 1 or 2 Children | 0 (0.0%) | 0 (0.0%) |
| 3 or 4 Children | 0 (0.0%) | 0 (0.0%) |
| 5 or more Children | 0 (0.0%) | 0 (0.0%) |
| Total | 0 (0.0%) | 0 (0.0%) |
Race in Miesville
The most populous races in Miesville are , and White / Caucasian (114 | 100.0%).
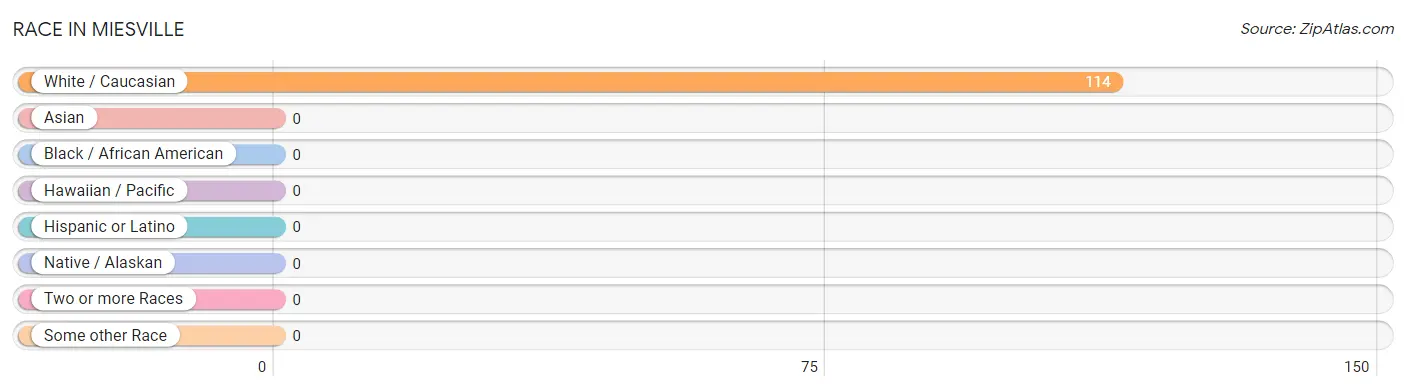
| Race | # Population | % Population |
| Asian | 0 | 0.0% |
| Black / African American | 0 | 0.0% |
| Hawaiian / Pacific | 0 | 0.0% |
| Hispanic or Latino | 0 | 0.0% |
| Native / Alaskan | 0 | 0.0% |
| White / Caucasian | 114 | 100.0% |
| Two or more Races | 0 | 0.0% |
| Some other Race | 0 | 0.0% |
| Total | 114 | 100.0% |
Ancestry in Miesville
The most populous ancestries reported in Miesville are German (32 | 28.1%), Norwegian (17 | 14.9%), Irish (8 | 7.0%), Swedish (8 | 7.0%), and American (5 | 4.4%), together accounting for 61.4% of all Miesville residents.
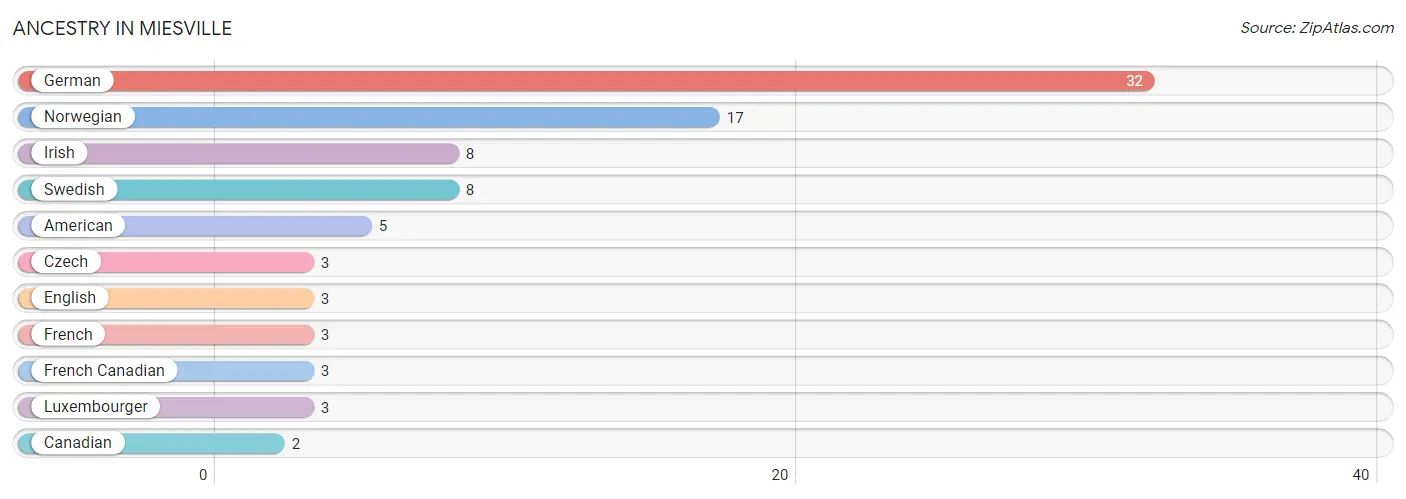
| Ancestry | # Population | % Population |
| American | 5 | 4.4% |
| Canadian | 2 | 1.8% |
| Czech | 3 | 2.6% |
| English | 3 | 2.6% |
| French | 3 | 2.6% |
| French Canadian | 3 | 2.6% |
| German | 32 | 28.1% |
| Irish | 8 | 7.0% |
| Luxembourger | 3 | 2.6% |
| Norwegian | 17 | 14.9% |
| Swedish | 8 | 7.0% | View All 11 Rows |
Immigrants in Miesville
The most numerous immigrant groups reported in Miesville came from , and Canada (2 | 1.8%), together accounting for 1.8% of all Miesville residents.

| Immigration Origin | # Population | % Population |
| Canada | 2 | 1.8% | View All 1 Rows |
Sex and Age in Miesville
Sex and Age in Miesville
The most populous age groups in Miesville are 5 to 9 Years (8 | 15.1%) for men and 5 to 9 Years (17 | 27.9%) for women.
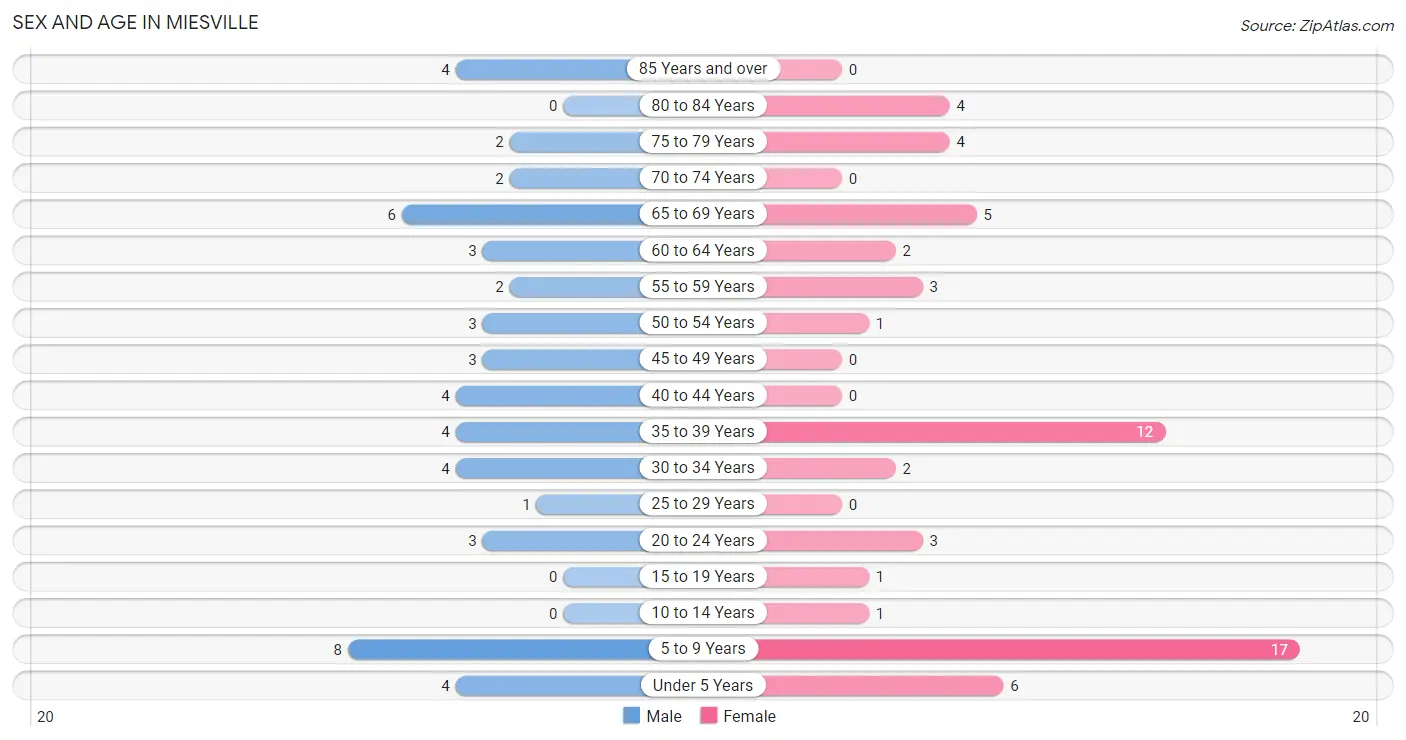
| Age Bracket | Male | Female |
| Under 5 Years | 4 (7.5%) | 6 (9.8%) |
| 5 to 9 Years | 8 (15.1%) | 17 (27.9%) |
| 10 to 14 Years | 0 (0.0%) | 1 (1.6%) |
| 15 to 19 Years | 0 (0.0%) | 1 (1.6%) |
| 20 to 24 Years | 3 (5.7%) | 3 (4.9%) |
| 25 to 29 Years | 1 (1.9%) | 0 (0.0%) |
| 30 to 34 Years | 4 (7.5%) | 2 (3.3%) |
| 35 to 39 Years | 4 (7.5%) | 12 (19.7%) |
| 40 to 44 Years | 4 (7.5%) | 0 (0.0%) |
| 45 to 49 Years | 3 (5.7%) | 0 (0.0%) |
| 50 to 54 Years | 3 (5.7%) | 1 (1.6%) |
| 55 to 59 Years | 2 (3.8%) | 3 (4.9%) |
| 60 to 64 Years | 3 (5.7%) | 2 (3.3%) |
| 65 to 69 Years | 6 (11.3%) | 5 (8.2%) |
| 70 to 74 Years | 2 (3.8%) | 0 (0.0%) |
| 75 to 79 Years | 2 (3.8%) | 4 (6.6%) |
| 80 to 84 Years | 0 (0.0%) | 4 (6.6%) |
| 85 Years and over | 4 (7.5%) | 0 (0.0%) |
| Total | 53 (100.0%) | 61 (100.0%) |
Families and Households in Miesville
Median Family Size in Miesville
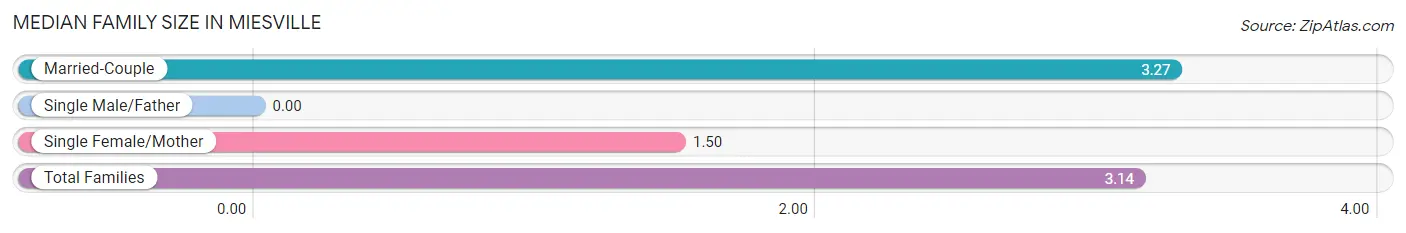
| Family Type | # Families | Family Size |
| Married-Couple | 26 (92.9%) | 3.27 |
| Single Male/Father | 0 (0.0%) | - |
| Single Female/Mother | 2 (7.1%) | 1.50 |
| Total Families | 28 (100.0%) | 3.14 |
Median Household Size in Miesville
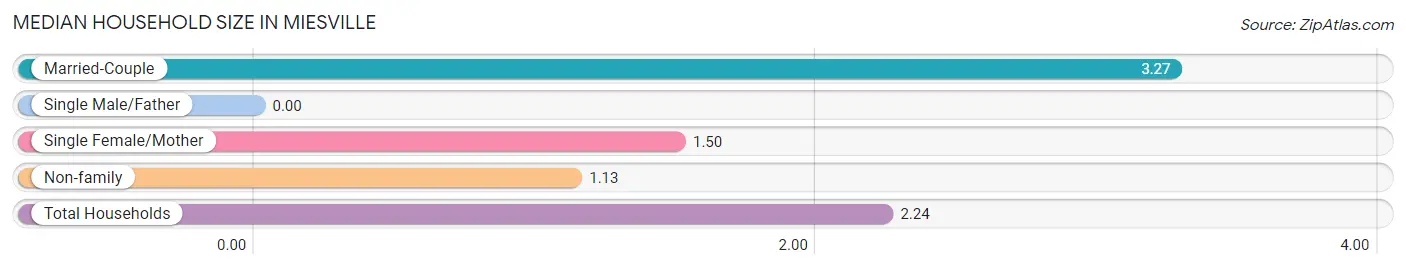
| Household Type | # Households | Household Size |
| Married-Couple | 26 (51.0%) | 3.27 |
| Single Male/Father | 0 (0.0%) | - |
| Single Female/Mother | 2 (3.9%) | 1.50 |
| Non-family | 23 (45.1%) | 1.13 |
| Total Households | 51 (100.0%) | 2.24 |
Household Size by Marriage Status in Miesville
Out of a total of 51 households in Miesville, 28 (54.9%) are family households, while 23 (45.1%) are nonfamily households. The most numerous type of family households are 2-person households, comprising 13, and the most common type of nonfamily households are 1-person households, comprising 19.
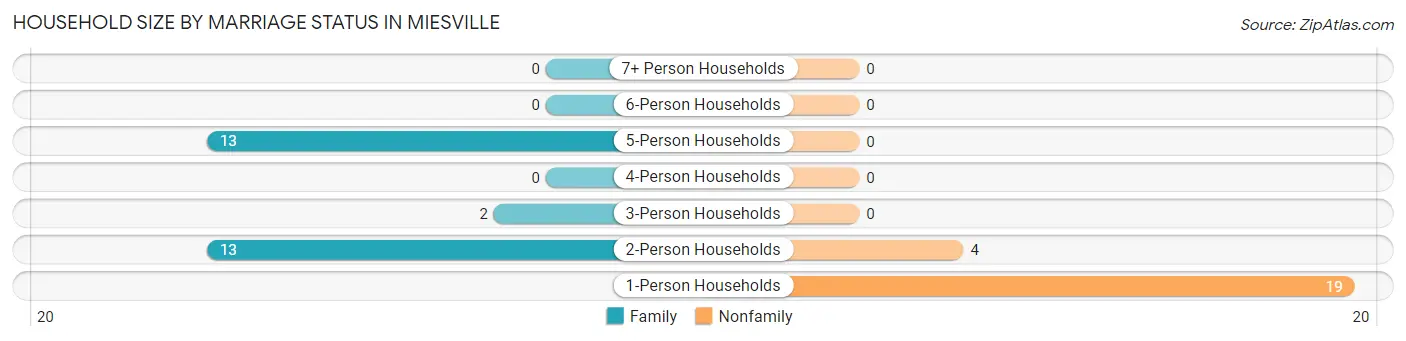
| Household Size | Family Households | Nonfamily Households |
| 1-Person Households | - | 19 (37.2%) |
| 2-Person Households | 13 (25.5%) | 4 (7.8%) |
| 3-Person Households | 2 (3.9%) | 0 (0.0%) |
| 4-Person Households | 0 (0.0%) | 0 (0.0%) |
| 5-Person Households | 13 (25.5%) | 0 (0.0%) |
| 6-Person Households | 0 (0.0%) | 0 (0.0%) |
| 7+ Person Households | 0 (0.0%) | 0 (0.0%) |
| Total | 28 (54.9%) | 23 (45.1%) |
Female Fertility in Miesville
Fertility by Age in Miesville
| Age Bracket | Women with Births | Births / 1,000 Women |
| 15 to 19 years | 0 (0.0%) | 0.0 |
| 20 to 34 years | 0 (0.0%) | 0.0 |
| 35 to 50 years | 0 (0.0%) | 0.0 |
| Total | 0 (0.0%) | 0.0 |
Fertility by Age by Marriage Status in Miesville
| Age Bracket | Married | Unmarried |
| 15 to 19 years | 0 (0.0%) | 0 (0.0%) |
| 20 to 34 years | 0 (0.0%) | 0 (0.0%) |
| 35 to 50 years | 0 (0.0%) | 0 (0.0%) |
| Total | 0 (0.0%) | 0 (0.0%) |
Fertility by Education in Miesville
| Educational Attainment | Women with Births | Births / 1,000 Women |
| Less than High School | 0 (0.0%) | 0.0 |
| High School Diploma | 0 (0.0%) | 0.0 |
| College or Associate's Degree | 0 (0.0%) | 0.0 |
| Bachelor's Degree | 0 (0.0%) | 0.0 |
| Graduate Degree | 0 (0.0%) | 0.0 |
| Total | 0 (0.0%) | 0.0 |
Fertility by Education by Marriage Status in Miesville
| Educational Attainment | Married | Unmarried |
| Less than High School | 0 (0.0%) | 0 (0.0%) |
| High School Diploma | 0 (0.0%) | 0 (0.0%) |
| College or Associate's Degree | 0 (0.0%) | 0 (0.0%) |
| Bachelor's Degree | 0 (0.0%) | 0 (0.0%) |
| Graduate Degree | 0 (0.0%) | 0 (0.0%) |
| Total | 0 (0.0%) | 0 (0.0%) |
Employment Characteristics in Miesville
Employment by Class of Employer in Miesville
Among the 50 employed individuals in Miesville, private company employees (26 | 52.0%), not-for-profit organizations (9 | 18.0%), and self-employed (not incorporated) (5 | 10.0%) make up the most common classes of employment.
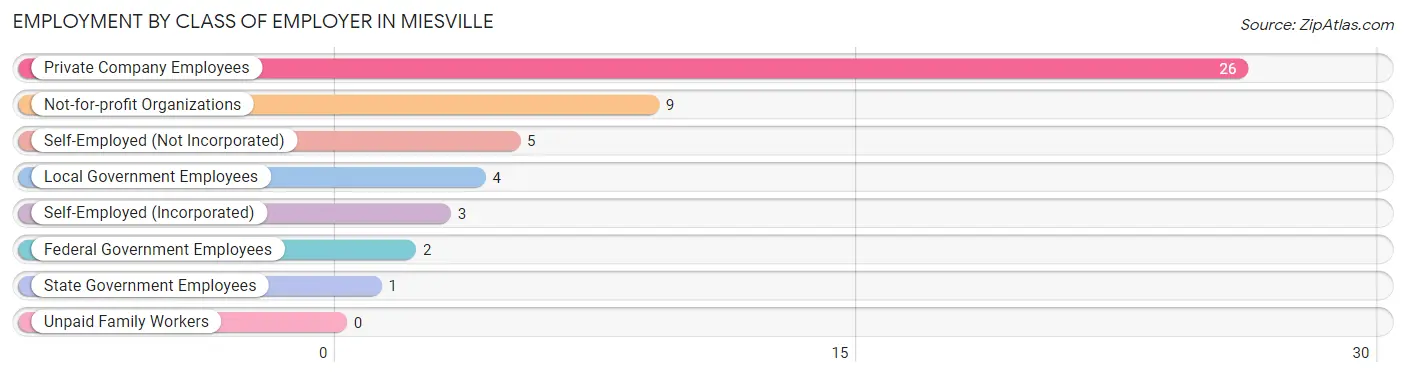
| Employer Class | # Employees | % Employees |
| Private Company Employees | 26 | 52.0% |
| Self-Employed (Incorporated) | 3 | 6.0% |
| Self-Employed (Not Incorporated) | 5 | 10.0% |
| Not-for-profit Organizations | 9 | 18.0% |
| Local Government Employees | 4 | 8.0% |
| State Government Employees | 1 | 2.0% |
| Federal Government Employees | 2 | 4.0% |
| Unpaid Family Workers | 0 | 0.0% |
| Total | 50 | 100.0% |
Employment Status by Age in Miesville
According to the labor force statistics for Miesville, out of the total population over 16 years of age (77), 68.8% or 53 individuals are in the labor force, with 3.8% or 2 of them unemployed. The age group with the highest labor force participation rate is 20 to 24 years, with 100.0% or 6 individuals in the labor force. Within the labor force, the 30 to 34 years age range has the highest percentage of unemployed individuals, with 33.3% or 2 of them being unemployed.
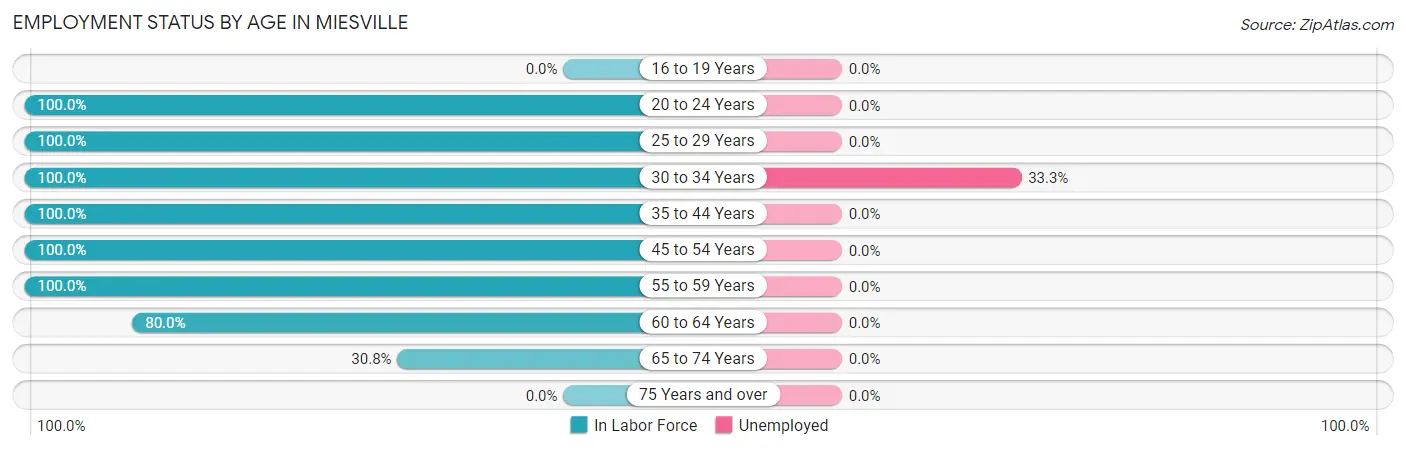
| Age Bracket | In Labor Force | Unemployed |
| 16 to 19 Years | 0 (0.0%) | 0 (0.0%) |
| 20 to 24 Years | 6 (100.0%) | 0 (0.0%) |
| 25 to 29 Years | 1 (100.0%) | 0 (0.0%) |
| 30 to 34 Years | 6 (100.0%) | 2 (33.3%) |
| 35 to 44 Years | 20 (100.0%) | 0 (0.0%) |
| 45 to 54 Years | 7 (100.0%) | 0 (0.0%) |
| 55 to 59 Years | 5 (100.0%) | 0 (0.0%) |
| 60 to 64 Years | 4 (80.0%) | 0 (0.0%) |
| 65 to 74 Years | 4 (30.8%) | 0 (0.0%) |
| 75 Years and over | 0 (0.0%) | 0 (0.0%) |
| Total | 53 (68.8%) | 2 (3.8%) |
Employment Status by Educational Attainment in Miesville
According to labor force statistics for Miesville, 97.7% of individuals (43) out of the total population between 25 and 64 years of age (44) are in the labor force, with 4.7% or 2 of them being unemployed. The group with the highest labor force participation rate are those with the educational attainment of high school diploma, with 100.0% or 7 individuals in the labor force. Within the labor force, individuals with college / associate degree education have the highest percentage of unemployment, with 8.7% or 2 of them being unemployed.
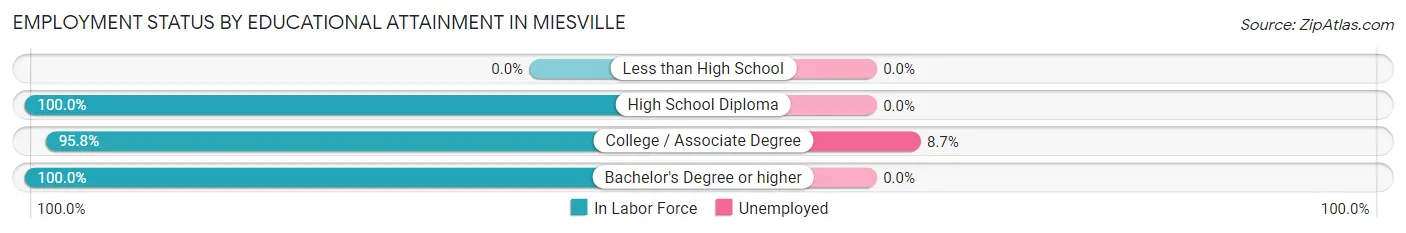
| Educational Attainment | In Labor Force | Unemployed |
| Less than High School | 0 (0.0%) | 0 (0.0%) |
| High School Diploma | 7 (100.0%) | 0 (0.0%) |
| College / Associate Degree | 23 (95.8%) | 2 (8.7%) |
| Bachelor's Degree or higher | 13 (100.0%) | 0 (0.0%) |
| Total | 43 (97.7%) | 2 (4.7%) |
Employment Occupations by Sex in Miesville
Management, Business, Science and Arts Occupations
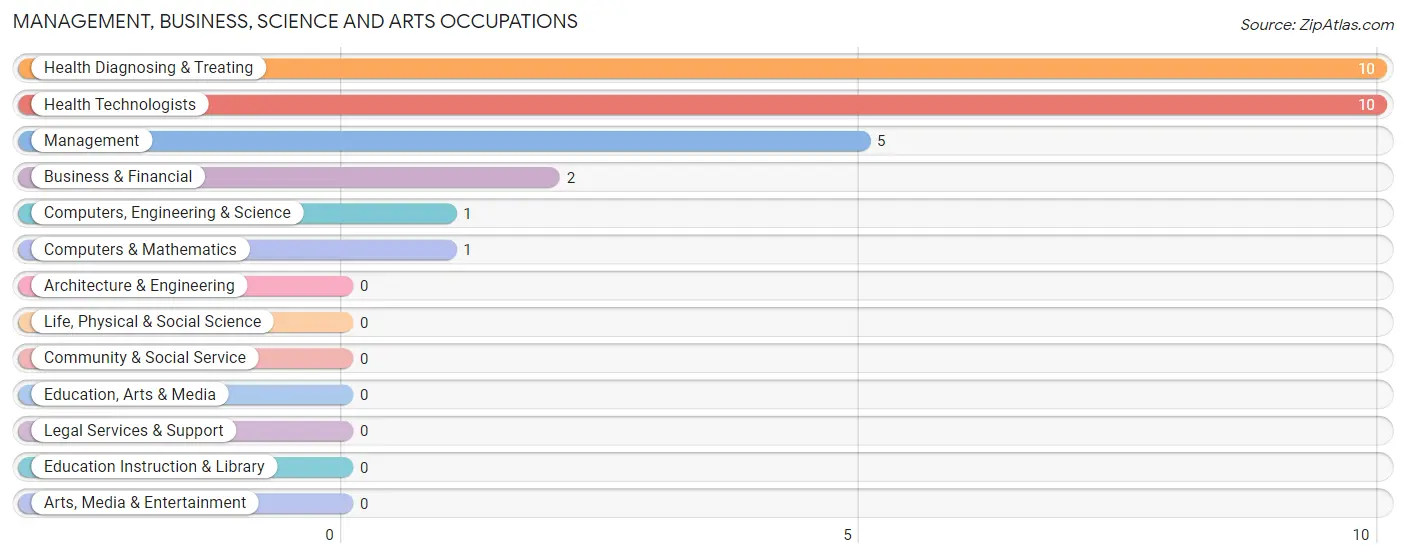
The most common Management, Business, Science and Arts occupations in Miesville are Health Diagnosing & Treating (10 | 19.6%), Health Technologists (10 | 19.6%), Management (5 | 9.8%), Business & Financial (2 | 3.9%), and Computers, Engineering & Science (1 | 2.0%).
Management, Business, Science and Arts Occupations by Sex
Within the Management, Business, Science and Arts occupations in Miesville, the most male-oriented occupations are Business & Financial (100.0%), Computers, Engineering & Science (100.0%), and Computers & Mathematics (100.0%), while the most female-oriented occupations are Management (100.0%), Health Diagnosing & Treating (100.0%), and Health Technologists (100.0%).
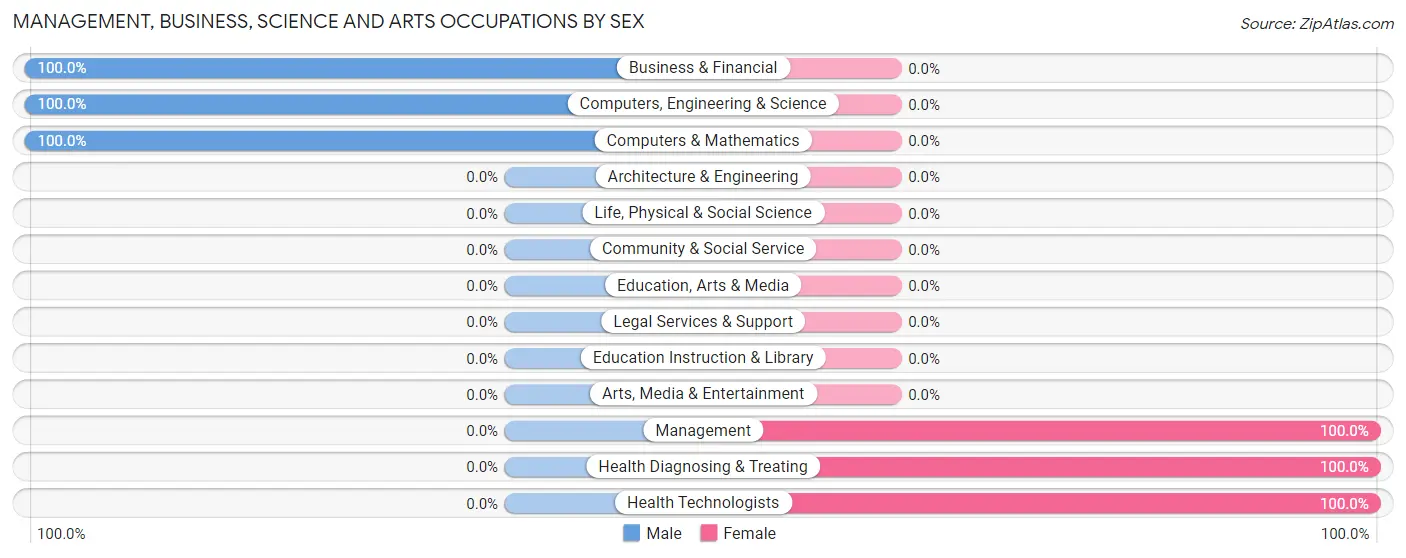
| Occupation | Male | Female |
| Management | 0 (0.0%) | 5 (100.0%) |
| Business & Financial | 2 (100.0%) | 0 (0.0%) |
| Computers, Engineering & Science | 1 (100.0%) | 0 (0.0%) |
| Computers & Mathematics | 1 (100.0%) | 0 (0.0%) |
| Architecture & Engineering | 0 (0.0%) | 0 (0.0%) |
| Life, Physical & Social Science | 0 (0.0%) | 0 (0.0%) |
| Community & Social Service | 0 (0.0%) | 0 (0.0%) |
| Education, Arts & Media | 0 (0.0%) | 0 (0.0%) |
| Legal Services & Support | 0 (0.0%) | 0 (0.0%) |
| Education Instruction & Library | 0 (0.0%) | 0 (0.0%) |
| Arts, Media & Entertainment | 0 (0.0%) | 0 (0.0%) |
| Health Diagnosing & Treating | 0 (0.0%) | 10 (100.0%) |
| Health Technologists | 0 (0.0%) | 10 (100.0%) |
| Total (Category) | 3 (16.7%) | 15 (83.3%) |
| Total (Overall) | 25 (49.0%) | 26 (51.0%) |
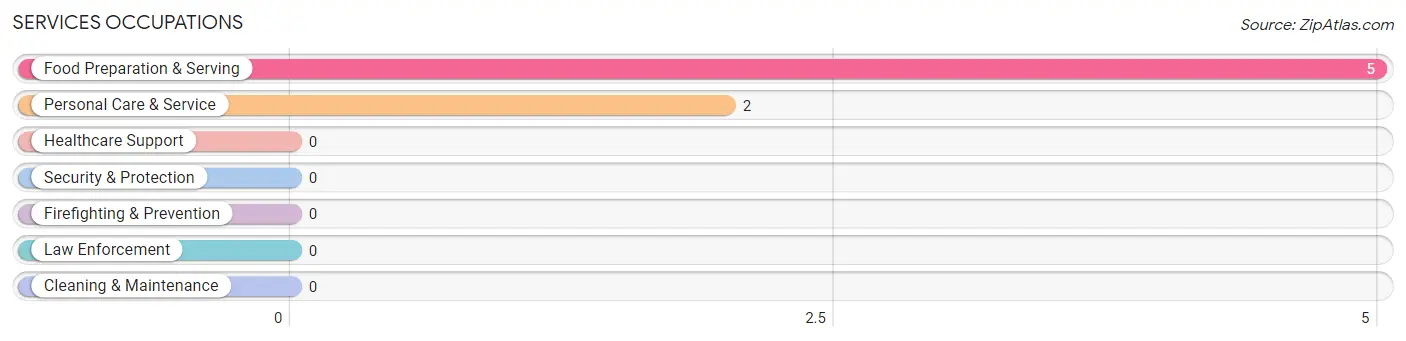
Services Occupations
The most common Services occupations in Miesville are Food Preparation & Serving (5 | 9.8%), and Personal Care & Service (2 | 3.9%).
Services Occupations by Sex
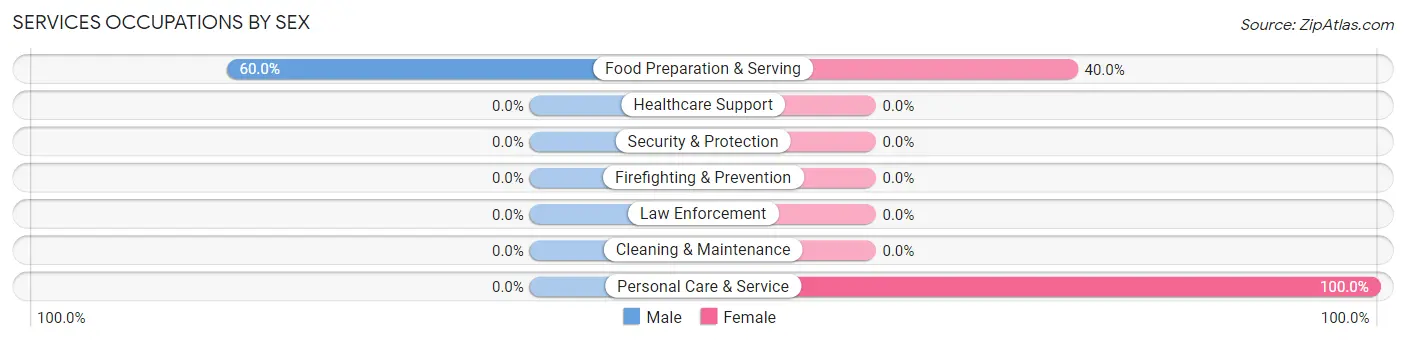
| Occupation | Male | Female |
| Healthcare Support | 0 (0.0%) | 0 (0.0%) |
| Security & Protection | 0 (0.0%) | 0 (0.0%) |
| Firefighting & Prevention | 0 (0.0%) | 0 (0.0%) |
| Law Enforcement | 0 (0.0%) | 0 (0.0%) |
| Food Preparation & Serving | 3 (60.0%) | 2 (40.0%) |
| Cleaning & Maintenance | 0 (0.0%) | 0 (0.0%) |
| Personal Care & Service | 0 (0.0%) | 2 (100.0%) |
| Total (Category) | 3 (42.9%) | 4 (57.1%) |
| Total (Overall) | 25 (49.0%) | 26 (51.0%) |
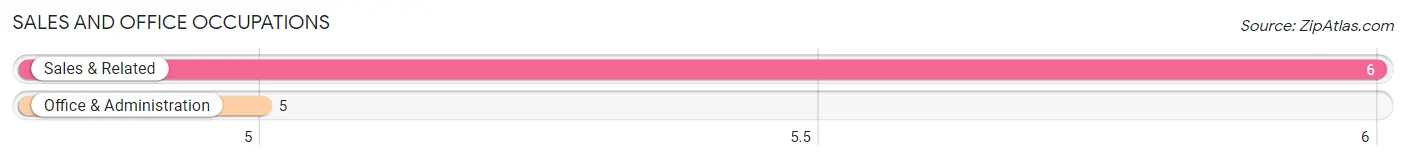
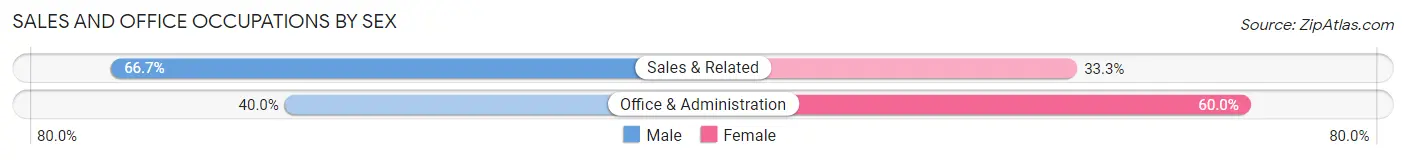
Sales and Office Occupations
The most common Sales and Office occupations in Miesville are Sales & Related (6 | 11.8%), and Office & Administration (5 | 9.8%).
Sales and Office Occupations by Sex
| Occupation | Male | Female |
| Sales & Related | 4 (66.7%) | 2 (33.3%) |
| Office & Administration | 2 (40.0%) | 3 (60.0%) |
| Total (Category) | 6 (54.5%) | 5 (45.5%) |
| Total (Overall) | 25 (49.0%) | 26 (51.0%) |
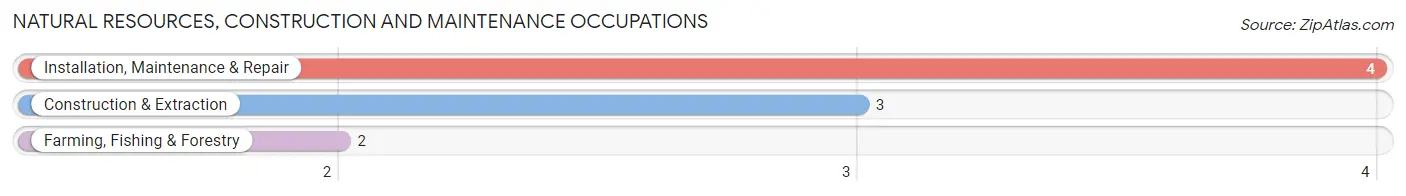
Natural Resources, Construction and Maintenance Occupations
The most common Natural Resources, Construction and Maintenance occupations in Miesville are Installation, Maintenance & Repair (4 | 7.8%), Construction & Extraction (3 | 5.9%), and Farming, Fishing & Forestry (2 | 3.9%).
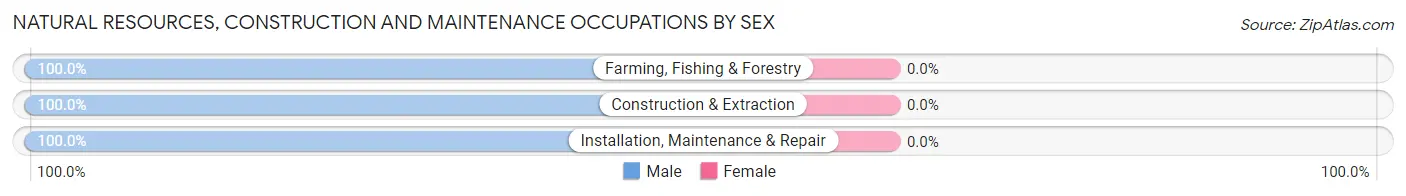
Natural Resources, Construction and Maintenance Occupations by Sex
| Occupation | Male | Female |
| Farming, Fishing & Forestry | 2 (100.0%) | 0 (0.0%) |
| Construction & Extraction | 3 (100.0%) | 0 (0.0%) |
| Installation, Maintenance & Repair | 4 (100.0%) | 0 (0.0%) |
| Total (Category) | 9 (100.0%) | 0 (0.0%) |
| Total (Overall) | 25 (49.0%) | 26 (51.0%) |
Production, Transportation and Moving Occupations
The most common Production, Transportation and Moving occupations in Miesville are Transportation (3 | 5.9%), and Material Moving (3 | 5.9%).
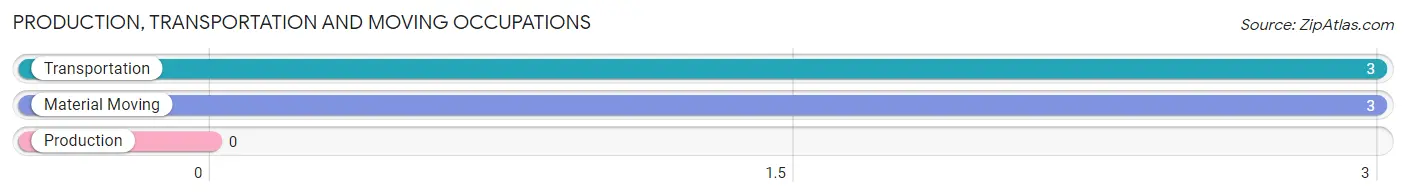
Production, Transportation and Moving Occupations by Sex
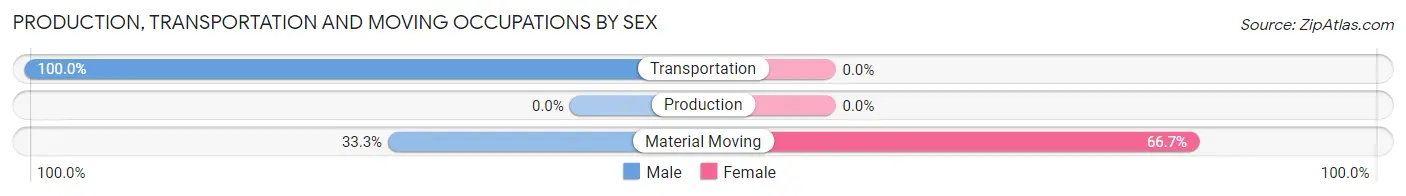
| Occupation | Male | Female |
| Production | 0 (0.0%) | 0 (0.0%) |
| Transportation | 3 (100.0%) | 0 (0.0%) |
| Material Moving | 1 (33.3%) | 2 (66.7%) |
| Total (Category) | 4 (66.7%) | 2 (33.3%) |
| Total (Overall) | 25 (49.0%) | 26 (51.0%) |
Employment Industries by Sex in Miesville
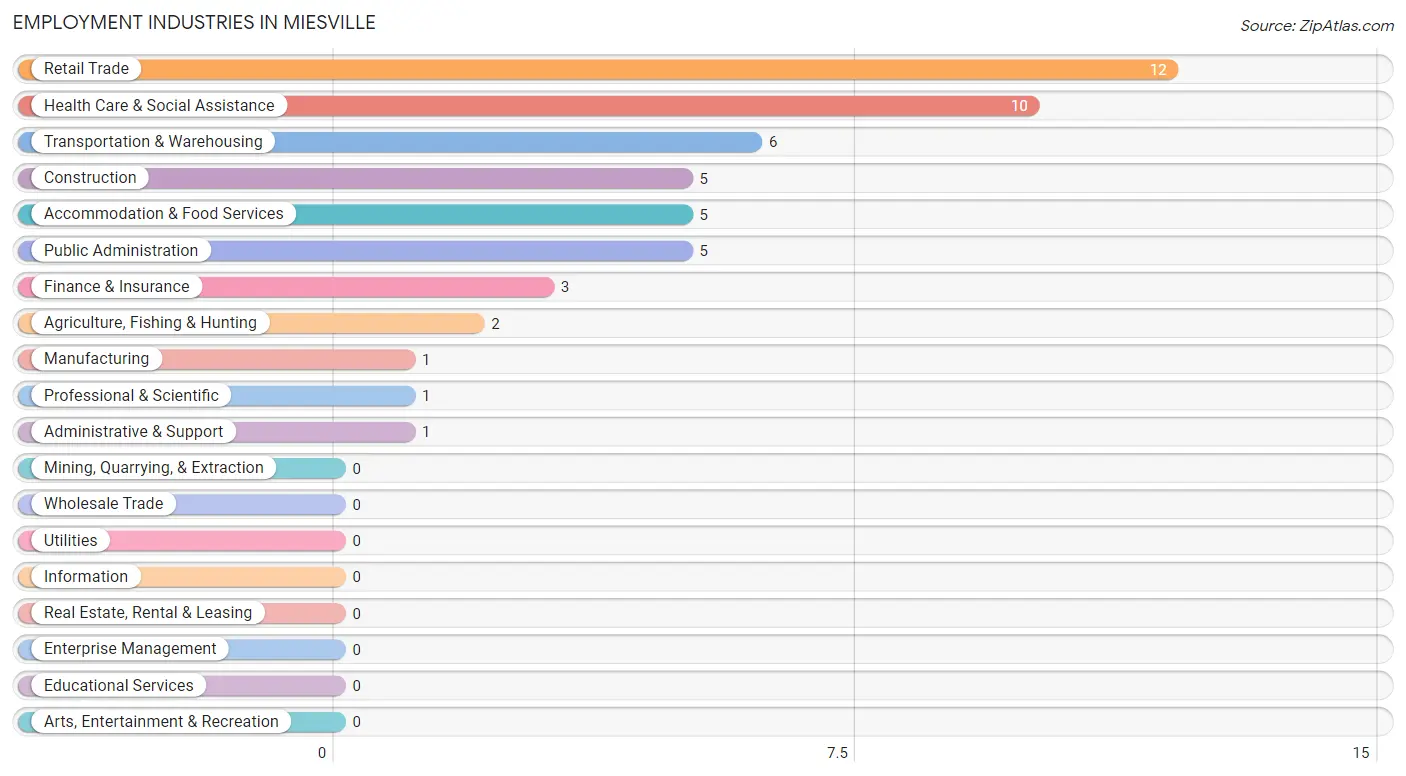
Employment Industries in Miesville
The major employment industries in Miesville include Retail Trade (12 | 23.5%), Health Care & Social Assistance (10 | 19.6%), Transportation & Warehousing (6 | 11.8%), Construction (5 | 9.8%), and Accommodation & Food Services (5 | 9.8%).
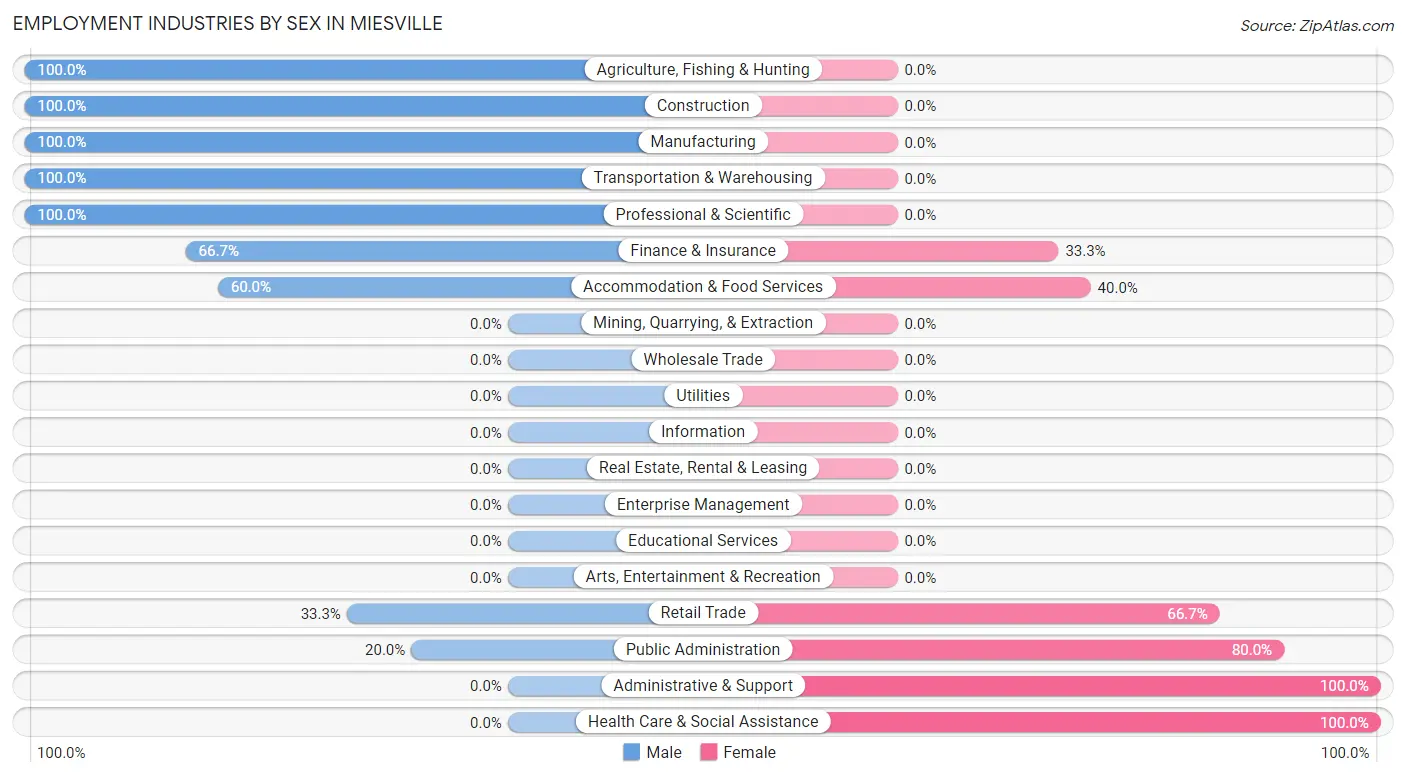
Employment Industries by Sex in Miesville
The Miesville industries that see more men than women are Agriculture, Fishing & Hunting (100.0%), Construction (100.0%), and Manufacturing (100.0%), whereas the industries that tend to have a higher number of women are Administrative & Support (100.0%), Health Care & Social Assistance (100.0%), and Public Administration (80.0%).
| Industry | Male | Female |
| Agriculture, Fishing & Hunting | 2 (100.0%) | 0 (0.0%) |
| Mining, Quarrying, & Extraction | 0 (0.0%) | 0 (0.0%) |
| Construction | 5 (100.0%) | 0 (0.0%) |
| Manufacturing | 1 (100.0%) | 0 (0.0%) |
| Wholesale Trade | 0 (0.0%) | 0 (0.0%) |
| Retail Trade | 4 (33.3%) | 8 (66.7%) |
| Transportation & Warehousing | 6 (100.0%) | 0 (0.0%) |
| Utilities | 0 (0.0%) | 0 (0.0%) |
| Information | 0 (0.0%) | 0 (0.0%) |
| Finance & Insurance | 2 (66.7%) | 1 (33.3%) |
| Real Estate, Rental & Leasing | 0 (0.0%) | 0 (0.0%) |
| Professional & Scientific | 1 (100.0%) | 0 (0.0%) |
| Enterprise Management | 0 (0.0%) | 0 (0.0%) |
| Administrative & Support | 0 (0.0%) | 1 (100.0%) |
| Educational Services | 0 (0.0%) | 0 (0.0%) |
| Health Care & Social Assistance | 0 (0.0%) | 10 (100.0%) |
| Arts, Entertainment & Recreation | 0 (0.0%) | 0 (0.0%) |
| Accommodation & Food Services | 3 (60.0%) | 2 (40.0%) |
| Public Administration | 1 (20.0%) | 4 (80.0%) |
| Total | 25 (49.0%) | 26 (51.0%) |
Education in Miesville
School Enrollment in Miesville
The most common levels of schooling among the 33 students in Miesville are elementary school (16 | 48.5%), kindergarten (9 | 27.3%), and nursery / preschool (4 | 12.1%).
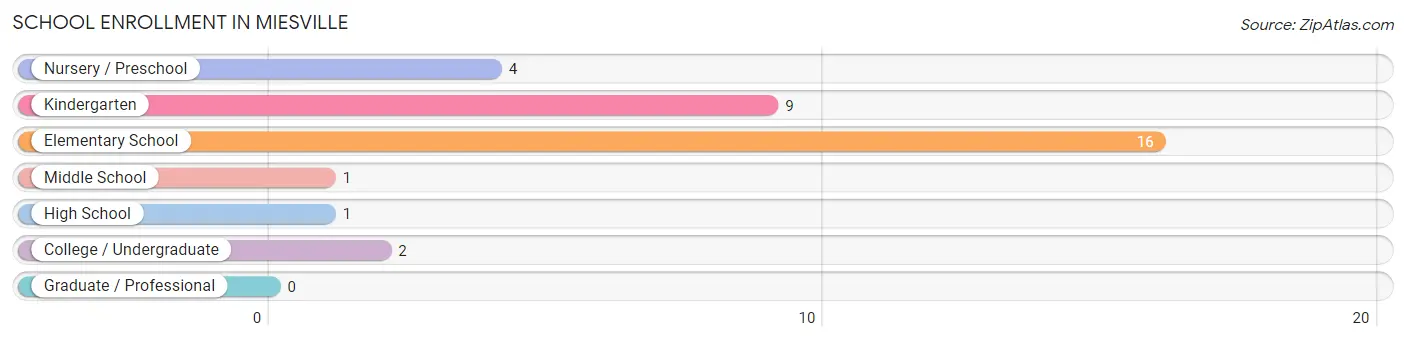
| School Level | # Students | % Students |
| Nursery / Preschool | 4 | 12.1% |
| Kindergarten | 9 | 27.3% |
| Elementary School | 16 | 48.5% |
| Middle School | 1 | 3.0% |
| High School | 1 | 3.0% |
| College / Undergraduate | 2 | 6.1% |
| Graduate / Professional | 0 | 0.0% |
| Total | 33 | 100.0% |
School Enrollment by Age by Funding Source in Miesville
Out of a total of 33 students who are enrolled in schools in Miesville, 14 (42.4%) attend a private institution, while the remaining 19 (57.6%) are enrolled in public schools. The age group of 3 to 4 year olds has the highest likelihood of being enrolled in private schools, with 4 (100.0% in the age bracket) enrolled. Conversely, the age group of 20 to 24 year olds has the lowest likelihood of being enrolled in a private school, with 2 (100.0% in the age bracket) attending a public institution.
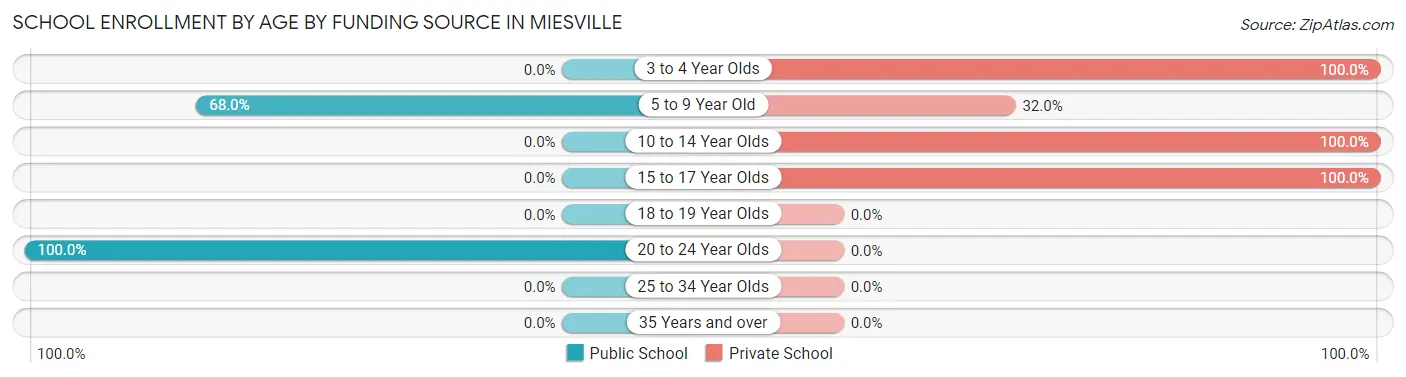
| Age Bracket | Public School | Private School |
| 3 to 4 Year Olds | 0 (0.0%) | 4 (100.0%) |
| 5 to 9 Year Old | 17 (68.0%) | 8 (32.0%) |
| 10 to 14 Year Olds | 0 (0.0%) | 1 (100.0%) |
| 15 to 17 Year Olds | 0 (0.0%) | 1 (100.0%) |
| 18 to 19 Year Olds | 0 (0.0%) | 0 (0.0%) |
| 20 to 24 Year Olds | 2 (100.0%) | 0 (0.0%) |
| 25 to 34 Year Olds | 0 (0.0%) | 0 (0.0%) |
| 35 Years and over | 0 (0.0%) | 0 (0.0%) |
| Total | 19 (57.6%) | 14 (42.4%) |
Educational Attainment by Field of Study in Miesville
Science & technology (8 | 44.4%), education (5 | 27.8%), psychology (2 | 11.1%), business (2 | 11.1%), and engineering (1 | 5.6%) are the most common fields of study among 18 individuals in Miesville who have obtained a bachelor's degree or higher.
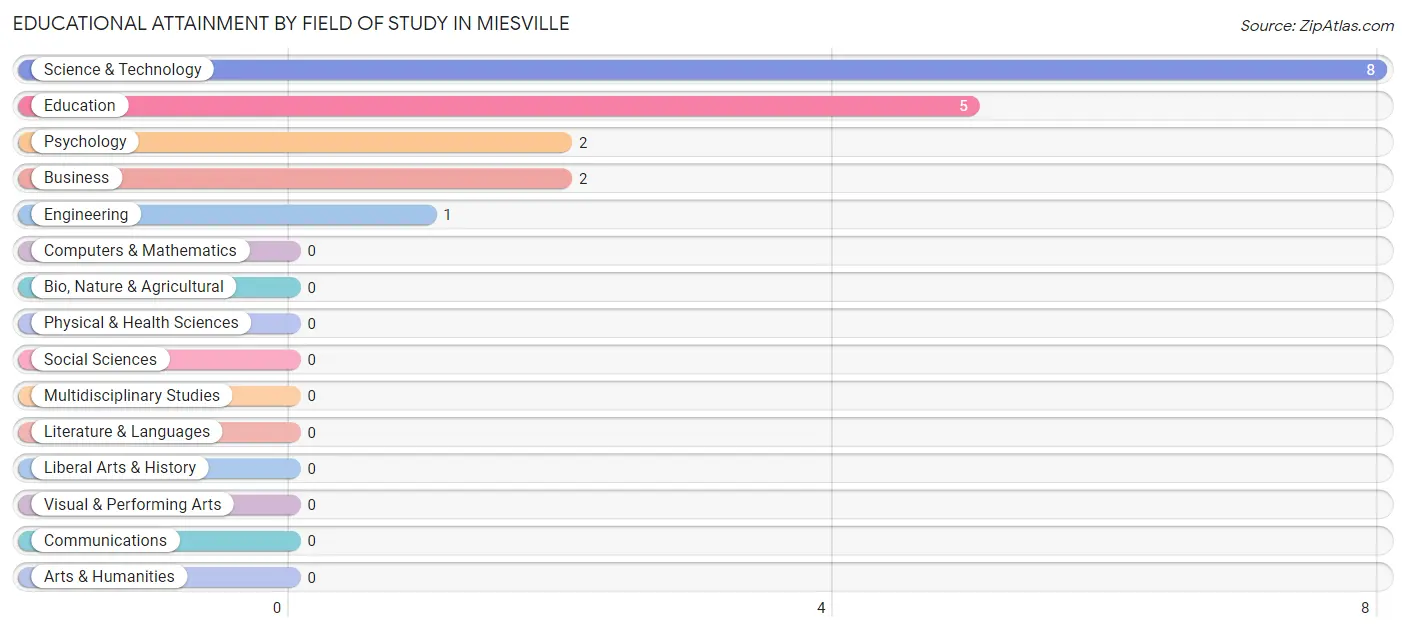
| Field of Study | # Graduates | % Graduates |
| Computers & Mathematics | 0 | 0.0% |
| Bio, Nature & Agricultural | 0 | 0.0% |
| Physical & Health Sciences | 0 | 0.0% |
| Psychology | 2 | 11.1% |
| Social Sciences | 0 | 0.0% |
| Engineering | 1 | 5.6% |
| Multidisciplinary Studies | 0 | 0.0% |
| Science & Technology | 8 | 44.4% |
| Business | 2 | 11.1% |
| Education | 5 | 27.8% |
| Literature & Languages | 0 | 0.0% |
| Liberal Arts & History | 0 | 0.0% |
| Visual & Performing Arts | 0 | 0.0% |
| Communications | 0 | 0.0% |
| Arts & Humanities | 0 | 0.0% |
| Total | 18 | 100.0% |
Transportation & Commute in Miesville
Vehicle Availability by Sex in Miesville
The most prevalent vehicle ownership categories in Miesville are males with 2 vehicles (15, accounting for 60.0%) and females with 2 vehicles (17, making up 60.0%).
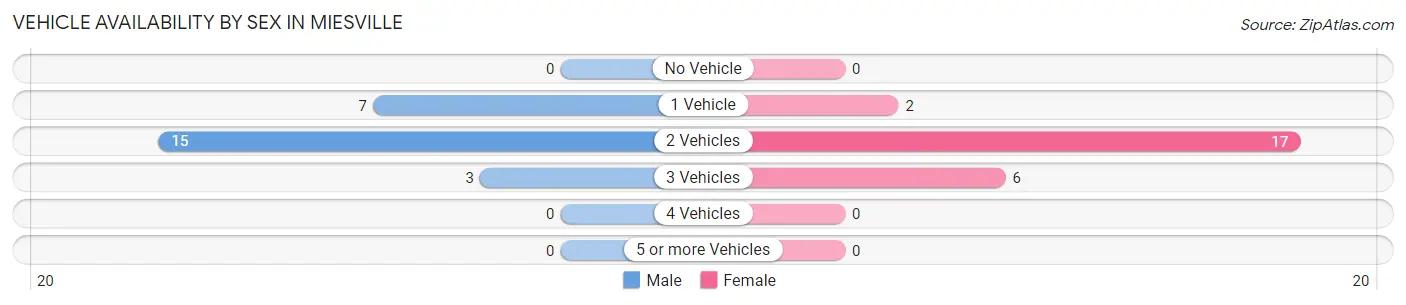
| Vehicles Available | Male | Female |
| No Vehicle | 0 (0.0%) | 0 (0.0%) |
| 1 Vehicle | 7 (28.0%) | 2 (8.0%) |
| 2 Vehicles | 15 (60.0%) | 17 (68.0%) |
| 3 Vehicles | 3 (12.0%) | 6 (24.0%) |
| 4 Vehicles | 0 (0.0%) | 0 (0.0%) |
| 5 or more Vehicles | 0 (0.0%) | 0 (0.0%) |
| Total | 25 (100.0%) | 25 (100.0%) |
Commute Time in Miesville
The most frequently occuring commute durations in Miesville are 15 to 19 minutes (12 commuters, 26.7%), 5 to 9 minutes (8 commuters, 17.8%), and 30 to 34 minutes (6 commuters, 13.3%).
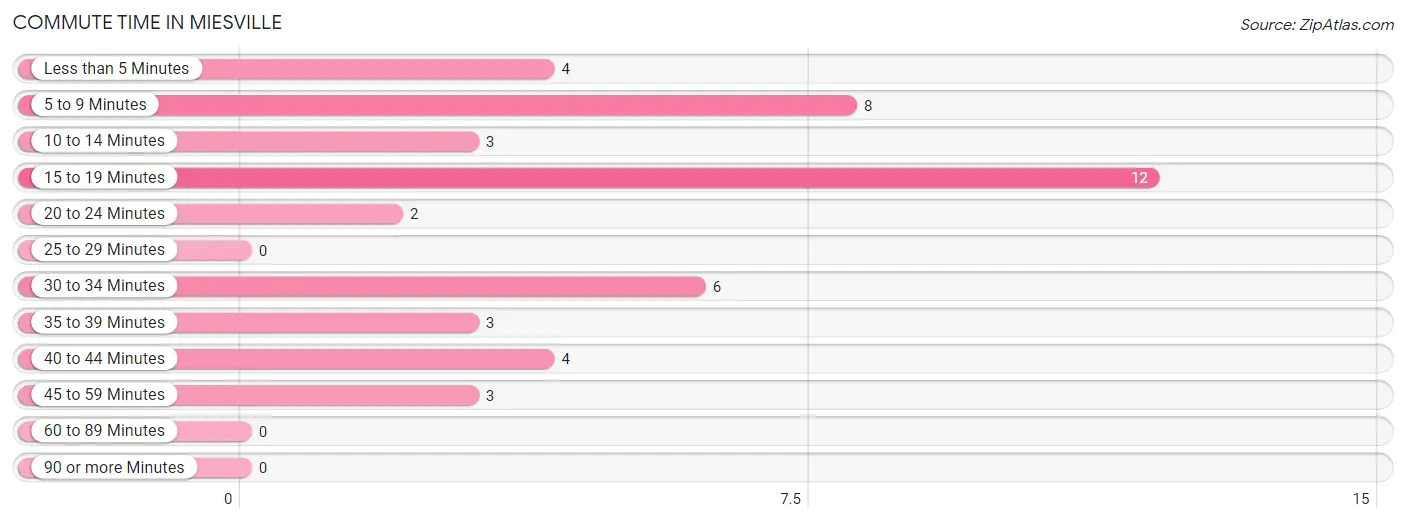
| Commute Time | # Commuters | % Commuters |
| Less than 5 Minutes | 4 | 8.9% |
| 5 to 9 Minutes | 8 | 17.8% |
| 10 to 14 Minutes | 3 | 6.7% |
| 15 to 19 Minutes | 12 | 26.7% |
| 20 to 24 Minutes | 2 | 4.4% |
| 25 to 29 Minutes | 0 | 0.0% |
| 30 to 34 Minutes | 6 | 13.3% |
| 35 to 39 Minutes | 3 | 6.7% |
| 40 to 44 Minutes | 4 | 8.9% |
| 45 to 59 Minutes | 3 | 6.7% |
| 60 to 89 Minutes | 0 | 0.0% |
| 90 or more Minutes | 0 | 0.0% |
Commute Time by Sex in Miesville
The most common commute times in Miesville are less than 5 minutes (4 commuters, 16.7%) for males and 15 to 19 minutes (10 commuters, 47.6%) for females.
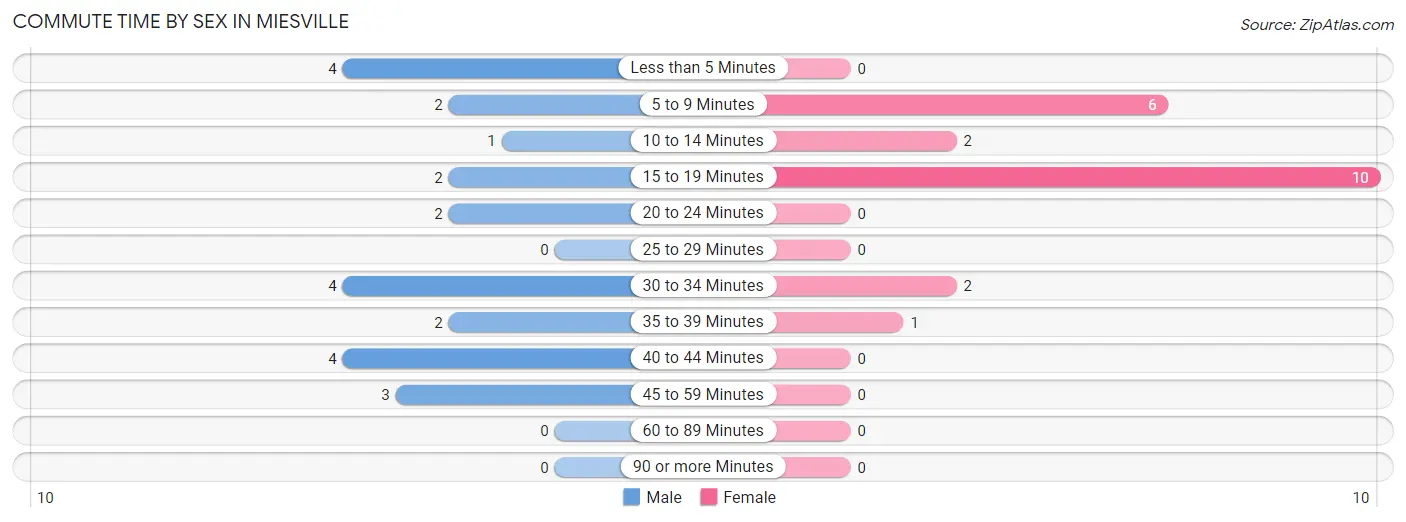
| Commute Time | Male | Female |
| Less than 5 Minutes | 4 (16.7%) | 0 (0.0%) |
| 5 to 9 Minutes | 2 (8.3%) | 6 (28.6%) |
| 10 to 14 Minutes | 1 (4.2%) | 2 (9.5%) |
| 15 to 19 Minutes | 2 (8.3%) | 10 (47.6%) |
| 20 to 24 Minutes | 2 (8.3%) | 0 (0.0%) |
| 25 to 29 Minutes | 0 (0.0%) | 0 (0.0%) |
| 30 to 34 Minutes | 4 (16.7%) | 2 (9.5%) |
| 35 to 39 Minutes | 2 (8.3%) | 1 (4.8%) |
| 40 to 44 Minutes | 4 (16.7%) | 0 (0.0%) |
| 45 to 59 Minutes | 3 (12.5%) | 0 (0.0%) |
| 60 to 89 Minutes | 0 (0.0%) | 0 (0.0%) |
| 90 or more Minutes | 0 (0.0%) | 0 (0.0%) |
Time of Departure to Work by Sex in Miesville
The most frequent times of departure to work in Miesville are 6:30 AM to 6:59 AM (6, 25.0%) for males and 7:00 AM to 7:29 AM (8, 38.1%) for females.
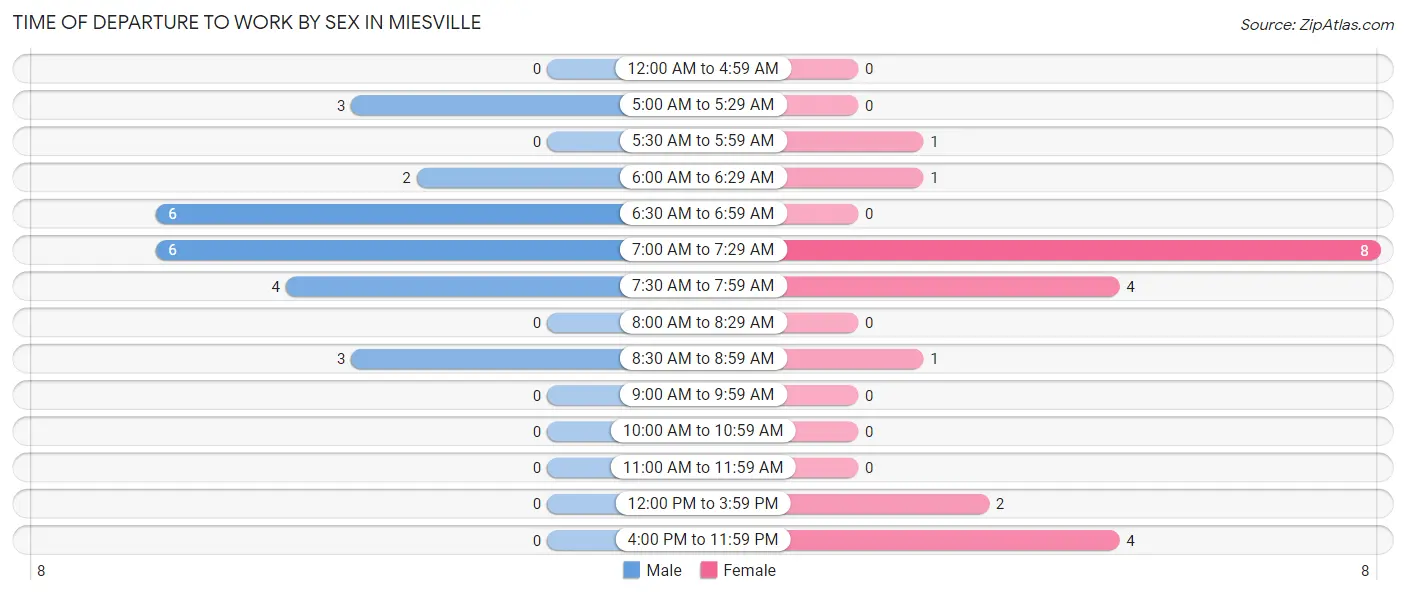
| Time of Departure | Male | Female |
| 12:00 AM to 4:59 AM | 0 (0.0%) | 0 (0.0%) |
| 5:00 AM to 5:29 AM | 3 (12.5%) | 0 (0.0%) |
| 5:30 AM to 5:59 AM | 0 (0.0%) | 1 (4.8%) |
| 6:00 AM to 6:29 AM | 2 (8.3%) | 1 (4.8%) |
| 6:30 AM to 6:59 AM | 6 (25.0%) | 0 (0.0%) |
| 7:00 AM to 7:29 AM | 6 (25.0%) | 8 (38.1%) |
| 7:30 AM to 7:59 AM | 4 (16.7%) | 4 (19.1%) |
| 8:00 AM to 8:29 AM | 0 (0.0%) | 0 (0.0%) |
| 8:30 AM to 8:59 AM | 3 (12.5%) | 1 (4.8%) |
| 9:00 AM to 9:59 AM | 0 (0.0%) | 0 (0.0%) |
| 10:00 AM to 10:59 AM | 0 (0.0%) | 0 (0.0%) |
| 11:00 AM to 11:59 AM | 0 (0.0%) | 0 (0.0%) |
| 12:00 PM to 3:59 PM | 0 (0.0%) | 2 (9.5%) |
| 4:00 PM to 11:59 PM | 0 (0.0%) | 4 (19.1%) |
| Total | 24 (100.0%) | 21 (100.0%) |
Housing Occupancy in Miesville
Occupancy by Ownership in Miesville
Of the total 51 dwellings in Miesville, owner-occupied units account for 48 (94.1%), while renter-occupied units make up 3 (5.9%).
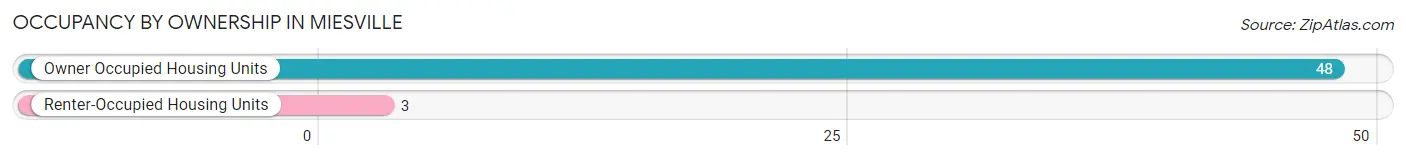
| Occupancy | # Housing Units | % Housing Units |
| Owner Occupied Housing Units | 48 | 94.1% |
| Renter-Occupied Housing Units | 3 | 5.9% |
| Total Occupied Housing Units | 51 | 100.0% |
Occupancy by Household Size in Miesville
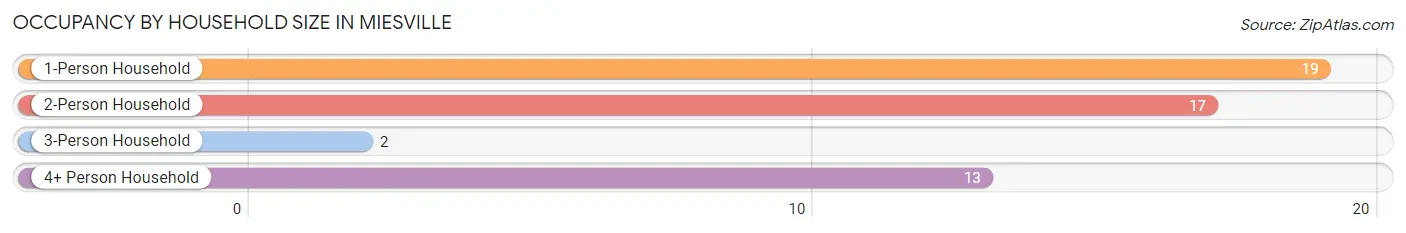
| Household Size | # Housing Units | % Housing Units |
| 1-Person Household | 19 | 37.2% |
| 2-Person Household | 17 | 33.3% |
| 3-Person Household | 2 | 3.9% |
| 4+ Person Household | 13 | 25.5% |
| Total Housing Units | 51 | 100.0% |
Occupancy by Ownership by Household Size in Miesville
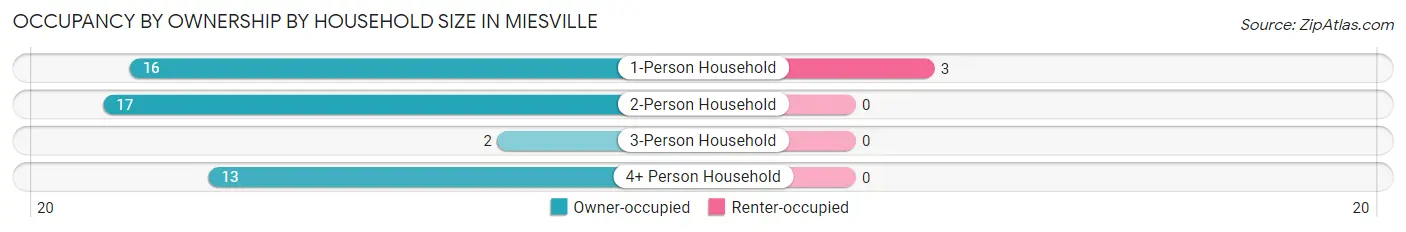
| Household Size | Owner-occupied | Renter-occupied |
| 1-Person Household | 16 (84.2%) | 3 (15.8%) |
| 2-Person Household | 17 (100.0%) | 0 (0.0%) |
| 3-Person Household | 2 (100.0%) | 0 (0.0%) |
| 4+ Person Household | 13 (100.0%) | 0 (0.0%) |
| Total Housing Units | 48 (94.1%) | 3 (5.9%) |
Occupancy by Educational Attainment in Miesville
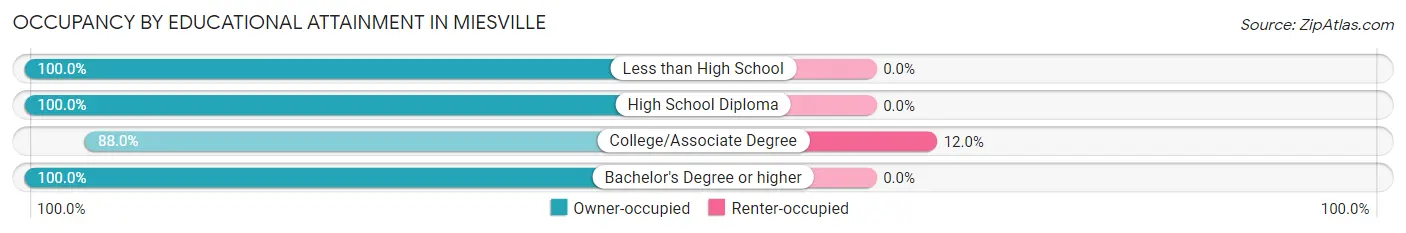
| Household Size | Owner-occupied | Renter-occupied |
| Less than High School | 3 (100.0%) | 0 (0.0%) |
| High School Diploma | 9 (100.0%) | 0 (0.0%) |
| College/Associate Degree | 22 (88.0%) | 3 (12.0%) |
| Bachelor's Degree or higher | 14 (100.0%) | 0 (0.0%) |
Occupancy by Age of Householder in Miesville
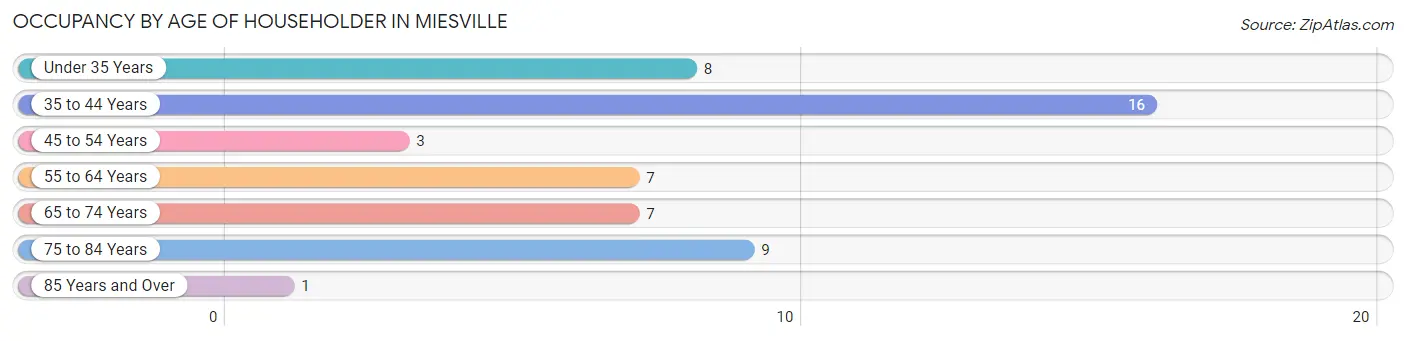
| Age Bracket | # Households | % Households |
| Under 35 Years | 8 | 15.7% |
| 35 to 44 Years | 16 | 31.4% |
| 45 to 54 Years | 3 | 5.9% |
| 55 to 64 Years | 7 | 13.7% |
| 65 to 74 Years | 7 | 13.7% |
| 75 to 84 Years | 9 | 17.6% |
| 85 Years and Over | 1 | 2.0% |
| Total | 51 | 100.0% |
Housing Finances in Miesville
Median Income by Occupancy in Miesville
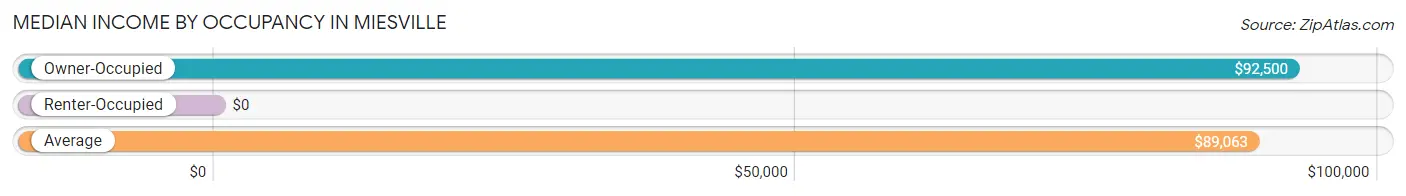
| Occupancy Type | # Households | Median Income |
| Owner-Occupied | 48 (94.1%) | $92,500 |
| Renter-Occupied | 3 (5.9%) | $0 |
| Average | 51 (100.0%) | $89,063 |
Occupancy by Householder Income Bracket in Miesville
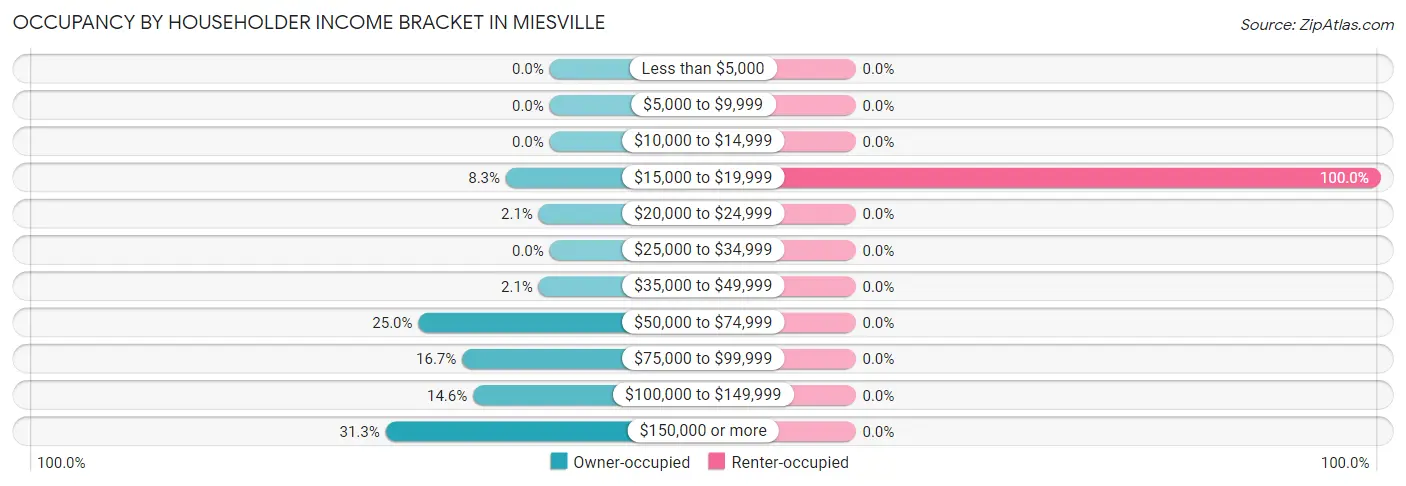
| Income Bracket | Owner-occupied | Renter-occupied |
| Less than $5,000 | 0 (0.0%) | 0 (0.0%) |
| $5,000 to $9,999 | 0 (0.0%) | 0 (0.0%) |
| $10,000 to $14,999 | 0 (0.0%) | 0 (0.0%) |
| $15,000 to $19,999 | 4 (8.3%) | 3 (100.0%) |
| $20,000 to $24,999 | 1 (2.1%) | 0 (0.0%) |
| $25,000 to $34,999 | 0 (0.0%) | 0 (0.0%) |
| $35,000 to $49,999 | 1 (2.1%) | 0 (0.0%) |
| $50,000 to $74,999 | 12 (25.0%) | 0 (0.0%) |
| $75,000 to $99,999 | 8 (16.7%) | 0 (0.0%) |
| $100,000 to $149,999 | 7 (14.6%) | 0 (0.0%) |
| $150,000 or more | 15 (31.2%) | 0 (0.0%) |
| Total | 48 (100.0%) | 3 (100.0%) |
Monthly Housing Cost Tiers in Miesville
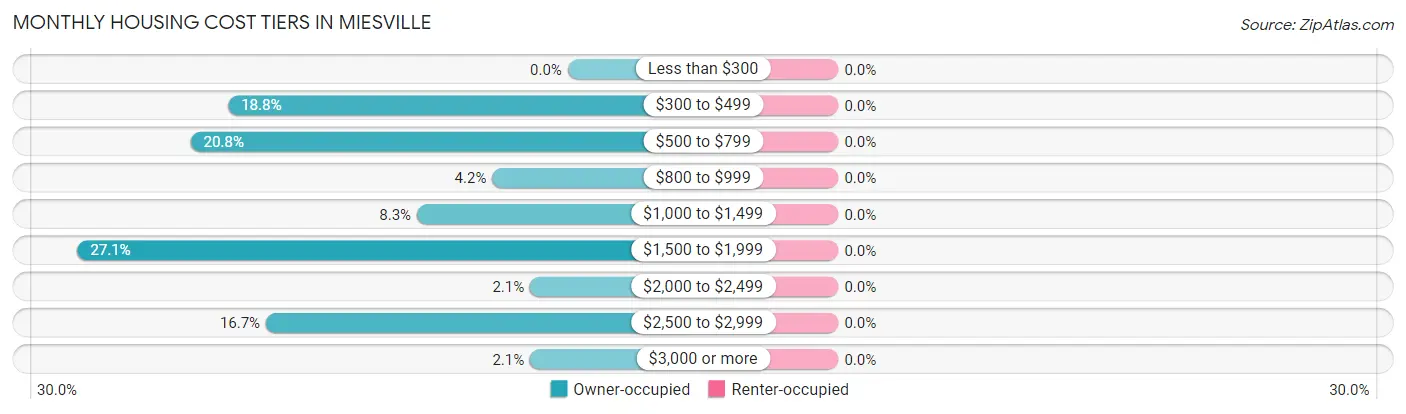
| Monthly Cost | Owner-occupied | Renter-occupied |
| Less than $300 | 0 (0.0%) | 0 (0.0%) |
| $300 to $499 | 9 (18.8%) | 0 (0.0%) |
| $500 to $799 | 10 (20.8%) | 0 (0.0%) |
| $800 to $999 | 2 (4.2%) | 0 (0.0%) |
| $1,000 to $1,499 | 4 (8.3%) | 0 (0.0%) |
| $1,500 to $1,999 | 13 (27.1%) | 0 (0.0%) |
| $2,000 to $2,499 | 1 (2.1%) | 0 (0.0%) |
| $2,500 to $2,999 | 8 (16.7%) | 0 (0.0%) |
| $3,000 or more | 1 (2.1%) | 0 (0.0%) |
| Total | 48 (100.0%) | 3 (100.0%) |
Physical Housing Characteristics in Miesville
Housing Structures in Miesville
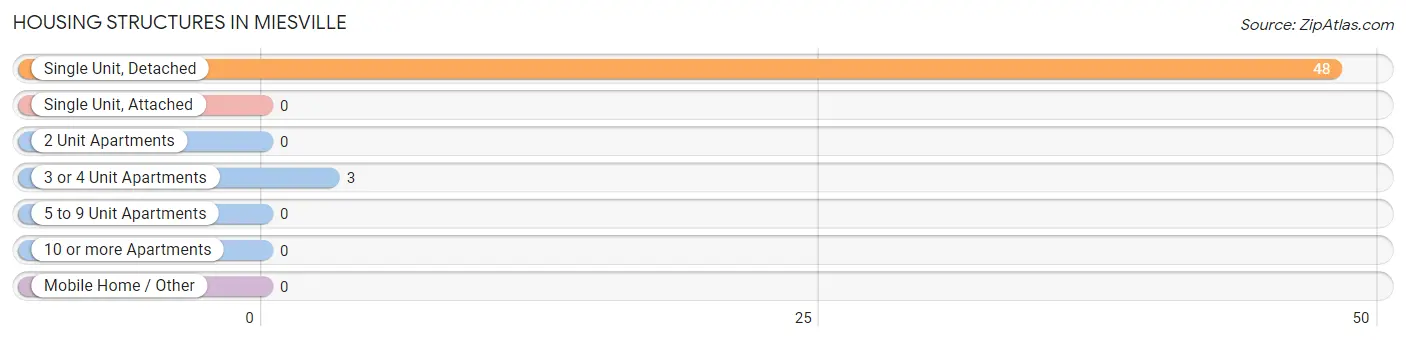
| Structure Type | # Housing Units | % Housing Units |
| Single Unit, Detached | 48 | 94.1% |
| Single Unit, Attached | 0 | 0.0% |
| 2 Unit Apartments | 0 | 0.0% |
| 3 or 4 Unit Apartments | 3 | 5.9% |
| 5 to 9 Unit Apartments | 0 | 0.0% |
| 10 or more Apartments | 0 | 0.0% |
| Mobile Home / Other | 0 | 0.0% |
| Total | 51 | 100.0% |
Housing Structures by Occupancy in Miesville
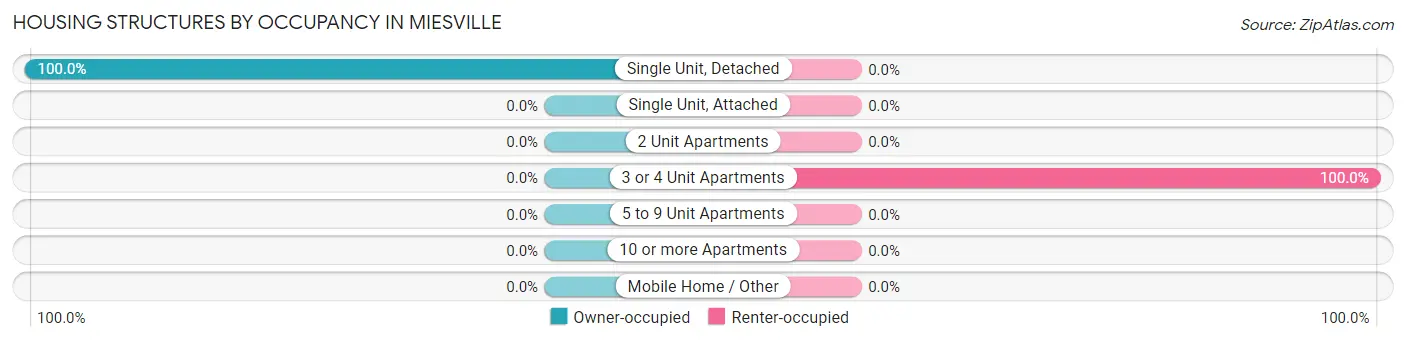
| Structure Type | Owner-occupied | Renter-occupied |
| Single Unit, Detached | 48 (100.0%) | 0 (0.0%) |
| Single Unit, Attached | 0 (0.0%) | 0 (0.0%) |
| 2 Unit Apartments | 0 (0.0%) | 0 (0.0%) |
| 3 or 4 Unit Apartments | 0 (0.0%) | 3 (100.0%) |
| 5 to 9 Unit Apartments | 0 (0.0%) | 0 (0.0%) |
| 10 or more Apartments | 0 (0.0%) | 0 (0.0%) |
| Mobile Home / Other | 0 (0.0%) | 0 (0.0%) |
| Total | 48 (94.1%) | 3 (5.9%) |
Housing Structures by Number of Rooms in Miesville
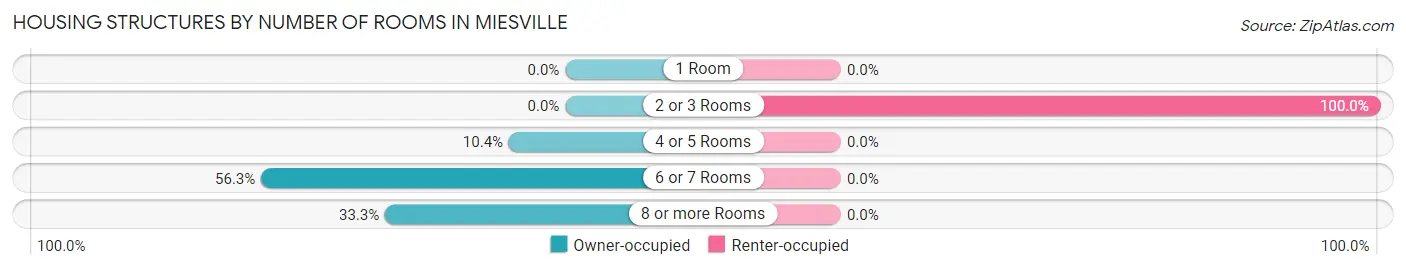
| Number of Rooms | Owner-occupied | Renter-occupied |
| 1 Room | 0 (0.0%) | 0 (0.0%) |
| 2 or 3 Rooms | 0 (0.0%) | 3 (100.0%) |
| 4 or 5 Rooms | 5 (10.4%) | 0 (0.0%) |
| 6 or 7 Rooms | 27 (56.2%) | 0 (0.0%) |
| 8 or more Rooms | 16 (33.3%) | 0 (0.0%) |
| Total | 48 (100.0%) | 3 (100.0%) |
Housing Structure by Heating Type in Miesville
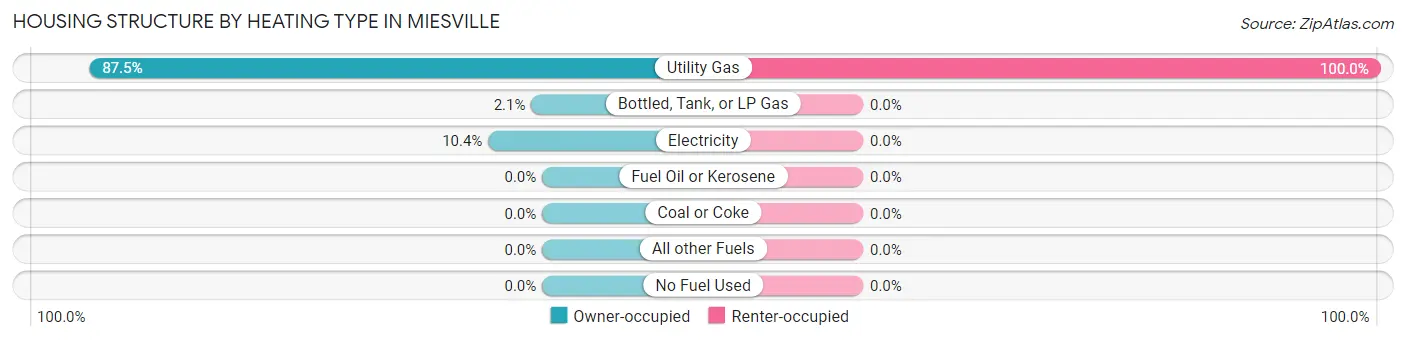
| Heating Type | Owner-occupied | Renter-occupied |
| Utility Gas | 42 (87.5%) | 3 (100.0%) |
| Bottled, Tank, or LP Gas | 1 (2.1%) | 0 (0.0%) |
| Electricity | 5 (10.4%) | 0 (0.0%) |
| Fuel Oil or Kerosene | 0 (0.0%) | 0 (0.0%) |
| Coal or Coke | 0 (0.0%) | 0 (0.0%) |
| All other Fuels | 0 (0.0%) | 0 (0.0%) |
| No Fuel Used | 0 (0.0%) | 0 (0.0%) |
| Total | 48 (100.0%) | 3 (100.0%) |
Household Vehicle Usage in Miesville
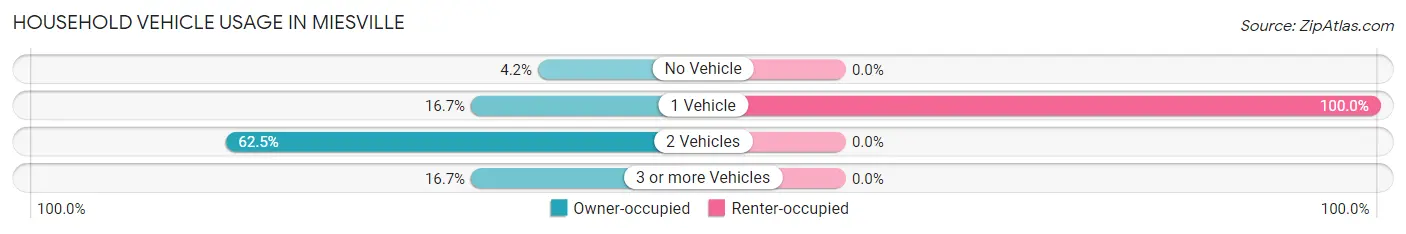
| Vehicles per Household | Owner-occupied | Renter-occupied |
| No Vehicle | 2 (4.2%) | 0 (0.0%) |
| 1 Vehicle | 8 (16.7%) | 3 (100.0%) |
| 2 Vehicles | 30 (62.5%) | 0 (0.0%) |
| 3 or more Vehicles | 8 (16.7%) | 0 (0.0%) |
| Total | 48 (100.0%) | 3 (100.0%) |
Real Estate & Mortgages in Miesville
Real Estate and Mortgage Overview in Miesville
| Characteristic | Without Mortgage | With Mortgage |
| Housing Units | 19 | 29 |
| Median Property Value | $270,800 | $338,200 |
| Median Household Income | $62,917 | $15 |
| Monthly Housing Costs | $517 | $1 |
| Real Estate Taxes | $2,357 | $0 |
Property Value by Mortgage Status in Miesville
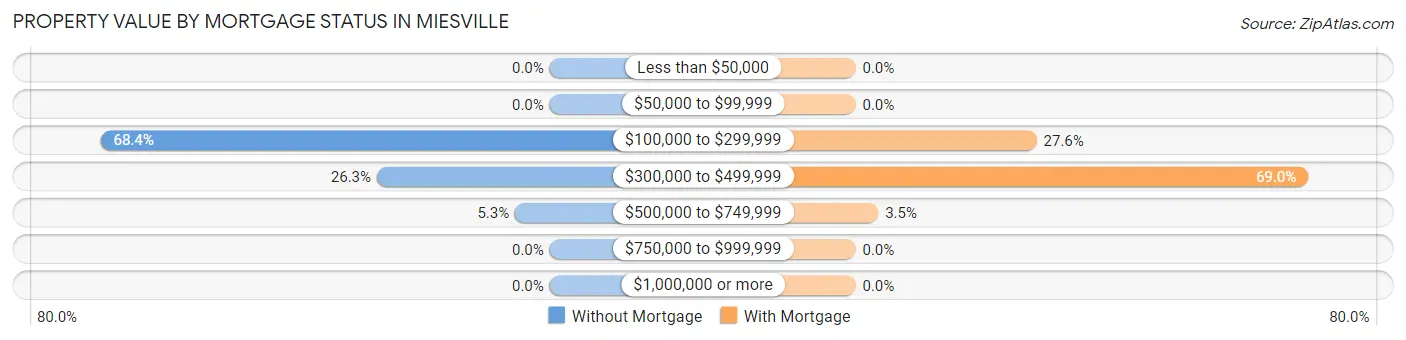
| Property Value | Without Mortgage | With Mortgage |
| Less than $50,000 | 0 (0.0%) | 0 (0.0%) |
| $50,000 to $99,999 | 0 (0.0%) | 0 (0.0%) |
| $100,000 to $299,999 | 13 (68.4%) | 8 (27.6%) |
| $300,000 to $499,999 | 5 (26.3%) | 20 (69.0%) |
| $500,000 to $749,999 | 1 (5.3%) | 1 (3.5%) |
| $750,000 to $999,999 | 0 (0.0%) | 0 (0.0%) |
| $1,000,000 or more | 0 (0.0%) | 0 (0.0%) |
| Total | 19 (100.0%) | 29 (100.0%) |
Household Income by Mortgage Status in Miesville
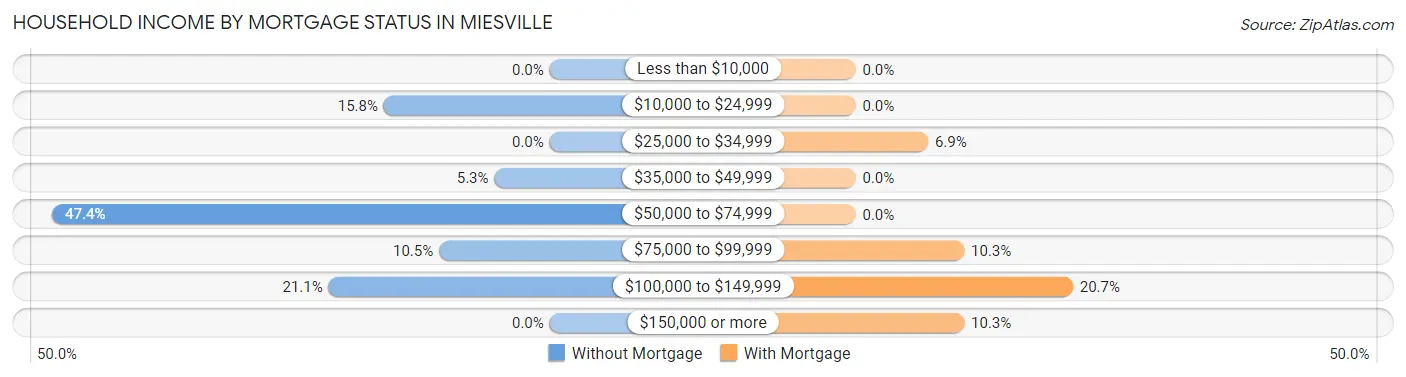
| Household Income | Without Mortgage | With Mortgage |
| Less than $10,000 | 0 (0.0%) | 0 (0.0%) |
| $10,000 to $24,999 | 3 (15.8%) | 0 (0.0%) |
| $25,000 to $34,999 | 0 (0.0%) | 2 (6.9%) |
| $35,000 to $49,999 | 1 (5.3%) | 0 (0.0%) |
| $50,000 to $74,999 | 9 (47.4%) | 0 (0.0%) |
| $75,000 to $99,999 | 2 (10.5%) | 3 (10.3%) |
| $100,000 to $149,999 | 4 (21.0%) | 6 (20.7%) |
| $150,000 or more | 0 (0.0%) | 3 (10.3%) |
| Total | 19 (100.0%) | 29 (100.0%) |
Property Value to Household Income Ratio in Miesville
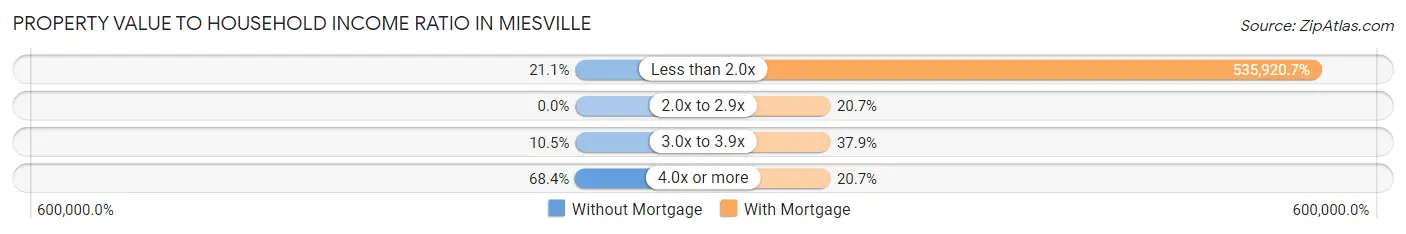
| Value-to-Income Ratio | Without Mortgage | With Mortgage |
| Less than 2.0x | 4 (21.0%) | 155,417 (535,920.7%) |
| 2.0x to 2.9x | 0 (0.0%) | 6 (20.7%) |
| 3.0x to 3.9x | 2 (10.5%) | 11 (37.9%) |
| 4.0x or more | 13 (68.4%) | 6 (20.7%) |
| Total | 19 (100.0%) | 29 (100.0%) |
Real Estate Taxes by Mortgage Status in Miesville
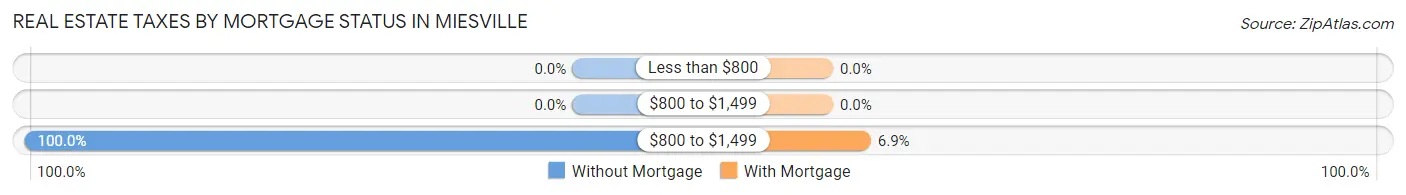
| Property Taxes | Without Mortgage | With Mortgage |
| Less than $800 | 0 (0.0%) | 0 (0.0%) |
| $800 to $1,499 | 0 (0.0%) | 0 (0.0%) |
| $800 to $1,499 | 19 (100.0%) | 2 (6.9%) |
| Total | 19 (100.0%) | 29 (100.0%) |
Health & Disability in Miesville
Health Insurance Coverage by Age in Miesville
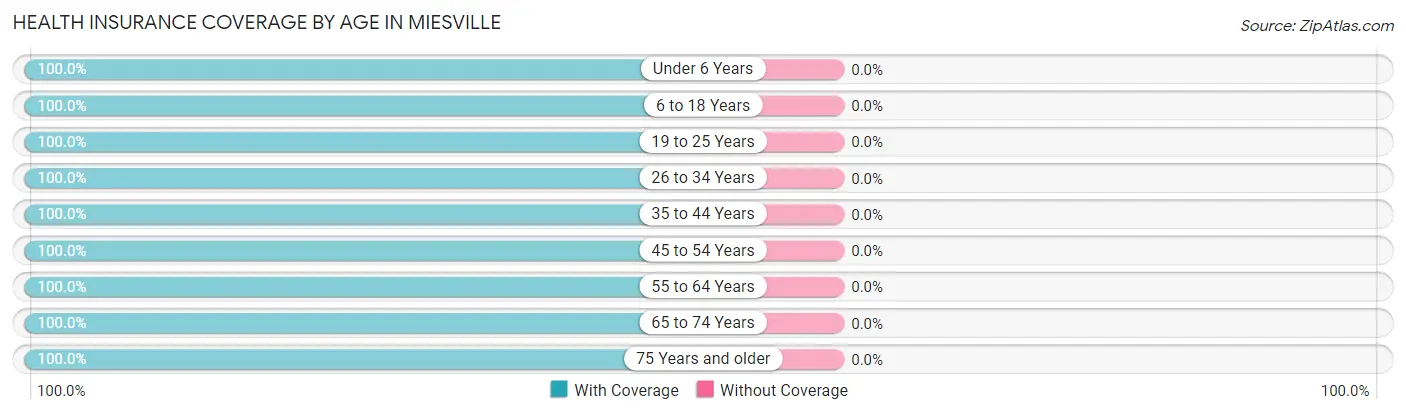
| Age Bracket | With Coverage | Without Coverage |
| Under 6 Years | 19 (100.0%) | 0 (0.0%) |
| 6 to 18 Years | 18 (100.0%) | 0 (0.0%) |
| 19 to 25 Years | 6 (100.0%) | 0 (0.0%) |
| 26 to 34 Years | 7 (100.0%) | 0 (0.0%) |
| 35 to 44 Years | 20 (100.0%) | 0 (0.0%) |
| 45 to 54 Years | 7 (100.0%) | 0 (0.0%) |
| 55 to 64 Years | 10 (100.0%) | 0 (0.0%) |
| 65 to 74 Years | 13 (100.0%) | 0 (0.0%) |
| 75 Years and older | 14 (100.0%) | 0 (0.0%) |
| Total | 114 (100.0%) | 0 (0.0%) |
Health Insurance Coverage by Citizenship Status in Miesville
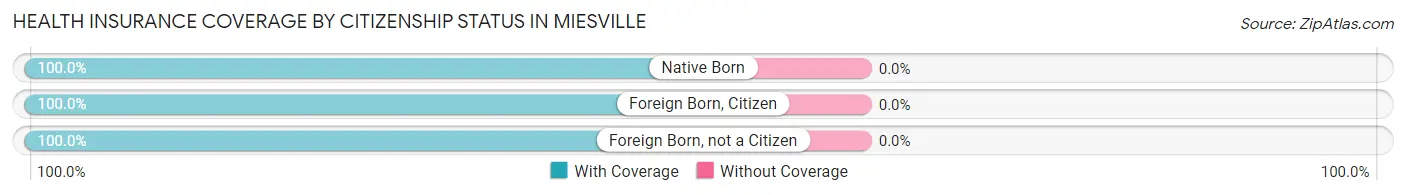
| Citizenship Status | With Coverage | Without Coverage |
| Native Born | 19 (100.0%) | 0 (0.0%) |
| Foreign Born, Citizen | 18 (100.0%) | 0 (0.0%) |
| Foreign Born, not a Citizen | 6 (100.0%) | 0 (0.0%) |
Health Insurance Coverage by Household Income in Miesville
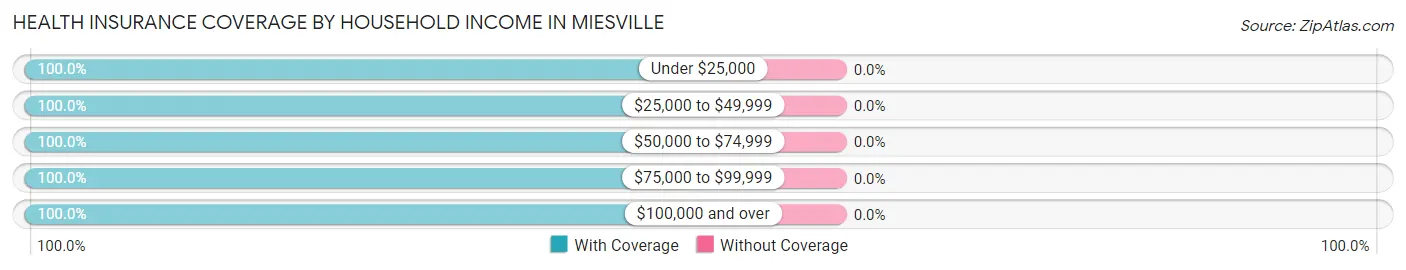
| Household Income | With Coverage | Without Coverage |
| Under $25,000 | 10 (100.0%) | 0 (0.0%) |
| $25,000 to $49,999 | 1 (100.0%) | 0 (0.0%) |
| $50,000 to $74,999 | 19 (100.0%) | 0 (0.0%) |
| $75,000 to $99,999 | 25 (100.0%) | 0 (0.0%) |
| $100,000 and over | 59 (100.0%) | 0 (0.0%) |
Public vs Private Health Insurance Coverage by Age in Miesville
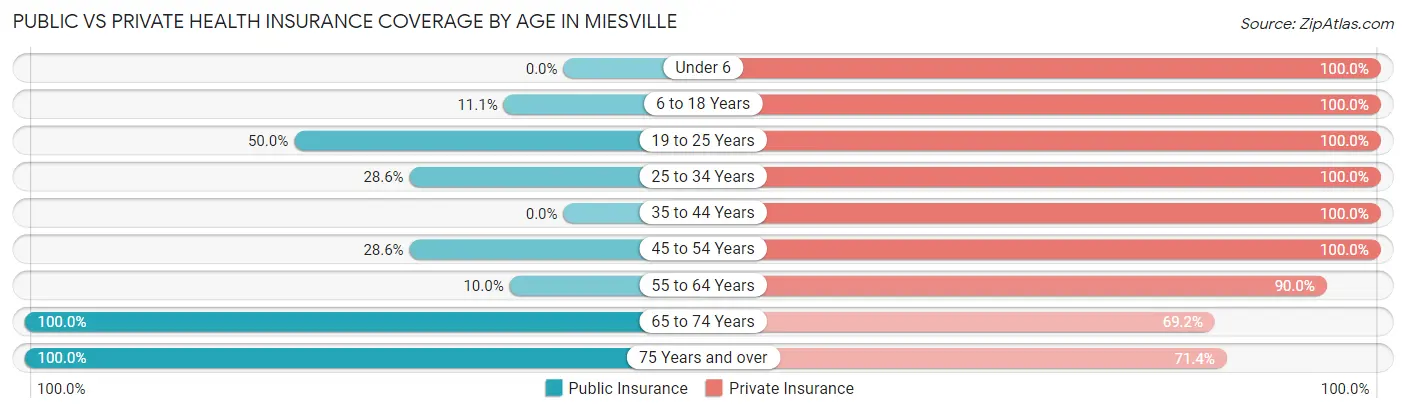
| Age Bracket | Public Insurance | Private Insurance |
| Under 6 | 0 (0.0%) | 19 (100.0%) |
| 6 to 18 Years | 2 (11.1%) | 18 (100.0%) |
| 19 to 25 Years | 3 (50.0%) | 6 (100.0%) |
| 25 to 34 Years | 2 (28.6%) | 7 (100.0%) |
| 35 to 44 Years | 0 (0.0%) | 20 (100.0%) |
| 45 to 54 Years | 2 (28.6%) | 7 (100.0%) |
| 55 to 64 Years | 1 (10.0%) | 9 (90.0%) |
| 65 to 74 Years | 13 (100.0%) | 9 (69.2%) |
| 75 Years and over | 14 (100.0%) | 10 (71.4%) |
| Total | 37 (32.5%) | 105 (92.1%) |
Disability Status by Sex by Age in Miesville
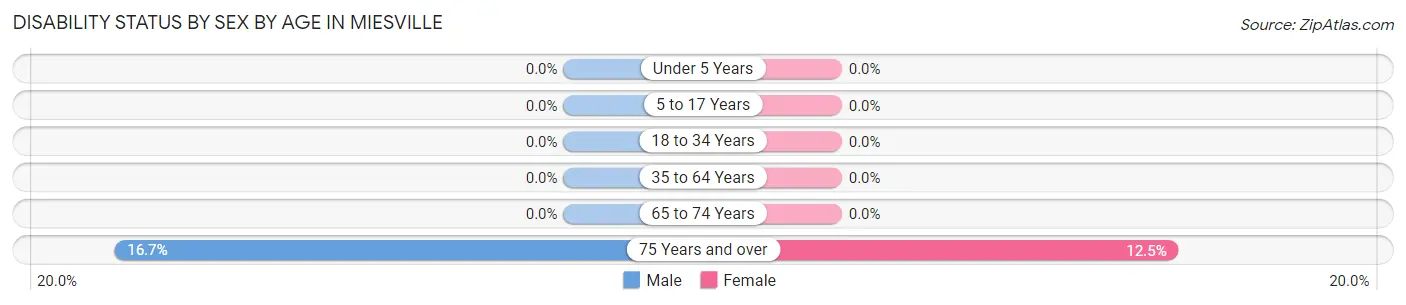
| Age Bracket | Male | Female |
| Under 5 Years | 0 (0.0%) | 0 (0.0%) |
| 5 to 17 Years | 0 (0.0%) | 0 (0.0%) |
| 18 to 34 Years | 0 (0.0%) | 0 (0.0%) |
| 35 to 64 Years | 0 (0.0%) | 0 (0.0%) |
| 65 to 74 Years | 0 (0.0%) | 0 (0.0%) |
| 75 Years and over | 1 (16.7%) | 1 (12.5%) |
Disability Class by Sex by Age in Miesville
Disability Class: Hearing Difficulty
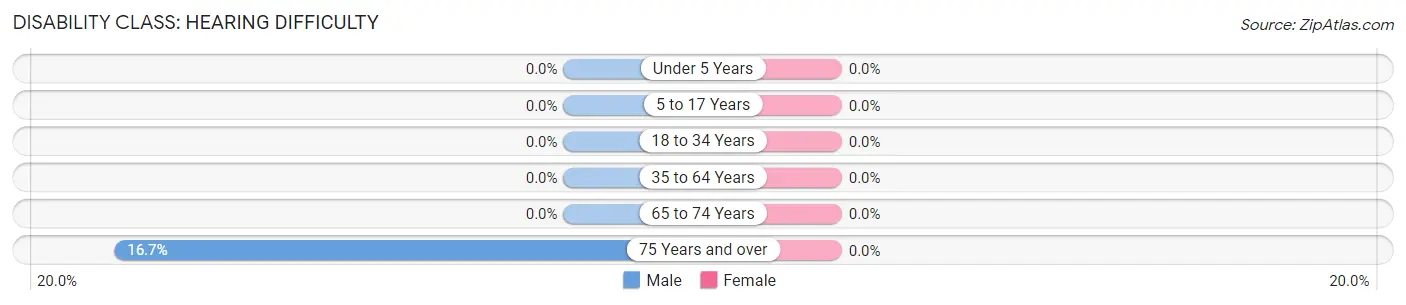
| Age Bracket | Male | Female |
| Under 5 Years | 0 (0.0%) | 0 (0.0%) |
| 5 to 17 Years | 0 (0.0%) | 0 (0.0%) |
| 18 to 34 Years | 0 (0.0%) | 0 (0.0%) |
| 35 to 64 Years | 0 (0.0%) | 0 (0.0%) |
| 65 to 74 Years | 0 (0.0%) | 0 (0.0%) |
| 75 Years and over | 1 (16.7%) | 0 (0.0%) |
Disability Class: Vision Difficulty
| Age Bracket | Male | Female |
| Under 5 Years | 0 (0.0%) | 0 (0.0%) |
| 5 to 17 Years | 0 (0.0%) | 0 (0.0%) |
| 18 to 34 Years | 0 (0.0%) | 0 (0.0%) |
| 35 to 64 Years | 0 (0.0%) | 0 (0.0%) |
| 65 to 74 Years | 0 (0.0%) | 0 (0.0%) |
| 75 Years and over | 0 (0.0%) | 0 (0.0%) |
Disability Class: Cognitive Difficulty
| Age Bracket | Male | Female |
| 5 to 17 Years | 0 (0.0%) | 0 (0.0%) |
| 18 to 34 Years | 0 (0.0%) | 0 (0.0%) |
| 35 to 64 Years | 0 (0.0%) | 0 (0.0%) |
| 65 to 74 Years | 0 (0.0%) | 0 (0.0%) |
| 75 Years and over | 0 (0.0%) | 0 (0.0%) |
Disability Class: Ambulatory Difficulty
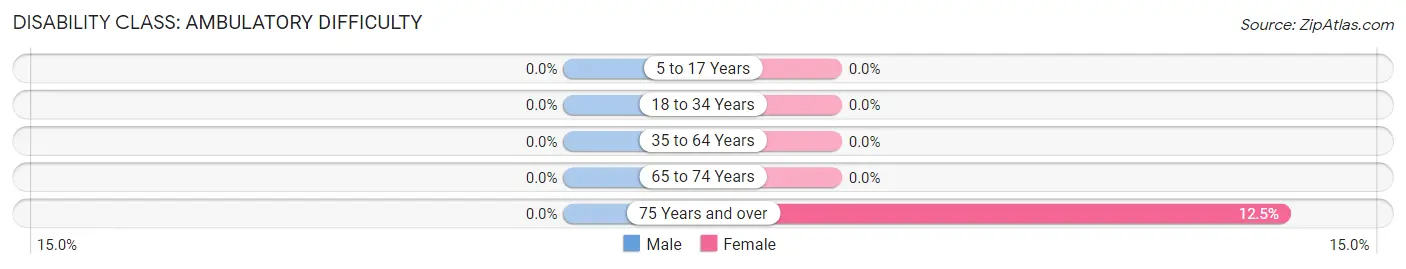
| Age Bracket | Male | Female |
| 5 to 17 Years | 0 (0.0%) | 0 (0.0%) |
| 18 to 34 Years | 0 (0.0%) | 0 (0.0%) |
| 35 to 64 Years | 0 (0.0%) | 0 (0.0%) |
| 65 to 74 Years | 0 (0.0%) | 0 (0.0%) |
| 75 Years and over | 0 (0.0%) | 1 (12.5%) |
Disability Class: Self-Care Difficulty
| Age Bracket | Male | Female |
| 5 to 17 Years | 0 (0.0%) | 0 (0.0%) |
| 18 to 34 Years | 0 (0.0%) | 0 (0.0%) |
| 35 to 64 Years | 0 (0.0%) | 0 (0.0%) |
| 65 to 74 Years | 0 (0.0%) | 0 (0.0%) |
| 75 Years and over | 0 (0.0%) | 0 (0.0%) |
Technology Access in Miesville
Computing Device Access in Miesville
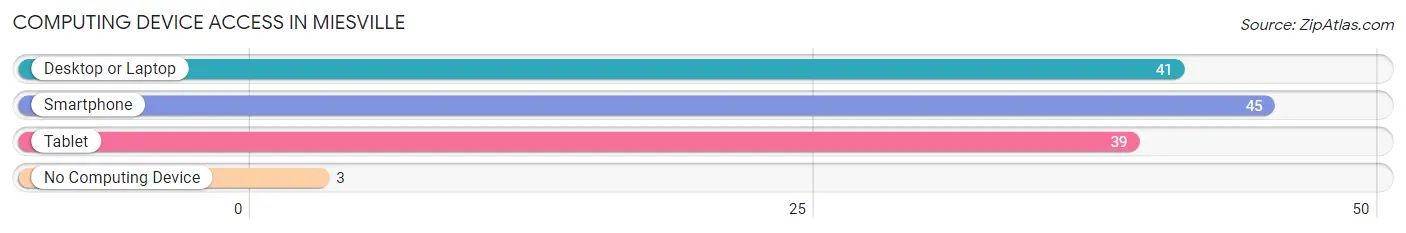
| Device Type | # Households | % Households |
| Desktop or Laptop | 41 | 80.4% |
| Smartphone | 45 | 88.2% |
| Tablet | 39 | 76.5% |
| No Computing Device | 3 | 5.9% |
| Total | 51 | 100.0% |
Internet Access in Miesville
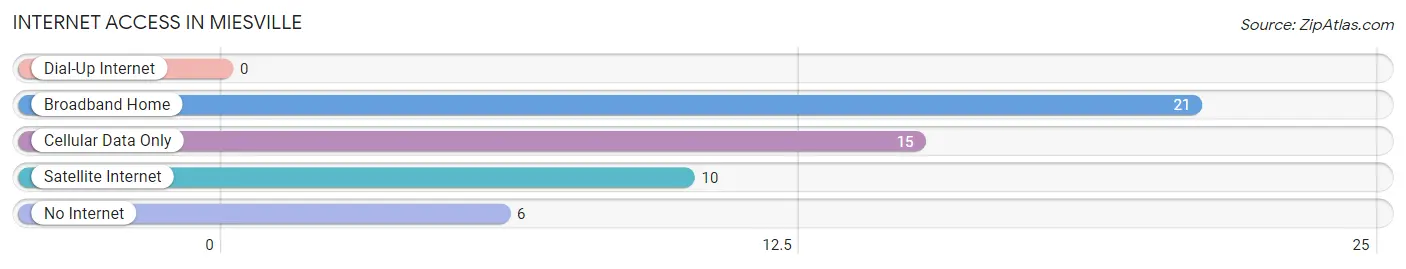
| Internet Type | # Households | % Households |
| Dial-Up Internet | 0 | 0.0% |
| Broadband Home | 21 | 41.2% |
| Cellular Data Only | 15 | 29.4% |
| Satellite Internet | 10 | 19.6% |
| No Internet | 6 | 11.8% |
| Total | 51 | 100.0% |
Miesville Summary
Miesville, Minnesota is a small city located in the southeastern corner of the state, just a few miles from the Wisconsin border. It is part of the Twin Cities metropolitan area and is home to a population of just over 1,000 people. The city is known for its small-town charm and its proximity to the larger cities of Minneapolis and St. Paul.
Geography
Miesville is located in the southeastern corner of Minnesota, just a few miles from the Wisconsin border. It is part of the Twin Cities metropolitan area and is located in Goodhue County. The city is situated on the banks of the Cannon River and is surrounded by rolling hills and farmland. The city is located at an elevation of 890 feet above sea level.
History
Miesville was founded in 1856 by German immigrants who named the city after their hometown of Miesenheim, Germany. The city was originally a farming community and was known for its production of wheat, corn, and other grains. In the late 19th century, the city began to grow and develop as a small industrial center. The city was home to several factories, including a flour mill, a sawmill, and a brickyard.
In the early 20th century, the city experienced a period of growth and development. The city was home to several businesses, including a bank, a hotel, and a movie theater. The city also had a streetcar line that connected it to the larger cities of Minneapolis and St. Paul.
Economy
Miesville’s economy is largely based on agriculture and manufacturing. The city is home to several farms that produce a variety of crops, including corn, soybeans, and wheat. The city is also home to several manufacturing companies, including a plastics manufacturer and a metal fabrication company.
The city is also home to several small businesses, including restaurants, retail stores, and professional services. The city is also home to a number of tourist attractions, including a golf course, a winery, and a museum.
Demographics
As of the 2010 census, the population of Miesville was 1,072. The population is largely white (94.3%) and the median age is 43. The median household income is $50,938 and the median home value is $179,400.
Conclusion
Miesville, Minnesota is a small city located in the southeastern corner of the state, just a few miles from the Wisconsin border. It is part of the Twin Cities metropolitan area and is home to a population of just over 1,000 people. The city is known for its small-town charm and its proximity to the larger cities of Minneapolis and St. Paul. The city’s economy is largely based on agriculture and manufacturing, and it is home to several small businesses, tourist attractions, and professional services. The population is largely white and the median age is 43.
Common Questions
What is Per Capita Income in Miesville?
Per Capita income in Miesville is $36,779.
What is the Median Family Income in Miesville?
Median Family Income in Miesville is $111,250.
What is the Median Household income in Miesville?
Median Household Income in Miesville is $89,063.
What is Inequality or Gini Index in Miesville?
Inequality or Gini Index in Miesville is 0.33.
What is the Total Population of Miesville?
Total Population of Miesville is 114.
What is the Total Male Population of Miesville?
Total Male Population of Miesville is 53.
What is the Total Female Population of Miesville?
Total Female Population of Miesville is 61.
What is the Ratio of Males per 100 Females in Miesville?
There are 86.89 Males per 100 Females in Miesville.
What is the Ratio of Females per 100 Males in Miesville?
There are 115.09 Females per 100 Males in Miesville.
What is the Median Population Age in Miesville?
Median Population Age in Miesville is 38.8 Years.
What is the Average Family Size in Miesville
Average Family Size in Miesville is 3.1 People.
What is the Average Household Size in Miesville
Average Household Size in Miesville is 2.2 People.
How Large is the Labor Force in Miesville?
There are 53 People in the Labor Forcein in Miesville.
What is the Percentage of People in the Labor Force in Miesville?
68.8% of People are in the Labor Force in Miesville.
What is the Unemployment Rate in Miesville?
Unemployment Rate in Miesville is 3.8%.