Strathcona, MN Map & Demographics
Strathcona Map
Strathcona Overview
$21,569
PER CAPITA INCOME
$41,250
AVG FAMILY INCOME
$36,875
AVG HOUSEHOLD INCOME
0.30
INEQUALITY / GINI INDEX
13
TOTAL POPULATION
5
MALE POPULATION
8
FEMALE POPULATION
62.50
MALES / 100 FEMALES
160.00
FEMALES / 100 MALES
44.5
MEDIAN AGE
3.0
AVG FAMILY SIZE
2.6
AVG HOUSEHOLD SIZE
7
LABOR FORCE [ PEOPLE ]
77.8%
PERCENT IN LABOR FORCE
Strathcona Zip Codes
Strathcona Area Codes
Income in Strathcona
Income Overview in Strathcona
Per Capita Income in Strathcona is $21,569, while median incomes of families and households are $41,250 and $36,875 respectively.
| Characteristic | Number | Measure |
| Per Capita Income | 13 | $21,569 |
| Median Family Income | 4 | $41,250 |
| Mean Family Income | 4 | $62,925 |
| Median Household Income | 5 | $36,875 |
| Mean Household Income | 5 | $56,080 |
| Income Deficit | 4 | $0 |
| Wage / Income Gap (%) | 13 | 0.00% |
| Wage / Income Gap ($) | 13 | 100.00¢ per $1 |
| Gini / Inequality Index | 13 | 0.30 |
Earnings by Sex in Strathcona
| Sex | Number | Average Earnings |
| Male | 2 (28.6%) | $0 |
| Female | 5 (71.4%) | $0 |
| Total | 7 (100.0%) | $0 |
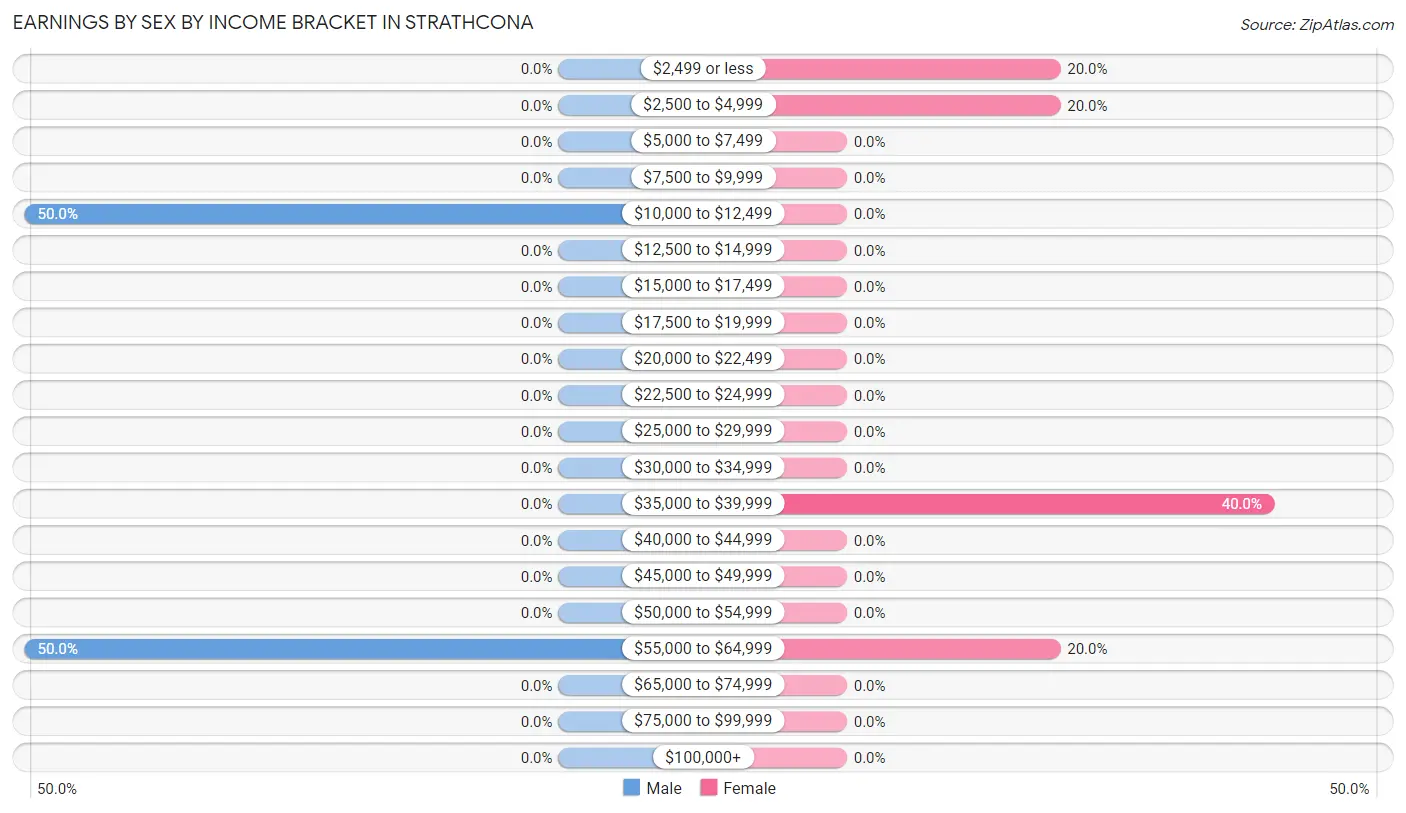
Earnings by Sex by Income Bracket in Strathcona
The most common earnings brackets in Strathcona are $10,000 to $12,499 for men (1 | 50.0%) and $35,000 to $39,999 for women (2 | 40.0%).
| Income | Male | Female |
| $2,499 or less | 0 (0.0%) | 1 (20.0%) |
| $2,500 to $4,999 | 0 (0.0%) | 1 (20.0%) |
| $5,000 to $7,499 | 0 (0.0%) | 0 (0.0%) |
| $7,500 to $9,999 | 0 (0.0%) | 0 (0.0%) |
| $10,000 to $12,499 | 1 (50.0%) | 0 (0.0%) |
| $12,500 to $14,999 | 0 (0.0%) | 0 (0.0%) |
| $15,000 to $17,499 | 0 (0.0%) | 0 (0.0%) |
| $17,500 to $19,999 | 0 (0.0%) | 0 (0.0%) |
| $20,000 to $22,499 | 0 (0.0%) | 0 (0.0%) |
| $22,500 to $24,999 | 0 (0.0%) | 0 (0.0%) |
| $25,000 to $29,999 | 0 (0.0%) | 0 (0.0%) |
| $30,000 to $34,999 | 0 (0.0%) | 0 (0.0%) |
| $35,000 to $39,999 | 0 (0.0%) | 2 (40.0%) |
| $40,000 to $44,999 | 0 (0.0%) | 0 (0.0%) |
| $45,000 to $49,999 | 0 (0.0%) | 0 (0.0%) |
| $50,000 to $54,999 | 0 (0.0%) | 0 (0.0%) |
| $55,000 to $64,999 | 1 (50.0%) | 1 (20.0%) |
| $65,000 to $74,999 | 0 (0.0%) | 0 (0.0%) |
| $75,000 to $99,999 | 0 (0.0%) | 0 (0.0%) |
| $100,000+ | 0 (0.0%) | 0 (0.0%) |
| Total | 2 (100.0%) | 5 (100.0%) |
Earnings by Sex by Educational Attainment in Strathcona
| Educational Attainment | Male Income | Female Income |
| Less than High School | - | - |
| High School Diploma | - | - |
| College or Associate's Degree | - | - |
| Bachelor's Degree | - | - |
| Graduate Degree | - | - |
| Total | - | - |
Family Income in Strathcona
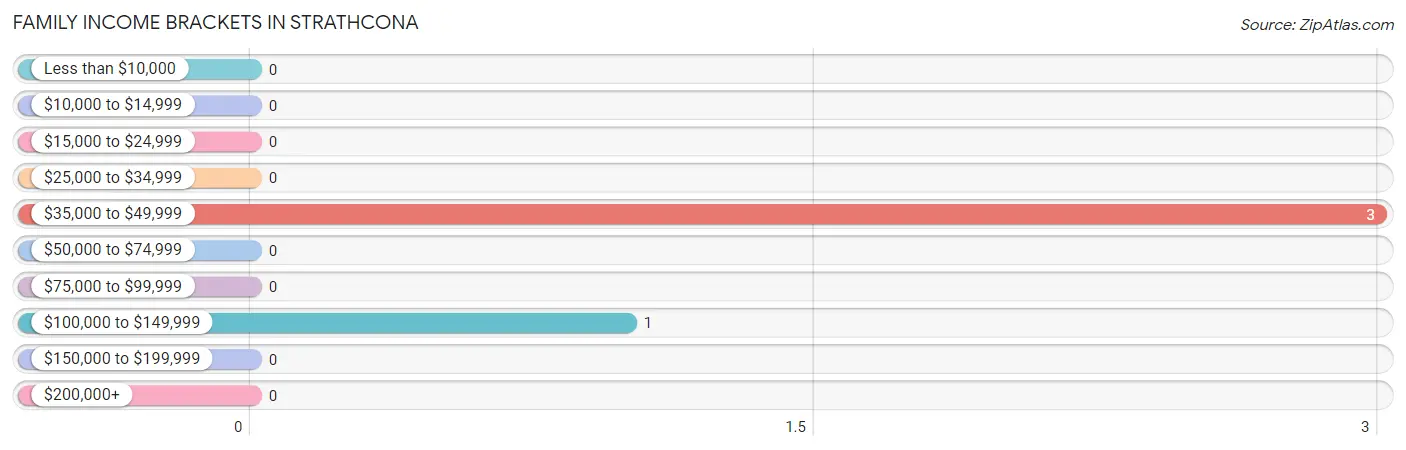
Family Income Brackets in Strathcona
According to the Strathcona family income data, there are 3 families falling into the $35,000 to $49,999 income range, which is the most common income bracket and makes up 75.0% of all families.
| Income Bracket | # Families | % Families |
| Less than $10,000 | 0 | 0.0% |
| $10,000 to $14,999 | 0 | 0.0% |
| $15,000 to $24,999 | 0 | 0.0% |
| $25,000 to $34,999 | 0 | 0.0% |
| $35,000 to $49,999 | 3 | 75.0% |
| $50,000 to $74,999 | 0 | 0.0% |
| $75,000 to $99,999 | 0 | 0.0% |
| $100,000 to $149,999 | 1 | 25.0% |
| $150,000 to $199,999 | 0 | 0.0% |
| $200,000+ | 0 | 0.0% |
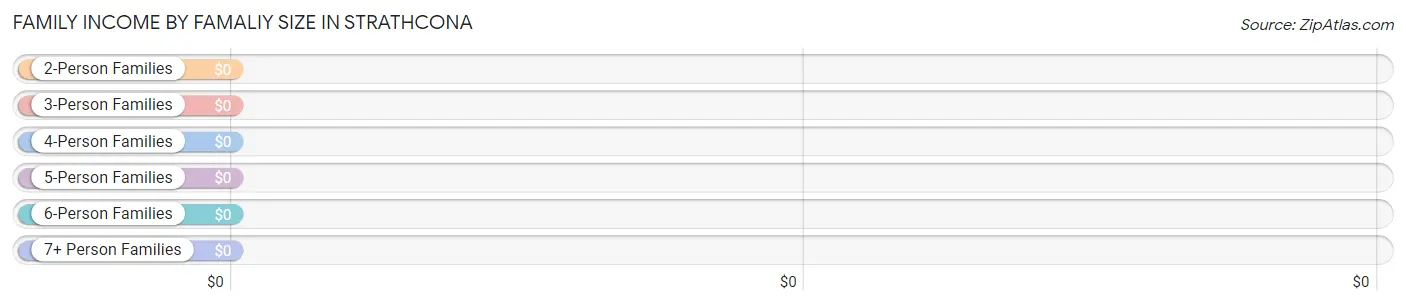
Family Income by Famaliy Size in Strathcona
| Income Bracket | # Families | Median Income |
| 2-Person Families | 3 (75.0%) | $0 |
| 3-Person Families | 0 (0.0%) | $0 |
| 4-Person Families | 0 (0.0%) | $0 |
| 5-Person Families | 0 (0.0%) | $0 |
| 6-Person Families | 1 (25.0%) | $0 |
| 7+ Person Families | 0 (0.0%) | $0 |
| Total | 4 (100.0%) | $41,250 |
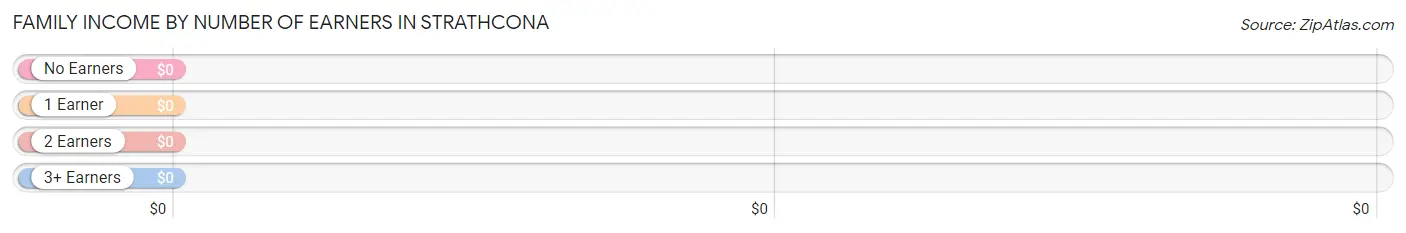
Family Income by Number of Earners in Strathcona
| Number of Earners | # Families | Median Income |
| No Earners | 0 (0.0%) | $0 |
| 1 Earner | 3 (75.0%) | $0 |
| 2 Earners | 0 (0.0%) | $0 |
| 3+ Earners | 1 (25.0%) | $0 |
| Total | 4 (100.0%) | $41,250 |
Household Income in Strathcona
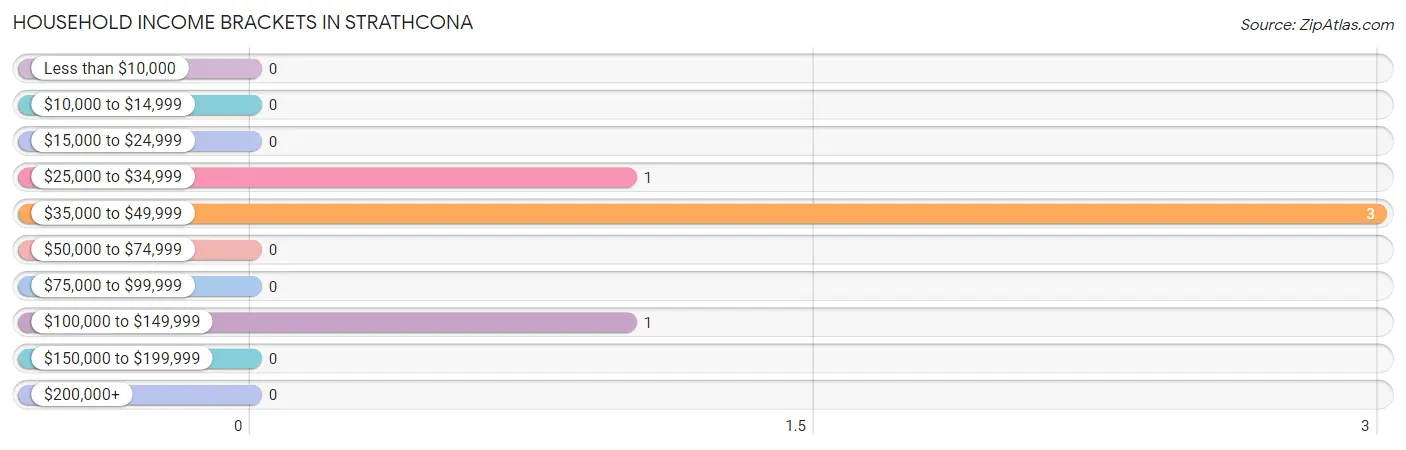
Household Income Brackets in Strathcona
With 3 households falling in the category, the $35,000 to $49,999 income range is the most frequent in Strathcona, accounting for 60.0% of all households.
| Income Bracket | # Households | % Households |
| Less than $10,000 | 0 | 0.0% |
| $10,000 to $14,999 | 0 | 0.0% |
| $15,000 to $24,999 | 0 | 0.0% |
| $25,000 to $34,999 | 1 | 20.0% |
| $35,000 to $49,999 | 3 | 60.0% |
| $50,000 to $74,999 | 0 | 0.0% |
| $75,000 to $99,999 | 0 | 0.0% |
| $100,000 to $149,999 | 1 | 20.0% |
| $150,000 to $199,999 | 0 | 0.0% |
| $200,000+ | 0 | 0.0% |
Household Income by Householder Age in Strathcona
| Income Bracket | # Households | Median Income |
| 15 to 24 Years | 0 (0.0%) | $0 |
| 25 to 44 Years | 0 (0.0%) | $0 |
| 45 to 64 Years | 3 (60.0%) | $0 |
| 65+ Years | 2 (40.0%) | $0 |
| Total | 5 (100.0%) | $36,875 |
Poverty in Strathcona
Income Below Poverty by Sex and Age in Strathcona
| Age Bracket | Male | Female |
| Under 5 Years | 0 (0.0%) | 0 (0.0%) |
| 5 Years | 0 (0.0%) | 0 (0.0%) |
| 6 to 11 Years | 0 (0.0%) | 0 (0.0%) |
| 12 to 14 Years | 0 (0.0%) | 0 (0.0%) |
| 15 Years | 0 (0.0%) | 0 (0.0%) |
| 16 and 17 Years | 0 (0.0%) | 0 (0.0%) |
| 18 to 24 Years | 0 (0.0%) | 0 (0.0%) |
| 25 to 34 Years | 0 (0.0%) | 0 (0.0%) |
| 35 to 44 Years | 0 (0.0%) | 0 (0.0%) |
| 45 to 54 Years | 0 (0.0%) | 0 (0.0%) |
| 55 to 64 Years | 0 (0.0%) | 0 (0.0%) |
| 65 to 74 Years | 0 (0.0%) | 0 (0.0%) |
| 75 Years and over | 0 (0.0%) | 0 (0.0%) |
| Total | 0 (0.0%) | 0 (0.0%) |
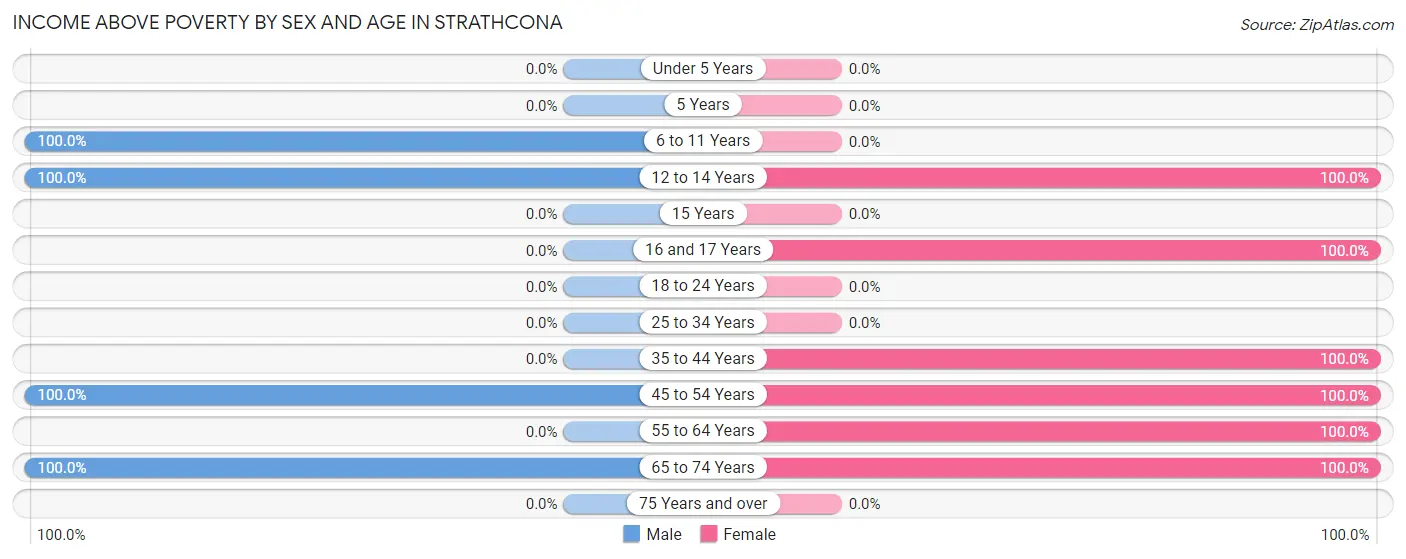
Income Above Poverty by Sex and Age in Strathcona
According to the poverty statistics in Strathcona, males aged 6 to 11 years and females aged 12 to 14 years are the age groups that are most secure financially, with 100.0% of males and 100.0% of females in these age groups living above the poverty line.
| Age Bracket | Male | Female |
| Under 5 Years | 0 (0.0%) | 0 (0.0%) |
| 5 Years | 0 (0.0%) | 0 (0.0%) |
| 6 to 11 Years | 1 (100.0%) | 0 (0.0%) |
| 12 to 14 Years | 2 (100.0%) | 1 (100.0%) |
| 15 Years | 0 (0.0%) | 0 (0.0%) |
| 16 and 17 Years | 0 (0.0%) | 2 (100.0%) |
| 18 to 24 Years | 0 (0.0%) | 0 (0.0%) |
| 25 to 34 Years | 0 (0.0%) | 0 (0.0%) |
| 35 to 44 Years | 0 (0.0%) | 1 (100.0%) |
| 45 to 54 Years | 1 (100.0%) | 2 (100.0%) |
| 55 to 64 Years | 0 (0.0%) | 1 (100.0%) |
| 65 to 74 Years | 1 (100.0%) | 1 (100.0%) |
| 75 Years and over | 0 (0.0%) | 0 (0.0%) |
| Total | 5 (100.0%) | 8 (100.0%) |
Income Below Poverty Among Married-Couple Families in Strathcona
| Children | Above Poverty | Below Poverty |
| No Children | 1 (100.0%) | 0 (0.0%) |
| 1 or 2 Children | 0 (0.0%) | 0 (0.0%) |
| 3 or 4 Children | 1 (100.0%) | 0 (0.0%) |
| 5 or more Children | 0 (0.0%) | 0 (0.0%) |
| Total | 2 (100.0%) | 0 (0.0%) |
Income Below Poverty Among Single-Parent Households in Strathcona
| Children | Single Father | Single Mother |
| No Children | 0 (0.0%) | 0 (0.0%) |
| 1 or 2 Children | 0 (0.0%) | 0 (0.0%) |
| 3 or 4 Children | 0 (0.0%) | 0 (0.0%) |
| 5 or more Children | 0 (0.0%) | 0 (0.0%) |
| Total | 0 (0.0%) | 0 (0.0%) |
Income Below Poverty Among Married-Couple vs Single-Parent Households in Strathcona
| Children | Married-Couple Families | Single-Parent Households |
| No Children | 0 (0.0%) | 0 (0.0%) |
| 1 or 2 Children | 0 (0.0%) | 0 (0.0%) |
| 3 or 4 Children | 0 (0.0%) | 0 (0.0%) |
| 5 or more Children | 0 (0.0%) | 0 (0.0%) |
| Total | 0 (0.0%) | 0 (0.0%) |
Race in Strathcona
The most populous races in Strathcona are White / Caucasian (12 | 92.3%), and Black / African American (1 | 7.7%).
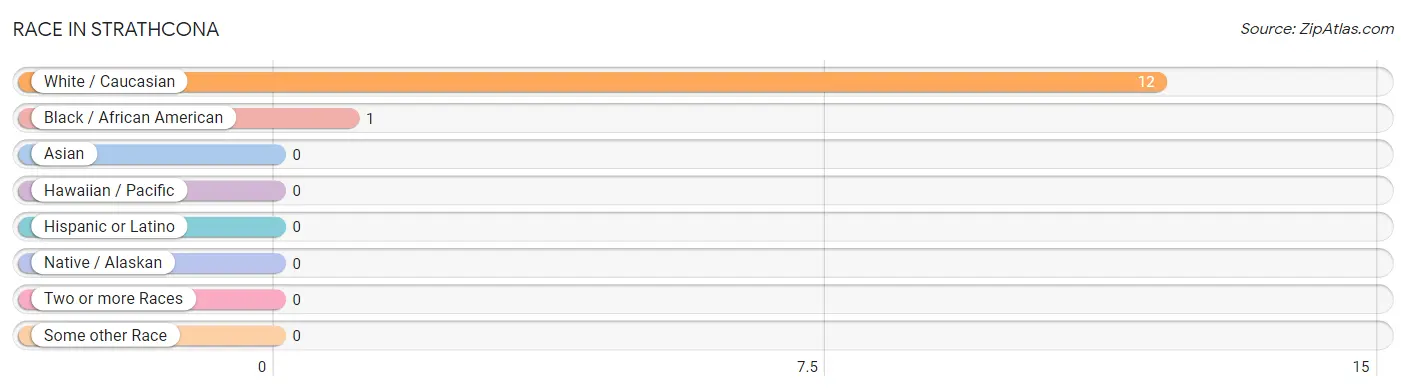
| Race | # Population | % Population |
| Asian | 0 | 0.0% |
| Black / African American | 1 | 7.7% |
| Hawaiian / Pacific | 0 | 0.0% |
| Hispanic or Latino | 0 | 0.0% |
| Native / Alaskan | 0 | 0.0% |
| White / Caucasian | 12 | 92.3% |
| Two or more Races | 0 | 0.0% |
| Some other Race | 0 | 0.0% |
| Total | 13 | 100.0% |
Ancestry in Strathcona
The most populous ancestries reported in Strathcona are Norwegian (10 | 76.9%), Swedish (4 | 30.8%), African (1 | 7.7%), German (1 | 7.7%), and Irish (1 | 7.7%), together accounting for 130.8% of all Strathcona residents.
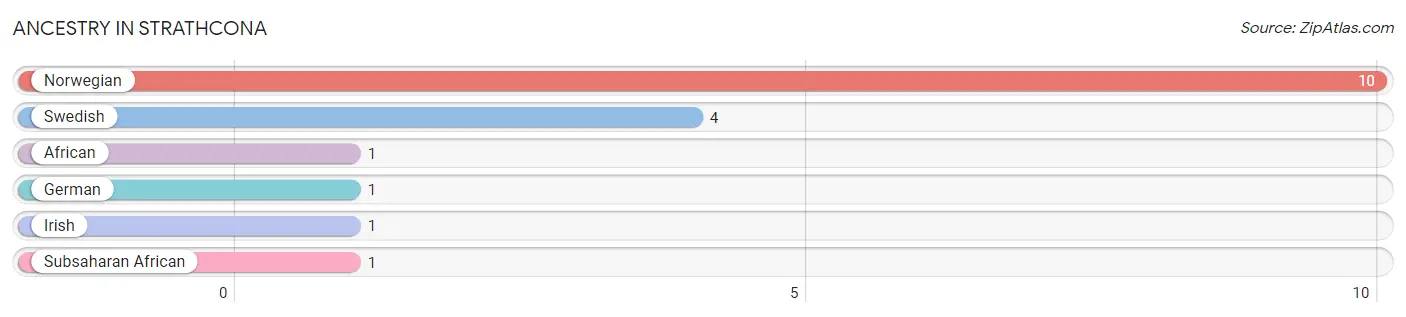
| Ancestry | # Population | % Population |
| African | 1 | 7.7% |
| German | 1 | 7.7% |
| Irish | 1 | 7.7% |
| Norwegian | 10 | 76.9% |
| Subsaharan African | 1 | 7.7% |
| Swedish | 4 | 30.8% | View All 6 Rows |
Immigrants in Strathcona

| Immigration Origin | # Population | % Population | View All 0 Rows |
Sex and Age in Strathcona
Sex and Age in Strathcona
The most populous age groups in Strathcona are 10 to 14 Years (2 | 40.0%) for men and 15 to 19 Years (2 | 25.0%) for women.
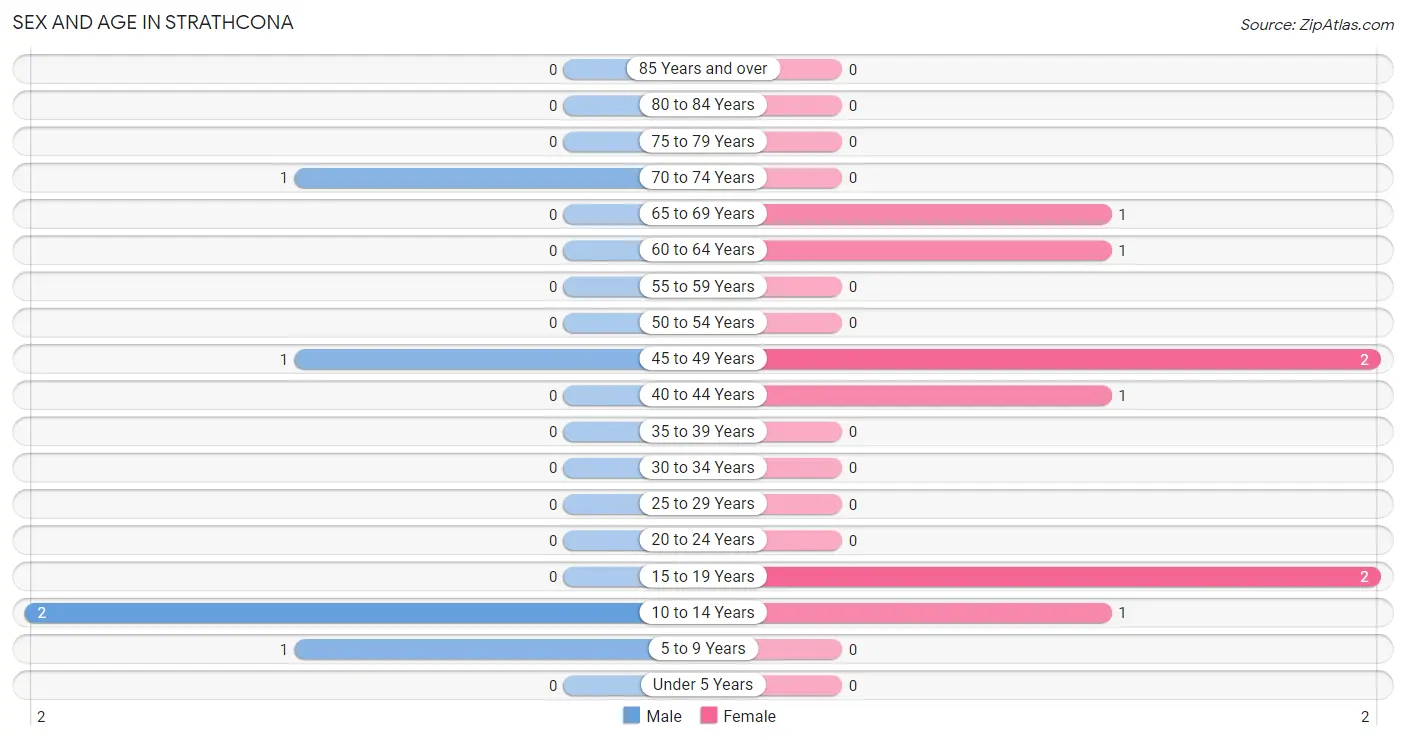
| Age Bracket | Male | Female |
| Under 5 Years | 0 (0.0%) | 0 (0.0%) |
| 5 to 9 Years | 1 (20.0%) | 0 (0.0%) |
| 10 to 14 Years | 2 (40.0%) | 1 (12.5%) |
| 15 to 19 Years | 0 (0.0%) | 2 (25.0%) |
| 20 to 24 Years | 0 (0.0%) | 0 (0.0%) |
| 25 to 29 Years | 0 (0.0%) | 0 (0.0%) |
| 30 to 34 Years | 0 (0.0%) | 0 (0.0%) |
| 35 to 39 Years | 0 (0.0%) | 0 (0.0%) |
| 40 to 44 Years | 0 (0.0%) | 1 (12.5%) |
| 45 to 49 Years | 1 (20.0%) | 2 (25.0%) |
| 50 to 54 Years | 0 (0.0%) | 0 (0.0%) |
| 55 to 59 Years | 0 (0.0%) | 0 (0.0%) |
| 60 to 64 Years | 0 (0.0%) | 1 (12.5%) |
| 65 to 69 Years | 0 (0.0%) | 1 (12.5%) |
| 70 to 74 Years | 1 (20.0%) | 0 (0.0%) |
| 75 to 79 Years | 0 (0.0%) | 0 (0.0%) |
| 80 to 84 Years | 0 (0.0%) | 0 (0.0%) |
| 85 Years and over | 0 (0.0%) | 0 (0.0%) |
| Total | 5 (100.0%) | 8 (100.0%) |
Families and Households in Strathcona
Median Family Size in Strathcona
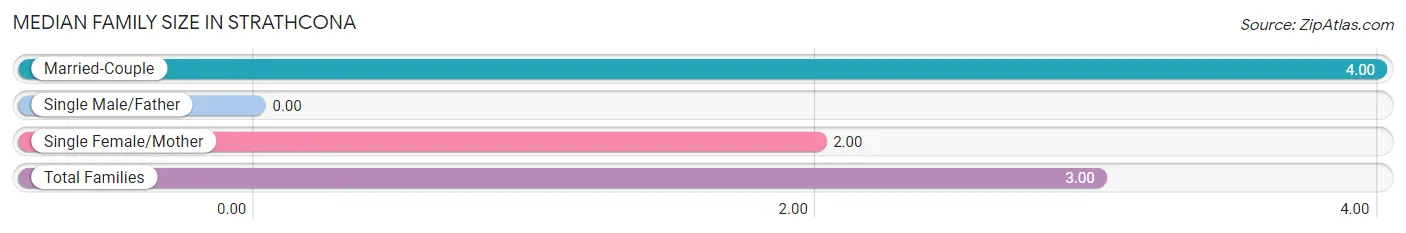
| Family Type | # Families | Family Size |
| Married-Couple | 2 (50.0%) | 4.00 |
| Single Male/Father | 0 (0.0%) | - |
| Single Female/Mother | 2 (50.0%) | 2.00 |
| Total Families | 4 (100.0%) | 3.00 |
Median Household Size in Strathcona
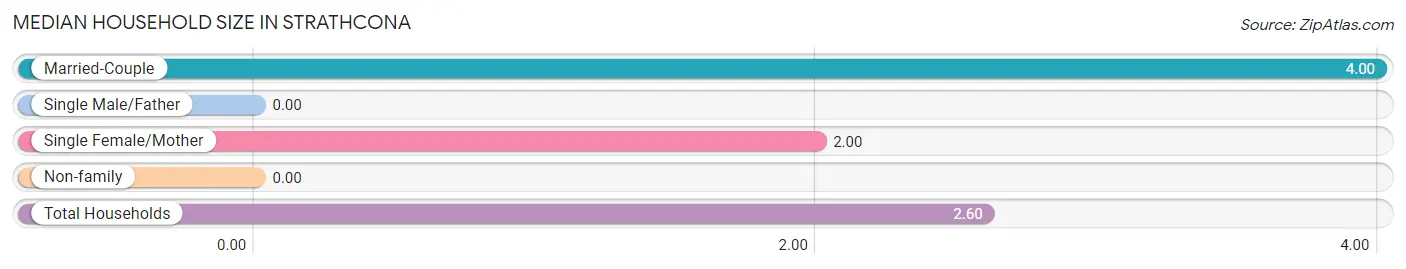
| Household Type | # Households | Household Size |
| Married-Couple | 2 (40.0%) | 4.00 |
| Single Male/Father | 0 (0.0%) | - |
| Single Female/Mother | 2 (40.0%) | 2.00 |
| Non-family | 1 (20.0%) | - |
| Total Households | 5 (100.0%) | 2.60 |
Household Size by Marriage Status in Strathcona
Out of a total of 5 households in Strathcona, 4 (80.0%) are family households, while 1 (20.0%) are nonfamily households. The most numerous type of family households are 2-person households, comprising 3, and the most common type of nonfamily households are 1-person households, comprising 1.
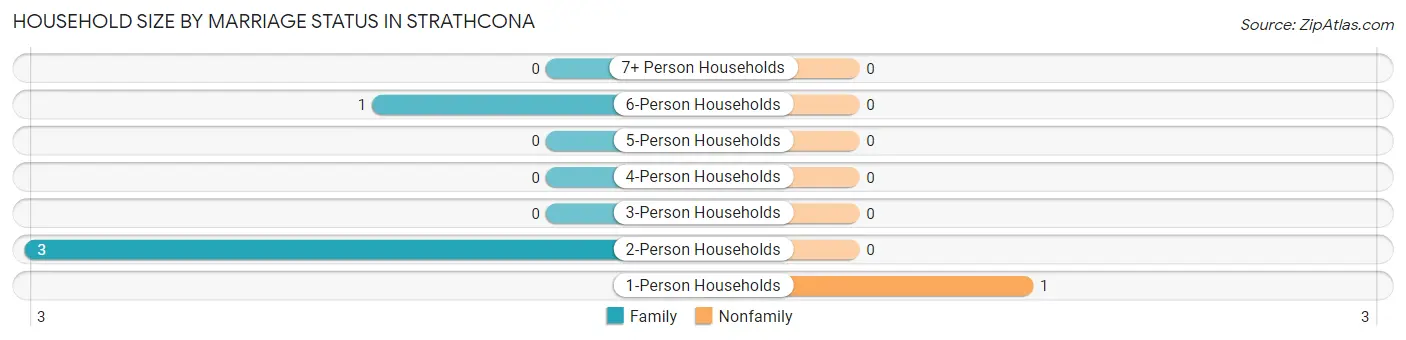
| Household Size | Family Households | Nonfamily Households |
| 1-Person Households | - | 1 (20.0%) |
| 2-Person Households | 3 (60.0%) | 0 (0.0%) |
| 3-Person Households | 0 (0.0%) | 0 (0.0%) |
| 4-Person Households | 0 (0.0%) | 0 (0.0%) |
| 5-Person Households | 0 (0.0%) | 0 (0.0%) |
| 6-Person Households | 1 (20.0%) | 0 (0.0%) |
| 7+ Person Households | 0 (0.0%) | 0 (0.0%) |
| Total | 4 (80.0%) | 1 (20.0%) |
Female Fertility in Strathcona
Fertility by Age in Strathcona
| Age Bracket | Women with Births | Births / 1,000 Women |
| 15 to 19 years | 0 (0.0%) | 0.0 |
| 20 to 34 years | 0 (0.0%) | 0.0 |
| 35 to 50 years | 0 (0.0%) | 0.0 |
| Total | 0 (0.0%) | 0.0 |
Fertility by Age by Marriage Status in Strathcona
| Age Bracket | Married | Unmarried |
| 15 to 19 years | 0 (0.0%) | 0 (0.0%) |
| 20 to 34 years | 0 (0.0%) | 0 (0.0%) |
| 35 to 50 years | 0 (0.0%) | 0 (0.0%) |
| Total | 0 (0.0%) | 0 (0.0%) |
Fertility by Education in Strathcona
| Educational Attainment | Women with Births | Births / 1,000 Women |
| Less than High School | 0 (0.0%) | 0.0 |
| High School Diploma | 0 (0.0%) | 0.0 |
| College or Associate's Degree | 0 (0.0%) | 0.0 |
| Bachelor's Degree | 0 (0.0%) | 0.0 |
| Graduate Degree | 0 (0.0%) | 0.0 |
| Total | 0 (0.0%) | 0.0 |
Fertility by Education by Marriage Status in Strathcona
| Educational Attainment | Married | Unmarried |
| Less than High School | 0 (0.0%) | 0 (0.0%) |
| High School Diploma | 0 (0.0%) | 0 (0.0%) |
| College or Associate's Degree | 0 (0.0%) | 0 (0.0%) |
| Bachelor's Degree | 0 (0.0%) | 0 (0.0%) |
| Graduate Degree | 0 (0.0%) | 0 (0.0%) |
| Total | 0 (0.0%) | 0 (0.0%) |
Employment Characteristics in Strathcona
Employment by Class of Employer in Strathcona
Among the 7 employed individuals in Strathcona, private company employees (3 | 42.9%), not-for-profit organizations (3 | 42.9%), and local government employees (1 | 14.3%) make up the most common classes of employment.
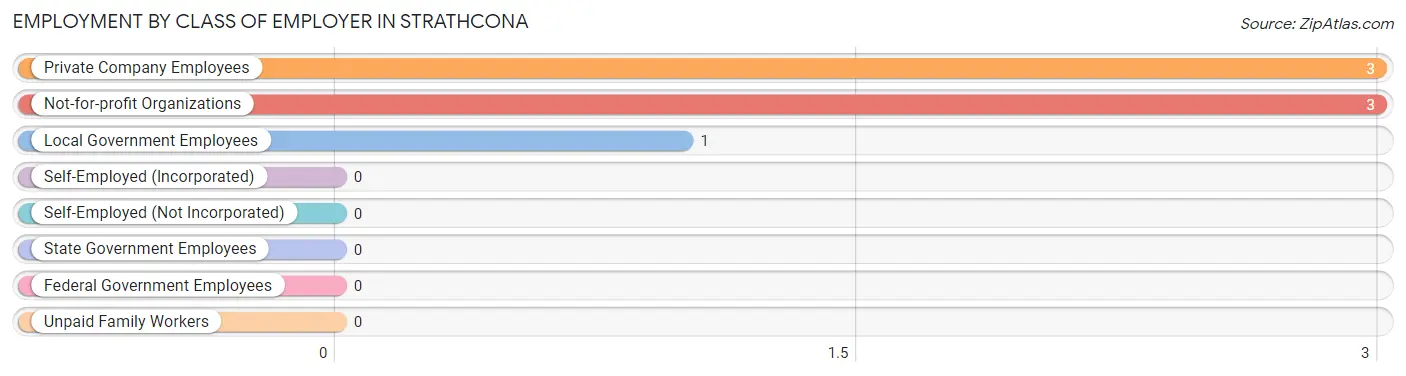
| Employer Class | # Employees | % Employees |
| Private Company Employees | 3 | 42.9% |
| Self-Employed (Incorporated) | 0 | 0.0% |
| Self-Employed (Not Incorporated) | 0 | 0.0% |
| Not-for-profit Organizations | 3 | 42.9% |
| Local Government Employees | 1 | 14.3% |
| State Government Employees | 0 | 0.0% |
| Federal Government Employees | 0 | 0.0% |
| Unpaid Family Workers | 0 | 0.0% |
| Total | 7 | 100.0% |
Employment Status by Age in Strathcona
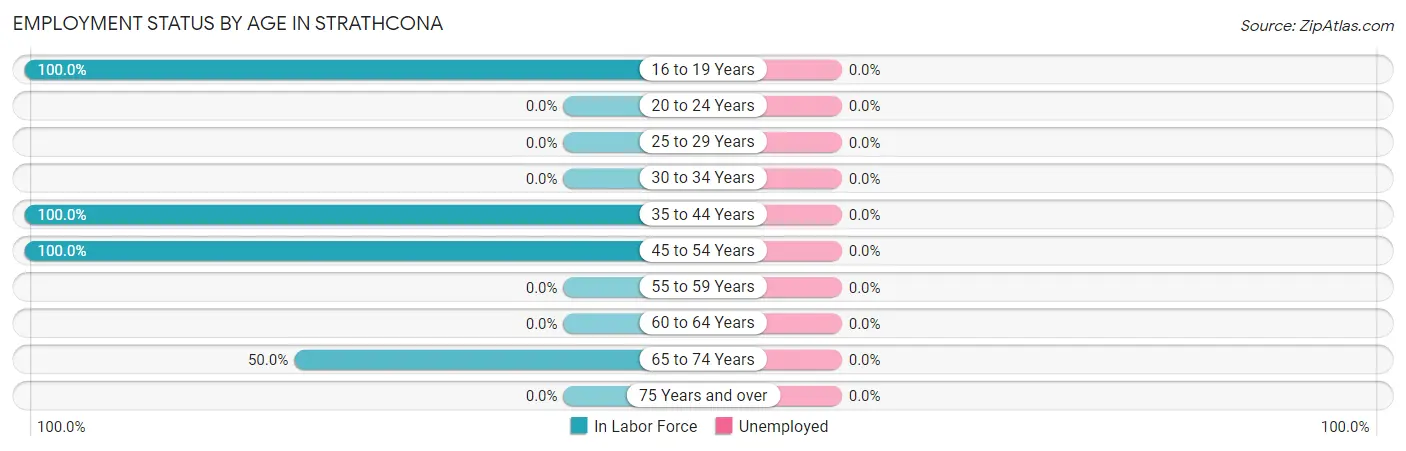
| Age Bracket | In Labor Force | Unemployed |
| 16 to 19 Years | 2 (100.0%) | 0 (0.0%) |
| 20 to 24 Years | 0 (0.0%) | 0 (0.0%) |
| 25 to 29 Years | 0 (0.0%) | 0 (0.0%) |
| 30 to 34 Years | 0 (0.0%) | 0 (0.0%) |
| 35 to 44 Years | 1 (100.0%) | 0 (0.0%) |
| 45 to 54 Years | 3 (100.0%) | 0 (0.0%) |
| 55 to 59 Years | 0 (0.0%) | 0 (0.0%) |
| 60 to 64 Years | 0 (0.0%) | 0 (0.0%) |
| 65 to 74 Years | 1 (50.0%) | 0 (0.0%) |
| 75 Years and over | 0 (0.0%) | 0 (0.0%) |
| Total | 7 (77.8%) | 0 (0.0%) |
Employment Status by Educational Attainment in Strathcona
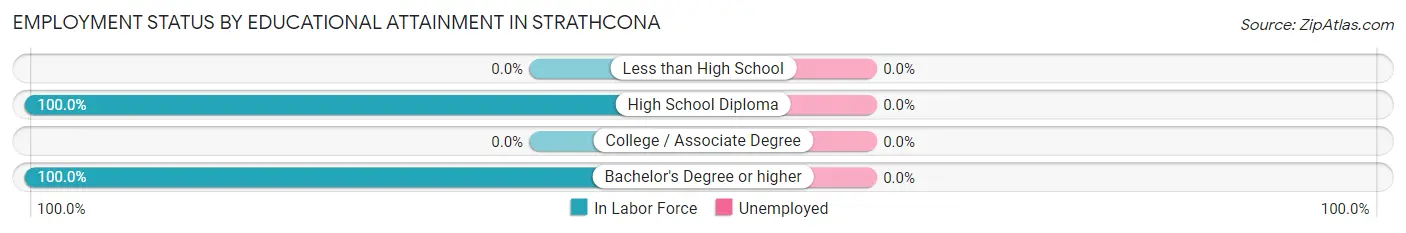
| Educational Attainment | In Labor Force | Unemployed |
| Less than High School | 0 (0.0%) | 0 (0.0%) |
| High School Diploma | 2 (100.0%) | 0 (0.0%) |
| College / Associate Degree | 0 (0.0%) | 0 (0.0%) |
| Bachelor's Degree or higher | 2 (100.0%) | 0 (0.0%) |
| Total | 4 (80.0%) | 0 (0.0%) |
Employment Occupations by Sex in Strathcona
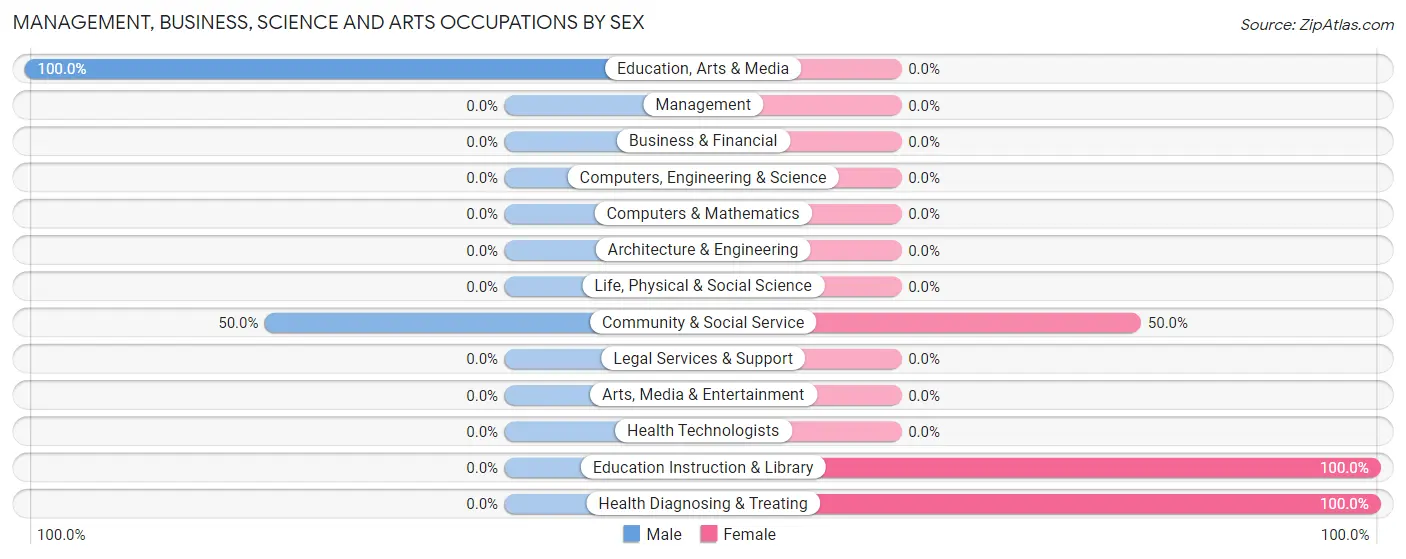
Management, Business, Science and Arts Occupations
The most common Management, Business, Science and Arts occupations in Strathcona are Community & Social Service (2 | 28.6%), Health Diagnosing & Treating (2 | 28.6%), Education, Arts & Media (1 | 14.3%), and Education Instruction & Library (1 | 14.3%).
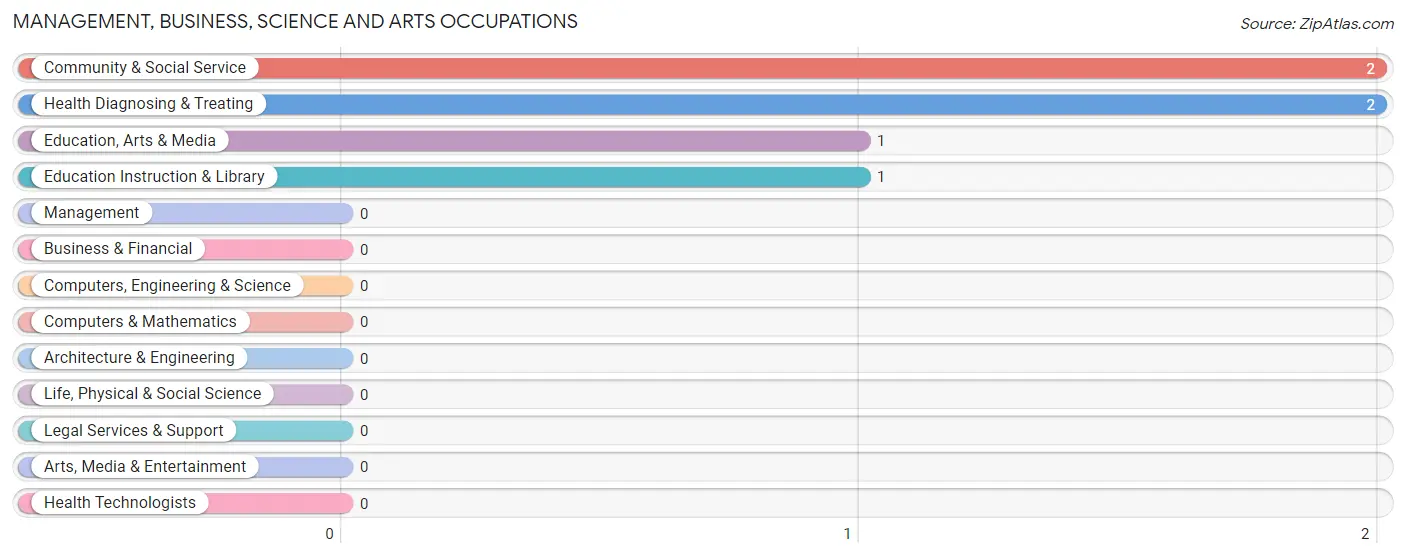
Management, Business, Science and Arts Occupations by Sex
Within the Management, Business, Science and Arts occupations in Strathcona, the most male-oriented occupations are Education, Arts & Media (100.0%), and Community & Social Service (50.0%), while the most female-oriented occupations are Education Instruction & Library (100.0%), Health Diagnosing & Treating (100.0%), and Community & Social Service (50.0%).
| Occupation | Male | Female |
| Management | 0 (0.0%) | 0 (0.0%) |
| Business & Financial | 0 (0.0%) | 0 (0.0%) |
| Computers, Engineering & Science | 0 (0.0%) | 0 (0.0%) |
| Computers & Mathematics | 0 (0.0%) | 0 (0.0%) |
| Architecture & Engineering | 0 (0.0%) | 0 (0.0%) |
| Life, Physical & Social Science | 0 (0.0%) | 0 (0.0%) |
| Community & Social Service | 1 (50.0%) | 1 (50.0%) |
| Education, Arts & Media | 1 (100.0%) | 0 (0.0%) |
| Legal Services & Support | 0 (0.0%) | 0 (0.0%) |
| Education Instruction & Library | 0 (0.0%) | 1 (100.0%) |
| Arts, Media & Entertainment | 0 (0.0%) | 0 (0.0%) |
| Health Diagnosing & Treating | 0 (0.0%) | 2 (100.0%) |
| Health Technologists | 0 (0.0%) | 0 (0.0%) |
| Total (Category) | 1 (25.0%) | 3 (75.0%) |
| Total (Overall) | 2 (28.6%) | 5 (71.4%) |
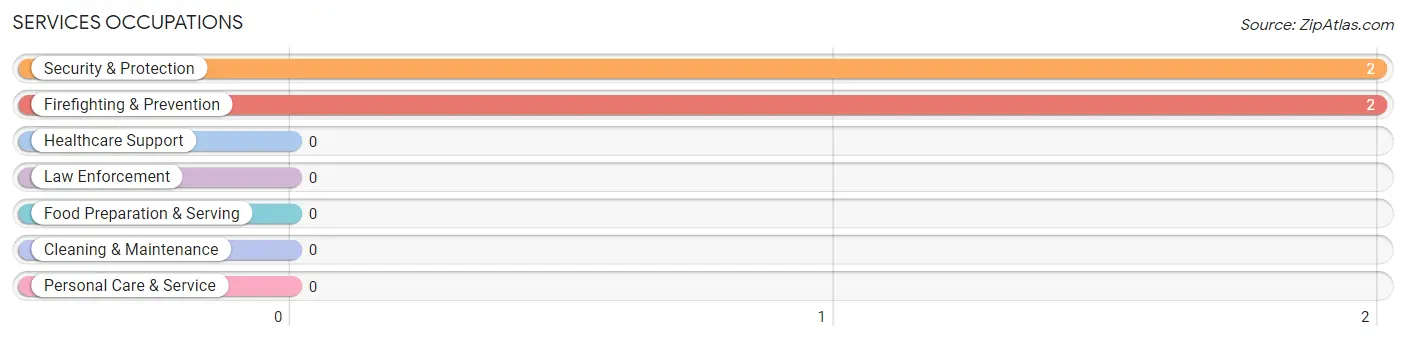
Services Occupations
The most common Services occupations in Strathcona are Security & Protection (2 | 28.6%), and Firefighting & Prevention (2 | 28.6%).
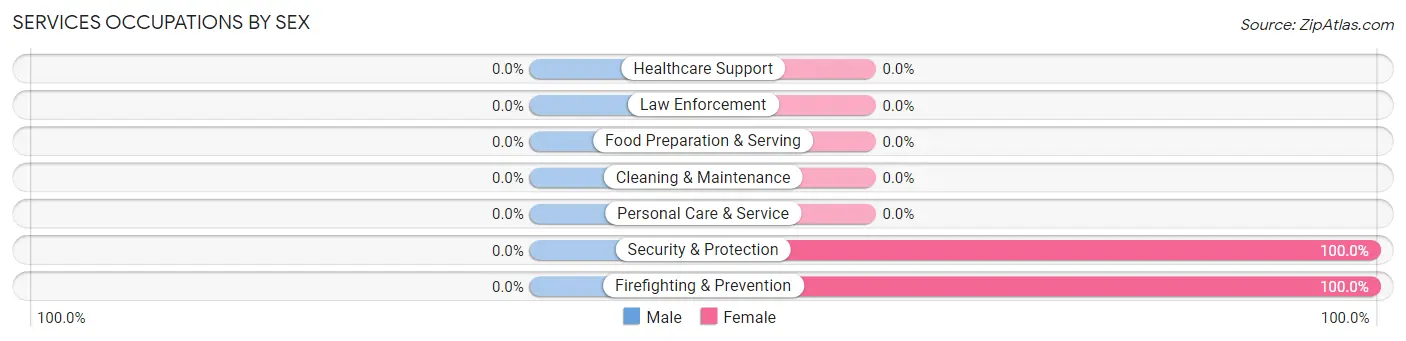
Services Occupations by Sex
| Occupation | Male | Female |
| Healthcare Support | 0 (0.0%) | 0 (0.0%) |
| Security & Protection | 0 (0.0%) | 2 (100.0%) |
| Firefighting & Prevention | 0 (0.0%) | 2 (100.0%) |
| Law Enforcement | 0 (0.0%) | 0 (0.0%) |
| Food Preparation & Serving | 0 (0.0%) | 0 (0.0%) |
| Cleaning & Maintenance | 0 (0.0%) | 0 (0.0%) |
| Personal Care & Service | 0 (0.0%) | 0 (0.0%) |
| Total (Category) | 0 (0.0%) | 2 (100.0%) |
| Total (Overall) | 2 (28.6%) | 5 (71.4%) |
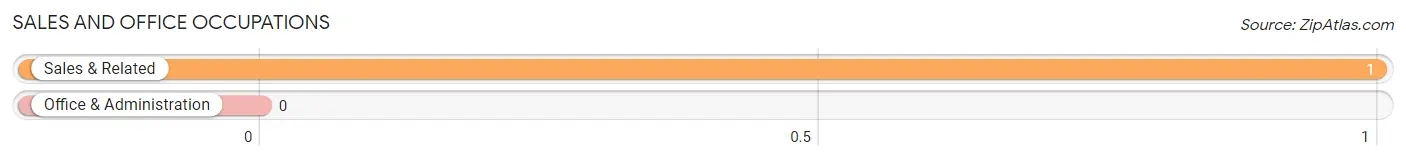
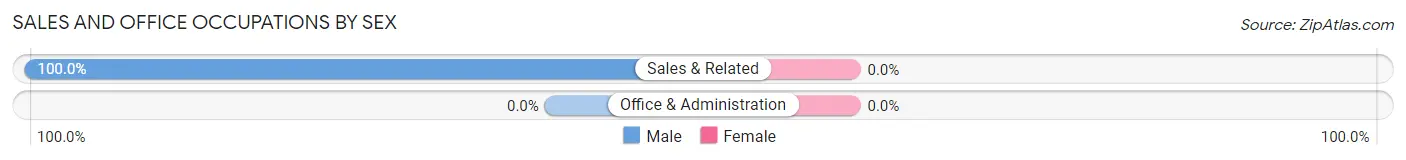
Sales and Office Occupations
The most common Sales and Office occupations in Strathcona are , and Sales & Related (1 | 14.3%).
Sales and Office Occupations by Sex
| Occupation | Male | Female |
| Sales & Related | 1 (100.0%) | 0 (0.0%) |
| Office & Administration | 0 (0.0%) | 0 (0.0%) |
| Total (Category) | 1 (100.0%) | 0 (0.0%) |
| Total (Overall) | 2 (28.6%) | 5 (71.4%) |
Natural Resources, Construction and Maintenance Occupations
Natural Resources, Construction and Maintenance Occupations by Sex
| Occupation | Male | Female |
| Farming, Fishing & Forestry | 0 (0.0%) | 0 (0.0%) |
| Construction & Extraction | 0 (0.0%) | 0 (0.0%) |
| Installation, Maintenance & Repair | 0 (0.0%) | 0 (0.0%) |
| Total (Category) | 0 (0.0%) | 0 (0.0%) |
| Total (Overall) | 2 (28.6%) | 5 (71.4%) |
Production, Transportation and Moving Occupations
Production, Transportation and Moving Occupations by Sex
| Occupation | Male | Female |
| Production | 0 (0.0%) | 0 (0.0%) |
| Transportation | 0 (0.0%) | 0 (0.0%) |
| Material Moving | 0 (0.0%) | 0 (0.0%) |
| Total (Category) | 0 (0.0%) | 0 (0.0%) |
| Total (Overall) | 2 (28.6%) | 5 (71.4%) |
Employment Industries by Sex in Strathcona
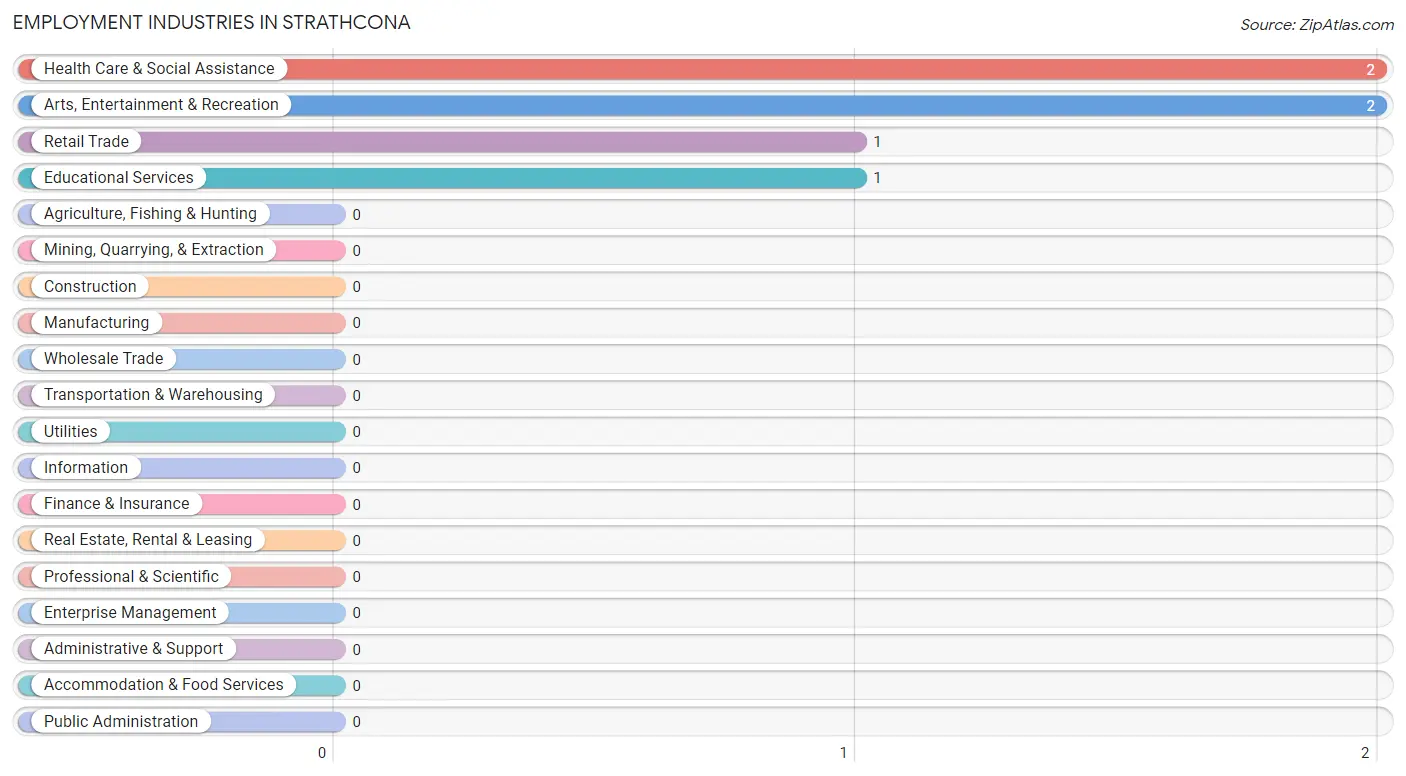
Employment Industries in Strathcona
The major employment industries in Strathcona include Health Care & Social Assistance (2 | 28.6%), Arts, Entertainment & Recreation (2 | 28.6%), Retail Trade (1 | 14.3%), and Educational Services (1 | 14.3%).
Employment Industries by Sex in Strathcona
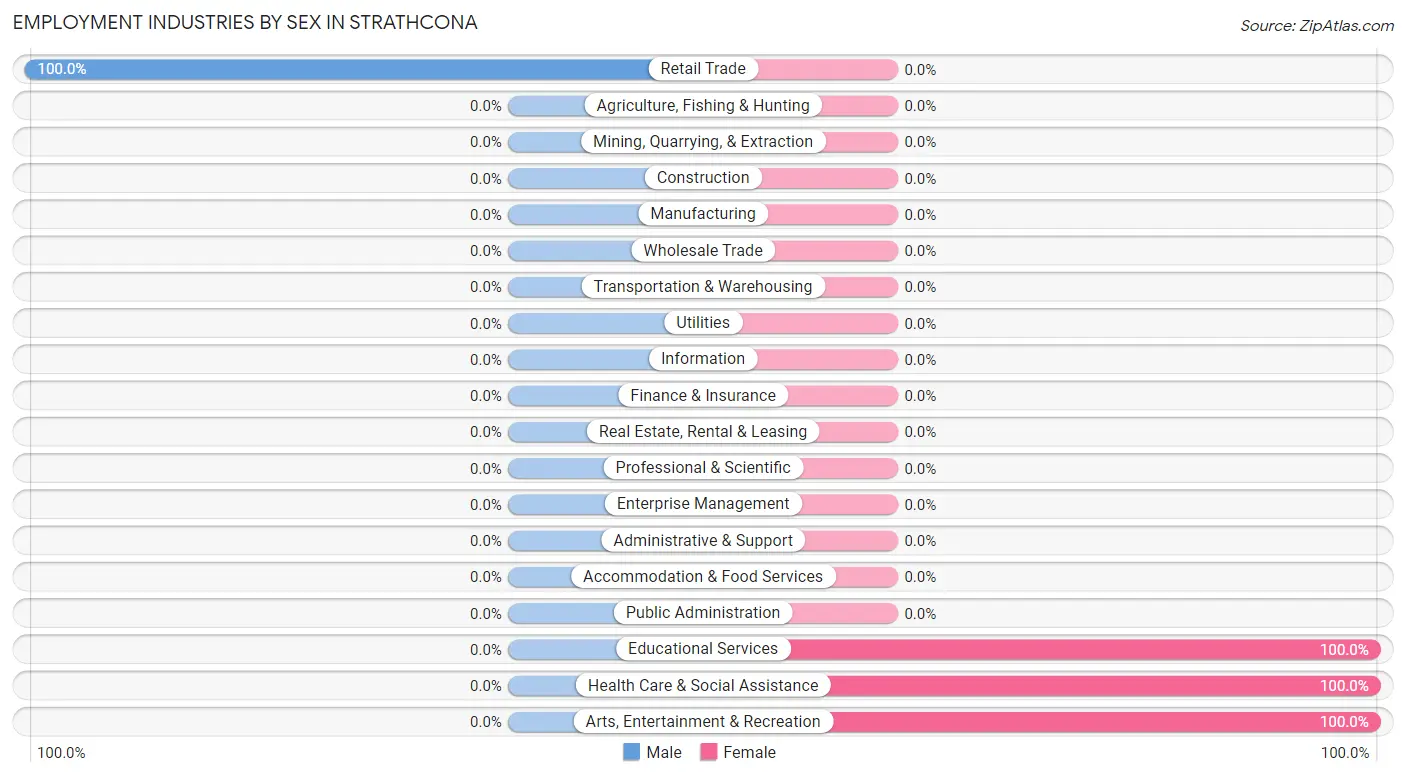
| Industry | Male | Female |
| Agriculture, Fishing & Hunting | 0 (0.0%) | 0 (0.0%) |
| Mining, Quarrying, & Extraction | 0 (0.0%) | 0 (0.0%) |
| Construction | 0 (0.0%) | 0 (0.0%) |
| Manufacturing | 0 (0.0%) | 0 (0.0%) |
| Wholesale Trade | 0 (0.0%) | 0 (0.0%) |
| Retail Trade | 1 (100.0%) | 0 (0.0%) |
| Transportation & Warehousing | 0 (0.0%) | 0 (0.0%) |
| Utilities | 0 (0.0%) | 0 (0.0%) |
| Information | 0 (0.0%) | 0 (0.0%) |
| Finance & Insurance | 0 (0.0%) | 0 (0.0%) |
| Real Estate, Rental & Leasing | 0 (0.0%) | 0 (0.0%) |
| Professional & Scientific | 0 (0.0%) | 0 (0.0%) |
| Enterprise Management | 0 (0.0%) | 0 (0.0%) |
| Administrative & Support | 0 (0.0%) | 0 (0.0%) |
| Educational Services | 0 (0.0%) | 1 (100.0%) |
| Health Care & Social Assistance | 0 (0.0%) | 2 (100.0%) |
| Arts, Entertainment & Recreation | 0 (0.0%) | 2 (100.0%) |
| Accommodation & Food Services | 0 (0.0%) | 0 (0.0%) |
| Public Administration | 0 (0.0%) | 0 (0.0%) |
| Total | 2 (28.6%) | 5 (71.4%) |
Education in Strathcona
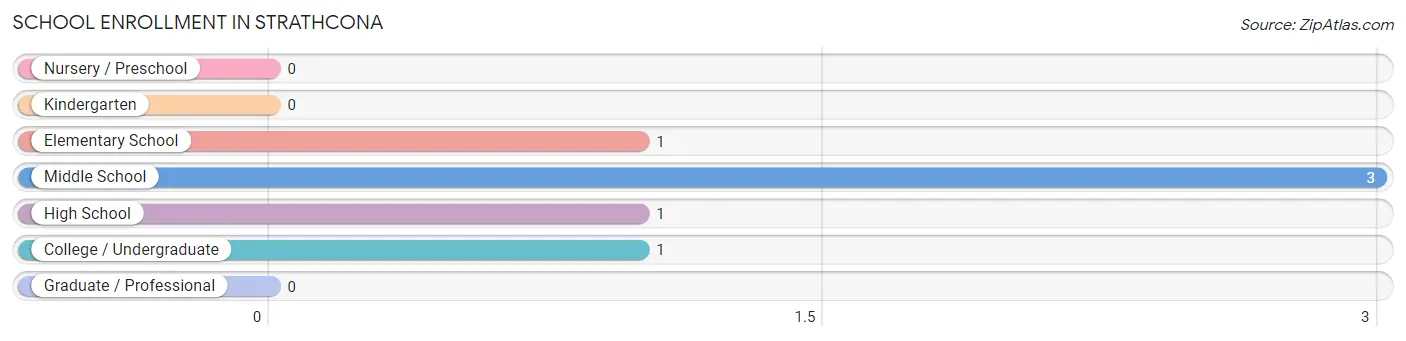
School Enrollment in Strathcona
The most common levels of schooling among the 6 students in Strathcona are middle school (3 | 50.0%), elementary school (1 | 16.7%), and high school (1 | 16.7%).
| School Level | # Students | % Students |
| Nursery / Preschool | 0 | 0.0% |
| Kindergarten | 0 | 0.0% |
| Elementary School | 1 | 16.7% |
| Middle School | 3 | 50.0% |
| High School | 1 | 16.7% |
| College / Undergraduate | 1 | 16.7% |
| Graduate / Professional | 0 | 0.0% |
| Total | 6 | 100.0% |
School Enrollment by Age by Funding Source in Strathcona
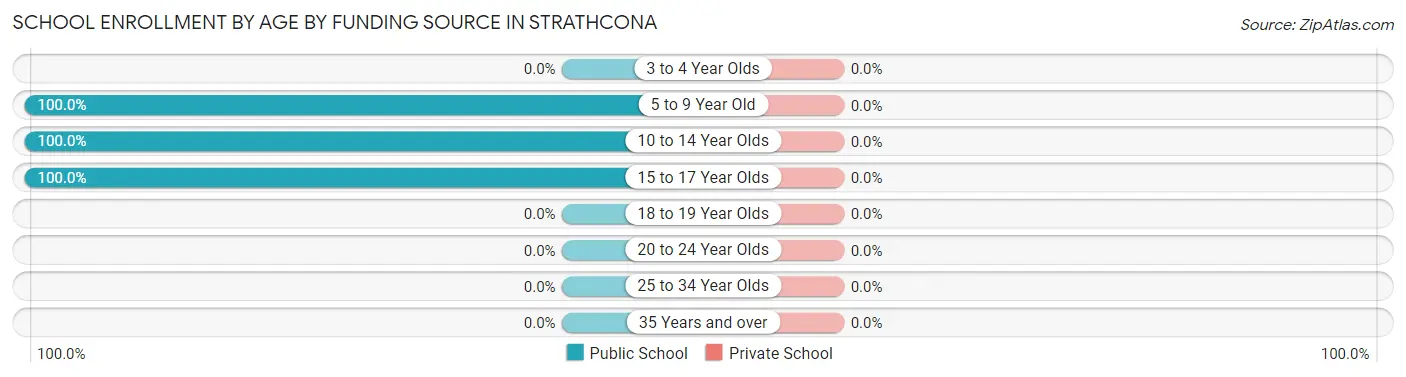
| Age Bracket | Public School | Private School |
| 3 to 4 Year Olds | 0 (0.0%) | 0 (0.0%) |
| 5 to 9 Year Old | 1 (100.0%) | 0 (0.0%) |
| 10 to 14 Year Olds | 3 (100.0%) | 0 (0.0%) |
| 15 to 17 Year Olds | 2 (100.0%) | 0 (0.0%) |
| 18 to 19 Year Olds | 0 (0.0%) | 0 (0.0%) |
| 20 to 24 Year Olds | 0 (0.0%) | 0 (0.0%) |
| 25 to 34 Year Olds | 0 (0.0%) | 0 (0.0%) |
| 35 Years and over | 0 (0.0%) | 0 (0.0%) |
| Total | 6 (100.0%) | 0 (0.0%) |
Educational Attainment by Field of Study in Strathcona
Education (2 | 66.7%), and bio, nature & agricultural (1 | 33.3%) are the most common fields of study among 3 individuals in Strathcona who have obtained a bachelor's degree or higher.
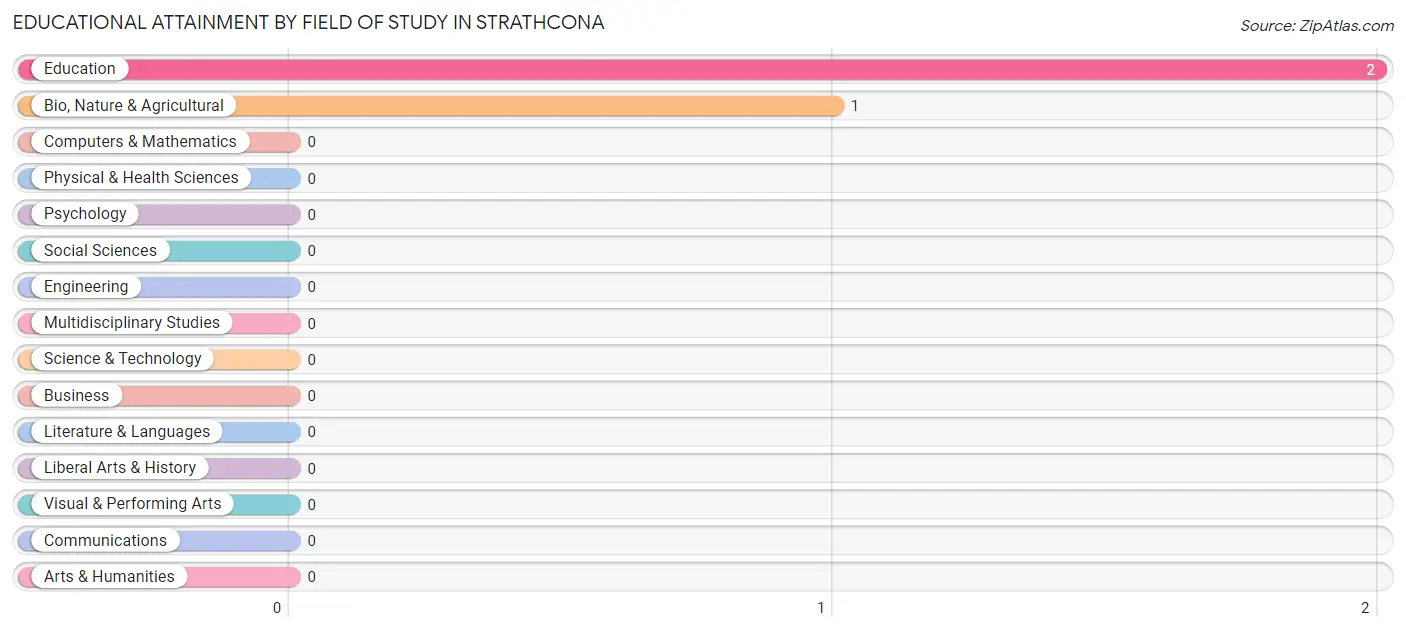
| Field of Study | # Graduates | % Graduates |
| Computers & Mathematics | 0 | 0.0% |
| Bio, Nature & Agricultural | 1 | 33.3% |
| Physical & Health Sciences | 0 | 0.0% |
| Psychology | 0 | 0.0% |
| Social Sciences | 0 | 0.0% |
| Engineering | 0 | 0.0% |
| Multidisciplinary Studies | 0 | 0.0% |
| Science & Technology | 0 | 0.0% |
| Business | 0 | 0.0% |
| Education | 2 | 66.7% |
| Literature & Languages | 0 | 0.0% |
| Liberal Arts & History | 0 | 0.0% |
| Visual & Performing Arts | 0 | 0.0% |
| Communications | 0 | 0.0% |
| Arts & Humanities | 0 | 0.0% |
| Total | 3 | 100.0% |
Transportation & Commute in Strathcona
Vehicle Availability by Sex in Strathcona
The most prevalent vehicle ownership categories in Strathcona are males with no vehicle (1, accounting for 50.0%) and females with no vehicle (3, making up 20.0%).
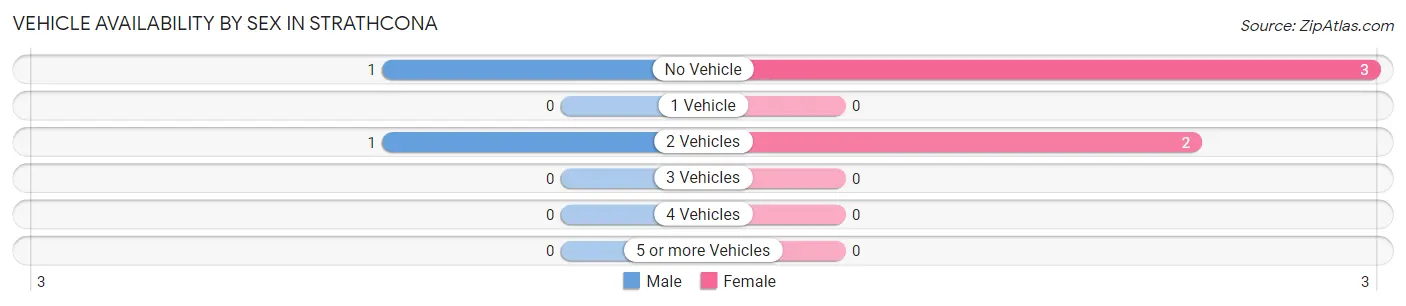
| Vehicles Available | Male | Female |
| No Vehicle | 1 (50.0%) | 3 (60.0%) |
| 1 Vehicle | 0 (0.0%) | 0 (0.0%) |
| 2 Vehicles | 1 (50.0%) | 2 (40.0%) |
| 3 Vehicles | 0 (0.0%) | 0 (0.0%) |
| 4 Vehicles | 0 (0.0%) | 0 (0.0%) |
| 5 or more Vehicles | 0 (0.0%) | 0 (0.0%) |
| Total | 2 (100.0%) | 5 (100.0%) |
Commute Time in Strathcona
The most frequently occuring commute durations in Strathcona are 45 to 59 minutes (3 commuters, 42.9%), 5 to 9 minutes (1 commuters, 14.3%), and 25 to 29 minutes (1 commuters, 14.3%).
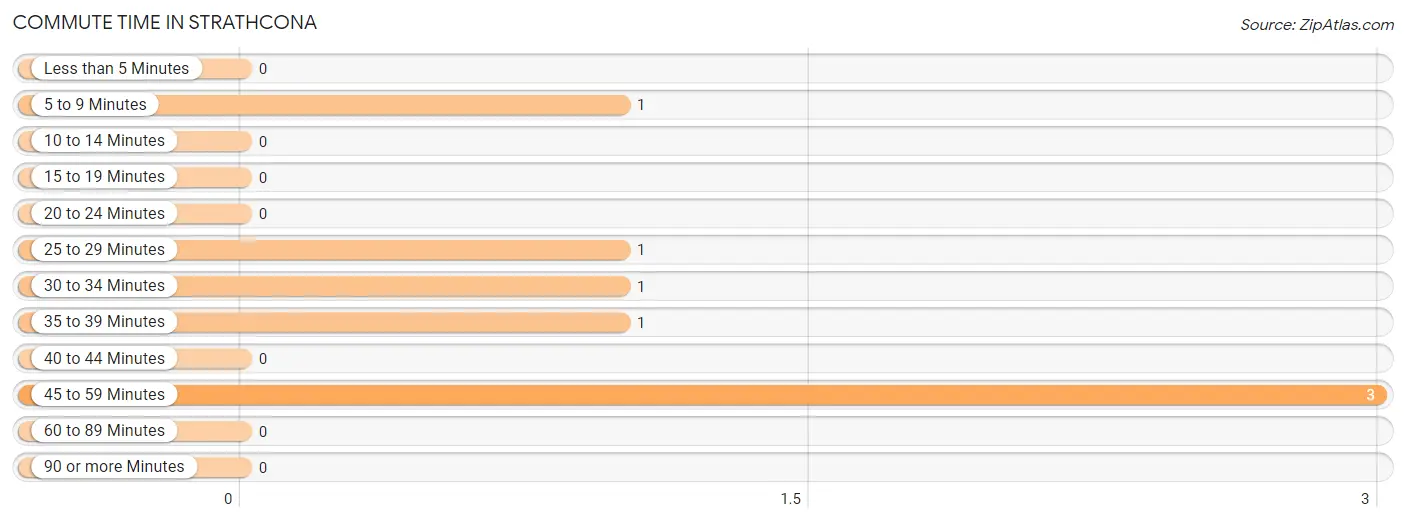
| Commute Time | # Commuters | % Commuters |
| Less than 5 Minutes | 0 | 0.0% |
| 5 to 9 Minutes | 1 | 14.3% |
| 10 to 14 Minutes | 0 | 0.0% |
| 15 to 19 Minutes | 0 | 0.0% |
| 20 to 24 Minutes | 0 | 0.0% |
| 25 to 29 Minutes | 1 | 14.3% |
| 30 to 34 Minutes | 1 | 14.3% |
| 35 to 39 Minutes | 1 | 14.3% |
| 40 to 44 Minutes | 0 | 0.0% |
| 45 to 59 Minutes | 3 | 42.9% |
| 60 to 89 Minutes | 0 | 0.0% |
| 90 or more Minutes | 0 | 0.0% |
Commute Time by Sex in Strathcona
The most common commute times in Strathcona are 30 to 34 minutes (1 commuters, 50.0%) for males and 45 to 59 minutes (3 commuters, 60.0%) for females.
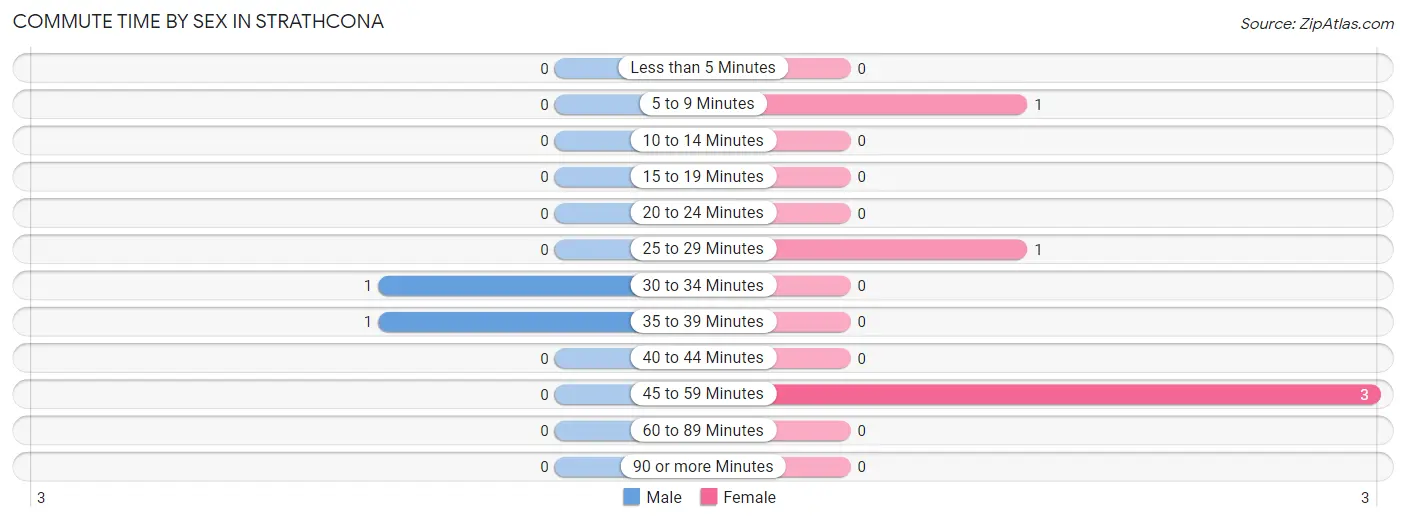
| Commute Time | Male | Female |
| Less than 5 Minutes | 0 (0.0%) | 0 (0.0%) |
| 5 to 9 Minutes | 0 (0.0%) | 1 (20.0%) |
| 10 to 14 Minutes | 0 (0.0%) | 0 (0.0%) |
| 15 to 19 Minutes | 0 (0.0%) | 0 (0.0%) |
| 20 to 24 Minutes | 0 (0.0%) | 0 (0.0%) |
| 25 to 29 Minutes | 0 (0.0%) | 1 (20.0%) |
| 30 to 34 Minutes | 1 (50.0%) | 0 (0.0%) |
| 35 to 39 Minutes | 1 (50.0%) | 0 (0.0%) |
| 40 to 44 Minutes | 0 (0.0%) | 0 (0.0%) |
| 45 to 59 Minutes | 0 (0.0%) | 3 (60.0%) |
| 60 to 89 Minutes | 0 (0.0%) | 0 (0.0%) |
| 90 or more Minutes | 0 (0.0%) | 0 (0.0%) |
Time of Departure to Work by Sex in Strathcona
The most frequent times of departure to work in Strathcona are 7:00 AM to 7:29 AM (2, 100.0%) for males and 5:30 AM to 5:59 AM (2, 40.0%) for females.
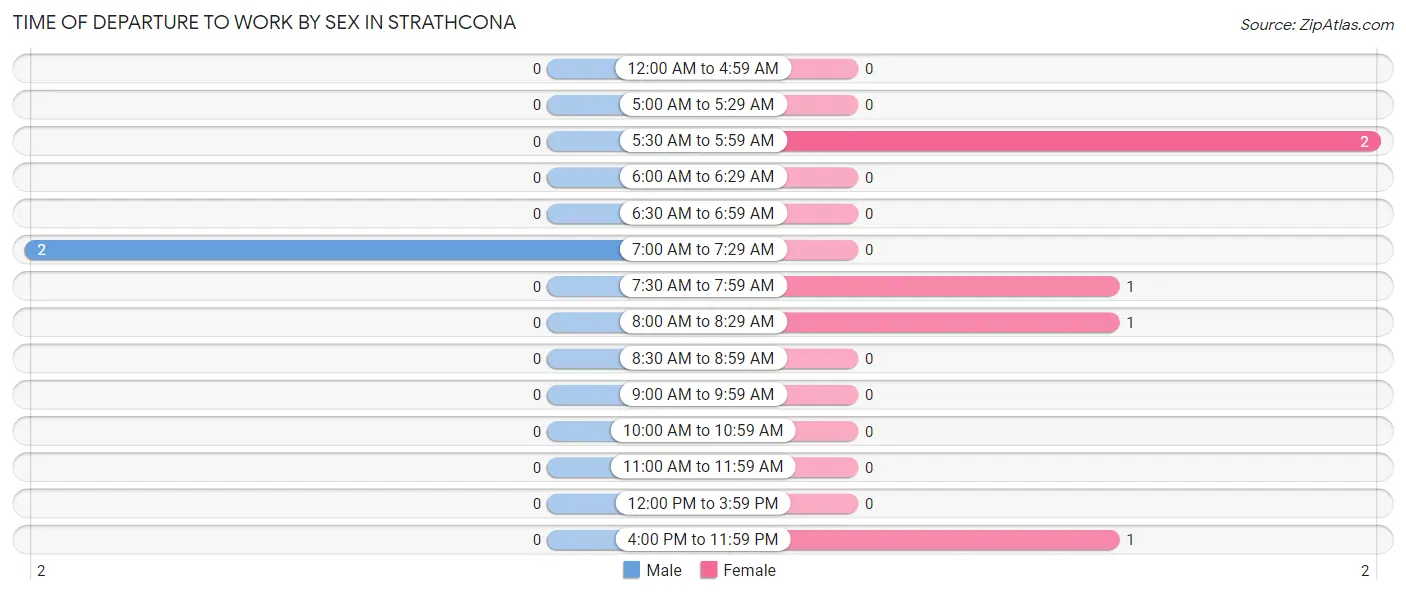
| Time of Departure | Male | Female |
| 12:00 AM to 4:59 AM | 0 (0.0%) | 0 (0.0%) |
| 5:00 AM to 5:29 AM | 0 (0.0%) | 0 (0.0%) |
| 5:30 AM to 5:59 AM | 0 (0.0%) | 2 (40.0%) |
| 6:00 AM to 6:29 AM | 0 (0.0%) | 0 (0.0%) |
| 6:30 AM to 6:59 AM | 0 (0.0%) | 0 (0.0%) |
| 7:00 AM to 7:29 AM | 2 (100.0%) | 0 (0.0%) |
| 7:30 AM to 7:59 AM | 0 (0.0%) | 1 (20.0%) |
| 8:00 AM to 8:29 AM | 0 (0.0%) | 1 (20.0%) |
| 8:30 AM to 8:59 AM | 0 (0.0%) | 0 (0.0%) |
| 9:00 AM to 9:59 AM | 0 (0.0%) | 0 (0.0%) |
| 10:00 AM to 10:59 AM | 0 (0.0%) | 0 (0.0%) |
| 11:00 AM to 11:59 AM | 0 (0.0%) | 0 (0.0%) |
| 12:00 PM to 3:59 PM | 0 (0.0%) | 0 (0.0%) |
| 4:00 PM to 11:59 PM | 0 (0.0%) | 1 (20.0%) |
| Total | 2 (100.0%) | 5 (100.0%) |
Housing Occupancy in Strathcona
Occupancy by Ownership in Strathcona
Of the total 5 dwellings in Strathcona, owner-occupied units account for 5 (100.0%), while renter-occupied units make up 0 (0.0%).
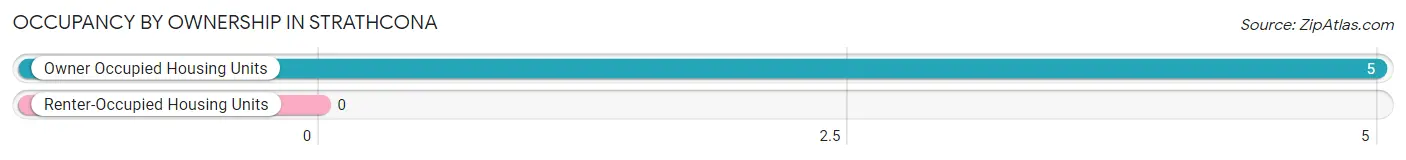
| Occupancy | # Housing Units | % Housing Units |
| Owner Occupied Housing Units | 5 | 100.0% |
| Renter-Occupied Housing Units | 0 | 0.0% |
| Total Occupied Housing Units | 5 | 100.0% |
Occupancy by Household Size in Strathcona
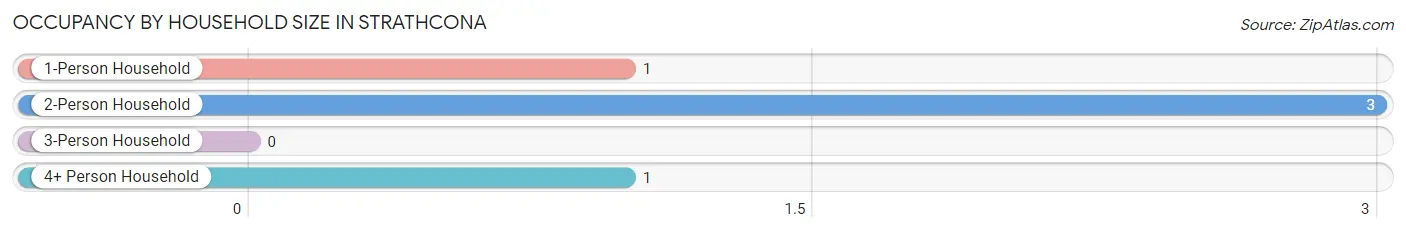
| Household Size | # Housing Units | % Housing Units |
| 1-Person Household | 1 | 20.0% |
| 2-Person Household | 3 | 60.0% |
| 3-Person Household | 0 | 0.0% |
| 4+ Person Household | 1 | 20.0% |
| Total Housing Units | 5 | 100.0% |
Occupancy by Ownership by Household Size in Strathcona
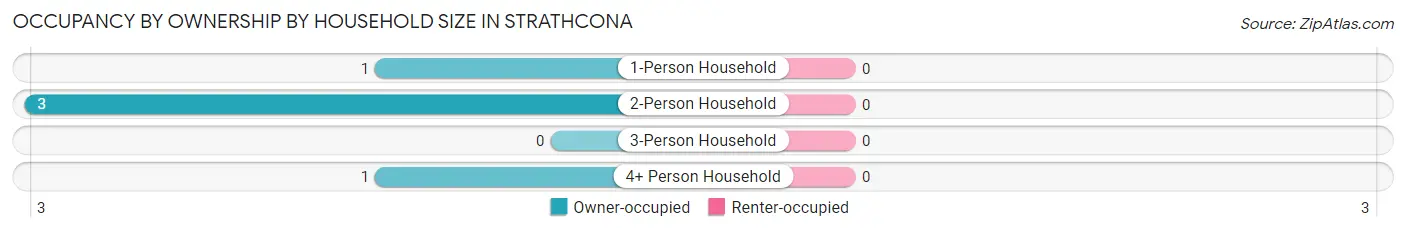
| Household Size | Owner-occupied | Renter-occupied |
| 1-Person Household | 1 (100.0%) | 0 (0.0%) |
| 2-Person Household | 3 (100.0%) | 0 (0.0%) |
| 3-Person Household | 0 (0.0%) | 0 (0.0%) |
| 4+ Person Household | 1 (100.0%) | 0 (0.0%) |
| Total Housing Units | 5 (100.0%) | 0 (0.0%) |
Occupancy by Educational Attainment in Strathcona
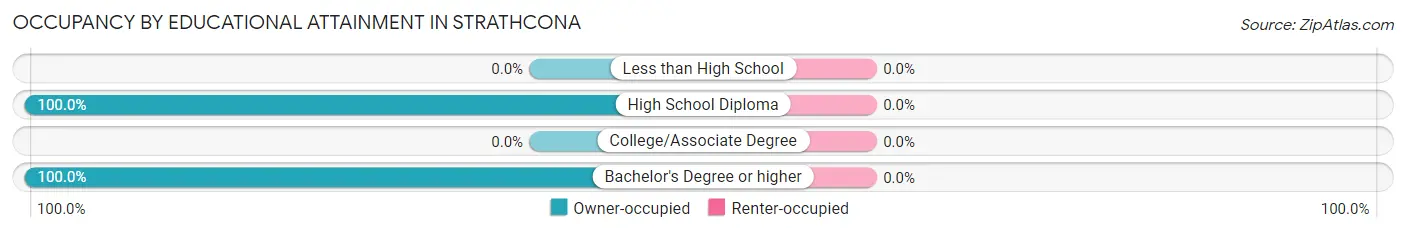
| Household Size | Owner-occupied | Renter-occupied |
| Less than High School | 0 (0.0%) | 0 (0.0%) |
| High School Diploma | 3 (100.0%) | 0 (0.0%) |
| College/Associate Degree | 0 (0.0%) | 0 (0.0%) |
| Bachelor's Degree or higher | 2 (100.0%) | 0 (0.0%) |
Occupancy by Age of Householder in Strathcona
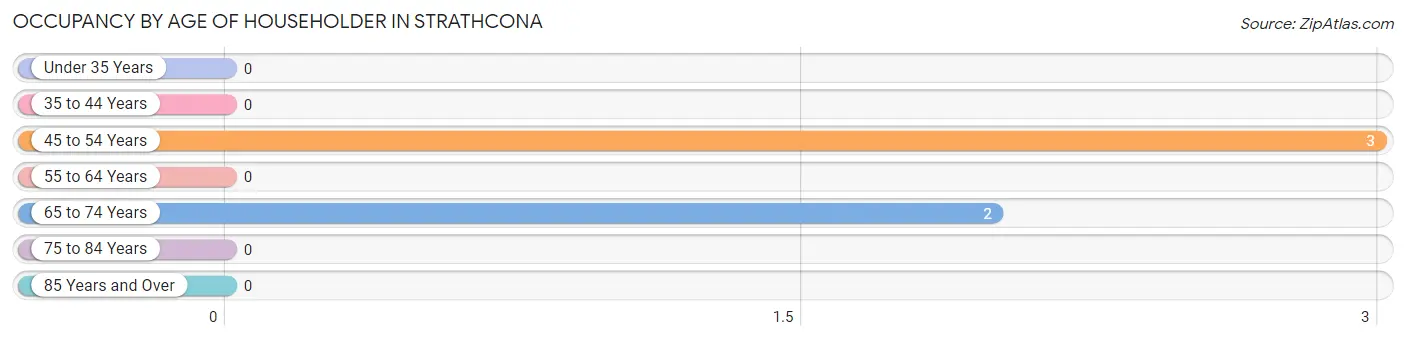
| Age Bracket | # Households | % Households |
| Under 35 Years | 0 | 0.0% |
| 35 to 44 Years | 0 | 0.0% |
| 45 to 54 Years | 3 | 60.0% |
| 55 to 64 Years | 0 | 0.0% |
| 65 to 74 Years | 2 | 40.0% |
| 75 to 84 Years | 0 | 0.0% |
| 85 Years and Over | 0 | 0.0% |
| Total | 5 | 100.0% |
Housing Finances in Strathcona
Median Income by Occupancy in Strathcona
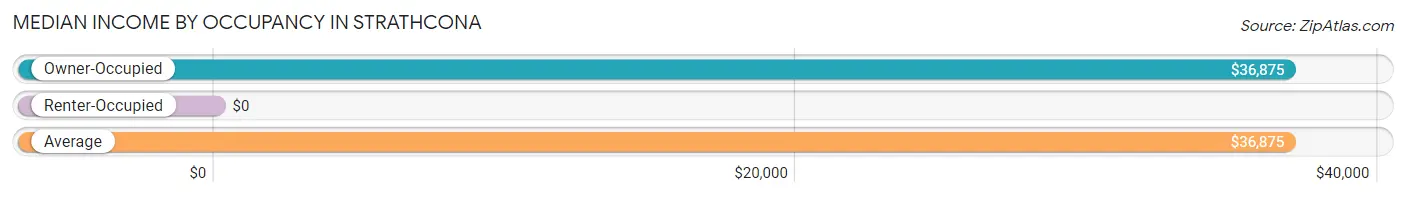
| Occupancy Type | # Households | Median Income |
| Owner-Occupied | 5 (100.0%) | $36,875 |
| Renter-Occupied | 0 (0.0%) | $0 |
| Average | 5 (100.0%) | $36,875 |
Occupancy by Householder Income Bracket in Strathcona
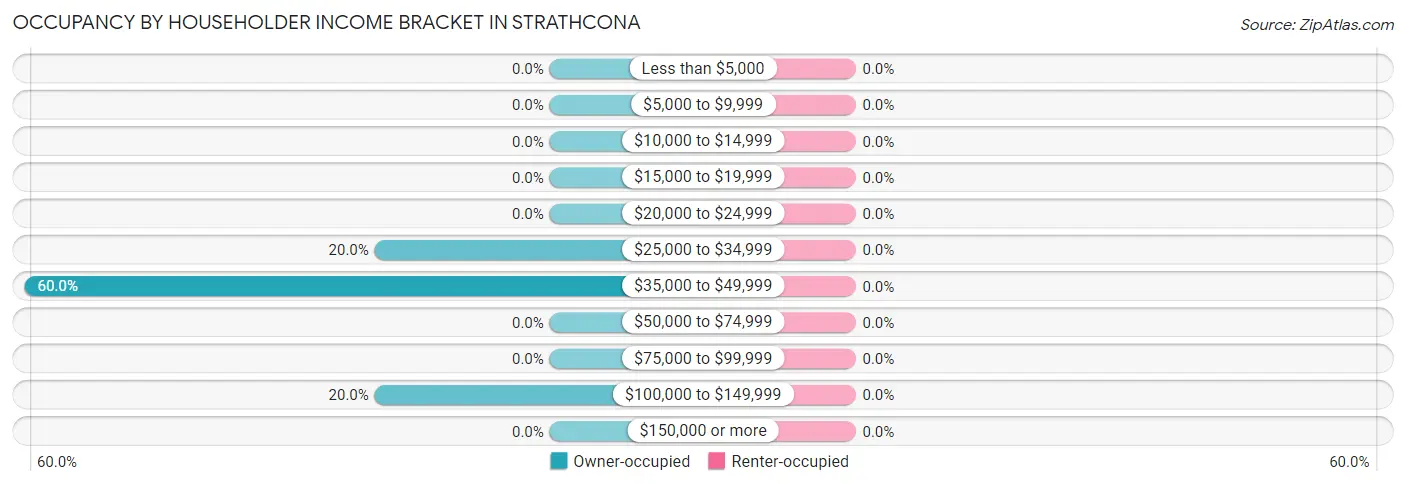
| Income Bracket | Owner-occupied | Renter-occupied |
| Less than $5,000 | 0 (0.0%) | 0 (0.0%) |
| $5,000 to $9,999 | 0 (0.0%) | 0 (0.0%) |
| $10,000 to $14,999 | 0 (0.0%) | 0 (0.0%) |
| $15,000 to $19,999 | 0 (0.0%) | 0 (0.0%) |
| $20,000 to $24,999 | 0 (0.0%) | 0 (0.0%) |
| $25,000 to $34,999 | 1 (20.0%) | 0 (0.0%) |
| $35,000 to $49,999 | 3 (60.0%) | 0 (0.0%) |
| $50,000 to $74,999 | 0 (0.0%) | 0 (0.0%) |
| $75,000 to $99,999 | 0 (0.0%) | 0 (0.0%) |
| $100,000 to $149,999 | 1 (20.0%) | 0 (0.0%) |
| $150,000 or more | 0 (0.0%) | 0 (0.0%) |
| Total | 5 (100.0%) | 0 (0.0%) |
Monthly Housing Cost Tiers in Strathcona
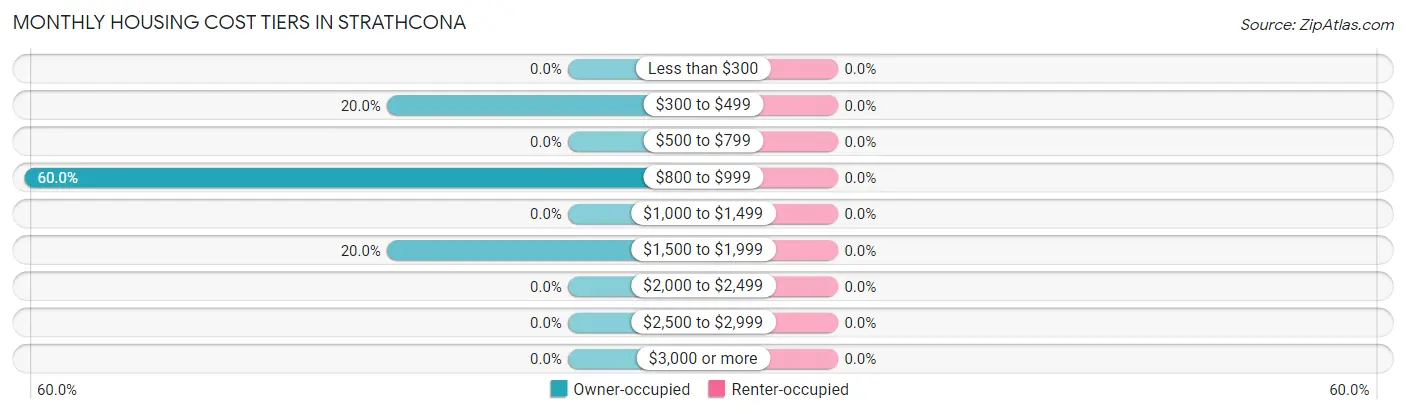
| Monthly Cost | Owner-occupied | Renter-occupied |
| Less than $300 | 0 (0.0%) | 0 (0.0%) |
| $300 to $499 | 1 (20.0%) | 0 (0.0%) |
| $500 to $799 | 0 (0.0%) | 0 (0.0%) |
| $800 to $999 | 3 (60.0%) | 0 (0.0%) |
| $1,000 to $1,499 | 0 (0.0%) | 0 (0.0%) |
| $1,500 to $1,999 | 1 (20.0%) | 0 (0.0%) |
| $2,000 to $2,499 | 0 (0.0%) | 0 (0.0%) |
| $2,500 to $2,999 | 0 (0.0%) | 0 (0.0%) |
| $3,000 or more | 0 (0.0%) | 0 (0.0%) |
| Total | 5 (100.0%) | 0 (0.0%) |
Physical Housing Characteristics in Strathcona
Housing Structures in Strathcona
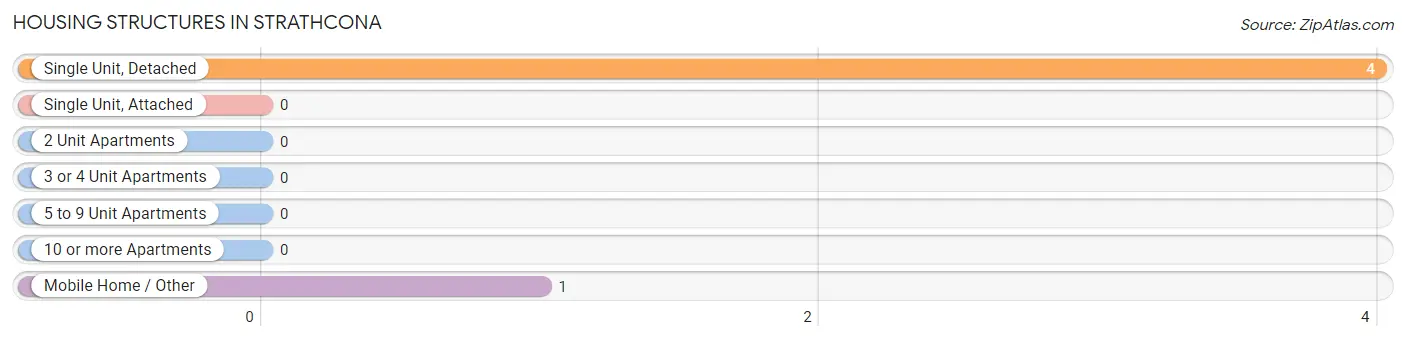
| Structure Type | # Housing Units | % Housing Units |
| Single Unit, Detached | 4 | 80.0% |
| Single Unit, Attached | 0 | 0.0% |
| 2 Unit Apartments | 0 | 0.0% |
| 3 or 4 Unit Apartments | 0 | 0.0% |
| 5 to 9 Unit Apartments | 0 | 0.0% |
| 10 or more Apartments | 0 | 0.0% |
| Mobile Home / Other | 1 | 20.0% |
| Total | 5 | 100.0% |
Housing Structures by Occupancy in Strathcona
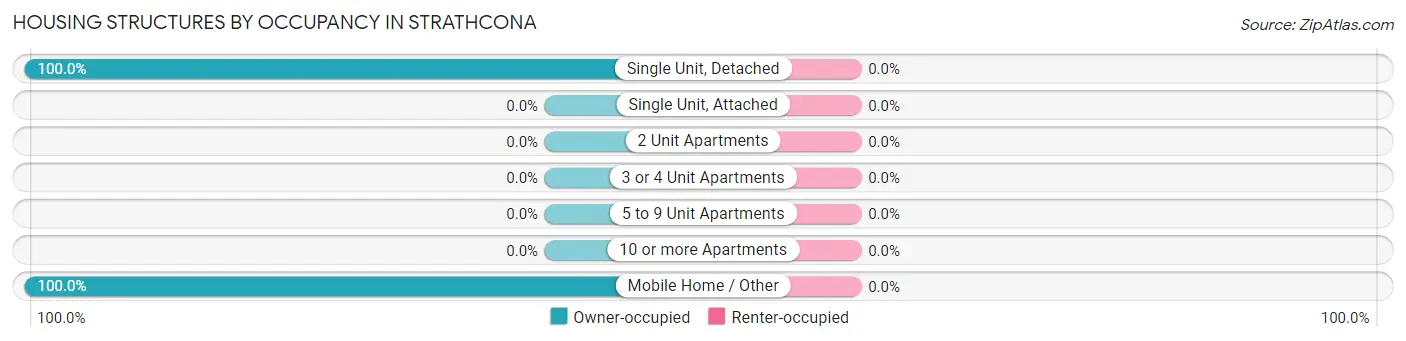
| Structure Type | Owner-occupied | Renter-occupied |
| Single Unit, Detached | 4 (100.0%) | 0 (0.0%) |
| Single Unit, Attached | 0 (0.0%) | 0 (0.0%) |
| 2 Unit Apartments | 0 (0.0%) | 0 (0.0%) |
| 3 or 4 Unit Apartments | 0 (0.0%) | 0 (0.0%) |
| 5 to 9 Unit Apartments | 0 (0.0%) | 0 (0.0%) |
| 10 or more Apartments | 0 (0.0%) | 0 (0.0%) |
| Mobile Home / Other | 1 (100.0%) | 0 (0.0%) |
| Total | 5 (100.0%) | 0 (0.0%) |
Housing Structures by Number of Rooms in Strathcona
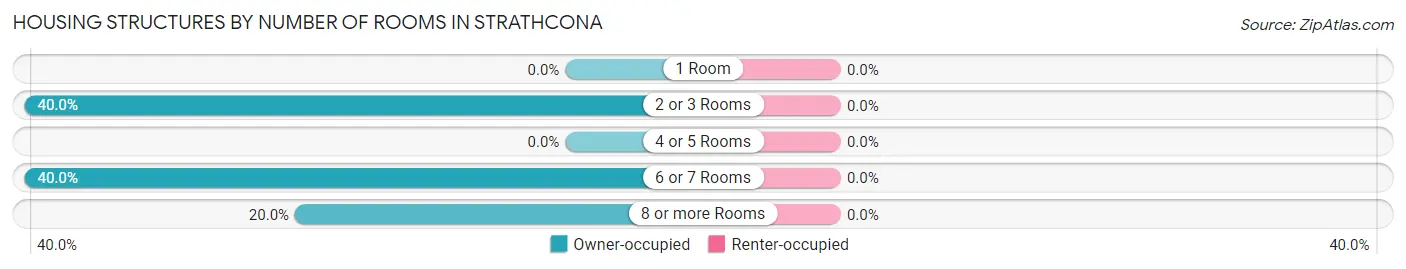
| Number of Rooms | Owner-occupied | Renter-occupied |
| 1 Room | 0 (0.0%) | 0 (0.0%) |
| 2 or 3 Rooms | 2 (40.0%) | 0 (0.0%) |
| 4 or 5 Rooms | 0 (0.0%) | 0 (0.0%) |
| 6 or 7 Rooms | 2 (40.0%) | 0 (0.0%) |
| 8 or more Rooms | 1 (20.0%) | 0 (0.0%) |
| Total | 5 (100.0%) | 0 (0.0%) |
Housing Structure by Heating Type in Strathcona
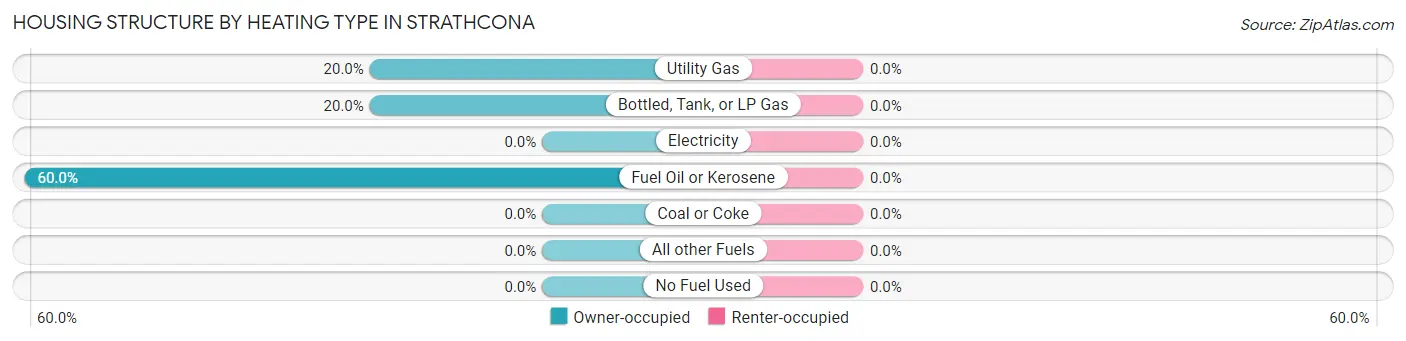
| Heating Type | Owner-occupied | Renter-occupied |
| Utility Gas | 1 (20.0%) | 0 (0.0%) |
| Bottled, Tank, or LP Gas | 1 (20.0%) | 0 (0.0%) |
| Electricity | 0 (0.0%) | 0 (0.0%) |
| Fuel Oil or Kerosene | 3 (60.0%) | 0 (0.0%) |
| Coal or Coke | 0 (0.0%) | 0 (0.0%) |
| All other Fuels | 0 (0.0%) | 0 (0.0%) |
| No Fuel Used | 0 (0.0%) | 0 (0.0%) |
| Total | 5 (100.0%) | 0 (0.0%) |
Household Vehicle Usage in Strathcona
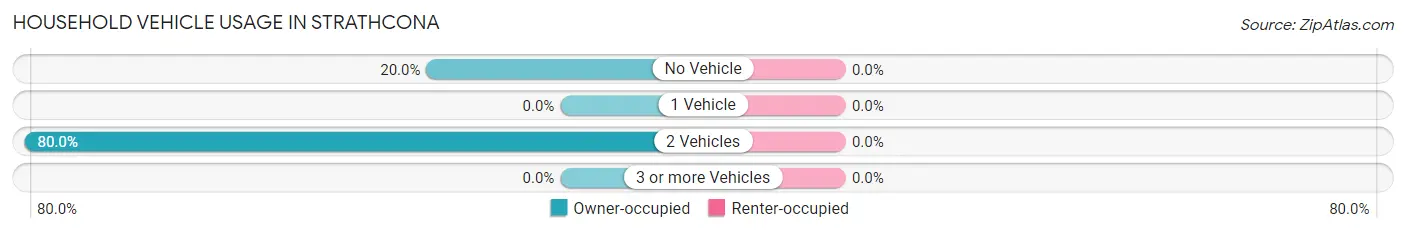
| Vehicles per Household | Owner-occupied | Renter-occupied |
| No Vehicle | 1 (20.0%) | 0 (0.0%) |
| 1 Vehicle | 0 (0.0%) | 0 (0.0%) |
| 2 Vehicles | 4 (80.0%) | 0 (0.0%) |
| 3 or more Vehicles | 0 (0.0%) | 0 (0.0%) |
| Total | 5 (100.0%) | 0 (0.0%) |
Real Estate & Mortgages in Strathcona
Real Estate and Mortgage Overview in Strathcona
| Characteristic | Without Mortgage | With Mortgage |
| Housing Units | 1 | 4 |
| Median Property Value | - | - |
| Median Household Income | - | - |
| Monthly Housing Costs | - | - |
| Real Estate Taxes | - | - |
Property Value by Mortgage Status in Strathcona
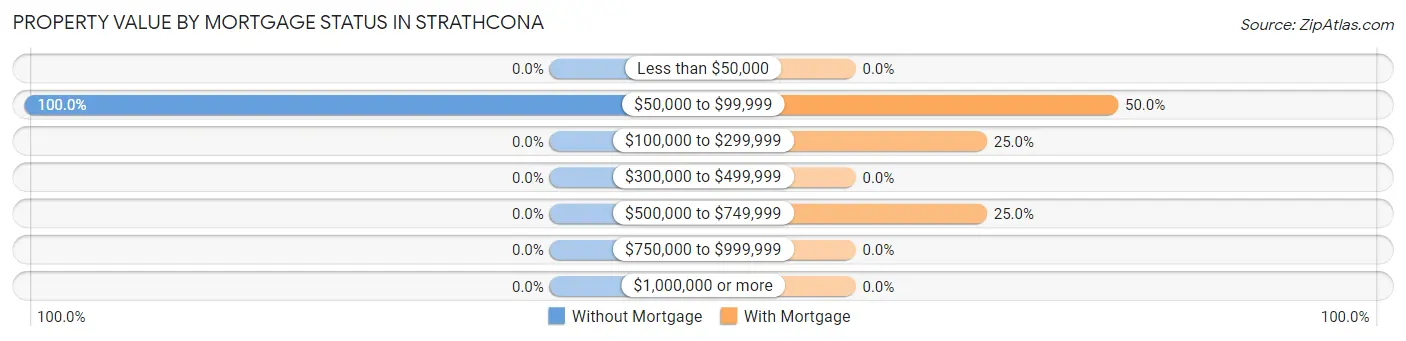
| Property Value | Without Mortgage | With Mortgage |
| Less than $50,000 | 0 (0.0%) | 0 (0.0%) |
| $50,000 to $99,999 | 1 (100.0%) | 2 (50.0%) |
| $100,000 to $299,999 | 0 (0.0%) | 1 (25.0%) |
| $300,000 to $499,999 | 0 (0.0%) | 0 (0.0%) |
| $500,000 to $749,999 | 0 (0.0%) | 1 (25.0%) |
| $750,000 to $999,999 | 0 (0.0%) | 0 (0.0%) |
| $1,000,000 or more | 0 (0.0%) | 0 (0.0%) |
| Total | 1 (100.0%) | 4 (100.0%) |
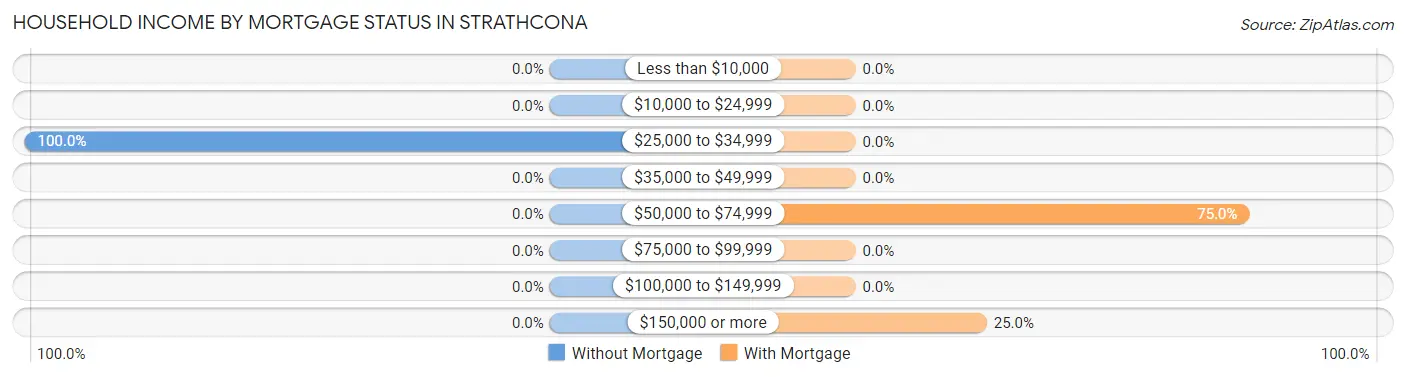
Household Income by Mortgage Status in Strathcona
| Household Income | Without Mortgage | With Mortgage |
| Less than $10,000 | 0 (0.0%) | 0 (0.0%) |
| $10,000 to $24,999 | 0 (0.0%) | 0 (0.0%) |
| $25,000 to $34,999 | 1 (100.0%) | 0 (0.0%) |
| $35,000 to $49,999 | 0 (0.0%) | 0 (0.0%) |
| $50,000 to $74,999 | 0 (0.0%) | 3 (75.0%) |
| $75,000 to $99,999 | 0 (0.0%) | 0 (0.0%) |
| $100,000 to $149,999 | 0 (0.0%) | 0 (0.0%) |
| $150,000 or more | 0 (0.0%) | 1 (25.0%) |
| Total | 1 (100.0%) | 4 (100.0%) |
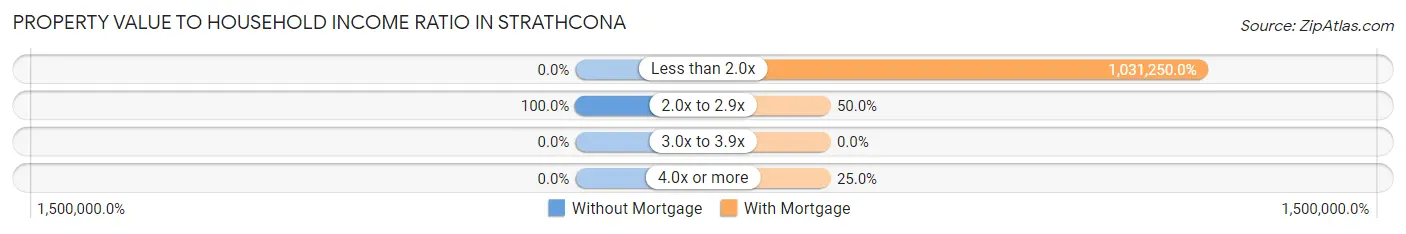
Property Value to Household Income Ratio in Strathcona
| Value-to-Income Ratio | Without Mortgage | With Mortgage |
| Less than 2.0x | 0 (0.0%) | 41,250 (1,031,250.0%) |
| 2.0x to 2.9x | 1 (100.0%) | 2 (50.0%) |
| 3.0x to 3.9x | 0 (0.0%) | 0 (0.0%) |
| 4.0x or more | 0 (0.0%) | 1 (25.0%) |
| Total | 1 (100.0%) | 4 (100.0%) |
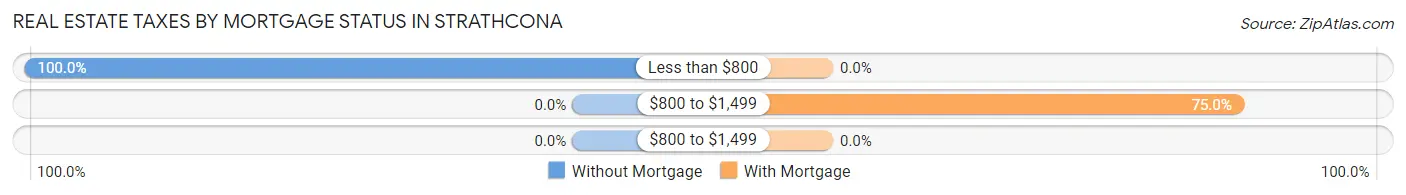
Real Estate Taxes by Mortgage Status in Strathcona
| Property Taxes | Without Mortgage | With Mortgage |
| Less than $800 | 1 (100.0%) | 0 (0.0%) |
| $800 to $1,499 | 0 (0.0%) | 3 (75.0%) |
| $800 to $1,499 | 0 (0.0%) | 0 (0.0%) |
| Total | 1 (100.0%) | 4 (100.0%) |
Health & Disability in Strathcona
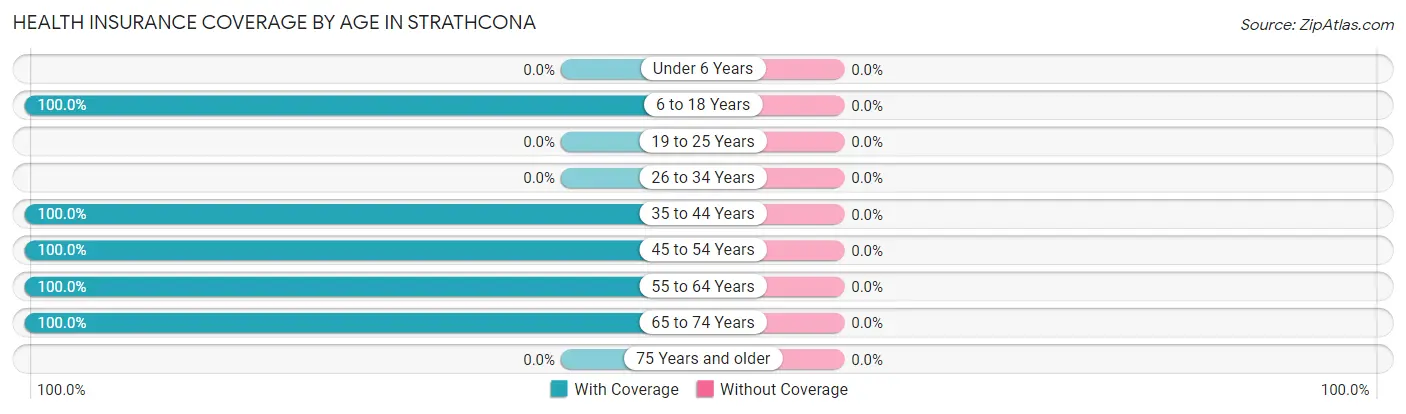
Health Insurance Coverage by Age in Strathcona
| Age Bracket | With Coverage | Without Coverage |
| Under 6 Years | 0 (0.0%) | 0 (0.0%) |
| 6 to 18 Years | 6 (100.0%) | 0 (0.0%) |
| 19 to 25 Years | 0 (0.0%) | 0 (0.0%) |
| 26 to 34 Years | 0 (0.0%) | 0 (0.0%) |
| 35 to 44 Years | 1 (100.0%) | 0 (0.0%) |
| 45 to 54 Years | 3 (100.0%) | 0 (0.0%) |
| 55 to 64 Years | 1 (100.0%) | 0 (0.0%) |
| 65 to 74 Years | 2 (100.0%) | 0 (0.0%) |
| 75 Years and older | 0 (0.0%) | 0 (0.0%) |
| Total | 13 (100.0%) | 0 (0.0%) |
Health Insurance Coverage by Citizenship Status in Strathcona
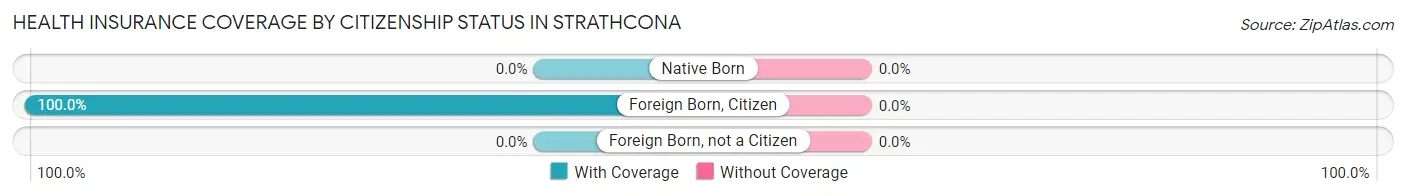
| Citizenship Status | With Coverage | Without Coverage |
| Native Born | 0 (0.0%) | 0 (0.0%) |
| Foreign Born, Citizen | 6 (100.0%) | 0 (0.0%) |
| Foreign Born, not a Citizen | 0 (0.0%) | 0 (0.0%) |
Health Insurance Coverage by Household Income in Strathcona
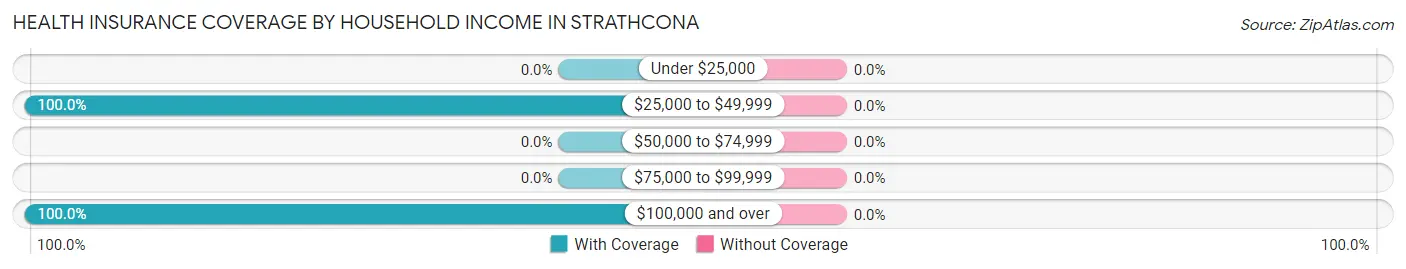
| Household Income | With Coverage | Without Coverage |
| Under $25,000 | 0 (0.0%) | 0 (0.0%) |
| $25,000 to $49,999 | 7 (100.0%) | 0 (0.0%) |
| $50,000 to $74,999 | 0 (0.0%) | 0 (0.0%) |
| $75,000 to $99,999 | 0 (0.0%) | 0 (0.0%) |
| $100,000 and over | 6 (100.0%) | 0 (0.0%) |
Public vs Private Health Insurance Coverage by Age in Strathcona
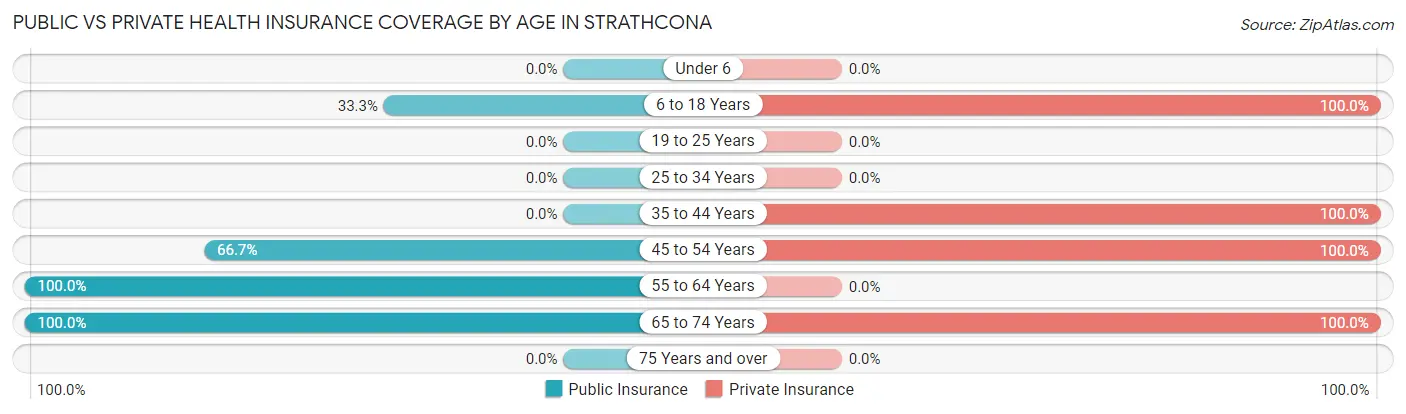
| Age Bracket | Public Insurance | Private Insurance |
| Under 6 | 0 (0.0%) | 0 (0.0%) |
| 6 to 18 Years | 2 (33.3%) | 6 (100.0%) |
| 19 to 25 Years | 0 (0.0%) | 0 (0.0%) |
| 25 to 34 Years | 0 (0.0%) | 0 (0.0%) |
| 35 to 44 Years | 0 (0.0%) | 1 (100.0%) |
| 45 to 54 Years | 2 (66.7%) | 3 (100.0%) |
| 55 to 64 Years | 1 (100.0%) | 0 (0.0%) |
| 65 to 74 Years | 2 (100.0%) | 2 (100.0%) |
| 75 Years and over | 0 (0.0%) | 0 (0.0%) |
| Total | 7 (53.8%) | 12 (92.3%) |
Disability Status by Sex by Age in Strathcona
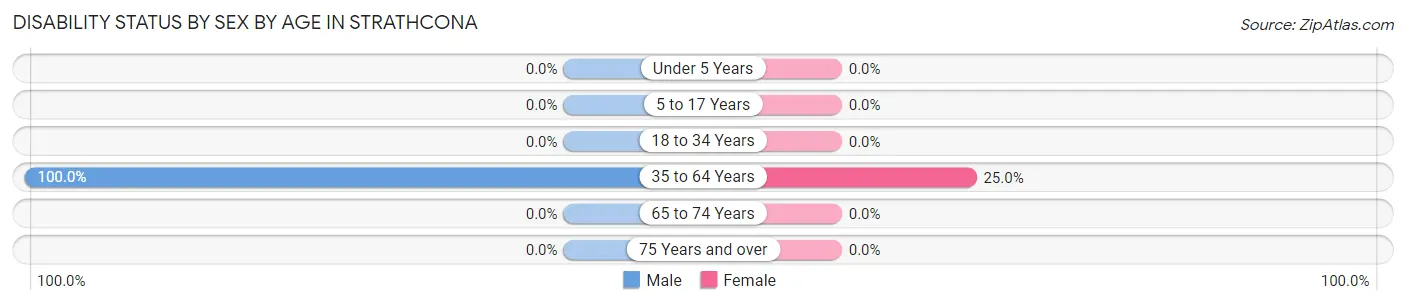
| Age Bracket | Male | Female |
| Under 5 Years | 0 (0.0%) | 0 (0.0%) |
| 5 to 17 Years | 0 (0.0%) | 0 (0.0%) |
| 18 to 34 Years | 0 (0.0%) | 0 (0.0%) |
| 35 to 64 Years | 1 (100.0%) | 1 (25.0%) |
| 65 to 74 Years | 0 (0.0%) | 0 (0.0%) |
| 75 Years and over | 0 (0.0%) | 0 (0.0%) |
Disability Class by Sex by Age in Strathcona
Disability Class: Hearing Difficulty
| Age Bracket | Male | Female |
| Under 5 Years | 0 (0.0%) | 0 (0.0%) |
| 5 to 17 Years | 0 (0.0%) | 0 (0.0%) |
| 18 to 34 Years | 0 (0.0%) | 0 (0.0%) |
| 35 to 64 Years | 0 (0.0%) | 0 (0.0%) |
| 65 to 74 Years | 0 (0.0%) | 0 (0.0%) |
| 75 Years and over | 0 (0.0%) | 0 (0.0%) |
Disability Class: Vision Difficulty
| Age Bracket | Male | Female |
| Under 5 Years | 0 (0.0%) | 0 (0.0%) |
| 5 to 17 Years | 0 (0.0%) | 0 (0.0%) |
| 18 to 34 Years | 0 (0.0%) | 0 (0.0%) |
| 35 to 64 Years | 0 (0.0%) | 1 (25.0%) |
| 65 to 74 Years | 0 (0.0%) | 0 (0.0%) |
| 75 Years and over | 0 (0.0%) | 0 (0.0%) |
Disability Class: Cognitive Difficulty

| Age Bracket | Male | Female |
| 5 to 17 Years | 0 (0.0%) | 0 (0.0%) |
| 18 to 34 Years | 0 (0.0%) | 0 (0.0%) |
| 35 to 64 Years | 0 (0.0%) | 0 (0.0%) |
| 65 to 74 Years | 0 (0.0%) | 0 (0.0%) |
| 75 Years and over | 0 (0.0%) | 0 (0.0%) |
Disability Class: Ambulatory Difficulty
| Age Bracket | Male | Female |
| 5 to 17 Years | 0 (0.0%) | 0 (0.0%) |
| 18 to 34 Years | 0 (0.0%) | 0 (0.0%) |
| 35 to 64 Years | 1 (100.0%) | 0 (0.0%) |
| 65 to 74 Years | 0 (0.0%) | 0 (0.0%) |
| 75 Years and over | 0 (0.0%) | 0 (0.0%) |
Disability Class: Self-Care Difficulty
| Age Bracket | Male | Female |
| 5 to 17 Years | 0 (0.0%) | 0 (0.0%) |
| 18 to 34 Years | 0 (0.0%) | 0 (0.0%) |
| 35 to 64 Years | 0 (0.0%) | 0 (0.0%) |
| 65 to 74 Years | 0 (0.0%) | 0 (0.0%) |
| 75 Years and over | 0 (0.0%) | 0 (0.0%) |
Technology Access in Strathcona
Computing Device Access in Strathcona
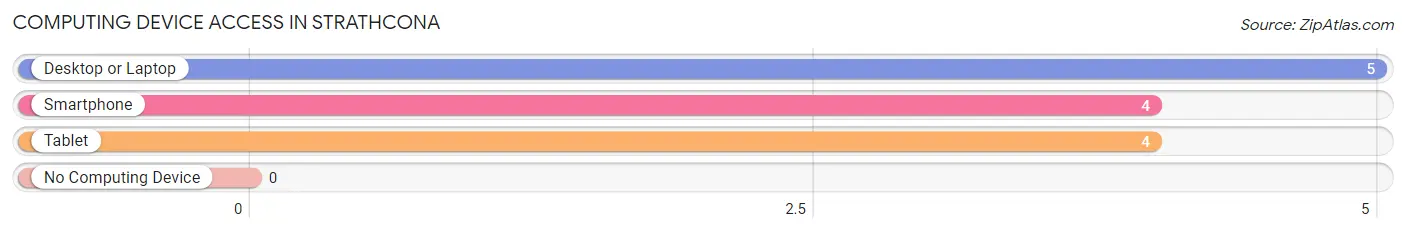
| Device Type | # Households | % Households |
| Desktop or Laptop | 5 | 100.0% |
| Smartphone | 4 | 80.0% |
| Tablet | 4 | 80.0% |
| No Computing Device | 0 | 0.0% |
| Total | 5 | 100.0% |
Internet Access in Strathcona
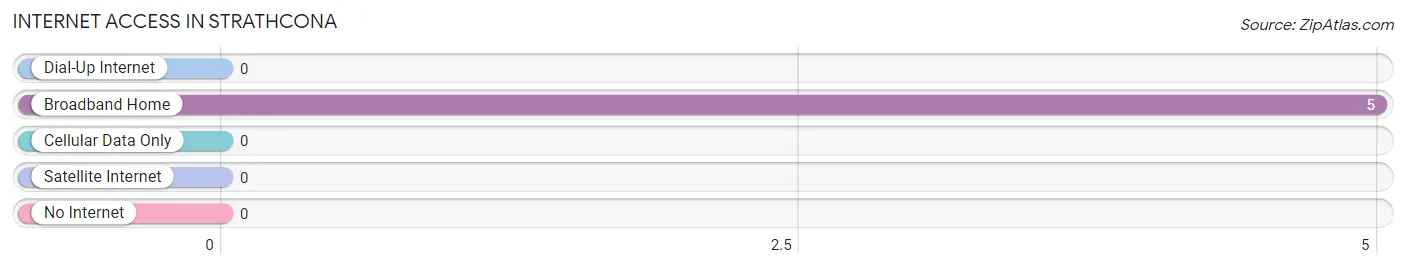
| Internet Type | # Households | % Households |
| Dial-Up Internet | 0 | 0.0% |
| Broadband Home | 5 | 100.0% |
| Cellular Data Only | 0 | 0.0% |
| Satellite Internet | 0 | 0.0% |
| No Internet | 0 | 0.0% |
| Total | 5 | 100.0% |
Strathcona Summary
Strathcona is a small city located in the state of Minnesota, United States. It is situated in the northwest corner of the state, near the border with Canada. The city has a population of approximately 1,500 people and is the county seat of St. Louis County.
History
Strathcona was founded in 1887 by a group of settlers from Scotland. The settlers named the city after the Earl of Strathcona, who was a prominent figure in the Canadian Pacific Railway. The city was incorporated in 1891 and was the first city in St. Louis County.
The city was initially a logging and mining town, but it soon developed into a commercial center. The city was home to several businesses, including a sawmill, a flour mill, a brickyard, and a general store. The city also had a post office, a bank, and a hotel.
In the early 1900s, the city experienced a period of growth and prosperity. The city was home to several churches, a library, and a hospital. The city also had a movie theater, a bowling alley, and a golf course.
Geography
Strathcona is located in the northwest corner of Minnesota, near the border with Canada. The city is situated on the banks of the St. Louis River, which flows through the city. The city is surrounded by forests and lakes, and is home to several parks and recreational areas.
The city has a total area of 4.2 square miles, of which 0.2 square miles is water. The city has a humid continental climate, with cold winters and warm summers.
Economy
The economy of Strathcona is largely based on tourism and services. The city is home to several restaurants, hotels, and other businesses that cater to tourists. The city is also home to several manufacturing companies, including a paper mill and a wood products plant.
The city is also home to several educational institutions, including a community college and a technical college. The city is also home to a hospital and several medical clinics.
Demographics
As of the 2010 census, the population of Strathcona was 1,500. The racial makeup of the city was 97.3% White, 0.7% African American, 0.3% Native American, 0.3% Asian, and 1.3% from other races. The median household income was $37,500, and the median family income was $45,000.
The city has a large number of retirees, with nearly 20% of the population over the age of 65. The city also has a large number of families, with nearly 40% of the population under the age of 18. The city has a low unemployment rate, with only 4.2% of the population unemployed.
Conclusion
Strathcona is a small city located in the northwest corner of Minnesota, near the border with Canada. The city has a population of approximately 1,500 people and is the county seat of St. Louis County. The city was founded in 1887 by a group of settlers from Scotland and was initially a logging and mining town. The city has since developed into a commercial center and is home to several businesses, educational institutions, and medical clinics. The economy of Strathcona is largely based on tourism and services, and the city has a low unemployment rate. The city has a large number of retirees and families, and the racial makeup of the city is predominantly White.
Common Questions
What is Per Capita Income in Strathcona?
Per Capita income in Strathcona is $21,569.
What is the Median Family Income in Strathcona?
Median Family Income in Strathcona is $41,250.
What is the Median Household income in Strathcona?
Median Household Income in Strathcona is $36,875.
What is Inequality or Gini Index in Strathcona?
Inequality or Gini Index in Strathcona is 0.30.
What is the Total Population of Strathcona?
Total Population of Strathcona is 13.
What is the Total Male Population of Strathcona?
Total Male Population of Strathcona is 5.
What is the Total Female Population of Strathcona?
Total Female Population of Strathcona is 8.
What is the Ratio of Males per 100 Females in Strathcona?
There are 62.50 Males per 100 Females in Strathcona.
What is the Ratio of Females per 100 Males in Strathcona?
There are 160.00 Females per 100 Males in Strathcona.
What is the Median Population Age in Strathcona?
Median Population Age in Strathcona is 44.5 Years.
What is the Average Family Size in Strathcona
Average Family Size in Strathcona is 3.0 People.
What is the Average Household Size in Strathcona
Average Household Size in Strathcona is 2.6 People.
How Large is the Labor Force in Strathcona?
There are 7 People in the Labor Forcein in Strathcona.
What is the Percentage of People in the Labor Force in Strathcona?
77.8% of People are in the Labor Force in Strathcona.