Dawson, MN Map & Demographics
Dawson Map
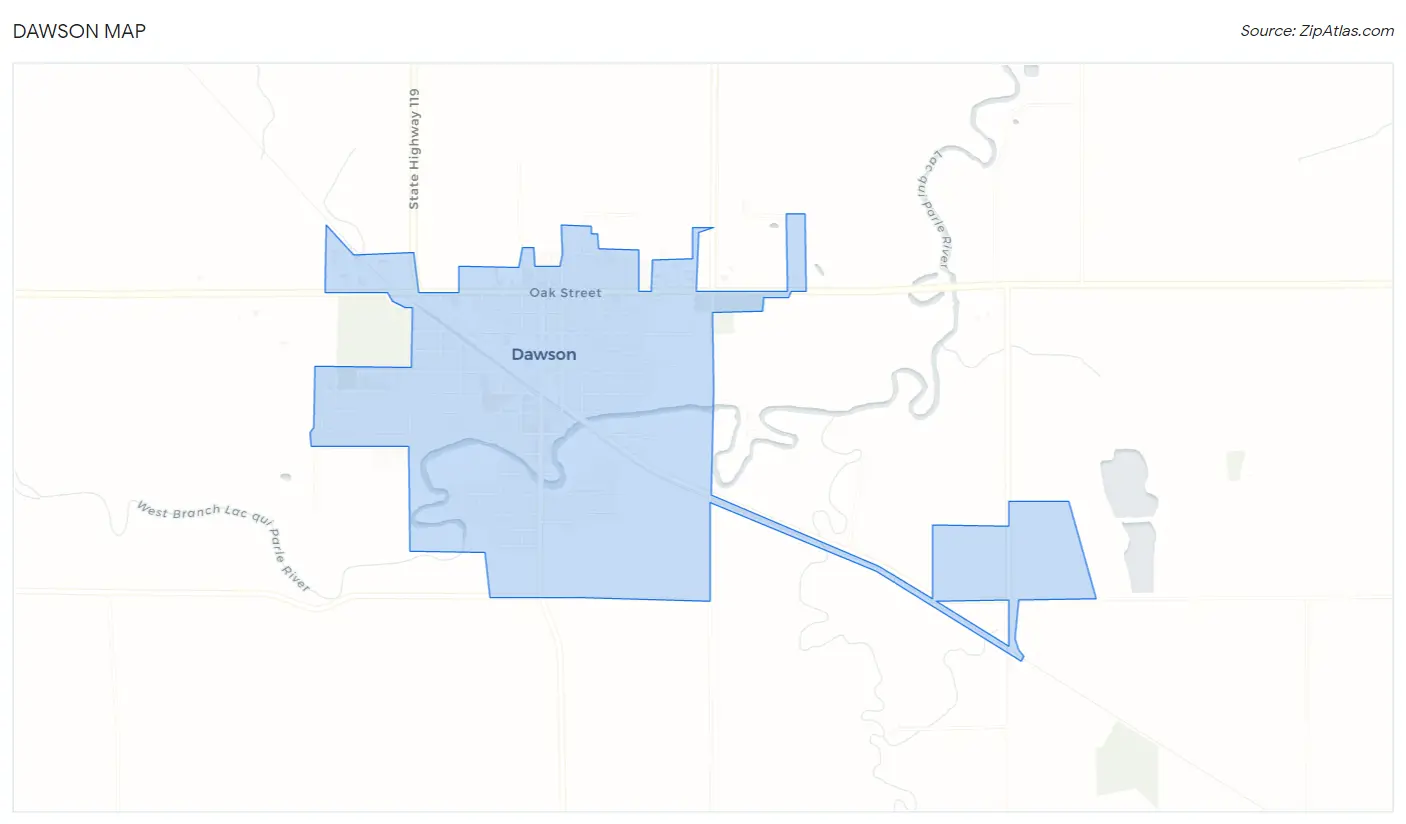
Dawson Overview
$35,982
PER CAPITA INCOME
$86,290
AVG FAMILY INCOME
$67,540
AVG HOUSEHOLD INCOME
35.7%
WAGE / INCOME GAP [ % ]
64.3¢/ $1
WAGE / INCOME GAP [ $ ]
0.43
INEQUALITY / GINI INDEX
1,369
TOTAL POPULATION
702
MALE POPULATION
667
FEMALE POPULATION
105.25
MALES / 100 FEMALES
95.01
FEMALES / 100 MALES
45.9
MEDIAN AGE
2.8
AVG FAMILY SIZE
2.2
AVG HOUSEHOLD SIZE
717
LABOR FORCE [ PEOPLE ]
61.2%
PERCENT IN LABOR FORCE
4.6%
UNEMPLOYMENT RATE
Dawson Zip Codes
Dawson Area Codes
Income in Dawson
Income Overview in Dawson
Per Capita Income in Dawson is $35,982, while median incomes of families and households are $86,290 and $67,540 respectively.
| Characteristic | Number | Measure |
| Per Capita Income | 1,369 | $35,982 |
| Median Family Income | 338 | $86,290 |
| Mean Family Income | 338 | $104,192 |
| Median Household Income | 581 | $67,540 |
| Mean Household Income | 581 | $80,666 |
| Income Deficit | 338 | $0 |
| Wage / Income Gap (%) | 1,369 | 35.69% |
| Wage / Income Gap ($) | 1,369 | 64.31¢ per $1 |
| Gini / Inequality Index | 1,369 | 0.43 |
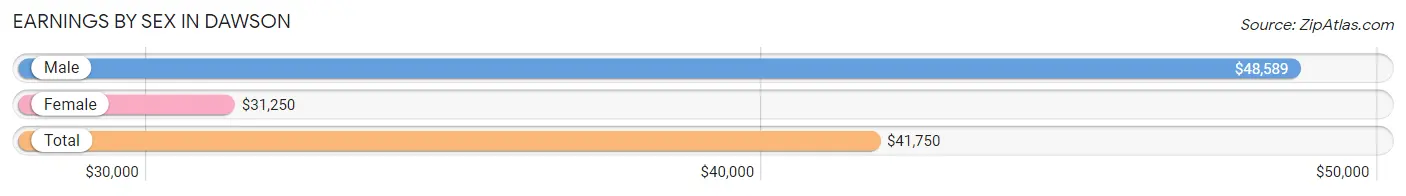
Earnings by Sex in Dawson
Average Earnings in Dawson are $41,750, $48,589 for men and $31,250 for women, a difference of 35.7%.
| Sex | Number | Average Earnings |
| Male | 381 (49.4%) | $48,589 |
| Female | 390 (50.6%) | $31,250 |
| Total | 771 (100.0%) | $41,750 |
Earnings by Sex by Income Bracket in Dawson
The most common earnings brackets in Dawson are $50,000 to $54,999 for men (48 | 12.6%) and $25,000 to $29,999 for women (58 | 14.9%).
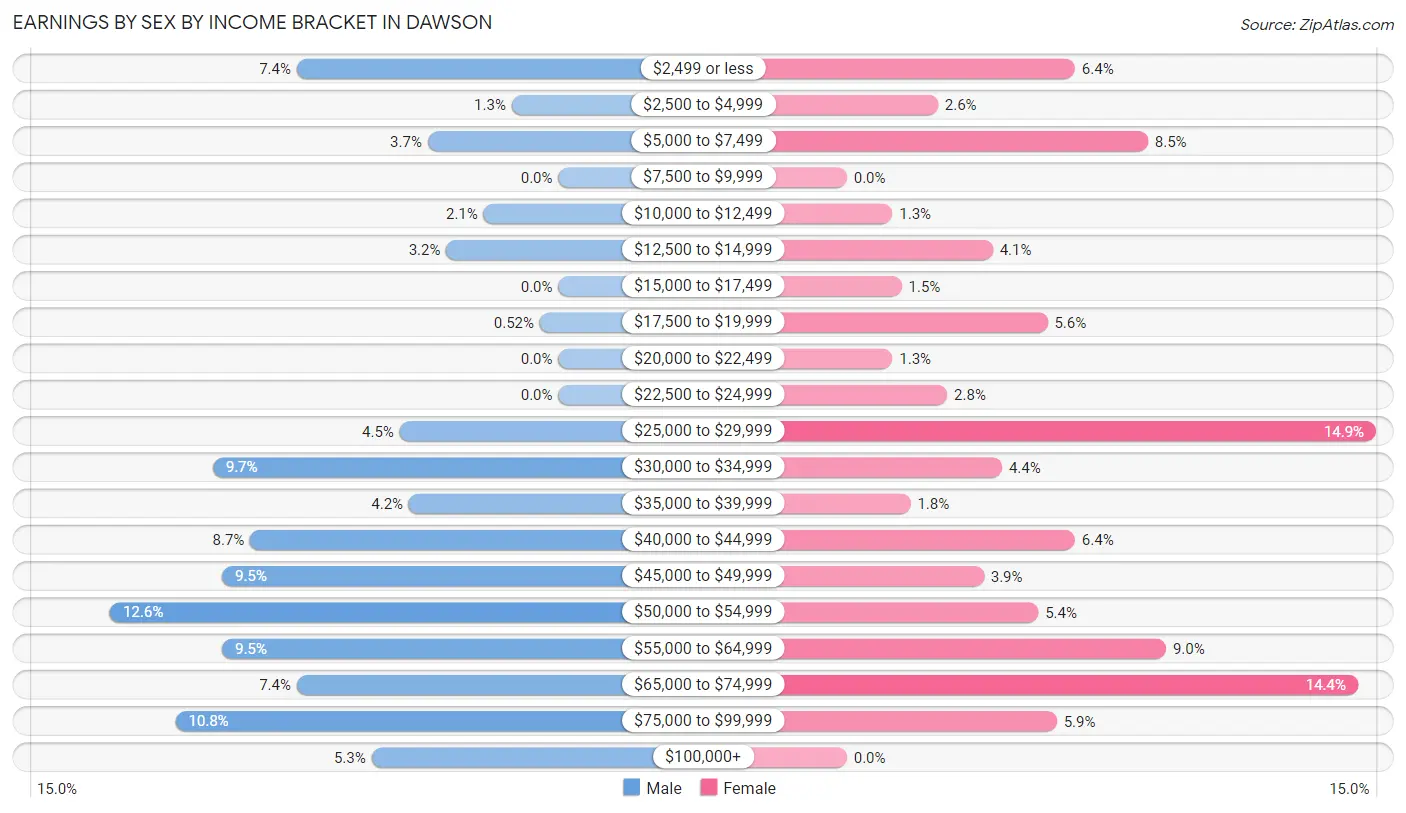
| Income | Male | Female |
| $2,499 or less | 28 (7.3%) | 25 (6.4%) |
| $2,500 to $4,999 | 5 (1.3%) | 10 (2.6%) |
| $5,000 to $7,499 | 14 (3.7%) | 33 (8.5%) |
| $7,500 to $9,999 | 0 (0.0%) | 0 (0.0%) |
| $10,000 to $12,499 | 8 (2.1%) | 5 (1.3%) |
| $12,500 to $14,999 | 12 (3.2%) | 16 (4.1%) |
| $15,000 to $17,499 | 0 (0.0%) | 6 (1.5%) |
| $17,500 to $19,999 | 2 (0.5%) | 22 (5.6%) |
| $20,000 to $22,499 | 0 (0.0%) | 5 (1.3%) |
| $22,500 to $24,999 | 0 (0.0%) | 11 (2.8%) |
| $25,000 to $29,999 | 17 (4.5%) | 58 (14.9%) |
| $30,000 to $34,999 | 37 (9.7%) | 17 (4.4%) |
| $35,000 to $39,999 | 16 (4.2%) | 7 (1.8%) |
| $40,000 to $44,999 | 33 (8.7%) | 25 (6.4%) |
| $45,000 to $49,999 | 36 (9.5%) | 15 (3.8%) |
| $50,000 to $54,999 | 48 (12.6%) | 21 (5.4%) |
| $55,000 to $64,999 | 36 (9.5%) | 35 (9.0%) |
| $65,000 to $74,999 | 28 (7.3%) | 56 (14.4%) |
| $75,000 to $99,999 | 41 (10.8%) | 23 (5.9%) |
| $100,000+ | 20 (5.2%) | 0 (0.0%) |
| Total | 381 (100.0%) | 390 (100.0%) |
Earnings by Sex by Educational Attainment in Dawson
Average earnings in Dawson are $49,839 for men and $38,125 for women, a difference of 23.5%. Men with an educational attainment of bachelor's degree enjoy the highest average annual earnings of $83,625, while those with college or associate's degree education earn the least with $42,411. Women with an educational attainment of bachelor's degree earn the most with the average annual earnings of $65,357, while those with less than high school education have the smallest earnings of $26,375.
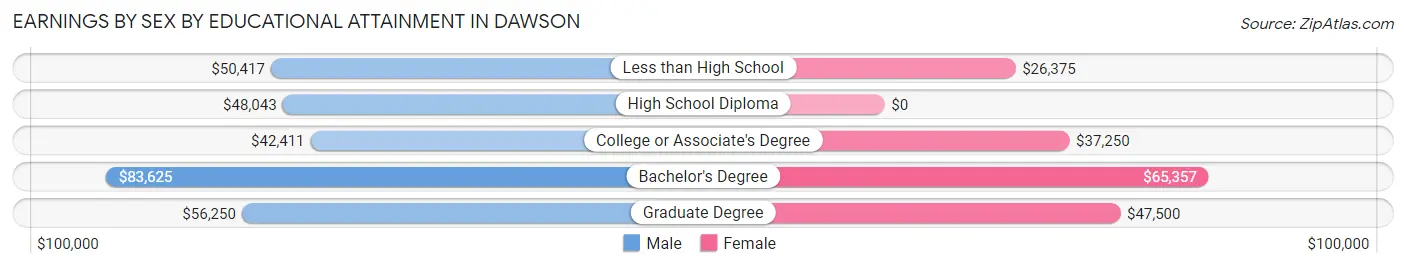
| Educational Attainment | Male Income | Female Income |
| Less than High School | $50,417 | $26,375 |
| High School Diploma | $48,043 | $0 |
| College or Associate's Degree | $42,411 | $37,250 |
| Bachelor's Degree | $83,625 | $65,357 |
| Graduate Degree | $56,250 | $47,500 |
| Total | $49,839 | $38,125 |
Family Income in Dawson
Family Income Brackets in Dawson
According to the Dawson family income data, there are 81 families falling into the $50,000 to $74,999 income range, which is the most common income bracket and makes up 24.0% of all families.
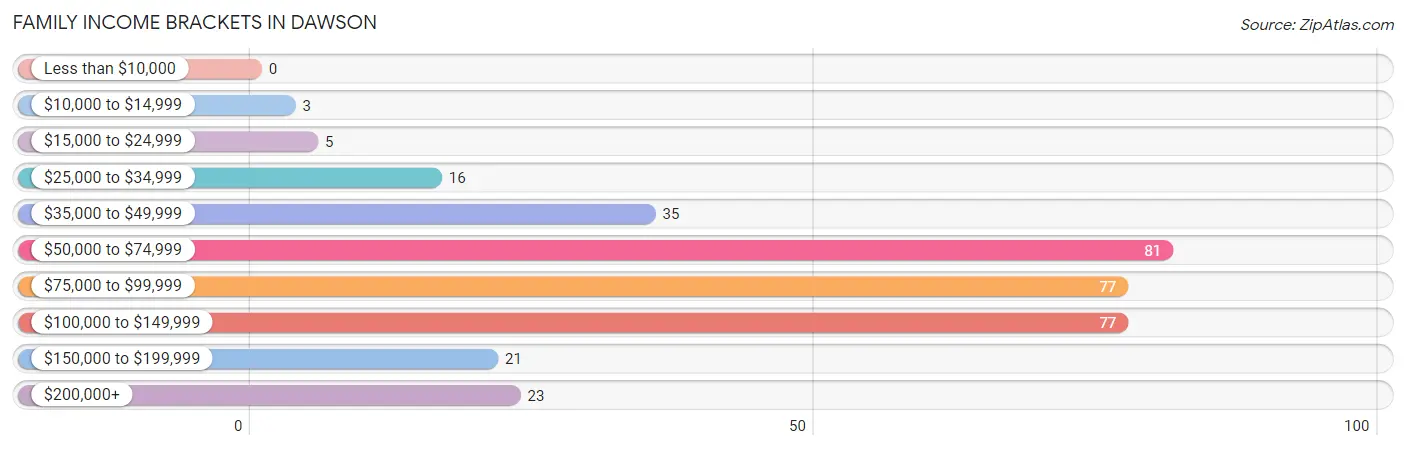
| Income Bracket | # Families | % Families |
| Less than $10,000 | 0 | 0.0% |
| $10,000 to $14,999 | 3 | 0.9% |
| $15,000 to $24,999 | 5 | 1.5% |
| $25,000 to $34,999 | 16 | 4.7% |
| $35,000 to $49,999 | 35 | 10.4% |
| $50,000 to $74,999 | 81 | 24.0% |
| $75,000 to $99,999 | 77 | 22.8% |
| $100,000 to $149,999 | 77 | 22.8% |
| $150,000 to $199,999 | 21 | 6.2% |
| $200,000+ | 23 | 6.8% |
Family Income by Famaliy Size in Dawson
4-person families (54 | 16.0%) account for the highest median family income in Dawson with $111,000 per family, while 2-person families (182 | 53.8%) have the highest median income of $39,250 per family member.
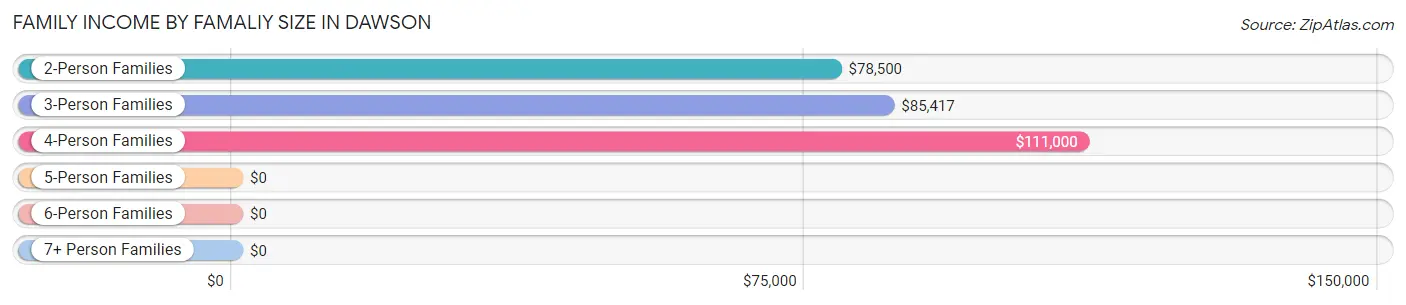
| Income Bracket | # Families | Median Income |
| 2-Person Families | 182 (53.8%) | $78,500 |
| 3-Person Families | 82 (24.3%) | $85,417 |
| 4-Person Families | 54 (16.0%) | $111,000 |
| 5-Person Families | 19 (5.6%) | $0 |
| 6-Person Families | 0 (0.0%) | $0 |
| 7+ Person Families | 1 (0.3%) | $0 |
| Total | 338 (100.0%) | $86,290 |
Family Income by Number of Earners in Dawson
The median family income in Dawson is $86,290, with families comprising 3+ earners (30) having the highest median family income of $111,500, while families with no earners (31) have the lowest median family income of $50,250, accounting for 8.9% and 9.2% of families, respectively.
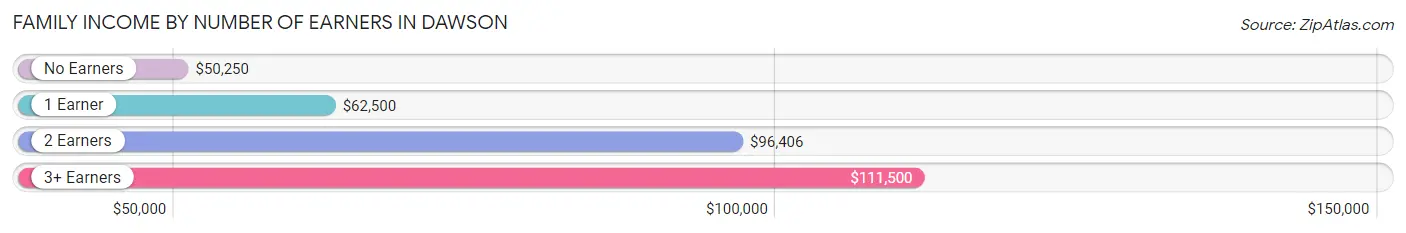
| Number of Earners | # Families | Median Income |
| No Earners | 31 (9.2%) | $50,250 |
| 1 Earner | 114 (33.7%) | $62,500 |
| 2 Earners | 163 (48.2%) | $96,406 |
| 3+ Earners | 30 (8.9%) | $111,500 |
| Total | 338 (100.0%) | $86,290 |
Household Income in Dawson
Household Income Brackets in Dawson
With 130 households falling in the category, the $50,000 to $74,999 income range is the most frequent in Dawson, accounting for 22.4% of all households. In contrast, only 21 households (3.6%) fall into the $150,000 to $199,999 income bracket, making it the least populous group.
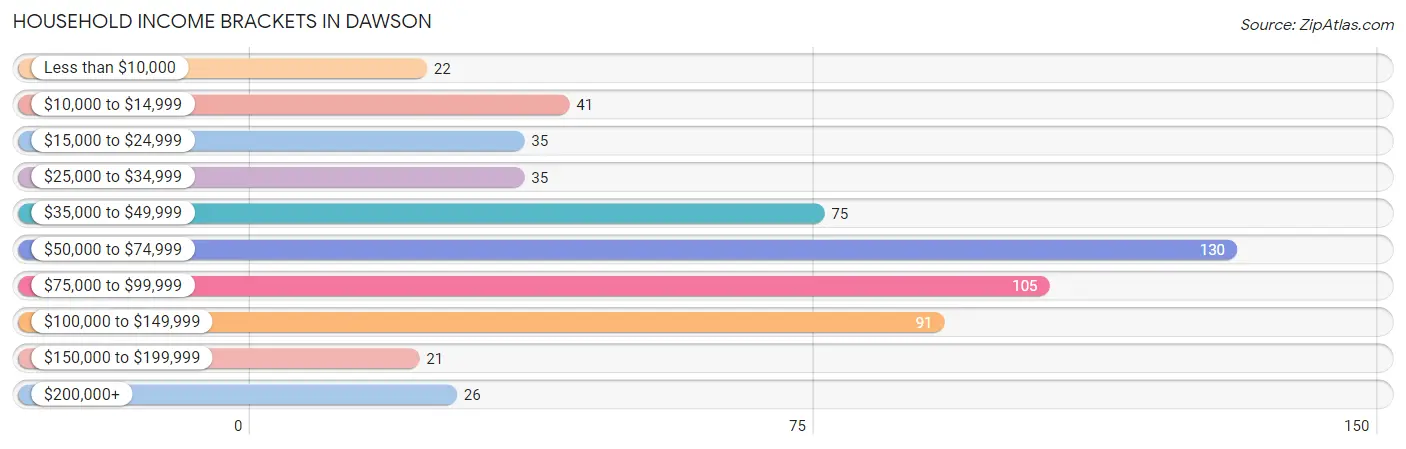
| Income Bracket | # Households | % Households |
| Less than $10,000 | 22 | 3.8% |
| $10,000 to $14,999 | 41 | 7.1% |
| $15,000 to $24,999 | 35 | 6.0% |
| $25,000 to $34,999 | 35 | 6.0% |
| $35,000 to $49,999 | 75 | 12.9% |
| $50,000 to $74,999 | 130 | 22.4% |
| $75,000 to $99,999 | 105 | 18.1% |
| $100,000 to $149,999 | 91 | 15.7% |
| $150,000 to $199,999 | 21 | 3.6% |
| $200,000+ | 26 | 4.5% |
Household Income by Householder Age in Dawson
The median household income in Dawson is $67,540, with the highest median household income of $86,094 found in the 25 to 44 years age bracket for the primary householder. A total of 128 households (22.0%) fall into this category. Meanwhile, the 65+ years age bracket for the primary householder has the lowest median household income of $46,250, with 231 households (39.8%) in this group.
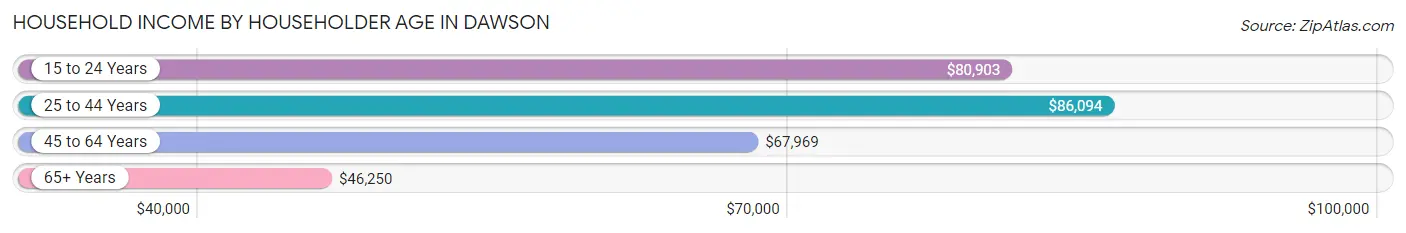
| Income Bracket | # Households | Median Income |
| 15 to 24 Years | 31 (5.3%) | $80,903 |
| 25 to 44 Years | 128 (22.0%) | $86,094 |
| 45 to 64 Years | 191 (32.9%) | $67,969 |
| 65+ Years | 231 (39.8%) | $46,250 |
| Total | 581 (100.0%) | $67,540 |
Poverty in Dawson
Income Below Poverty by Sex and Age in Dawson
With 3.7% poverty level for males and 7.1% for females among the residents of Dawson, 65 to 74 year old males and 45 to 54 year old females are the most vulnerable to poverty, with 13 males (12.0%) and 14 females (28.6%) in their respective age groups living below the poverty level.
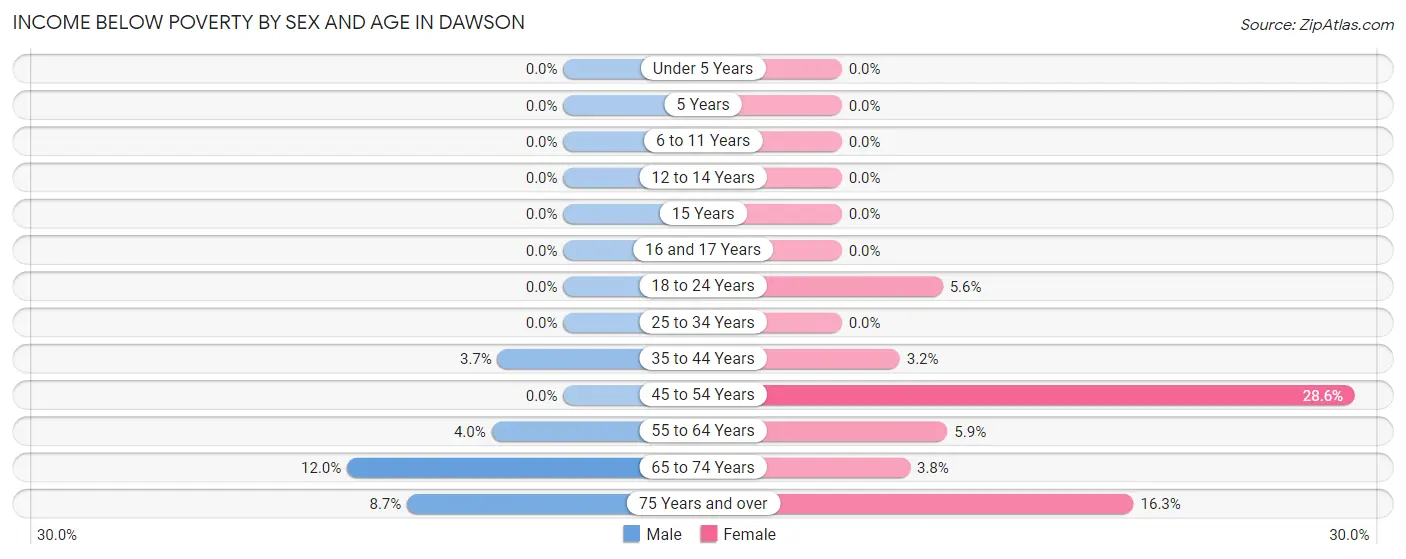
| Age Bracket | Male | Female |
| Under 5 Years | 0 (0.0%) | 0 (0.0%) |
| 5 Years | 0 (0.0%) | 0 (0.0%) |
| 6 to 11 Years | 0 (0.0%) | 0 (0.0%) |
| 12 to 14 Years | 0 (0.0%) | 0 (0.0%) |
| 15 Years | 0 (0.0%) | 0 (0.0%) |
| 16 and 17 Years | 0 (0.0%) | 0 (0.0%) |
| 18 to 24 Years | 0 (0.0%) | 5 (5.6%) |
| 25 to 34 Years | 0 (0.0%) | 0 (0.0%) |
| 35 to 44 Years | 3 (3.7%) | 3 (3.2%) |
| 45 to 54 Years | 0 (0.0%) | 14 (28.6%) |
| 55 to 64 Years | 3 (4.0%) | 7 (5.9%) |
| 65 to 74 Years | 13 (12.0%) | 3 (3.8%) |
| 75 Years and over | 6 (8.7%) | 13 (16.3%) |
| Total | 25 (3.7%) | 45 (7.1%) |
Income Above Poverty by Sex and Age in Dawson
According to the poverty statistics in Dawson, males aged under 5 years and females aged under 5 years are the age groups that are most secure financially, with 100.0% of males and 100.0% of females in these age groups living above the poverty line.
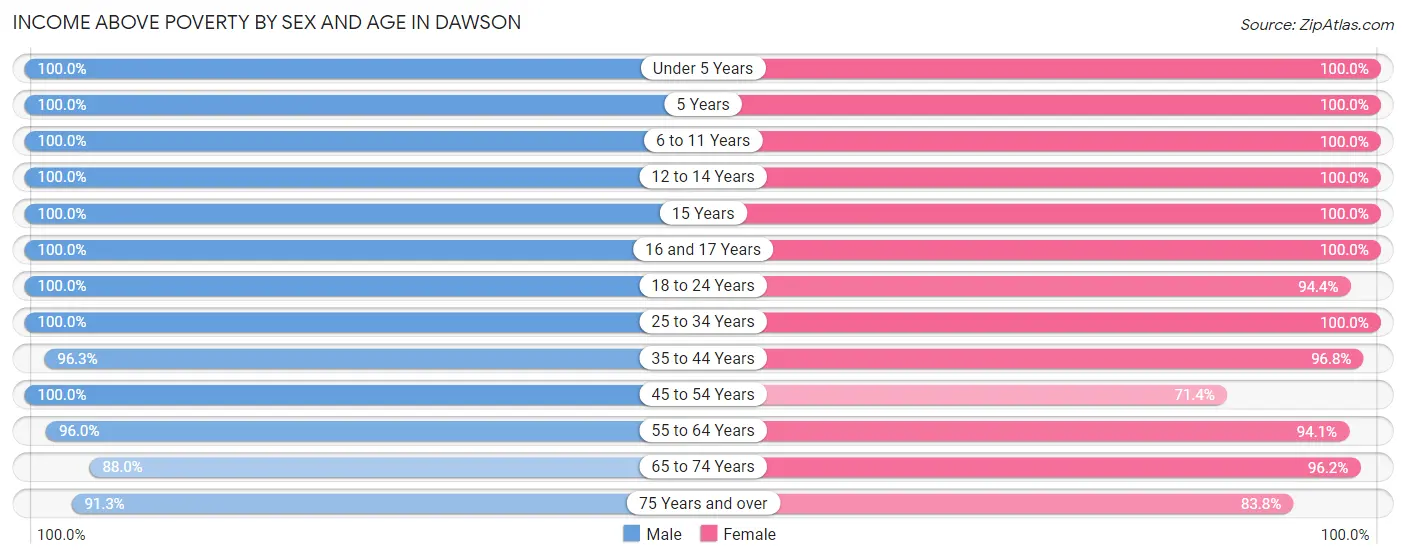
| Age Bracket | Male | Female |
| Under 5 Years | 28 (100.0%) | 18 (100.0%) |
| 5 Years | 2 (100.0%) | 6 (100.0%) |
| 6 to 11 Years | 85 (100.0%) | 11 (100.0%) |
| 12 to 14 Years | 13 (100.0%) | 14 (100.0%) |
| 15 Years | 13 (100.0%) | 4 (100.0%) |
| 16 and 17 Years | 31 (100.0%) | 26 (100.0%) |
| 18 to 24 Years | 62 (100.0%) | 84 (94.4%) |
| 25 to 34 Years | 43 (100.0%) | 41 (100.0%) |
| 35 to 44 Years | 79 (96.3%) | 90 (96.8%) |
| 45 to 54 Years | 65 (100.0%) | 35 (71.4%) |
| 55 to 64 Years | 72 (96.0%) | 112 (94.1%) |
| 65 to 74 Years | 95 (88.0%) | 76 (96.2%) |
| 75 Years and over | 63 (91.3%) | 67 (83.8%) |
| Total | 651 (96.3%) | 584 (92.8%) |
Income Below Poverty Among Married-Couple Families in Dawson
The poverty statistics for married-couple families in Dawson show that 1.1% or 3 of the total 284 families live below the poverty line. Families with no children have the highest poverty rate of 1.7%, comprising of 3 families. On the other hand, families with 1 or 2 children have the lowest poverty rate of 0.0%, which includes 0 families.
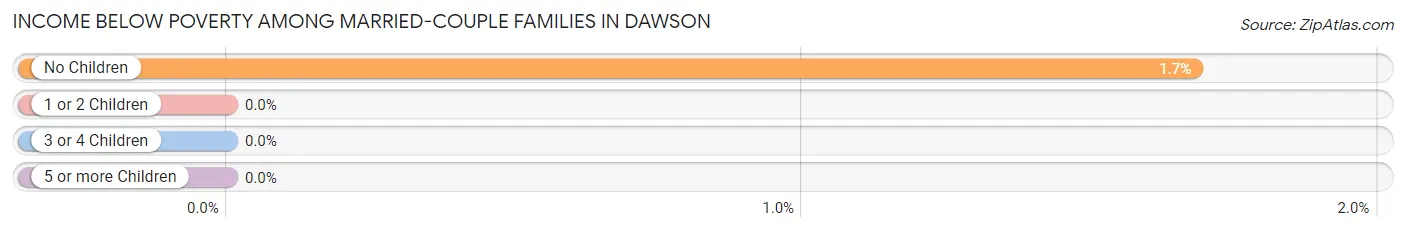
| Children | Above Poverty | Below Poverty |
| No Children | 176 (98.3%) | 3 (1.7%) |
| 1 or 2 Children | 85 (100.0%) | 0 (0.0%) |
| 3 or 4 Children | 20 (100.0%) | 0 (0.0%) |
| 5 or more Children | 0 (0.0%) | 0 (0.0%) |
| Total | 281 (98.9%) | 3 (1.1%) |
Income Below Poverty Among Single-Parent Households in Dawson
| Children | Single Father | Single Mother |
| No Children | 0 (0.0%) | 0 (0.0%) |
| 1 or 2 Children | 0 (0.0%) | 0 (0.0%) |
| 3 or 4 Children | 0 (0.0%) | 0 (0.0%) |
| 5 or more Children | 0 (0.0%) | 0 (0.0%) |
| Total | 0 (0.0%) | 0 (0.0%) |
Income Below Poverty Among Married-Couple vs Single-Parent Households in Dawson
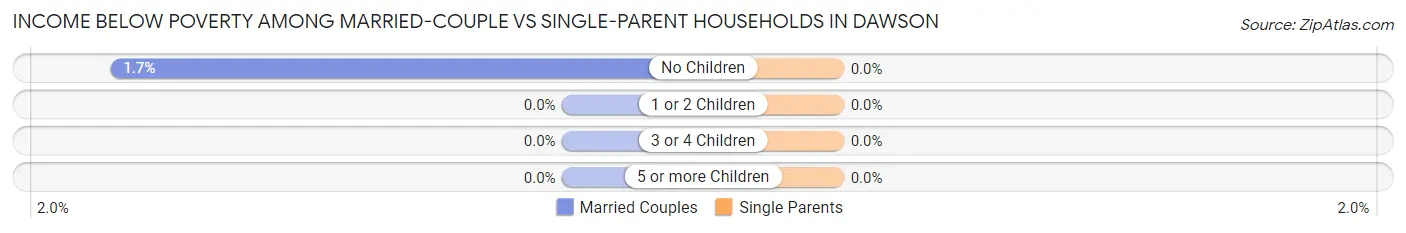
| Children | Married-Couple Families | Single-Parent Households |
| No Children | 3 (1.7%) | 0 (0.0%) |
| 1 or 2 Children | 0 (0.0%) | 0 (0.0%) |
| 3 or 4 Children | 0 (0.0%) | 0 (0.0%) |
| 5 or more Children | 0 (0.0%) | 0 (0.0%) |
| Total | 3 (1.1%) | 0 (0.0%) |
Race in Dawson
The most populous races in Dawson are White / Caucasian (1,225 | 89.5%), Two or more Races (86 | 6.3%), and Black / African American (27 | 2.0%).
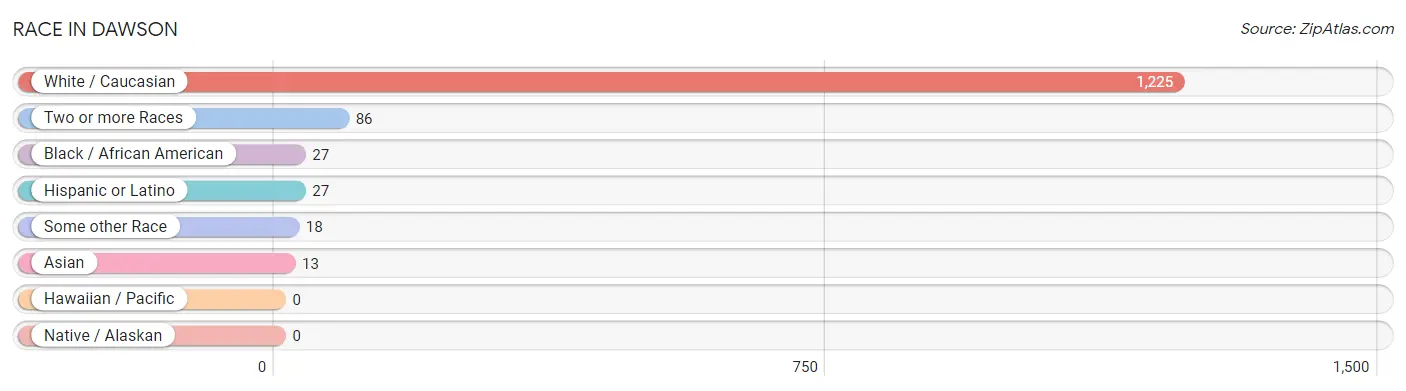
| Race | # Population | % Population |
| Asian | 13 | 0.9% |
| Black / African American | 27 | 2.0% |
| Hawaiian / Pacific | 0 | 0.0% |
| Hispanic or Latino | 27 | 2.0% |
| Native / Alaskan | 0 | 0.0% |
| White / Caucasian | 1,225 | 89.5% |
| Two or more Races | 86 | 6.3% |
| Some other Race | 18 | 1.3% |
| Total | 1,369 | 100.0% |
Ancestry in Dawson
The most populous ancestries reported in Dawson are Norwegian (538 | 39.3%), German (380 | 27.8%), Swedish (91 | 6.7%), Irish (75 | 5.5%), and American (41 | 3.0%), together accounting for 82.2% of all Dawson residents.
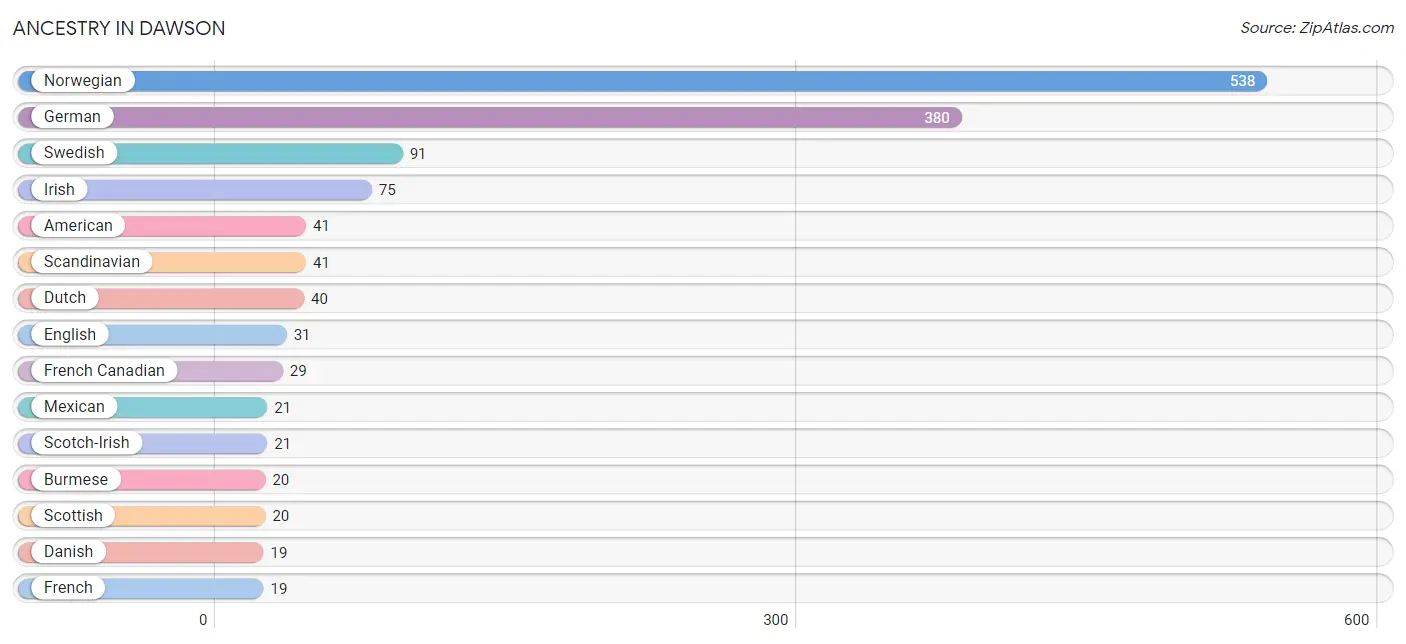
| Ancestry | # Population | % Population |
| American | 41 | 3.0% |
| Arab | 3 | 0.2% |
| Belgian | 10 | 0.7% |
| Burmese | 20 | 1.5% |
| Cherokee | 5 | 0.4% |
| Chippewa | 7 | 0.5% |
| Czech | 6 | 0.4% |
| Danish | 19 | 1.4% |
| Dutch | 40 | 2.9% |
| English | 31 | 2.3% |
| European | 6 | 0.4% |
| French | 19 | 1.4% |
| French Canadian | 29 | 2.1% |
| German | 380 | 27.8% |
| Hungarian | 7 | 0.5% |
| Irish | 75 | 5.5% |
| Italian | 4 | 0.3% |
| Korean | 5 | 0.4% |
| Lithuanian | 2 | 0.2% |
| Mexican | 21 | 1.5% |
| Norwegian | 538 | 39.3% |
| Polish | 8 | 0.6% |
| Scandinavian | 41 | 3.0% |
| Scotch-Irish | 21 | 1.5% |
| Scottish | 20 | 1.5% |
| Seminole | 12 | 0.9% |
| Slovak | 3 | 0.2% |
| South African | 3 | 0.2% |
| Spanish | 6 | 0.4% |
| Subsaharan African | 3 | 0.2% |
| Swedish | 91 | 6.7% |
| Welsh | 2 | 0.2% | View All 32 Rows |
Immigrants in Dawson
The most numerous immigrant groups reported in Dawson came from Asia (20 | 1.5%), Africa (10 | 0.7%), Philippines (9 | 0.7%), South Eastern Asia (9 | 0.7%), and Central America (7 | 0.5%), together accounting for 4.0% of all Dawson residents.
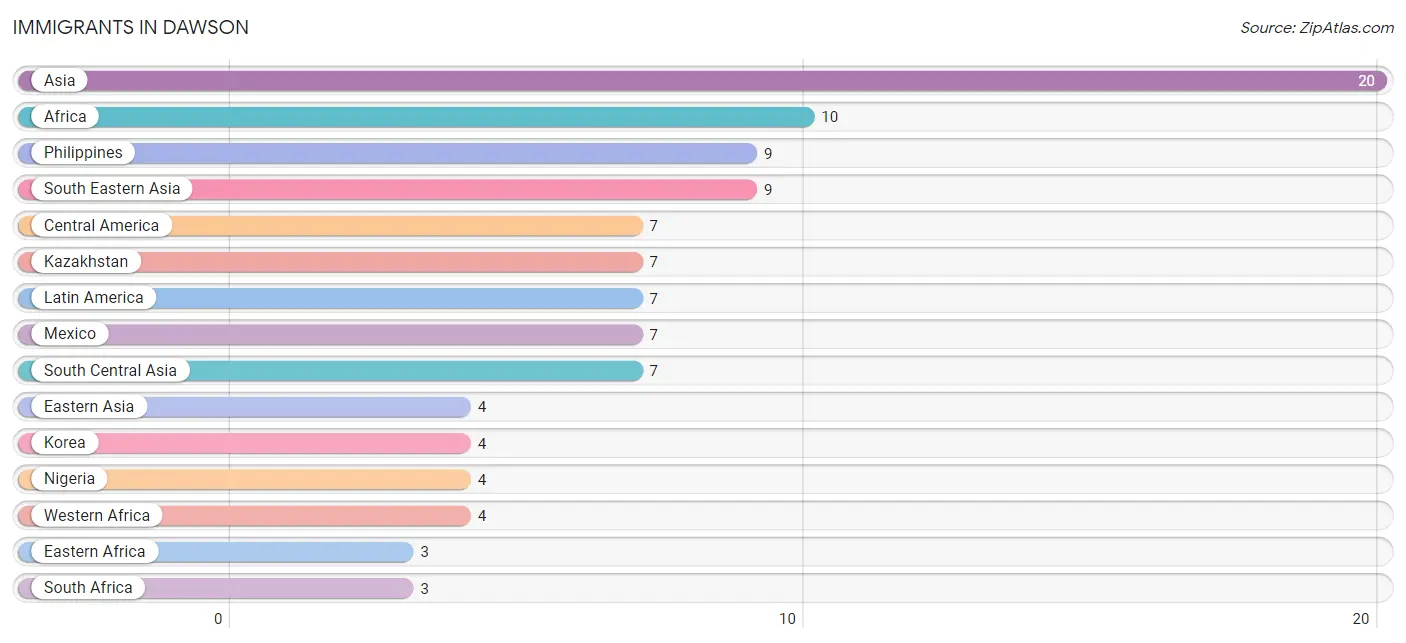
| Immigration Origin | # Population | % Population |
| Africa | 10 | 0.7% |
| Asia | 20 | 1.5% |
| Central America | 7 | 0.5% |
| Eastern Africa | 3 | 0.2% |
| Eastern Asia | 4 | 0.3% |
| Kazakhstan | 7 | 0.5% |
| Korea | 4 | 0.3% |
| Latin America | 7 | 0.5% |
| Mexico | 7 | 0.5% |
| Nigeria | 4 | 0.3% |
| Philippines | 9 | 0.7% |
| South Africa | 3 | 0.2% |
| South Central Asia | 7 | 0.5% |
| South Eastern Asia | 9 | 0.7% |
| Western Africa | 4 | 0.3% | View All 15 Rows |
Sex and Age in Dawson
Sex and Age in Dawson
The most populous age groups in Dawson are 65 to 69 Years (81 | 11.5%) for men and 20 to 24 Years (83 | 12.4%) for women.
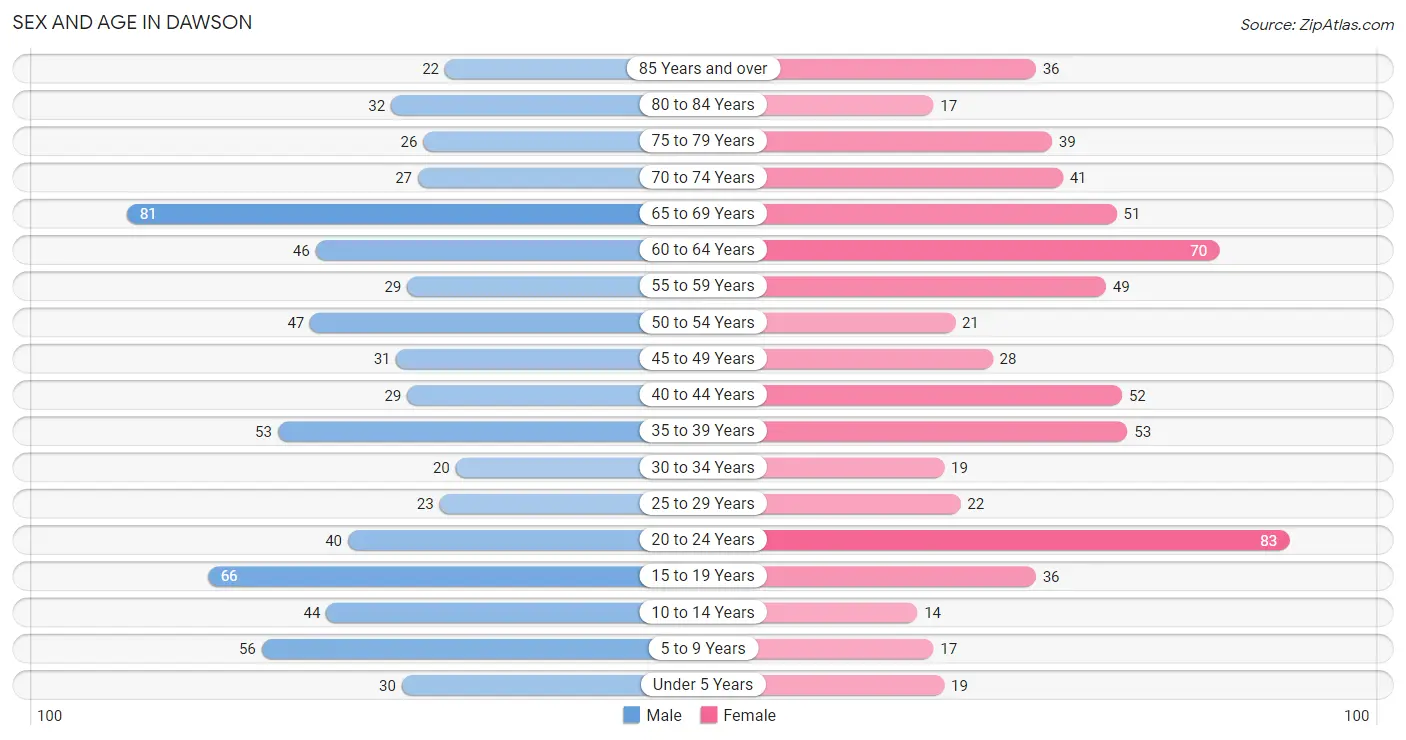
| Age Bracket | Male | Female |
| Under 5 Years | 30 (4.3%) | 19 (2.9%) |
| 5 to 9 Years | 56 (8.0%) | 17 (2.5%) |
| 10 to 14 Years | 44 (6.3%) | 14 (2.1%) |
| 15 to 19 Years | 66 (9.4%) | 36 (5.4%) |
| 20 to 24 Years | 40 (5.7%) | 83 (12.4%) |
| 25 to 29 Years | 23 (3.3%) | 22 (3.3%) |
| 30 to 34 Years | 20 (2.9%) | 19 (2.9%) |
| 35 to 39 Years | 53 (7.5%) | 53 (8.0%) |
| 40 to 44 Years | 29 (4.1%) | 52 (7.8%) |
| 45 to 49 Years | 31 (4.4%) | 28 (4.2%) |
| 50 to 54 Years | 47 (6.7%) | 21 (3.2%) |
| 55 to 59 Years | 29 (4.1%) | 49 (7.3%) |
| 60 to 64 Years | 46 (6.6%) | 70 (10.5%) |
| 65 to 69 Years | 81 (11.5%) | 51 (7.6%) |
| 70 to 74 Years | 27 (3.8%) | 41 (6.1%) |
| 75 to 79 Years | 26 (3.7%) | 39 (5.9%) |
| 80 to 84 Years | 32 (4.6%) | 17 (2.5%) |
| 85 Years and over | 22 (3.1%) | 36 (5.4%) |
| Total | 702 (100.0%) | 667 (100.0%) |
Families and Households in Dawson
Median Family Size in Dawson
The median family size in Dawson is 2.84 persons per family, with single female/mother families (19 | 5.6%) accounting for the largest median family size of 3.74 persons per family. On the other hand, single male/father families (35 | 10.4%) represent the smallest median family size with 2.66 persons per family.
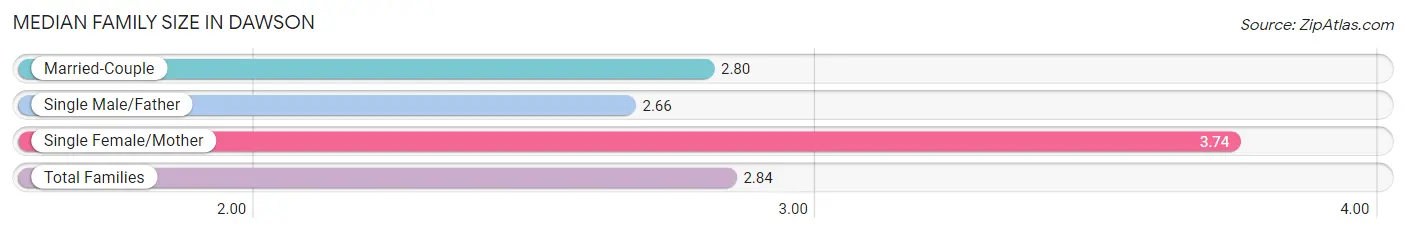
| Family Type | # Families | Family Size |
| Married-Couple | 284 (84.0%) | 2.80 |
| Single Male/Father | 35 (10.4%) | 2.66 |
| Single Female/Mother | 19 (5.6%) | 3.74 |
| Total Families | 338 (100.0%) | 2.84 |
Median Household Size in Dawson
The median household size in Dawson is 2.24 persons per household, with single female/mother households (19 | 3.3%) accounting for the largest median household size of 3.95 persons per household. non-family households (243 | 41.8%) represent the smallest median household size with 1.18 persons per household.
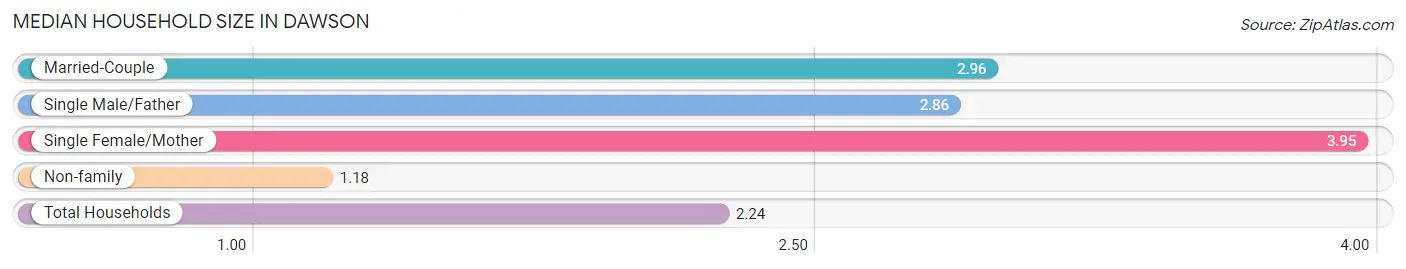
| Household Type | # Households | Household Size |
| Married-Couple | 284 (48.9%) | 2.96 |
| Single Male/Father | 35 (6.0%) | 2.86 |
| Single Female/Mother | 19 (3.3%) | 3.95 |
| Non-family | 243 (41.8%) | 1.18 |
| Total Households | 581 (100.0%) | 2.24 |
Household Size by Marriage Status in Dawson
Out of a total of 581 households in Dawson, 338 (58.2%) are family households, while 243 (41.8%) are nonfamily households. The most numerous type of family households are 2-person households, comprising 173, and the most common type of nonfamily households are 1-person households, comprising 210.
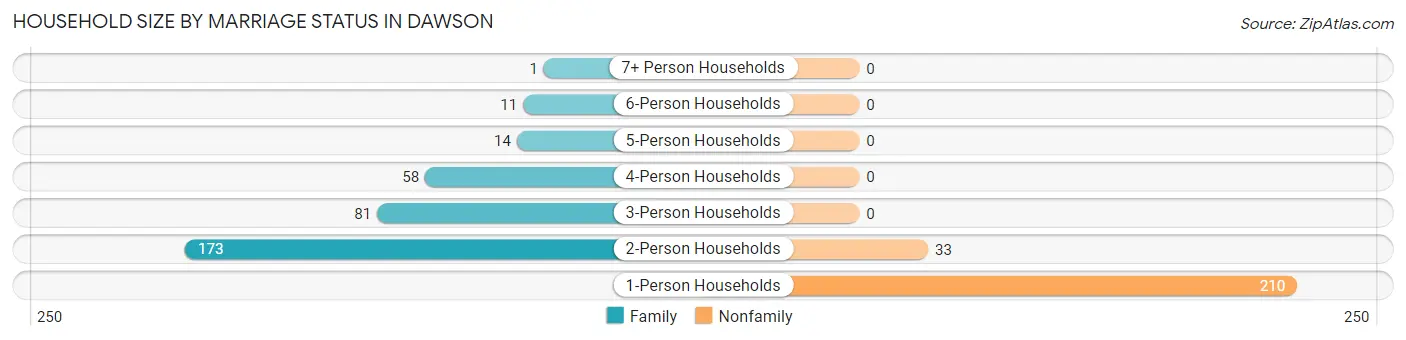
| Household Size | Family Households | Nonfamily Households |
| 1-Person Households | - | 210 (36.1%) |
| 2-Person Households | 173 (29.8%) | 33 (5.7%) |
| 3-Person Households | 81 (13.9%) | 0 (0.0%) |
| 4-Person Households | 58 (10.0%) | 0 (0.0%) |
| 5-Person Households | 14 (2.4%) | 0 (0.0%) |
| 6-Person Households | 11 (1.9%) | 0 (0.0%) |
| 7+ Person Households | 1 (0.2%) | 0 (0.0%) |
| Total | 338 (58.2%) | 243 (41.8%) |
Female Fertility in Dawson
Fertility by Age in Dawson
Average fertility rate in Dawson is 34.0 births per 1,000 women. Women in the age bracket of 20 to 34 years have the highest fertility rate with 48.0 births per 1,000 women. Women in the age bracket of 20 to 34 years acount for 60.0% of all women with births.
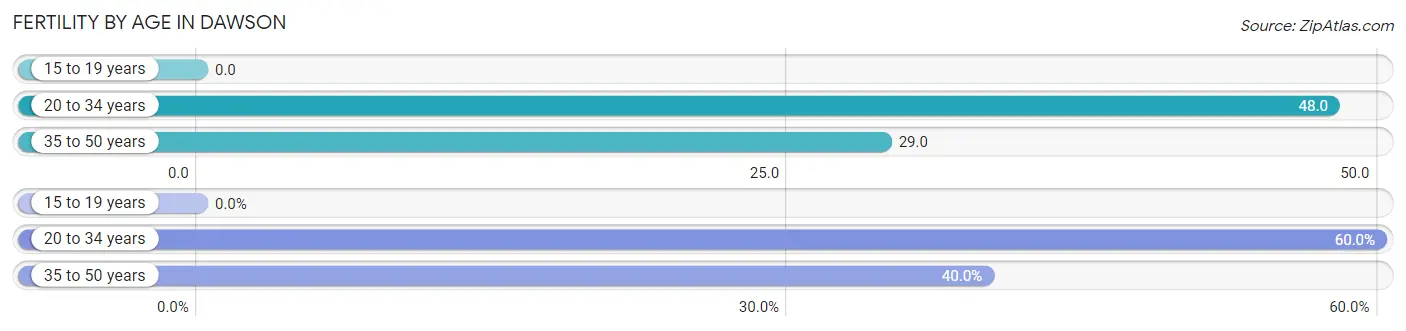
| Age Bracket | Women with Births | Births / 1,000 Women |
| 15 to 19 years | 0 (0.0%) | 0.0 |
| 20 to 34 years | 6 (60.0%) | 48.0 |
| 35 to 50 years | 4 (40.0%) | 29.0 |
| Total | 10 (100.0%) | 34.0 |
Fertility by Age by Marriage Status in Dawson
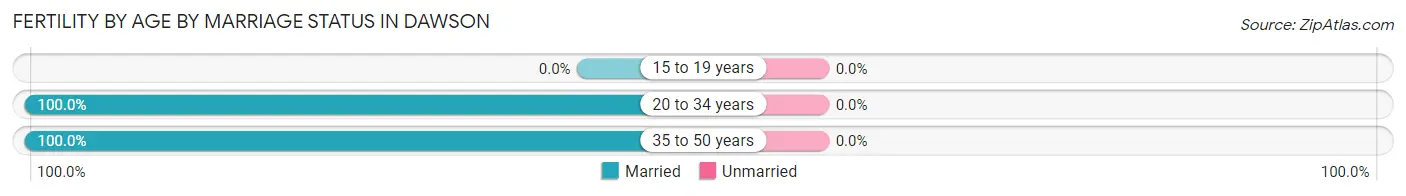
| Age Bracket | Married | Unmarried |
| 15 to 19 years | 0 (0.0%) | 0 (0.0%) |
| 20 to 34 years | 6 (100.0%) | 0 (0.0%) |
| 35 to 50 years | 4 (100.0%) | 0 (0.0%) |
| Total | 10 (100.0%) | 0 (0.0%) |
Fertility by Education in Dawson
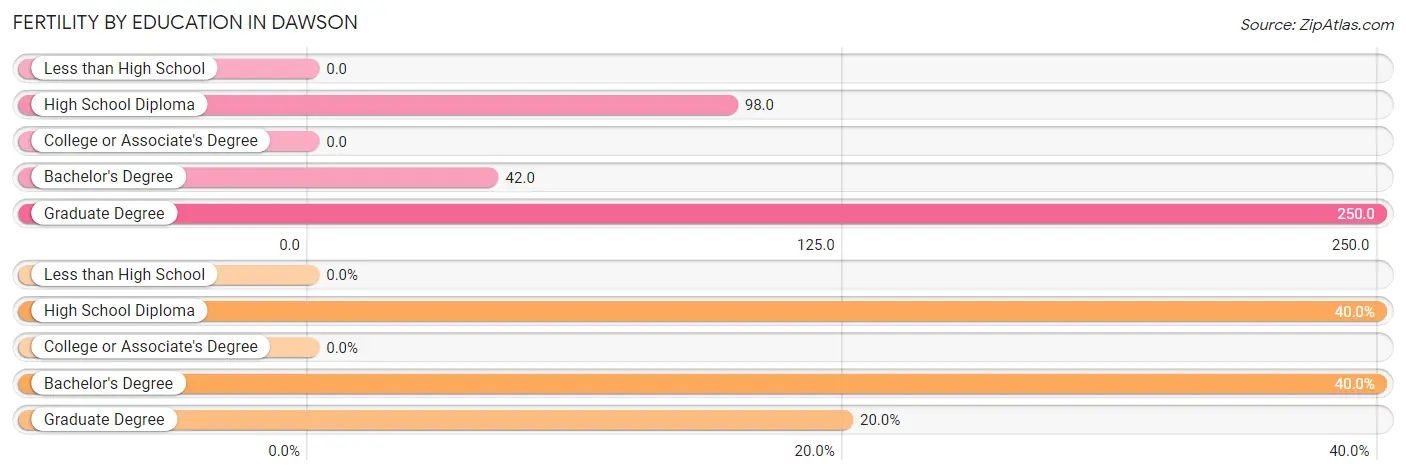
| Educational Attainment | Women with Births | Births / 1,000 Women |
| Less than High School | 0 (0.0%) | 0.0 |
| High School Diploma | 4 (40.0%) | 98.0 |
| College or Associate's Degree | 0 (0.0%) | 0.0 |
| Bachelor's Degree | 4 (40.0%) | 42.0 |
| Graduate Degree | 2 (20.0%) | 250.0 |
| Total | 10 (100.0%) | 34.0 |
Fertility by Education by Marriage Status in Dawson
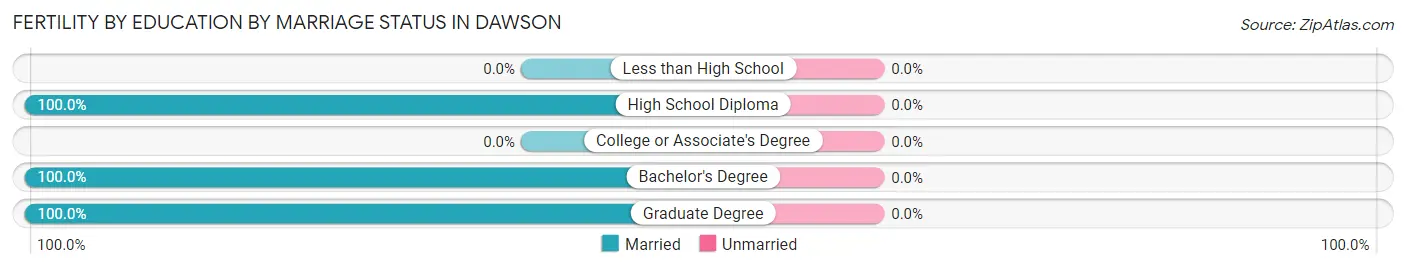
| Educational Attainment | Married | Unmarried |
| Less than High School | 0 (0.0%) | 0 (0.0%) |
| High School Diploma | 4 (100.0%) | 0 (0.0%) |
| College or Associate's Degree | 0 (0.0%) | 0 (0.0%) |
| Bachelor's Degree | 4 (100.0%) | 0 (0.0%) |
| Graduate Degree | 2 (100.0%) | 0 (0.0%) |
| Total | 10 (100.0%) | 0 (0.0%) |
Employment Characteristics in Dawson
Employment by Class of Employer in Dawson
Among the 676 employed individuals in Dawson, private company employees (406 | 60.1%), not-for-profit organizations (101 | 14.9%), and local government employees (78 | 11.5%) make up the most common classes of employment.
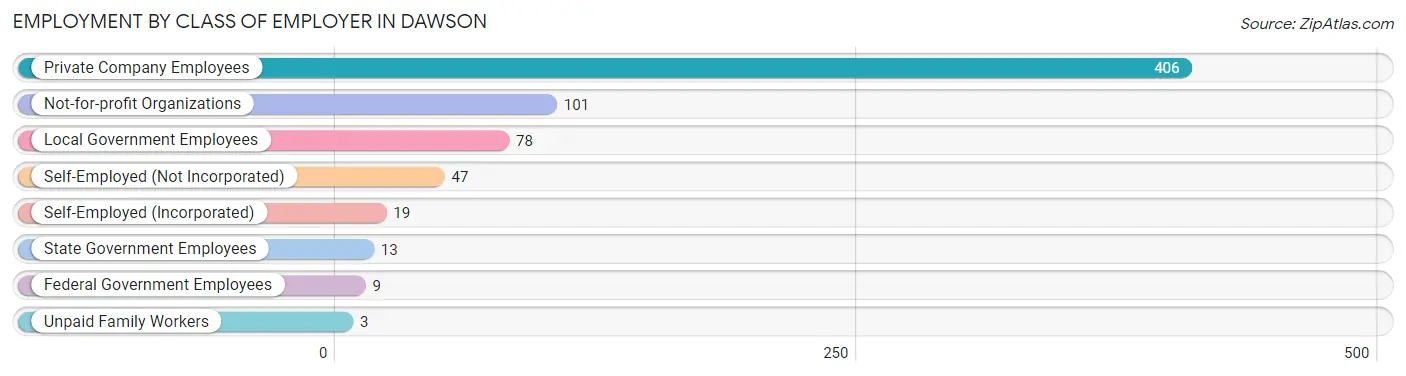
| Employer Class | # Employees | % Employees |
| Private Company Employees | 406 | 60.1% |
| Self-Employed (Incorporated) | 19 | 2.8% |
| Self-Employed (Not Incorporated) | 47 | 7.0% |
| Not-for-profit Organizations | 101 | 14.9% |
| Local Government Employees | 78 | 11.5% |
| State Government Employees | 13 | 1.9% |
| Federal Government Employees | 9 | 1.3% |
| Unpaid Family Workers | 3 | 0.4% |
| Total | 676 | 100.0% |
Employment Status by Age in Dawson
According to the labor force statistics for Dawson, out of the total population over 16 years of age (1,172), 61.2% or 717 individuals are in the labor force, with 4.6% or 33 of them unemployed. The age group with the highest labor force participation rate is 30 to 34 years, with 100.0% or 39 individuals in the labor force. Within the labor force, the 16 to 19 years age range has the highest percentage of unemployed individuals, with 39.2% or 20 of them being unemployed.
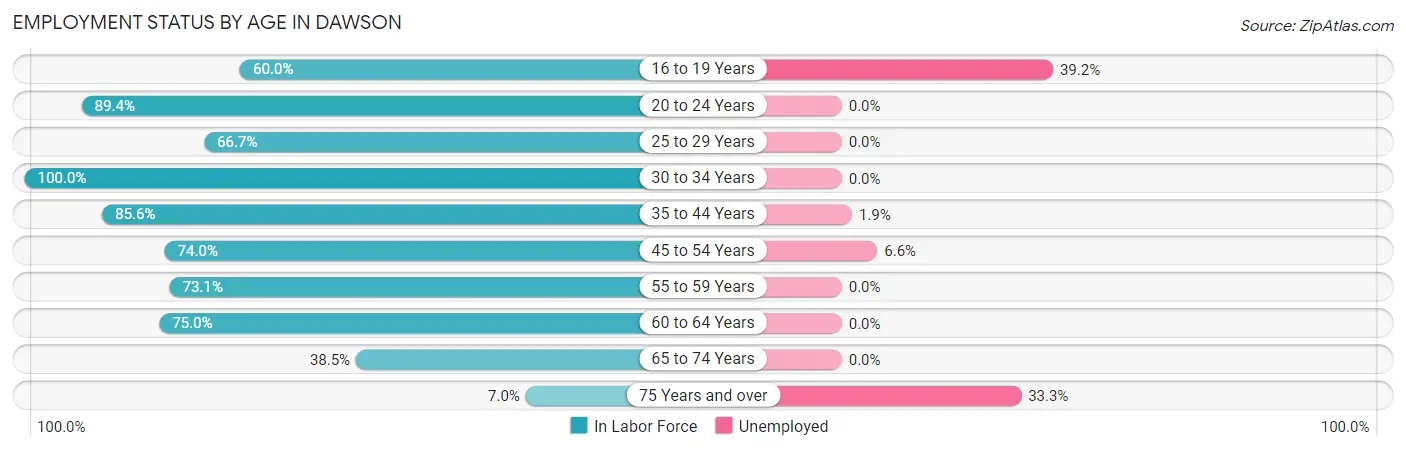
| Age Bracket | In Labor Force | Unemployed |
| 16 to 19 Years | 51 (60.0%) | 20 (39.2%) |
| 20 to 24 Years | 110 (89.4%) | 0 (0.0%) |
| 25 to 29 Years | 30 (66.7%) | 0 (0.0%) |
| 30 to 34 Years | 39 (100.0%) | 0 (0.0%) |
| 35 to 44 Years | 160 (85.6%) | 3 (1.9%) |
| 45 to 54 Years | 94 (74.0%) | 6 (6.6%) |
| 55 to 59 Years | 57 (73.1%) | 0 (0.0%) |
| 60 to 64 Years | 87 (75.0%) | 0 (0.0%) |
| 65 to 74 Years | 77 (38.5%) | 0 (0.0%) |
| 75 Years and over | 12 (7.0%) | 4 (33.3%) |
| Total | 717 (61.2%) | 33 (4.6%) |
Employment Status by Educational Attainment in Dawson
According to labor force statistics for Dawson, 78.9% of individuals (467) out of the total population between 25 and 64 years of age (592) are in the labor force, with 2.0% or 9 of them being unemployed. The group with the highest labor force participation rate are those with the educational attainment of college / associate degree, with 93.7% or 209 individuals in the labor force. Within the labor force, individuals with college / associate degree education have the highest percentage of unemployment, with 3.4% or 7 of them being unemployed.
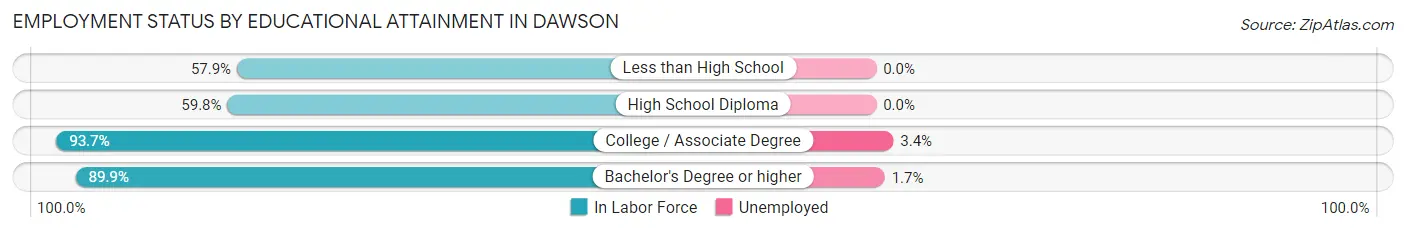
| Educational Attainment | In Labor Force | Unemployed |
| Less than High School | 44 (57.9%) | 0 (0.0%) |
| High School Diploma | 98 (59.8%) | 0 (0.0%) |
| College / Associate Degree | 209 (93.7%) | 8 (3.4%) |
| Bachelor's Degree or higher | 116 (89.9%) | 2 (1.7%) |
| Total | 467 (78.9%) | 12 (2.0%) |
Employment Occupations by Sex in Dawson
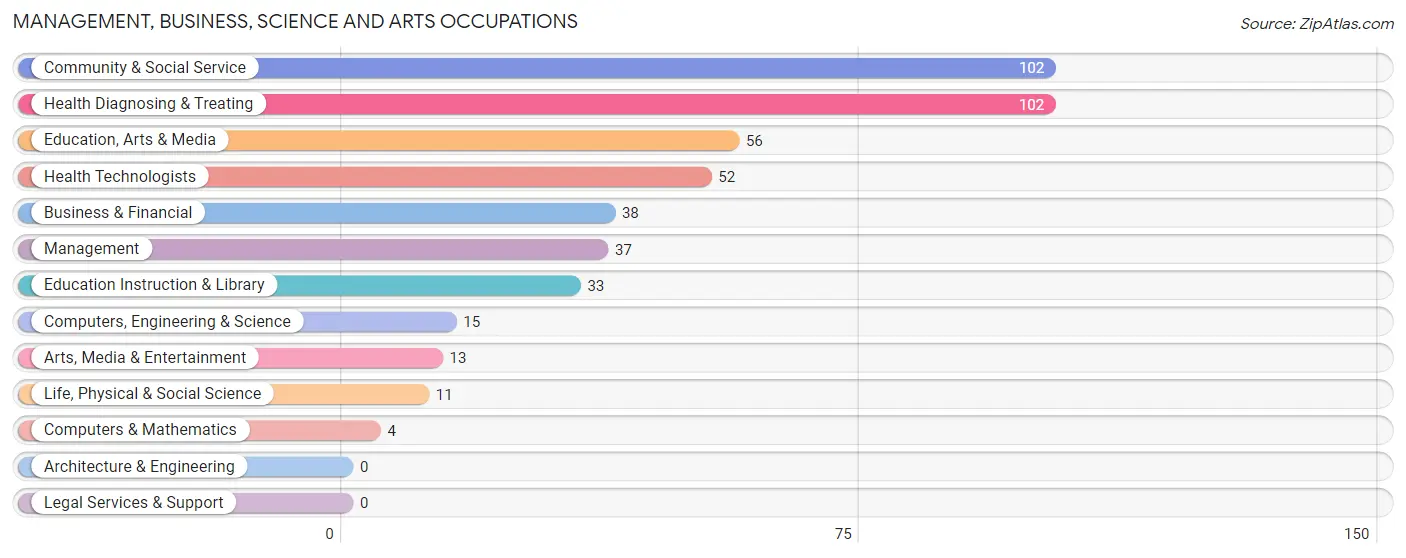
Management, Business, Science and Arts Occupations
The most common Management, Business, Science and Arts occupations in Dawson are Community & Social Service (102 | 15.0%), Health Diagnosing & Treating (102 | 15.0%), Education, Arts & Media (56 | 8.3%), Health Technologists (52 | 7.7%), and Business & Financial (38 | 5.6%).
Management, Business, Science and Arts Occupations by Sex
Within the Management, Business, Science and Arts occupations in Dawson, the most male-oriented occupations are Life, Physical & Social Science (100.0%), Computers, Engineering & Science (73.3%), and Management (40.5%), while the most female-oriented occupations are Computers & Mathematics (100.0%), Arts, Media & Entertainment (100.0%), and Health Diagnosing & Treating (89.2%).
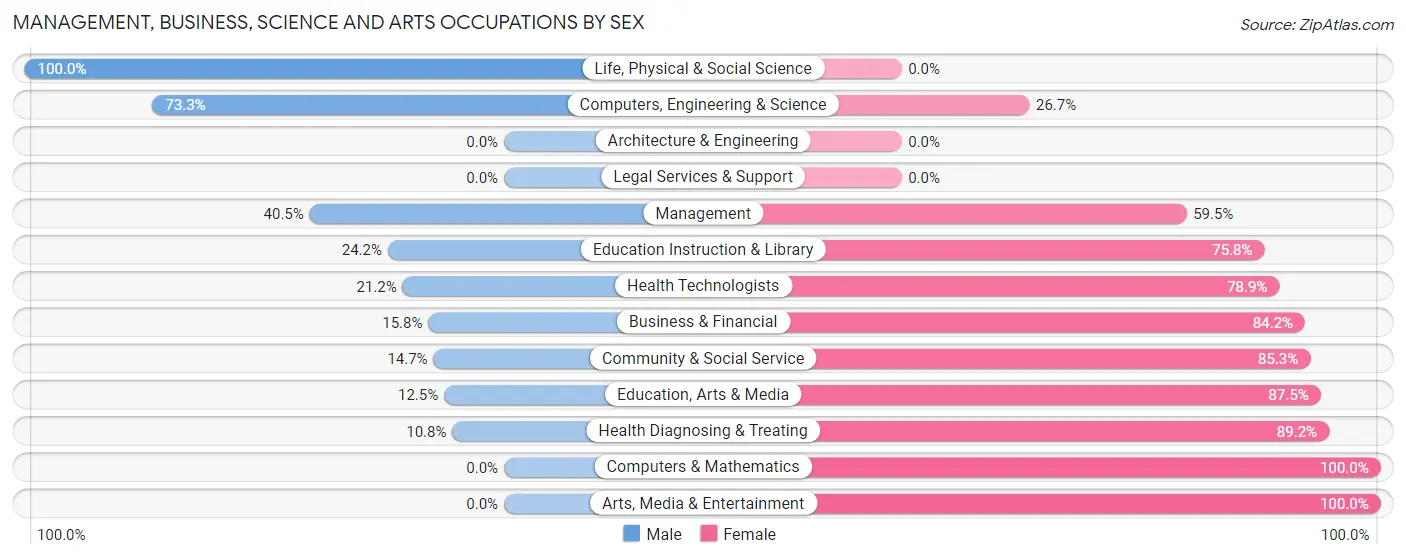
| Occupation | Male | Female |
| Management | 15 (40.5%) | 22 (59.5%) |
| Business & Financial | 6 (15.8%) | 32 (84.2%) |
| Computers, Engineering & Science | 11 (73.3%) | 4 (26.7%) |
| Computers & Mathematics | 0 (0.0%) | 4 (100.0%) |
| Architecture & Engineering | 0 (0.0%) | 0 (0.0%) |
| Life, Physical & Social Science | 11 (100.0%) | 0 (0.0%) |
| Community & Social Service | 15 (14.7%) | 87 (85.3%) |
| Education, Arts & Media | 7 (12.5%) | 49 (87.5%) |
| Legal Services & Support | 0 (0.0%) | 0 (0.0%) |
| Education Instruction & Library | 8 (24.2%) | 25 (75.8%) |
| Arts, Media & Entertainment | 0 (0.0%) | 13 (100.0%) |
| Health Diagnosing & Treating | 11 (10.8%) | 91 (89.2%) |
| Health Technologists | 11 (21.1%) | 41 (78.8%) |
| Total (Category) | 58 (19.7%) | 236 (80.3%) |
| Total (Overall) | 311 (45.9%) | 367 (54.1%) |
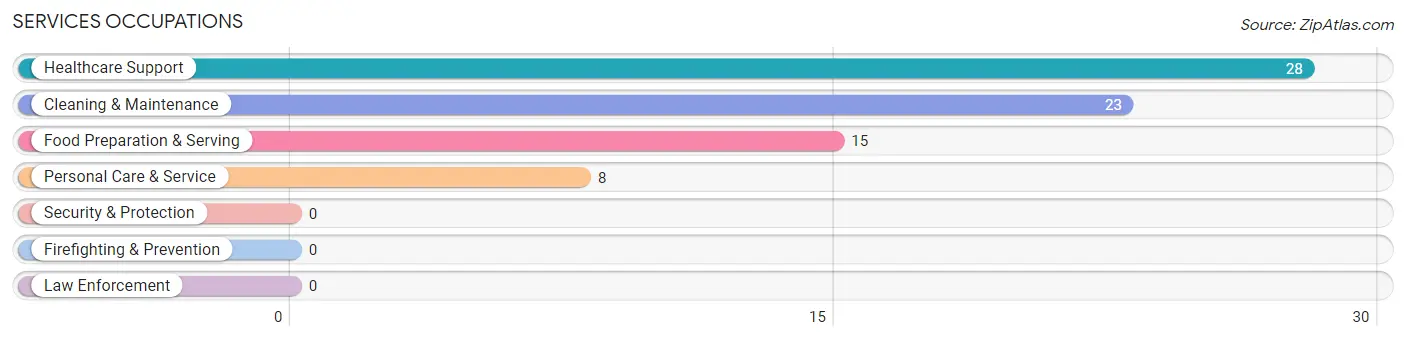
Services Occupations
The most common Services occupations in Dawson are Healthcare Support (28 | 4.1%), Cleaning & Maintenance (23 | 3.4%), Food Preparation & Serving (15 | 2.2%), and Personal Care & Service (8 | 1.2%).
Services Occupations by Sex
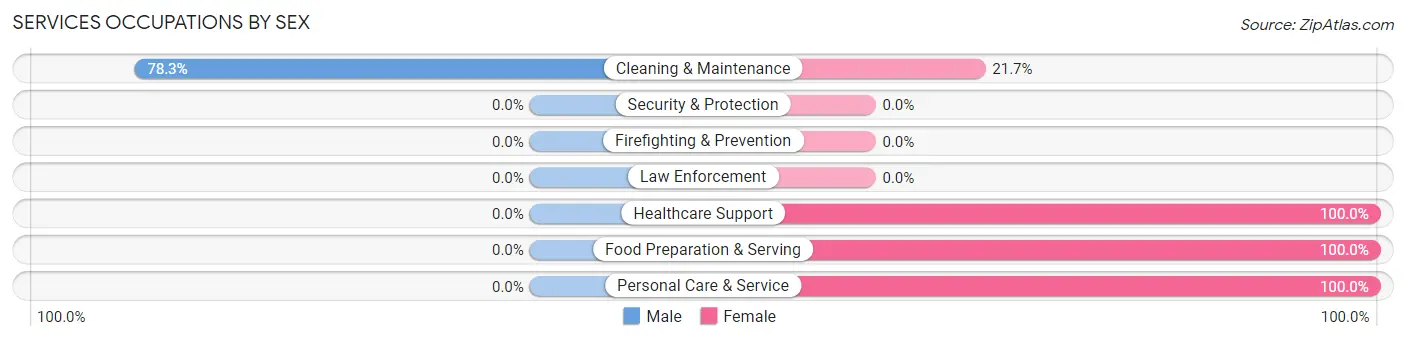
| Occupation | Male | Female |
| Healthcare Support | 0 (0.0%) | 28 (100.0%) |
| Security & Protection | 0 (0.0%) | 0 (0.0%) |
| Firefighting & Prevention | 0 (0.0%) | 0 (0.0%) |
| Law Enforcement | 0 (0.0%) | 0 (0.0%) |
| Food Preparation & Serving | 0 (0.0%) | 15 (100.0%) |
| Cleaning & Maintenance | 18 (78.3%) | 5 (21.7%) |
| Personal Care & Service | 0 (0.0%) | 8 (100.0%) |
| Total (Category) | 18 (24.3%) | 56 (75.7%) |
| Total (Overall) | 311 (45.9%) | 367 (54.1%) |
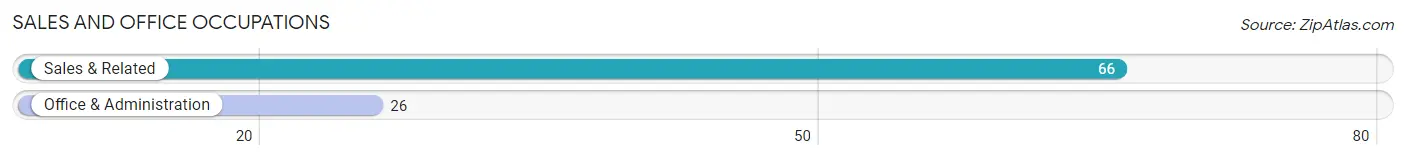
Sales and Office Occupations
The most common Sales and Office occupations in Dawson are Sales & Related (66 | 9.7%), and Office & Administration (26 | 3.8%).
Sales and Office Occupations by Sex
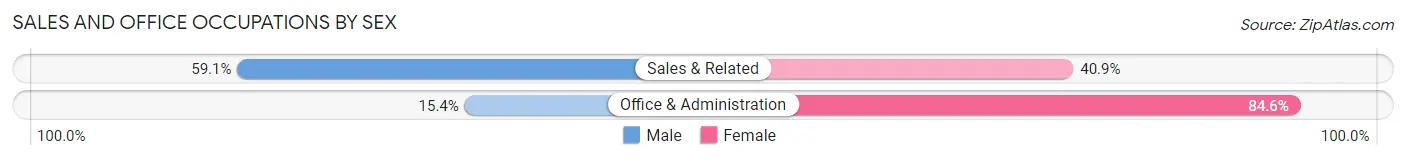
| Occupation | Male | Female |
| Sales & Related | 39 (59.1%) | 27 (40.9%) |
| Office & Administration | 4 (15.4%) | 22 (84.6%) |
| Total (Category) | 43 (46.7%) | 49 (53.3%) |
| Total (Overall) | 311 (45.9%) | 367 (54.1%) |
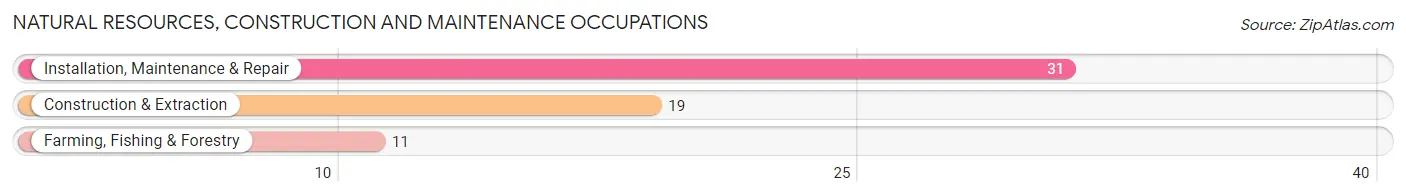
Natural Resources, Construction and Maintenance Occupations
The most common Natural Resources, Construction and Maintenance occupations in Dawson are Installation, Maintenance & Repair (31 | 4.6%), Construction & Extraction (19 | 2.8%), and Farming, Fishing & Forestry (11 | 1.6%).
Natural Resources, Construction and Maintenance Occupations by Sex
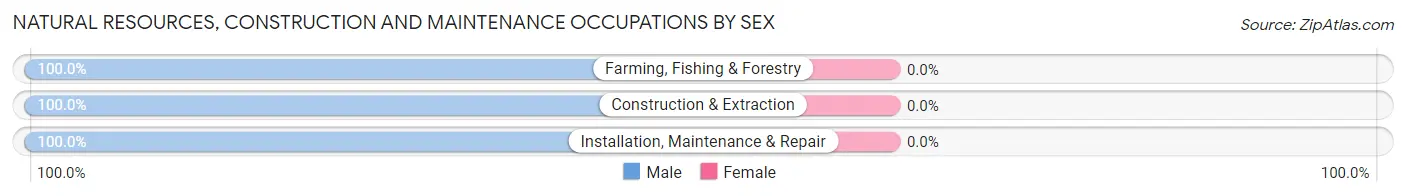
| Occupation | Male | Female |
| Farming, Fishing & Forestry | 11 (100.0%) | 0 (0.0%) |
| Construction & Extraction | 19 (100.0%) | 0 (0.0%) |
| Installation, Maintenance & Repair | 31 (100.0%) | 0 (0.0%) |
| Total (Category) | 61 (100.0%) | 0 (0.0%) |
| Total (Overall) | 311 (45.9%) | 367 (54.1%) |
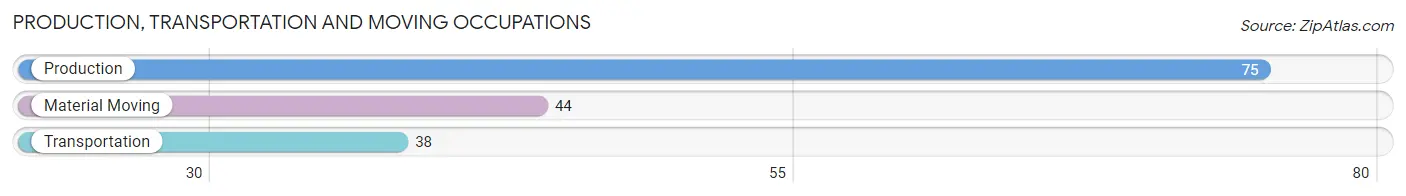
Production, Transportation and Moving Occupations
The most common Production, Transportation and Moving occupations in Dawson are Production (75 | 11.1%), Material Moving (44 | 6.5%), and Transportation (38 | 5.6%).
Production, Transportation and Moving Occupations by Sex
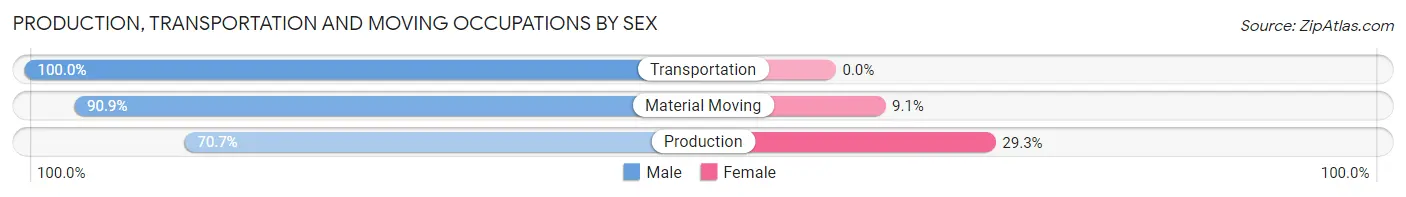
| Occupation | Male | Female |
| Production | 53 (70.7%) | 22 (29.3%) |
| Transportation | 38 (100.0%) | 0 (0.0%) |
| Material Moving | 40 (90.9%) | 4 (9.1%) |
| Total (Category) | 131 (83.4%) | 26 (16.6%) |
| Total (Overall) | 311 (45.9%) | 367 (54.1%) |
Employment Industries by Sex in Dawson
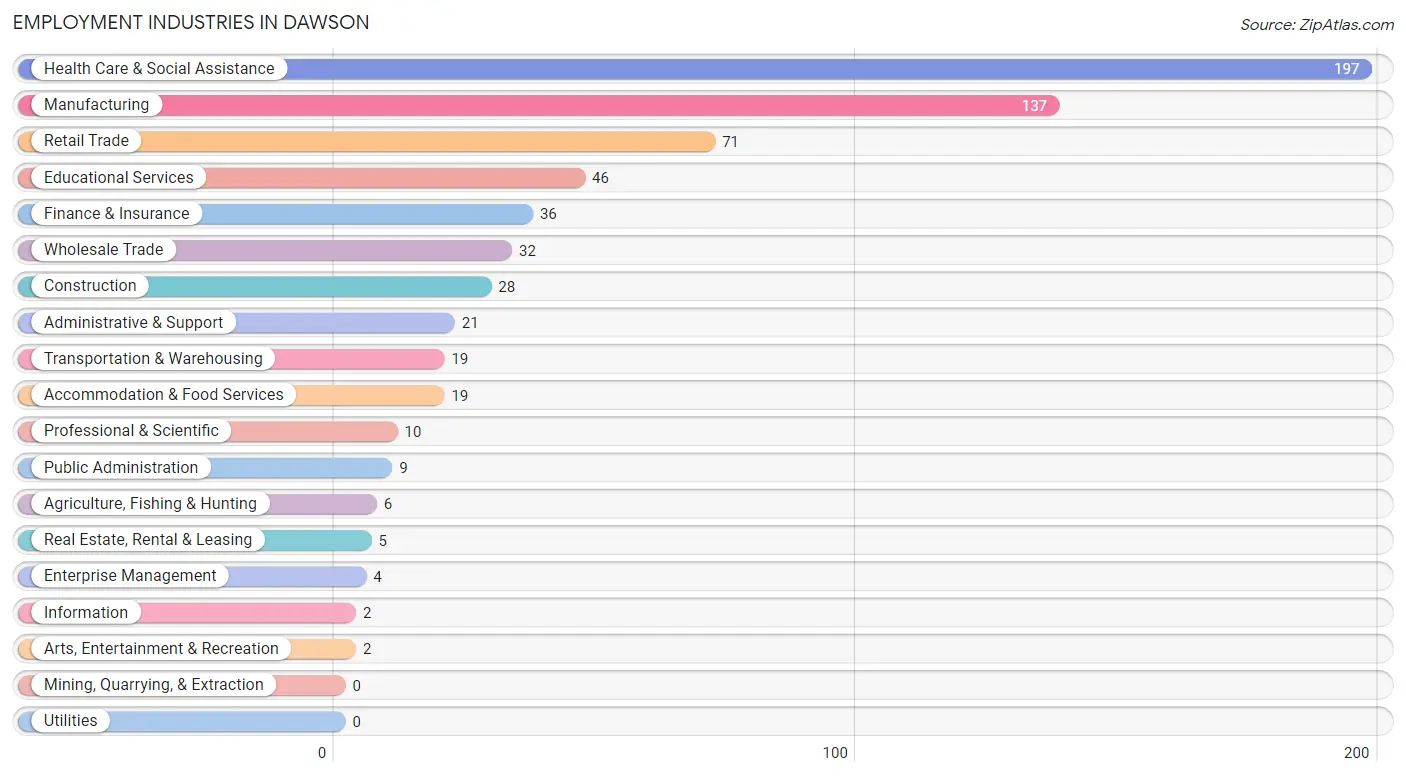
Employment Industries in Dawson
The major employment industries in Dawson include Health Care & Social Assistance (197 | 29.1%), Manufacturing (137 | 20.2%), Retail Trade (71 | 10.5%), Educational Services (46 | 6.8%), and Finance & Insurance (36 | 5.3%).
Employment Industries by Sex in Dawson
The Dawson industries that see more men than women are Agriculture, Fishing & Hunting (100.0%), Construction (100.0%), and Real Estate, Rental & Leasing (100.0%), whereas the industries that tend to have a higher number of women are Information (100.0%), Professional & Scientific (100.0%), and Arts, Entertainment & Recreation (100.0%).
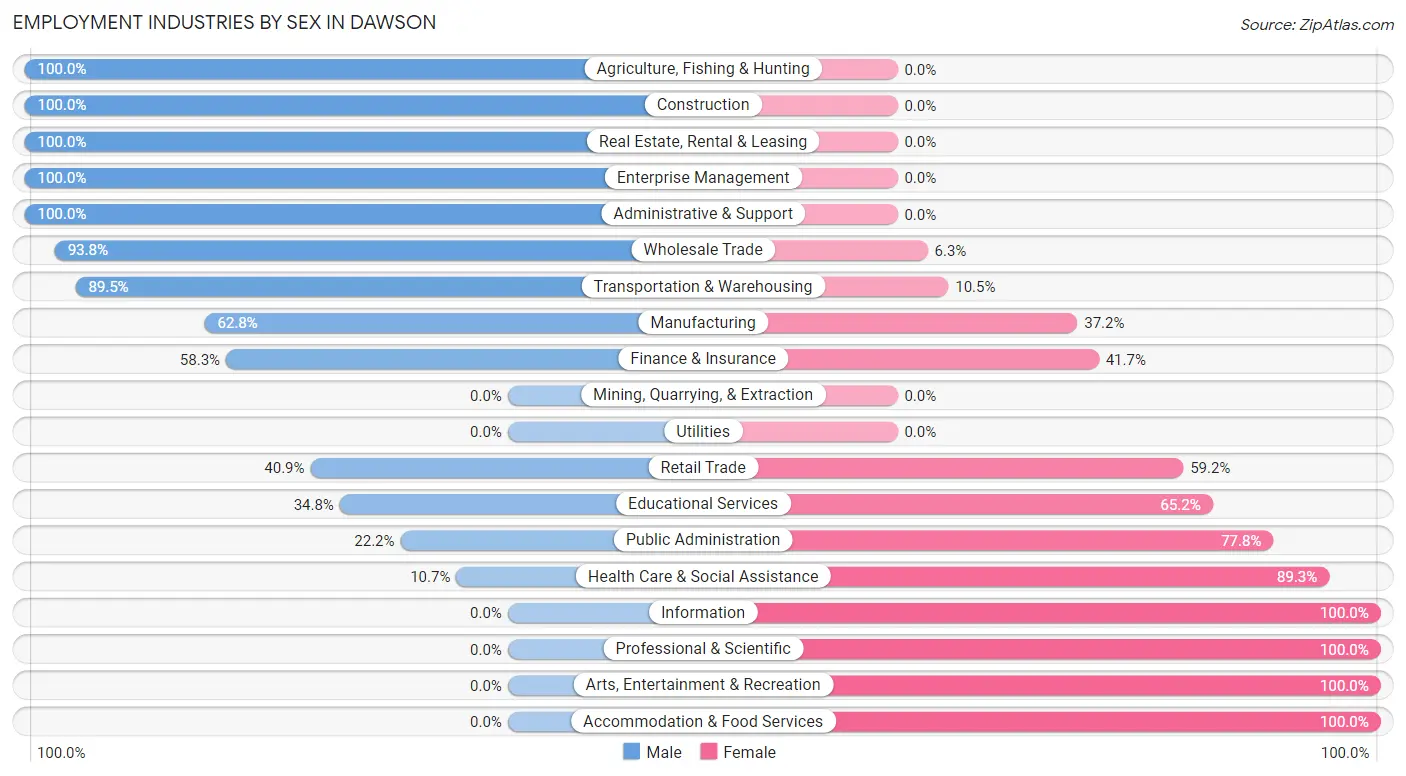
| Industry | Male | Female |
| Agriculture, Fishing & Hunting | 6 (100.0%) | 0 (0.0%) |
| Mining, Quarrying, & Extraction | 0 (0.0%) | 0 (0.0%) |
| Construction | 28 (100.0%) | 0 (0.0%) |
| Manufacturing | 86 (62.8%) | 51 (37.2%) |
| Wholesale Trade | 30 (93.8%) | 2 (6.2%) |
| Retail Trade | 29 (40.8%) | 42 (59.2%) |
| Transportation & Warehousing | 17 (89.5%) | 2 (10.5%) |
| Utilities | 0 (0.0%) | 0 (0.0%) |
| Information | 0 (0.0%) | 2 (100.0%) |
| Finance & Insurance | 21 (58.3%) | 15 (41.7%) |
| Real Estate, Rental & Leasing | 5 (100.0%) | 0 (0.0%) |
| Professional & Scientific | 0 (0.0%) | 10 (100.0%) |
| Enterprise Management | 4 (100.0%) | 0 (0.0%) |
| Administrative & Support | 21 (100.0%) | 0 (0.0%) |
| Educational Services | 16 (34.8%) | 30 (65.2%) |
| Health Care & Social Assistance | 21 (10.7%) | 176 (89.3%) |
| Arts, Entertainment & Recreation | 0 (0.0%) | 2 (100.0%) |
| Accommodation & Food Services | 0 (0.0%) | 19 (100.0%) |
| Public Administration | 2 (22.2%) | 7 (77.8%) |
| Total | 311 (45.9%) | 367 (54.1%) |
Education in Dawson
School Enrollment in Dawson
The most common levels of schooling among the 218 students in Dawson are high school (85 | 39.0%), elementary school (46 | 21.1%), and middle school (39 | 17.9%).
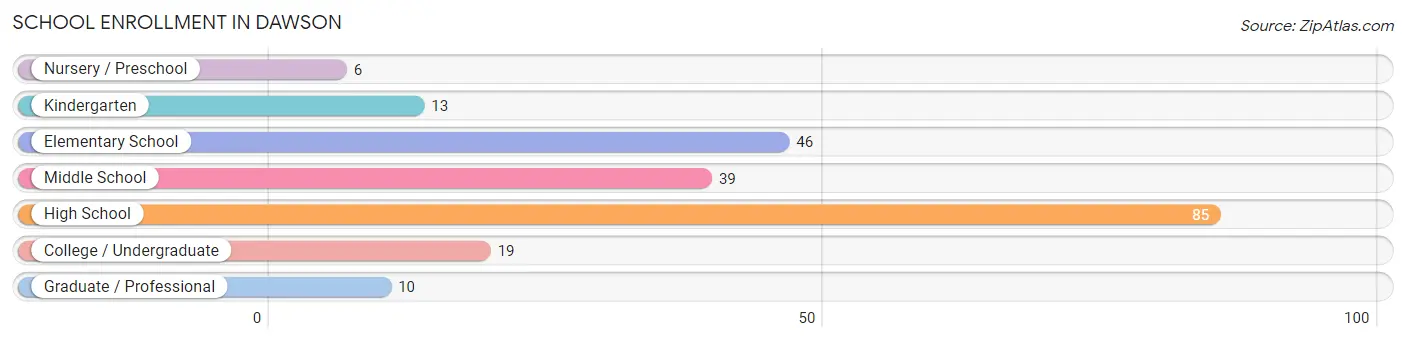
| School Level | # Students | % Students |
| Nursery / Preschool | 6 | 2.8% |
| Kindergarten | 13 | 6.0% |
| Elementary School | 46 | 21.1% |
| Middle School | 39 | 17.9% |
| High School | 85 | 39.0% |
| College / Undergraduate | 19 | 8.7% |
| Graduate / Professional | 10 | 4.6% |
| Total | 218 | 100.0% |
School Enrollment by Age by Funding Source in Dawson
Out of a total of 218 students who are enrolled in schools in Dawson, 14 (6.4%) attend a private institution, while the remaining 204 (93.6%) are enrolled in public schools. The age group of 25 to 34 year olds has the highest likelihood of being enrolled in private schools, with 5 (62.5% in the age bracket) enrolled. Conversely, the age group of 3 to 4 year olds has the lowest likelihood of being enrolled in a private school, with 4 (100.0% in the age bracket) attending a public institution.
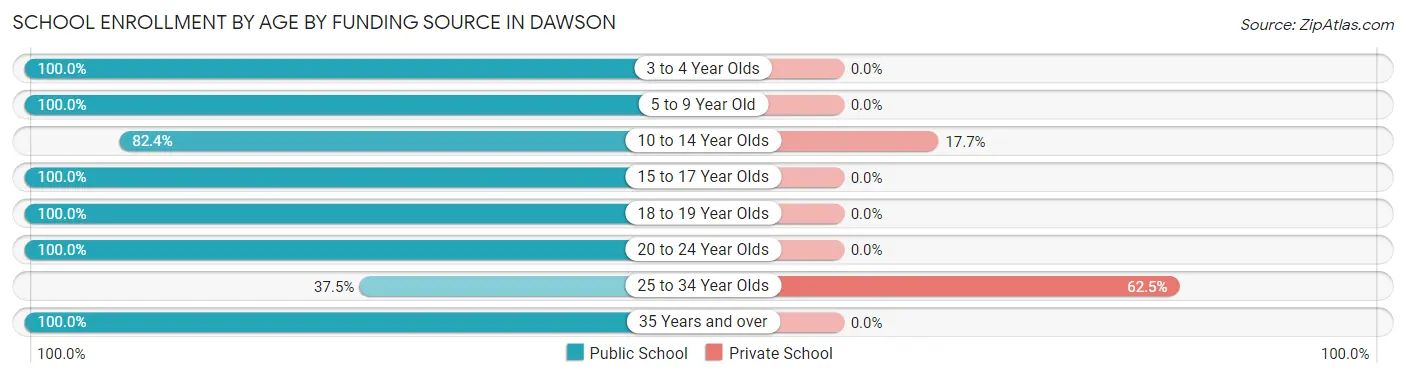
| Age Bracket | Public School | Private School |
| 3 to 4 Year Olds | 4 (100.0%) | 0 (0.0%) |
| 5 to 9 Year Old | 54 (100.0%) | 0 (0.0%) |
| 10 to 14 Year Olds | 42 (82.4%) | 9 (17.6%) |
| 15 to 17 Year Olds | 74 (100.0%) | 0 (0.0%) |
| 18 to 19 Year Olds | 6 (100.0%) | 0 (0.0%) |
| 20 to 24 Year Olds | 11 (100.0%) | 0 (0.0%) |
| 25 to 34 Year Olds | 3 (37.5%) | 5 (62.5%) |
| 35 Years and over | 10 (100.0%) | 0 (0.0%) |
| Total | 204 (93.6%) | 14 (6.4%) |
Educational Attainment by Field of Study in Dawson
Education (58 | 26.9%), business (40 | 18.5%), science & technology (36 | 16.7%), bio, nature & agricultural (29 | 13.4%), and psychology (12 | 5.6%) are the most common fields of study among 216 individuals in Dawson who have obtained a bachelor's degree or higher.
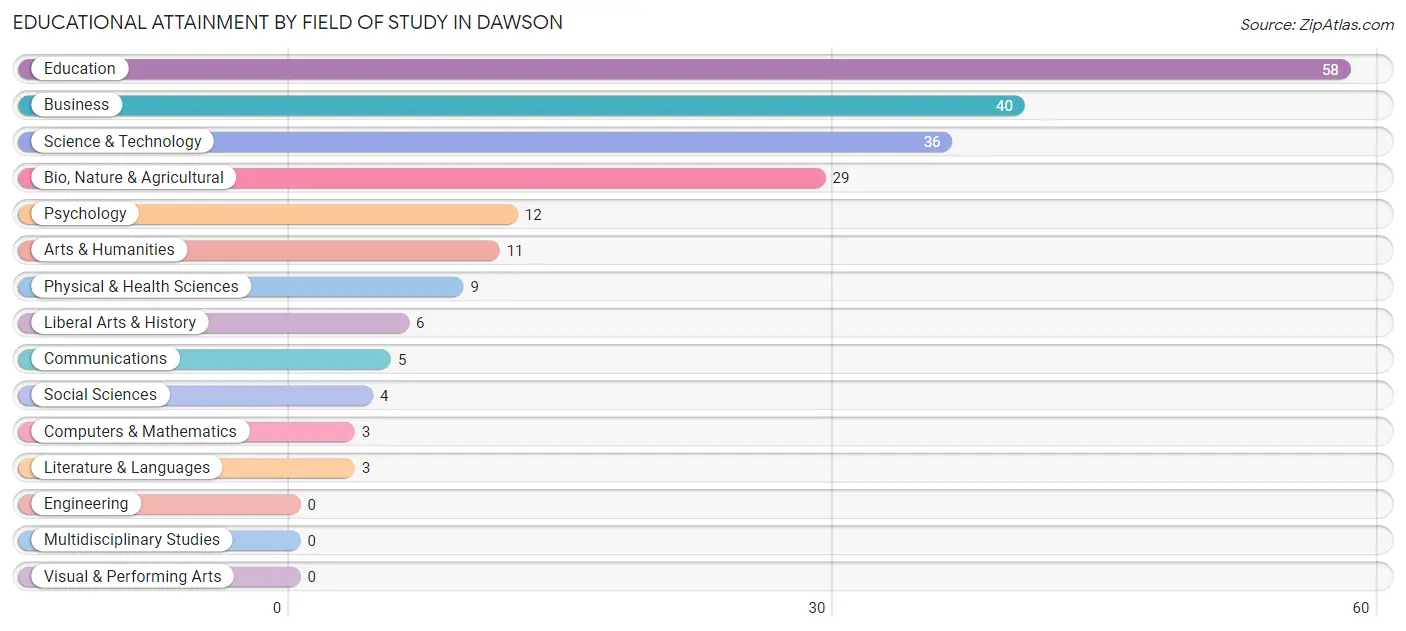
| Field of Study | # Graduates | % Graduates |
| Computers & Mathematics | 3 | 1.4% |
| Bio, Nature & Agricultural | 29 | 13.4% |
| Physical & Health Sciences | 9 | 4.2% |
| Psychology | 12 | 5.6% |
| Social Sciences | 4 | 1.8% |
| Engineering | 0 | 0.0% |
| Multidisciplinary Studies | 0 | 0.0% |
| Science & Technology | 36 | 16.7% |
| Business | 40 | 18.5% |
| Education | 58 | 26.9% |
| Literature & Languages | 3 | 1.4% |
| Liberal Arts & History | 6 | 2.8% |
| Visual & Performing Arts | 0 | 0.0% |
| Communications | 5 | 2.3% |
| Arts & Humanities | 11 | 5.1% |
| Total | 216 | 100.0% |
Transportation & Commute in Dawson
Vehicle Availability by Sex in Dawson
The most prevalent vehicle ownership categories in Dawson are males with 2 vehicles (138, accounting for 44.4%) and females with 2 vehicles (173, making up 37.8%).
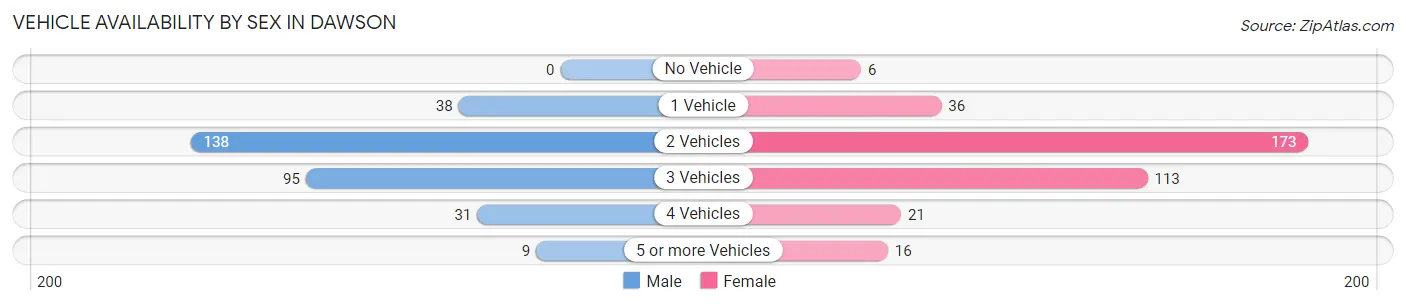
| Vehicles Available | Male | Female |
| No Vehicle | 0 (0.0%) | 6 (1.6%) |
| 1 Vehicle | 38 (12.2%) | 36 (9.9%) |
| 2 Vehicles | 138 (44.4%) | 173 (47.4%) |
| 3 Vehicles | 95 (30.5%) | 113 (31.0%) |
| 4 Vehicles | 31 (10.0%) | 21 (5.8%) |
| 5 or more Vehicles | 9 (2.9%) | 16 (4.4%) |
| Total | 311 (100.0%) | 365 (100.0%) |
Commute Time in Dawson
The most frequently occuring commute durations in Dawson are 5 to 9 minutes (222 commuters, 34.8%), less than 5 minutes (153 commuters, 24.0%), and 20 to 24 minutes (67 commuters, 10.5%).
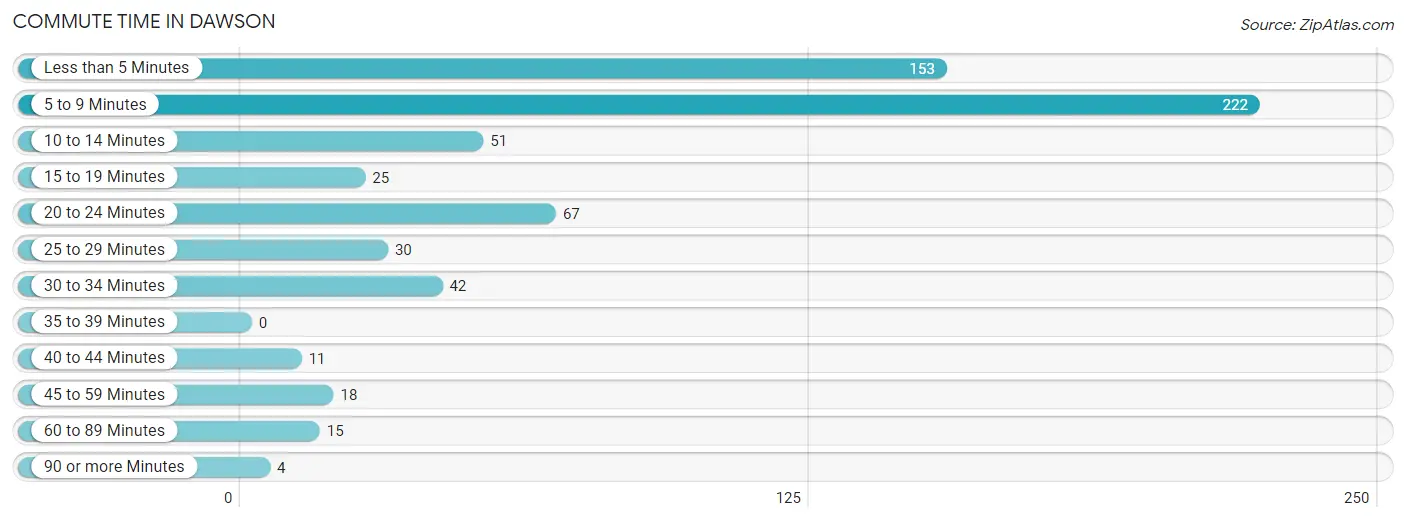
| Commute Time | # Commuters | % Commuters |
| Less than 5 Minutes | 153 | 24.0% |
| 5 to 9 Minutes | 222 | 34.8% |
| 10 to 14 Minutes | 51 | 8.0% |
| 15 to 19 Minutes | 25 | 3.9% |
| 20 to 24 Minutes | 67 | 10.5% |
| 25 to 29 Minutes | 30 | 4.7% |
| 30 to 34 Minutes | 42 | 6.6% |
| 35 to 39 Minutes | 0 | 0.0% |
| 40 to 44 Minutes | 11 | 1.7% |
| 45 to 59 Minutes | 18 | 2.8% |
| 60 to 89 Minutes | 15 | 2.4% |
| 90 or more Minutes | 4 | 0.6% |
Commute Time by Sex in Dawson
The most common commute times in Dawson are 5 to 9 minutes (108 commuters, 35.8%) for males and 5 to 9 minutes (114 commuters, 33.9%) for females.
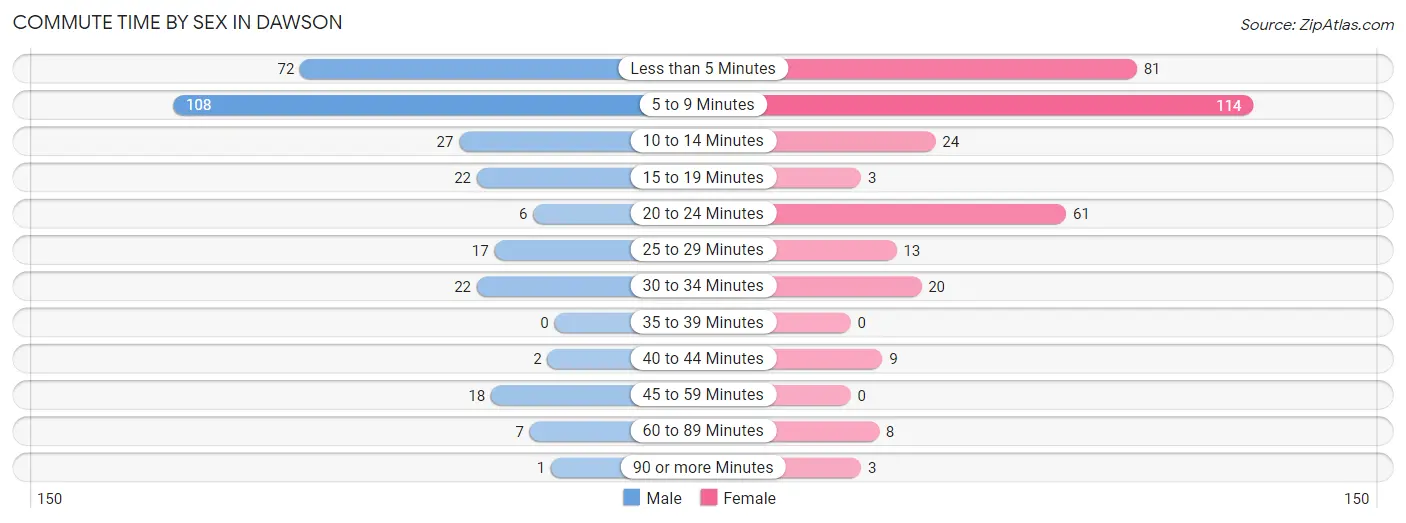
| Commute Time | Male | Female |
| Less than 5 Minutes | 72 (23.8%) | 81 (24.1%) |
| 5 to 9 Minutes | 108 (35.8%) | 114 (33.9%) |
| 10 to 14 Minutes | 27 (8.9%) | 24 (7.1%) |
| 15 to 19 Minutes | 22 (7.3%) | 3 (0.9%) |
| 20 to 24 Minutes | 6 (2.0%) | 61 (18.1%) |
| 25 to 29 Minutes | 17 (5.6%) | 13 (3.9%) |
| 30 to 34 Minutes | 22 (7.3%) | 20 (5.9%) |
| 35 to 39 Minutes | 0 (0.0%) | 0 (0.0%) |
| 40 to 44 Minutes | 2 (0.7%) | 9 (2.7%) |
| 45 to 59 Minutes | 18 (6.0%) | 0 (0.0%) |
| 60 to 89 Minutes | 7 (2.3%) | 8 (2.4%) |
| 90 or more Minutes | 1 (0.3%) | 3 (0.9%) |
Time of Departure to Work by Sex in Dawson
The most frequent times of departure to work in Dawson are 7:30 AM to 7:59 AM (65, 21.5%) for males and 7:30 AM to 7:59 AM (91, 27.1%) for females.
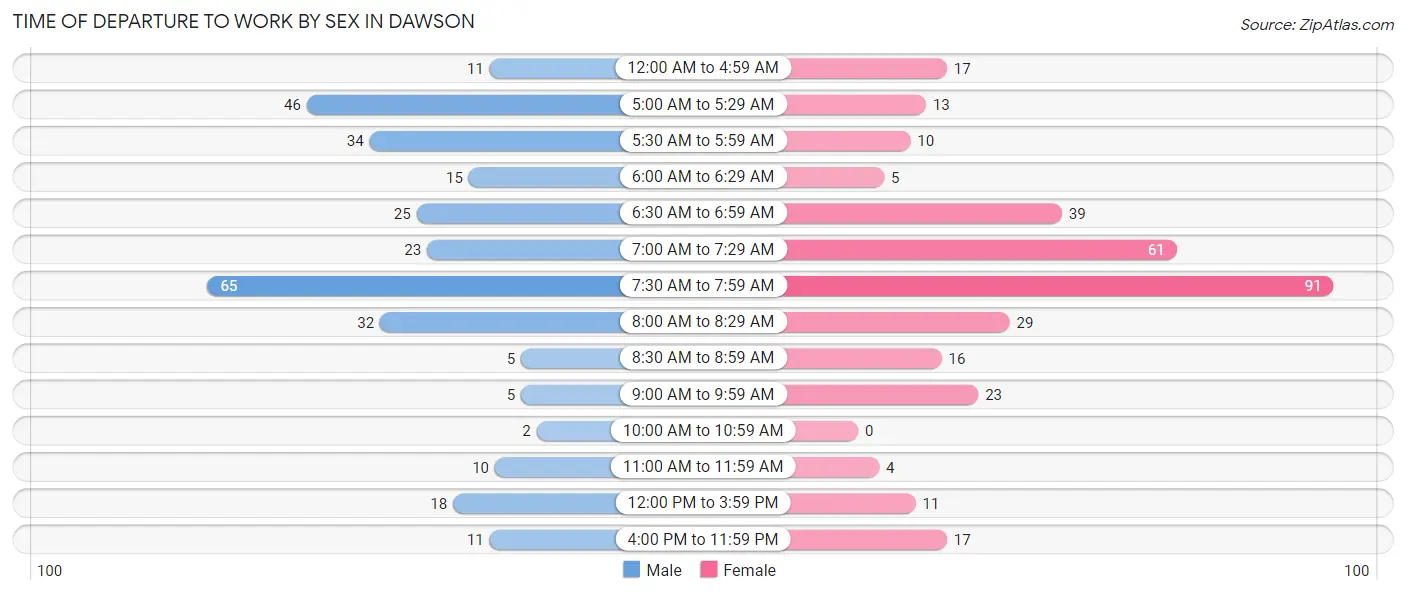
| Time of Departure | Male | Female |
| 12:00 AM to 4:59 AM | 11 (3.6%) | 17 (5.1%) |
| 5:00 AM to 5:29 AM | 46 (15.2%) | 13 (3.9%) |
| 5:30 AM to 5:59 AM | 34 (11.3%) | 10 (3.0%) |
| 6:00 AM to 6:29 AM | 15 (5.0%) | 5 (1.5%) |
| 6:30 AM to 6:59 AM | 25 (8.3%) | 39 (11.6%) |
| 7:00 AM to 7:29 AM | 23 (7.6%) | 61 (18.1%) |
| 7:30 AM to 7:59 AM | 65 (21.5%) | 91 (27.1%) |
| 8:00 AM to 8:29 AM | 32 (10.6%) | 29 (8.6%) |
| 8:30 AM to 8:59 AM | 5 (1.7%) | 16 (4.8%) |
| 9:00 AM to 9:59 AM | 5 (1.7%) | 23 (6.9%) |
| 10:00 AM to 10:59 AM | 2 (0.7%) | 0 (0.0%) |
| 11:00 AM to 11:59 AM | 10 (3.3%) | 4 (1.2%) |
| 12:00 PM to 3:59 PM | 18 (6.0%) | 11 (3.3%) |
| 4:00 PM to 11:59 PM | 11 (3.6%) | 17 (5.1%) |
| Total | 302 (100.0%) | 336 (100.0%) |
Housing Occupancy in Dawson
Occupancy by Ownership in Dawson
Of the total 581 dwellings in Dawson, owner-occupied units account for 447 (76.9%), while renter-occupied units make up 134 (23.1%).
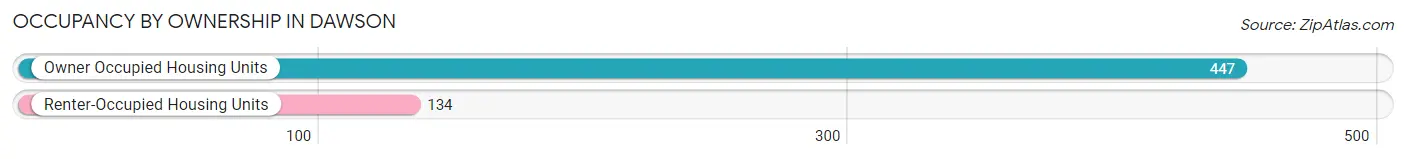
| Occupancy | # Housing Units | % Housing Units |
| Owner Occupied Housing Units | 447 | 76.9% |
| Renter-Occupied Housing Units | 134 | 23.1% |
| Total Occupied Housing Units | 581 | 100.0% |
Occupancy by Household Size in Dawson
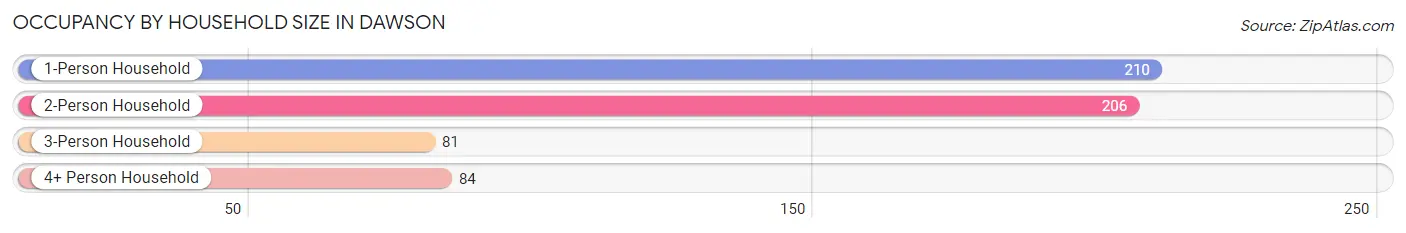
| Household Size | # Housing Units | % Housing Units |
| 1-Person Household | 210 | 36.1% |
| 2-Person Household | 206 | 35.5% |
| 3-Person Household | 81 | 13.9% |
| 4+ Person Household | 84 | 14.5% |
| Total Housing Units | 581 | 100.0% |
Occupancy by Ownership by Household Size in Dawson
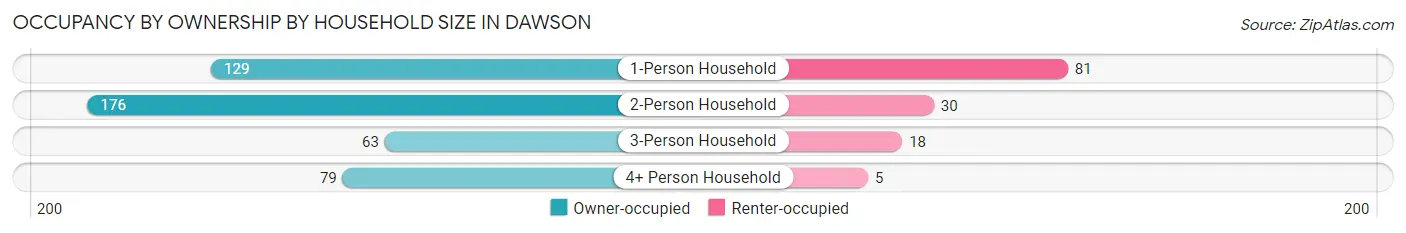
| Household Size | Owner-occupied | Renter-occupied |
| 1-Person Household | 129 (61.4%) | 81 (38.6%) |
| 2-Person Household | 176 (85.4%) | 30 (14.6%) |
| 3-Person Household | 63 (77.8%) | 18 (22.2%) |
| 4+ Person Household | 79 (94.1%) | 5 (5.9%) |
| Total Housing Units | 447 (76.9%) | 134 (23.1%) |
Occupancy by Educational Attainment in Dawson
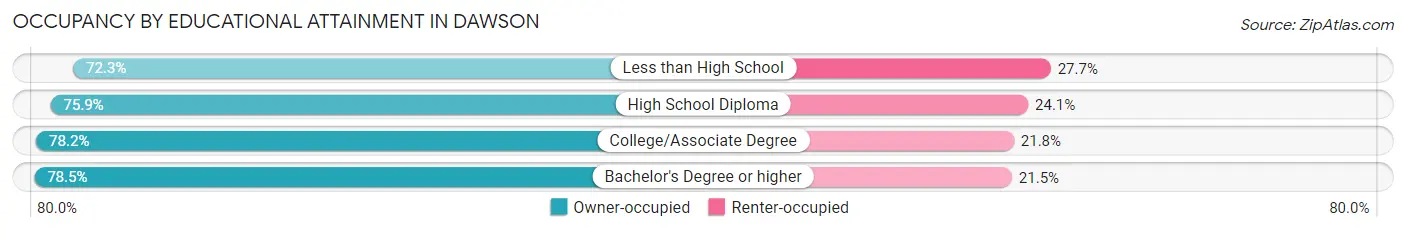
| Household Size | Owner-occupied | Renter-occupied |
| Less than High School | 47 (72.3%) | 18 (27.7%) |
| High School Diploma | 126 (75.9%) | 40 (24.1%) |
| College/Associate Degree | 161 (78.2%) | 45 (21.8%) |
| Bachelor's Degree or higher | 113 (78.5%) | 31 (21.5%) |
Occupancy by Age of Householder in Dawson
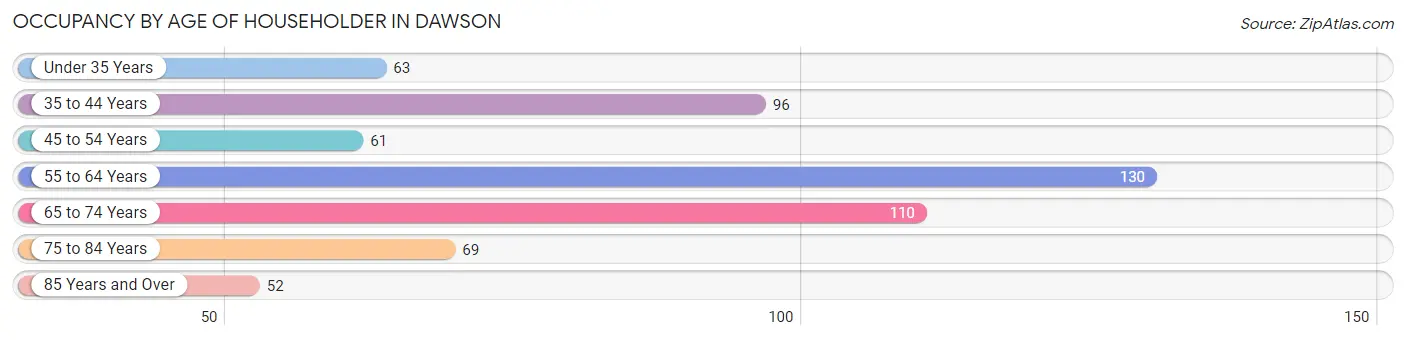
| Age Bracket | # Households | % Households |
| Under 35 Years | 63 | 10.8% |
| 35 to 44 Years | 96 | 16.5% |
| 45 to 54 Years | 61 | 10.5% |
| 55 to 64 Years | 130 | 22.4% |
| 65 to 74 Years | 110 | 18.9% |
| 75 to 84 Years | 69 | 11.9% |
| 85 Years and Over | 52 | 8.9% |
| Total | 581 | 100.0% |
Housing Finances in Dawson
Median Income by Occupancy in Dawson
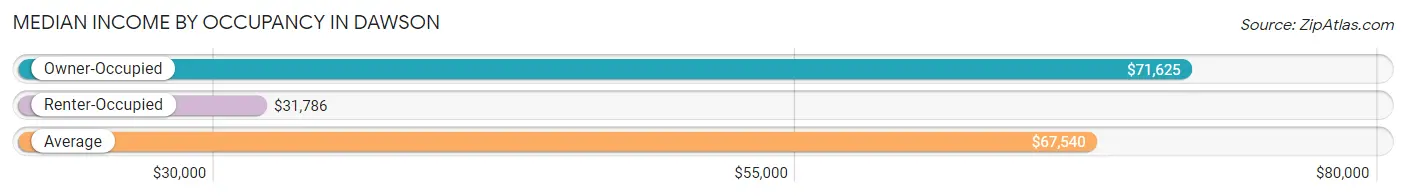
| Occupancy Type | # Households | Median Income |
| Owner-Occupied | 447 (76.9%) | $71,625 |
| Renter-Occupied | 134 (23.1%) | $31,786 |
| Average | 581 (100.0%) | $67,540 |
Occupancy by Householder Income Bracket in Dawson
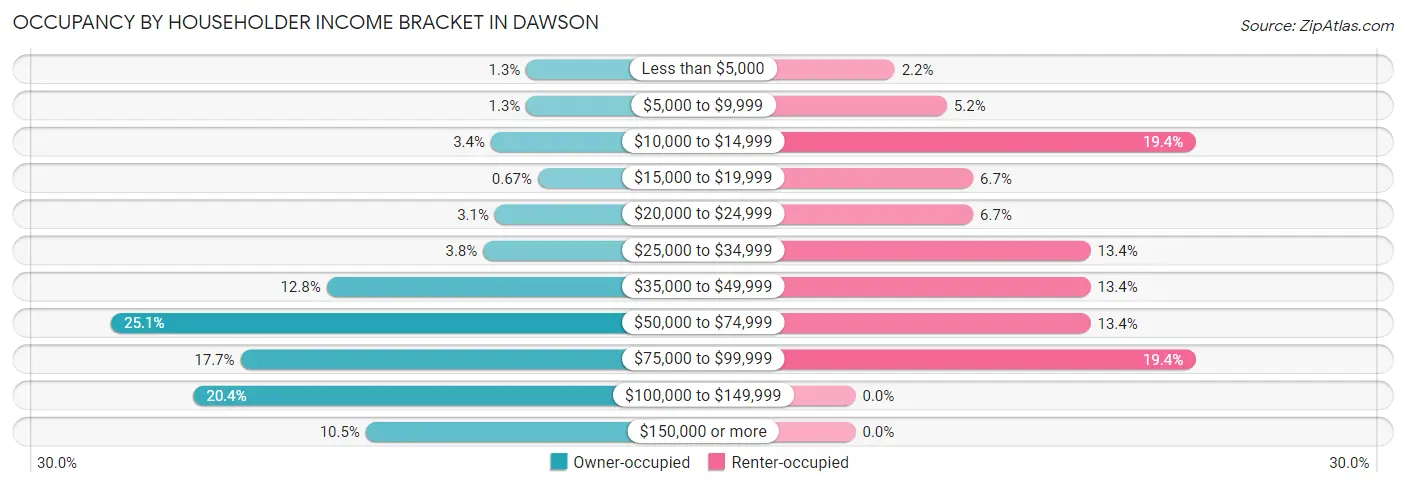
| Income Bracket | Owner-occupied | Renter-occupied |
| Less than $5,000 | 6 (1.3%) | 3 (2.2%) |
| $5,000 to $9,999 | 6 (1.3%) | 7 (5.2%) |
| $10,000 to $14,999 | 15 (3.4%) | 26 (19.4%) |
| $15,000 to $19,999 | 3 (0.7%) | 9 (6.7%) |
| $20,000 to $24,999 | 14 (3.1%) | 9 (6.7%) |
| $25,000 to $34,999 | 17 (3.8%) | 18 (13.4%) |
| $35,000 to $49,999 | 57 (12.8%) | 18 (13.4%) |
| $50,000 to $74,999 | 112 (25.1%) | 18 (13.4%) |
| $75,000 to $99,999 | 79 (17.7%) | 26 (19.4%) |
| $100,000 to $149,999 | 91 (20.4%) | 0 (0.0%) |
| $150,000 or more | 47 (10.5%) | 0 (0.0%) |
| Total | 447 (100.0%) | 134 (100.0%) |
Monthly Housing Cost Tiers in Dawson
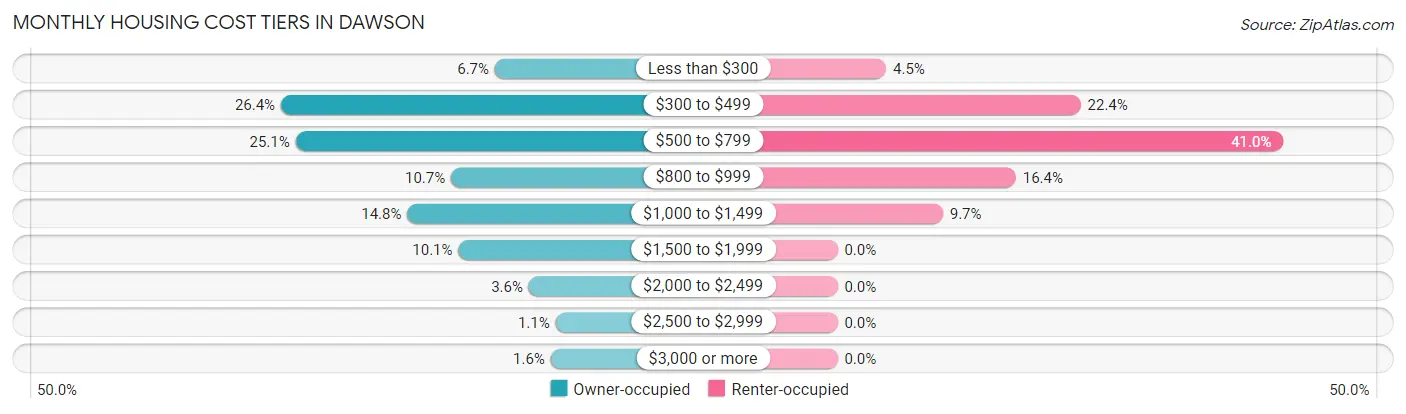
| Monthly Cost | Owner-occupied | Renter-occupied |
| Less than $300 | 30 (6.7%) | 6 (4.5%) |
| $300 to $499 | 118 (26.4%) | 30 (22.4%) |
| $500 to $799 | 112 (25.1%) | 55 (41.0%) |
| $800 to $999 | 48 (10.7%) | 22 (16.4%) |
| $1,000 to $1,499 | 66 (14.8%) | 13 (9.7%) |
| $1,500 to $1,999 | 45 (10.1%) | 0 (0.0%) |
| $2,000 to $2,499 | 16 (3.6%) | 0 (0.0%) |
| $2,500 to $2,999 | 5 (1.1%) | 0 (0.0%) |
| $3,000 or more | 7 (1.6%) | 0 (0.0%) |
| Total | 447 (100.0%) | 134 (100.0%) |
Physical Housing Characteristics in Dawson
Housing Structures in Dawson
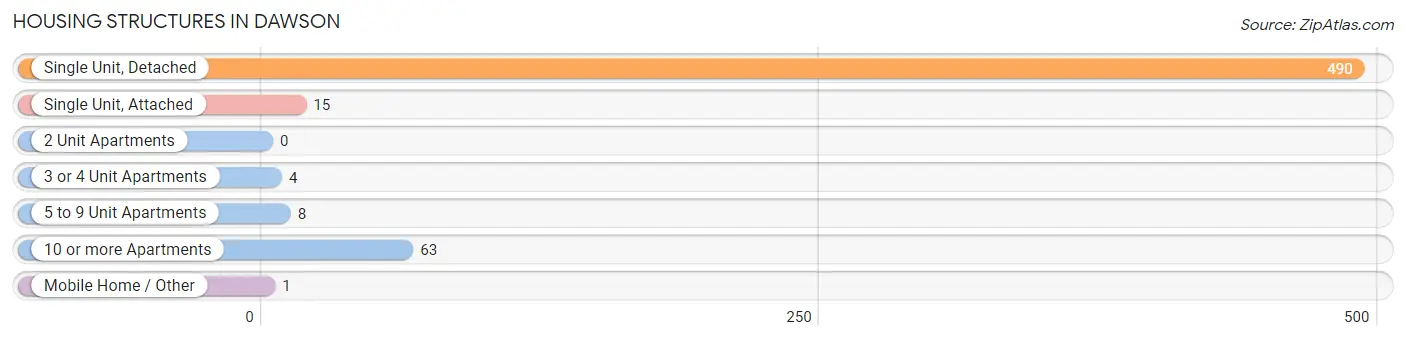
| Structure Type | # Housing Units | % Housing Units |
| Single Unit, Detached | 490 | 84.3% |
| Single Unit, Attached | 15 | 2.6% |
| 2 Unit Apartments | 0 | 0.0% |
| 3 or 4 Unit Apartments | 4 | 0.7% |
| 5 to 9 Unit Apartments | 8 | 1.4% |
| 10 or more Apartments | 63 | 10.8% |
| Mobile Home / Other | 1 | 0.2% |
| Total | 581 | 100.0% |
Housing Structures by Occupancy in Dawson
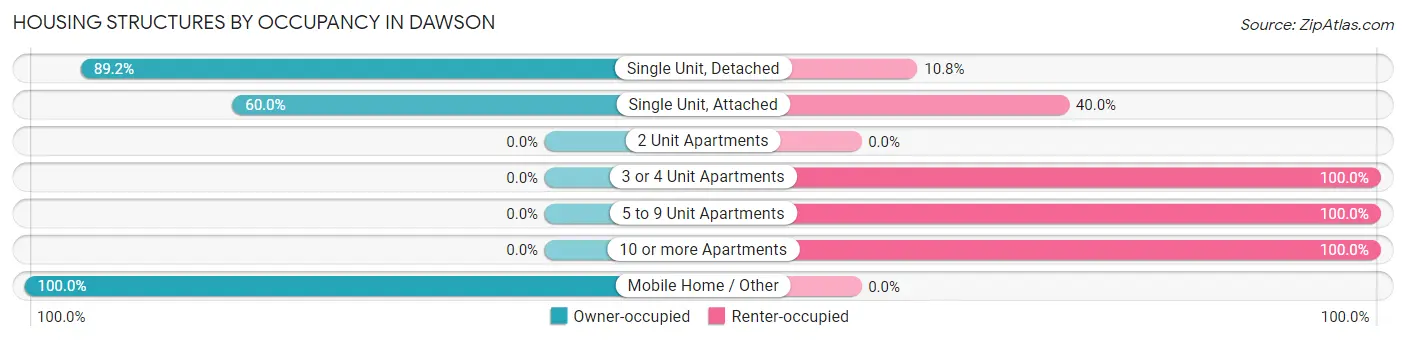
| Structure Type | Owner-occupied | Renter-occupied |
| Single Unit, Detached | 437 (89.2%) | 53 (10.8%) |
| Single Unit, Attached | 9 (60.0%) | 6 (40.0%) |
| 2 Unit Apartments | 0 (0.0%) | 0 (0.0%) |
| 3 or 4 Unit Apartments | 0 (0.0%) | 4 (100.0%) |
| 5 to 9 Unit Apartments | 0 (0.0%) | 8 (100.0%) |
| 10 or more Apartments | 0 (0.0%) | 63 (100.0%) |
| Mobile Home / Other | 1 (100.0%) | 0 (0.0%) |
| Total | 447 (76.9%) | 134 (23.1%) |
Housing Structures by Number of Rooms in Dawson
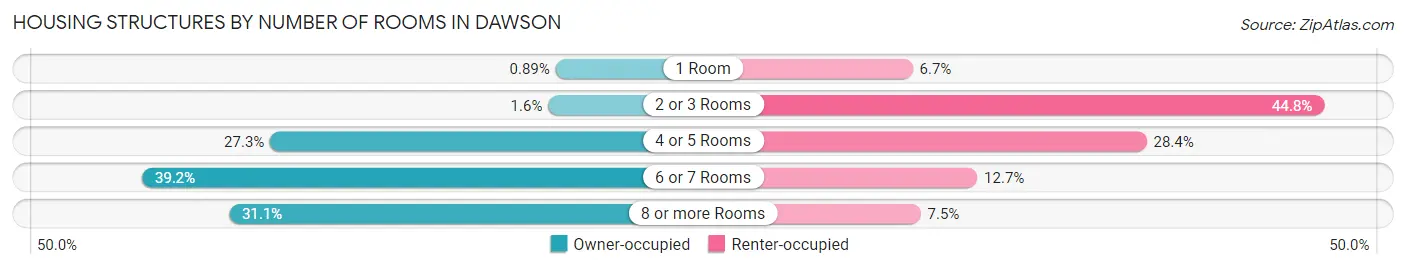
| Number of Rooms | Owner-occupied | Renter-occupied |
| 1 Room | 4 (0.9%) | 9 (6.7%) |
| 2 or 3 Rooms | 7 (1.6%) | 60 (44.8%) |
| 4 or 5 Rooms | 122 (27.3%) | 38 (28.4%) |
| 6 or 7 Rooms | 175 (39.2%) | 17 (12.7%) |
| 8 or more Rooms | 139 (31.1%) | 10 (7.5%) |
| Total | 447 (100.0%) | 134 (100.0%) |
Housing Structure by Heating Type in Dawson
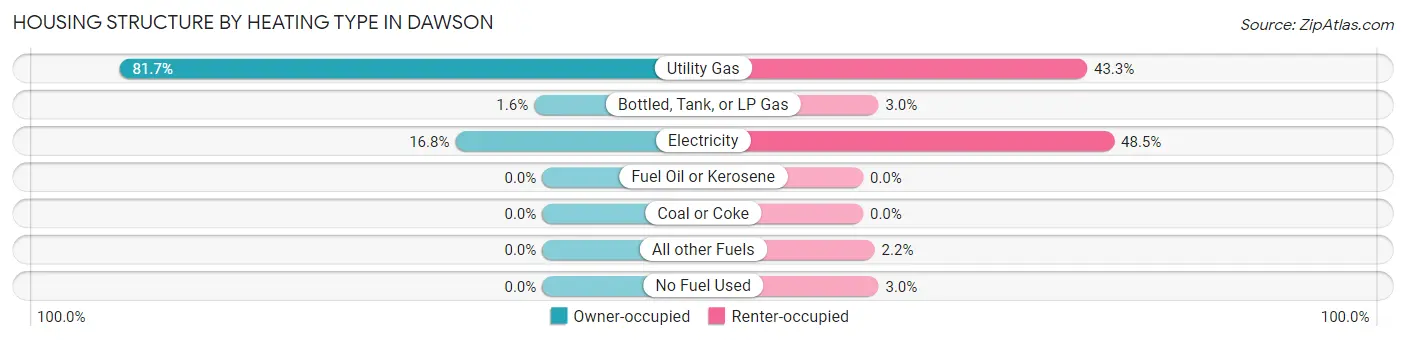
| Heating Type | Owner-occupied | Renter-occupied |
| Utility Gas | 365 (81.7%) | 58 (43.3%) |
| Bottled, Tank, or LP Gas | 7 (1.6%) | 4 (3.0%) |
| Electricity | 75 (16.8%) | 65 (48.5%) |
| Fuel Oil or Kerosene | 0 (0.0%) | 0 (0.0%) |
| Coal or Coke | 0 (0.0%) | 0 (0.0%) |
| All other Fuels | 0 (0.0%) | 3 (2.2%) |
| No Fuel Used | 0 (0.0%) | 4 (3.0%) |
| Total | 447 (100.0%) | 134 (100.0%) |
Household Vehicle Usage in Dawson
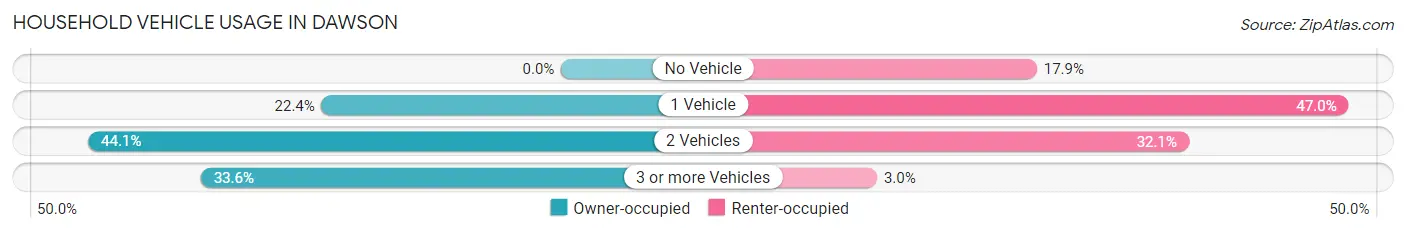
| Vehicles per Household | Owner-occupied | Renter-occupied |
| No Vehicle | 0 (0.0%) | 24 (17.9%) |
| 1 Vehicle | 100 (22.4%) | 63 (47.0%) |
| 2 Vehicles | 197 (44.1%) | 43 (32.1%) |
| 3 or more Vehicles | 150 (33.6%) | 4 (3.0%) |
| Total | 447 (100.0%) | 134 (100.0%) |
Real Estate & Mortgages in Dawson
Real Estate and Mortgage Overview in Dawson
| Characteristic | Without Mortgage | With Mortgage |
| Housing Units | 225 | 222 |
| Median Property Value | $102,000 | $132,100 |
| Median Household Income | $63,750 | $24 |
| Monthly Housing Costs | $397 | $7 |
| Real Estate Taxes | $1,346 | $11 |
Property Value by Mortgage Status in Dawson
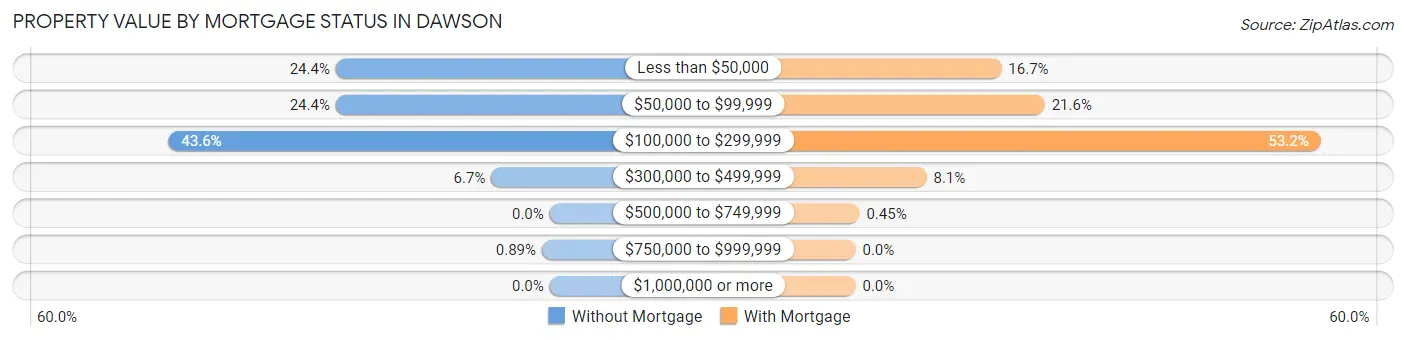
| Property Value | Without Mortgage | With Mortgage |
| Less than $50,000 | 55 (24.4%) | 37 (16.7%) |
| $50,000 to $99,999 | 55 (24.4%) | 48 (21.6%) |
| $100,000 to $299,999 | 98 (43.6%) | 118 (53.1%) |
| $300,000 to $499,999 | 15 (6.7%) | 18 (8.1%) |
| $500,000 to $749,999 | 0 (0.0%) | 1 (0.4%) |
| $750,000 to $999,999 | 2 (0.9%) | 0 (0.0%) |
| $1,000,000 or more | 0 (0.0%) | 0 (0.0%) |
| Total | 225 (100.0%) | 222 (100.0%) |
Household Income by Mortgage Status in Dawson
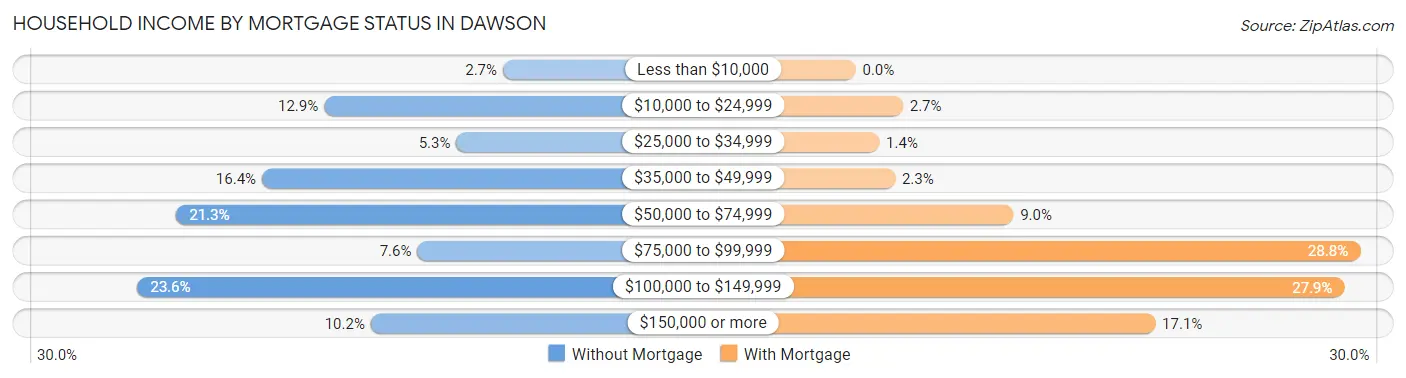
| Household Income | Without Mortgage | With Mortgage |
| Less than $10,000 | 6 (2.7%) | 0 (0.0%) |
| $10,000 to $24,999 | 29 (12.9%) | 6 (2.7%) |
| $25,000 to $34,999 | 12 (5.3%) | 3 (1.3%) |
| $35,000 to $49,999 | 37 (16.4%) | 5 (2.2%) |
| $50,000 to $74,999 | 48 (21.3%) | 20 (9.0%) |
| $75,000 to $99,999 | 17 (7.6%) | 64 (28.8%) |
| $100,000 to $149,999 | 53 (23.6%) | 62 (27.9%) |
| $150,000 or more | 23 (10.2%) | 38 (17.1%) |
| Total | 225 (100.0%) | 222 (100.0%) |
Property Value to Household Income Ratio in Dawson
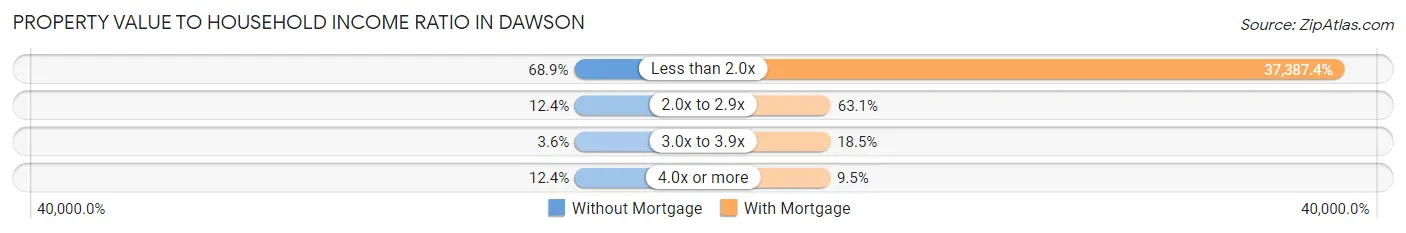
| Value-to-Income Ratio | Without Mortgage | With Mortgage |
| Less than 2.0x | 155 (68.9%) | 83,000 (37,387.4%) |
| 2.0x to 2.9x | 28 (12.4%) | 140 (63.1%) |
| 3.0x to 3.9x | 8 (3.6%) | 41 (18.5%) |
| 4.0x or more | 28 (12.4%) | 21 (9.5%) |
| Total | 225 (100.0%) | 222 (100.0%) |
Real Estate Taxes by Mortgage Status in Dawson
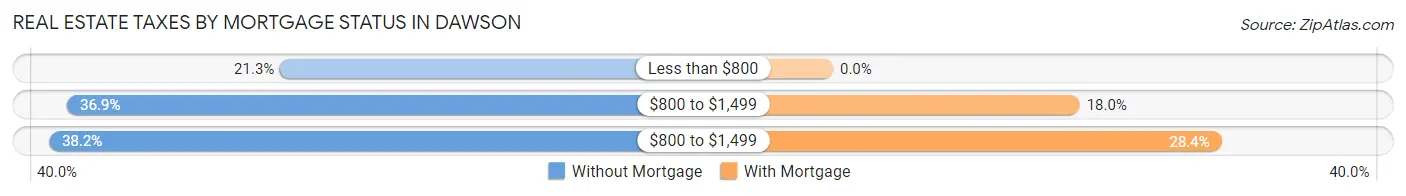
| Property Taxes | Without Mortgage | With Mortgage |
| Less than $800 | 48 (21.3%) | 0 (0.0%) |
| $800 to $1,499 | 83 (36.9%) | 40 (18.0%) |
| $800 to $1,499 | 86 (38.2%) | 63 (28.4%) |
| Total | 225 (100.0%) | 222 (100.0%) |
Health & Disability in Dawson
Health Insurance Coverage by Age in Dawson
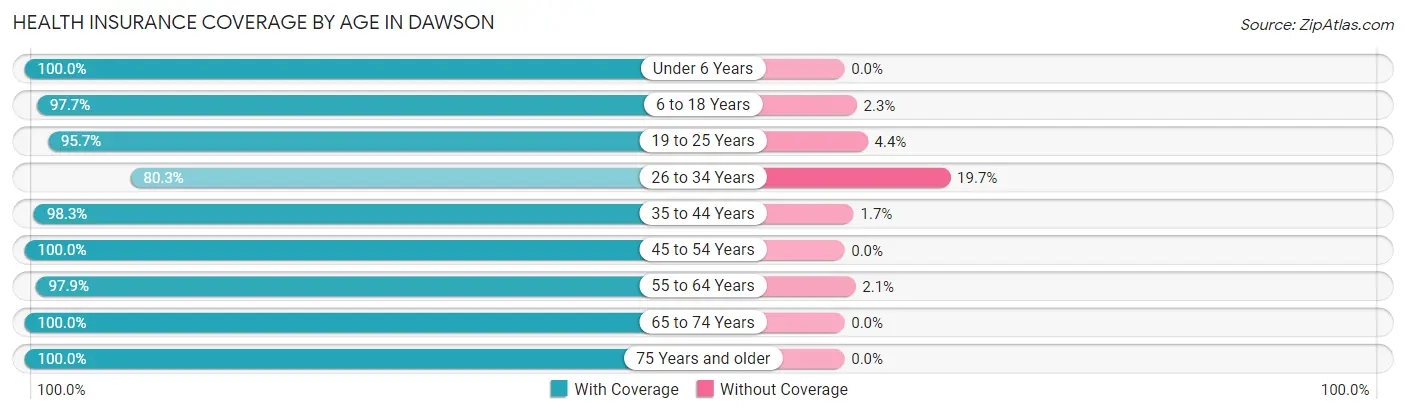
| Age Bracket | With Coverage | Without Coverage |
| Under 6 Years | 57 (100.0%) | 0 (0.0%) |
| 6 to 18 Years | 213 (97.7%) | 5 (2.3%) |
| 19 to 25 Years | 132 (95.7%) | 6 (4.3%) |
| 26 to 34 Years | 61 (80.3%) | 15 (19.7%) |
| 35 to 44 Years | 169 (98.3%) | 3 (1.7%) |
| 45 to 54 Years | 111 (100.0%) | 0 (0.0%) |
| 55 to 64 Years | 190 (97.9%) | 4 (2.1%) |
| 65 to 74 Years | 187 (100.0%) | 0 (0.0%) |
| 75 Years and older | 149 (100.0%) | 0 (0.0%) |
| Total | 1,269 (97.5%) | 33 (2.5%) |
Health Insurance Coverage by Citizenship Status in Dawson
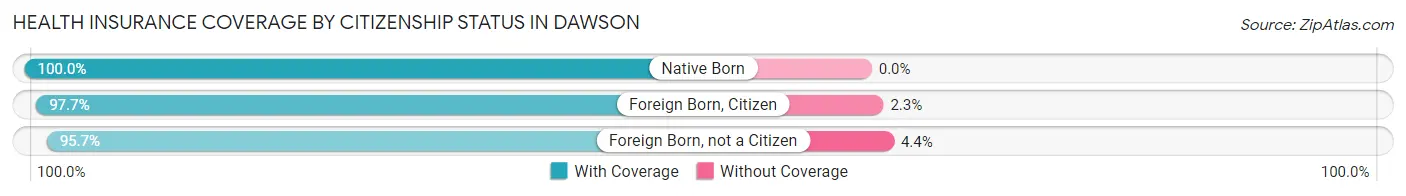
| Citizenship Status | With Coverage | Without Coverage |
| Native Born | 57 (100.0%) | 0 (0.0%) |
| Foreign Born, Citizen | 213 (97.7%) | 5 (2.3%) |
| Foreign Born, not a Citizen | 132 (95.7%) | 6 (4.3%) |
Health Insurance Coverage by Household Income in Dawson
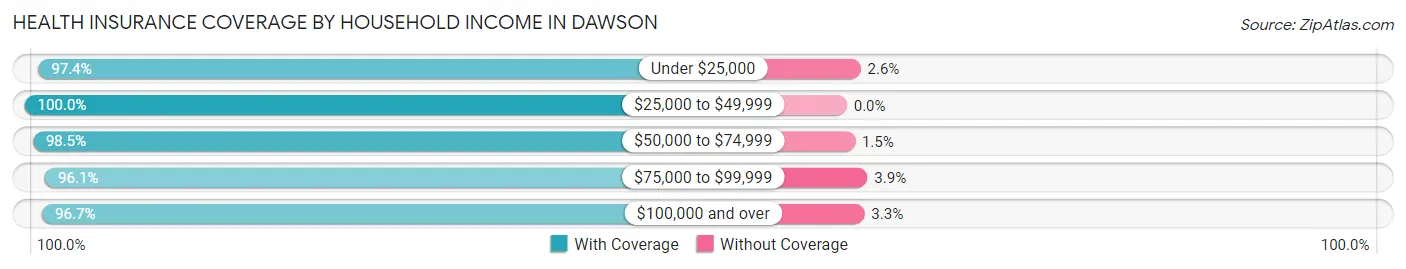
| Household Income | With Coverage | Without Coverage |
| Under $25,000 | 113 (97.4%) | 3 (2.6%) |
| $25,000 to $49,999 | 179 (100.0%) | 0 (0.0%) |
| $50,000 to $74,999 | 258 (98.5%) | 4 (1.5%) |
| $75,000 to $99,999 | 274 (96.1%) | 11 (3.9%) |
| $100,000 and over | 439 (96.7%) | 15 (3.3%) |
Public vs Private Health Insurance Coverage by Age in Dawson
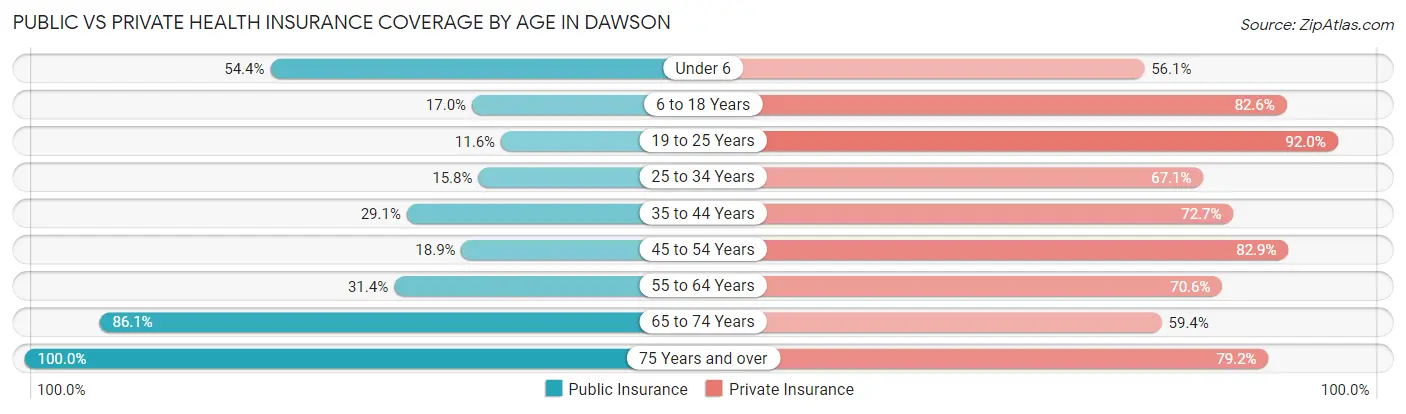
| Age Bracket | Public Insurance | Private Insurance |
| Under 6 | 31 (54.4%) | 32 (56.1%) |
| 6 to 18 Years | 37 (17.0%) | 180 (82.6%) |
| 19 to 25 Years | 16 (11.6%) | 127 (92.0%) |
| 25 to 34 Years | 12 (15.8%) | 51 (67.1%) |
| 35 to 44 Years | 50 (29.1%) | 125 (72.7%) |
| 45 to 54 Years | 21 (18.9%) | 92 (82.9%) |
| 55 to 64 Years | 61 (31.4%) | 137 (70.6%) |
| 65 to 74 Years | 161 (86.1%) | 111 (59.4%) |
| 75 Years and over | 149 (100.0%) | 118 (79.2%) |
| Total | 538 (41.3%) | 973 (74.7%) |
Disability Status by Sex by Age in Dawson
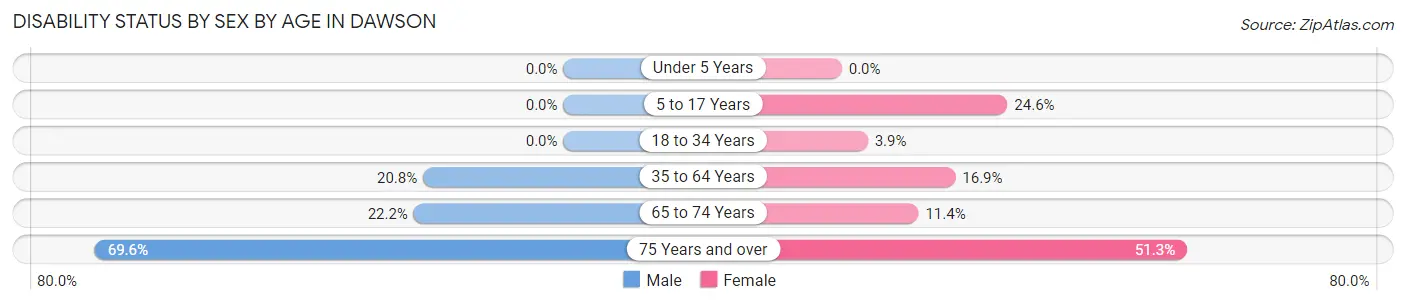
| Age Bracket | Male | Female |
| Under 5 Years | 0 (0.0%) | 0 (0.0%) |
| 5 to 17 Years | 0 (0.0%) | 15 (24.6%) |
| 18 to 34 Years | 0 (0.0%) | 5 (3.8%) |
| 35 to 64 Years | 45 (20.8%) | 44 (16.9%) |
| 65 to 74 Years | 24 (22.2%) | 9 (11.4%) |
| 75 Years and over | 48 (69.6%) | 41 (51.2%) |
Disability Class by Sex by Age in Dawson
Disability Class: Hearing Difficulty
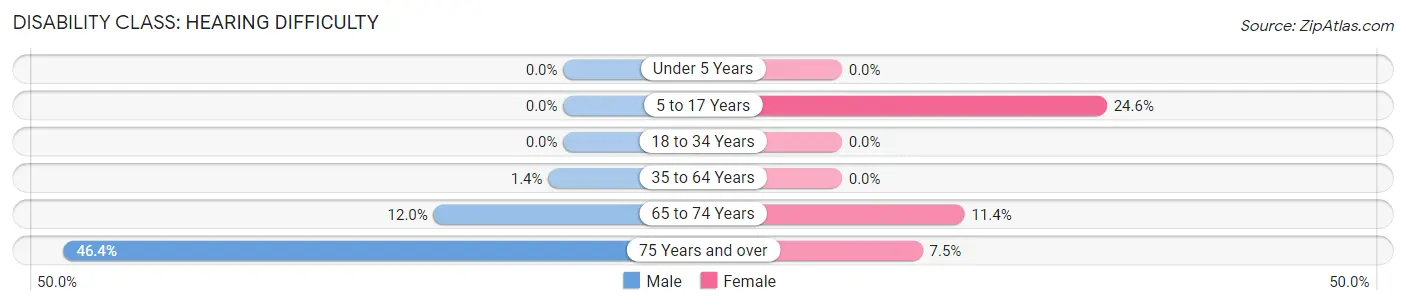
| Age Bracket | Male | Female |
| Under 5 Years | 0 (0.0%) | 0 (0.0%) |
| 5 to 17 Years | 0 (0.0%) | 15 (24.6%) |
| 18 to 34 Years | 0 (0.0%) | 0 (0.0%) |
| 35 to 64 Years | 3 (1.4%) | 0 (0.0%) |
| 65 to 74 Years | 13 (12.0%) | 9 (11.4%) |
| 75 Years and over | 32 (46.4%) | 6 (7.5%) |
Disability Class: Vision Difficulty
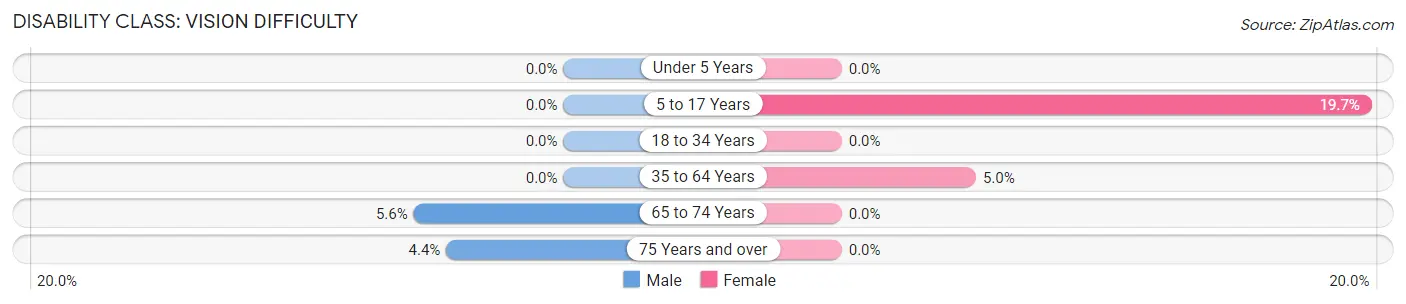
| Age Bracket | Male | Female |
| Under 5 Years | 0 (0.0%) | 0 (0.0%) |
| 5 to 17 Years | 0 (0.0%) | 12 (19.7%) |
| 18 to 34 Years | 0 (0.0%) | 0 (0.0%) |
| 35 to 64 Years | 0 (0.0%) | 13 (5.0%) |
| 65 to 74 Years | 6 (5.6%) | 0 (0.0%) |
| 75 Years and over | 3 (4.3%) | 0 (0.0%) |
Disability Class: Cognitive Difficulty
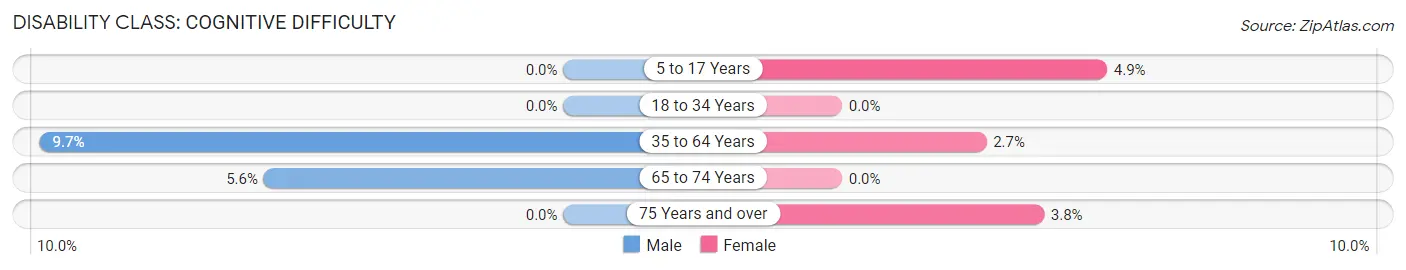
| Age Bracket | Male | Female |
| 5 to 17 Years | 0 (0.0%) | 3 (4.9%) |
| 18 to 34 Years | 0 (0.0%) | 0 (0.0%) |
| 35 to 64 Years | 21 (9.7%) | 7 (2.7%) |
| 65 to 74 Years | 6 (5.6%) | 0 (0.0%) |
| 75 Years and over | 0 (0.0%) | 3 (3.7%) |
Disability Class: Ambulatory Difficulty
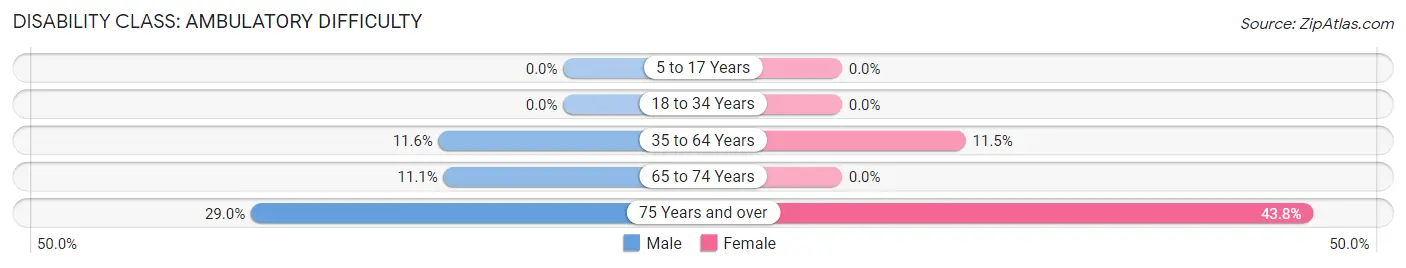
| Age Bracket | Male | Female |
| 5 to 17 Years | 0 (0.0%) | 0 (0.0%) |
| 18 to 34 Years | 0 (0.0%) | 0 (0.0%) |
| 35 to 64 Years | 25 (11.6%) | 30 (11.5%) |
| 65 to 74 Years | 12 (11.1%) | 0 (0.0%) |
| 75 Years and over | 20 (29.0%) | 35 (43.8%) |
Disability Class: Self-Care Difficulty
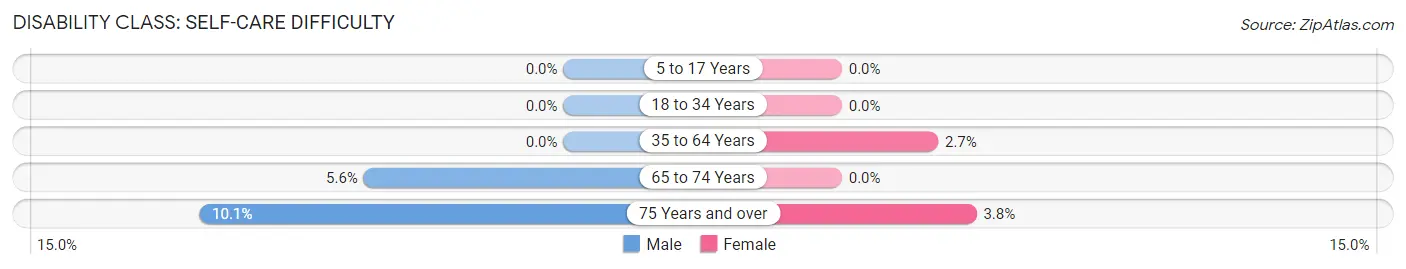
| Age Bracket | Male | Female |
| 5 to 17 Years | 0 (0.0%) | 0 (0.0%) |
| 18 to 34 Years | 0 (0.0%) | 0 (0.0%) |
| 35 to 64 Years | 0 (0.0%) | 7 (2.7%) |
| 65 to 74 Years | 6 (5.6%) | 0 (0.0%) |
| 75 Years and over | 7 (10.1%) | 3 (3.7%) |
Technology Access in Dawson
Computing Device Access in Dawson
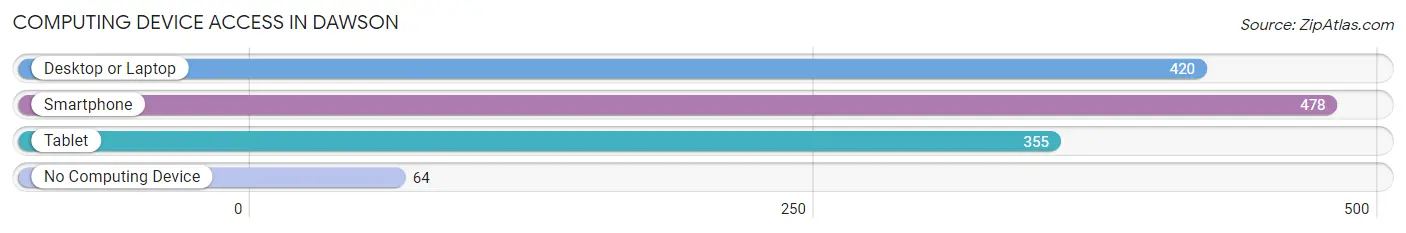
| Device Type | # Households | % Households |
| Desktop or Laptop | 420 | 72.3% |
| Smartphone | 478 | 82.3% |
| Tablet | 355 | 61.1% |
| No Computing Device | 64 | 11.0% |
| Total | 581 | 100.0% |
Internet Access in Dawson
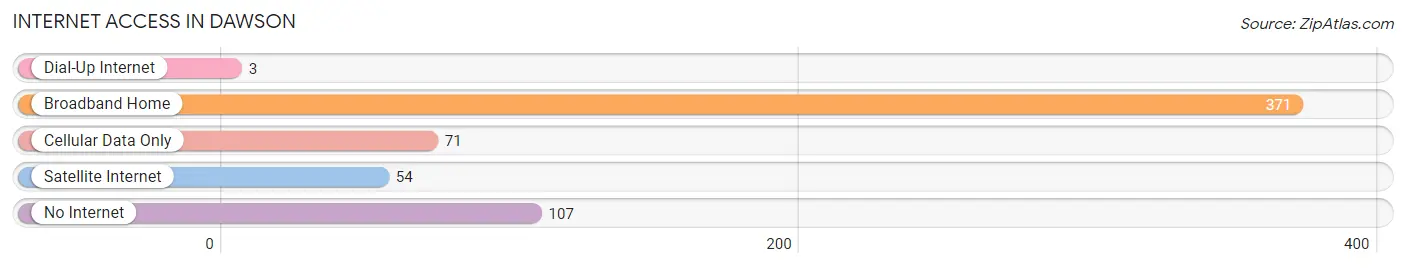
| Internet Type | # Households | % Households |
| Dial-Up Internet | 3 | 0.5% |
| Broadband Home | 371 | 63.9% |
| Cellular Data Only | 71 | 12.2% |
| Satellite Internet | 54 | 9.3% |
| No Internet | 107 | 18.4% |
| Total | 581 | 100.0% |
Dawson Summary
Dawson, Minnesota is a small city located in Lac qui Parle County in the western part of the state. It is situated on the banks of the Lac qui Parle River, and is home to a population of 1,845 people as of the 2010 census. The city was founded in 1881 and was named after the first settler, William Dawson.
History
The area that is now Dawson was first settled in 1881 by William Dawson, who had come to the area from Wisconsin. He was soon joined by other settlers, and the town was officially incorporated in 1883. The town was originally called “Dawson’s Landing”, but the name was changed to “Dawson” in 1885.
The city was built on the banks of the Lac qui Parle River, and the river was an important part of the city’s early development. The river provided a source of transportation for goods and people, and it was also used for fishing and recreation. The river was also used to power the city’s first sawmill, which was built in 1883.
The city grew steadily throughout the late 19th and early 20th centuries, and by the 1920s it had become a thriving agricultural center. The city was also home to several businesses, including a flour mill, a creamery, a brickyard, and a furniture factory.
Geography
Dawson is located in western Minnesota, in Lac qui Parle County. It is situated on the banks of the Lac qui Parle River, and is about 25 miles west of the city of Madison. The city covers an area of 1.2 square miles, and has a population density of 1,541 people per square mile.
The city is located in a mostly flat area, with some rolling hills in the surrounding area. The climate is typical of the Midwest, with cold winters and hot, humid summers. The average annual temperature is around 45 degrees Fahrenheit, and the average annual precipitation is around 28 inches.
Economy
Dawson’s economy is largely based on agriculture. The city is home to several large farms, and the surrounding area is known for its production of corn, soybeans, and other crops. The city is also home to several businesses, including a flour mill, a creamery, a brickyard, and a furniture factory.
The city is also home to several small businesses, including restaurants, retail stores, and service providers. The city is also home to a branch of the Lac qui Parle County Library, and a branch of the Lac qui Parle County Historical Society.
Demographics
As of the 2010 census, the population of Dawson was 1,845 people. The racial makeup of the city was 97.3% White, 0.7% African American, 0.3% Native American, 0.2% Asian, 0.1% Pacific Islander, 0.3% from other races, and 1.2% from two or more races. Hispanic or Latino of any race were 1.2% of the population.
The median household income in Dawson was $41,250, and the median family income was $48,750. The per capita income was $19,945. About 11.2% of families and 14.2% of the population were below the poverty line, including 18.2% of those under age 18 and 8.3% of those age 65 or over.
Common Questions
What is Per Capita Income in Dawson?
Per Capita income in Dawson is $35,982.
What is the Median Family Income in Dawson?
Median Family Income in Dawson is $86,290.
What is the Median Household income in Dawson?
Median Household Income in Dawson is $67,540.
What is Income or Wage Gap in Dawson?
Income or Wage Gap in Dawson is 35.7%.
Women in Dawson earn 64.3 cents for every dollar earned by a man.
What is Inequality or Gini Index in Dawson?
Inequality or Gini Index in Dawson is 0.43.
What is the Total Population of Dawson?
Total Population of Dawson is 1,369.
What is the Total Male Population of Dawson?
Total Male Population of Dawson is 702.
What is the Total Female Population of Dawson?
Total Female Population of Dawson is 667.
What is the Ratio of Males per 100 Females in Dawson?
There are 105.25 Males per 100 Females in Dawson.
What is the Ratio of Females per 100 Males in Dawson?
There are 95.01 Females per 100 Males in Dawson.
What is the Median Population Age in Dawson?
Median Population Age in Dawson is 45.9 Years.
What is the Average Family Size in Dawson
Average Family Size in Dawson is 2.8 People.
What is the Average Household Size in Dawson
Average Household Size in Dawson is 2.2 People.
How Large is the Labor Force in Dawson?
There are 717 People in the Labor Forcein in Dawson.
What is the Percentage of People in the Labor Force in Dawson?
61.2% of People are in the Labor Force in Dawson.
What is the Unemployment Rate in Dawson?
Unemployment Rate in Dawson is 4.6%.