Zip Codes with the Highest Percentage of Population Employed in Accommodation & Food Services in Minneapolis, MN
RELATED REPORTS & OPTIONS
Accommodation & Food Services
Minneapolis
Compare Zip Codes
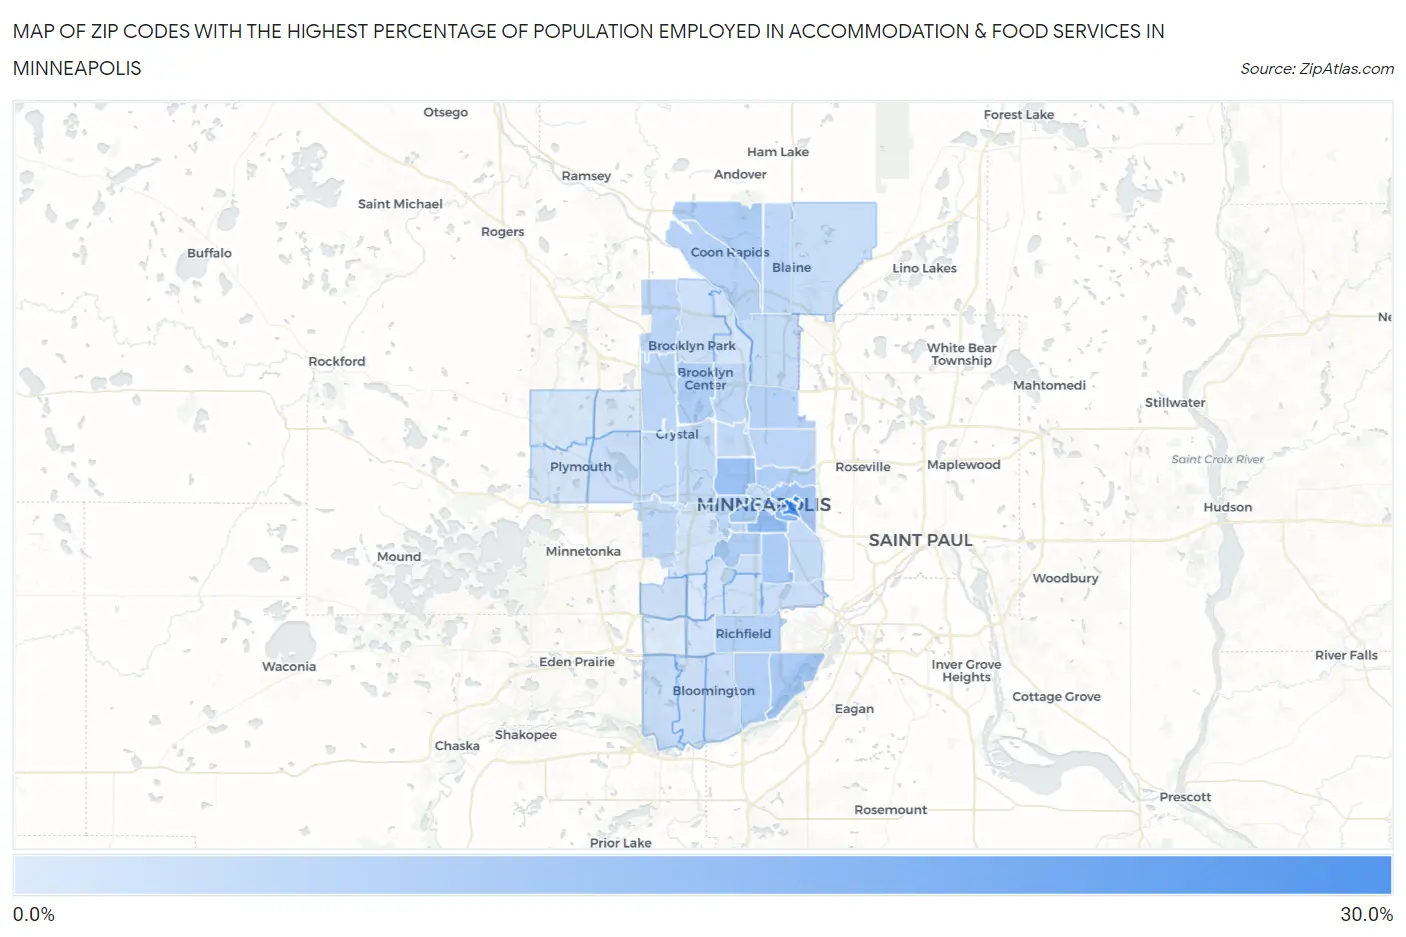
Map of Zip Codes with the Highest Percentage of Population Employed in Accommodation & Food Services in Minneapolis
1.5%
26.4%

Zip Codes with the Highest Percentage of Population Employed in Accommodation & Food Services in Minneapolis, MN
| Zip Code | % Employed | vs State | vs National | |
| 1. | 55455 | 26.4% | 5.5%(+20.9)#4 | 6.9%(+19.5)#444 |
| 2. | 55454 | 13.7% | 5.5%(+8.19)#16 | 6.9%(+6.82)#2,052 |
| 3. | 55404 | 13.3% | 5.5%(+7.76)#18 | 6.9%(+6.40)#2,234 |
| 4. | 55411 | 11.5% | 5.5%(+5.99)#29 | 6.9%(+4.63)#3,153 |
| 5. | 55414 | 10.3% | 5.5%(+4.75)#47 | 6.9%(+3.38)#4,234 |
| 6. | 55403 | 9.7% | 5.5%(+4.22)#57 | 6.9%(+2.86)#4,882 |
| 7. | 55425 | 9.3% | 5.5%(+3.74)#70 | 6.9%(+2.38)#5,563 |
| 8. | 55407 | 9.0% | 5.5%(+3.47)#79 | 6.9%(+2.10)#5,986 |
| 9. | 55408 | 8.4% | 5.5%(+2.88)#97 | 6.9%(+1.51)#7,012 |
| 10. | 55429 | 8.4% | 5.5%(+2.85)#99 | 6.9%(+1.48)#7,064 |
| 11. | 55413 | 8.2% | 5.5%(+2.71)#104 | 6.9%(+1.34)#7,369 |
| 12. | 55448 | 8.1% | 5.5%(+2.58)#110 | 6.9%(+1.21)#7,632 |
| 13. | 55420 | 7.8% | 5.5%(+2.28)#118 | 6.9%(+0.913)#8,272 |
| 14. | 55421 | 7.7% | 5.5%(+2.16)#127 | 6.9%(+0.794)#8,568 |
| 15. | 55423 | 7.5% | 5.5%(+2.00)#135 | 6.9%(+0.637)#8,952 |
| 16. | 55433 | 7.2% | 5.5%(+1.67)#147 | 6.9%(+0.305)#9,845 |
| 17. | 55418 | 6.6% | 5.5%(+1.06)#185 | 6.9%(-0.310)#11,609 |
| 18. | 55428 | 6.4% | 5.5%(+0.838)#201 | 6.9%(-0.527)#12,317 |
| 19. | 55445 | 6.3% | 5.5%(+0.806)#206 | 6.9%(-0.560)#12,413 |
| 20. | 55434 | 6.2% | 5.5%(+0.689)#213 | 6.9%(-0.677)#12,783 |
| 21. | 55405 | 6.1% | 5.5%(+0.576)#229 | 6.9%(-0.789)#13,164 |
| 22. | 55402 | 6.0% | 5.5%(+0.495)#236 | 6.9%(-0.870)#13,408 |
| 23. | 55430 | 6.0% | 5.5%(+0.453)#238 | 6.9%(-0.913)#13,548 |
| 24. | 55412 | 5.7% | 5.5%(+0.215)#260 | 6.9%(-1.15)#14,278 |
| 25. | 55426 | 5.7% | 5.5%(+0.202)#262 | 6.9%(-1.16)#14,325 |
| 26. | 55422 | 5.4% | 5.5%(-0.156)#303 | 6.9%(-1.52)#15,543 |
| 27. | 55427 | 5.3% | 5.5%(-0.255)#313 | 6.9%(-1.62)#15,924 |
| 28. | 55406 | 5.2% | 5.5%(-0.321)#323 | 6.9%(-1.69)#16,126 |
| 29. | 55432 | 5.0% | 5.5%(-0.539)#344 | 6.9%(-1.90)#16,910 |
| 30. | 55438 | 4.6% | 5.5%(-0.892)#389 | 6.9%(-2.26)#18,093 |
| 31. | 55409 | 4.6% | 5.5%(-0.961)#396 | 6.9%(-2.33)#18,312 |
| 32. | 55449 | 4.5% | 5.5%(-1.01)#401 | 6.9%(-2.38)#18,494 |
| 33. | 55441 | 4.3% | 5.5%(-1.20)#424 | 6.9%(-2.56)#19,113 |
| 34. | 55431 | 4.3% | 5.5%(-1.22)#429 | 6.9%(-2.59)#19,219 |
| 35. | 55417 | 4.2% | 5.5%(-1.33)#439 | 6.9%(-2.70)#19,556 |
| 36. | 55436 | 4.0% | 5.5%(-1.49)#460 | 6.9%(-2.86)#20,095 |
| 37. | 55401 | 4.0% | 5.5%(-1.55)#464 | 6.9%(-2.91)#20,254 |
| 38. | 55437 | 3.8% | 5.5%(-1.71)#491 | 6.9%(-3.08)#20,795 |
| 39. | 55443 | 3.7% | 5.5%(-1.77)#500 | 6.9%(-3.14)#20,968 |
| 40. | 55419 | 3.5% | 5.5%(-2.05)#553 | 6.9%(-3.42)#21,899 |
| 41. | 55410 | 3.2% | 5.5%(-2.34)#601 | 6.9%(-3.71)#22,770 |
| 42. | 55435 | 3.1% | 5.5%(-2.37)#608 | 6.9%(-3.74)#22,856 |
| 43. | 55444 | 3.1% | 5.5%(-2.45)#614 | 6.9%(-3.82)#23,038 |
| 44. | 55416 | 2.8% | 5.5%(-2.75)#648 | 6.9%(-4.12)#23,856 |
| 45. | 55446 | 2.6% | 5.5%(-2.88)#662 | 6.9%(-4.25)#24,165 |
| 46. | 55447 | 2.5% | 5.5%(-2.97)#677 | 6.9%(-4.34)#24,383 |
| 47. | 55442 | 2.3% | 5.5%(-3.17)#704 | 6.9%(-4.54)#24,851 |
| 48. | 55415 | 2.2% | 5.5%(-3.30)#715 | 6.9%(-4.67)#25,131 |
| 49. | 55424 | 2.0% | 5.5%(-3.53)#734 | 6.9%(-4.90)#25,579 |
| 50. | 55439 | 1.5% | 5.5%(-4.00)#769 | 6.9%(-5.36)#26,443 |
1
Common Questions
What are the Top 10 Zip Codes with the Highest Percentage of Population Employed in Accommodation & Food Services in Minneapolis, MN?
Top 10 Zip Codes with the Highest Percentage of Population Employed in Accommodation & Food Services in Minneapolis, MN are:
What zip code has the Highest Percentage of Population Employed in Accommodation & Food Services in Minneapolis, MN?
55455 has the Highest Percentage of Population Employed in Accommodation & Food Services in Minneapolis, MN with 26.4%.
What is the Percentage of Population Employed in Accommodation & Food Services in Minneapolis, MN?
Percentage of Population Employed in Accommodation & Food Services in Minneapolis is 7.4%.
What is the Percentage of Population Employed in Accommodation & Food Services in Minnesota?
Percentage of Population Employed in Accommodation & Food Services in Minnesota is 5.5%.
What is the Percentage of Population Employed in Accommodation & Food Services in the United States?
Percentage of Population Employed in Accommodation & Food Services in the United States is 6.9%.