Zip Codes with the Highest Percentage of Population Employed in Accommodation & Food Services in Minnesota
RELATED REPORTS & OPTIONS
Accommodation & Food Services
Minnesota
Compare Zip Codes
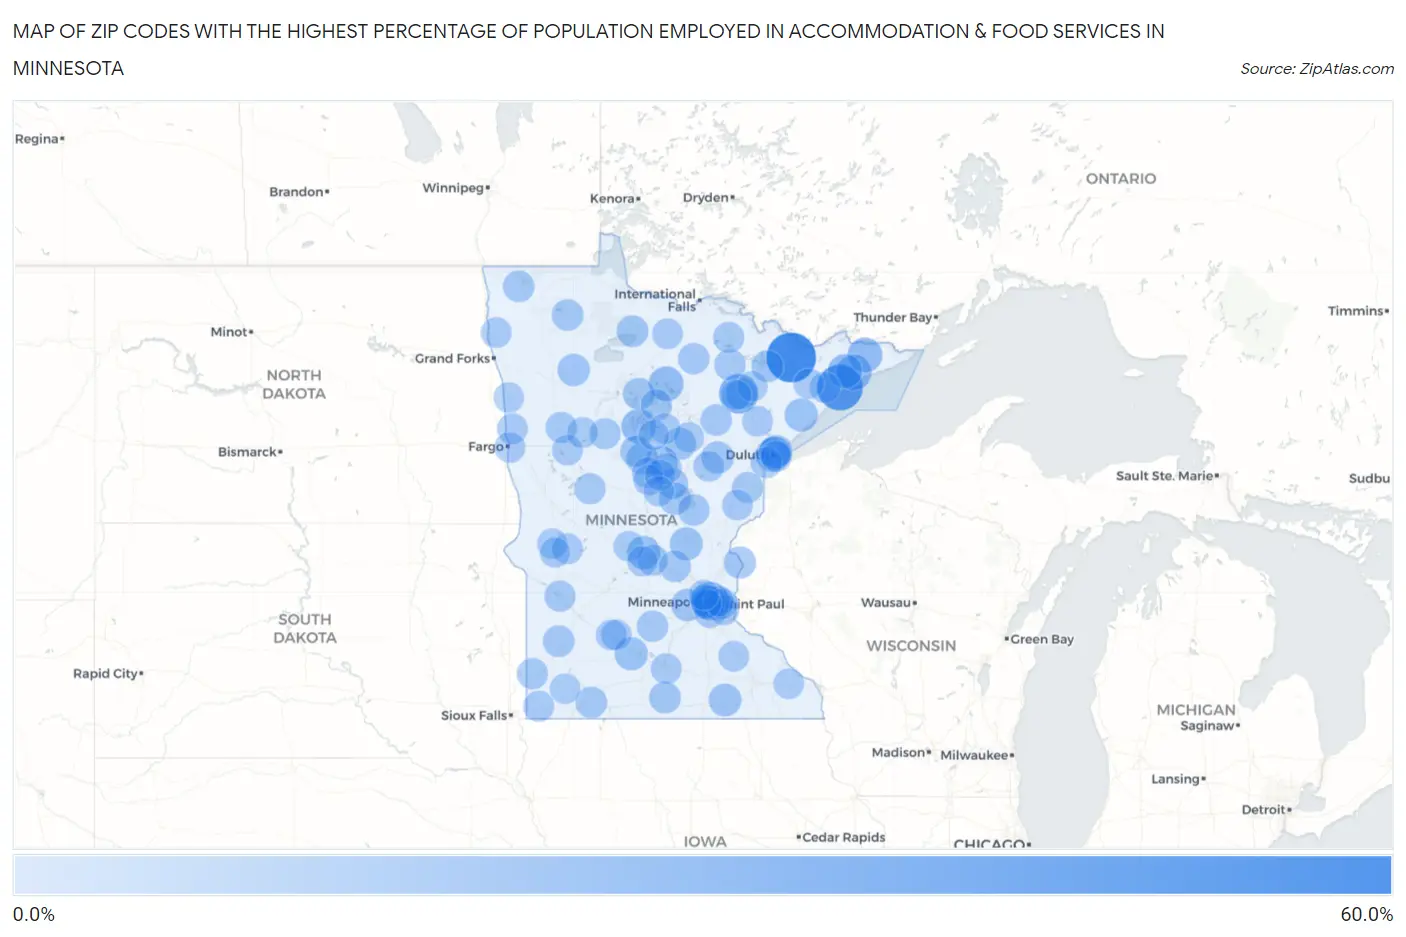
Map of Zip Codes with the Highest Percentage of Population Employed in Accommodation & Food Services in Minnesota
0.0%
60.0%
Zip Codes with the Highest Percentage of Population Employed in Accommodation & Food Services in Minnesota
| Zip Code | % Employed | vs State | vs National | |
| 1. | 55796 | 50.8% | 5.5%(+45.3)#1 | 6.9%(+44.0)#92 |
| 2. | 55613 | 42.5% | 5.5%(+36.9)#2 | 6.9%(+35.6)#148 |
| 3. | 55758 | 28.0% | 5.5%(+22.5)#3 | 6.9%(+21.1)#384 |
| 4. | 55455 | 26.4% | 5.5%(+20.9)#4 | 6.9%(+19.5)#444 |
| 5. | 55612 | 19.6% | 5.5%(+14.1)#5 | 6.9%(+12.7)#870 |
| 6. | 56659 | 17.8% | 5.5%(+12.3)#6 | 6.9%(+10.9)#1,125 |
| 7. | 55604 | 17.8% | 5.5%(+12.3)#7 | 6.9%(+10.9)#1,128 |
| 8. | 56484 | 17.5% | 5.5%(+12.0)#8 | 6.9%(+10.6)#1,184 |
| 9. | 55615 | 16.7% | 5.5%(+11.2)#9 | 6.9%(+9.79)#1,315 |
| 10. | 55806 | 15.8% | 5.5%(+10.3)#10 | 6.9%(+8.91)#1,497 |
| 11. | 56321 | 14.9% | 5.5%(+9.39)#11 | 6.9%(+8.03)#1,698 |
| 12. | 55616 | 14.4% | 5.5%(+8.90)#12 | 6.9%(+7.54)#1,842 |
| 13. | 56030 | 14.3% | 5.5%(+8.77)#13 | 6.9%(+7.40)#1,886 |
| 14. | 56363 | 14.0% | 5.5%(+8.46)#14 | 6.9%(+7.09)#1,983 |
| 15. | 56442 | 13.7% | 5.5%(+8.19)#15 | 6.9%(+6.83)#2,051 |
| 16. | 55454 | 13.7% | 5.5%(+8.19)#16 | 6.9%(+6.82)#2,052 |
| 17. | 55950 | 13.5% | 5.5%(+8.00)#17 | 6.9%(+6.63)#2,133 |
| 18. | 55404 | 13.3% | 5.5%(+7.76)#18 | 6.9%(+6.40)#2,234 |
| 19. | 55812 | 13.3% | 5.5%(+7.74)#19 | 6.9%(+6.38)#2,244 |
| 20. | 55805 | 13.0% | 5.5%(+7.51)#20 | 6.9%(+6.14)#2,339 |
| 21. | 55384 | 13.0% | 5.5%(+7.44)#21 | 6.9%(+6.07)#2,362 |
| 22. | 55787 | 12.8% | 5.5%(+7.31)#22 | 6.9%(+5.95)#2,417 |
| 23. | 56646 | 12.8% | 5.5%(+7.24)#23 | 6.9%(+5.87)#2,461 |
| 24. | 55785 | 12.5% | 5.5%(+6.98)#24 | 6.9%(+5.62)#2,595 |
| 25. | 55084 | 12.0% | 5.5%(+6.48)#25 | 6.9%(+5.12)#2,831 |
| 26. | 56474 | 11.9% | 5.5%(+6.42)#26 | 6.9%(+5.06)#2,871 |
| 27. | 56450 | 11.8% | 5.5%(+6.31)#27 | 6.9%(+4.95)#2,937 |
| 28. | 55782 | 11.5% | 5.5%(+6.00)#28 | 6.9%(+4.64)#3,148 |
| 29. | 55411 | 11.5% | 5.5%(+5.99)#29 | 6.9%(+4.63)#3,153 |
| 30. | 56685 | 11.4% | 5.5%(+5.91)#30 | 6.9%(+4.55)#3,212 |
| 31. | 56435 | 11.4% | 5.5%(+5.87)#31 | 6.9%(+4.51)#3,244 |
| 32. | 56663 | 11.4% | 5.5%(+5.85)#32 | 6.9%(+4.48)#3,268 |
| 33. | 55768 | 11.3% | 5.5%(+5.80)#33 | 6.9%(+4.44)#3,306 |
| 34. | 56023 | 11.3% | 5.5%(+5.79)#34 | 6.9%(+4.43)#3,314 |
| 35. | 56239 | 11.1% | 5.5%(+5.60)#35 | 6.9%(+4.23)#3,461 |
| 36. | 56724 | 11.1% | 5.5%(+5.60)#36 | 6.9%(+4.23)#3,471 |
| 37. | 55308 | 10.9% | 5.5%(+5.42)#37 | 6.9%(+4.06)#3,603 |
| 38. | 56386 | 10.9% | 5.5%(+5.39)#38 | 6.9%(+4.02)#3,638 |
| 39. | 56734 | 10.9% | 5.5%(+5.39)#39 | 6.9%(+4.02)#3,639 |
| 40. | 56161 | 10.9% | 5.5%(+5.34)#40 | 6.9%(+3.98)#3,669 |
| 41. | 56626 | 10.8% | 5.5%(+5.30)#41 | 6.9%(+3.93)#3,713 |
| 42. | 55742 | 10.5% | 5.5%(+4.95)#42 | 6.9%(+3.58)#4,034 |
| 43. | 56639 | 10.5% | 5.5%(+4.94)#43 | 6.9%(+3.58)#4,041 |
| 44. | 55723 | 10.4% | 5.5%(+4.88)#44 | 6.9%(+3.52)#4,098 |
| 45. | 55808 | 10.4% | 5.5%(+4.88)#45 | 6.9%(+3.51)#4,099 |
| 46. | 55366 | 10.4% | 5.5%(+4.84)#46 | 6.9%(+3.48)#4,142 |
| 47. | 55414 | 10.3% | 5.5%(+4.75)#47 | 6.9%(+3.38)#4,234 |
| 48. | 56301 | 10.2% | 5.5%(+4.70)#48 | 6.9%(+3.34)#4,280 |
| 49. | 56527 | 10.1% | 5.5%(+4.60)#49 | 6.9%(+3.23)#4,398 |
| 50. | 56444 | 10.1% | 5.5%(+4.56)#50 | 6.9%(+3.19)#4,437 |
| 51. | 55771 | 10.1% | 5.5%(+4.54)#51 | 6.9%(+3.18)#4,458 |
| 52. | 56295 | 9.9% | 5.5%(+4.42)#52 | 6.9%(+3.06)#4,621 |
| 53. | 56591 | 9.9% | 5.5%(+4.38)#53 | 6.9%(+3.01)#4,671 |
| 54. | 56164 | 9.9% | 5.5%(+4.35)#54 | 6.9%(+2.99)#4,703 |
| 55. | 55802 | 9.9% | 5.5%(+4.35)#55 | 6.9%(+2.98)#4,712 |
| 56. | 55603 | 9.8% | 5.5%(+4.30)#56 | 6.9%(+2.93)#4,772 |
| 57. | 55403 | 9.7% | 5.5%(+4.22)#57 | 6.9%(+2.86)#4,882 |
| 58. | 55756 | 9.6% | 5.5%(+4.10)#58 | 6.9%(+2.73)#5,038 |
| 59. | 56470 | 9.6% | 5.5%(+4.05)#59 | 6.9%(+2.69)#5,120 |
| 60. | 56441 | 9.5% | 5.5%(+4.01)#60 | 6.9%(+2.64)#5,175 |
| 61. | 56156 | 9.5% | 5.5%(+3.95)#61 | 6.9%(+2.59)#5,254 |
| 62. | 55760 | 9.4% | 5.5%(+3.89)#62 | 6.9%(+2.52)#5,341 |
| 63. | 56672 | 9.4% | 5.5%(+3.88)#63 | 6.9%(+2.52)#5,353 |
| 64. | 56323 | 9.4% | 5.5%(+3.84)#64 | 6.9%(+2.48)#5,414 |
| 65. | 56575 | 9.3% | 5.5%(+3.81)#65 | 6.9%(+2.45)#5,462 |
| 66. | 56270 | 9.3% | 5.5%(+3.81)#66 | 6.9%(+2.44)#5,463 |
| 67. | 56472 | 9.3% | 5.5%(+3.80)#67 | 6.9%(+2.44)#5,470 |
| 68. | 56001 | 9.3% | 5.5%(+3.80)#68 | 6.9%(+2.43)#5,481 |
| 69. | 55333 | 9.3% | 5.5%(+3.78)#69 | 6.9%(+2.41)#5,507 |
| 70. | 55425 | 9.3% | 5.5%(+3.74)#70 | 6.9%(+2.38)#5,563 |
| 71. | 55107 | 9.2% | 5.5%(+3.73)#71 | 6.9%(+2.36)#5,589 |
| 72. | 56546 | 9.2% | 5.5%(+3.65)#72 | 6.9%(+2.29)#5,705 |
| 73. | 56627 | 9.1% | 5.5%(+3.58)#73 | 6.9%(+2.21)#5,817 |
| 74. | 55072 | 9.1% | 5.5%(+3.57)#74 | 6.9%(+2.20)#5,829 |
| 75. | 56710 | 9.0% | 5.5%(+3.53)#75 | 6.9%(+2.16)#5,889 |
| 76. | 56468 | 9.0% | 5.5%(+3.49)#76 | 6.9%(+2.13)#5,935 |
| 77. | 56563 | 9.0% | 5.5%(+3.48)#77 | 6.9%(+2.11)#5,964 |
| 78. | 55983 | 9.0% | 5.5%(+3.47)#78 | 6.9%(+2.10)#5,983 |
| 79. | 55407 | 9.0% | 5.5%(+3.47)#79 | 6.9%(+2.10)#5,986 |
| 80. | 56501 | 9.0% | 5.5%(+3.46)#80 | 6.9%(+2.10)#5,999 |
| 81. | 55724 | 8.9% | 5.5%(+3.35)#81 | 6.9%(+1.98)#6,173 |
| 82. | 56465 | 8.8% | 5.5%(+3.33)#82 | 6.9%(+1.96)#6,209 |
| 83. | 56331 | 8.8% | 5.5%(+3.29)#83 | 6.9%(+1.93)#6,267 |
| 84. | 56235 | 8.8% | 5.5%(+3.29)#84 | 6.9%(+1.92)#6,279 |
| 85. | 56401 | 8.8% | 5.5%(+3.29)#85 | 6.9%(+1.92)#6,281 |
| 86. | 55952 | 8.8% | 5.5%(+3.28)#86 | 6.9%(+1.91)#6,292 |
| 87. | 55055 | 8.7% | 5.5%(+3.20)#87 | 6.9%(+1.84)#6,439 |
| 88. | 55792 | 8.7% | 5.5%(+3.17)#88 | 6.9%(+1.80)#6,504 |
| 89. | 55119 | 8.7% | 5.5%(+3.14)#89 | 6.9%(+1.78)#6,542 |
| 90. | 56655 | 8.6% | 5.5%(+3.12)#90 | 6.9%(+1.76)#6,568 |
| 91. | 55130 | 8.6% | 5.5%(+3.12)#91 | 6.9%(+1.75)#6,572 |
| 92. | 55748 | 8.6% | 5.5%(+3.08)#92 | 6.9%(+1.72)#6,647 |
| 93. | 55607 | 8.6% | 5.5%(+3.06)#93 | 6.9%(+1.69)#6,687 |
| 94. | 56141 | 8.5% | 5.5%(+3.03)#94 | 6.9%(+1.67)#6,737 |
| 95. | 56320 | 8.5% | 5.5%(+2.98)#95 | 6.9%(+1.61)#6,832 |
| 96. | 56581 | 8.4% | 5.5%(+2.88)#96 | 6.9%(+1.52)#7,003 |
| 97. | 55408 | 8.4% | 5.5%(+2.88)#97 | 6.9%(+1.51)#7,012 |
| 98. | 56267 | 8.4% | 5.5%(+2.86)#98 | 6.9%(+1.50)#7,034 |
| 99. | 55429 | 8.4% | 5.5%(+2.85)#99 | 6.9%(+1.48)#7,064 |
| 100. | 55713 | 8.3% | 5.5%(+2.77)#100 | 6.9%(+1.41)#7,245 |
Common Questions
What are the Top 10 Zip Codes with the Highest Percentage of Population Employed in Accommodation & Food Services in Minnesota?
Top 10 Zip Codes with the Highest Percentage of Population Employed in Accommodation & Food Services in Minnesota are:
What zip code has the Highest Percentage of Population Employed in Accommodation & Food Services in Minnesota?
55796 has the Highest Percentage of Population Employed in Accommodation & Food Services in Minnesota with 50.8%.
What is the Percentage of Population Employed in Accommodation & Food Services in the State of Minnesota?
Percentage of Population Employed in Accommodation & Food Services in Minnesota is 5.5%.
What is the Percentage of Population Employed in Accommodation & Food Services in the United States?
Percentage of Population Employed in Accommodation & Food Services in the United States is 6.9%.