Spicer, MN Map & Demographics
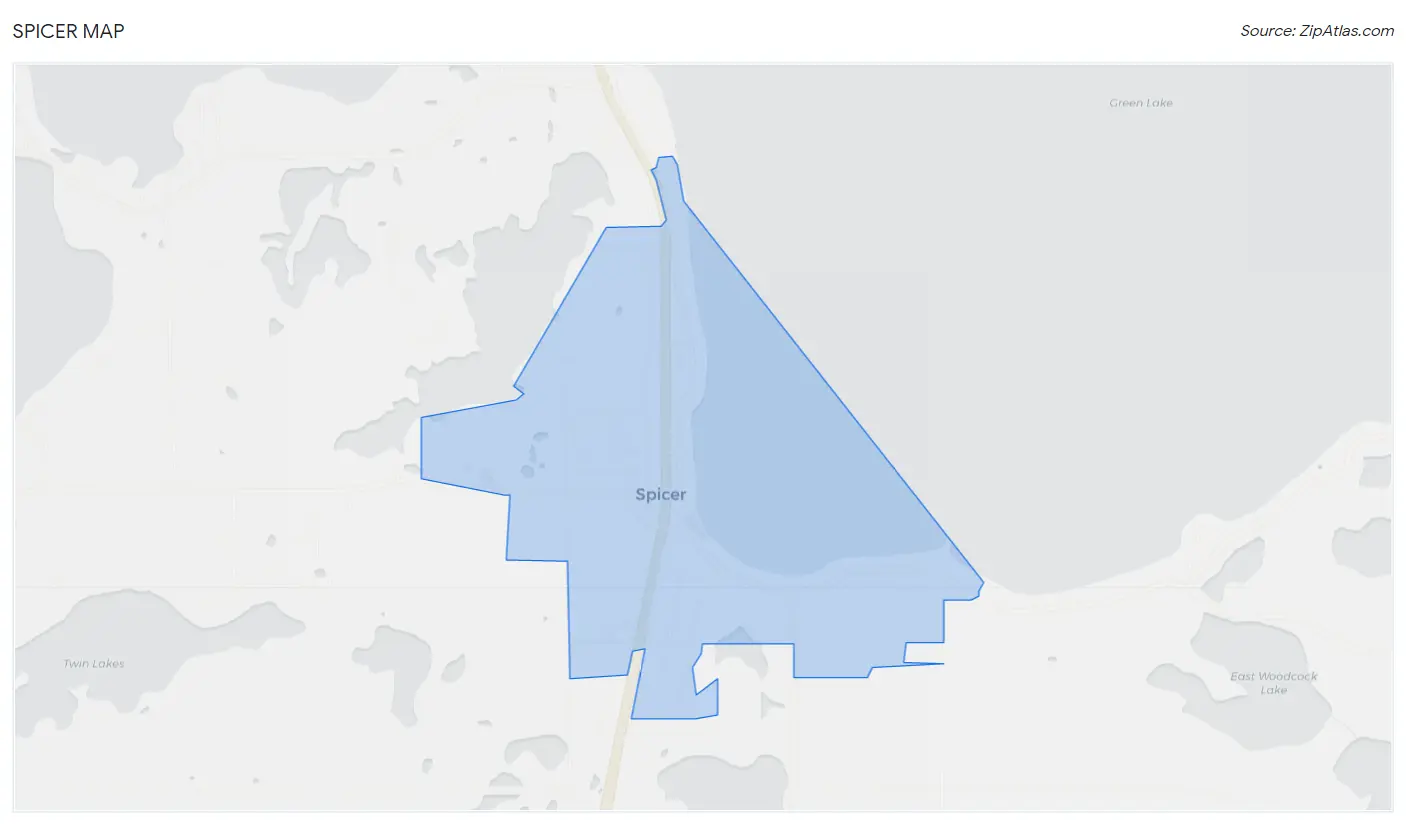
Spicer Map
Spicer Overview
$43,465
PER CAPITA INCOME
$101,667
AVG FAMILY INCOME
$68,571
AVG HOUSEHOLD INCOME
49.6%
WAGE / INCOME GAP [ % ]
50.4¢/ $1
WAGE / INCOME GAP [ $ ]
0.52
INEQUALITY / GINI INDEX
1,190
TOTAL POPULATION
657
MALE POPULATION
533
FEMALE POPULATION
123.26
MALES / 100 FEMALES
81.13
FEMALES / 100 MALES
47.2
MEDIAN AGE
3.0
AVG FAMILY SIZE
2.2
AVG HOUSEHOLD SIZE
718
LABOR FORCE [ PEOPLE ]
71.0%
PERCENT IN LABOR FORCE
1.9%
UNEMPLOYMENT RATE
Spicer Zip Codes
Spicer Area Codes
Income in Spicer
Income Overview in Spicer
Per Capita Income in Spicer is $43,465, while median incomes of families and households are $101,667 and $68,571 respectively.
| Characteristic | Number | Measure |
| Per Capita Income | 1,190 | $43,465 |
| Median Family Income | 268 | $101,667 |
| Mean Family Income | 268 | $143,625 |
| Median Household Income | 522 | $68,571 |
| Mean Household Income | 522 | $94,313 |
| Income Deficit | 268 | $0 |
| Wage / Income Gap (%) | 1,190 | 49.59% |
| Wage / Income Gap ($) | 1,190 | 50.41¢ per $1 |
| Gini / Inequality Index | 1,190 | 0.52 |
Earnings by Sex in Spicer
Average Earnings in Spicer are $33,512, $46,250 for men and $23,313 for women, a difference of 49.6%.
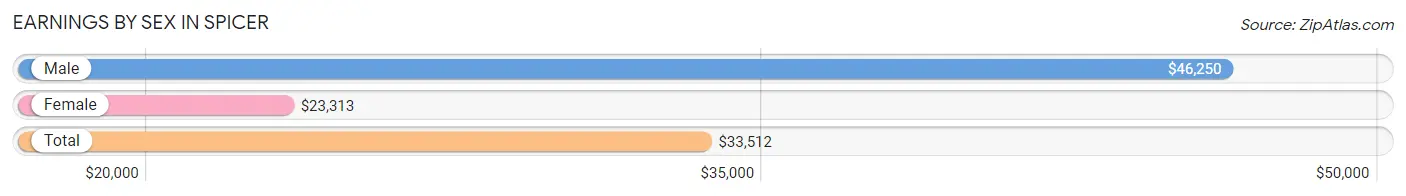
| Sex | Number | Average Earnings |
| Male | 446 (57.3%) | $46,250 |
| Female | 333 (42.7%) | $23,313 |
| Total | 779 (100.0%) | $33,512 |
Earnings by Sex by Income Bracket in Spicer
The most common earnings brackets in Spicer are $100,000+ for men (91 | 20.4%) and $35,000 to $39,999 for women (40 | 12.0%).
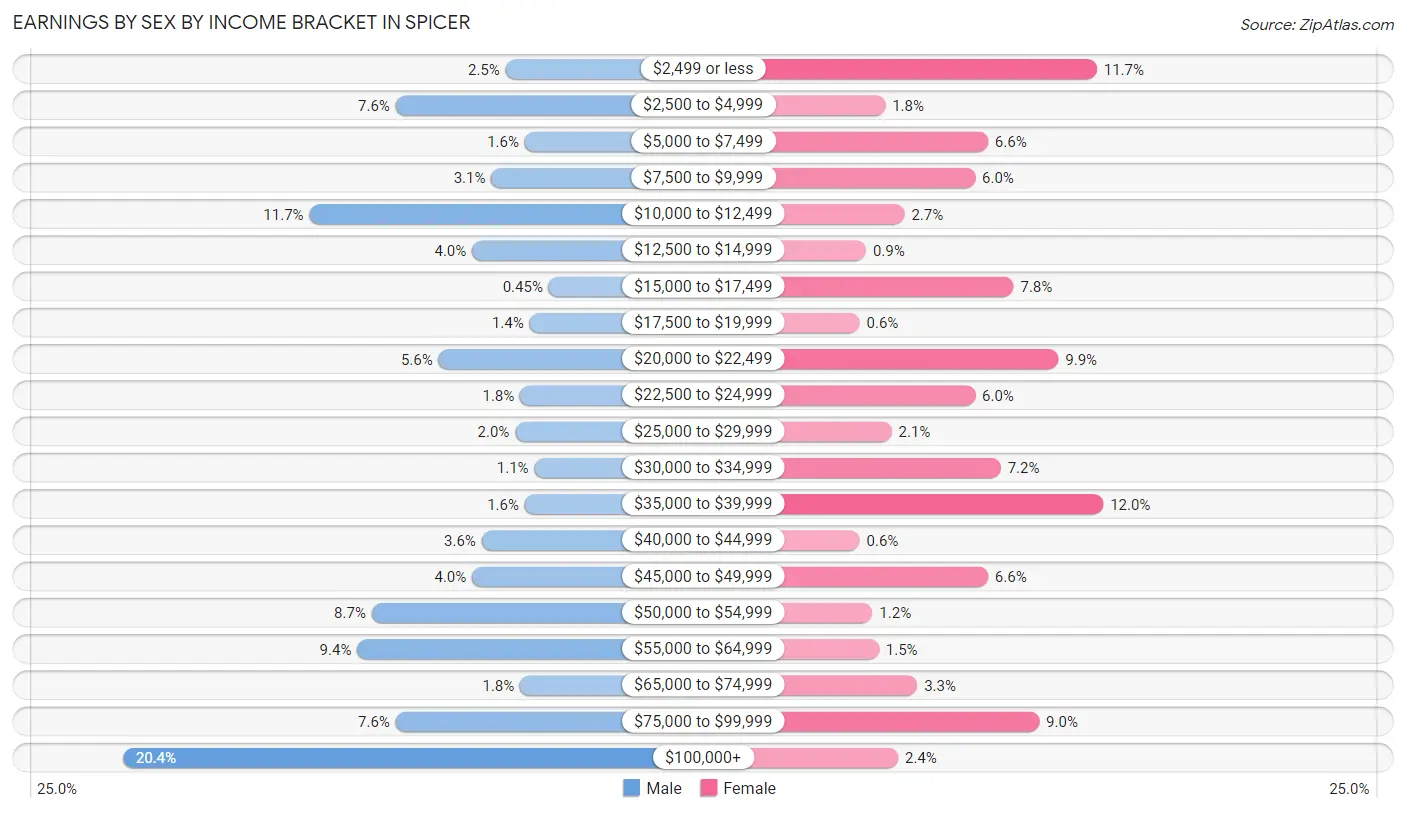
| Income | Male | Female |
| $2,499 or less | 11 (2.5%) | 39 (11.7%) |
| $2,500 to $4,999 | 34 (7.6%) | 6 (1.8%) |
| $5,000 to $7,499 | 7 (1.6%) | 22 (6.6%) |
| $7,500 to $9,999 | 14 (3.1%) | 20 (6.0%) |
| $10,000 to $12,499 | 52 (11.7%) | 9 (2.7%) |
| $12,500 to $14,999 | 18 (4.0%) | 3 (0.9%) |
| $15,000 to $17,499 | 2 (0.4%) | 26 (7.8%) |
| $17,500 to $19,999 | 6 (1.3%) | 2 (0.6%) |
| $20,000 to $22,499 | 25 (5.6%) | 33 (9.9%) |
| $22,500 to $24,999 | 8 (1.8%) | 20 (6.0%) |
| $25,000 to $29,999 | 9 (2.0%) | 7 (2.1%) |
| $30,000 to $34,999 | 5 (1.1%) | 24 (7.2%) |
| $35,000 to $39,999 | 7 (1.6%) | 40 (12.0%) |
| $40,000 to $44,999 | 16 (3.6%) | 2 (0.6%) |
| $45,000 to $49,999 | 18 (4.0%) | 22 (6.6%) |
| $50,000 to $54,999 | 39 (8.7%) | 4 (1.2%) |
| $55,000 to $64,999 | 42 (9.4%) | 5 (1.5%) |
| $65,000 to $74,999 | 8 (1.8%) | 11 (3.3%) |
| $75,000 to $99,999 | 34 (7.6%) | 30 (9.0%) |
| $100,000+ | 91 (20.4%) | 8 (2.4%) |
| Total | 446 (100.0%) | 333 (100.0%) |
Earnings by Sex by Educational Attainment in Spicer
Average earnings in Spicer are $52,300 for men and $32,250 for women, a difference of 38.3%. Men with an educational attainment of bachelor's degree enjoy the highest average annual earnings of $108,021, while those with high school diploma education earn the least with $23,125. Women with an educational attainment of graduate degree earn the most with the average annual earnings of $82,750, while those with high school diploma education have the smallest earnings of $9,318.
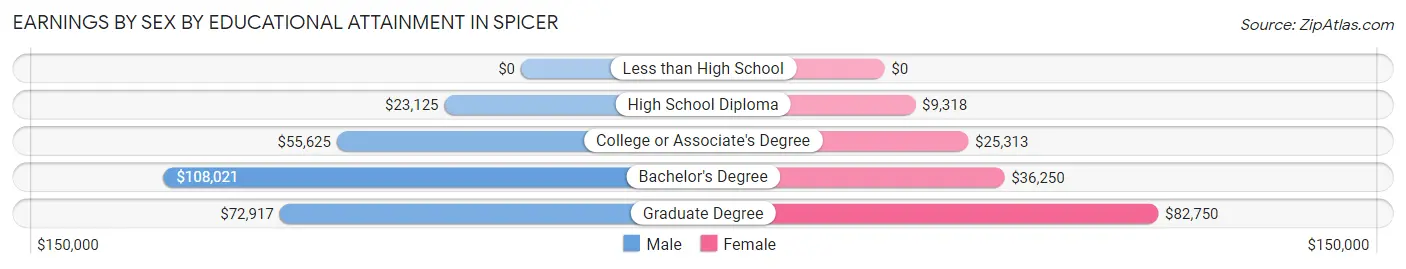
| Educational Attainment | Male Income | Female Income |
| Less than High School | - | - |
| High School Diploma | $23,125 | $9,318 |
| College or Associate's Degree | $55,625 | $25,313 |
| Bachelor's Degree | $108,021 | $36,250 |
| Graduate Degree | $72,917 | $82,750 |
| Total | $52,300 | $32,250 |
Family Income in Spicer
Family Income Brackets in Spicer
According to the Spicer family income data, there are 58 families falling into the $75,000 to $99,999 income range, which is the most common income bracket and makes up 21.6% of all families.
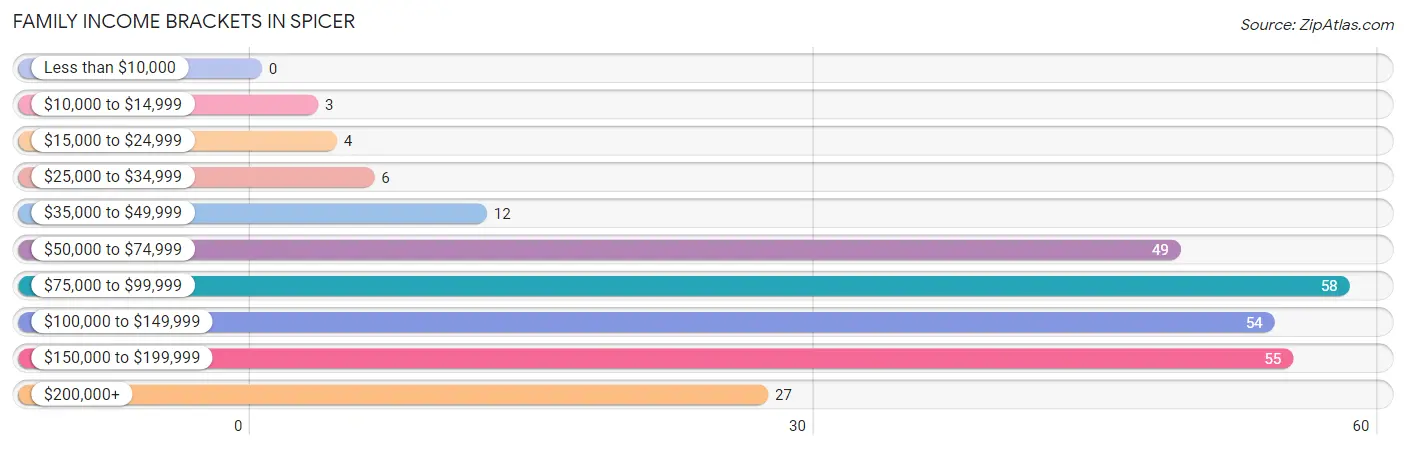
| Income Bracket | # Families | % Families |
| Less than $10,000 | 0 | 0.0% |
| $10,000 to $14,999 | 3 | 1.1% |
| $15,000 to $24,999 | 4 | 1.5% |
| $25,000 to $34,999 | 6 | 2.2% |
| $35,000 to $49,999 | 12 | 4.5% |
| $50,000 to $74,999 | 49 | 18.3% |
| $75,000 to $99,999 | 58 | 21.6% |
| $100,000 to $149,999 | 54 | 20.1% |
| $150,000 to $199,999 | 55 | 20.5% |
| $200,000+ | 27 | 10.1% |
Family Income by Famaliy Size in Spicer
2-person families (154 | 57.5%) account for the highest median family income in Spicer with $113,750 per family, while 2-person families (154 | 57.5%) have the highest median income of $56,875 per family member.
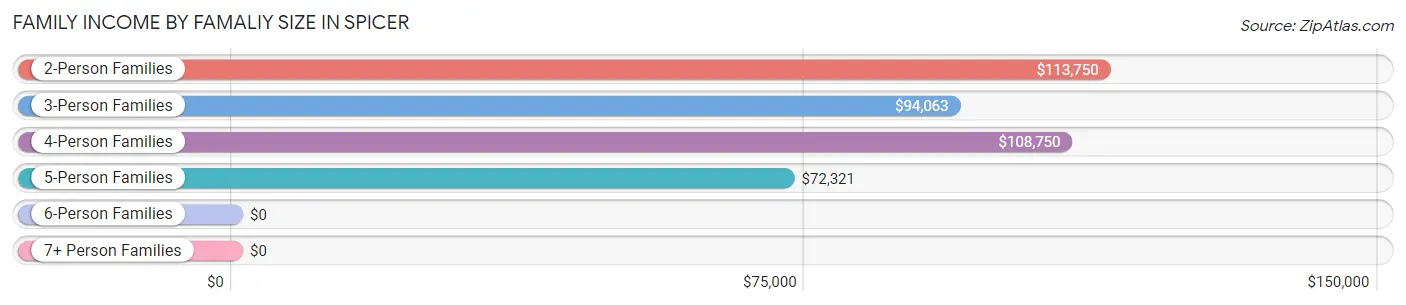
| Income Bracket | # Families | Median Income |
| 2-Person Families | 154 (57.5%) | $113,750 |
| 3-Person Families | 31 (11.6%) | $94,063 |
| 4-Person Families | 49 (18.3%) | $108,750 |
| 5-Person Families | 34 (12.7%) | $72,321 |
| 6-Person Families | 0 (0.0%) | $0 |
| 7+ Person Families | 0 (0.0%) | $0 |
| Total | 268 (100.0%) | $101,667 |
Family Income by Number of Earners in Spicer
The median family income in Spicer is $101,667, with families comprising 3+ earners (22) having the highest median family income of $148,750, while families with no earners (23) have the lowest median family income of $69,583, accounting for 8.2% and 8.6% of families, respectively.
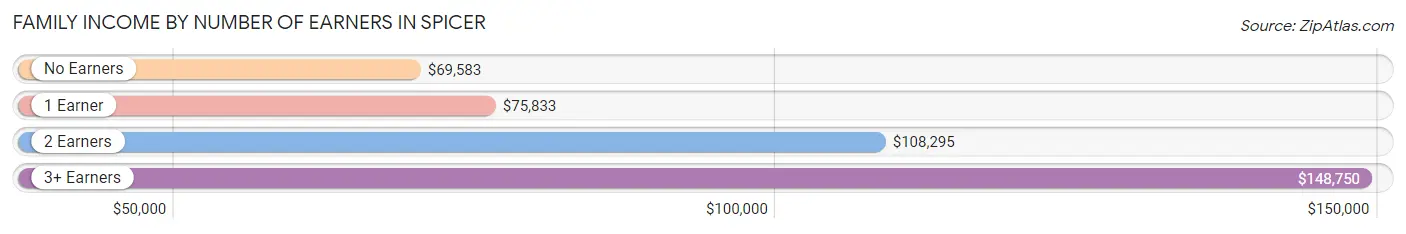
| Number of Earners | # Families | Median Income |
| No Earners | 23 (8.6%) | $69,583 |
| 1 Earner | 44 (16.4%) | $75,833 |
| 2 Earners | 179 (66.8%) | $108,295 |
| 3+ Earners | 22 (8.2%) | $148,750 |
| Total | 268 (100.0%) | $101,667 |
Household Income in Spicer
Household Income Brackets in Spicer
With 73 households falling in the category, the $75,000 to $99,999 income range is the most frequent in Spicer, accounting for 14.0% of all households. In contrast, only 24 households (4.6%) fall into the $25,000 to $34,999 income bracket, making it the least populous group.
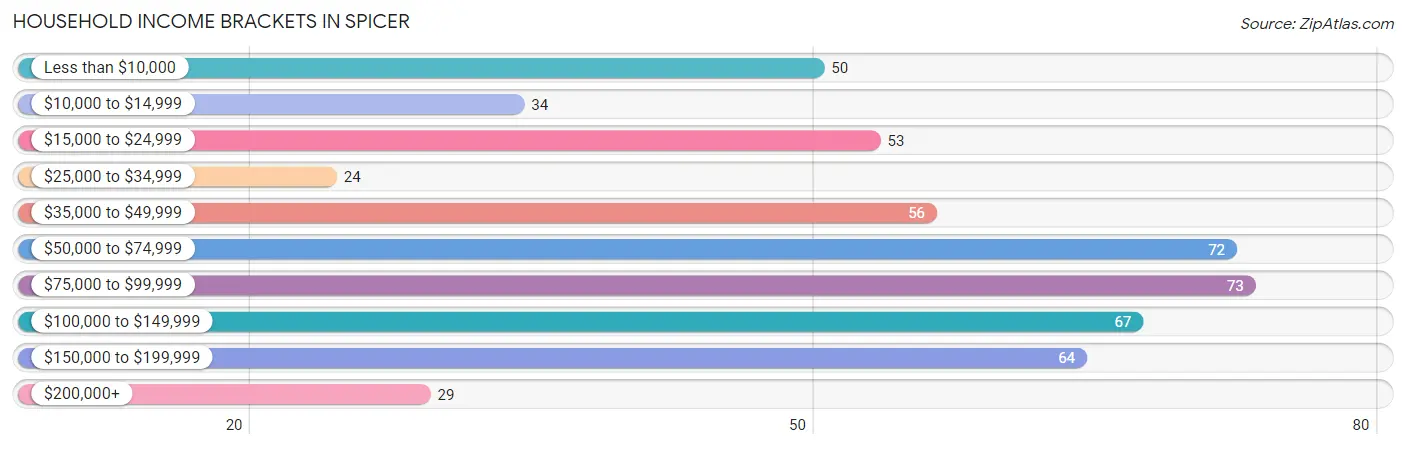
| Income Bracket | # Households | % Households |
| Less than $10,000 | 50 | 9.6% |
| $10,000 to $14,999 | 34 | 6.5% |
| $15,000 to $24,999 | 53 | 10.2% |
| $25,000 to $34,999 | 24 | 4.6% |
| $35,000 to $49,999 | 56 | 10.7% |
| $50,000 to $74,999 | 72 | 13.8% |
| $75,000 to $99,999 | 73 | 14.0% |
| $100,000 to $149,999 | 67 | 12.8% |
| $150,000 to $199,999 | 64 | 12.3% |
| $200,000+ | 29 | 5.6% |
Household Income by Householder Age in Spicer
The median household income in Spicer is $68,571, with the highest median household income of $86,467 found in the 45 to 64 years age bracket for the primary householder. A total of 229 households (43.9%) fall into this category. Meanwhile, the 65+ years age bracket for the primary householder has the lowest median household income of $23,636, with 148 households (28.3%) in this group.
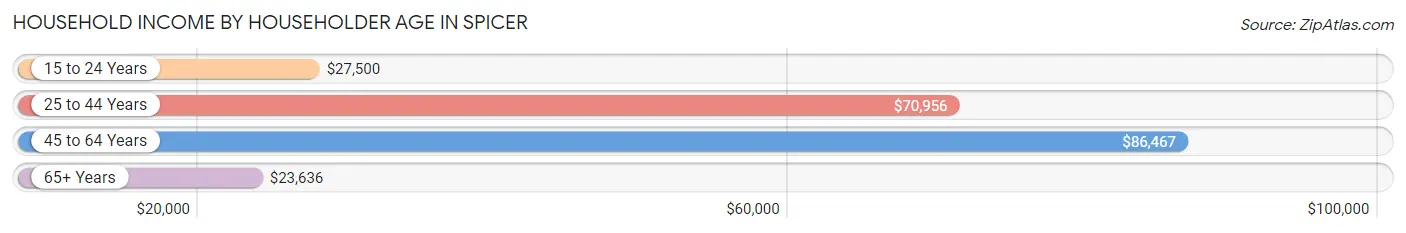
| Income Bracket | # Households | Median Income |
| 15 to 24 Years | 14 (2.7%) | $27,500 |
| 25 to 44 Years | 131 (25.1%) | $70,956 |
| 45 to 64 Years | 229 (43.9%) | $86,467 |
| 65+ Years | 148 (28.3%) | $23,636 |
| Total | 522 (100.0%) | $68,571 |
Poverty in Spicer
Income Below Poverty by Sex and Age in Spicer
With 10.4% poverty level for males and 4.2% for females among the residents of Spicer, 75 year old and over males and 65 to 74 year old females are the most vulnerable to poverty, with 23 males (44.2%) and 7 females (22.6%) in their respective age groups living below the poverty level.
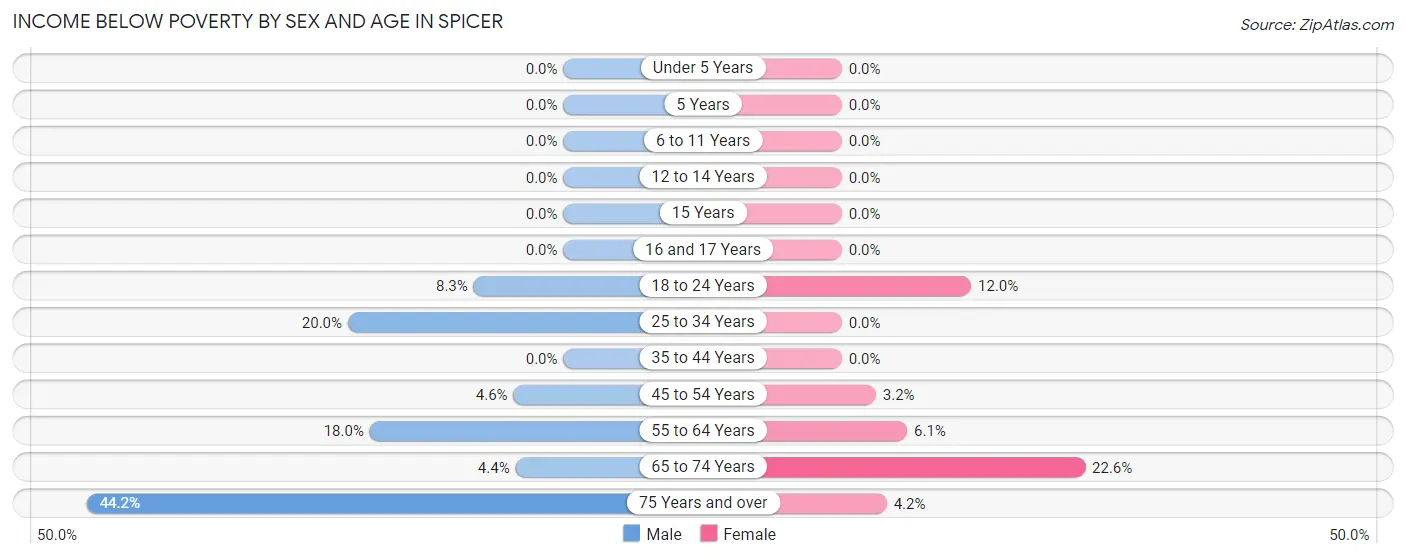
| Age Bracket | Male | Female |
| Under 5 Years | 0 (0.0%) | 0 (0.0%) |
| 5 Years | 0 (0.0%) | 0 (0.0%) |
| 6 to 11 Years | 0 (0.0%) | 0 (0.0%) |
| 12 to 14 Years | 0 (0.0%) | 0 (0.0%) |
| 15 Years | 0 (0.0%) | 0 (0.0%) |
| 16 and 17 Years | 0 (0.0%) | 0 (0.0%) |
| 18 to 24 Years | 5 (8.3%) | 3 (12.0%) |
| 25 to 34 Years | 10 (20.0%) | 0 (0.0%) |
| 35 to 44 Years | 0 (0.0%) | 0 (0.0%) |
| 45 to 54 Years | 5 (4.6%) | 3 (3.2%) |
| 55 to 64 Years | 23 (18.0%) | 6 (6.1%) |
| 65 to 74 Years | 2 (4.4%) | 7 (22.6%) |
| 75 Years and over | 23 (44.2%) | 3 (4.2%) |
| Total | 68 (10.4%) | 22 (4.2%) |
Income Above Poverty by Sex and Age in Spicer
According to the poverty statistics in Spicer, males aged under 5 years and females aged under 5 years are the age groups that are most secure financially, with 100.0% of males and 100.0% of females in these age groups living above the poverty line.
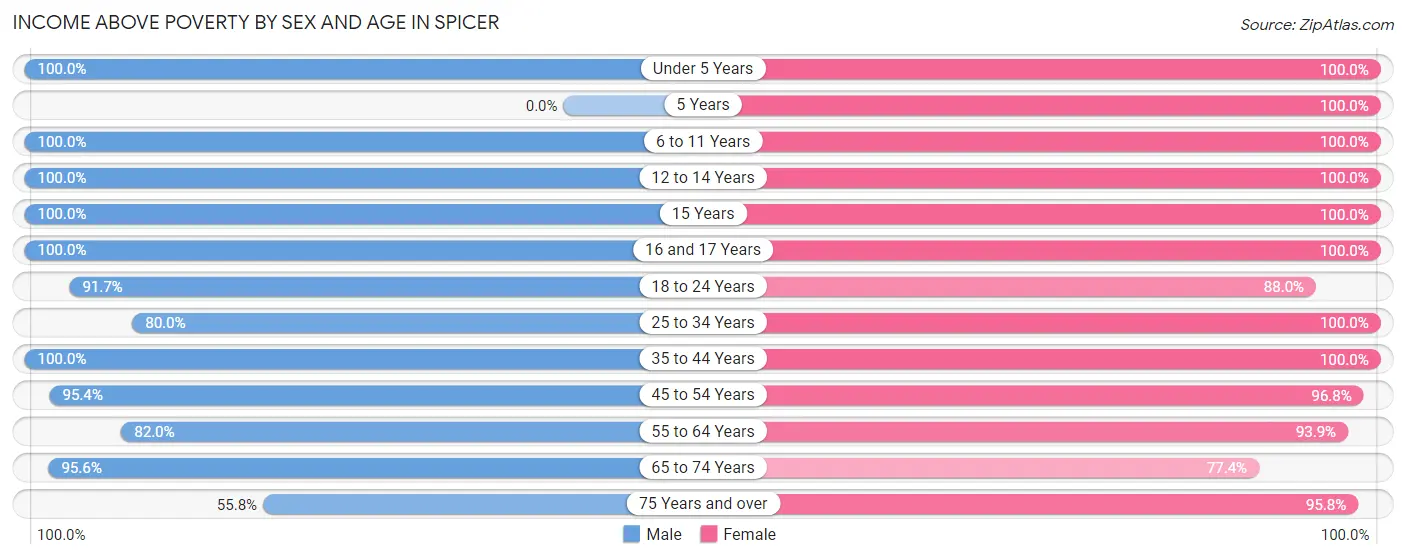
| Age Bracket | Male | Female |
| Under 5 Years | 21 (100.0%) | 14 (100.0%) |
| 5 Years | 0 (0.0%) | 4 (100.0%) |
| 6 to 11 Years | 28 (100.0%) | 37 (100.0%) |
| 12 to 14 Years | 36 (100.0%) | 24 (100.0%) |
| 15 Years | 3 (100.0%) | 3 (100.0%) |
| 16 and 17 Years | 25 (100.0%) | 31 (100.0%) |
| 18 to 24 Years | 55 (91.7%) | 22 (88.0%) |
| 25 to 34 Years | 40 (80.0%) | 44 (100.0%) |
| 35 to 44 Years | 95 (100.0%) | 51 (100.0%) |
| 45 to 54 Years | 103 (95.4%) | 92 (96.8%) |
| 55 to 64 Years | 105 (82.0%) | 93 (93.9%) |
| 65 to 74 Years | 43 (95.6%) | 24 (77.4%) |
| 75 Years and over | 29 (55.8%) | 69 (95.8%) |
| Total | 583 (89.5%) | 508 (95.9%) |
Income Below Poverty Among Married-Couple Families in Spicer
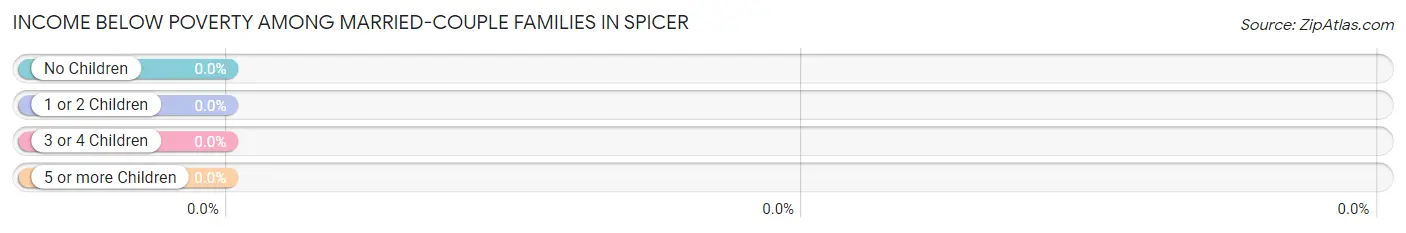
| Children | Above Poverty | Below Poverty |
| No Children | 142 (100.0%) | 0 (0.0%) |
| 1 or 2 Children | 59 (100.0%) | 0 (0.0%) |
| 3 or 4 Children | 26 (100.0%) | 0 (0.0%) |
| 5 or more Children | 0 (0.0%) | 0 (0.0%) |
| Total | 227 (100.0%) | 0 (0.0%) |
Income Below Poverty Among Single-Parent Households in Spicer
| Children | Single Father | Single Mother |
| No Children | 0 (0.0%) | 3 (37.5%) |
| 1 or 2 Children | 0 (0.0%) | 0 (0.0%) |
| 3 or 4 Children | 0 (0.0%) | 0 (0.0%) |
| 5 or more Children | 0 (0.0%) | 0 (0.0%) |
| Total | 0 (0.0%) | 3 (15.0%) |
Income Below Poverty Among Married-Couple vs Single-Parent Households in Spicer
| Children | Married-Couple Families | Single-Parent Households |
| No Children | 0 (0.0%) | 3 (17.6%) |
| 1 or 2 Children | 0 (0.0%) | 0 (0.0%) |
| 3 or 4 Children | 0 (0.0%) | 0 (0.0%) |
| 5 or more Children | 0 (0.0%) | 0 (0.0%) |
| Total | 0 (0.0%) | 3 (7.3%) |
Race in Spicer
The most populous races in Spicer are White / Caucasian (994 | 83.5%), Two or more Races (145 | 12.2%), and Hispanic or Latino (105 | 8.8%).
| Race | # Population | % Population |
| Asian | 0 | 0.0% |
| Black / African American | 20 | 1.7% |
| Hawaiian / Pacific | 0 | 0.0% |
| Hispanic or Latino | 105 | 8.8% |
| Native / Alaskan | 9 | 0.8% |
| White / Caucasian | 994 | 83.5% |
| Two or more Races | 145 | 12.2% |
| Some other Race | 22 | 1.8% |
| Total | 1,190 | 100.0% |
Ancestry in Spicer
The most populous ancestries reported in Spicer are German (385 | 32.4%), Norwegian (267 | 22.4%), Swedish (181 | 15.2%), Irish (75 | 6.3%), and English (73 | 6.1%), together accounting for 82.4% of all Spicer residents.
| Ancestry | # Population | % Population |
| American | 65 | 5.5% |
| Belgian | 3 | 0.3% |
| Cuban | 11 | 0.9% |
| Czech | 10 | 0.8% |
| Danish | 14 | 1.2% |
| Dutch | 30 | 2.5% |
| English | 73 | 6.1% |
| European | 65 | 5.5% |
| Finnish | 11 | 0.9% |
| French | 15 | 1.3% |
| French Canadian | 8 | 0.7% |
| German | 385 | 32.4% |
| Irish | 75 | 6.3% |
| Italian | 9 | 0.8% |
| Mexican | 63 | 5.3% |
| Norwegian | 267 | 22.4% |
| Polish | 7 | 0.6% |
| Russian | 2 | 0.2% |
| Scandinavian | 33 | 2.8% |
| Scotch-Irish | 5 | 0.4% |
| Scottish | 6 | 0.5% |
| Sioux | 9 | 0.8% |
| Swedish | 181 | 15.2% |
| Swiss | 4 | 0.3% |
| Welsh | 7 | 0.6% | View All 25 Rows |
Immigrants in Spicer
The most numerous immigrant groups reported in Spicer came from Africa (24 | 2.0%), Europe (8 | 0.7%), Germany (4 | 0.3%), Northern Europe (4 | 0.3%), and Western Europe (4 | 0.3%), together accounting for 3.7% of all Spicer residents.
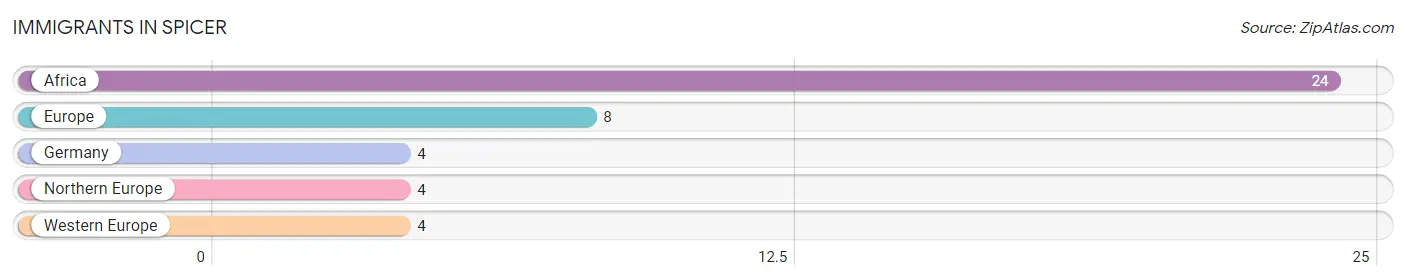
| Immigration Origin | # Population | % Population |
| Africa | 24 | 2.0% |
| Europe | 8 | 0.7% |
| Germany | 4 | 0.3% |
| Northern Europe | 4 | 0.3% |
| Western Europe | 4 | 0.3% | View All 5 Rows |
Sex and Age in Spicer
Sex and Age in Spicer
The most populous age groups in Spicer are 60 to 64 Years (95 | 14.5%) for men and 60 to 64 Years (63 | 11.8%) for women.
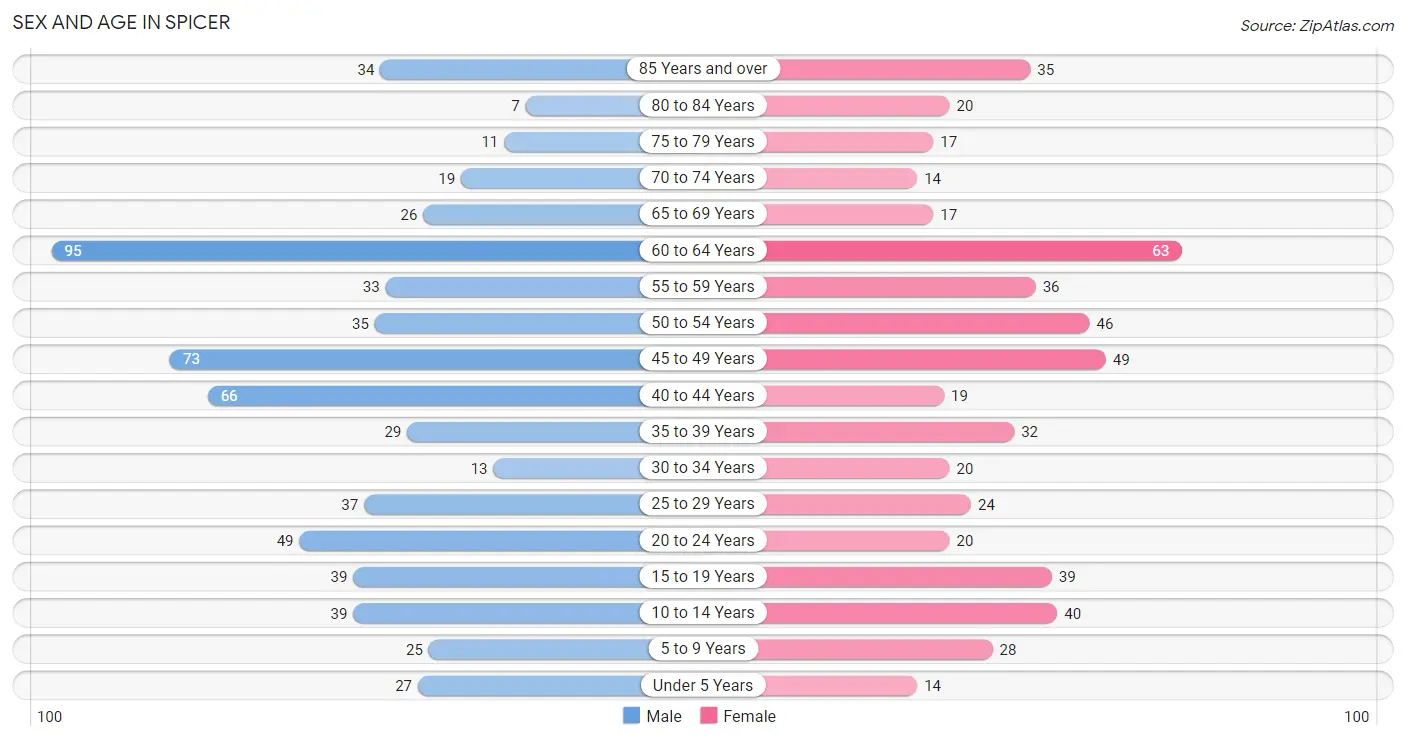
| Age Bracket | Male | Female |
| Under 5 Years | 27 (4.1%) | 14 (2.6%) |
| 5 to 9 Years | 25 (3.8%) | 28 (5.2%) |
| 10 to 14 Years | 39 (5.9%) | 40 (7.5%) |
| 15 to 19 Years | 39 (5.9%) | 39 (7.3%) |
| 20 to 24 Years | 49 (7.5%) | 20 (3.7%) |
| 25 to 29 Years | 37 (5.6%) | 24 (4.5%) |
| 30 to 34 Years | 13 (2.0%) | 20 (3.7%) |
| 35 to 39 Years | 29 (4.4%) | 32 (6.0%) |
| 40 to 44 Years | 66 (10.1%) | 19 (3.6%) |
| 45 to 49 Years | 73 (11.1%) | 49 (9.2%) |
| 50 to 54 Years | 35 (5.3%) | 46 (8.6%) |
| 55 to 59 Years | 33 (5.0%) | 36 (6.8%) |
| 60 to 64 Years | 95 (14.5%) | 63 (11.8%) |
| 65 to 69 Years | 26 (4.0%) | 17 (3.2%) |
| 70 to 74 Years | 19 (2.9%) | 14 (2.6%) |
| 75 to 79 Years | 11 (1.7%) | 17 (3.2%) |
| 80 to 84 Years | 7 (1.1%) | 20 (3.7%) |
| 85 Years and over | 34 (5.2%) | 35 (6.6%) |
| Total | 657 (100.0%) | 533 (100.0%) |
Families and Households in Spicer
Median Family Size in Spicer
The median family size in Spicer is 3.04 persons per family, with single female/mother families (20 | 7.5%) accounting for the largest median family size of 5.75 persons per family. On the other hand, single male/father families (21 | 7.8%) represent the smallest median family size with 2.52 persons per family.
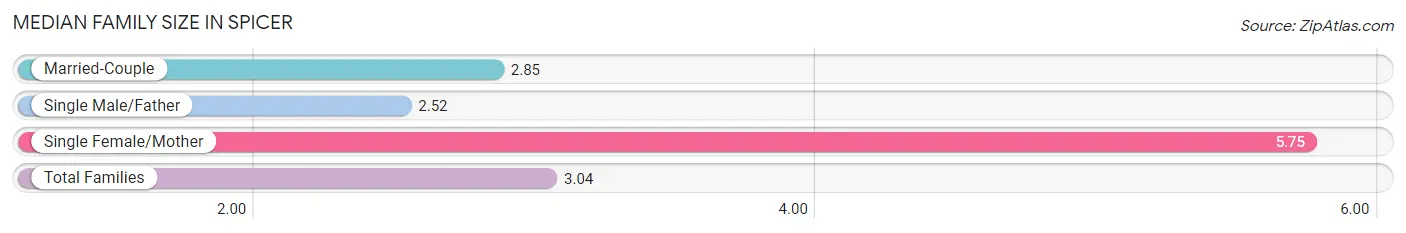
| Family Type | # Families | Family Size |
| Married-Couple | 227 (84.7%) | 2.85 |
| Single Male/Father | 21 (7.8%) | 2.52 |
| Single Female/Mother | 20 (7.5%) | 5.75 |
| Total Families | 268 (100.0%) | 3.04 |
Median Household Size in Spicer
The median household size in Spicer is 2.22 persons per household, with single female/mother households (20 | 3.8%) accounting for the largest median household size of 6.85 persons per household. non-family households (254 | 48.7%) represent the smallest median household size with 1.26 persons per household.
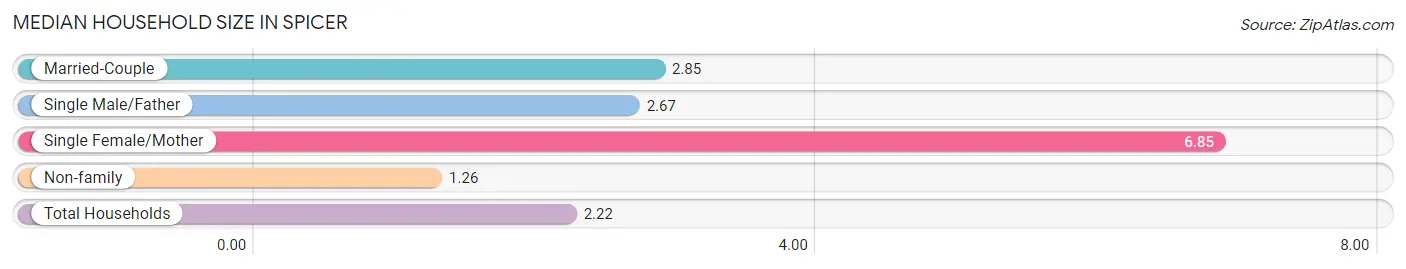
| Household Type | # Households | Household Size |
| Married-Couple | 227 (43.5%) | 2.85 |
| Single Male/Father | 21 (4.0%) | 2.67 |
| Single Female/Mother | 20 (3.8%) | 6.85 |
| Non-family | 254 (48.7%) | 1.26 |
| Total Households | 522 (100.0%) | 2.22 |
Household Size by Marriage Status in Spicer
Out of a total of 522 households in Spicer, 268 (51.3%) are family households, while 254 (48.7%) are nonfamily households. The most numerous type of family households are 2-person households, comprising 148, and the most common type of nonfamily households are 1-person households, comprising 231.
| Household Size | Family Households | Nonfamily Households |
| 1-Person Households | - | 231 (44.3%) |
| 2-Person Households | 148 (28.3%) | 19 (3.6%) |
| 3-Person Households | 37 (7.1%) | 2 (0.4%) |
| 4-Person Households | 49 (9.4%) | 0 (0.0%) |
| 5-Person Households | 30 (5.8%) | 0 (0.0%) |
| 6-Person Households | 4 (0.8%) | 2 (0.4%) |
| 7+ Person Households | 0 (0.0%) | 0 (0.0%) |
| Total | 268 (51.3%) | 254 (48.7%) |
Female Fertility in Spicer
Fertility by Age in Spicer
Average fertility rate in Spicer is 34.0 births per 1,000 women. Women in the age bracket of 20 to 34 years have the highest fertility rate with 125.0 births per 1,000 women. Women in the age bracket of 20 to 34 years acount for 100.0% of all women with births.
| Age Bracket | Women with Births | Births / 1,000 Women |
| 15 to 19 years | 0 (0.0%) | 0.0 |
| 20 to 34 years | 8 (100.0%) | 125.0 |
| 35 to 50 years | 0 (0.0%) | 0.0 |
| Total | 8 (100.0%) | 34.0 |
Fertility by Age by Marriage Status in Spicer
62.5% of women with births (8) in Spicer are married. The highest percentage of unmarried women with births falls into 20 to 34 years age bracket with 37.5% of them unmarried at the time of birth, while the lowest percentage of unmarried women with births belong to 20 to 34 years age bracket with 37.5% of them unmarried.
| Age Bracket | Married | Unmarried |
| 15 to 19 years | 0 (0.0%) | 0 (0.0%) |
| 20 to 34 years | 5 (62.5%) | 3 (37.5%) |
| 35 to 50 years | 0 (0.0%) | 0 (0.0%) |
| Total | 5 (62.5%) | 3 (37.5%) |
Fertility by Education in Spicer
| Educational Attainment | Women with Births | Births / 1,000 Women |
| Less than High School | 0 (0.0%) | 0.0 |
| High School Diploma | 0 (0.0%) | 0.0 |
| College or Associate's Degree | 8 (100.0%) | 98.0 |
| Bachelor's Degree | 0 (0.0%) | 0.0 |
| Graduate Degree | 0 (0.0%) | 0.0 |
| Total | 8 (100.0%) | 34.0 |
Fertility by Education by Marriage Status in Spicer
37.5% of women with births in Spicer are unmarried. Women with the educational attainment of college or associate's degree are most likely to be married with 62.5% of them married at childbirth, while women with the educational attainment of college or associate's degree are least likely to be married with 37.5% of them unmarried at childbirth.
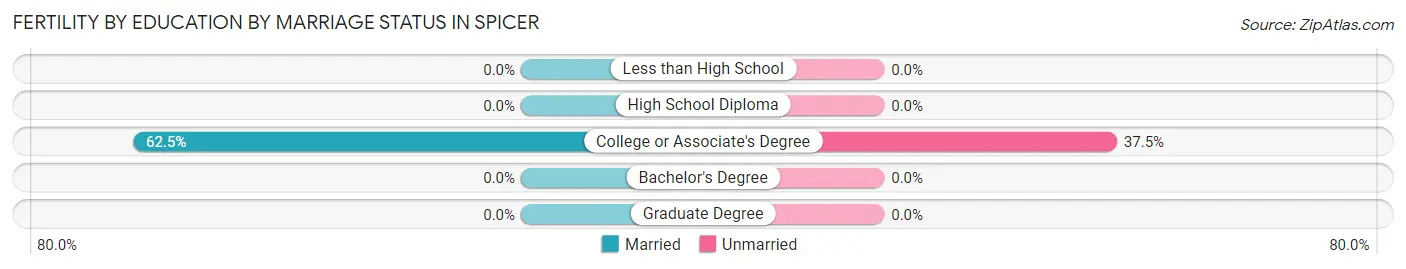
| Educational Attainment | Married | Unmarried |
| Less than High School | 0 (0.0%) | 0 (0.0%) |
| High School Diploma | 0 (0.0%) | 0 (0.0%) |
| College or Associate's Degree | 5 (62.5%) | 3 (37.5%) |
| Bachelor's Degree | 0 (0.0%) | 0 (0.0%) |
| Graduate Degree | 0 (0.0%) | 0 (0.0%) |
| Total | 5 (62.5%) | 3 (37.5%) |
Employment Characteristics in Spicer
Employment by Class of Employer in Spicer
Among the 684 employed individuals in Spicer, private company employees (446 | 65.2%), not-for-profit organizations (102 | 14.9%), and self-employed (not incorporated) (33 | 4.8%) make up the most common classes of employment.
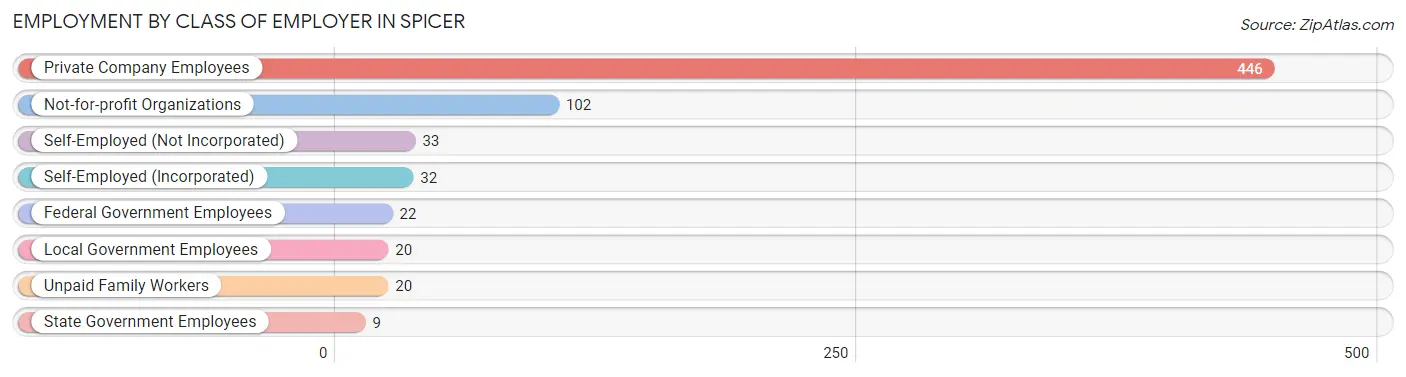
| Employer Class | # Employees | % Employees |
| Private Company Employees | 446 | 65.2% |
| Self-Employed (Incorporated) | 32 | 4.7% |
| Self-Employed (Not Incorporated) | 33 | 4.8% |
| Not-for-profit Organizations | 102 | 14.9% |
| Local Government Employees | 20 | 2.9% |
| State Government Employees | 9 | 1.3% |
| Federal Government Employees | 22 | 3.2% |
| Unpaid Family Workers | 20 | 2.9% |
| Total | 684 | 100.0% |
Employment Status by Age in Spicer
According to the labor force statistics for Spicer, out of the total population over 16 years of age (1,011), 71.0% or 718 individuals are in the labor force, with 1.9% or 14 of them unemployed. The age group with the highest labor force participation rate is 20 to 24 years, with 100.0% or 69 individuals in the labor force. Within the labor force, the 65 to 74 years age range has the highest percentage of unemployed individuals, with 11.1% or 3 of them being unemployed.
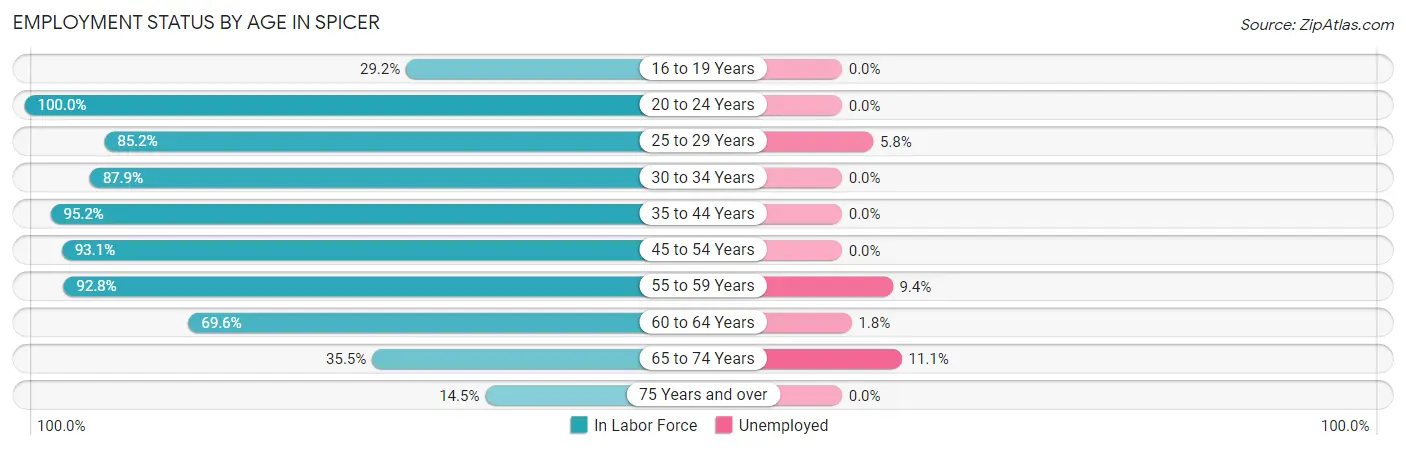
| Age Bracket | In Labor Force | Unemployed |
| 16 to 19 Years | 21 (29.2%) | 0 (0.0%) |
| 20 to 24 Years | 69 (100.0%) | 0 (0.0%) |
| 25 to 29 Years | 52 (85.2%) | 3 (5.8%) |
| 30 to 34 Years | 29 (87.9%) | 0 (0.0%) |
| 35 to 44 Years | 139 (95.2%) | 0 (0.0%) |
| 45 to 54 Years | 189 (93.1%) | 0 (0.0%) |
| 55 to 59 Years | 64 (92.8%) | 6 (9.4%) |
| 60 to 64 Years | 110 (69.6%) | 2 (1.8%) |
| 65 to 74 Years | 27 (35.5%) | 3 (11.1%) |
| 75 Years and over | 18 (14.5%) | 0 (0.0%) |
| Total | 718 (71.0%) | 14 (1.9%) |
Employment Status by Educational Attainment in Spicer
According to labor force statistics for Spicer, 87.0% of individuals (583) out of the total population between 25 and 64 years of age (670) are in the labor force, with 1.9% or 11 of them being unemployed. The group with the highest labor force participation rate are those with the educational attainment of less than high school, with 100.0% or 10 individuals in the labor force. Within the labor force, individuals with high school diploma education have the highest percentage of unemployment, with 4.8% or 6 of them being unemployed.
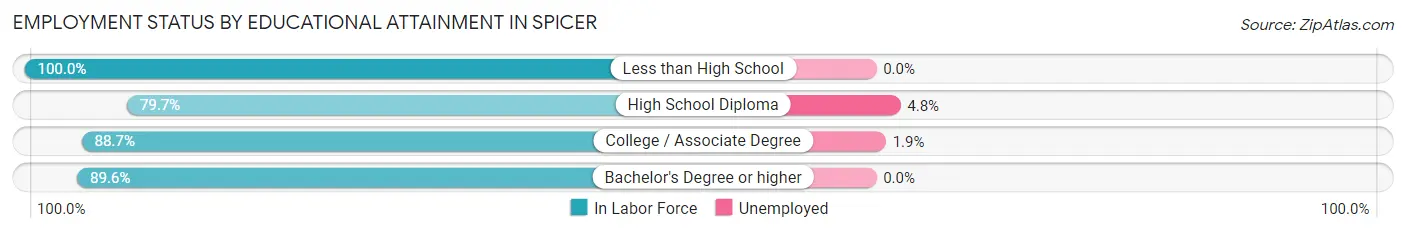
| Educational Attainment | In Labor Force | Unemployed |
| Less than High School | 10 (100.0%) | 0 (0.0%) |
| High School Diploma | 126 (79.7%) | 8 (4.8%) |
| College / Associate Degree | 267 (88.7%) | 6 (1.9%) |
| Bachelor's Degree or higher | 180 (89.6%) | 0 (0.0%) |
| Total | 583 (87.0%) | 13 (1.9%) |
Employment Occupations by Sex in Spicer
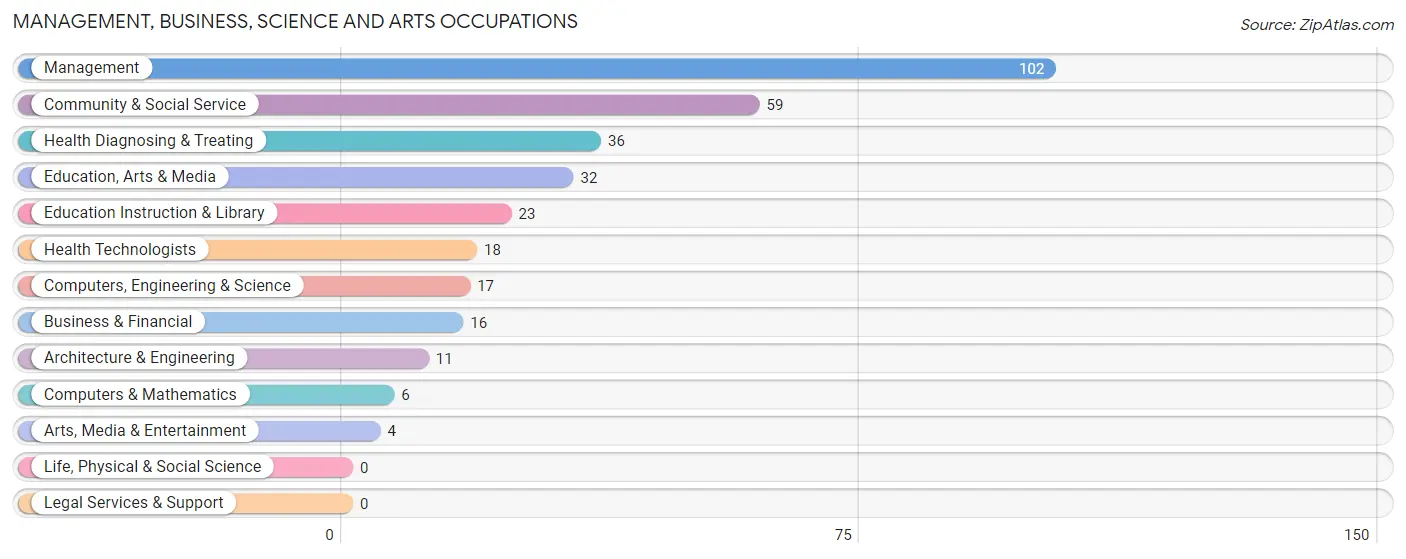
Management, Business, Science and Arts Occupations
The most common Management, Business, Science and Arts occupations in Spicer are Management (102 | 14.5%), Community & Social Service (59 | 8.4%), Health Diagnosing & Treating (36 | 5.1%), Education, Arts & Media (32 | 4.5%), and Education Instruction & Library (23 | 3.3%).
Management, Business, Science and Arts Occupations by Sex
Within the Management, Business, Science and Arts occupations in Spicer, the most male-oriented occupations are Architecture & Engineering (100.0%), Arts, Media & Entertainment (100.0%), and Education, Arts & Media (75.0%), while the most female-oriented occupations are Computers & Mathematics (100.0%), Education Instruction & Library (78.3%), and Health Diagnosing & Treating (69.4%).
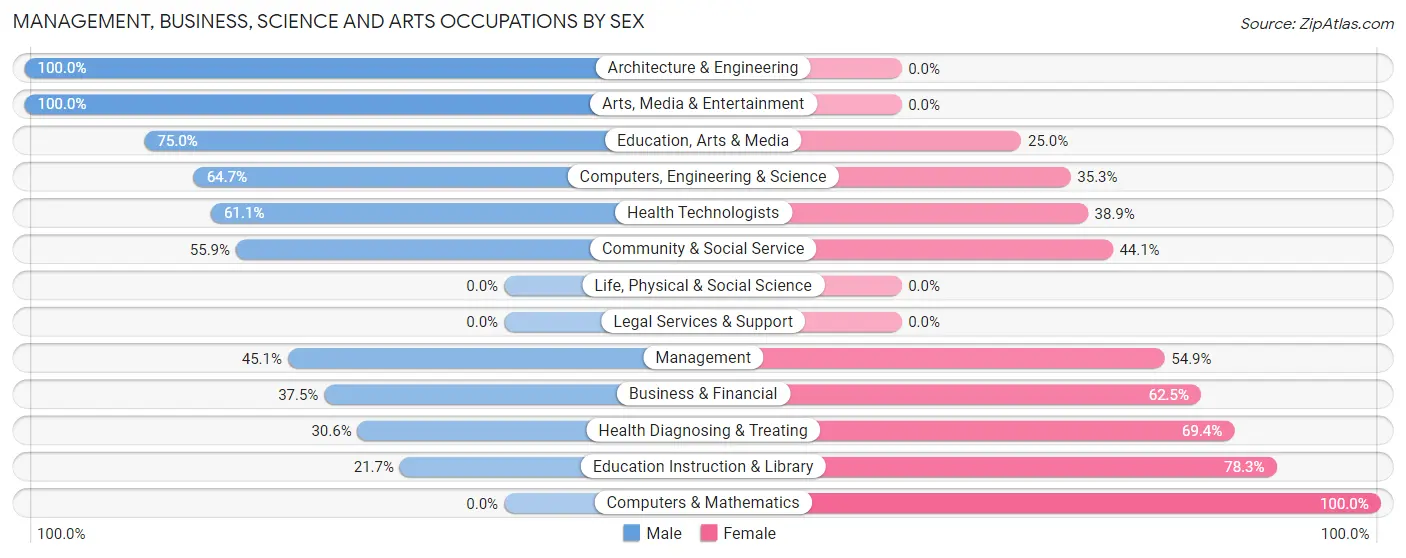
| Occupation | Male | Female |
| Management | 46 (45.1%) | 56 (54.9%) |
| Business & Financial | 6 (37.5%) | 10 (62.5%) |
| Computers, Engineering & Science | 11 (64.7%) | 6 (35.3%) |
| Computers & Mathematics | 0 (0.0%) | 6 (100.0%) |
| Architecture & Engineering | 11 (100.0%) | 0 (0.0%) |
| Life, Physical & Social Science | 0 (0.0%) | 0 (0.0%) |
| Community & Social Service | 33 (55.9%) | 26 (44.1%) |
| Education, Arts & Media | 24 (75.0%) | 8 (25.0%) |
| Legal Services & Support | 0 (0.0%) | 0 (0.0%) |
| Education Instruction & Library | 5 (21.7%) | 18 (78.3%) |
| Arts, Media & Entertainment | 4 (100.0%) | 0 (0.0%) |
| Health Diagnosing & Treating | 11 (30.6%) | 25 (69.4%) |
| Health Technologists | 11 (61.1%) | 7 (38.9%) |
| Total (Category) | 107 (46.5%) | 123 (53.5%) |
| Total (Overall) | 418 (59.4%) | 286 (40.6%) |
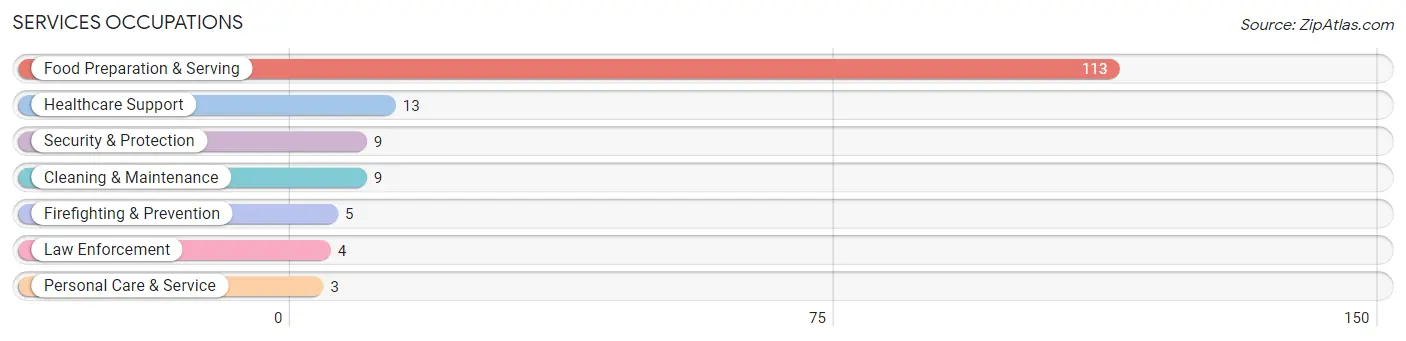
Services Occupations
The most common Services occupations in Spicer are Food Preparation & Serving (113 | 16.1%), Healthcare Support (13 | 1.8%), Security & Protection (9 | 1.3%), Cleaning & Maintenance (9 | 1.3%), and Firefighting & Prevention (5 | 0.7%).
Services Occupations by Sex
Within the Services occupations in Spicer, the most male-oriented occupations are Security & Protection (100.0%), Firefighting & Prevention (100.0%), and Law Enforcement (100.0%), while the most female-oriented occupations are Healthcare Support (100.0%), Personal Care & Service (100.0%), and Food Preparation & Serving (34.5%).
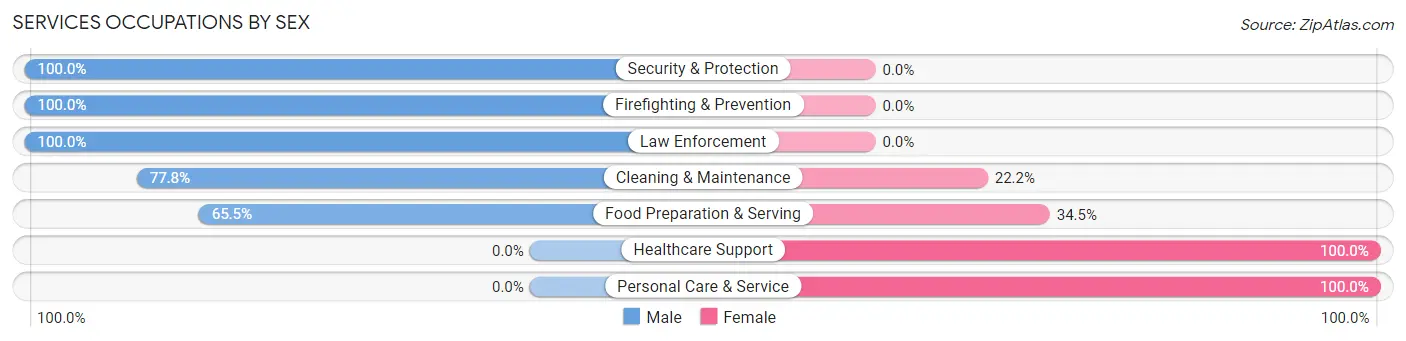
| Occupation | Male | Female |
| Healthcare Support | 0 (0.0%) | 13 (100.0%) |
| Security & Protection | 9 (100.0%) | 0 (0.0%) |
| Firefighting & Prevention | 5 (100.0%) | 0 (0.0%) |
| Law Enforcement | 4 (100.0%) | 0 (0.0%) |
| Food Preparation & Serving | 74 (65.5%) | 39 (34.5%) |
| Cleaning & Maintenance | 7 (77.8%) | 2 (22.2%) |
| Personal Care & Service | 0 (0.0%) | 3 (100.0%) |
| Total (Category) | 90 (61.2%) | 57 (38.8%) |
| Total (Overall) | 418 (59.4%) | 286 (40.6%) |
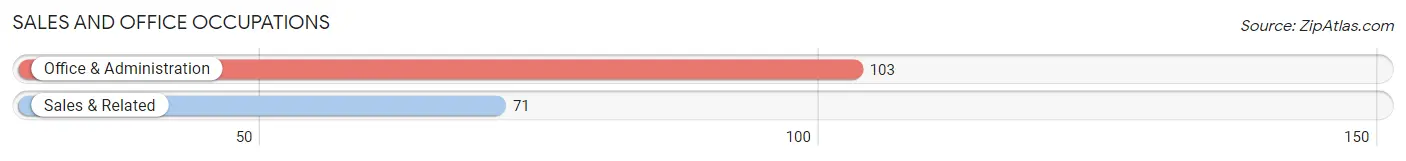
Sales and Office Occupations
The most common Sales and Office occupations in Spicer are Office & Administration (103 | 14.6%), and Sales & Related (71 | 10.1%).
Sales and Office Occupations by Sex
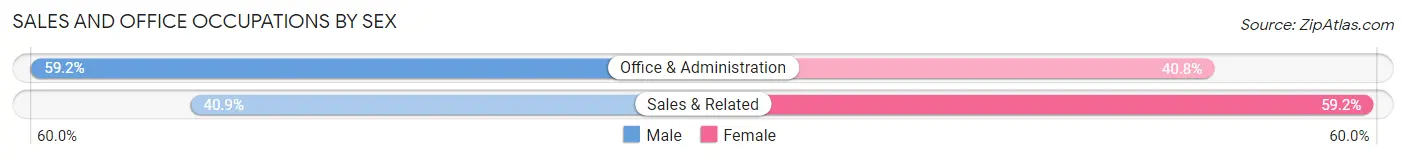
| Occupation | Male | Female |
| Sales & Related | 29 (40.8%) | 42 (59.2%) |
| Office & Administration | 61 (59.2%) | 42 (40.8%) |
| Total (Category) | 90 (51.7%) | 84 (48.3%) |
| Total (Overall) | 418 (59.4%) | 286 (40.6%) |
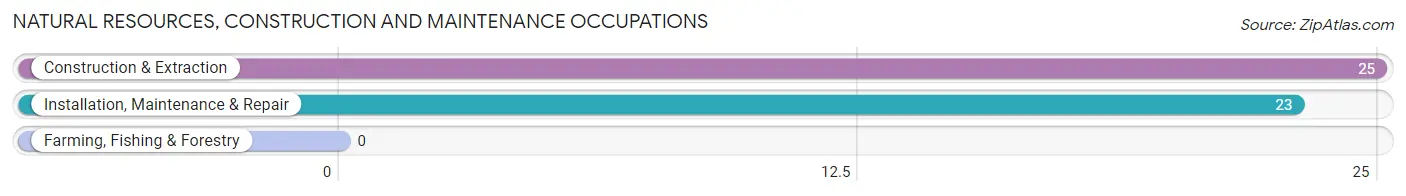
Natural Resources, Construction and Maintenance Occupations
The most common Natural Resources, Construction and Maintenance occupations in Spicer are Construction & Extraction (25 | 3.5%), and Installation, Maintenance & Repair (23 | 3.3%).
Natural Resources, Construction and Maintenance Occupations by Sex
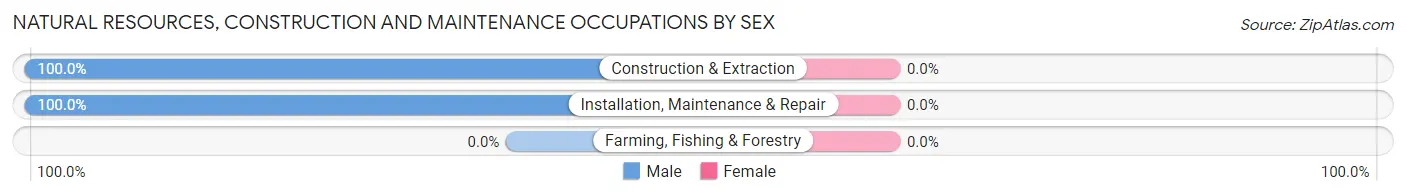
| Occupation | Male | Female |
| Farming, Fishing & Forestry | 0 (0.0%) | 0 (0.0%) |
| Construction & Extraction | 25 (100.0%) | 0 (0.0%) |
| Installation, Maintenance & Repair | 23 (100.0%) | 0 (0.0%) |
| Total (Category) | 48 (100.0%) | 0 (0.0%) |
| Total (Overall) | 418 (59.4%) | 286 (40.6%) |
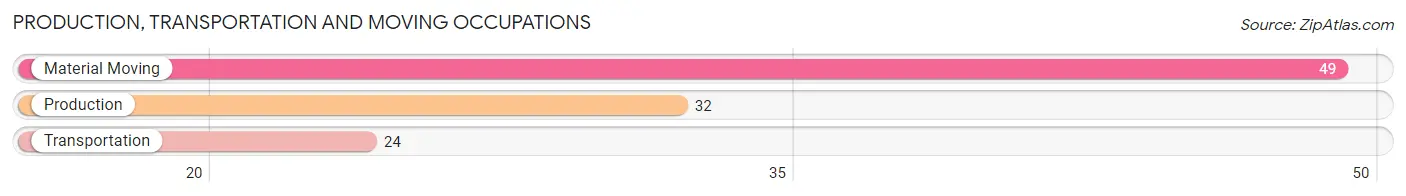
Production, Transportation and Moving Occupations
The most common Production, Transportation and Moving occupations in Spicer are Material Moving (49 | 7.0%), Production (32 | 4.5%), and Transportation (24 | 3.4%).
Production, Transportation and Moving Occupations by Sex
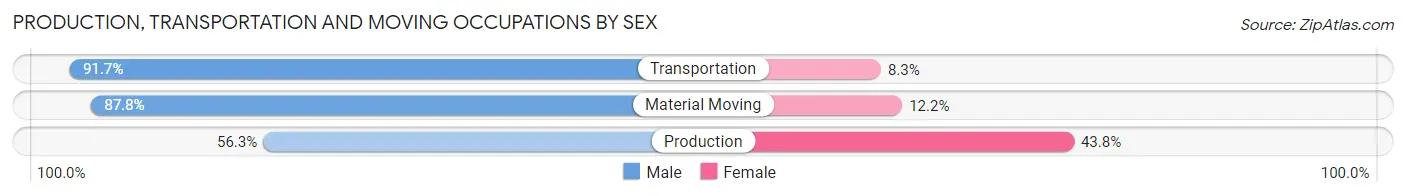
| Occupation | Male | Female |
| Production | 18 (56.2%) | 14 (43.8%) |
| Transportation | 22 (91.7%) | 2 (8.3%) |
| Material Moving | 43 (87.8%) | 6 (12.2%) |
| Total (Category) | 83 (79.0%) | 22 (20.9%) |
| Total (Overall) | 418 (59.4%) | 286 (40.6%) |
Employment Industries by Sex in Spicer
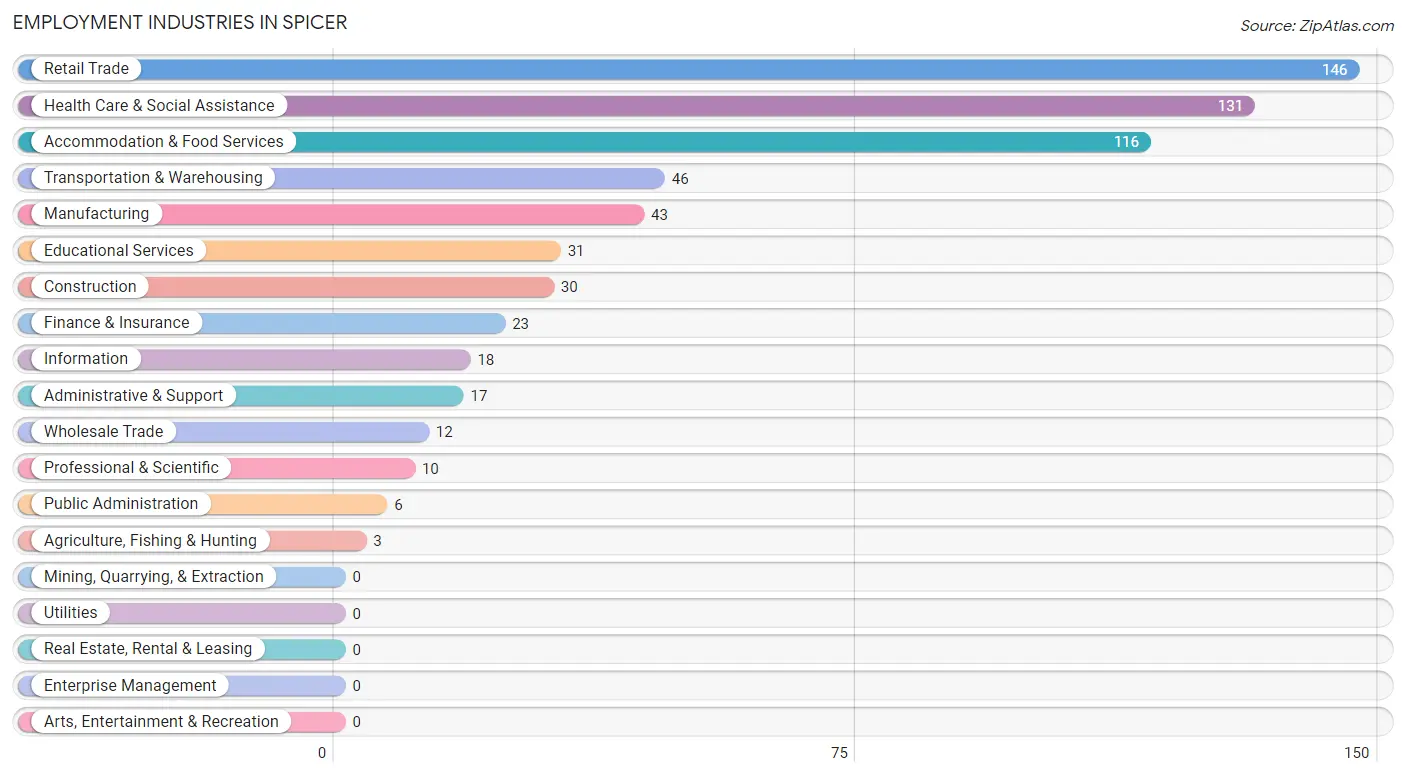
Employment Industries in Spicer
The major employment industries in Spicer include Retail Trade (146 | 20.7%), Health Care & Social Assistance (131 | 18.6%), Accommodation & Food Services (116 | 16.5%), Transportation & Warehousing (46 | 6.5%), and Manufacturing (43 | 6.1%).
Employment Industries by Sex in Spicer
The Spicer industries that see more men than women are Agriculture, Fishing & Hunting (100.0%), Wholesale Trade (100.0%), and Professional & Scientific (100.0%), whereas the industries that tend to have a higher number of women are Health Care & Social Assistance (75.6%), Educational Services (71.0%), and Finance & Insurance (43.5%).
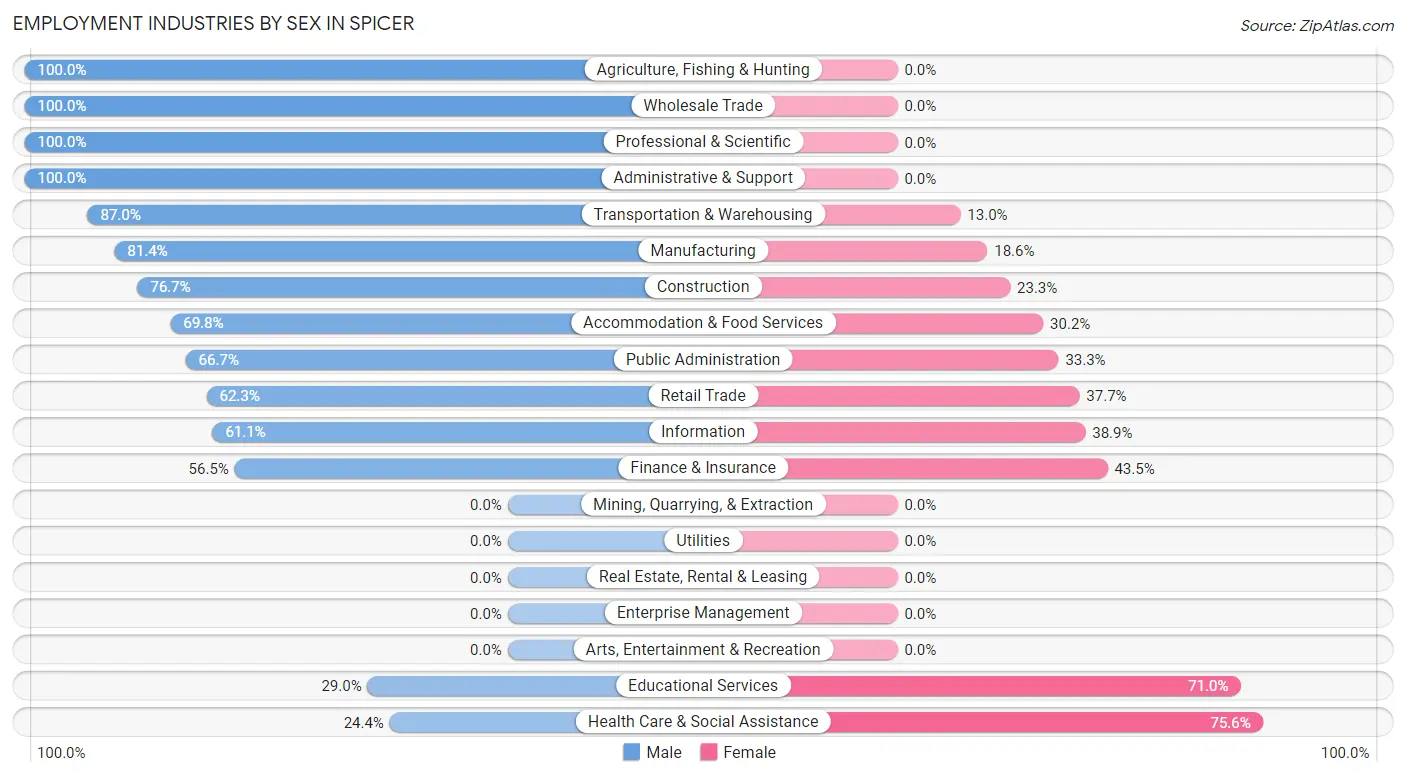
| Industry | Male | Female |
| Agriculture, Fishing & Hunting | 3 (100.0%) | 0 (0.0%) |
| Mining, Quarrying, & Extraction | 0 (0.0%) | 0 (0.0%) |
| Construction | 23 (76.7%) | 7 (23.3%) |
| Manufacturing | 35 (81.4%) | 8 (18.6%) |
| Wholesale Trade | 12 (100.0%) | 0 (0.0%) |
| Retail Trade | 91 (62.3%) | 55 (37.7%) |
| Transportation & Warehousing | 40 (87.0%) | 6 (13.0%) |
| Utilities | 0 (0.0%) | 0 (0.0%) |
| Information | 11 (61.1%) | 7 (38.9%) |
| Finance & Insurance | 13 (56.5%) | 10 (43.5%) |
| Real Estate, Rental & Leasing | 0 (0.0%) | 0 (0.0%) |
| Professional & Scientific | 10 (100.0%) | 0 (0.0%) |
| Enterprise Management | 0 (0.0%) | 0 (0.0%) |
| Administrative & Support | 17 (100.0%) | 0 (0.0%) |
| Educational Services | 9 (29.0%) | 22 (71.0%) |
| Health Care & Social Assistance | 32 (24.4%) | 99 (75.6%) |
| Arts, Entertainment & Recreation | 0 (0.0%) | 0 (0.0%) |
| Accommodation & Food Services | 81 (69.8%) | 35 (30.2%) |
| Public Administration | 4 (66.7%) | 2 (33.3%) |
| Total | 418 (59.4%) | 286 (40.6%) |
Education in Spicer
School Enrollment in Spicer
The most common levels of schooling among the 220 students in Spicer are high school (70 | 31.8%), middle school (59 | 26.8%), and elementary school (34 | 15.4%).
| School Level | # Students | % Students |
| Nursery / Preschool | 10 | 4.5% |
| Kindergarten | 16 | 7.3% |
| Elementary School | 34 | 15.4% |
| Middle School | 59 | 26.8% |
| High School | 70 | 31.8% |
| College / Undergraduate | 24 | 10.9% |
| Graduate / Professional | 7 | 3.2% |
| Total | 220 | 100.0% |
School Enrollment by Age by Funding Source in Spicer
Out of a total of 220 students who are enrolled in schools in Spicer, 24 (10.9%) attend a private institution, while the remaining 196 (89.1%) are enrolled in public schools. The age group of 3 to 4 year olds has the highest likelihood of being enrolled in private schools, with 3 (100.0% in the age bracket) enrolled. Conversely, the age group of 15 to 17 year olds has the lowest likelihood of being enrolled in a private school, with 58 (100.0% in the age bracket) attending a public institution.
| Age Bracket | Public School | Private School |
| 3 to 4 Year Olds | 0 (0.0%) | 3 (100.0%) |
| 5 to 9 Year Old | 46 (86.8%) | 7 (13.2%) |
| 10 to 14 Year Olds | 68 (90.7%) | 7 (9.3%) |
| 15 to 17 Year Olds | 58 (100.0%) | 0 (0.0%) |
| 18 to 19 Year Olds | 10 (100.0%) | 0 (0.0%) |
| 20 to 24 Year Olds | 11 (100.0%) | 0 (0.0%) |
| 25 to 34 Year Olds | 0 (0.0%) | 0 (0.0%) |
| 35 Years and over | 3 (30.0%) | 7 (70.0%) |
| Total | 196 (89.1%) | 24 (10.9%) |
Educational Attainment by Field of Study in Spicer
Business (56 | 23.1%), physical & health sciences (43 | 17.8%), education (43 | 17.8%), science & technology (21 | 8.7%), and bio, nature & agricultural (16 | 6.6%) are the most common fields of study among 242 individuals in Spicer who have obtained a bachelor's degree or higher.
| Field of Study | # Graduates | % Graduates |
| Computers & Mathematics | 3 | 1.2% |
| Bio, Nature & Agricultural | 16 | 6.6% |
| Physical & Health Sciences | 43 | 17.8% |
| Psychology | 0 | 0.0% |
| Social Sciences | 12 | 5.0% |
| Engineering | 4 | 1.7% |
| Multidisciplinary Studies | 0 | 0.0% |
| Science & Technology | 21 | 8.7% |
| Business | 56 | 23.1% |
| Education | 43 | 17.8% |
| Literature & Languages | 15 | 6.2% |
| Liberal Arts & History | 3 | 1.2% |
| Visual & Performing Arts | 12 | 5.0% |
| Communications | 3 | 1.2% |
| Arts & Humanities | 11 | 4.5% |
| Total | 242 | 100.0% |
Transportation & Commute in Spicer
Vehicle Availability by Sex in Spicer
The most prevalent vehicle ownership categories in Spicer are males with 2 vehicles (236, accounting for 57.0%) and females with 2 vehicles (115, making up 93.6%).
| Vehicles Available | Male | Female |
| No Vehicle | 6 (1.5%) | 5 (2.0%) |
| 1 Vehicle | 41 (9.9%) | 56 (22.2%) |
| 2 Vehicles | 236 (57.0%) | 115 (45.6%) |
| 3 Vehicles | 106 (25.6%) | 62 (24.6%) |
| 4 Vehicles | 19 (4.6%) | 10 (4.0%) |
| 5 or more Vehicles | 6 (1.5%) | 4 (1.6%) |
| Total | 414 (100.0%) | 252 (100.0%) |
Commute Time in Spicer
The most frequently occuring commute durations in Spicer are 15 to 19 minutes (147 commuters, 22.3%), 20 to 24 minutes (147 commuters, 22.3%), and less than 5 minutes (138 commuters, 21.0%).
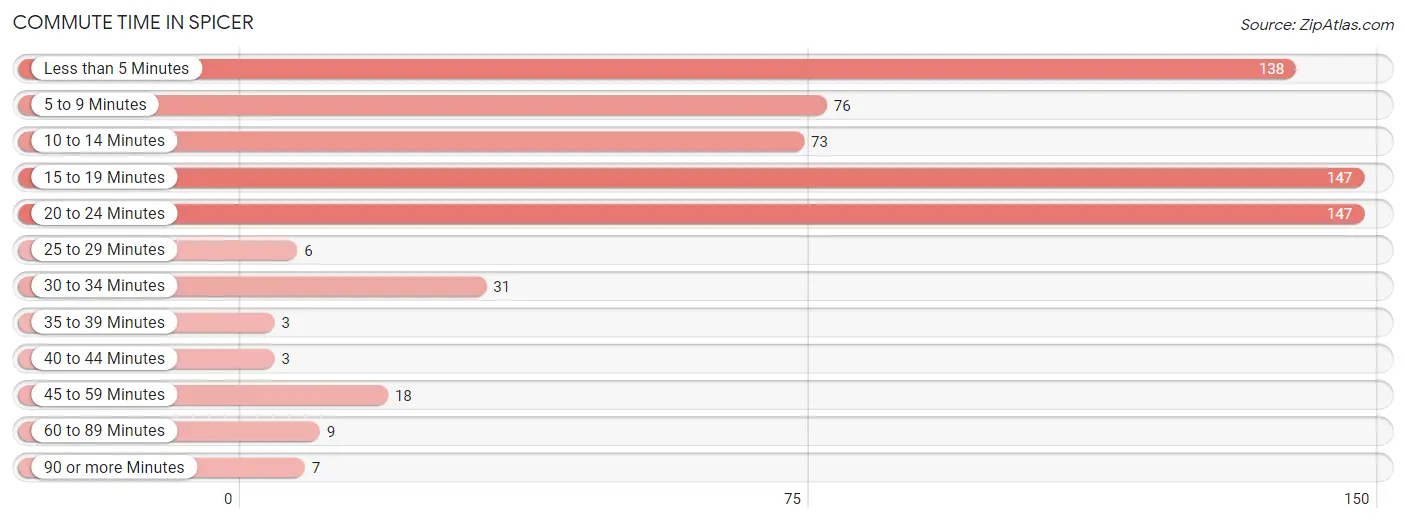
| Commute Time | # Commuters | % Commuters |
| Less than 5 Minutes | 138 | 21.0% |
| 5 to 9 Minutes | 76 | 11.6% |
| 10 to 14 Minutes | 73 | 11.1% |
| 15 to 19 Minutes | 147 | 22.3% |
| 20 to 24 Minutes | 147 | 22.3% |
| 25 to 29 Minutes | 6 | 0.9% |
| 30 to 34 Minutes | 31 | 4.7% |
| 35 to 39 Minutes | 3 | 0.5% |
| 40 to 44 Minutes | 3 | 0.5% |
| 45 to 59 Minutes | 18 | 2.7% |
| 60 to 89 Minutes | 9 | 1.4% |
| 90 or more Minutes | 7 | 1.1% |
Commute Time by Sex in Spicer
The most common commute times in Spicer are less than 5 minutes (98 commuters, 24.0%) for males and 20 to 24 minutes (61 commuters, 24.4%) for females.
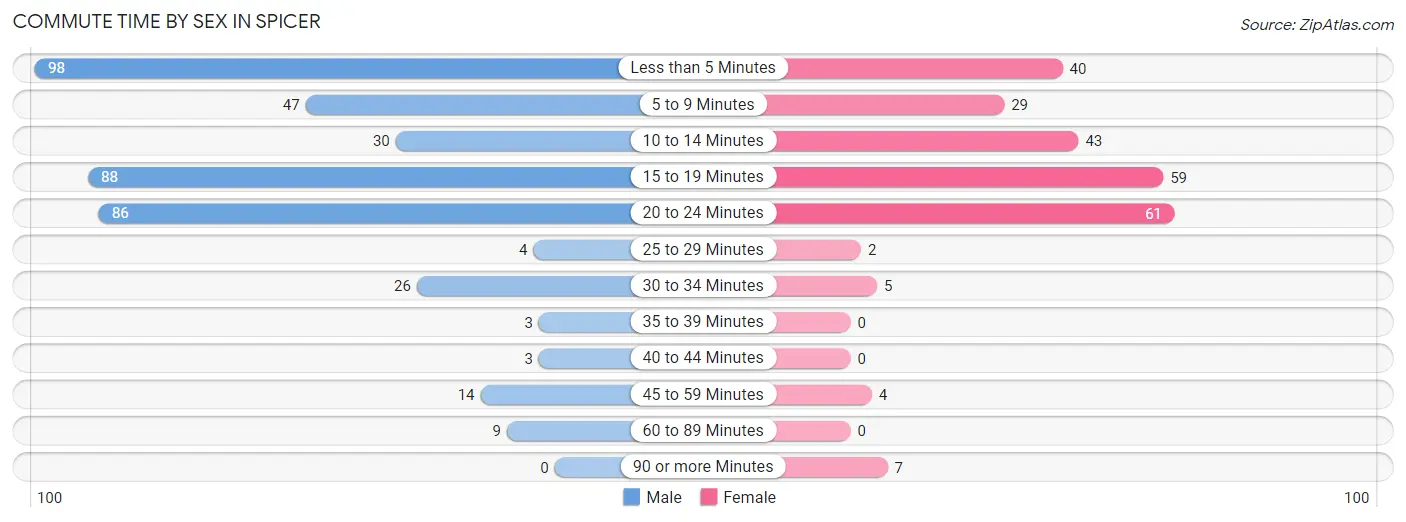
| Commute Time | Male | Female |
| Less than 5 Minutes | 98 (24.0%) | 40 (16.0%) |
| 5 to 9 Minutes | 47 (11.5%) | 29 (11.6%) |
| 10 to 14 Minutes | 30 (7.3%) | 43 (17.2%) |
| 15 to 19 Minutes | 88 (21.6%) | 59 (23.6%) |
| 20 to 24 Minutes | 86 (21.1%) | 61 (24.4%) |
| 25 to 29 Minutes | 4 (1.0%) | 2 (0.8%) |
| 30 to 34 Minutes | 26 (6.4%) | 5 (2.0%) |
| 35 to 39 Minutes | 3 (0.7%) | 0 (0.0%) |
| 40 to 44 Minutes | 3 (0.7%) | 0 (0.0%) |
| 45 to 59 Minutes | 14 (3.4%) | 4 (1.6%) |
| 60 to 89 Minutes | 9 (2.2%) | 0 (0.0%) |
| 90 or more Minutes | 0 (0.0%) | 7 (2.8%) |
Time of Departure to Work by Sex in Spicer
The most frequent times of departure to work in Spicer are 12:00 AM to 4:59 AM (73, 17.9%) for males and 7:30 AM to 7:59 AM (87, 34.8%) for females.
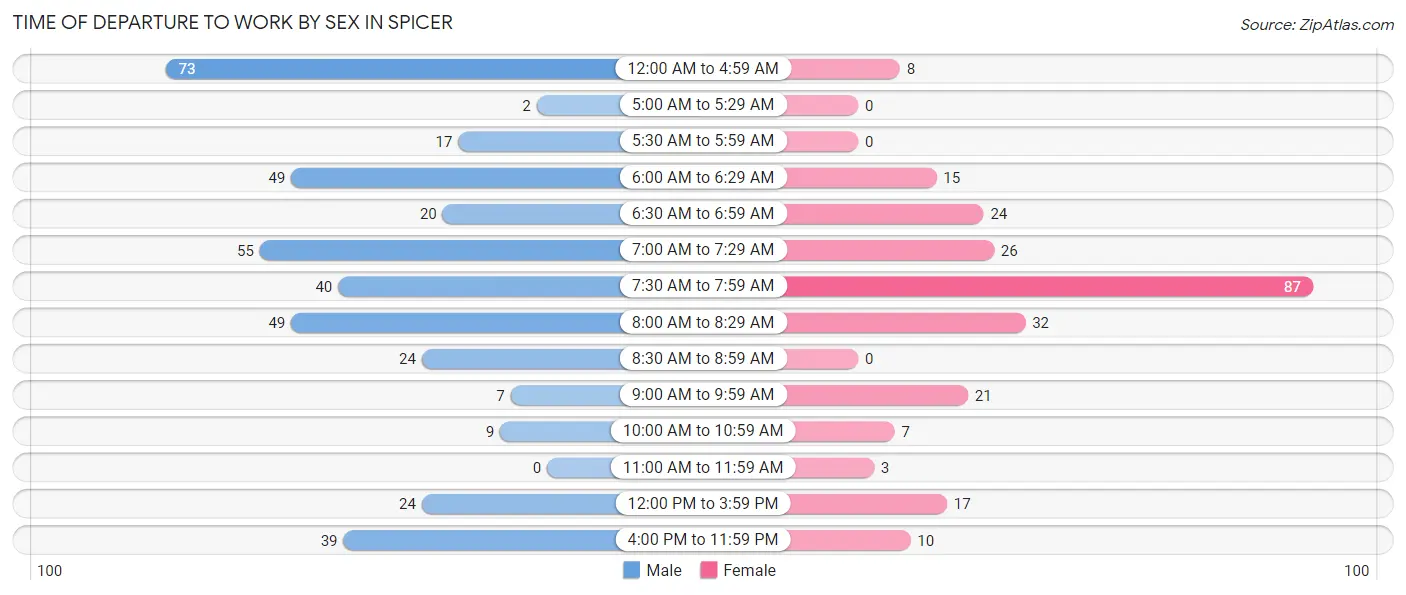
| Time of Departure | Male | Female |
| 12:00 AM to 4:59 AM | 73 (17.9%) | 8 (3.2%) |
| 5:00 AM to 5:29 AM | 2 (0.5%) | 0 (0.0%) |
| 5:30 AM to 5:59 AM | 17 (4.2%) | 0 (0.0%) |
| 6:00 AM to 6:29 AM | 49 (12.0%) | 15 (6.0%) |
| 6:30 AM to 6:59 AM | 20 (4.9%) | 24 (9.6%) |
| 7:00 AM to 7:29 AM | 55 (13.5%) | 26 (10.4%) |
| 7:30 AM to 7:59 AM | 40 (9.8%) | 87 (34.8%) |
| 8:00 AM to 8:29 AM | 49 (12.0%) | 32 (12.8%) |
| 8:30 AM to 8:59 AM | 24 (5.9%) | 0 (0.0%) |
| 9:00 AM to 9:59 AM | 7 (1.7%) | 21 (8.4%) |
| 10:00 AM to 10:59 AM | 9 (2.2%) | 7 (2.8%) |
| 11:00 AM to 11:59 AM | 0 (0.0%) | 3 (1.2%) |
| 12:00 PM to 3:59 PM | 24 (5.9%) | 17 (6.8%) |
| 4:00 PM to 11:59 PM | 39 (9.6%) | 10 (4.0%) |
| Total | 408 (100.0%) | 250 (100.0%) |
Housing Occupancy in Spicer
Occupancy by Ownership in Spicer
Of the total 522 dwellings in Spicer, owner-occupied units account for 361 (69.2%), while renter-occupied units make up 161 (30.8%).
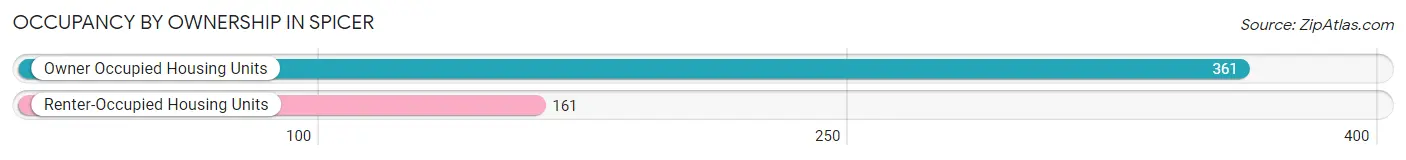
| Occupancy | # Housing Units | % Housing Units |
| Owner Occupied Housing Units | 361 | 69.2% |
| Renter-Occupied Housing Units | 161 | 30.8% |
| Total Occupied Housing Units | 522 | 100.0% |
Occupancy by Household Size in Spicer
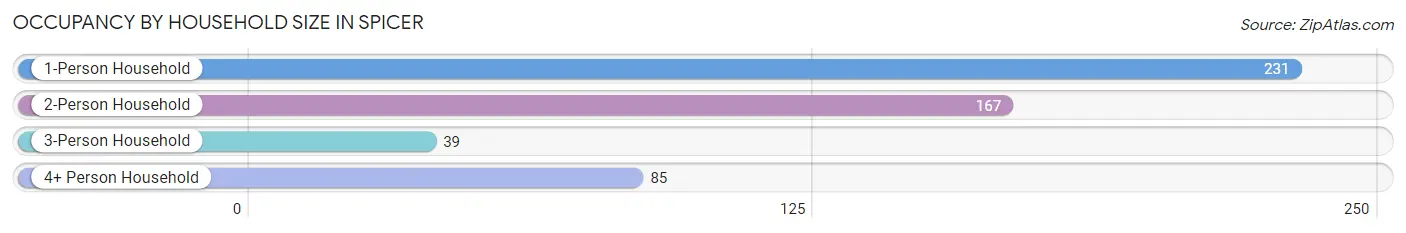
| Household Size | # Housing Units | % Housing Units |
| 1-Person Household | 231 | 44.3% |
| 2-Person Household | 167 | 32.0% |
| 3-Person Household | 39 | 7.5% |
| 4+ Person Household | 85 | 16.3% |
| Total Housing Units | 522 | 100.0% |
Occupancy by Ownership by Household Size in Spicer
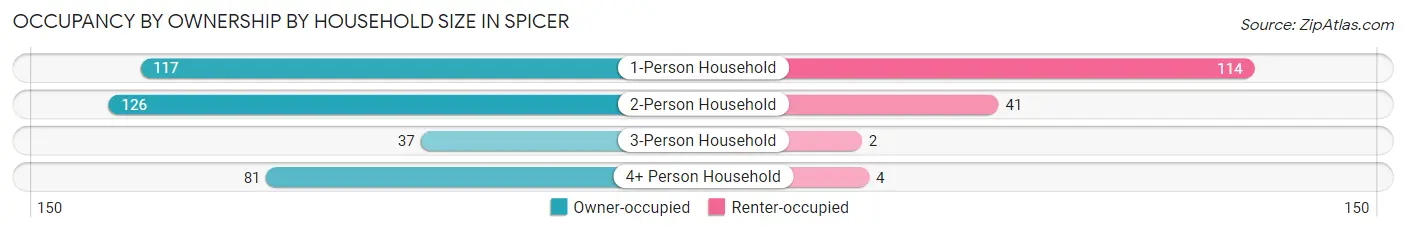
| Household Size | Owner-occupied | Renter-occupied |
| 1-Person Household | 117 (50.6%) | 114 (49.3%) |
| 2-Person Household | 126 (75.4%) | 41 (24.5%) |
| 3-Person Household | 37 (94.9%) | 2 (5.1%) |
| 4+ Person Household | 81 (95.3%) | 4 (4.7%) |
| Total Housing Units | 361 (69.2%) | 161 (30.8%) |
Occupancy by Educational Attainment in Spicer
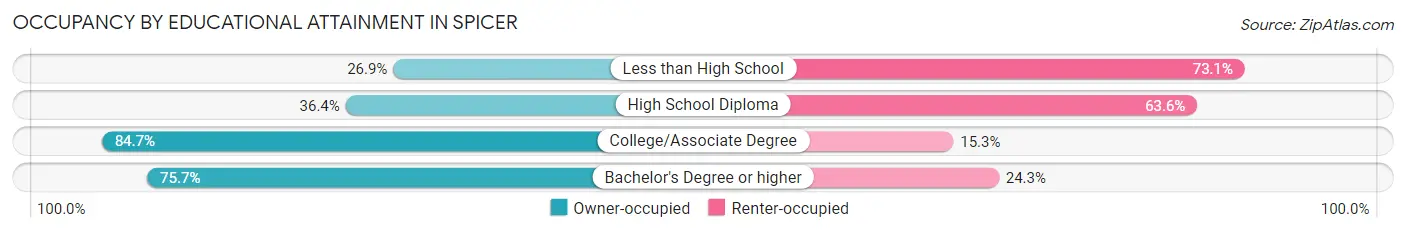
| Household Size | Owner-occupied | Renter-occupied |
| Less than High School | 7 (26.9%) | 19 (73.1%) |
| High School Diploma | 40 (36.4%) | 70 (63.6%) |
| College/Associate Degree | 205 (84.7%) | 37 (15.3%) |
| Bachelor's Degree or higher | 109 (75.7%) | 35 (24.3%) |
Occupancy by Age of Householder in Spicer
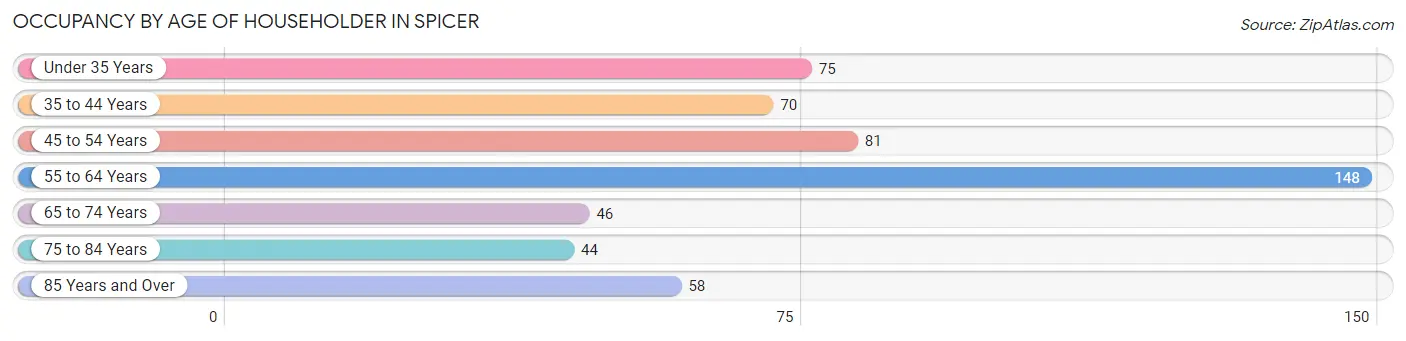
| Age Bracket | # Households | % Households |
| Under 35 Years | 75 | 14.4% |
| 35 to 44 Years | 70 | 13.4% |
| 45 to 54 Years | 81 | 15.5% |
| 55 to 64 Years | 148 | 28.3% |
| 65 to 74 Years | 46 | 8.8% |
| 75 to 84 Years | 44 | 8.4% |
| 85 Years and Over | 58 | 11.1% |
| Total | 522 | 100.0% |
Housing Finances in Spicer
Median Income by Occupancy in Spicer
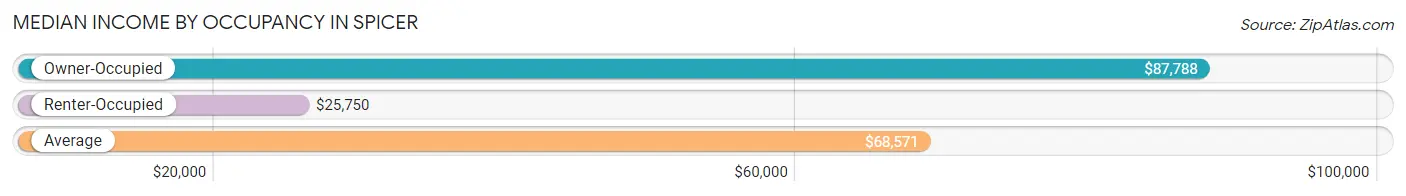
| Occupancy Type | # Households | Median Income |
| Owner-Occupied | 361 (69.2%) | $87,788 |
| Renter-Occupied | 161 (30.8%) | $25,750 |
| Average | 522 (100.0%) | $68,571 |
Occupancy by Householder Income Bracket in Spicer
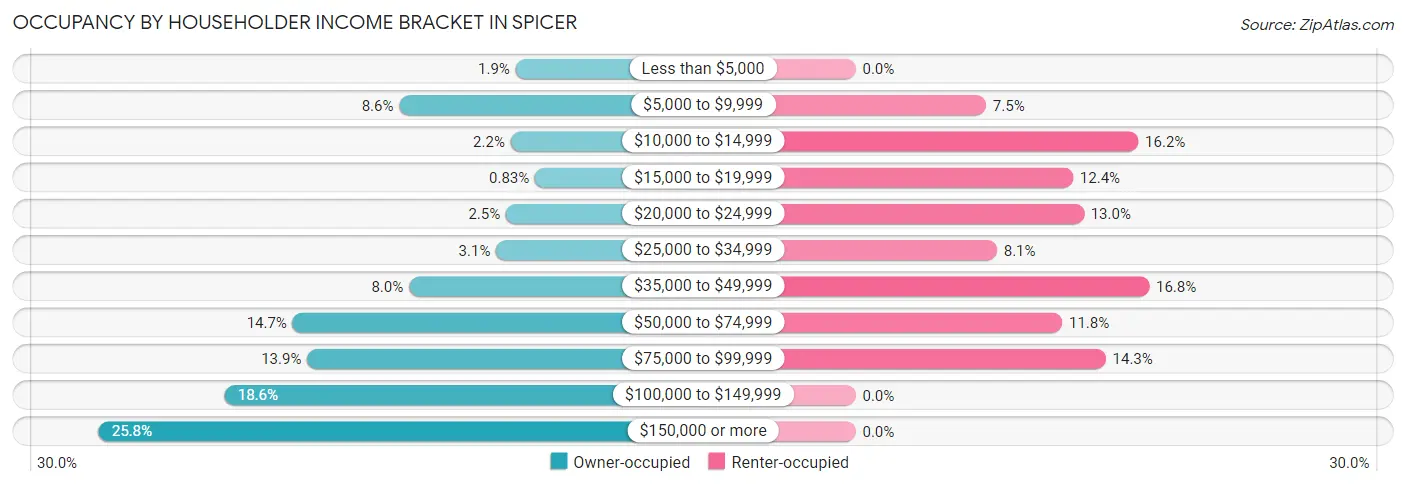
| Income Bracket | Owner-occupied | Renter-occupied |
| Less than $5,000 | 7 (1.9%) | 0 (0.0%) |
| $5,000 to $9,999 | 31 (8.6%) | 12 (7.4%) |
| $10,000 to $14,999 | 8 (2.2%) | 26 (16.2%) |
| $15,000 to $19,999 | 3 (0.8%) | 20 (12.4%) |
| $20,000 to $24,999 | 9 (2.5%) | 21 (13.0%) |
| $25,000 to $34,999 | 11 (3.0%) | 13 (8.1%) |
| $35,000 to $49,999 | 29 (8.0%) | 27 (16.8%) |
| $50,000 to $74,999 | 53 (14.7%) | 19 (11.8%) |
| $75,000 to $99,999 | 50 (13.9%) | 23 (14.3%) |
| $100,000 to $149,999 | 67 (18.6%) | 0 (0.0%) |
| $150,000 or more | 93 (25.8%) | 0 (0.0%) |
| Total | 361 (100.0%) | 161 (100.0%) |
Monthly Housing Cost Tiers in Spicer
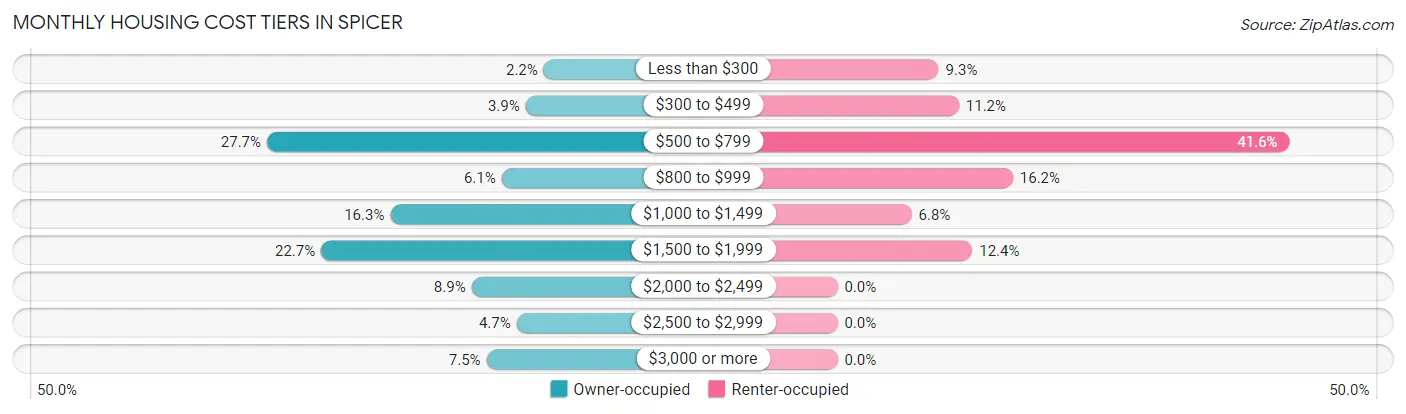
| Monthly Cost | Owner-occupied | Renter-occupied |
| Less than $300 | 8 (2.2%) | 15 (9.3%) |
| $300 to $499 | 14 (3.9%) | 18 (11.2%) |
| $500 to $799 | 100 (27.7%) | 67 (41.6%) |
| $800 to $999 | 22 (6.1%) | 26 (16.2%) |
| $1,000 to $1,499 | 59 (16.3%) | 11 (6.8%) |
| $1,500 to $1,999 | 82 (22.7%) | 20 (12.4%) |
| $2,000 to $2,499 | 32 (8.9%) | 0 (0.0%) |
| $2,500 to $2,999 | 17 (4.7%) | 0 (0.0%) |
| $3,000 or more | 27 (7.5%) | 0 (0.0%) |
| Total | 361 (100.0%) | 161 (100.0%) |
Physical Housing Characteristics in Spicer
Housing Structures in Spicer
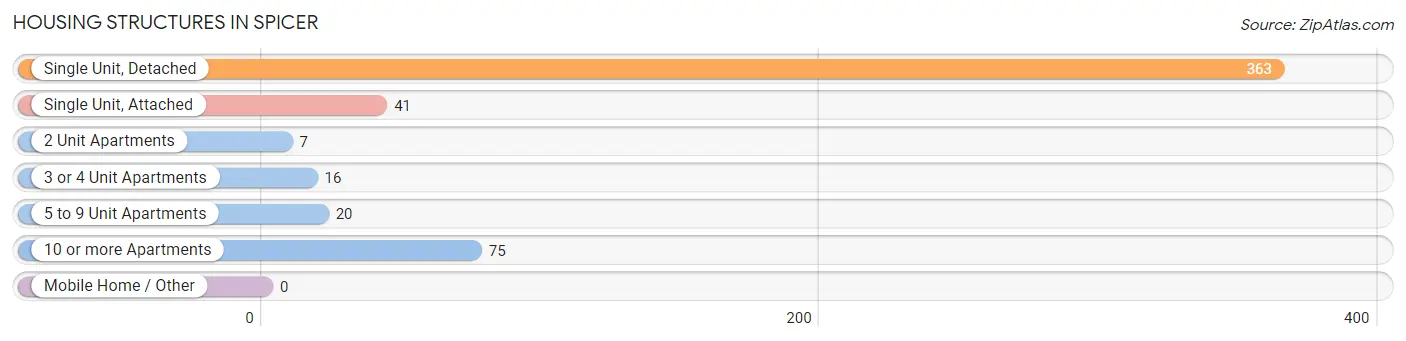
| Structure Type | # Housing Units | % Housing Units |
| Single Unit, Detached | 363 | 69.5% |
| Single Unit, Attached | 41 | 7.9% |
| 2 Unit Apartments | 7 | 1.3% |
| 3 or 4 Unit Apartments | 16 | 3.1% |
| 5 to 9 Unit Apartments | 20 | 3.8% |
| 10 or more Apartments | 75 | 14.4% |
| Mobile Home / Other | 0 | 0.0% |
| Total | 522 | 100.0% |
Housing Structures by Occupancy in Spicer
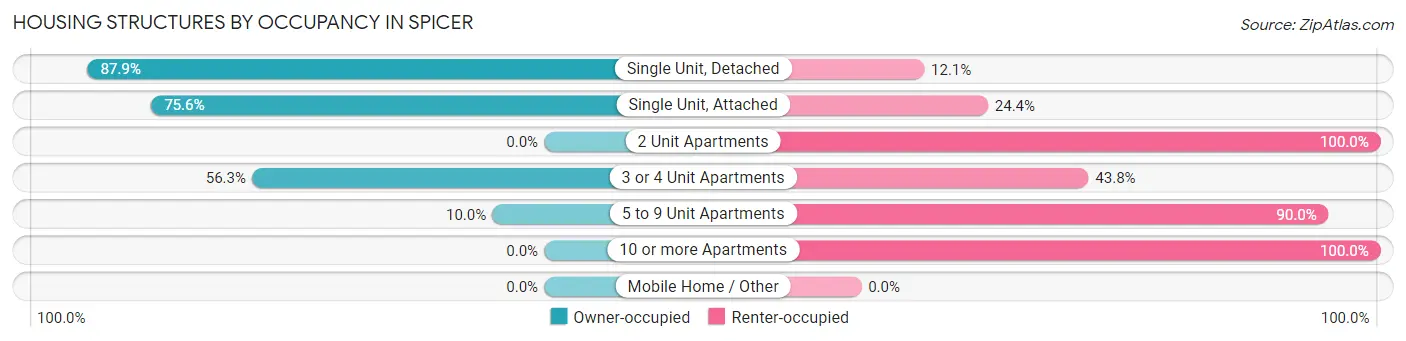
| Structure Type | Owner-occupied | Renter-occupied |
| Single Unit, Detached | 319 (87.9%) | 44 (12.1%) |
| Single Unit, Attached | 31 (75.6%) | 10 (24.4%) |
| 2 Unit Apartments | 0 (0.0%) | 7 (100.0%) |
| 3 or 4 Unit Apartments | 9 (56.2%) | 7 (43.8%) |
| 5 to 9 Unit Apartments | 2 (10.0%) | 18 (90.0%) |
| 10 or more Apartments | 0 (0.0%) | 75 (100.0%) |
| Mobile Home / Other | 0 (0.0%) | 0 (0.0%) |
| Total | 361 (69.2%) | 161 (30.8%) |
Housing Structures by Number of Rooms in Spicer
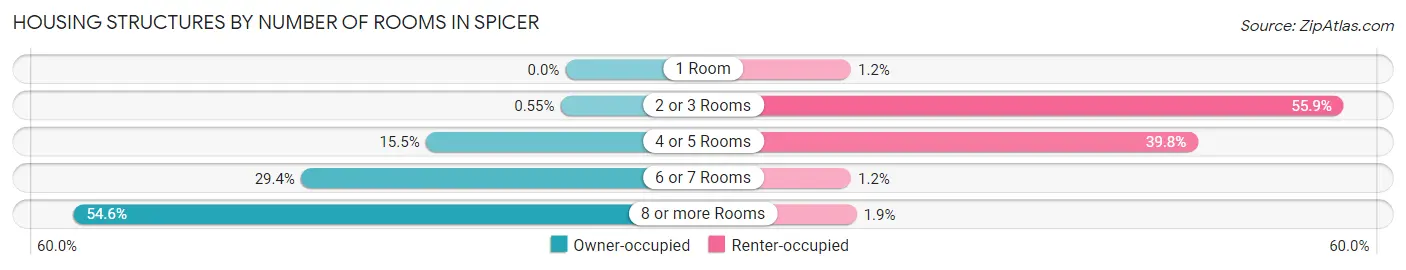
| Number of Rooms | Owner-occupied | Renter-occupied |
| 1 Room | 0 (0.0%) | 2 (1.2%) |
| 2 or 3 Rooms | 2 (0.5%) | 90 (55.9%) |
| 4 or 5 Rooms | 56 (15.5%) | 64 (39.8%) |
| 6 or 7 Rooms | 106 (29.4%) | 2 (1.2%) |
| 8 or more Rooms | 197 (54.6%) | 3 (1.9%) |
| Total | 361 (100.0%) | 161 (100.0%) |
Housing Structure by Heating Type in Spicer
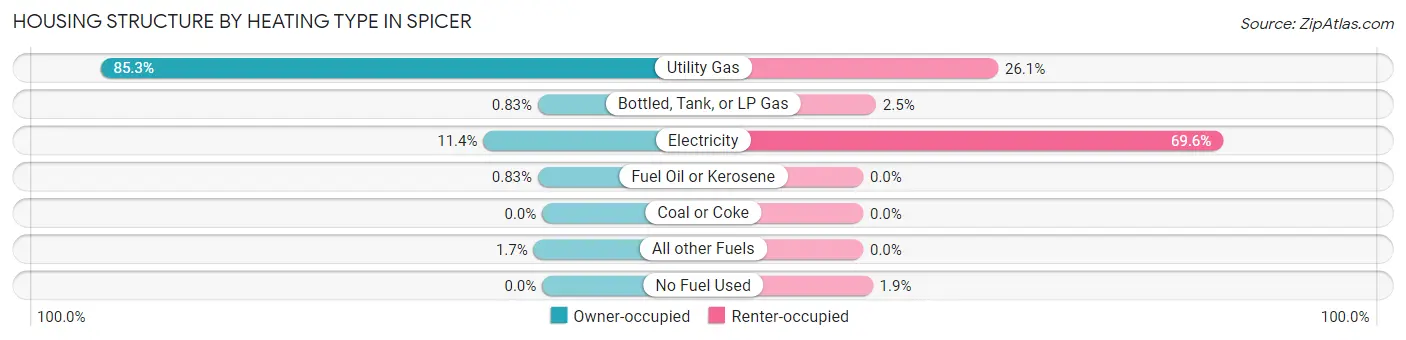
| Heating Type | Owner-occupied | Renter-occupied |
| Utility Gas | 308 (85.3%) | 42 (26.1%) |
| Bottled, Tank, or LP Gas | 3 (0.8%) | 4 (2.5%) |
| Electricity | 41 (11.4%) | 112 (69.6%) |
| Fuel Oil or Kerosene | 3 (0.8%) | 0 (0.0%) |
| Coal or Coke | 0 (0.0%) | 0 (0.0%) |
| All other Fuels | 6 (1.7%) | 0 (0.0%) |
| No Fuel Used | 0 (0.0%) | 3 (1.9%) |
| Total | 361 (100.0%) | 161 (100.0%) |
Household Vehicle Usage in Spicer
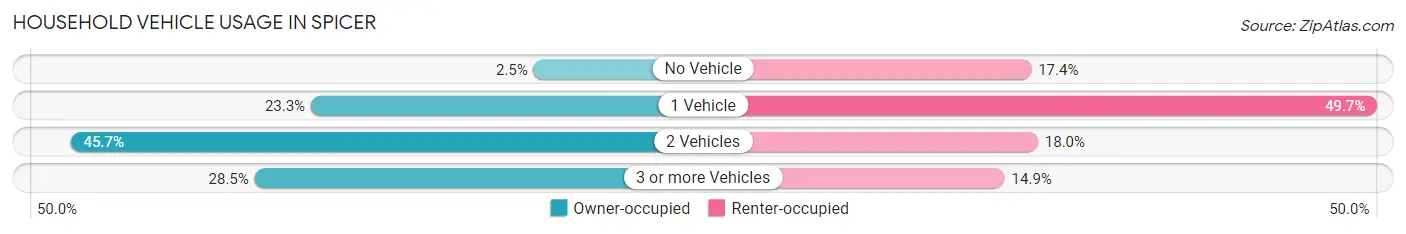
| Vehicles per Household | Owner-occupied | Renter-occupied |
| No Vehicle | 9 (2.5%) | 28 (17.4%) |
| 1 Vehicle | 84 (23.3%) | 80 (49.7%) |
| 2 Vehicles | 165 (45.7%) | 29 (18.0%) |
| 3 or more Vehicles | 103 (28.5%) | 24 (14.9%) |
| Total | 361 (100.0%) | 161 (100.0%) |
Real Estate & Mortgages in Spicer
Real Estate and Mortgage Overview in Spicer
| Characteristic | Without Mortgage | With Mortgage |
| Housing Units | 156 | 205 |
| Median Property Value | $266,100 | $252,100 |
| Median Household Income | $62,500 | $57 |
| Monthly Housing Costs | $666 | $27 |
| Real Estate Taxes | $3,451 | $3 |
Property Value by Mortgage Status in Spicer
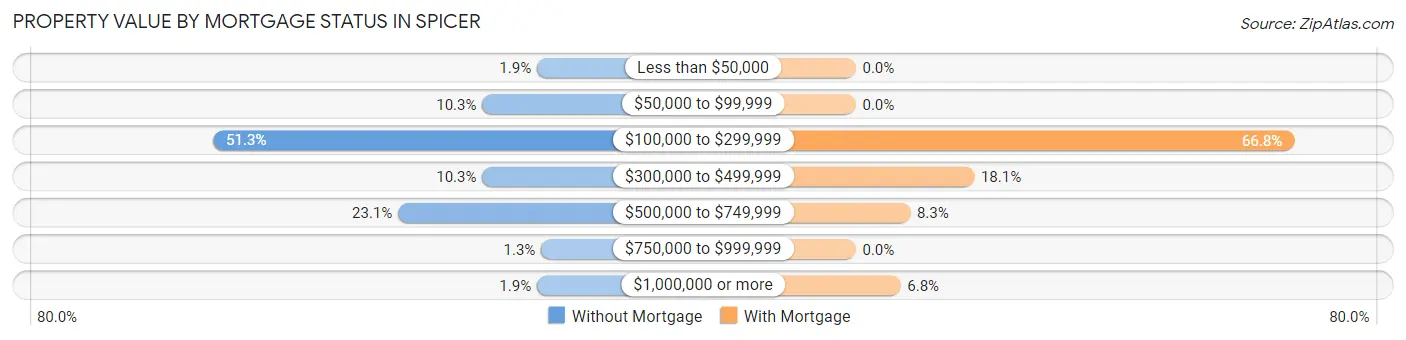
| Property Value | Without Mortgage | With Mortgage |
| Less than $50,000 | 3 (1.9%) | 0 (0.0%) |
| $50,000 to $99,999 | 16 (10.3%) | 0 (0.0%) |
| $100,000 to $299,999 | 80 (51.3%) | 137 (66.8%) |
| $300,000 to $499,999 | 16 (10.3%) | 37 (18.0%) |
| $500,000 to $749,999 | 36 (23.1%) | 17 (8.3%) |
| $750,000 to $999,999 | 2 (1.3%) | 0 (0.0%) |
| $1,000,000 or more | 3 (1.9%) | 14 (6.8%) |
| Total | 156 (100.0%) | 205 (100.0%) |
Household Income by Mortgage Status in Spicer
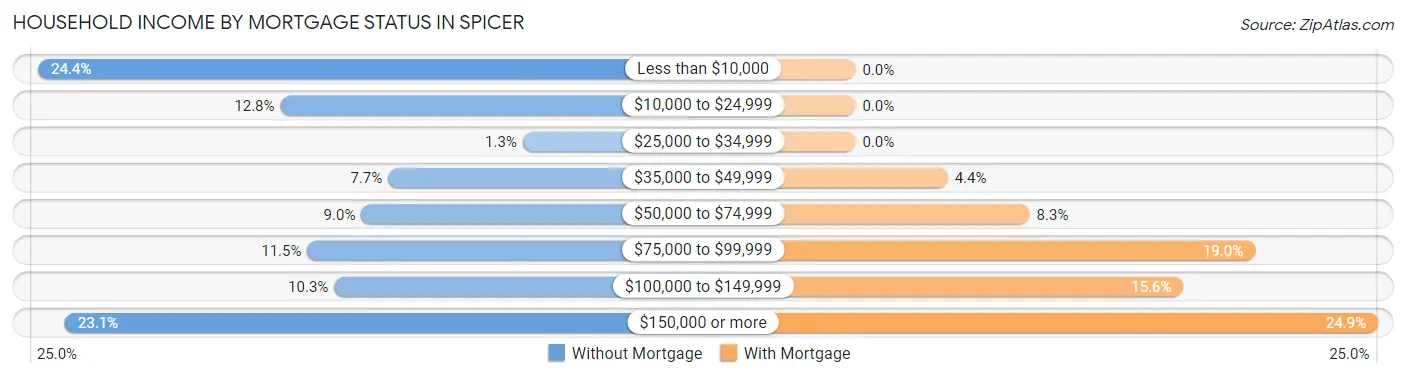
| Household Income | Without Mortgage | With Mortgage |
| Less than $10,000 | 38 (24.4%) | 0 (0.0%) |
| $10,000 to $24,999 | 20 (12.8%) | 0 (0.0%) |
| $25,000 to $34,999 | 2 (1.3%) | 0 (0.0%) |
| $35,000 to $49,999 | 12 (7.7%) | 9 (4.4%) |
| $50,000 to $74,999 | 14 (9.0%) | 17 (8.3%) |
| $75,000 to $99,999 | 18 (11.5%) | 39 (19.0%) |
| $100,000 to $149,999 | 16 (10.3%) | 32 (15.6%) |
| $150,000 or more | 36 (23.1%) | 51 (24.9%) |
| Total | 156 (100.0%) | 205 (100.0%) |
Property Value to Household Income Ratio in Spicer
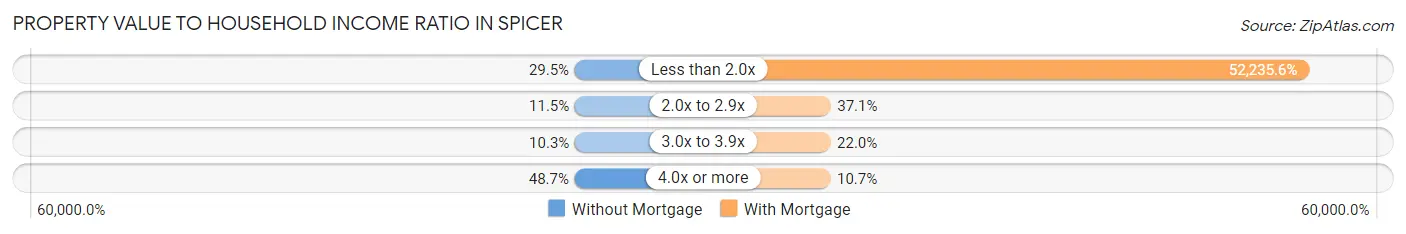
| Value-to-Income Ratio | Without Mortgage | With Mortgage |
| Less than 2.0x | 46 (29.5%) | 107,083 (52,235.6%) |
| 2.0x to 2.9x | 18 (11.5%) | 76 (37.1%) |
| 3.0x to 3.9x | 16 (10.3%) | 45 (22.0%) |
| 4.0x or more | 76 (48.7%) | 22 (10.7%) |
| Total | 156 (100.0%) | 205 (100.0%) |
Real Estate Taxes by Mortgage Status in Spicer
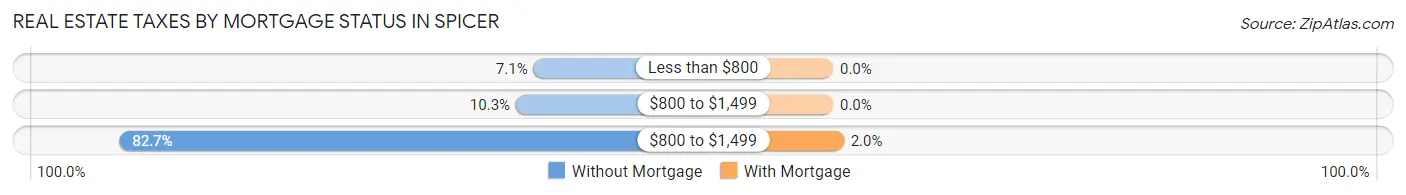
| Property Taxes | Without Mortgage | With Mortgage |
| Less than $800 | 11 (7.0%) | 0 (0.0%) |
| $800 to $1,499 | 16 (10.3%) | 0 (0.0%) |
| $800 to $1,499 | 129 (82.7%) | 4 (1.9%) |
| Total | 156 (100.0%) | 205 (100.0%) |
Health & Disability in Spicer
Health Insurance Coverage by Age in Spicer
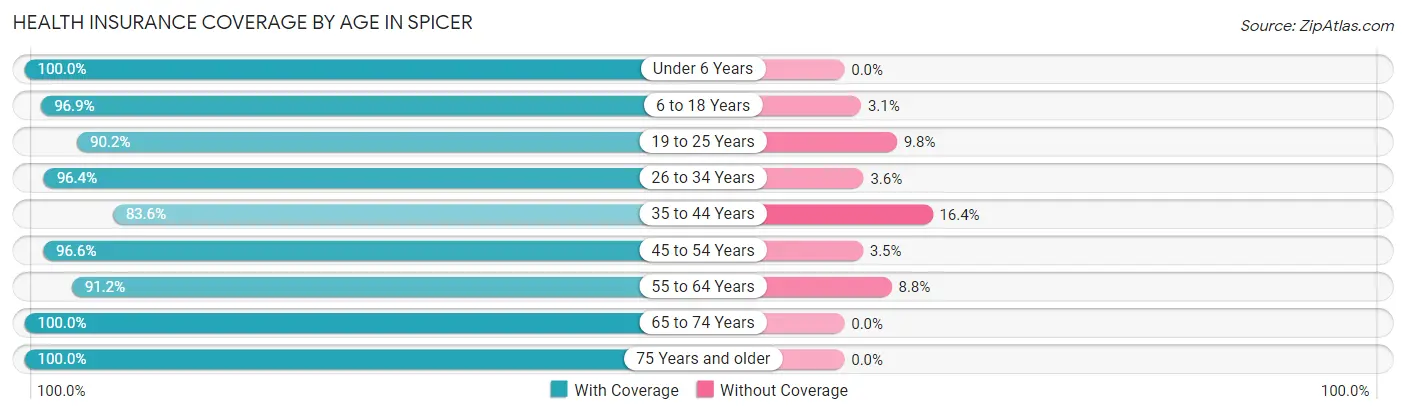
| Age Bracket | With Coverage | Without Coverage |
| Under 6 Years | 45 (100.0%) | 0 (0.0%) |
| 6 to 18 Years | 187 (96.9%) | 6 (3.1%) |
| 19 to 25 Years | 83 (90.2%) | 9 (9.8%) |
| 26 to 34 Years | 81 (96.4%) | 3 (3.6%) |
| 35 to 44 Years | 122 (83.6%) | 24 (16.4%) |
| 45 to 54 Years | 196 (96.6%) | 7 (3.5%) |
| 55 to 64 Years | 207 (91.2%) | 20 (8.8%) |
| 65 to 74 Years | 76 (100.0%) | 0 (0.0%) |
| 75 Years and older | 124 (100.0%) | 0 (0.0%) |
| Total | 1,121 (94.2%) | 69 (5.8%) |
Health Insurance Coverage by Citizenship Status in Spicer
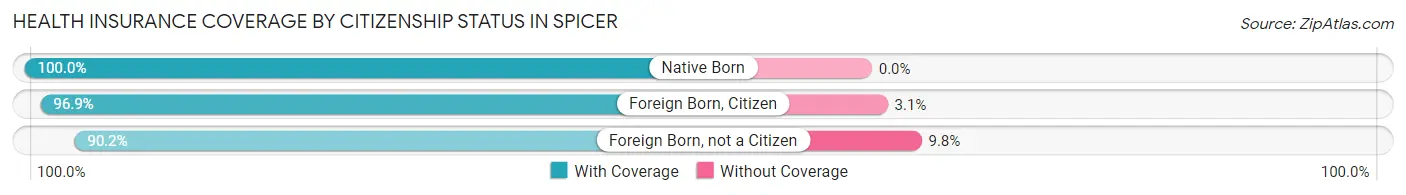
| Citizenship Status | With Coverage | Without Coverage |
| Native Born | 45 (100.0%) | 0 (0.0%) |
| Foreign Born, Citizen | 187 (96.9%) | 6 (3.1%) |
| Foreign Born, not a Citizen | 83 (90.2%) | 9 (9.8%) |
Health Insurance Coverage by Household Income in Spicer
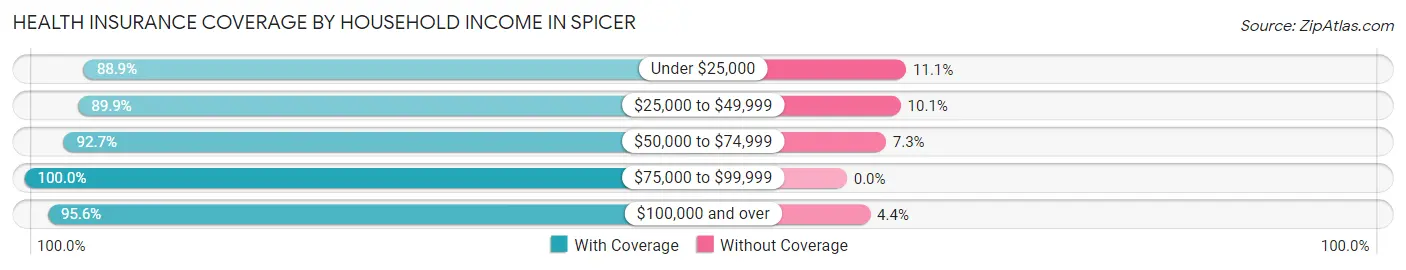
| Household Income | With Coverage | Without Coverage |
| Under $25,000 | 128 (88.9%) | 16 (11.1%) |
| $25,000 to $49,999 | 98 (89.9%) | 11 (10.1%) |
| $50,000 to $74,999 | 291 (92.7%) | 23 (7.3%) |
| $75,000 to $99,999 | 158 (100.0%) | 0 (0.0%) |
| $100,000 and over | 415 (95.6%) | 19 (4.4%) |
Public vs Private Health Insurance Coverage by Age in Spicer
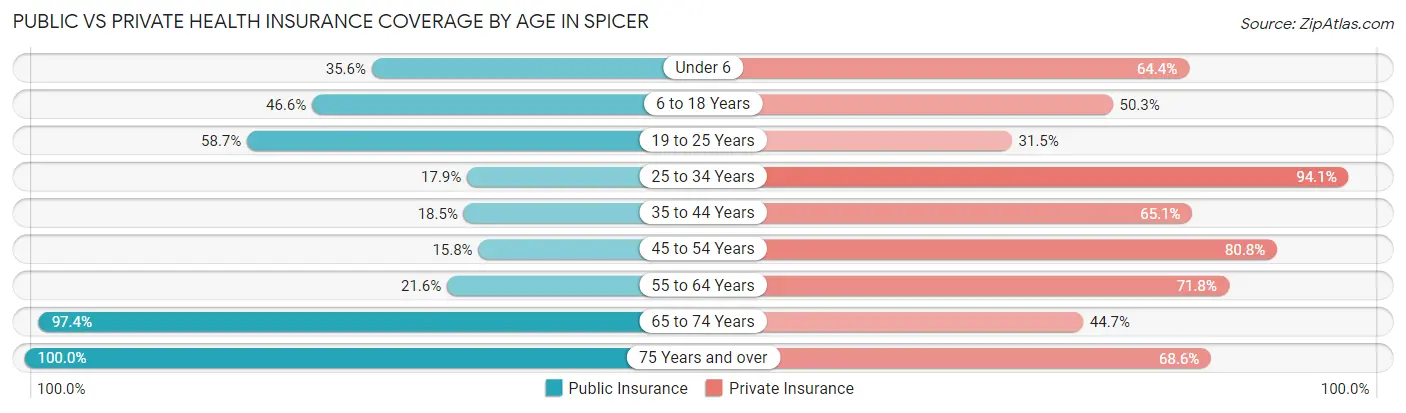
| Age Bracket | Public Insurance | Private Insurance |
| Under 6 | 16 (35.6%) | 29 (64.4%) |
| 6 to 18 Years | 90 (46.6%) | 97 (50.3%) |
| 19 to 25 Years | 54 (58.7%) | 29 (31.5%) |
| 25 to 34 Years | 15 (17.9%) | 79 (94.1%) |
| 35 to 44 Years | 27 (18.5%) | 95 (65.1%) |
| 45 to 54 Years | 32 (15.8%) | 164 (80.8%) |
| 55 to 64 Years | 49 (21.6%) | 163 (71.8%) |
| 65 to 74 Years | 74 (97.4%) | 34 (44.7%) |
| 75 Years and over | 124 (100.0%) | 85 (68.5%) |
| Total | 481 (40.4%) | 775 (65.1%) |
Disability Status by Sex by Age in Spicer
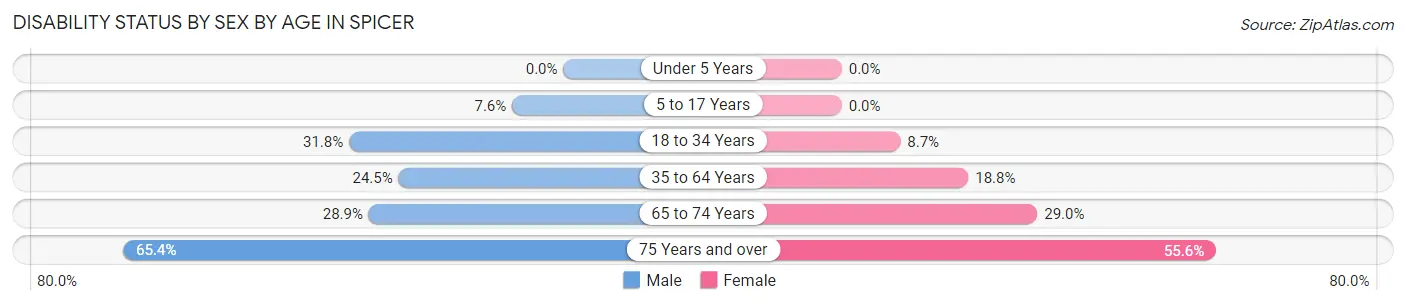
| Age Bracket | Male | Female |
| Under 5 Years | 0 (0.0%) | 0 (0.0%) |
| 5 to 17 Years | 7 (7.6%) | 0 (0.0%) |
| 18 to 34 Years | 35 (31.8%) | 6 (8.7%) |
| 35 to 64 Years | 81 (24.5%) | 46 (18.8%) |
| 65 to 74 Years | 13 (28.9%) | 9 (29.0%) |
| 75 Years and over | 34 (65.4%) | 40 (55.6%) |
Disability Class by Sex by Age in Spicer
Disability Class: Hearing Difficulty
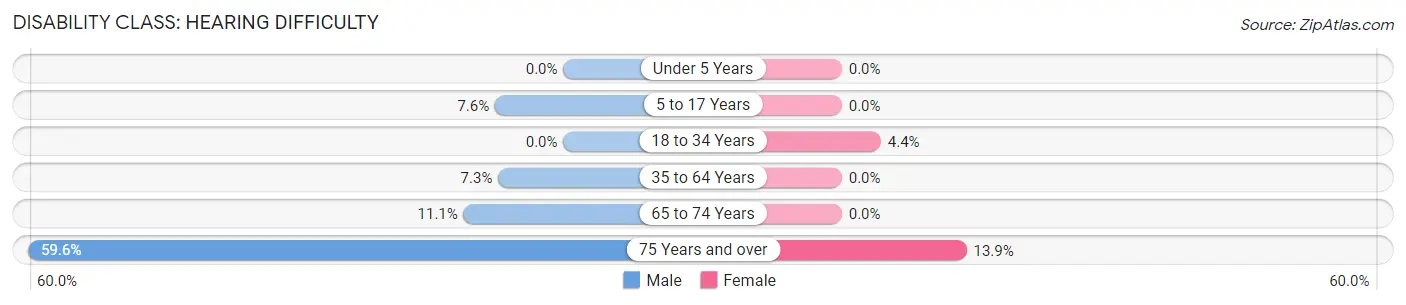
| Age Bracket | Male | Female |
| Under 5 Years | 0 (0.0%) | 0 (0.0%) |
| 5 to 17 Years | 7 (7.6%) | 0 (0.0%) |
| 18 to 34 Years | 0 (0.0%) | 3 (4.3%) |
| 35 to 64 Years | 24 (7.2%) | 0 (0.0%) |
| 65 to 74 Years | 5 (11.1%) | 0 (0.0%) |
| 75 Years and over | 31 (59.6%) | 10 (13.9%) |
Disability Class: Vision Difficulty
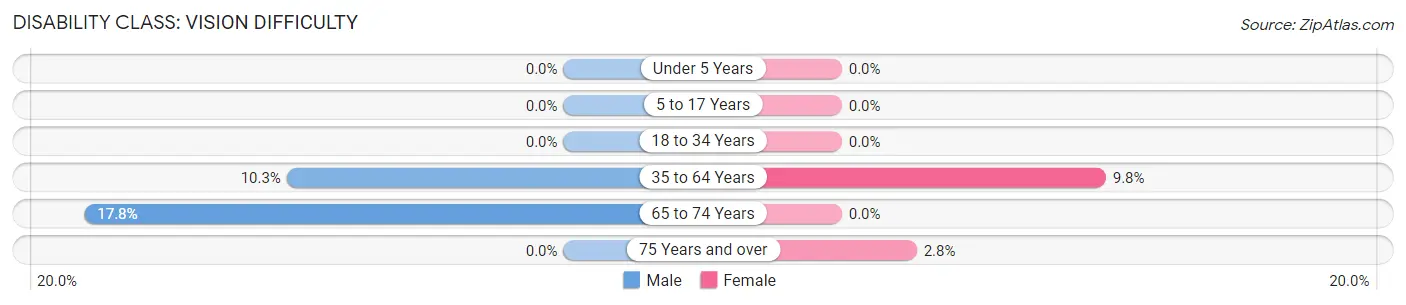
| Age Bracket | Male | Female |
| Under 5 Years | 0 (0.0%) | 0 (0.0%) |
| 5 to 17 Years | 0 (0.0%) | 0 (0.0%) |
| 18 to 34 Years | 0 (0.0%) | 0 (0.0%) |
| 35 to 64 Years | 34 (10.3%) | 24 (9.8%) |
| 65 to 74 Years | 8 (17.8%) | 0 (0.0%) |
| 75 Years and over | 0 (0.0%) | 2 (2.8%) |
Disability Class: Cognitive Difficulty
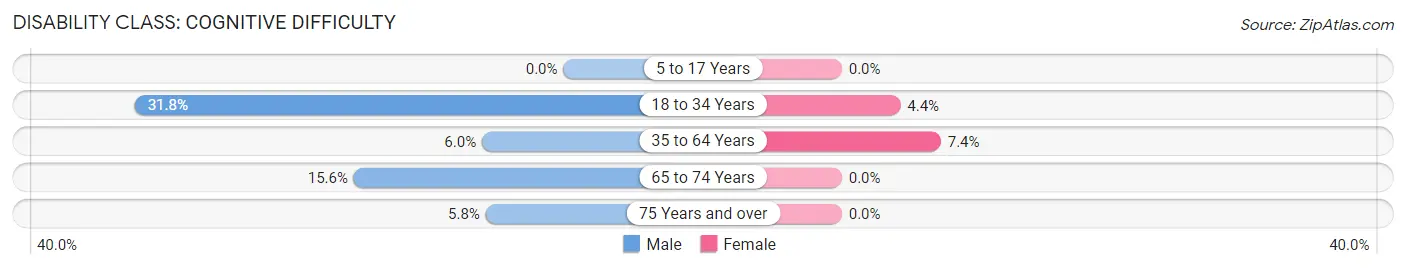
| Age Bracket | Male | Female |
| 5 to 17 Years | 0 (0.0%) | 0 (0.0%) |
| 18 to 34 Years | 35 (31.8%) | 3 (4.3%) |
| 35 to 64 Years | 20 (6.0%) | 18 (7.3%) |
| 65 to 74 Years | 7 (15.6%) | 0 (0.0%) |
| 75 Years and over | 3 (5.8%) | 0 (0.0%) |
Disability Class: Ambulatory Difficulty
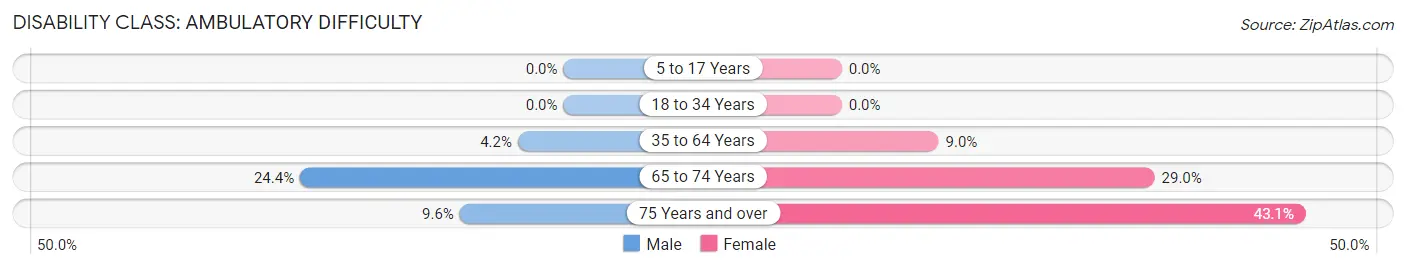
| Age Bracket | Male | Female |
| 5 to 17 Years | 0 (0.0%) | 0 (0.0%) |
| 18 to 34 Years | 0 (0.0%) | 0 (0.0%) |
| 35 to 64 Years | 14 (4.2%) | 22 (9.0%) |
| 65 to 74 Years | 11 (24.4%) | 9 (29.0%) |
| 75 Years and over | 5 (9.6%) | 31 (43.1%) |
Disability Class: Self-Care Difficulty
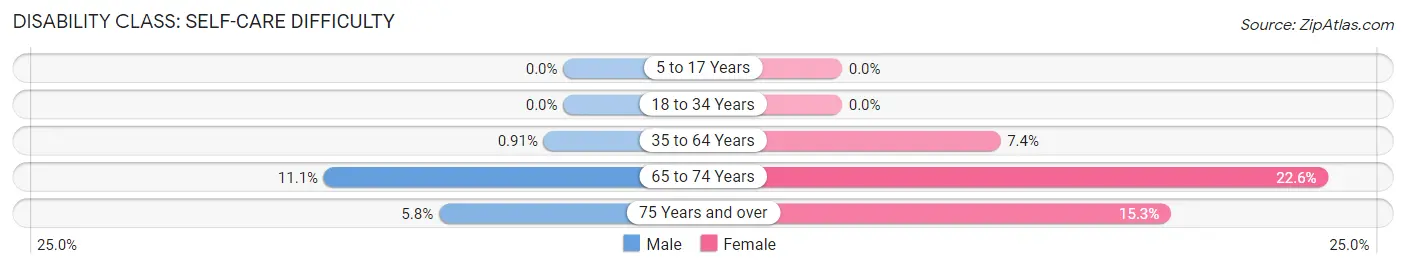
| Age Bracket | Male | Female |
| 5 to 17 Years | 0 (0.0%) | 0 (0.0%) |
| 18 to 34 Years | 0 (0.0%) | 0 (0.0%) |
| 35 to 64 Years | 3 (0.9%) | 18 (7.3%) |
| 65 to 74 Years | 5 (11.1%) | 7 (22.6%) |
| 75 Years and over | 3 (5.8%) | 11 (15.3%) |
Technology Access in Spicer
Computing Device Access in Spicer
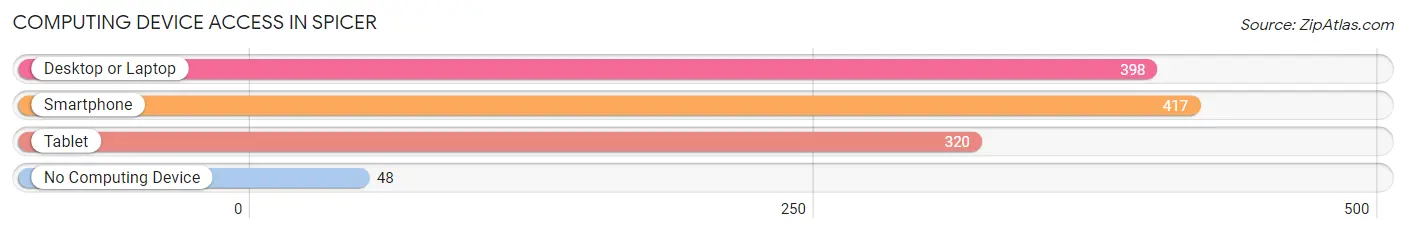
| Device Type | # Households | % Households |
| Desktop or Laptop | 398 | 76.2% |
| Smartphone | 417 | 79.9% |
| Tablet | 320 | 61.3% |
| No Computing Device | 48 | 9.2% |
| Total | 522 | 100.0% |
Internet Access in Spicer
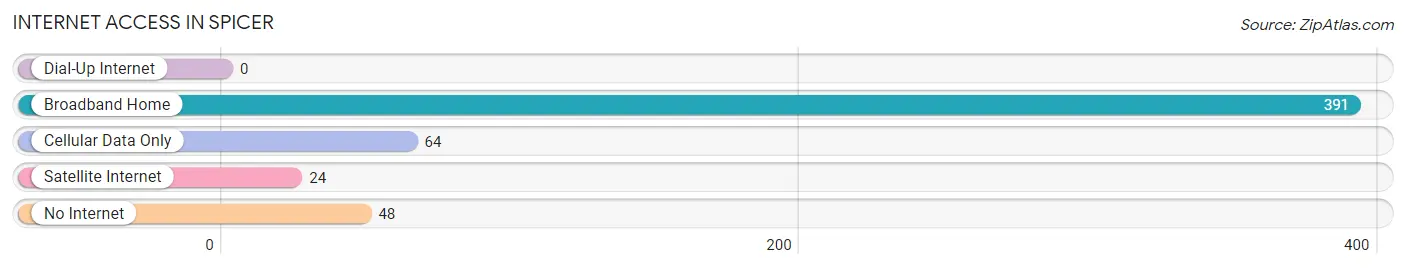
| Internet Type | # Households | % Households |
| Dial-Up Internet | 0 | 0.0% |
| Broadband Home | 391 | 74.9% |
| Cellular Data Only | 64 | 12.3% |
| Satellite Internet | 24 | 4.6% |
| No Internet | 48 | 9.2% |
| Total | 522 | 100.0% |
Spicer Summary
Spicer, Minnesota is a small city located in Kandiyohi County, in the west-central part of the state. It is situated on the south shore of Green Lake, one of the largest natural lakes in Minnesota. The city was founded in 1871 and has a population of 1,400 people as of the 2010 census.
History
The area that is now Spicer was first settled in the late 1860s by a group of Swedish immigrants. The first permanent settlers were John and Anna Anderson, who arrived in 1871. They named the settlement after their hometown of Spicer, Sweden. The Andersons built a sawmill and a gristmill, which helped to attract more settlers to the area.
In 1872, the first post office was established and the village was officially incorporated in 1878. The first school was built in 1879 and the first church was built in 1881.
In the early 1900s, the city began to grow rapidly. The railroad arrived in 1903, bringing with it new businesses and industries. The city was also home to a number of resorts, which attracted tourists from all over the Midwest.
Geography
Spicer is located at the intersection of U.S. Route 12 and Minnesota State Highway 23. It is situated on the south shore of Green Lake, which is the largest natural lake in Minnesota. The city is surrounded by rolling hills and farmland.
The climate in Spicer is typical of the Midwest, with cold winters and hot summers. The average annual temperature is around 40 degrees Fahrenheit.
Economy
The economy of Spicer is largely based on agriculture and tourism. The city is home to a number of resorts, which attract visitors from all over the Midwest. The city is also home to a number of small businesses, including restaurants, retail stores, and service providers.
The city is also home to a number of manufacturing companies, including a plastics manufacturer and a food processing plant.
Demographics
As of the 2010 census, the population of Spicer was 1,400 people. The racial makeup of the city was 97.4% White, 0.6% African American, 0.3% Native American, 0.3% Asian, 0.1% Pacific Islander, and 1.3% from other races.
The median household income in Spicer was $45,000, and the median family income was $50,000. The per capita income was $20,000. About 8.5% of the population was below the poverty line.
The population of Spicer is largely made up of people of Scandinavian descent. The city is also home to a small Hispanic population. The majority of the population is Christian, with the largest denominations being Lutheran and Catholic.
Common Questions
What is Per Capita Income in Spicer?
Per Capita income in Spicer is $43,465.
What is the Median Family Income in Spicer?
Median Family Income in Spicer is $101,667.
What is the Median Household income in Spicer?
Median Household Income in Spicer is $68,571.
What is Income or Wage Gap in Spicer?
Income or Wage Gap in Spicer is 49.6%.
Women in Spicer earn 50.4 cents for every dollar earned by a man.
What is Inequality or Gini Index in Spicer?
Inequality or Gini Index in Spicer is 0.52.
What is the Total Population of Spicer?
Total Population of Spicer is 1,190.
What is the Total Male Population of Spicer?
Total Male Population of Spicer is 657.
What is the Total Female Population of Spicer?
Total Female Population of Spicer is 533.
What is the Ratio of Males per 100 Females in Spicer?
There are 123.26 Males per 100 Females in Spicer.
What is the Ratio of Females per 100 Males in Spicer?
There are 81.13 Females per 100 Males in Spicer.
What is the Median Population Age in Spicer?
Median Population Age in Spicer is 47.2 Years.
What is the Average Family Size in Spicer
Average Family Size in Spicer is 3.0 People.
What is the Average Household Size in Spicer
Average Household Size in Spicer is 2.2 People.
How Large is the Labor Force in Spicer?
There are 718 People in the Labor Forcein in Spicer.
What is the Percentage of People in the Labor Force in Spicer?
71.0% of People are in the Labor Force in Spicer.
What is the Unemployment Rate in Spicer?
Unemployment Rate in Spicer is 1.9%.