Roscoe, MN Map & Demographics
Roscoe Map
Roscoe Overview
$22,582
PER CAPITA INCOME
$55,750
AVG FAMILY INCOME
$43,250
AVG HOUSEHOLD INCOME
0.47
INEQUALITY / GINI INDEX
104
TOTAL POPULATION
68
MALE POPULATION
36
FEMALE POPULATION
188.89
MALES / 100 FEMALES
52.94
FEMALES / 100 MALES
35.8
MEDIAN AGE
3.2
AVG FAMILY SIZE
2.8
AVG HOUSEHOLD SIZE
57
LABOR FORCE [ PEOPLE ]
66.3%
PERCENT IN LABOR FORCE
3.5%
UNEMPLOYMENT RATE
Roscoe Zip Codes
Roscoe Area Codes
Income in Roscoe
Income Overview in Roscoe
Per Capita Income in Roscoe is $22,582, while median incomes of families and households are $55,750 and $43,250 respectively.
| Characteristic | Number | Measure |
| Per Capita Income | 104 | $22,582 |
| Median Family Income | 23 | $55,750 |
| Mean Family Income | 23 | $60,622 |
| Median Household Income | 37 | $43,250 |
| Mean Household Income | 37 | $55,092 |
| Income Deficit | 23 | $0 |
| Wage / Income Gap (%) | 104 | 0.00% |
| Wage / Income Gap ($) | 104 | 100.00¢ per $1 |
| Gini / Inequality Index | 104 | 0.47 |
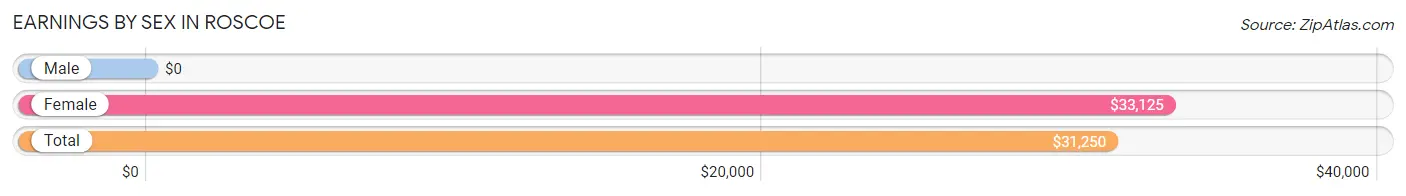
Earnings by Sex in Roscoe
| Sex | Number | Average Earnings |
| Male | 37 (61.7%) | $0 |
| Female | 23 (38.3%) | $33,125 |
| Total | 60 (100.0%) | $31,250 |
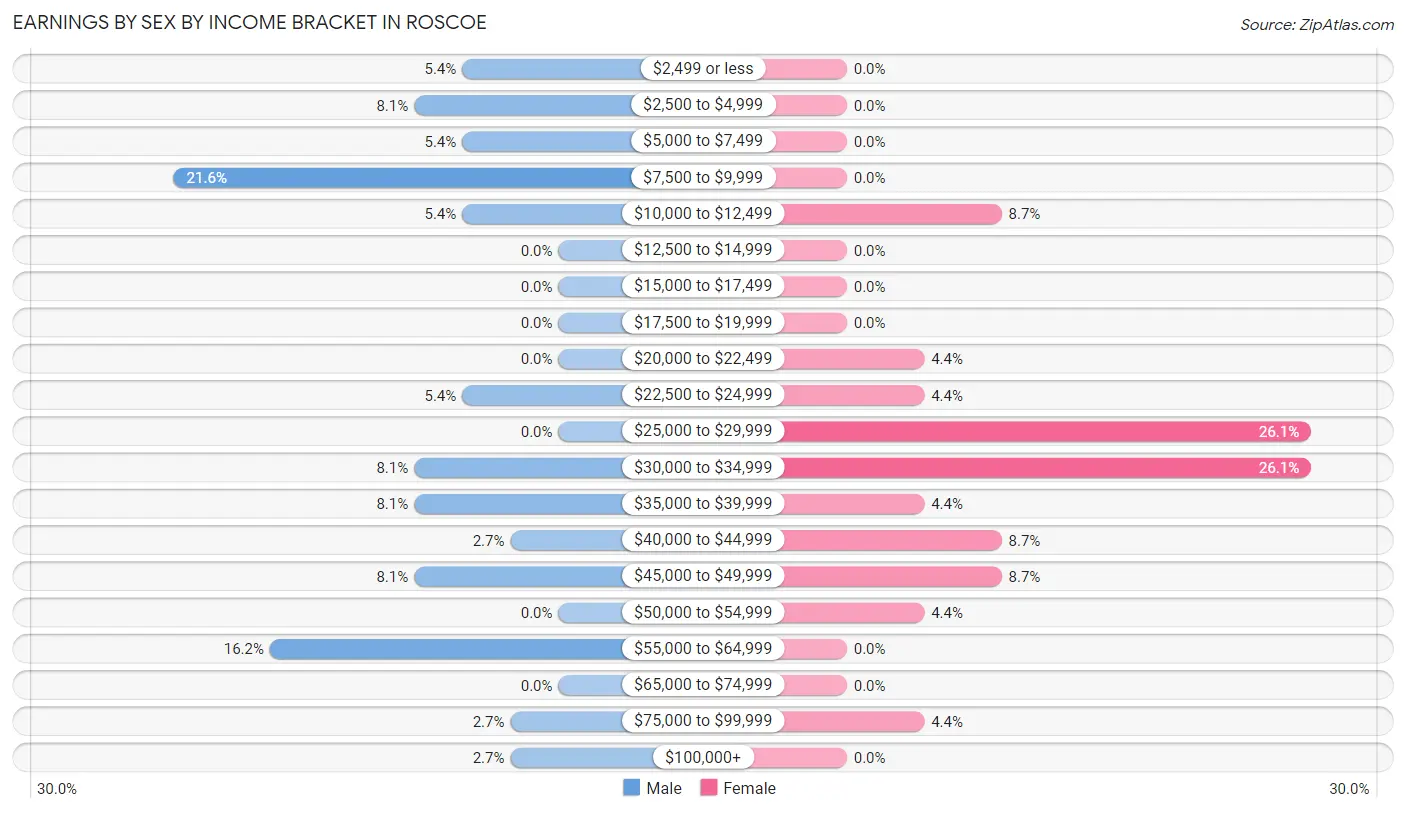
Earnings by Sex by Income Bracket in Roscoe
The most common earnings brackets in Roscoe are $7,500 to $9,999 for men (8 | 21.6%) and $25,000 to $29,999 for women (6 | 26.1%).
| Income | Male | Female |
| $2,499 or less | 2 (5.4%) | 0 (0.0%) |
| $2,500 to $4,999 | 3 (8.1%) | 0 (0.0%) |
| $5,000 to $7,499 | 2 (5.4%) | 0 (0.0%) |
| $7,500 to $9,999 | 8 (21.6%) | 0 (0.0%) |
| $10,000 to $12,499 | 2 (5.4%) | 2 (8.7%) |
| $12,500 to $14,999 | 0 (0.0%) | 0 (0.0%) |
| $15,000 to $17,499 | 0 (0.0%) | 0 (0.0%) |
| $17,500 to $19,999 | 0 (0.0%) | 0 (0.0%) |
| $20,000 to $22,499 | 0 (0.0%) | 1 (4.3%) |
| $22,500 to $24,999 | 2 (5.4%) | 1 (4.3%) |
| $25,000 to $29,999 | 0 (0.0%) | 6 (26.1%) |
| $30,000 to $34,999 | 3 (8.1%) | 6 (26.1%) |
| $35,000 to $39,999 | 3 (8.1%) | 1 (4.3%) |
| $40,000 to $44,999 | 1 (2.7%) | 2 (8.7%) |
| $45,000 to $49,999 | 3 (8.1%) | 2 (8.7%) |
| $50,000 to $54,999 | 0 (0.0%) | 1 (4.3%) |
| $55,000 to $64,999 | 6 (16.2%) | 0 (0.0%) |
| $65,000 to $74,999 | 0 (0.0%) | 0 (0.0%) |
| $75,000 to $99,999 | 1 (2.7%) | 1 (4.3%) |
| $100,000+ | 1 (2.7%) | 0 (0.0%) |
| Total | 37 (100.0%) | 23 (100.0%) |
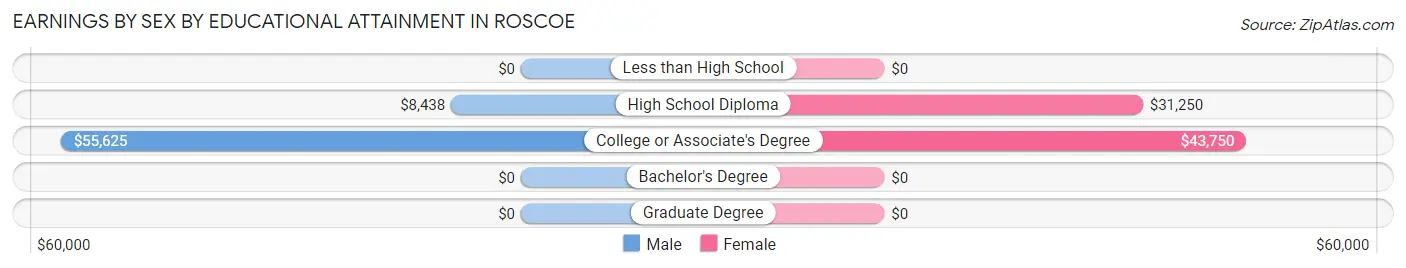
Earnings by Sex by Educational Attainment in Roscoe
| Educational Attainment | Male Income | Female Income |
| Less than High School | - | - |
| High School Diploma | $8,438 | $31,250 |
| College or Associate's Degree | $55,625 | $43,750 |
| Bachelor's Degree | - | - |
| Graduate Degree | - | - |
| Total | - | - |
Family Income in Roscoe
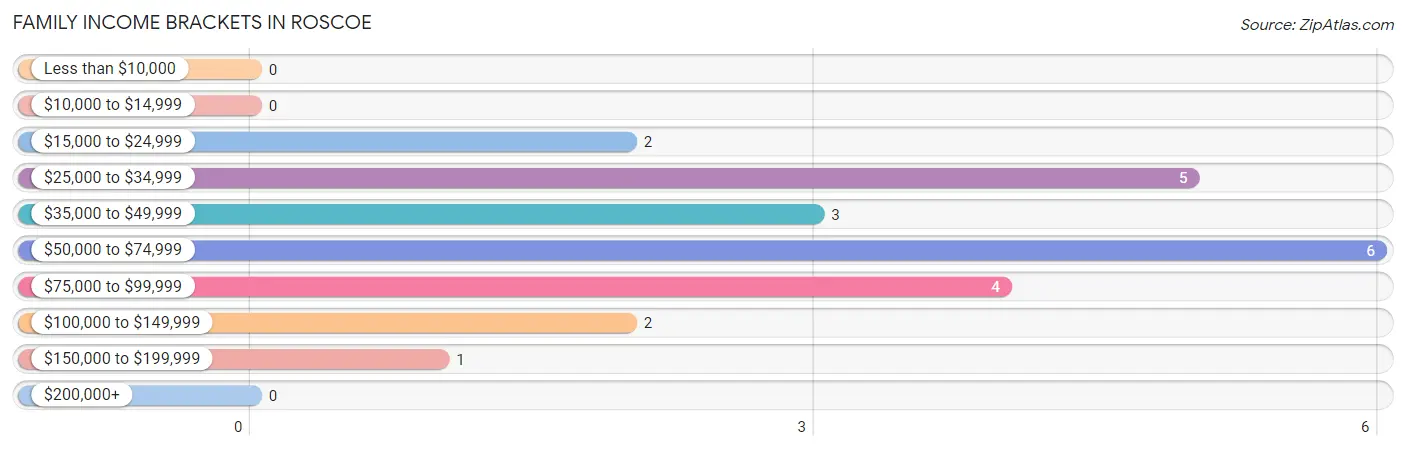
Family Income Brackets in Roscoe
According to the Roscoe family income data, there are 6 families falling into the $50,000 to $74,999 income range, which is the most common income bracket and makes up 26.1% of all families.
| Income Bracket | # Families | % Families |
| Less than $10,000 | 0 | 0.0% |
| $10,000 to $14,999 | 0 | 0.0% |
| $15,000 to $24,999 | 2 | 8.7% |
| $25,000 to $34,999 | 5 | 21.7% |
| $35,000 to $49,999 | 3 | 13.0% |
| $50,000 to $74,999 | 6 | 26.1% |
| $75,000 to $99,999 | 4 | 17.4% |
| $100,000 to $149,999 | 2 | 8.7% |
| $150,000 to $199,999 | 1 | 4.3% |
| $200,000+ | 0 | 0.0% |
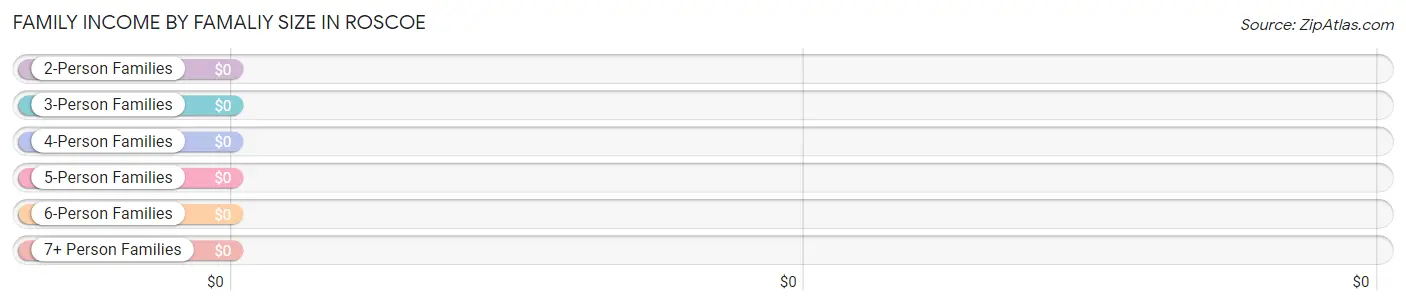
Family Income by Famaliy Size in Roscoe
| Income Bracket | # Families | Median Income |
| 2-Person Families | 12 (52.2%) | $0 |
| 3-Person Families | 5 (21.7%) | $0 |
| 4-Person Families | 3 (13.0%) | $0 |
| 5-Person Families | 3 (13.0%) | $0 |
| 6-Person Families | 0 (0.0%) | $0 |
| 7+ Person Families | 0 (0.0%) | $0 |
| Total | 23 (100.0%) | $55,750 |
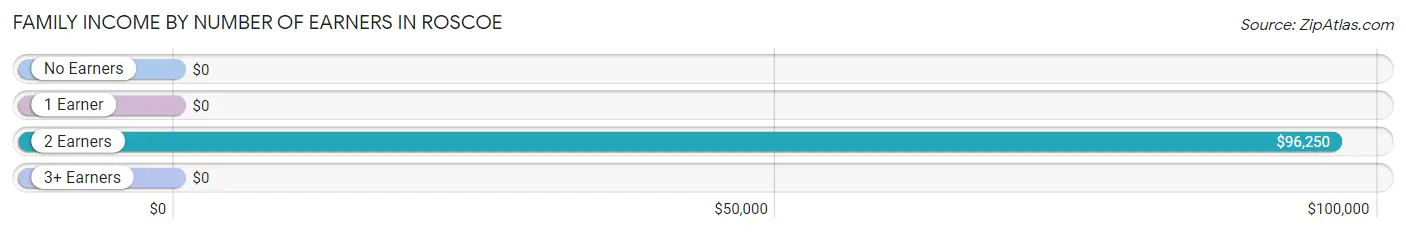
Family Income by Number of Earners in Roscoe
| Number of Earners | # Families | Median Income |
| No Earners | 0 (0.0%) | $0 |
| 1 Earner | 16 (69.6%) | $0 |
| 2 Earners | 5 (21.7%) | $96,250 |
| 3+ Earners | 2 (8.7%) | $0 |
| Total | 23 (100.0%) | $55,750 |
Household Income in Roscoe
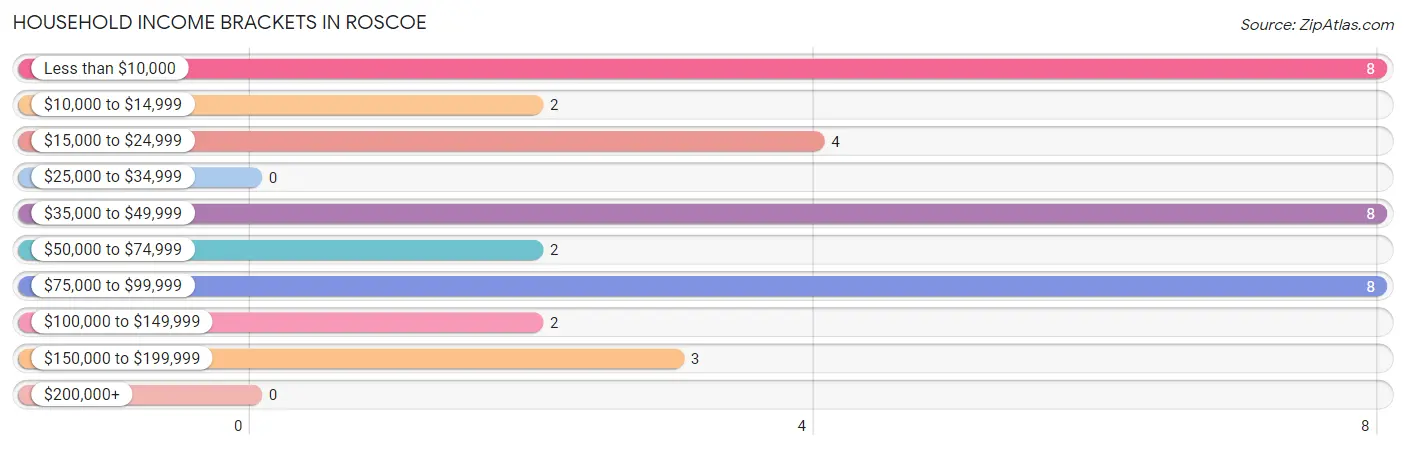
Household Income Brackets in Roscoe
With 8 households falling in the category, the less than $10,000 income range is the most frequent in Roscoe, accounting for 21.6% of all households.
| Income Bracket | # Households | % Households |
| Less than $10,000 | 8 | 21.6% |
| $10,000 to $14,999 | 2 | 5.4% |
| $15,000 to $24,999 | 4 | 10.8% |
| $25,000 to $34,999 | 0 | 0.0% |
| $35,000 to $49,999 | 8 | 21.6% |
| $50,000 to $74,999 | 2 | 5.4% |
| $75,000 to $99,999 | 8 | 21.6% |
| $100,000 to $149,999 | 2 | 5.4% |
| $150,000 to $199,999 | 3 | 8.1% |
| $200,000+ | 0 | 0.0% |
Household Income by Householder Age in Roscoe
The median household income in Roscoe is $43,250, with the highest median household income of $88,750 found in the 45 to 64 years age bracket for the primary householder. A total of 7 households (18.9%) fall into this category.
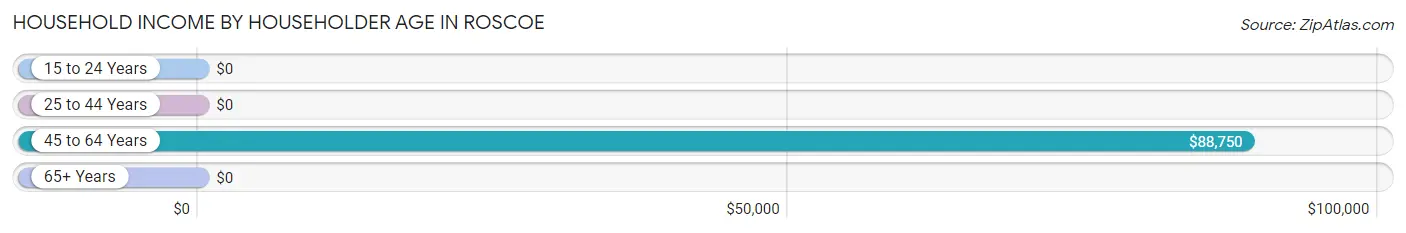
| Income Bracket | # Households | Median Income |
| 15 to 24 Years | 0 (0.0%) | $0 |
| 25 to 44 Years | 16 (43.2%) | $0 |
| 45 to 64 Years | 7 (18.9%) | $88,750 |
| 65+ Years | 14 (37.8%) | $0 |
| Total | 37 (100.0%) | $43,250 |
Poverty in Roscoe
Income Below Poverty by Sex and Age in Roscoe
With 32.4% poverty level for males and 19.4% for females among the residents of Roscoe, 12 to 14 year old males and 15 year old females are the most vulnerable to poverty, with 2 males (100.0%) and 2 females (100.0%) in their respective age groups living below the poverty level.
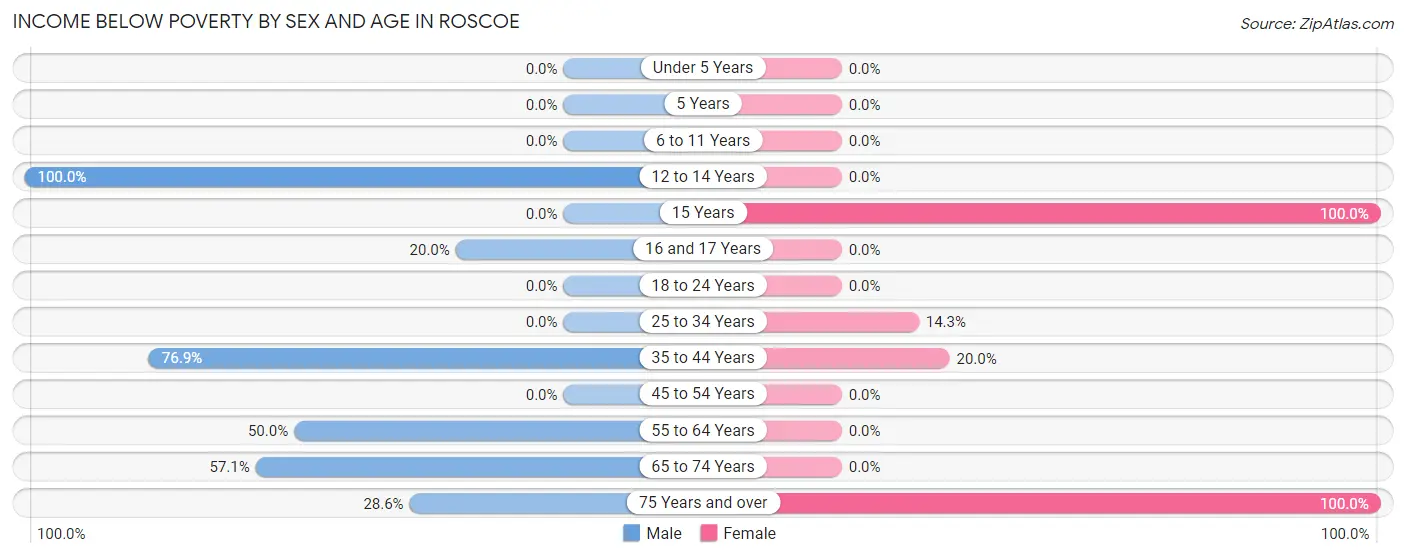
| Age Bracket | Male | Female |
| Under 5 Years | 0 (0.0%) | 0 (0.0%) |
| 5 Years | 0 (0.0%) | 0 (0.0%) |
| 6 to 11 Years | 0 (0.0%) | 0 (0.0%) |
| 12 to 14 Years | 2 (100.0%) | 0 (0.0%) |
| 15 Years | 0 (0.0%) | 2 (100.0%) |
| 16 and 17 Years | 2 (20.0%) | 0 (0.0%) |
| 18 to 24 Years | 0 (0.0%) | 0 (0.0%) |
| 25 to 34 Years | 0 (0.0%) | 1 (14.3%) |
| 35 to 44 Years | 10 (76.9%) | 2 (20.0%) |
| 45 to 54 Years | 0 (0.0%) | 0 (0.0%) |
| 55 to 64 Years | 2 (50.0%) | 0 (0.0%) |
| 65 to 74 Years | 4 (57.1%) | 0 (0.0%) |
| 75 Years and over | 2 (28.6%) | 2 (100.0%) |
| Total | 22 (32.4%) | 7 (19.4%) |
Income Above Poverty by Sex and Age in Roscoe
According to the poverty statistics in Roscoe, males aged under 5 years and females aged under 5 years are the age groups that are most secure financially, with 100.0% of males and 100.0% of females in these age groups living above the poverty line.
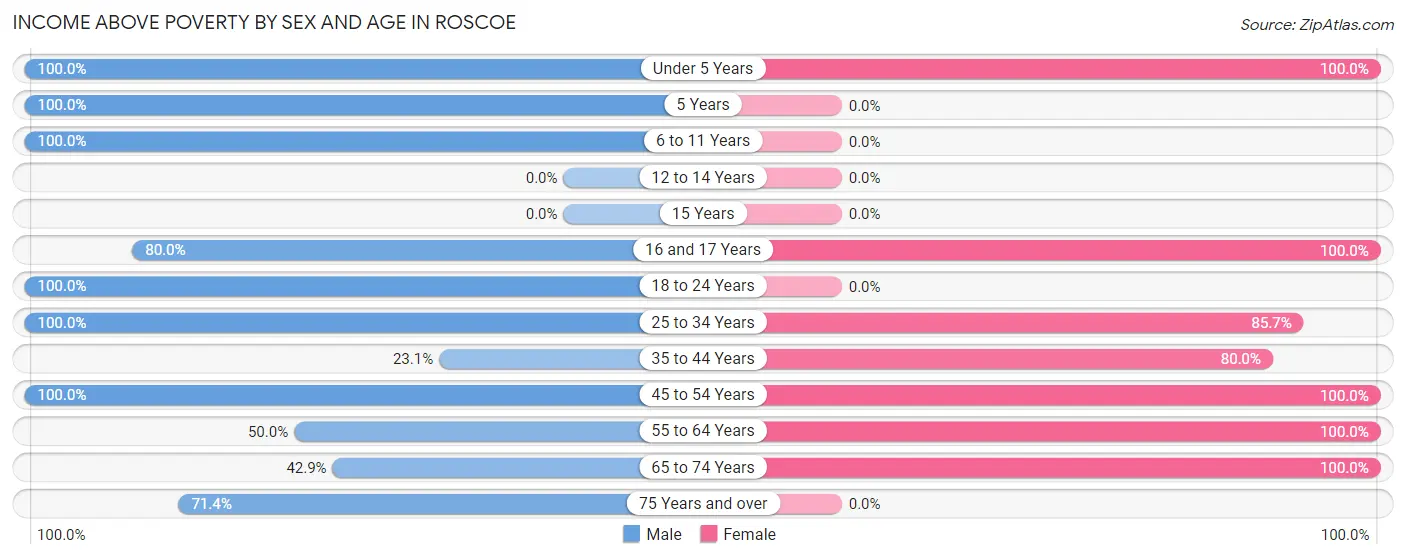
| Age Bracket | Male | Female |
| Under 5 Years | 5 (100.0%) | 5 (100.0%) |
| 5 Years | 1 (100.0%) | 0 (0.0%) |
| 6 to 11 Years | 3 (100.0%) | 0 (0.0%) |
| 12 to 14 Years | 0 (0.0%) | 0 (0.0%) |
| 15 Years | 0 (0.0%) | 0 (0.0%) |
| 16 and 17 Years | 8 (80.0%) | 1 (100.0%) |
| 18 to 24 Years | 7 (100.0%) | 0 (0.0%) |
| 25 to 34 Years | 6 (100.0%) | 6 (85.7%) |
| 35 to 44 Years | 3 (23.1%) | 8 (80.0%) |
| 45 to 54 Years | 3 (100.0%) | 3 (100.0%) |
| 55 to 64 Years | 2 (50.0%) | 3 (100.0%) |
| 65 to 74 Years | 3 (42.9%) | 3 (100.0%) |
| 75 Years and over | 5 (71.4%) | 0 (0.0%) |
| Total | 46 (67.6%) | 29 (80.6%) |
Income Below Poverty Among Married-Couple Families in Roscoe
The poverty statistics for married-couple families in Roscoe show that 18.2% or 2 of the total 11 families live below the poverty line. Families with 3 or 4 children have the highest poverty rate of 100.0%, comprising of 2 families. On the other hand, families with no children have the lowest poverty rate of 0.0%, which includes 0 families.
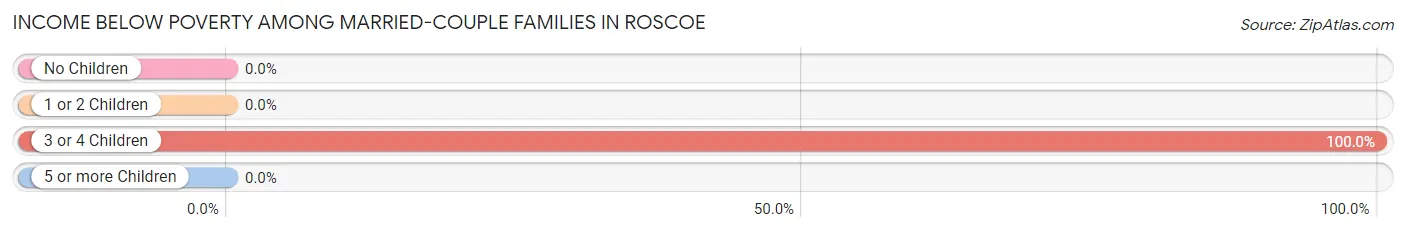
| Children | Above Poverty | Below Poverty |
| No Children | 6 (100.0%) | 0 (0.0%) |
| 1 or 2 Children | 3 (100.0%) | 0 (0.0%) |
| 3 or 4 Children | 0 (0.0%) | 2 (100.0%) |
| 5 or more Children | 0 (0.0%) | 0 (0.0%) |
| Total | 9 (81.8%) | 2 (18.2%) |
Income Below Poverty Among Single-Parent Households in Roscoe
| Children | Single Father | Single Mother |
| No Children | 0 (0.0%) | 0 (0.0%) |
| 1 or 2 Children | 0 (0.0%) | 0 (0.0%) |
| 3 or 4 Children | 0 (0.0%) | 0 (0.0%) |
| 5 or more Children | 0 (0.0%) | 0 (0.0%) |
| Total | 0 (0.0%) | 0 (0.0%) |
Income Below Poverty Among Married-Couple vs Single-Parent Households in Roscoe
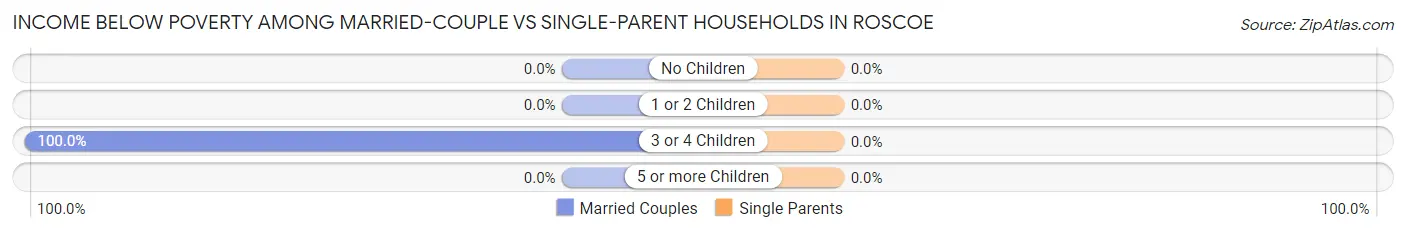
| Children | Married-Couple Families | Single-Parent Households |
| No Children | 0 (0.0%) | 0 (0.0%) |
| 1 or 2 Children | 0 (0.0%) | 0 (0.0%) |
| 3 or 4 Children | 2 (100.0%) | 0 (0.0%) |
| 5 or more Children | 0 (0.0%) | 0 (0.0%) |
| Total | 2 (18.2%) | 0 (0.0%) |
Race in Roscoe
The most populous races in Roscoe are White / Caucasian (99 | 95.2%), Hispanic or Latino (5 | 4.8%), and Some other Race (5 | 4.8%).
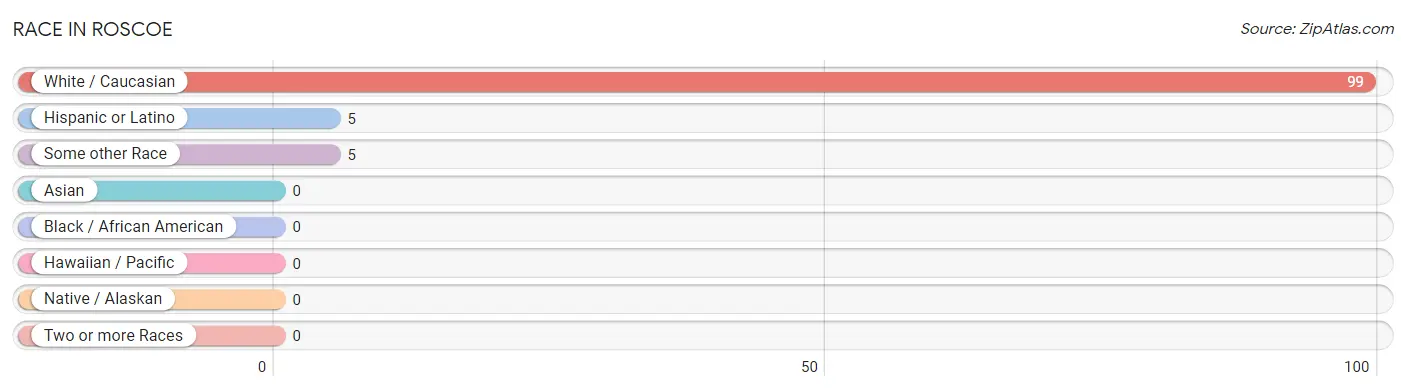
| Race | # Population | % Population |
| Asian | 0 | 0.0% |
| Black / African American | 0 | 0.0% |
| Hawaiian / Pacific | 0 | 0.0% |
| Hispanic or Latino | 5 | 4.8% |
| Native / Alaskan | 0 | 0.0% |
| White / Caucasian | 99 | 95.2% |
| Two or more Races | 0 | 0.0% |
| Some other Race | 5 | 4.8% |
| Total | 104 | 100.0% |
Ancestry in Roscoe
The most populous ancestries reported in Roscoe are German (33 | 31.7%), Polish (14 | 13.5%), Swedish (6 | 5.8%), Mexican (4 | 3.8%), and Norwegian (4 | 3.8%), together accounting for 58.7% of all Roscoe residents.
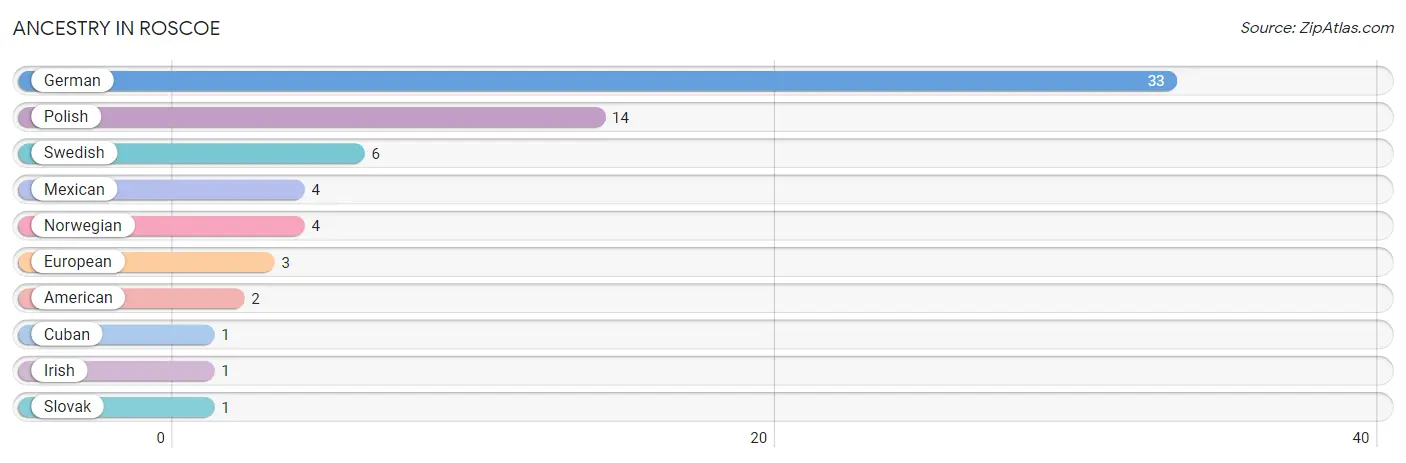
| Ancestry | # Population | % Population |
| American | 2 | 1.9% |
| Cuban | 1 | 1.0% |
| European | 3 | 2.9% |
| German | 33 | 31.7% |
| Irish | 1 | 1.0% |
| Mexican | 4 | 3.8% |
| Norwegian | 4 | 3.8% |
| Polish | 14 | 13.5% |
| Slovak | 1 | 1.0% |
| Swedish | 6 | 5.8% | View All 10 Rows |
Immigrants in Roscoe
The most numerous immigrant groups reported in Roscoe came from Latin America (5 | 4.8%), Central America (4 | 3.8%), Mexico (4 | 3.8%), Caribbean (1 | 1.0%), and Cuba (1 | 1.0%), together accounting for 14.4% of all Roscoe residents.
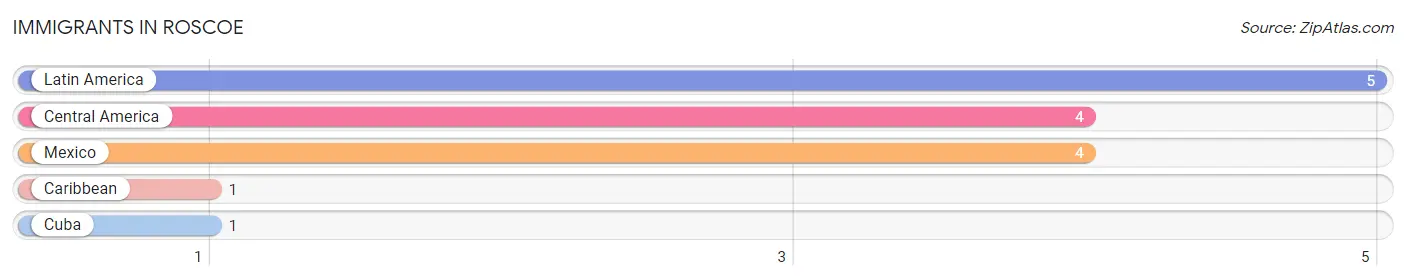
| Immigration Origin | # Population | % Population |
| Caribbean | 1 | 1.0% |
| Central America | 4 | 3.8% |
| Cuba | 1 | 1.0% |
| Latin America | 5 | 4.8% |
| Mexico | 4 | 3.8% | View All 5 Rows |
Sex and Age in Roscoe
Sex and Age in Roscoe
The most populous age groups in Roscoe are 15 to 19 Years (11 | 16.2%) for men and 25 to 29 Years (6 | 16.7%) for women.
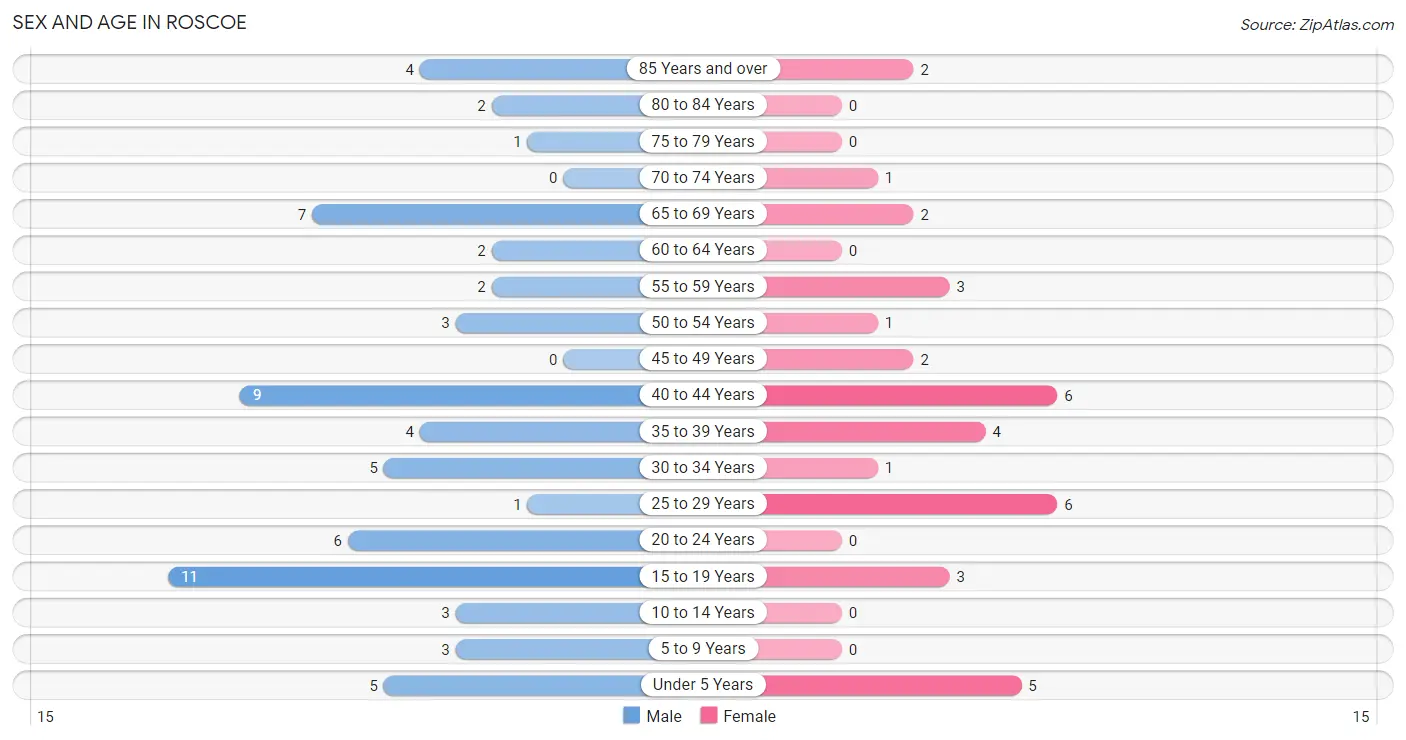
| Age Bracket | Male | Female |
| Under 5 Years | 5 (7.3%) | 5 (13.9%) |
| 5 to 9 Years | 3 (4.4%) | 0 (0.0%) |
| 10 to 14 Years | 3 (4.4%) | 0 (0.0%) |
| 15 to 19 Years | 11 (16.2%) | 3 (8.3%) |
| 20 to 24 Years | 6 (8.8%) | 0 (0.0%) |
| 25 to 29 Years | 1 (1.5%) | 6 (16.7%) |
| 30 to 34 Years | 5 (7.3%) | 1 (2.8%) |
| 35 to 39 Years | 4 (5.9%) | 4 (11.1%) |
| 40 to 44 Years | 9 (13.2%) | 6 (16.7%) |
| 45 to 49 Years | 0 (0.0%) | 2 (5.6%) |
| 50 to 54 Years | 3 (4.4%) | 1 (2.8%) |
| 55 to 59 Years | 2 (2.9%) | 3 (8.3%) |
| 60 to 64 Years | 2 (2.9%) | 0 (0.0%) |
| 65 to 69 Years | 7 (10.3%) | 2 (5.6%) |
| 70 to 74 Years | 0 (0.0%) | 1 (2.8%) |
| 75 to 79 Years | 1 (1.5%) | 0 (0.0%) |
| 80 to 84 Years | 2 (2.9%) | 0 (0.0%) |
| 85 Years and over | 4 (5.9%) | 2 (5.6%) |
| Total | 68 (100.0%) | 36 (100.0%) |
Families and Households in Roscoe
Median Family Size in Roscoe
The median family size in Roscoe is 3.22 persons per family, with married-couple families (11 | 47.8%) accounting for the largest median family size of 3.91 persons per family. On the other hand, single female/mother families (7 | 30.4%) represent the smallest median family size with 2.14 persons per family.
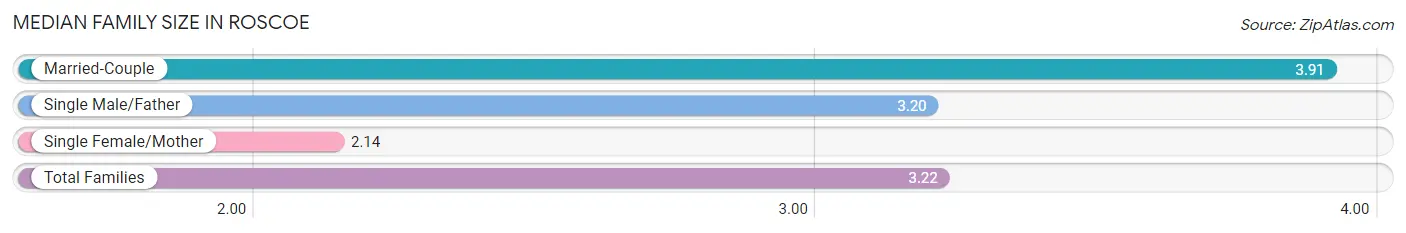
| Family Type | # Families | Family Size |
| Married-Couple | 11 (47.8%) | 3.91 |
| Single Male/Father | 5 (21.7%) | 3.20 |
| Single Female/Mother | 7 (30.4%) | 2.14 |
| Total Families | 23 (100.0%) | 3.22 |
Median Household Size in Roscoe
The median household size in Roscoe is 2.81 persons per household, with single male/father households (5 | 13.5%) accounting for the largest median household size of 4.4 persons per household. non-family households (14 | 37.8%) represent the smallest median household size with 1.07 persons per household.
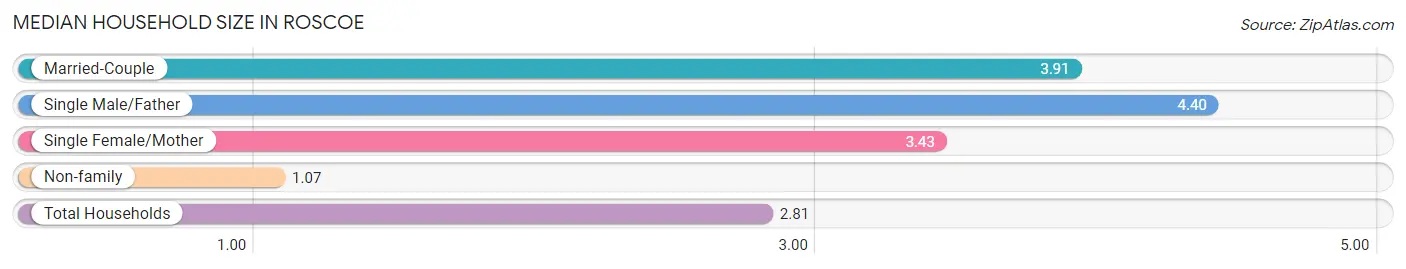
| Household Type | # Households | Household Size |
| Married-Couple | 11 (29.7%) | 3.91 |
| Single Male/Father | 5 (13.5%) | 4.40 |
| Single Female/Mother | 7 (18.9%) | 3.43 |
| Non-family | 14 (37.8%) | 1.07 |
| Total Households | 37 (100.0%) | 2.81 |
Household Size by Marriage Status in Roscoe
Out of a total of 37 households in Roscoe, 23 (62.2%) are family households, while 14 (37.8%) are nonfamily households. The most numerous type of family households are 4-person households, comprising 8, and the most common type of nonfamily households are 1-person households, comprising 13.
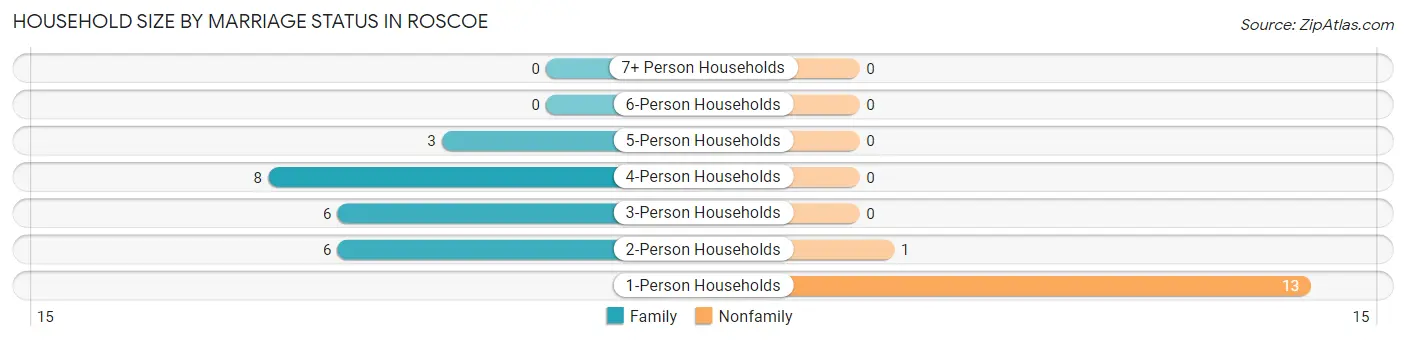
| Household Size | Family Households | Nonfamily Households |
| 1-Person Households | - | 13 (35.1%) |
| 2-Person Households | 6 (16.2%) | 1 (2.7%) |
| 3-Person Households | 6 (16.2%) | 0 (0.0%) |
| 4-Person Households | 8 (21.6%) | 0 (0.0%) |
| 5-Person Households | 3 (8.1%) | 0 (0.0%) |
| 6-Person Households | 0 (0.0%) | 0 (0.0%) |
| 7+ Person Households | 0 (0.0%) | 0 (0.0%) |
| Total | 23 (62.2%) | 14 (37.8%) |
Female Fertility in Roscoe
Fertility by Age in Roscoe
Average fertility rate in Roscoe is 227.0 births per 1,000 women. Women in the age bracket of 20 to 34 years have the highest fertility rate with 714.0 births per 1,000 women. Women in the age bracket of 20 to 34 years acount for 100.0% of all women with births.
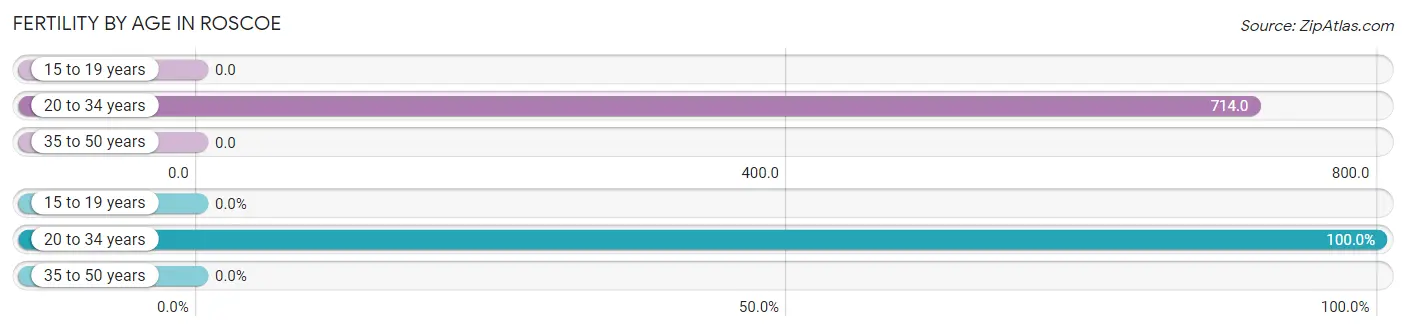
| Age Bracket | Women with Births | Births / 1,000 Women |
| 15 to 19 years | 0 (0.0%) | 0.0 |
| 20 to 34 years | 5 (100.0%) | 714.0 |
| 35 to 50 years | 0 (0.0%) | 0.0 |
| Total | 5 (100.0%) | 227.0 |
Fertility by Age by Marriage Status in Roscoe
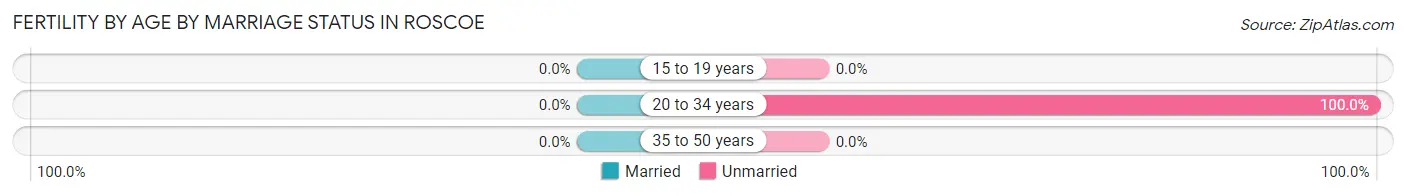
| Age Bracket | Married | Unmarried |
| 15 to 19 years | 0 (0.0%) | 0 (0.0%) |
| 20 to 34 years | 0 (0.0%) | 5 (100.0%) |
| 35 to 50 years | 0 (0.0%) | 0 (0.0%) |
| Total | 0 (0.0%) | 5 (100.0%) |
Fertility by Education in Roscoe
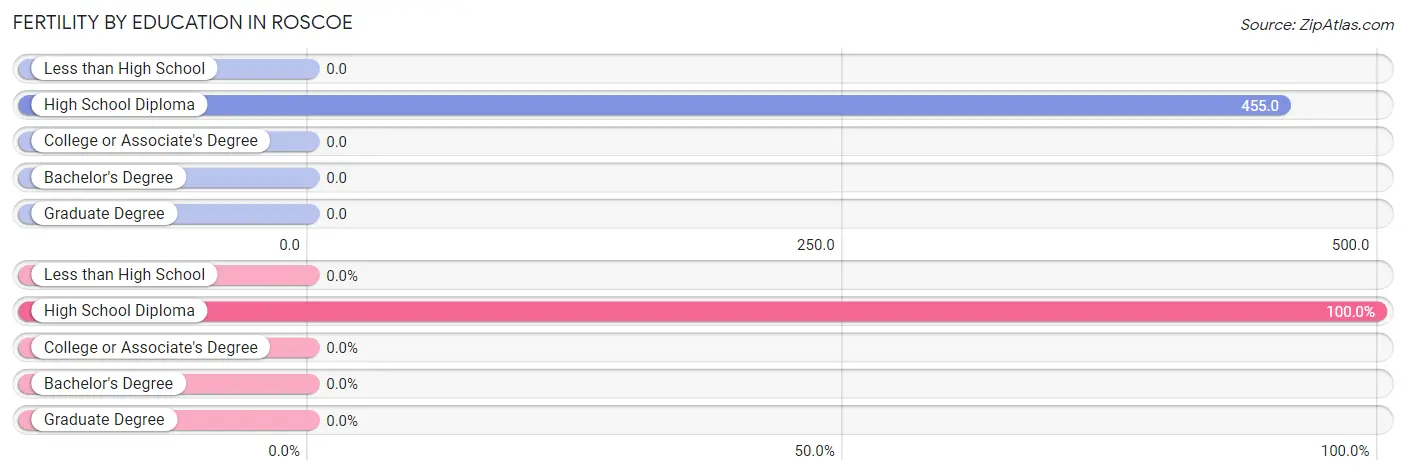
| Educational Attainment | Women with Births | Births / 1,000 Women |
| Less than High School | 0 (0.0%) | 0.0 |
| High School Diploma | 5 (100.0%) | 455.0 |
| College or Associate's Degree | 0 (0.0%) | 0.0 |
| Bachelor's Degree | 0 (0.0%) | 0.0 |
| Graduate Degree | 0 (0.0%) | 0.0 |
| Total | 5 (100.0%) | 227.0 |
Fertility by Education by Marriage Status in Roscoe
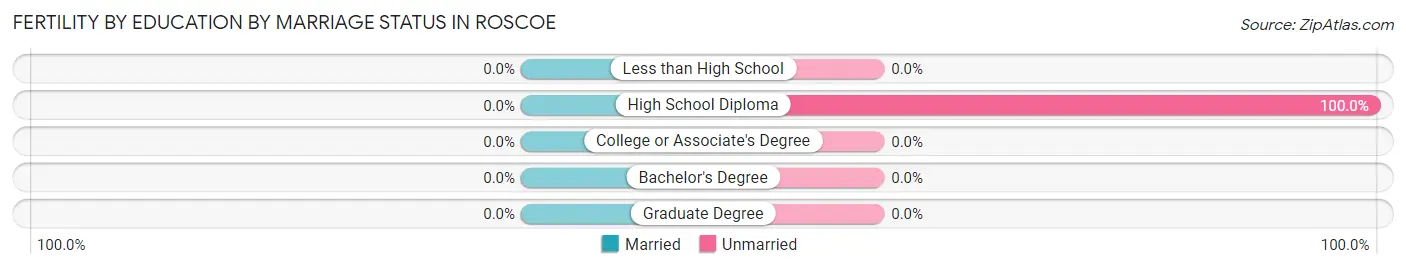
| Educational Attainment | Married | Unmarried |
| Less than High School | 0 (0.0%) | 0 (0.0%) |
| High School Diploma | 0 (0.0%) | 5 (100.0%) |
| College or Associate's Degree | 0 (0.0%) | 0 (0.0%) |
| Bachelor's Degree | 0 (0.0%) | 0 (0.0%) |
| Graduate Degree | 0 (0.0%) | 0 (0.0%) |
| Total | 0 (0.0%) | 5 (100.0%) |
Employment Characteristics in Roscoe
Employment by Class of Employer in Roscoe
Among the 50 employed individuals in Roscoe, private company employees (43 | 86.0%), self-employed (not incorporated) (3 | 6.0%), and not-for-profit organizations (3 | 6.0%) make up the most common classes of employment.
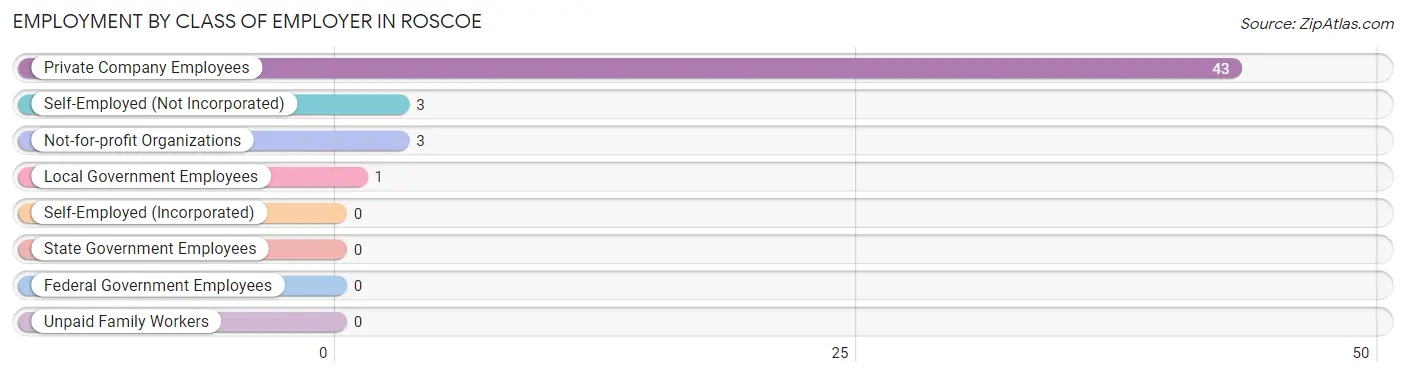
| Employer Class | # Employees | % Employees |
| Private Company Employees | 43 | 86.0% |
| Self-Employed (Incorporated) | 0 | 0.0% |
| Self-Employed (Not Incorporated) | 3 | 6.0% |
| Not-for-profit Organizations | 3 | 6.0% |
| Local Government Employees | 1 | 2.0% |
| State Government Employees | 0 | 0.0% |
| Federal Government Employees | 0 | 0.0% |
| Unpaid Family Workers | 0 | 0.0% |
| Total | 50 | 100.0% |
Employment Status by Age in Roscoe
According to the labor force statistics for Roscoe, out of the total population over 16 years of age (86), 66.3% or 57 individuals are in the labor force, with 3.5% or 2 of them unemployed. The age group with the highest labor force participation rate is 25 to 29 years, with 100.0% or 7 individuals in the labor force. Within the labor force, the 35 to 44 years age range has the highest percentage of unemployed individuals, with 8.7% or 2 of them being unemployed.
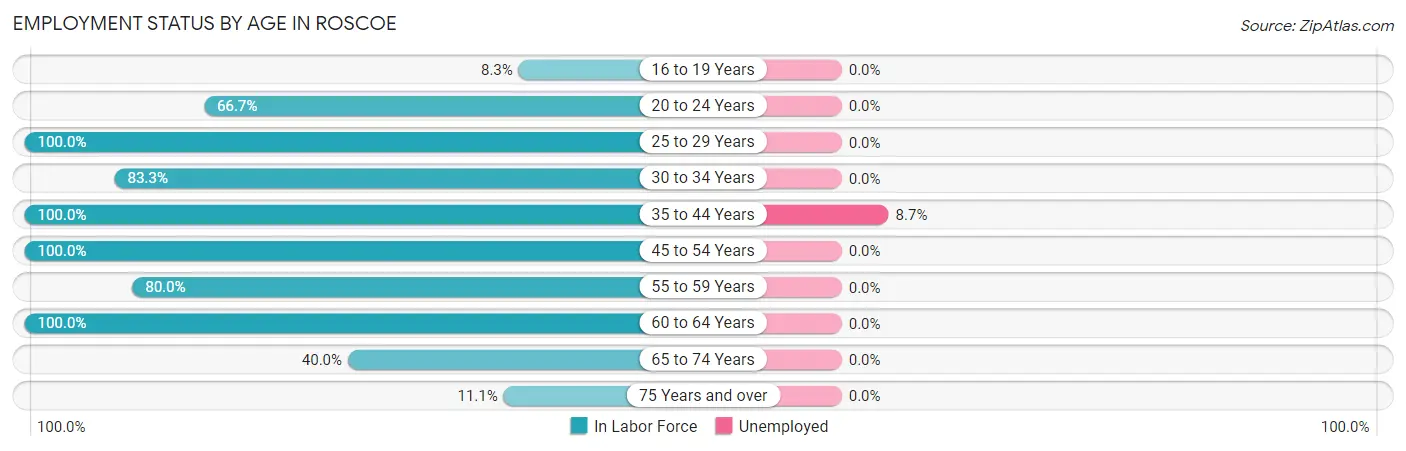
| Age Bracket | In Labor Force | Unemployed |
| 16 to 19 Years | 1 (8.3%) | 0 (0.0%) |
| 20 to 24 Years | 4 (66.7%) | 0 (0.0%) |
| 25 to 29 Years | 7 (100.0%) | 0 (0.0%) |
| 30 to 34 Years | 5 (83.3%) | 0 (0.0%) |
| 35 to 44 Years | 23 (100.0%) | 2 (8.7%) |
| 45 to 54 Years | 6 (100.0%) | 0 (0.0%) |
| 55 to 59 Years | 4 (80.0%) | 0 (0.0%) |
| 60 to 64 Years | 2 (100.0%) | 0 (0.0%) |
| 65 to 74 Years | 4 (40.0%) | 0 (0.0%) |
| 75 Years and over | 1 (11.1%) | 0 (0.0%) |
| Total | 57 (66.3%) | 2 (3.5%) |
Employment Status by Educational Attainment in Roscoe
According to labor force statistics for Roscoe, 95.9% of individuals (47) out of the total population between 25 and 64 years of age (49) are in the labor force, with 4.3% or 2 of them being unemployed. The group with the highest labor force participation rate are those with the educational attainment of college / associate degree, with 100.0% or 19 individuals in the labor force. Within the labor force, individuals with college / associate degree education have the highest percentage of unemployment, with 10.5% or 2 of them being unemployed.
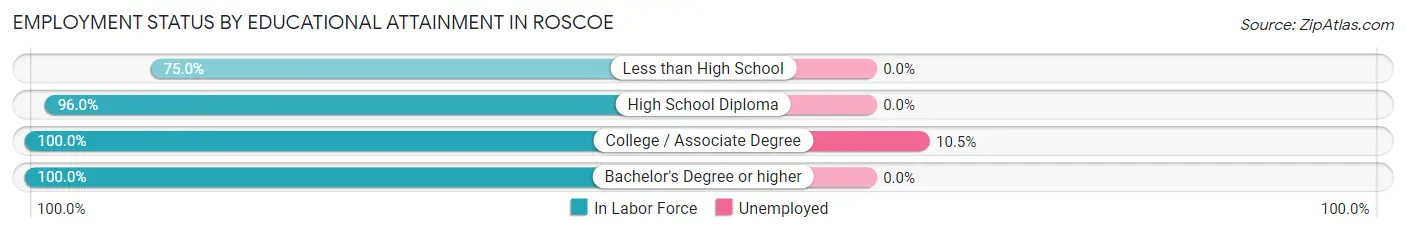
| Educational Attainment | In Labor Force | Unemployed |
| Less than High School | 3 (75.0%) | 0 (0.0%) |
| High School Diploma | 24 (96.0%) | 0 (0.0%) |
| College / Associate Degree | 19 (100.0%) | 2 (10.5%) |
| Bachelor's Degree or higher | 1 (100.0%) | 0 (0.0%) |
| Total | 47 (95.9%) | 2 (4.3%) |
Employment Occupations by Sex in Roscoe
Management, Business, Science and Arts Occupations
The most common Management, Business, Science and Arts occupations in Roscoe are , and Management (5 | 9.1%).
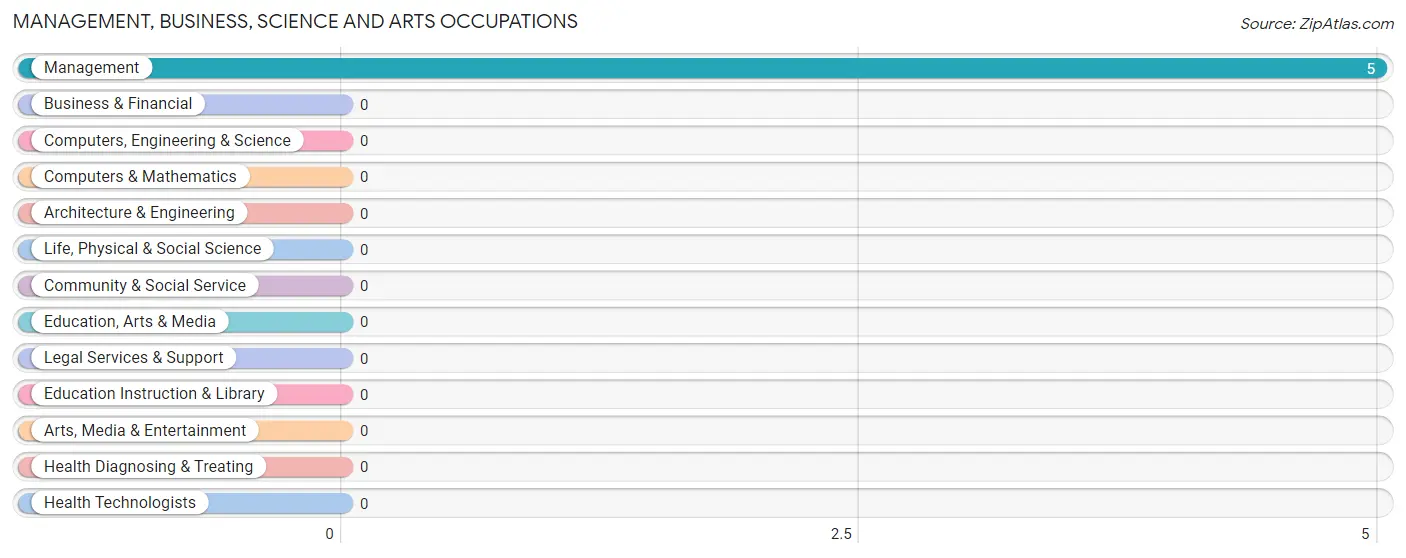
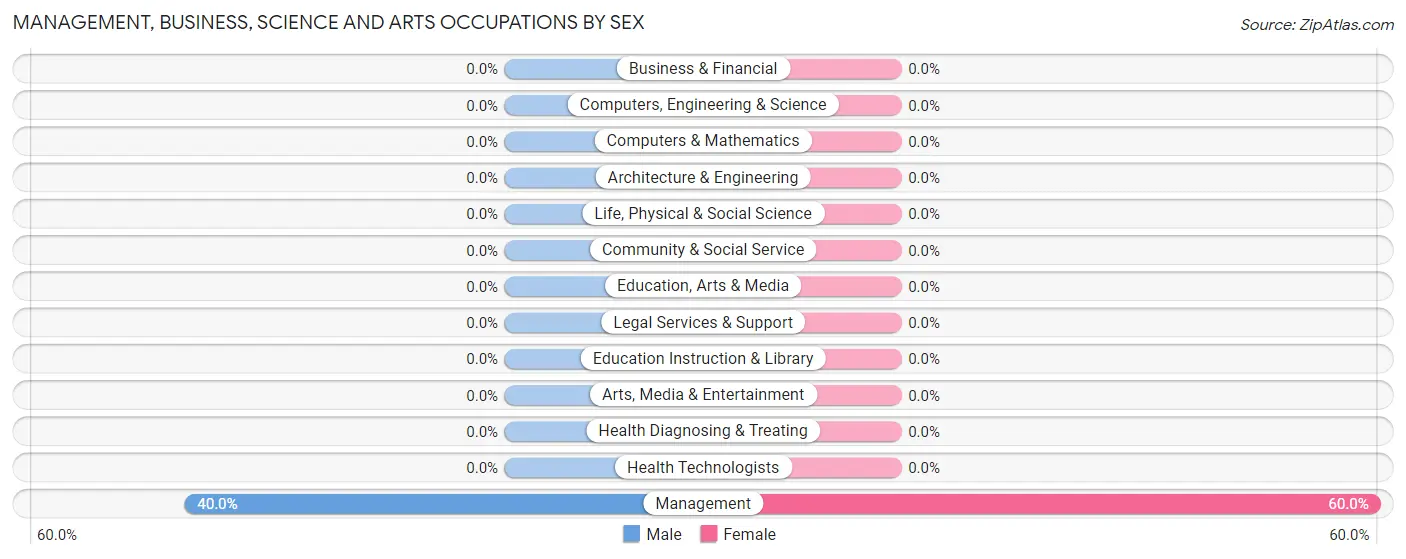
Management, Business, Science and Arts Occupations by Sex
| Occupation | Male | Female |
| Management | 2 (40.0%) | 3 (60.0%) |
| Business & Financial | 0 (0.0%) | 0 (0.0%) |
| Computers, Engineering & Science | 0 (0.0%) | 0 (0.0%) |
| Computers & Mathematics | 0 (0.0%) | 0 (0.0%) |
| Architecture & Engineering | 0 (0.0%) | 0 (0.0%) |
| Life, Physical & Social Science | 0 (0.0%) | 0 (0.0%) |
| Community & Social Service | 0 (0.0%) | 0 (0.0%) |
| Education, Arts & Media | 0 (0.0%) | 0 (0.0%) |
| Legal Services & Support | 0 (0.0%) | 0 (0.0%) |
| Education Instruction & Library | 0 (0.0%) | 0 (0.0%) |
| Arts, Media & Entertainment | 0 (0.0%) | 0 (0.0%) |
| Health Diagnosing & Treating | 0 (0.0%) | 0 (0.0%) |
| Health Technologists | 0 (0.0%) | 0 (0.0%) |
| Total (Category) | 2 (40.0%) | 3 (60.0%) |
| Total (Overall) | 32 (58.2%) | 23 (41.8%) |
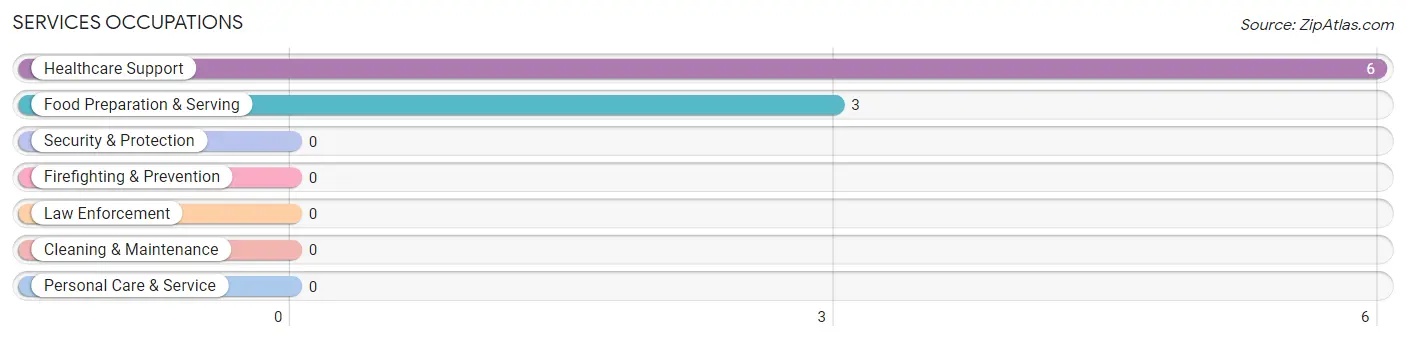
Services Occupations
The most common Services occupations in Roscoe are Healthcare Support (6 | 10.9%), and Food Preparation & Serving (3 | 5.4%).
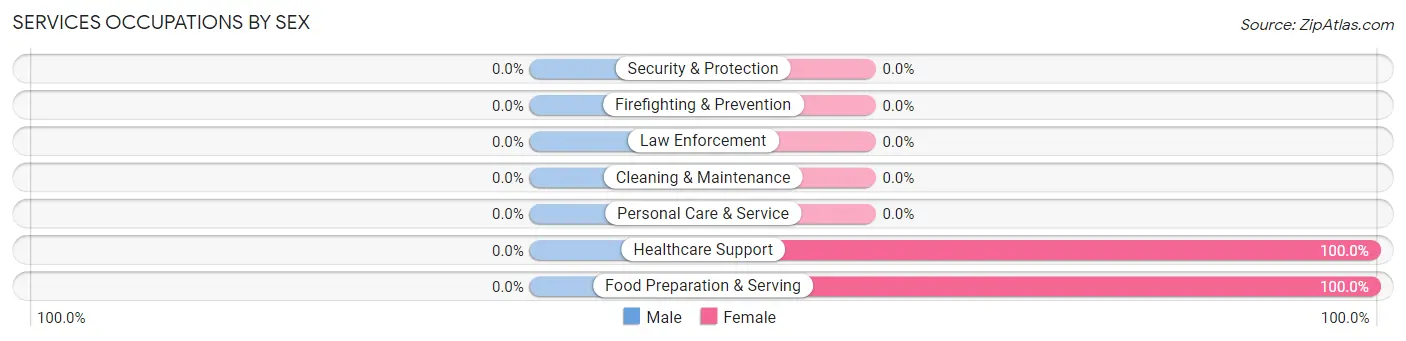
Services Occupations by Sex
| Occupation | Male | Female |
| Healthcare Support | 0 (0.0%) | 6 (100.0%) |
| Security & Protection | 0 (0.0%) | 0 (0.0%) |
| Firefighting & Prevention | 0 (0.0%) | 0 (0.0%) |
| Law Enforcement | 0 (0.0%) | 0 (0.0%) |
| Food Preparation & Serving | 0 (0.0%) | 3 (100.0%) |
| Cleaning & Maintenance | 0 (0.0%) | 0 (0.0%) |
| Personal Care & Service | 0 (0.0%) | 0 (0.0%) |
| Total (Category) | 0 (0.0%) | 9 (100.0%) |
| Total (Overall) | 32 (58.2%) | 23 (41.8%) |
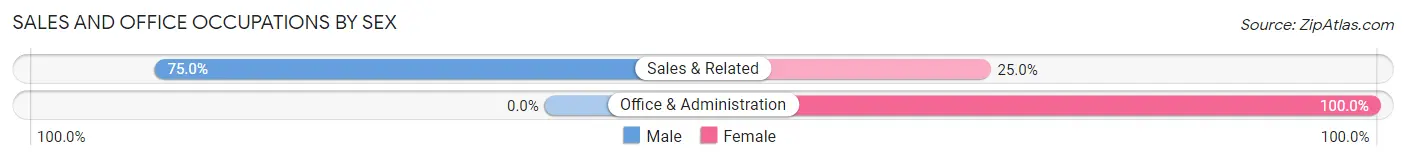
Sales and Office Occupations
The most common Sales and Office occupations in Roscoe are Sales & Related (4 | 7.3%), and Office & Administration (4 | 7.3%).
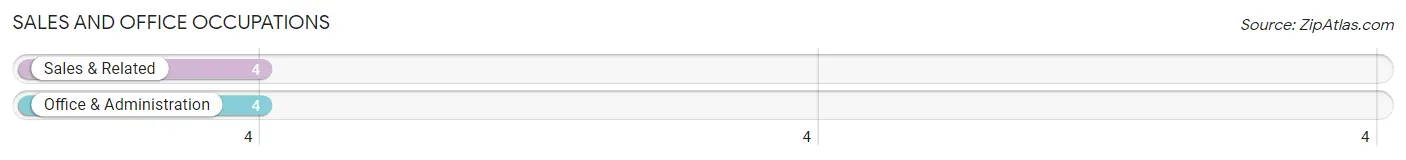
Sales and Office Occupations by Sex
| Occupation | Male | Female |
| Sales & Related | 3 (75.0%) | 1 (25.0%) |
| Office & Administration | 0 (0.0%) | 4 (100.0%) |
| Total (Category) | 3 (37.5%) | 5 (62.5%) |
| Total (Overall) | 32 (58.2%) | 23 (41.8%) |
Natural Resources, Construction and Maintenance Occupations
The most common Natural Resources, Construction and Maintenance occupations in Roscoe are Construction & Extraction (12 | 21.8%), and Installation, Maintenance & Repair (6 | 10.9%).
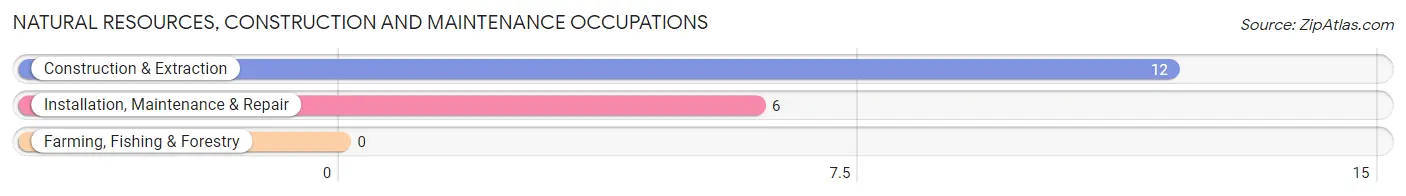
Natural Resources, Construction and Maintenance Occupations by Sex
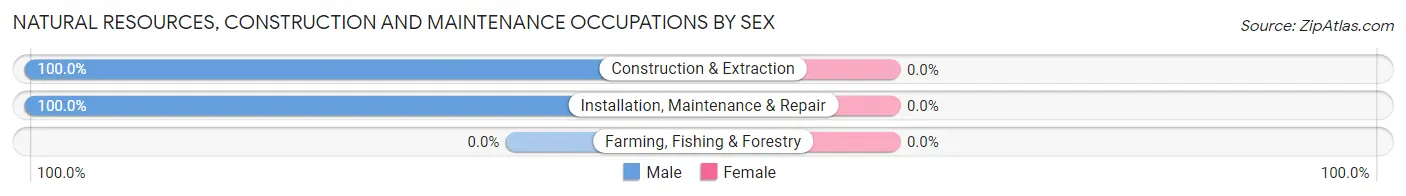
| Occupation | Male | Female |
| Farming, Fishing & Forestry | 0 (0.0%) | 0 (0.0%) |
| Construction & Extraction | 12 (100.0%) | 0 (0.0%) |
| Installation, Maintenance & Repair | 6 (100.0%) | 0 (0.0%) |
| Total (Category) | 18 (100.0%) | 0 (0.0%) |
| Total (Overall) | 32 (58.2%) | 23 (41.8%) |
Production, Transportation and Moving Occupations
The most common Production, Transportation and Moving occupations in Roscoe are Production (10 | 18.2%), and Transportation (5 | 9.1%).
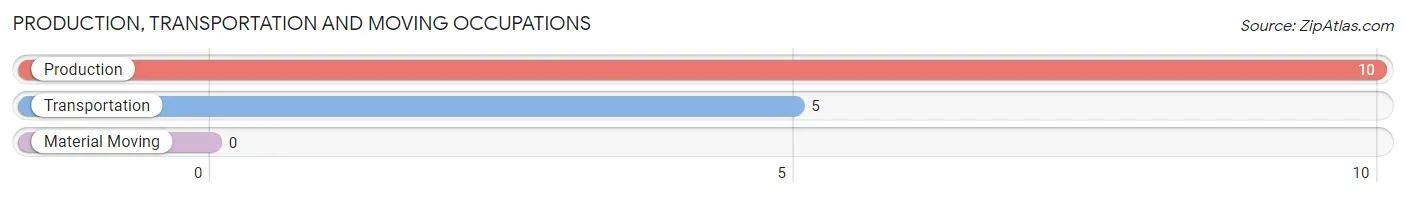
Production, Transportation and Moving Occupations by Sex
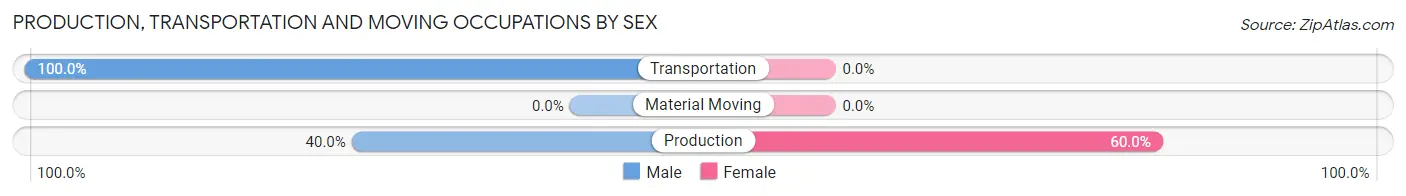
| Occupation | Male | Female |
| Production | 4 (40.0%) | 6 (60.0%) |
| Transportation | 5 (100.0%) | 0 (0.0%) |
| Material Moving | 0 (0.0%) | 0 (0.0%) |
| Total (Category) | 9 (60.0%) | 6 (40.0%) |
| Total (Overall) | 32 (58.2%) | 23 (41.8%) |
Employment Industries by Sex in Roscoe
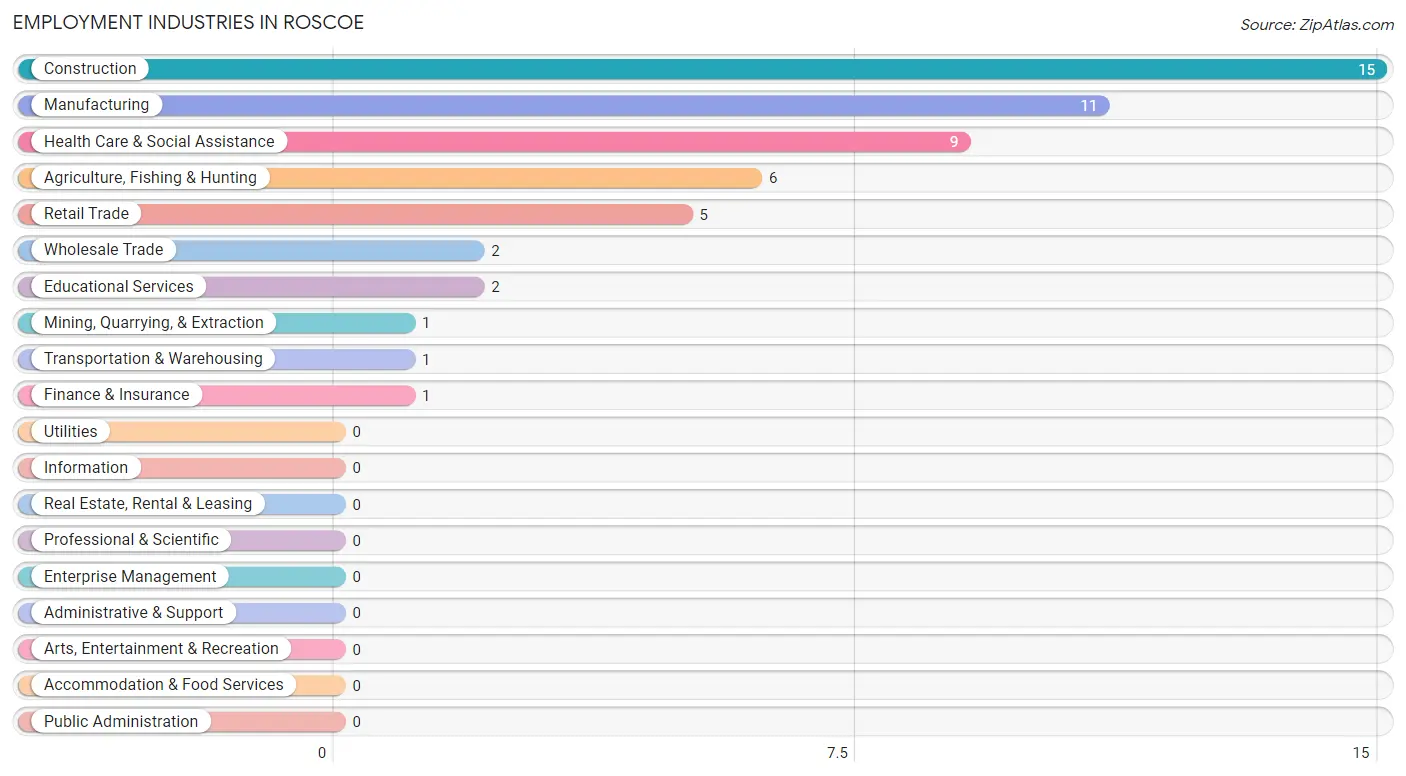
Employment Industries in Roscoe
The major employment industries in Roscoe include Construction (15 | 27.3%), Manufacturing (11 | 20.0%), Health Care & Social Assistance (9 | 16.4%), Agriculture, Fishing & Hunting (6 | 10.9%), and Retail Trade (5 | 9.1%).
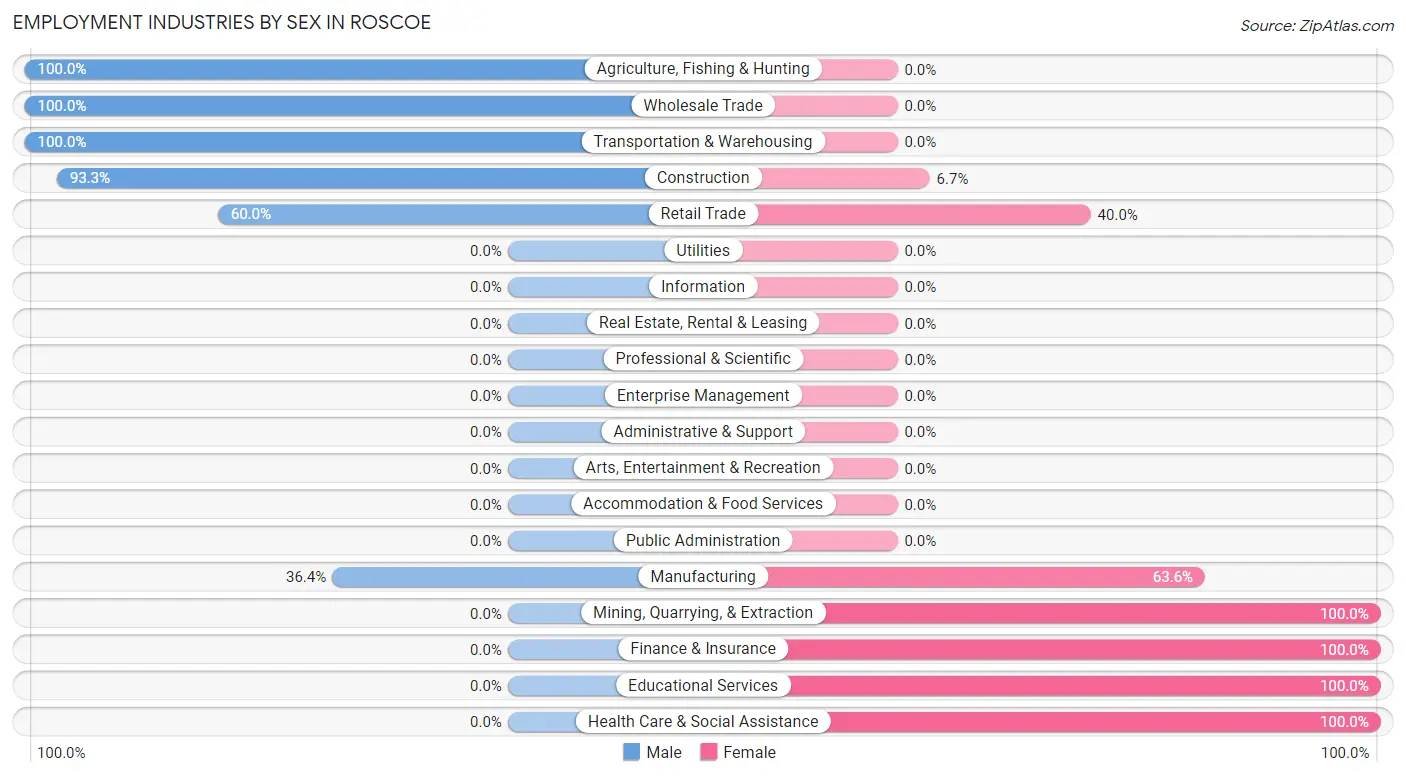
Employment Industries by Sex in Roscoe
The Roscoe industries that see more men than women are Agriculture, Fishing & Hunting (100.0%), Wholesale Trade (100.0%), and Transportation & Warehousing (100.0%), whereas the industries that tend to have a higher number of women are Mining, Quarrying, & Extraction (100.0%), Finance & Insurance (100.0%), and Educational Services (100.0%).
| Industry | Male | Female |
| Agriculture, Fishing & Hunting | 6 (100.0%) | 0 (0.0%) |
| Mining, Quarrying, & Extraction | 0 (0.0%) | 1 (100.0%) |
| Construction | 14 (93.3%) | 1 (6.7%) |
| Manufacturing | 4 (36.4%) | 7 (63.6%) |
| Wholesale Trade | 2 (100.0%) | 0 (0.0%) |
| Retail Trade | 3 (60.0%) | 2 (40.0%) |
| Transportation & Warehousing | 1 (100.0%) | 0 (0.0%) |
| Utilities | 0 (0.0%) | 0 (0.0%) |
| Information | 0 (0.0%) | 0 (0.0%) |
| Finance & Insurance | 0 (0.0%) | 1 (100.0%) |
| Real Estate, Rental & Leasing | 0 (0.0%) | 0 (0.0%) |
| Professional & Scientific | 0 (0.0%) | 0 (0.0%) |
| Enterprise Management | 0 (0.0%) | 0 (0.0%) |
| Administrative & Support | 0 (0.0%) | 0 (0.0%) |
| Educational Services | 0 (0.0%) | 2 (100.0%) |
| Health Care & Social Assistance | 0 (0.0%) | 9 (100.0%) |
| Arts, Entertainment & Recreation | 0 (0.0%) | 0 (0.0%) |
| Accommodation & Food Services | 0 (0.0%) | 0 (0.0%) |
| Public Administration | 0 (0.0%) | 0 (0.0%) |
| Total | 32 (58.2%) | 23 (41.8%) |
Education in Roscoe
School Enrollment in Roscoe
The most common levels of schooling among the 21 students in Roscoe are high school (13 | 61.9%), middle school (3 | 14.3%), and elementary school (2 | 9.5%).
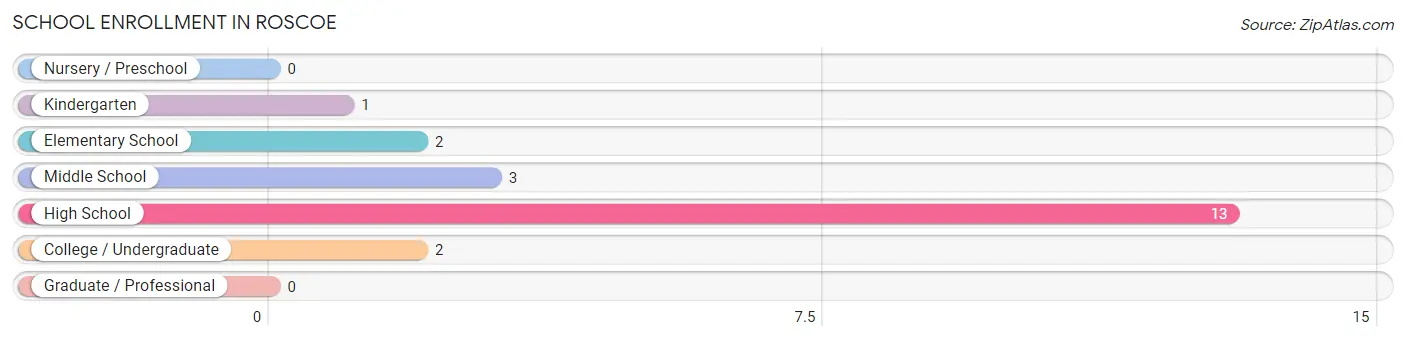
| School Level | # Students | % Students |
| Nursery / Preschool | 0 | 0.0% |
| Kindergarten | 1 | 4.8% |
| Elementary School | 2 | 9.5% |
| Middle School | 3 | 14.3% |
| High School | 13 | 61.9% |
| College / Undergraduate | 2 | 9.5% |
| Graduate / Professional | 0 | 0.0% |
| Total | 21 | 100.0% |
School Enrollment by Age by Funding Source in Roscoe
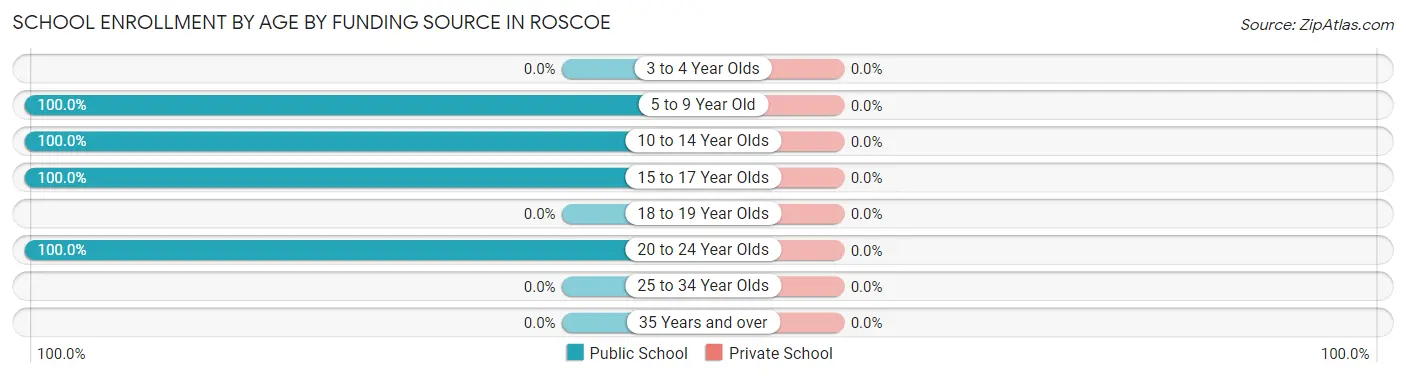
| Age Bracket | Public School | Private School |
| 3 to 4 Year Olds | 0 (0.0%) | 0 (0.0%) |
| 5 to 9 Year Old | 3 (100.0%) | 0 (0.0%) |
| 10 to 14 Year Olds | 3 (100.0%) | 0 (0.0%) |
| 15 to 17 Year Olds | 13 (100.0%) | 0 (0.0%) |
| 18 to 19 Year Olds | 0 (0.0%) | 0 (0.0%) |
| 20 to 24 Year Olds | 2 (100.0%) | 0 (0.0%) |
| 25 to 34 Year Olds | 0 (0.0%) | 0 (0.0%) |
| 35 Years and over | 0 (0.0%) | 0 (0.0%) |
| Total | 21 (100.0%) | 0 (0.0%) |
Educational Attainment by Field of Study in Roscoe
, and social sciences (1 | 100.0%) are the most common fields of study among 1 individuals in Roscoe who have obtained a bachelor's degree or higher.
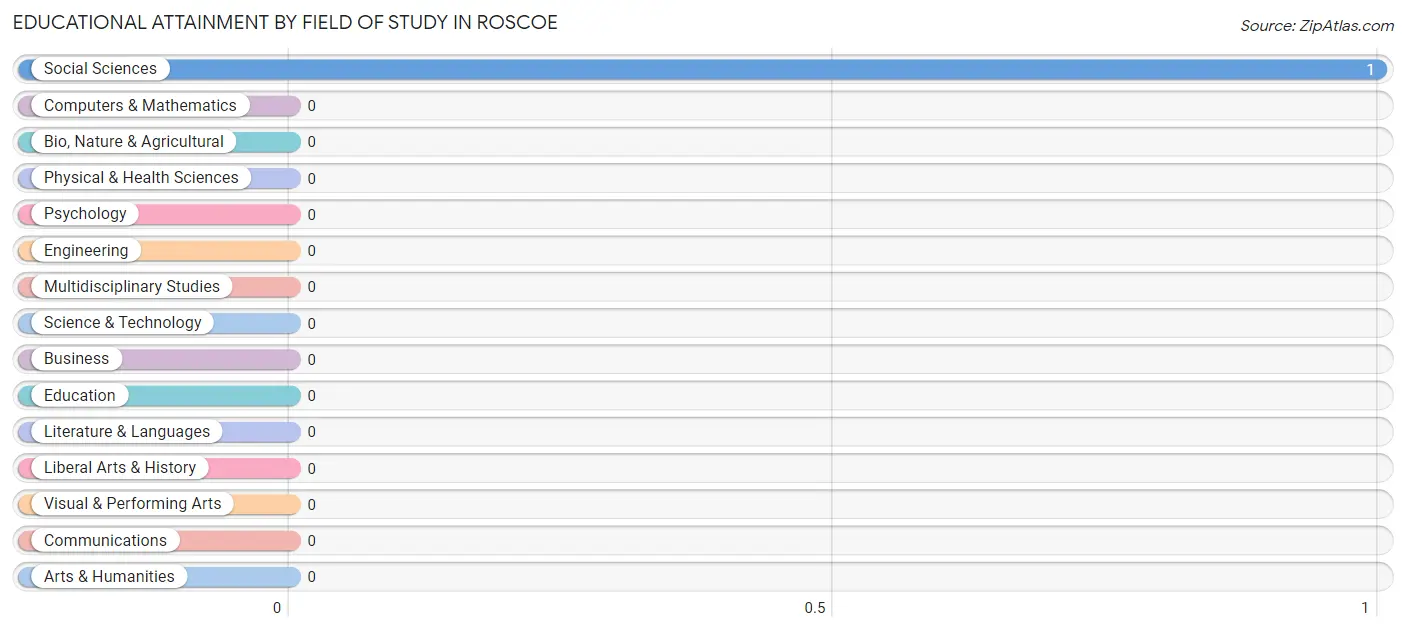
| Field of Study | # Graduates | % Graduates |
| Computers & Mathematics | 0 | 0.0% |
| Bio, Nature & Agricultural | 0 | 0.0% |
| Physical & Health Sciences | 0 | 0.0% |
| Psychology | 0 | 0.0% |
| Social Sciences | 1 | 100.0% |
| Engineering | 0 | 0.0% |
| Multidisciplinary Studies | 0 | 0.0% |
| Science & Technology | 0 | 0.0% |
| Business | 0 | 0.0% |
| Education | 0 | 0.0% |
| Literature & Languages | 0 | 0.0% |
| Liberal Arts & History | 0 | 0.0% |
| Visual & Performing Arts | 0 | 0.0% |
| Communications | 0 | 0.0% |
| Arts & Humanities | 0 | 0.0% |
| Total | 1 | 100.0% |
Transportation & Commute in Roscoe
Vehicle Availability by Sex in Roscoe
The most prevalent vehicle ownership categories in Roscoe are males with 3 vehicles (19, accounting for 59.4%) and females with 3 vehicles (9, making up 105.6%).
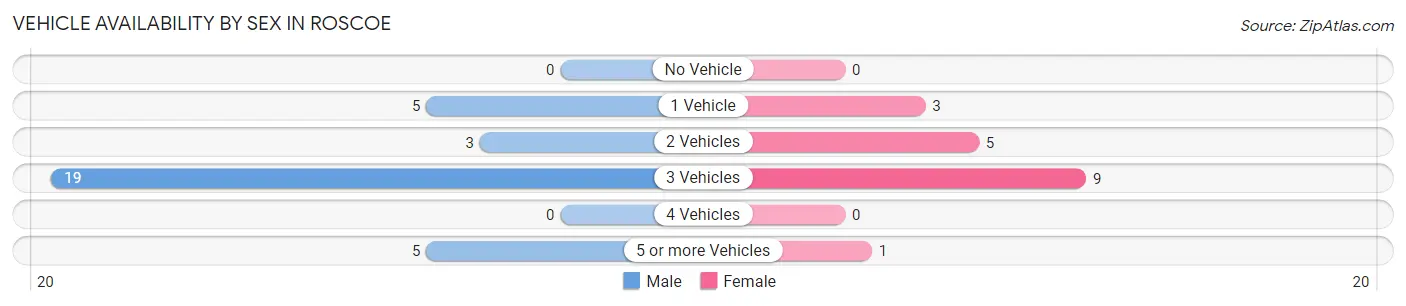
| Vehicles Available | Male | Female |
| No Vehicle | 0 (0.0%) | 0 (0.0%) |
| 1 Vehicle | 5 (15.6%) | 3 (16.7%) |
| 2 Vehicles | 3 (9.4%) | 5 (27.8%) |
| 3 Vehicles | 19 (59.4%) | 9 (50.0%) |
| 4 Vehicles | 0 (0.0%) | 0 (0.0%) |
| 5 or more Vehicles | 5 (15.6%) | 1 (5.6%) |
| Total | 32 (100.0%) | 18 (100.0%) |
Commute Time in Roscoe
The most frequently occuring commute durations in Roscoe are 30 to 34 minutes (12 commuters, 24.5%), 10 to 14 minutes (9 commuters, 18.4%), and 15 to 19 minutes (9 commuters, 18.4%).
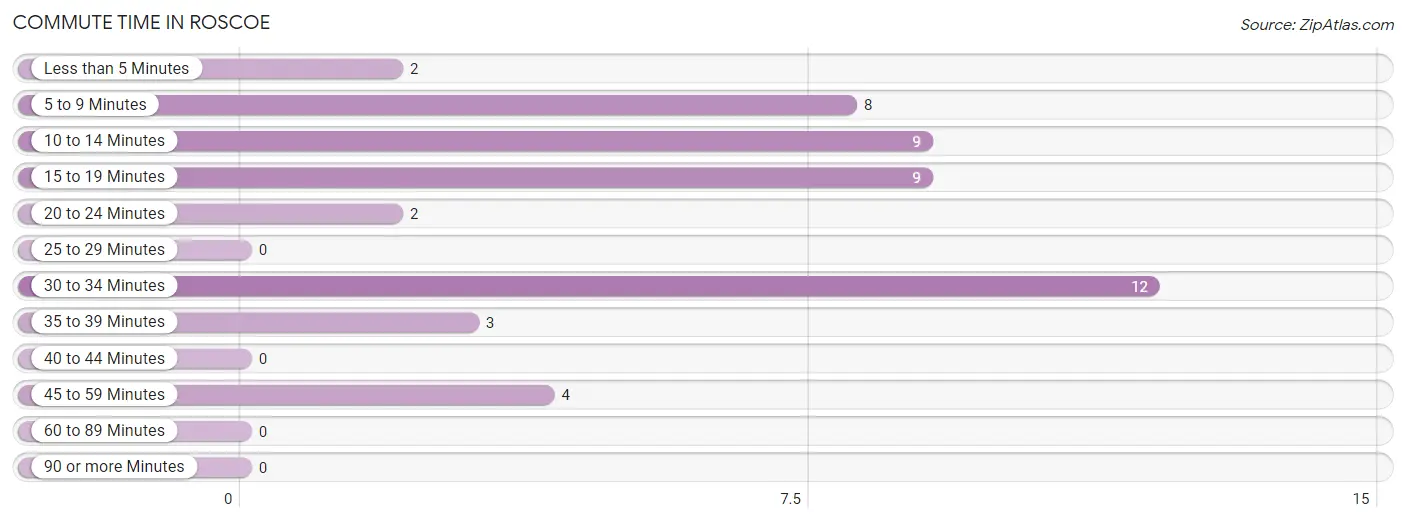
| Commute Time | # Commuters | % Commuters |
| Less than 5 Minutes | 2 | 4.1% |
| 5 to 9 Minutes | 8 | 16.3% |
| 10 to 14 Minutes | 9 | 18.4% |
| 15 to 19 Minutes | 9 | 18.4% |
| 20 to 24 Minutes | 2 | 4.1% |
| 25 to 29 Minutes | 0 | 0.0% |
| 30 to 34 Minutes | 12 | 24.5% |
| 35 to 39 Minutes | 3 | 6.1% |
| 40 to 44 Minutes | 0 | 0.0% |
| 45 to 59 Minutes | 4 | 8.2% |
| 60 to 89 Minutes | 0 | 0.0% |
| 90 or more Minutes | 0 | 0.0% |
Commute Time by Sex in Roscoe
The most common commute times in Roscoe are 15 to 19 minutes (8 commuters, 25.8%) for males and 30 to 34 minutes (7 commuters, 38.9%) for females.
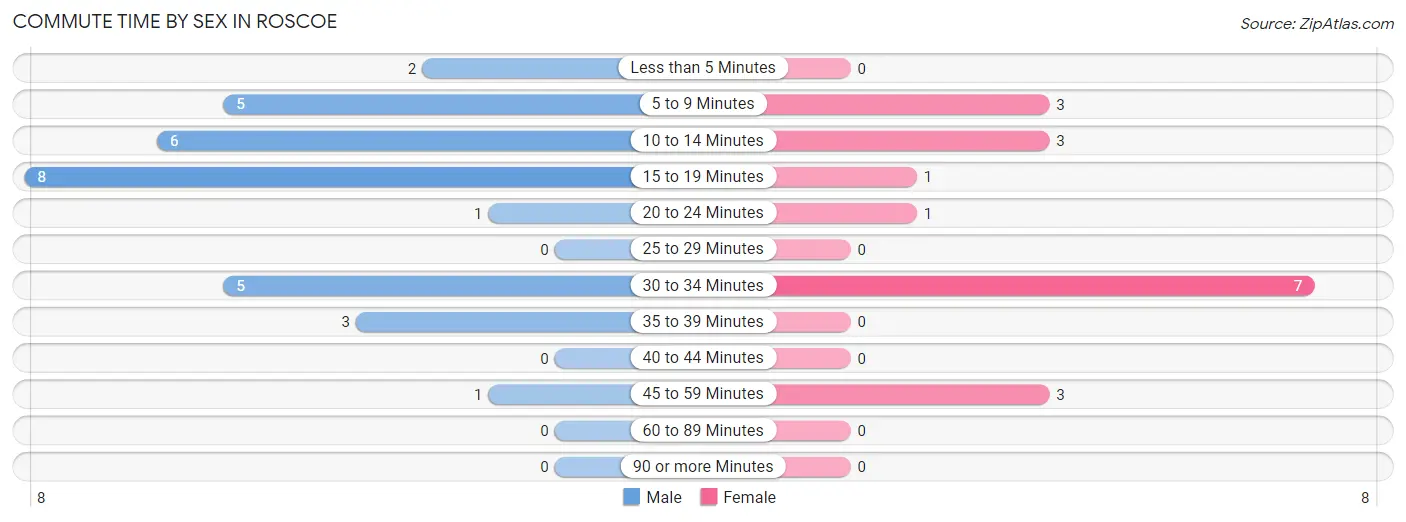
| Commute Time | Male | Female |
| Less than 5 Minutes | 2 (6.5%) | 0 (0.0%) |
| 5 to 9 Minutes | 5 (16.1%) | 3 (16.7%) |
| 10 to 14 Minutes | 6 (19.4%) | 3 (16.7%) |
| 15 to 19 Minutes | 8 (25.8%) | 1 (5.6%) |
| 20 to 24 Minutes | 1 (3.2%) | 1 (5.6%) |
| 25 to 29 Minutes | 0 (0.0%) | 0 (0.0%) |
| 30 to 34 Minutes | 5 (16.1%) | 7 (38.9%) |
| 35 to 39 Minutes | 3 (9.7%) | 0 (0.0%) |
| 40 to 44 Minutes | 0 (0.0%) | 0 (0.0%) |
| 45 to 59 Minutes | 1 (3.2%) | 3 (16.7%) |
| 60 to 89 Minutes | 0 (0.0%) | 0 (0.0%) |
| 90 or more Minutes | 0 (0.0%) | 0 (0.0%) |
Time of Departure to Work by Sex in Roscoe
The most frequent times of departure to work in Roscoe are 7:00 AM to 7:29 AM (14, 45.2%) for males and 5:00 AM to 5:29 AM (8, 44.4%) for females.
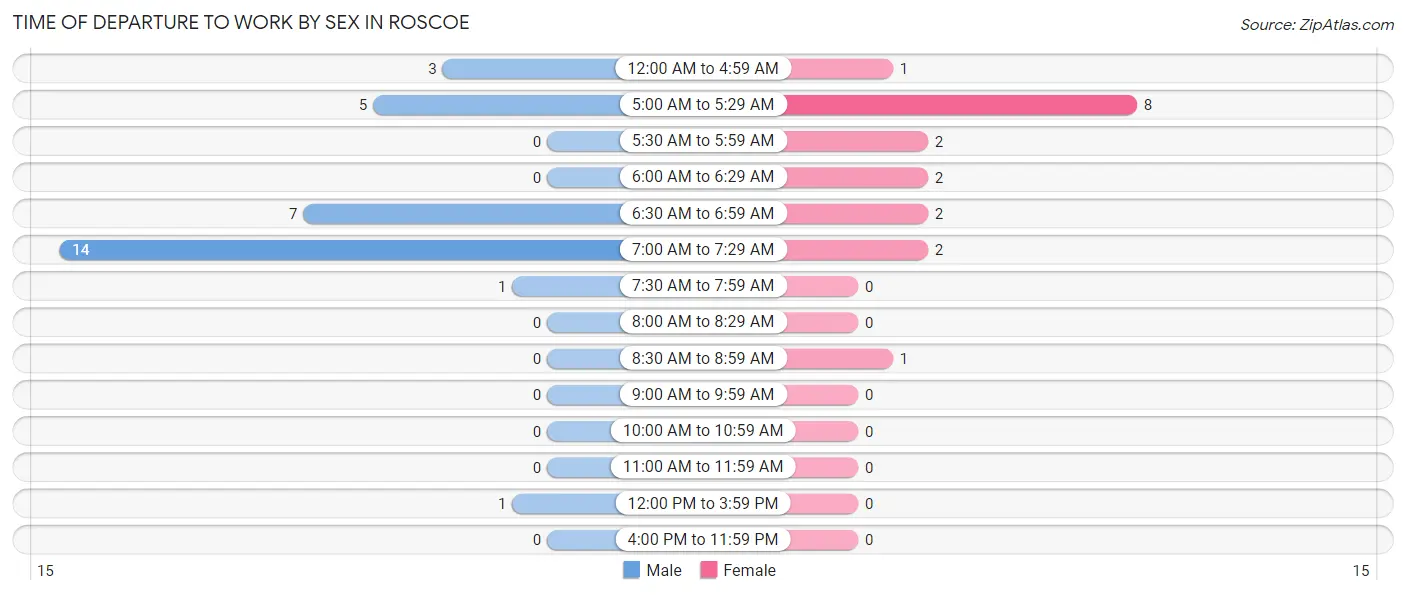
| Time of Departure | Male | Female |
| 12:00 AM to 4:59 AM | 3 (9.7%) | 1 (5.6%) |
| 5:00 AM to 5:29 AM | 5 (16.1%) | 8 (44.4%) |
| 5:30 AM to 5:59 AM | 0 (0.0%) | 2 (11.1%) |
| 6:00 AM to 6:29 AM | 0 (0.0%) | 2 (11.1%) |
| 6:30 AM to 6:59 AM | 7 (22.6%) | 2 (11.1%) |
| 7:00 AM to 7:29 AM | 14 (45.2%) | 2 (11.1%) |
| 7:30 AM to 7:59 AM | 1 (3.2%) | 0 (0.0%) |
| 8:00 AM to 8:29 AM | 0 (0.0%) | 0 (0.0%) |
| 8:30 AM to 8:59 AM | 0 (0.0%) | 1 (5.6%) |
| 9:00 AM to 9:59 AM | 0 (0.0%) | 0 (0.0%) |
| 10:00 AM to 10:59 AM | 0 (0.0%) | 0 (0.0%) |
| 11:00 AM to 11:59 AM | 0 (0.0%) | 0 (0.0%) |
| 12:00 PM to 3:59 PM | 1 (3.2%) | 0 (0.0%) |
| 4:00 PM to 11:59 PM | 0 (0.0%) | 0 (0.0%) |
| Total | 31 (100.0%) | 18 (100.0%) |
Housing Occupancy in Roscoe
Occupancy by Ownership in Roscoe
Of the total 37 dwellings in Roscoe, owner-occupied units account for 22 (59.5%), while renter-occupied units make up 15 (40.5%).
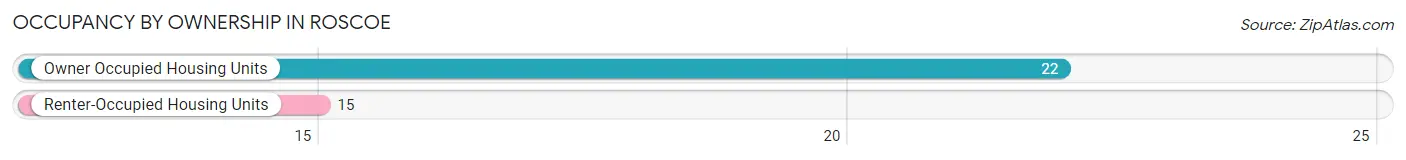
| Occupancy | # Housing Units | % Housing Units |
| Owner Occupied Housing Units | 22 | 59.5% |
| Renter-Occupied Housing Units | 15 | 40.5% |
| Total Occupied Housing Units | 37 | 100.0% |
Occupancy by Household Size in Roscoe
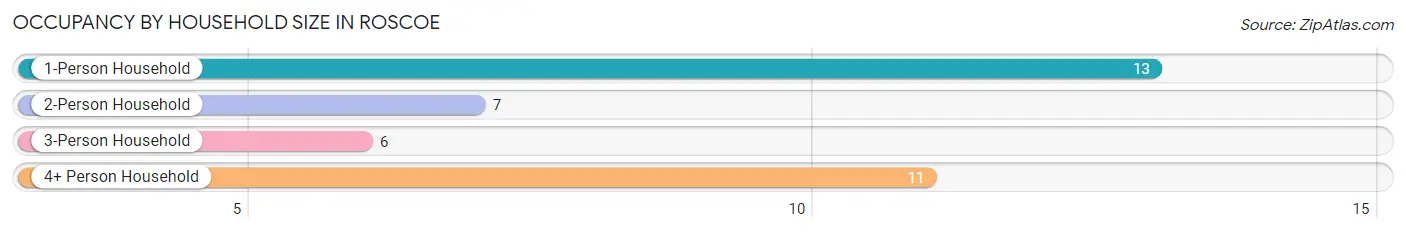
| Household Size | # Housing Units | % Housing Units |
| 1-Person Household | 13 | 35.1% |
| 2-Person Household | 7 | 18.9% |
| 3-Person Household | 6 | 16.2% |
| 4+ Person Household | 11 | 29.7% |
| Total Housing Units | 37 | 100.0% |
Occupancy by Ownership by Household Size in Roscoe
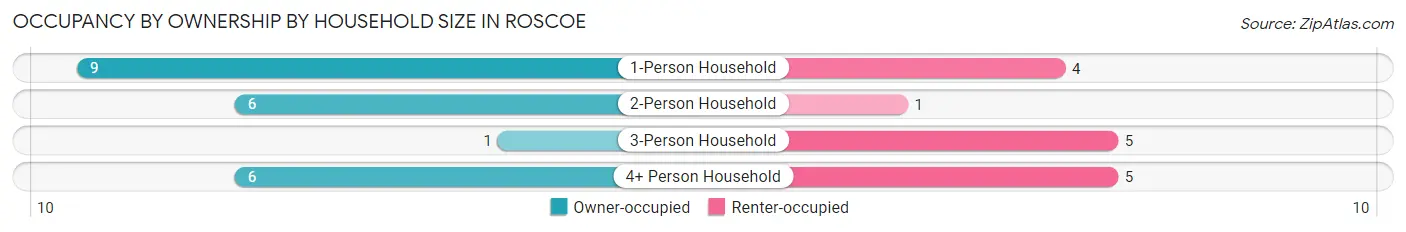
| Household Size | Owner-occupied | Renter-occupied |
| 1-Person Household | 9 (69.2%) | 4 (30.8%) |
| 2-Person Household | 6 (85.7%) | 1 (14.3%) |
| 3-Person Household | 1 (16.7%) | 5 (83.3%) |
| 4+ Person Household | 6 (54.5%) | 5 (45.5%) |
| Total Housing Units | 22 (59.5%) | 15 (40.5%) |
Occupancy by Educational Attainment in Roscoe
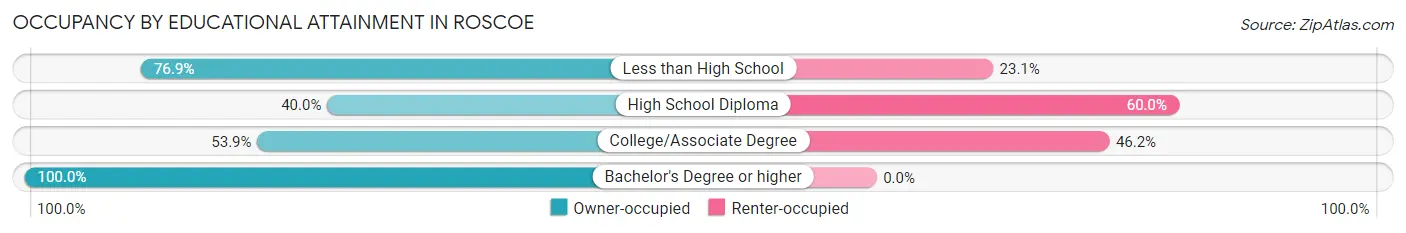
| Household Size | Owner-occupied | Renter-occupied |
| Less than High School | 10 (76.9%) | 3 (23.1%) |
| High School Diploma | 4 (40.0%) | 6 (60.0%) |
| College/Associate Degree | 7 (53.8%) | 6 (46.2%) |
| Bachelor's Degree or higher | 1 (100.0%) | 0 (0.0%) |
Occupancy by Age of Householder in Roscoe
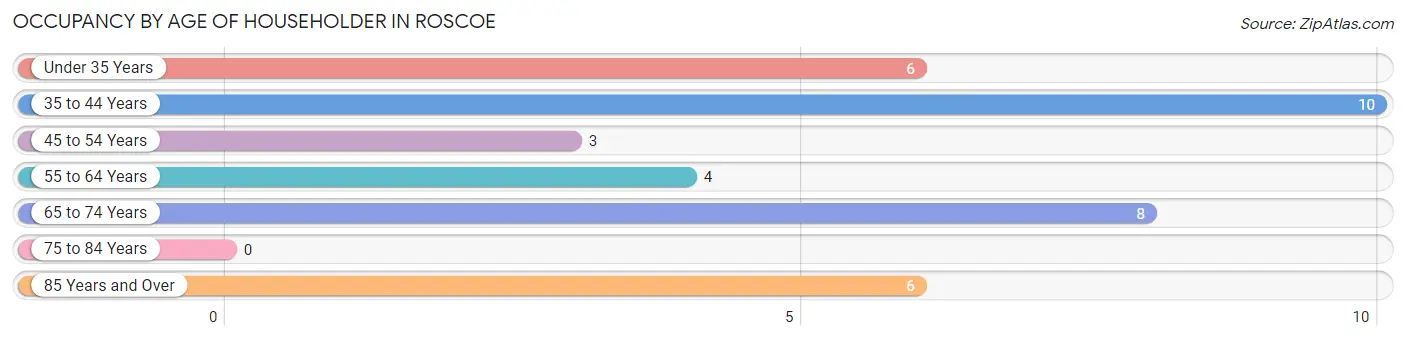
| Age Bracket | # Households | % Households |
| Under 35 Years | 6 | 16.2% |
| 35 to 44 Years | 10 | 27.0% |
| 45 to 54 Years | 3 | 8.1% |
| 55 to 64 Years | 4 | 10.8% |
| 65 to 74 Years | 8 | 21.6% |
| 75 to 84 Years | 0 | 0.0% |
| 85 Years and Over | 6 | 16.2% |
| Total | 37 | 100.0% |
Housing Finances in Roscoe
Median Income by Occupancy in Roscoe
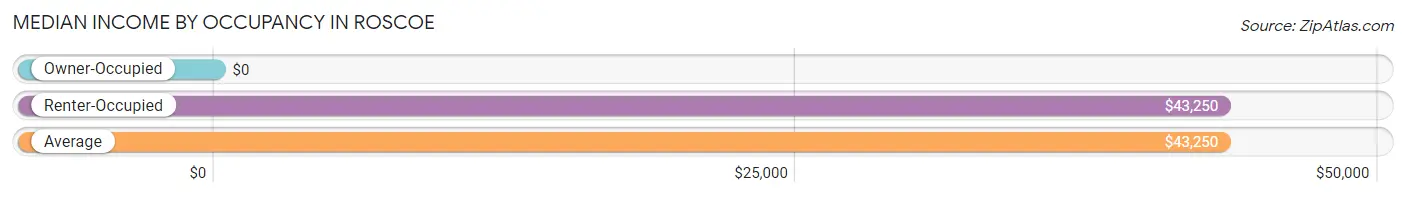
| Occupancy Type | # Households | Median Income |
| Owner-Occupied | 22 (59.5%) | $0 |
| Renter-Occupied | 15 (40.5%) | $43,250 |
| Average | 37 (100.0%) | $43,250 |
Occupancy by Householder Income Bracket in Roscoe
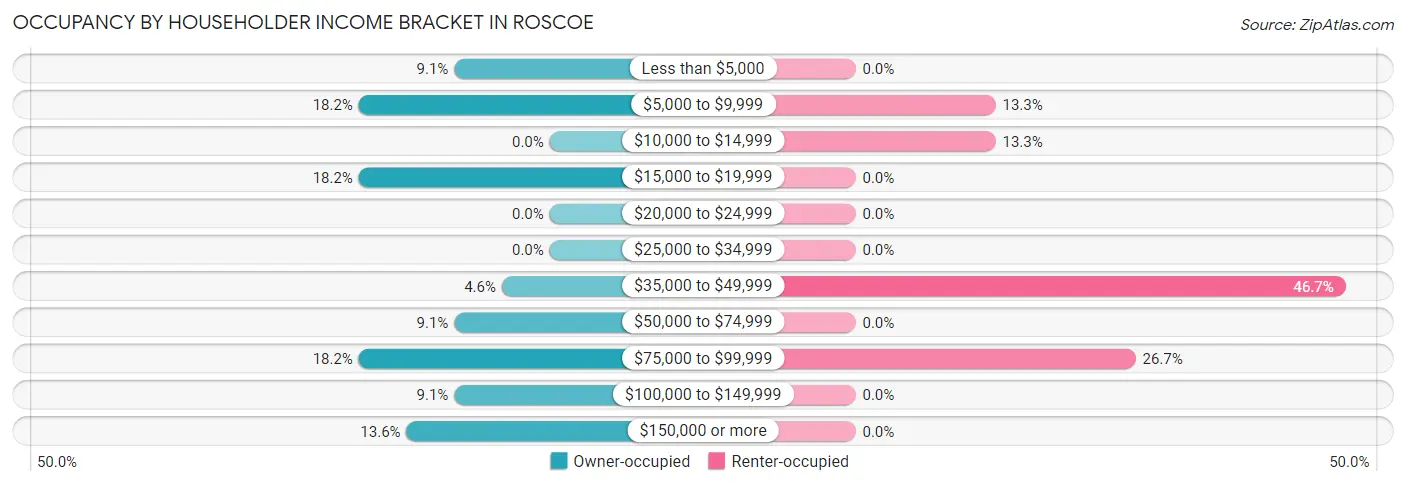
| Income Bracket | Owner-occupied | Renter-occupied |
| Less than $5,000 | 2 (9.1%) | 0 (0.0%) |
| $5,000 to $9,999 | 4 (18.2%) | 2 (13.3%) |
| $10,000 to $14,999 | 0 (0.0%) | 2 (13.3%) |
| $15,000 to $19,999 | 4 (18.2%) | 0 (0.0%) |
| $20,000 to $24,999 | 0 (0.0%) | 0 (0.0%) |
| $25,000 to $34,999 | 0 (0.0%) | 0 (0.0%) |
| $35,000 to $49,999 | 1 (4.5%) | 7 (46.7%) |
| $50,000 to $74,999 | 2 (9.1%) | 0 (0.0%) |
| $75,000 to $99,999 | 4 (18.2%) | 4 (26.7%) |
| $100,000 to $149,999 | 2 (9.1%) | 0 (0.0%) |
| $150,000 or more | 3 (13.6%) | 0 (0.0%) |
| Total | 22 (100.0%) | 15 (100.0%) |
Monthly Housing Cost Tiers in Roscoe
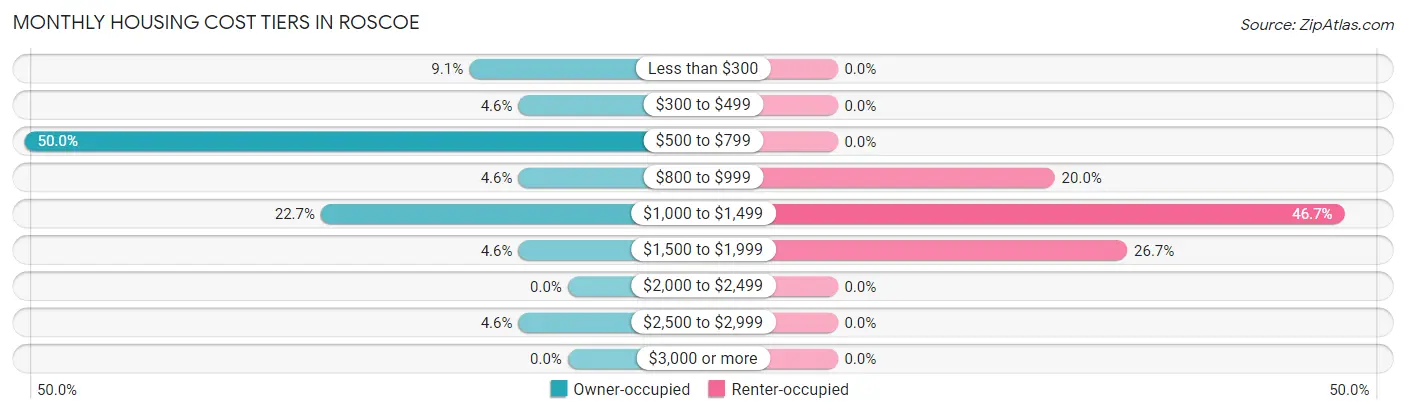
| Monthly Cost | Owner-occupied | Renter-occupied |
| Less than $300 | 2 (9.1%) | 0 (0.0%) |
| $300 to $499 | 1 (4.5%) | 0 (0.0%) |
| $500 to $799 | 11 (50.0%) | 0 (0.0%) |
| $800 to $999 | 1 (4.5%) | 3 (20.0%) |
| $1,000 to $1,499 | 5 (22.7%) | 7 (46.7%) |
| $1,500 to $1,999 | 1 (4.5%) | 4 (26.7%) |
| $2,000 to $2,499 | 0 (0.0%) | 0 (0.0%) |
| $2,500 to $2,999 | 1 (4.5%) | 0 (0.0%) |
| $3,000 or more | 0 (0.0%) | 0 (0.0%) |
| Total | 22 (100.0%) | 15 (100.0%) |
Physical Housing Characteristics in Roscoe
Housing Structures in Roscoe
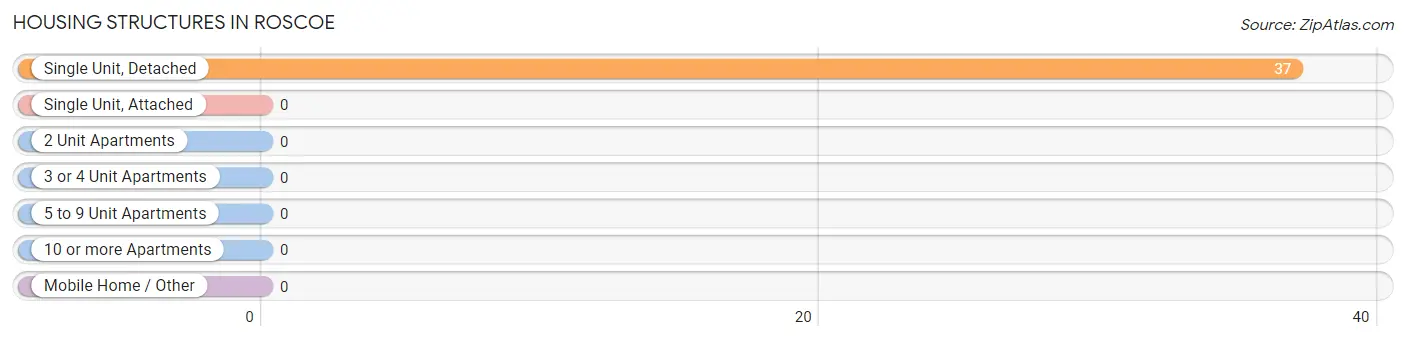
| Structure Type | # Housing Units | % Housing Units |
| Single Unit, Detached | 37 | 100.0% |
| Single Unit, Attached | 0 | 0.0% |
| 2 Unit Apartments | 0 | 0.0% |
| 3 or 4 Unit Apartments | 0 | 0.0% |
| 5 to 9 Unit Apartments | 0 | 0.0% |
| 10 or more Apartments | 0 | 0.0% |
| Mobile Home / Other | 0 | 0.0% |
| Total | 37 | 100.0% |
Housing Structures by Occupancy in Roscoe
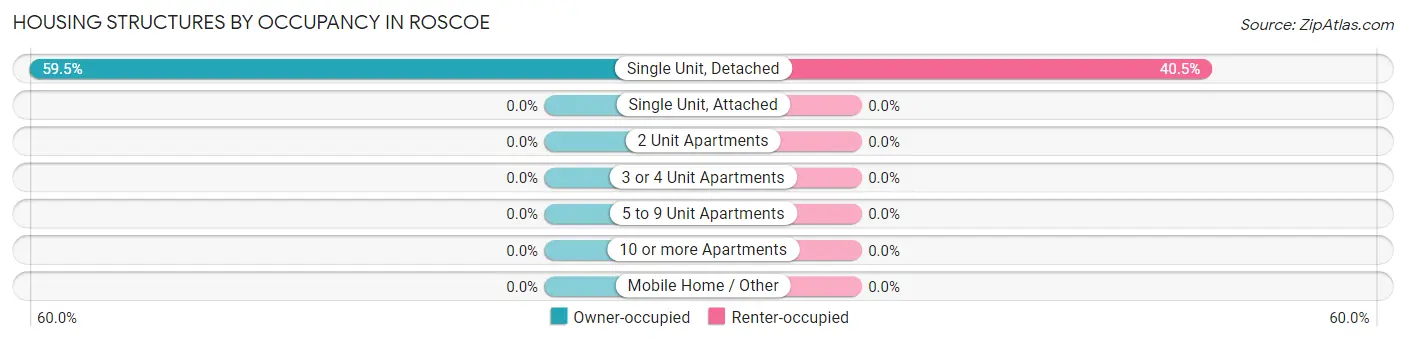
| Structure Type | Owner-occupied | Renter-occupied |
| Single Unit, Detached | 22 (59.5%) | 15 (40.5%) |
| Single Unit, Attached | 0 (0.0%) | 0 (0.0%) |
| 2 Unit Apartments | 0 (0.0%) | 0 (0.0%) |
| 3 or 4 Unit Apartments | 0 (0.0%) | 0 (0.0%) |
| 5 to 9 Unit Apartments | 0 (0.0%) | 0 (0.0%) |
| 10 or more Apartments | 0 (0.0%) | 0 (0.0%) |
| Mobile Home / Other | 0 (0.0%) | 0 (0.0%) |
| Total | 22 (59.5%) | 15 (40.5%) |
Housing Structures by Number of Rooms in Roscoe
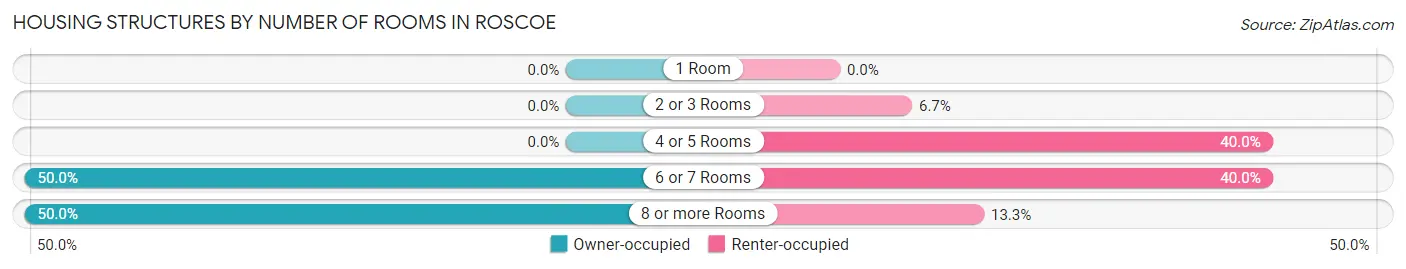
| Number of Rooms | Owner-occupied | Renter-occupied |
| 1 Room | 0 (0.0%) | 0 (0.0%) |
| 2 or 3 Rooms | 0 (0.0%) | 1 (6.7%) |
| 4 or 5 Rooms | 0 (0.0%) | 6 (40.0%) |
| 6 or 7 Rooms | 11 (50.0%) | 6 (40.0%) |
| 8 or more Rooms | 11 (50.0%) | 2 (13.3%) |
| Total | 22 (100.0%) | 15 (100.0%) |
Housing Structure by Heating Type in Roscoe
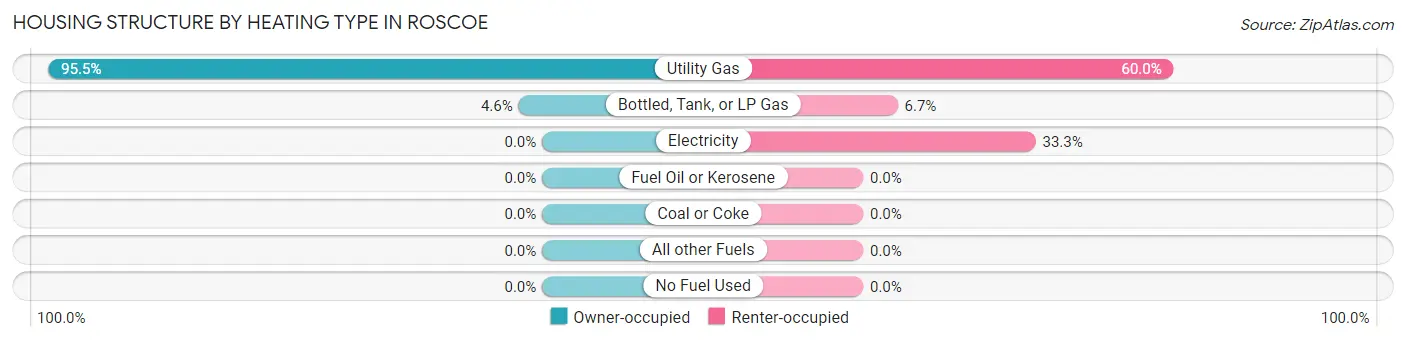
| Heating Type | Owner-occupied | Renter-occupied |
| Utility Gas | 21 (95.5%) | 9 (60.0%) |
| Bottled, Tank, or LP Gas | 1 (4.5%) | 1 (6.7%) |
| Electricity | 0 (0.0%) | 5 (33.3%) |
| Fuel Oil or Kerosene | 0 (0.0%) | 0 (0.0%) |
| Coal or Coke | 0 (0.0%) | 0 (0.0%) |
| All other Fuels | 0 (0.0%) | 0 (0.0%) |
| No Fuel Used | 0 (0.0%) | 0 (0.0%) |
| Total | 22 (100.0%) | 15 (100.0%) |
Household Vehicle Usage in Roscoe
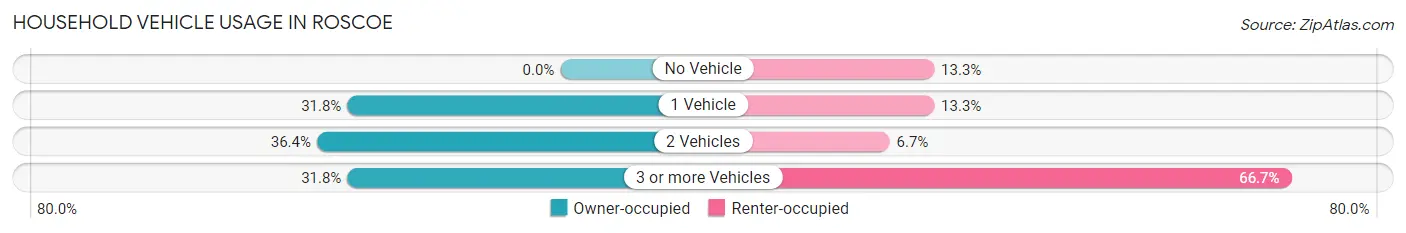
| Vehicles per Household | Owner-occupied | Renter-occupied |
| No Vehicle | 0 (0.0%) | 2 (13.3%) |
| 1 Vehicle | 7 (31.8%) | 2 (13.3%) |
| 2 Vehicles | 8 (36.4%) | 1 (6.7%) |
| 3 or more Vehicles | 7 (31.8%) | 10 (66.7%) |
| Total | 22 (100.0%) | 15 (100.0%) |
Real Estate & Mortgages in Roscoe
Real Estate and Mortgage Overview in Roscoe
| Characteristic | Without Mortgage | With Mortgage |
| Housing Units | 12 | 10 |
| Median Property Value | $185,000 | $137,500 |
| Median Household Income | - | - |
| Monthly Housing Costs | $575 | $0 |
| Real Estate Taxes | $1,500 | $0 |
Property Value by Mortgage Status in Roscoe
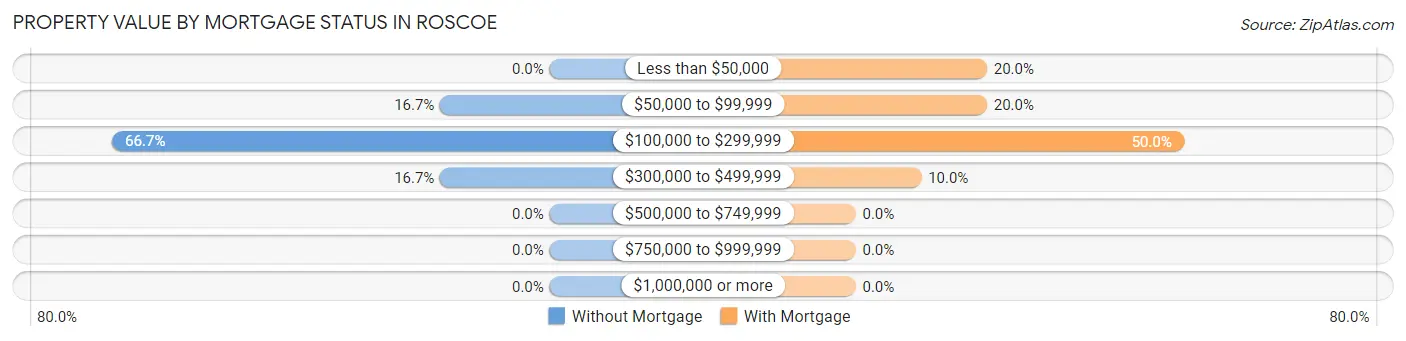
| Property Value | Without Mortgage | With Mortgage |
| Less than $50,000 | 0 (0.0%) | 2 (20.0%) |
| $50,000 to $99,999 | 2 (16.7%) | 2 (20.0%) |
| $100,000 to $299,999 | 8 (66.7%) | 5 (50.0%) |
| $300,000 to $499,999 | 2 (16.7%) | 1 (10.0%) |
| $500,000 to $749,999 | 0 (0.0%) | 0 (0.0%) |
| $750,000 to $999,999 | 0 (0.0%) | 0 (0.0%) |
| $1,000,000 or more | 0 (0.0%) | 0 (0.0%) |
| Total | 12 (100.0%) | 10 (100.0%) |
Household Income by Mortgage Status in Roscoe
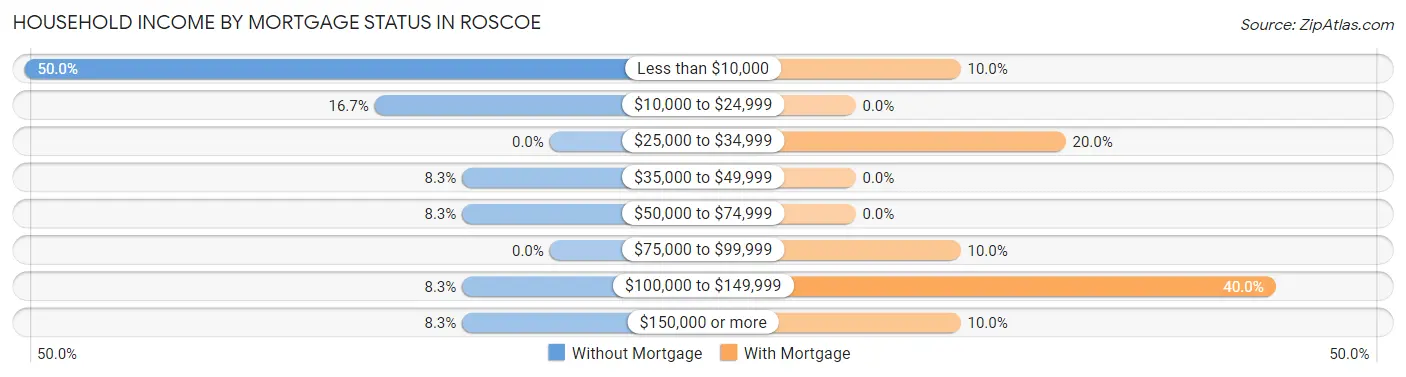
| Household Income | Without Mortgage | With Mortgage |
| Less than $10,000 | 6 (50.0%) | 1 (10.0%) |
| $10,000 to $24,999 | 2 (16.7%) | 0 (0.0%) |
| $25,000 to $34,999 | 0 (0.0%) | 2 (20.0%) |
| $35,000 to $49,999 | 1 (8.3%) | 0 (0.0%) |
| $50,000 to $74,999 | 1 (8.3%) | 0 (0.0%) |
| $75,000 to $99,999 | 0 (0.0%) | 1 (10.0%) |
| $100,000 to $149,999 | 1 (8.3%) | 4 (40.0%) |
| $150,000 or more | 1 (8.3%) | 1 (10.0%) |
| Total | 12 (100.0%) | 10 (100.0%) |
Property Value to Household Income Ratio in Roscoe
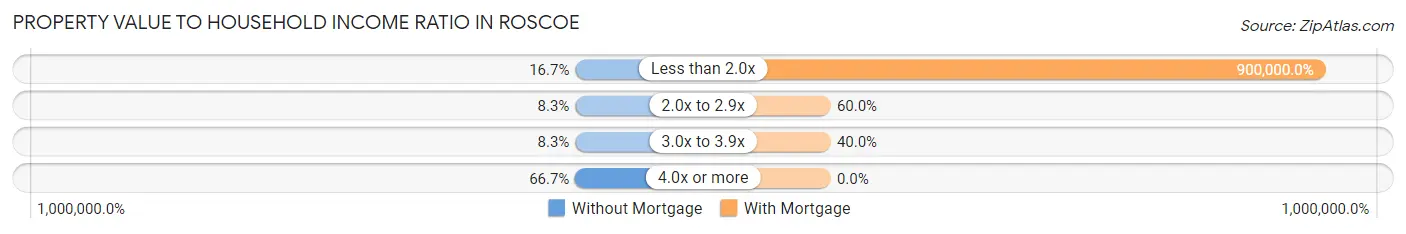
| Value-to-Income Ratio | Without Mortgage | With Mortgage |
| Less than 2.0x | 2 (16.7%) | 90,000 (900,000.0%) |
| 2.0x to 2.9x | 1 (8.3%) | 6 (60.0%) |
| 3.0x to 3.9x | 1 (8.3%) | 4 (40.0%) |
| 4.0x or more | 8 (66.7%) | 0 (0.0%) |
| Total | 12 (100.0%) | 10 (100.0%) |
Real Estate Taxes by Mortgage Status in Roscoe
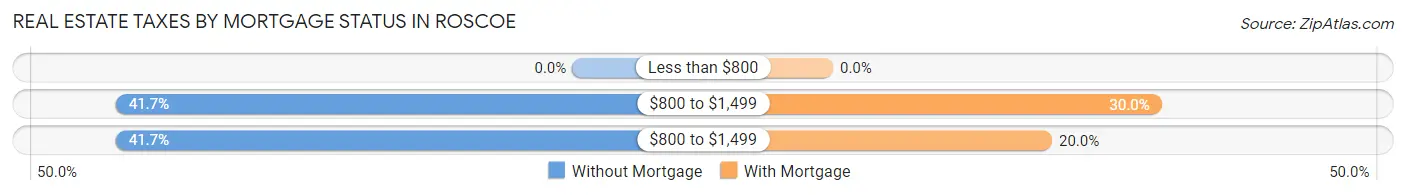
| Property Taxes | Without Mortgage | With Mortgage |
| Less than $800 | 0 (0.0%) | 0 (0.0%) |
| $800 to $1,499 | 5 (41.7%) | 3 (30.0%) |
| $800 to $1,499 | 5 (41.7%) | 2 (20.0%) |
| Total | 12 (100.0%) | 10 (100.0%) |
Health & Disability in Roscoe
Health Insurance Coverage by Age in Roscoe
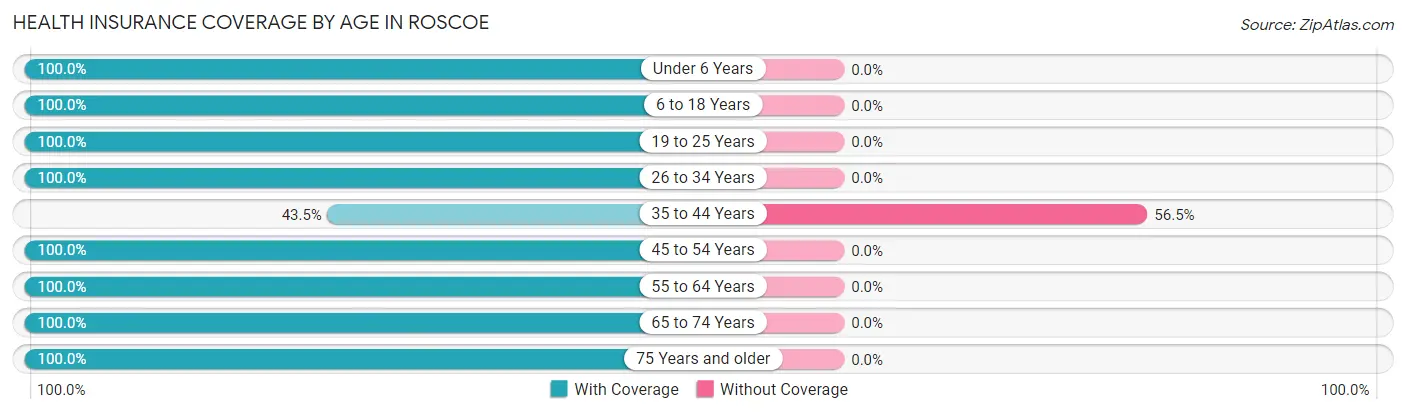
| Age Bracket | With Coverage | Without Coverage |
| Under 6 Years | 11 (100.0%) | 0 (0.0%) |
| 6 to 18 Years | 18 (100.0%) | 0 (0.0%) |
| 19 to 25 Years | 9 (100.0%) | 0 (0.0%) |
| 26 to 34 Years | 11 (100.0%) | 0 (0.0%) |
| 35 to 44 Years | 10 (43.5%) | 13 (56.5%) |
| 45 to 54 Years | 6 (100.0%) | 0 (0.0%) |
| 55 to 64 Years | 7 (100.0%) | 0 (0.0%) |
| 65 to 74 Years | 10 (100.0%) | 0 (0.0%) |
| 75 Years and older | 9 (100.0%) | 0 (0.0%) |
| Total | 91 (87.5%) | 13 (12.5%) |
Health Insurance Coverage by Citizenship Status in Roscoe
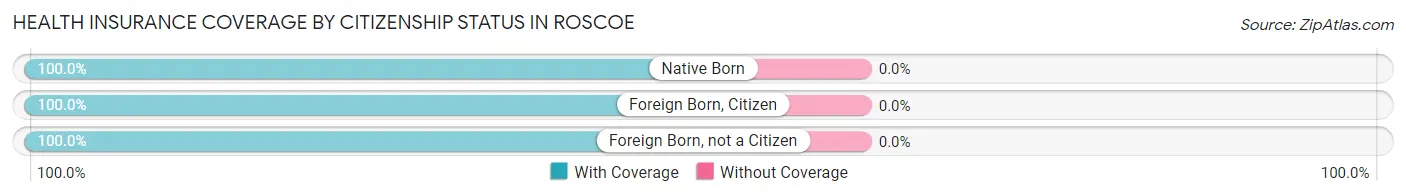
| Citizenship Status | With Coverage | Without Coverage |
| Native Born | 11 (100.0%) | 0 (0.0%) |
| Foreign Born, Citizen | 18 (100.0%) | 0 (0.0%) |
| Foreign Born, not a Citizen | 9 (100.0%) | 0 (0.0%) |
Health Insurance Coverage by Household Income in Roscoe
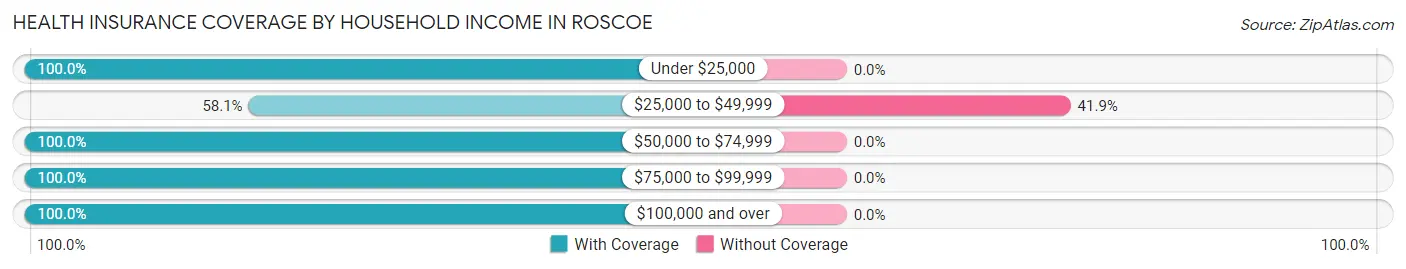
| Household Income | With Coverage | Without Coverage |
| Under $25,000 | 22 (100.0%) | 0 (0.0%) |
| $25,000 to $49,999 | 18 (58.1%) | 13 (41.9%) |
| $50,000 to $74,999 | 5 (100.0%) | 0 (0.0%) |
| $75,000 to $99,999 | 29 (100.0%) | 0 (0.0%) |
| $100,000 and over | 17 (100.0%) | 0 (0.0%) |
Public vs Private Health Insurance Coverage by Age in Roscoe
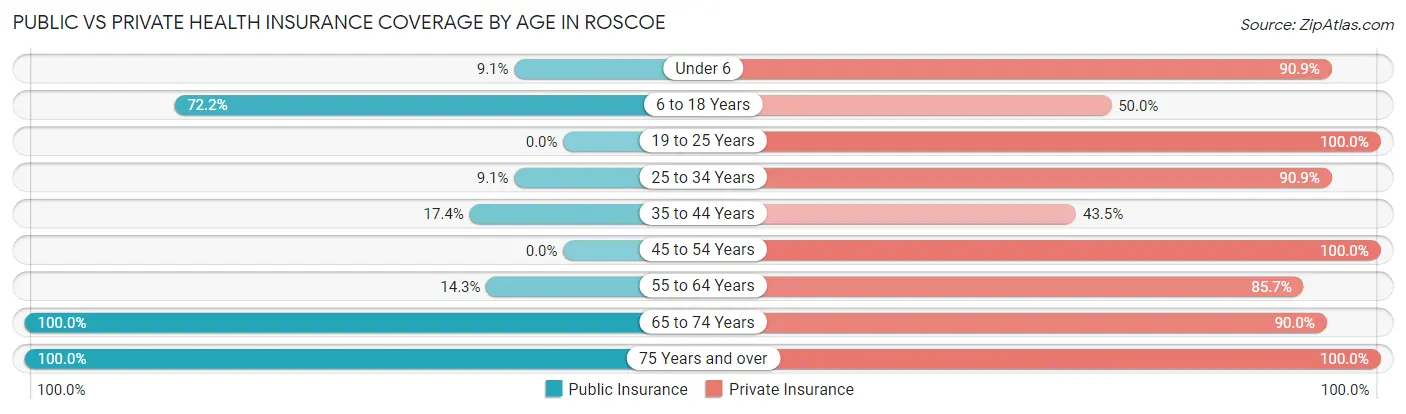
| Age Bracket | Public Insurance | Private Insurance |
| Under 6 | 1 (9.1%) | 10 (90.9%) |
| 6 to 18 Years | 13 (72.2%) | 9 (50.0%) |
| 19 to 25 Years | 0 (0.0%) | 9 (100.0%) |
| 25 to 34 Years | 1 (9.1%) | 10 (90.9%) |
| 35 to 44 Years | 4 (17.4%) | 10 (43.5%) |
| 45 to 54 Years | 0 (0.0%) | 6 (100.0%) |
| 55 to 64 Years | 1 (14.3%) | 6 (85.7%) |
| 65 to 74 Years | 10 (100.0%) | 9 (90.0%) |
| 75 Years and over | 9 (100.0%) | 9 (100.0%) |
| Total | 39 (37.5%) | 78 (75.0%) |
Disability Status by Sex by Age in Roscoe
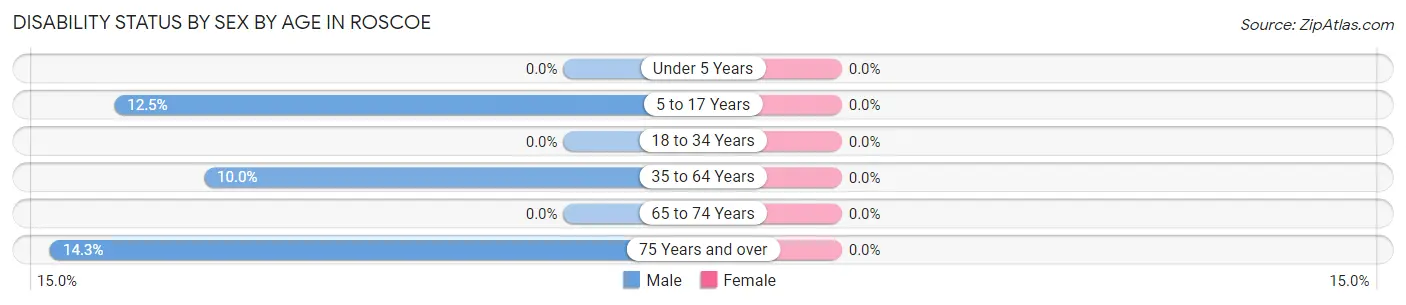
| Age Bracket | Male | Female |
| Under 5 Years | 0 (0.0%) | 0 (0.0%) |
| 5 to 17 Years | 2 (12.5%) | 0 (0.0%) |
| 18 to 34 Years | 0 (0.0%) | 0 (0.0%) |
| 35 to 64 Years | 2 (10.0%) | 0 (0.0%) |
| 65 to 74 Years | 0 (0.0%) | 0 (0.0%) |
| 75 Years and over | 1 (14.3%) | 0 (0.0%) |
Disability Class by Sex by Age in Roscoe
Disability Class: Hearing Difficulty
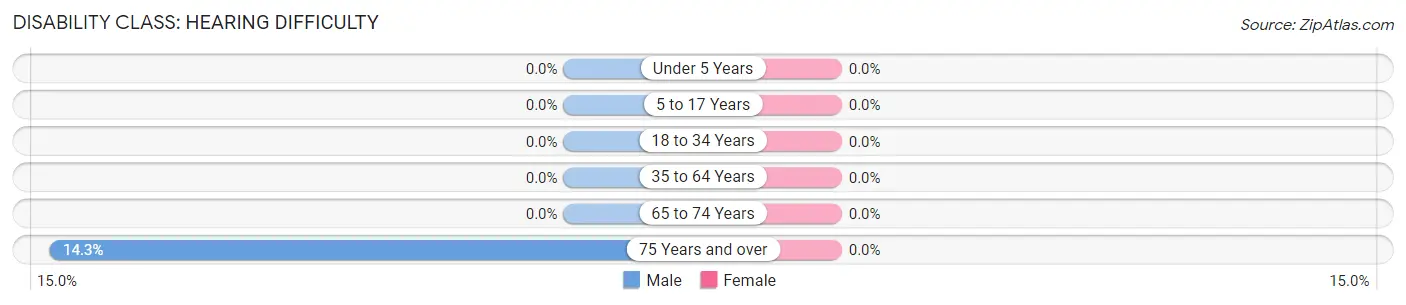
| Age Bracket | Male | Female |
| Under 5 Years | 0 (0.0%) | 0 (0.0%) |
| 5 to 17 Years | 0 (0.0%) | 0 (0.0%) |
| 18 to 34 Years | 0 (0.0%) | 0 (0.0%) |
| 35 to 64 Years | 0 (0.0%) | 0 (0.0%) |
| 65 to 74 Years | 0 (0.0%) | 0 (0.0%) |
| 75 Years and over | 1 (14.3%) | 0 (0.0%) |
Disability Class: Vision Difficulty
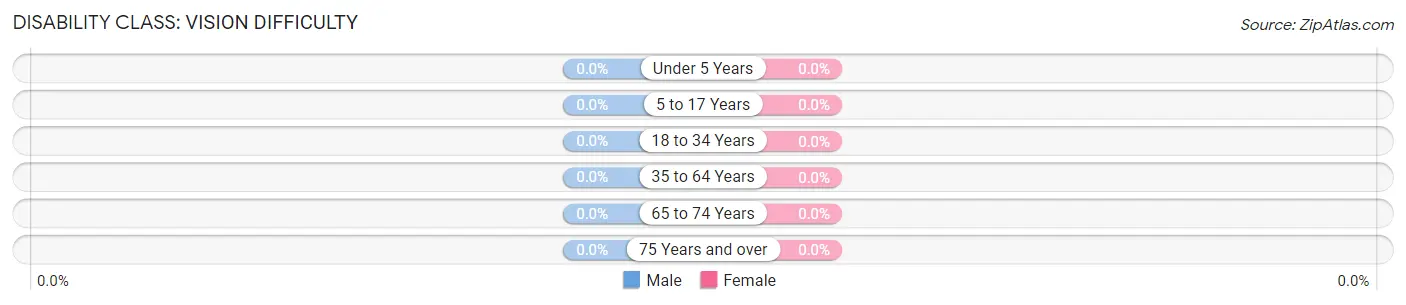
| Age Bracket | Male | Female |
| Under 5 Years | 0 (0.0%) | 0 (0.0%) |
| 5 to 17 Years | 0 (0.0%) | 0 (0.0%) |
| 18 to 34 Years | 0 (0.0%) | 0 (0.0%) |
| 35 to 64 Years | 0 (0.0%) | 0 (0.0%) |
| 65 to 74 Years | 0 (0.0%) | 0 (0.0%) |
| 75 Years and over | 0 (0.0%) | 0 (0.0%) |
Disability Class: Cognitive Difficulty
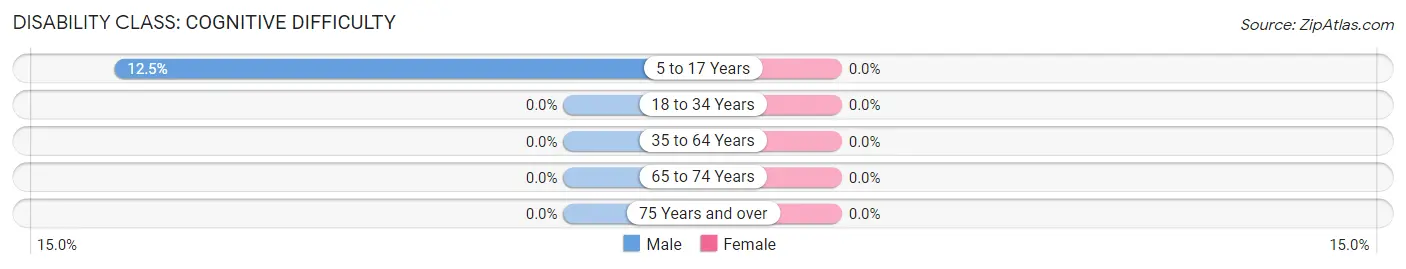
| Age Bracket | Male | Female |
| 5 to 17 Years | 2 (12.5%) | 0 (0.0%) |
| 18 to 34 Years | 0 (0.0%) | 0 (0.0%) |
| 35 to 64 Years | 0 (0.0%) | 0 (0.0%) |
| 65 to 74 Years | 0 (0.0%) | 0 (0.0%) |
| 75 Years and over | 0 (0.0%) | 0 (0.0%) |
Disability Class: Ambulatory Difficulty
| Age Bracket | Male | Female |
| 5 to 17 Years | 0 (0.0%) | 0 (0.0%) |
| 18 to 34 Years | 0 (0.0%) | 0 (0.0%) |
| 35 to 64 Years | 0 (0.0%) | 0 (0.0%) |
| 65 to 74 Years | 0 (0.0%) | 0 (0.0%) |
| 75 Years and over | 0 (0.0%) | 0 (0.0%) |
Disability Class: Self-Care Difficulty
| Age Bracket | Male | Female |
| 5 to 17 Years | 0 (0.0%) | 0 (0.0%) |
| 18 to 34 Years | 0 (0.0%) | 0 (0.0%) |
| 35 to 64 Years | 0 (0.0%) | 0 (0.0%) |
| 65 to 74 Years | 0 (0.0%) | 0 (0.0%) |
| 75 Years and over | 0 (0.0%) | 0 (0.0%) |
Technology Access in Roscoe
Computing Device Access in Roscoe
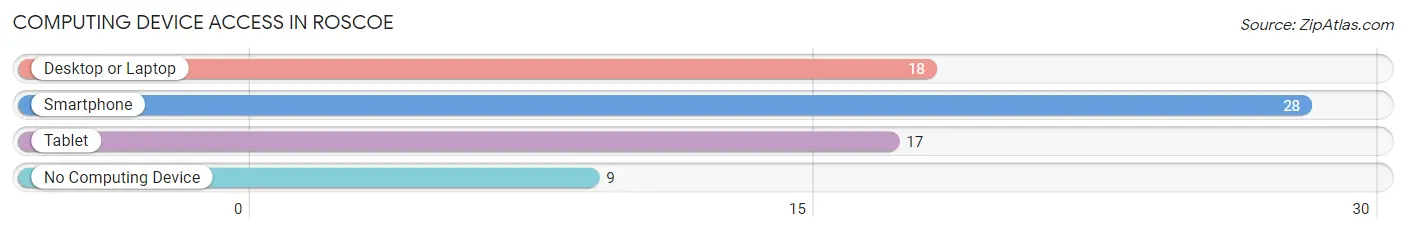
| Device Type | # Households | % Households |
| Desktop or Laptop | 18 | 48.6% |
| Smartphone | 28 | 75.7% |
| Tablet | 17 | 46.0% |
| No Computing Device | 9 | 24.3% |
| Total | 37 | 100.0% |
Internet Access in Roscoe
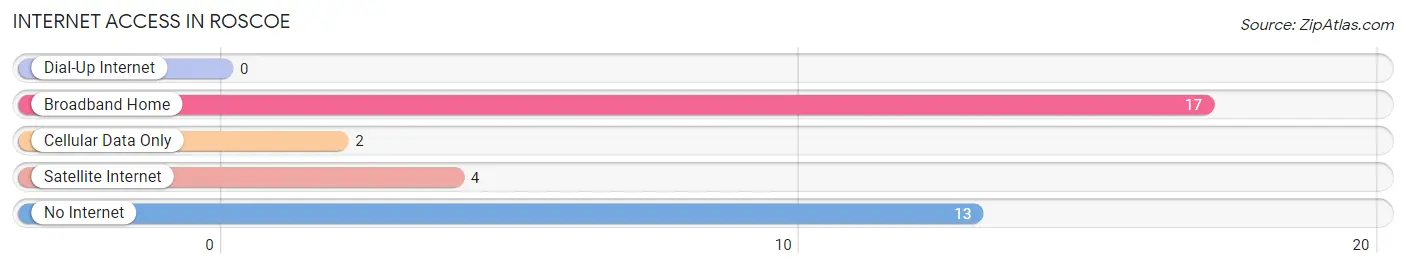
| Internet Type | # Households | % Households |
| Dial-Up Internet | 0 | 0.0% |
| Broadband Home | 17 | 46.0% |
| Cellular Data Only | 2 | 5.4% |
| Satellite Internet | 4 | 10.8% |
| No Internet | 13 | 35.1% |
| Total | 37 | 100.0% |
Roscoe Summary
Roscoe, Minnesota is a small town located in the southeastern corner of the state, near the border of Iowa. It is part of the Mower County and is situated on the banks of the Cedar River. The town was founded in 1856 and was named after Roscoe Conkling, a prominent politician of the time. The population of Roscoe was estimated to be around 500 people in 2020.
Geography
Roscoe is located in the southeastern corner of Minnesota, near the border of Iowa. It is part of Mower County and is situated on the banks of the Cedar River. The town is surrounded by rolling hills and farmland, with the nearest major city being Austin, which is about 20 miles away. The climate in Roscoe is generally mild, with temperatures ranging from the mid-30s in the winter to the mid-80s in the summer.
Economy
The economy of Roscoe is largely based on agriculture, with the majority of the population employed in farming and related industries. The town is also home to a number of small businesses, including a grocery store, a hardware store, and a few restaurants. The town also has a few manufacturing plants, which produce a variety of products, including furniture, clothing, and automotive parts.
Demographics
As of 2020, the population of Roscoe was estimated to be around 500 people. The majority of the population is white (95%), with the remaining 5% being made up of African Americans, Hispanics, and other ethnicities. The median household income in Roscoe is $45,000, and the median age is 43. The town has a low unemployment rate of 3.2%, and the poverty rate is 8.3%.
History
Roscoe was founded in 1856 and was named after Roscoe Conkling, a prominent politician of the time. The town was originally a farming community, and the first settlers were mostly of German and Scandinavian descent. The town grew slowly over the years, and by the early 1900s, it had become a thriving agricultural center. In the 1950s, the town began to experience a decline in population as many of the younger residents moved away in search of better job opportunities. However, the town has since seen a resurgence in population, and today it is a vibrant and thriving community.
Roscoe is a small town with a rich history and a bright future. It is a great place to live, work, and raise a family, and it offers a variety of activities and amenities for its residents. The town is home to a number of small businesses, and it is a great place to experience the rural lifestyle. Roscoe is a great place to call home.
Common Questions
What is Per Capita Income in Roscoe?
Per Capita income in Roscoe is $22,582.
What is the Median Family Income in Roscoe?
Median Family Income in Roscoe is $55,750.
What is the Median Household income in Roscoe?
Median Household Income in Roscoe is $43,250.
What is Inequality or Gini Index in Roscoe?
Inequality or Gini Index in Roscoe is 0.47.
What is the Total Population of Roscoe?
Total Population of Roscoe is 104.
What is the Total Male Population of Roscoe?
Total Male Population of Roscoe is 68.
What is the Total Female Population of Roscoe?
Total Female Population of Roscoe is 36.
What is the Ratio of Males per 100 Females in Roscoe?
There are 188.89 Males per 100 Females in Roscoe.
What is the Ratio of Females per 100 Males in Roscoe?
There are 52.94 Females per 100 Males in Roscoe.
What is the Median Population Age in Roscoe?
Median Population Age in Roscoe is 35.8 Years.
What is the Average Family Size in Roscoe
Average Family Size in Roscoe is 3.2 People.
What is the Average Household Size in Roscoe
Average Household Size in Roscoe is 2.8 People.
How Large is the Labor Force in Roscoe?
There are 57 People in the Labor Forcein in Roscoe.
What is the Percentage of People in the Labor Force in Roscoe?
66.3% of People are in the Labor Force in Roscoe.
What is the Unemployment Rate in Roscoe?
Unemployment Rate in Roscoe is 3.5%.