McGrath, MN Map & Demographics
McGrath Map
McGrath Overview
$7,913
PER CAPITA INCOME
$8,750
AVG HOUSEHOLD INCOME
0.62
INEQUALITY / GINI INDEX
24
TOTAL POPULATION
14
MALE POPULATION
10
FEMALE POPULATION
140.00
MALES / 100 FEMALES
71.43
FEMALES / 100 MALES
55.8
MEDIAN AGE
2.3
AVG FAMILY SIZE
1.7
AVG HOUSEHOLD SIZE
Income in McGrath
Income Overview in McGrath
| Characteristic | Number | Measure |
| Per Capita Income | 24 | $7,913 |
| Median Family Income | 6 | $0 |
| Mean Family Income | 6 | $22,900 |
| Median Household Income | 14 | $8,750 |
| Mean Household Income | 14 | $12,464 |
| Income Deficit | 6 | $0 |
| Wage / Income Gap (%) | 24 | 0.00% |
| Wage / Income Gap ($) | 24 | 100.00¢ per $1 |
| Gini / Inequality Index | 24 | 0.62 |
Earnings by Sex in McGrath
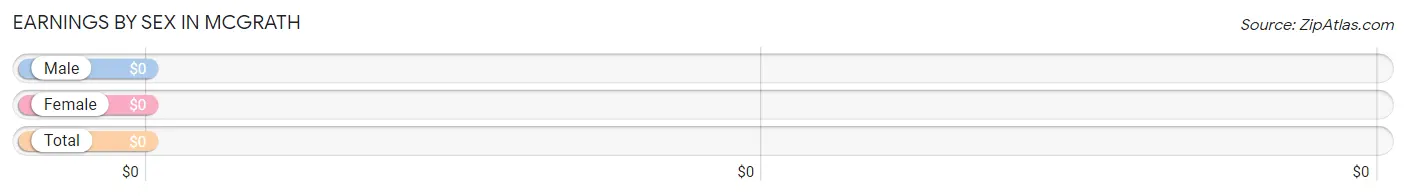
| Sex | Number | Average Earnings |
| Male | 4 (100.0%) | $0 |
| Female | 0 (0.0%) | $0 |
| Total | 4 (100.0%) | $0 |
Earnings by Sex by Income Bracket in McGrath
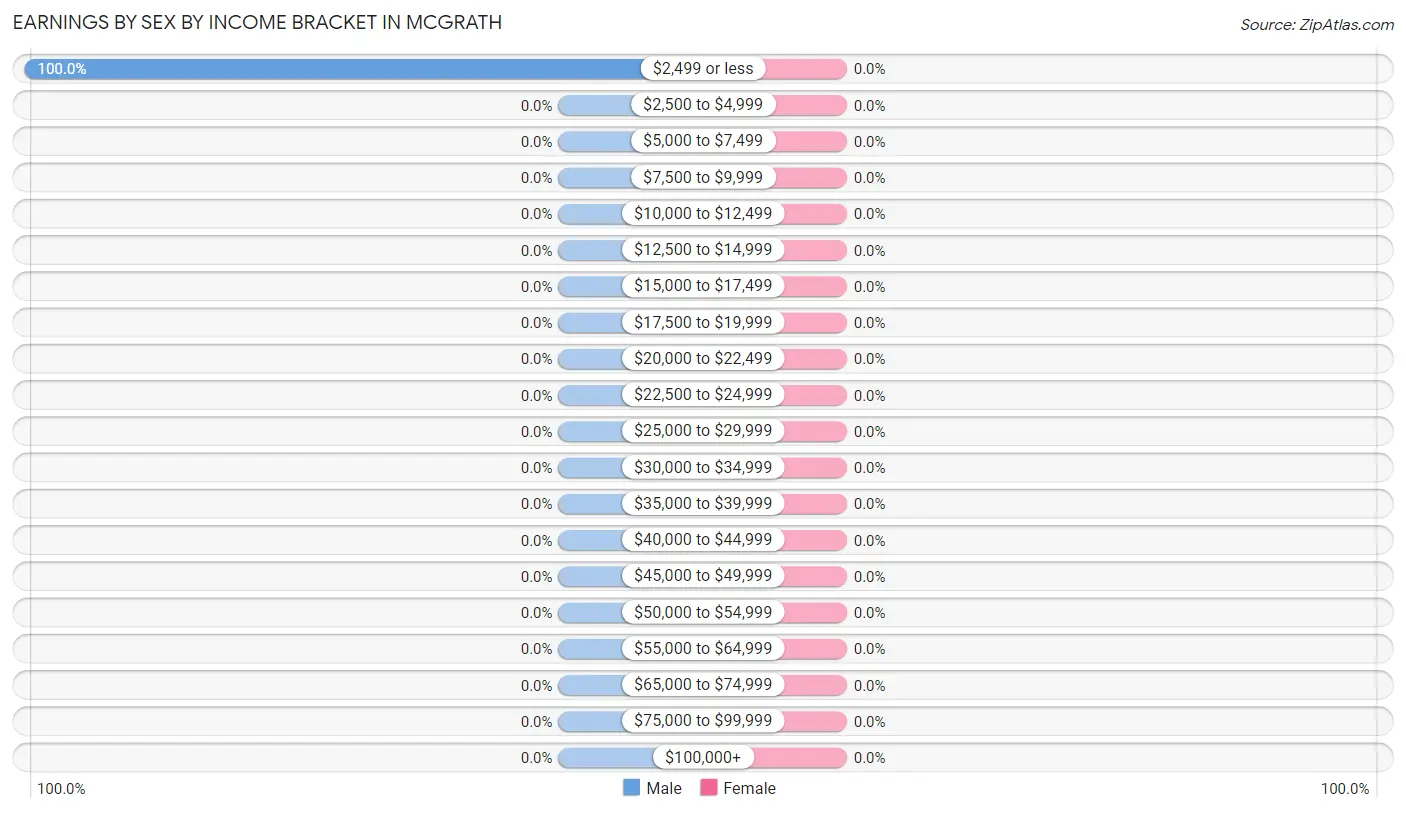
| Income | Male | Female |
| $2,499 or less | 4 (100.0%) | 0 (0.0%) |
| $2,500 to $4,999 | 0 (0.0%) | 0 (0.0%) |
| $5,000 to $7,499 | 0 (0.0%) | 0 (0.0%) |
| $7,500 to $9,999 | 0 (0.0%) | 0 (0.0%) |
| $10,000 to $12,499 | 0 (0.0%) | 0 (0.0%) |
| $12,500 to $14,999 | 0 (0.0%) | 0 (0.0%) |
| $15,000 to $17,499 | 0 (0.0%) | 0 (0.0%) |
| $17,500 to $19,999 | 0 (0.0%) | 0 (0.0%) |
| $20,000 to $22,499 | 0 (0.0%) | 0 (0.0%) |
| $22,500 to $24,999 | 0 (0.0%) | 0 (0.0%) |
| $25,000 to $29,999 | 0 (0.0%) | 0 (0.0%) |
| $30,000 to $34,999 | 0 (0.0%) | 0 (0.0%) |
| $35,000 to $39,999 | 0 (0.0%) | 0 (0.0%) |
| $40,000 to $44,999 | 0 (0.0%) | 0 (0.0%) |
| $45,000 to $49,999 | 0 (0.0%) | 0 (0.0%) |
| $50,000 to $54,999 | 0 (0.0%) | 0 (0.0%) |
| $55,000 to $64,999 | 0 (0.0%) | 0 (0.0%) |
| $65,000 to $74,999 | 0 (0.0%) | 0 (0.0%) |
| $75,000 to $99,999 | 0 (0.0%) | 0 (0.0%) |
| $100,000+ | 0 (0.0%) | 0 (0.0%) |
| Total | 4 (100.0%) | 0 (0.0%) |
Earnings by Sex by Educational Attainment in McGrath
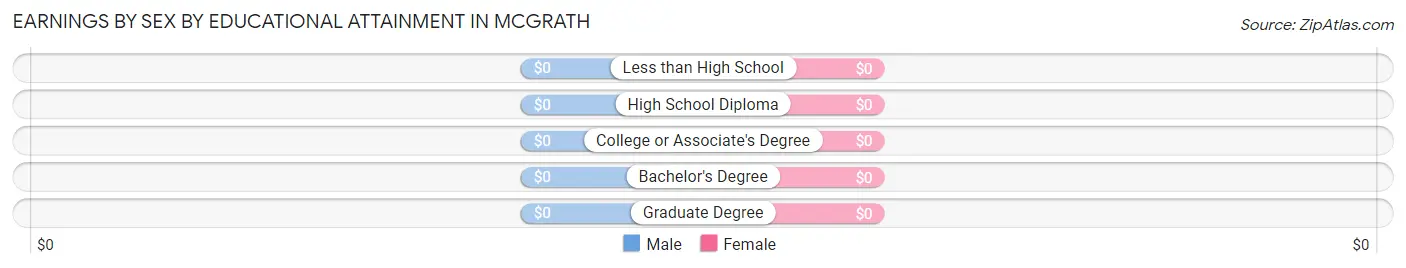
| Educational Attainment | Male Income | Female Income |
| Less than High School | - | - |
| High School Diploma | - | - |
| College or Associate's Degree | - | - |
| Bachelor's Degree | - | - |
| Graduate Degree | - | - |
| Total | - | - |
Family Income in McGrath
Family Income Brackets in McGrath
According to the McGrath family income data, there are 4 families falling into the less than $10,000 income range, which is the most common income bracket and makes up 66.7% of all families.
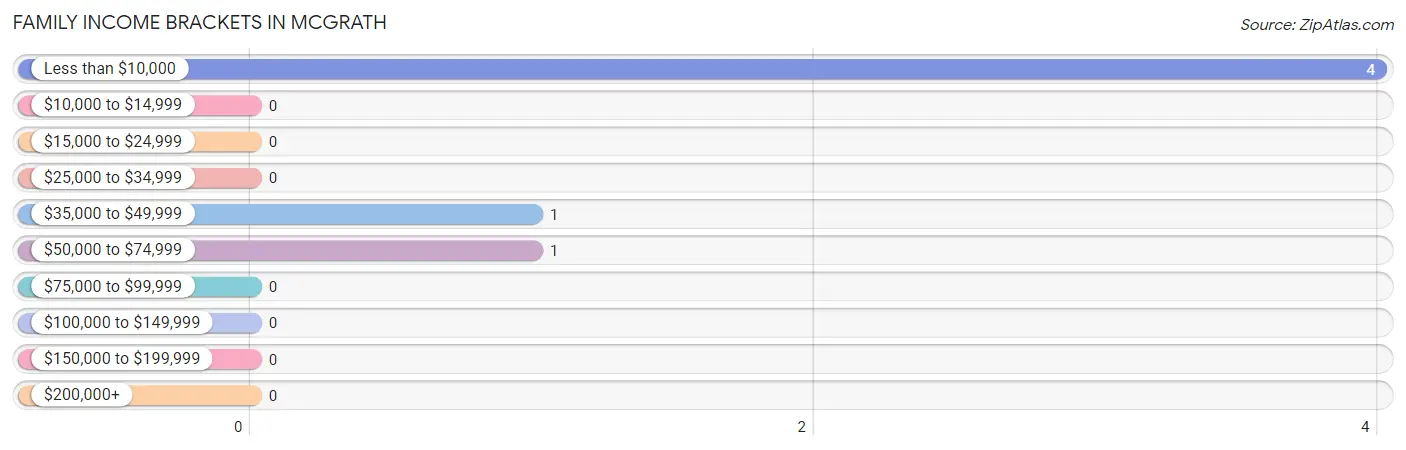
| Income Bracket | # Families | % Families |
| Less than $10,000 | 4 | 66.7% |
| $10,000 to $14,999 | 0 | 0.0% |
| $15,000 to $24,999 | 0 | 0.0% |
| $25,000 to $34,999 | 0 | 0.0% |
| $35,000 to $49,999 | 1 | 16.7% |
| $50,000 to $74,999 | 1 | 16.7% |
| $75,000 to $99,999 | 0 | 0.0% |
| $100,000 to $149,999 | 0 | 0.0% |
| $150,000 to $199,999 | 0 | 0.0% |
| $200,000+ | 0 | 0.0% |
Family Income by Famaliy Size in McGrath
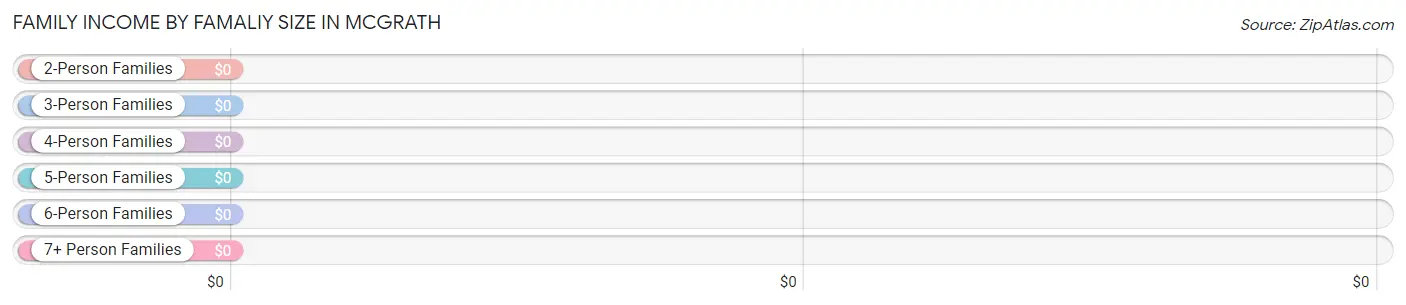
| Income Bracket | # Families | Median Income |
| 2-Person Families | 6 (100.0%) | $0 |
| 3-Person Families | 0 (0.0%) | $0 |
| 4-Person Families | 0 (0.0%) | $0 |
| 5-Person Families | 0 (0.0%) | $0 |
| 6-Person Families | 0 (0.0%) | $0 |
| 7+ Person Families | 0 (0.0%) | $0 |
| Total | 6 (100.0%) | $0 |
Family Income by Number of Earners in McGrath
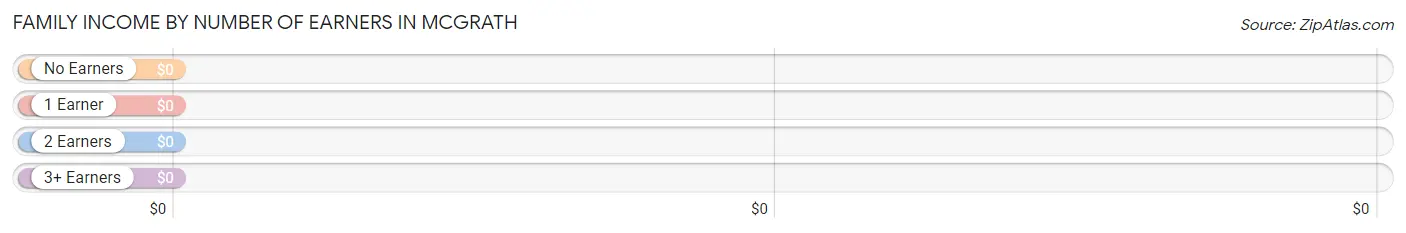
| Number of Earners | # Families | Median Income |
| No Earners | 6 (100.0%) | $0 |
| 1 Earner | 0 (0.0%) | $0 |
| 2 Earners | 0 (0.0%) | $0 |
| 3+ Earners | 0 (0.0%) | $0 |
| Total | 6 (100.0%) | $0 |
Household Income in McGrath
Household Income Brackets in McGrath
With 9 households falling in the category, the less than $10,000 income range is the most frequent in McGrath, accounting for 64.3% of all households.
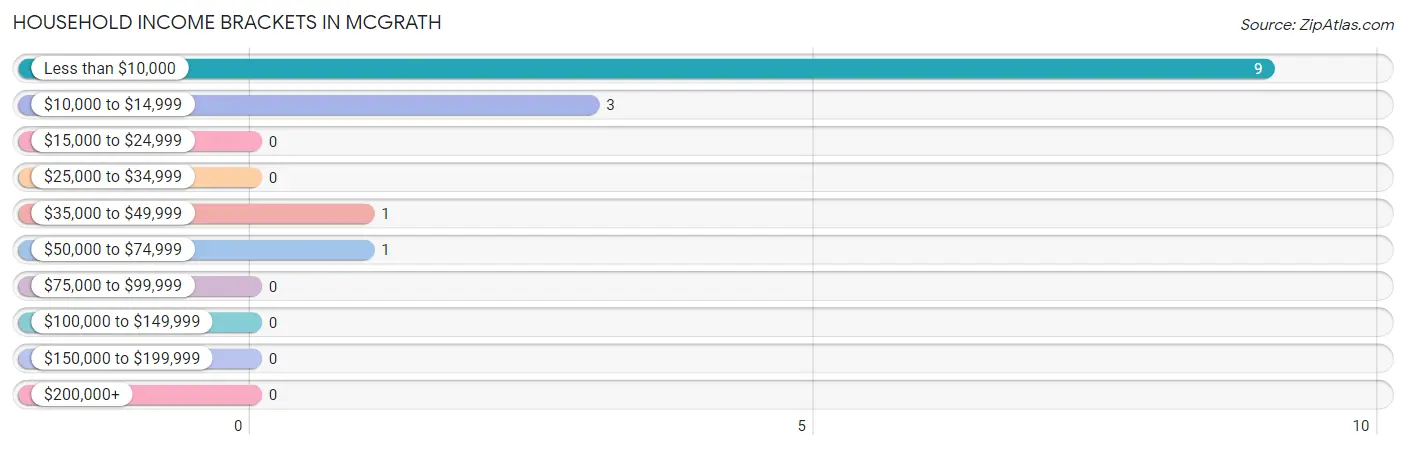
| Income Bracket | # Households | % Households |
| Less than $10,000 | 9 | 64.3% |
| $10,000 to $14,999 | 3 | 21.4% |
| $15,000 to $24,999 | 0 | 0.0% |
| $25,000 to $34,999 | 0 | 0.0% |
| $35,000 to $49,999 | 1 | 7.1% |
| $50,000 to $74,999 | 1 | 7.1% |
| $75,000 to $99,999 | 0 | 0.0% |
| $100,000 to $149,999 | 0 | 0.0% |
| $150,000 to $199,999 | 0 | 0.0% |
| $200,000+ | 0 | 0.0% |
Household Income by Householder Age in McGrath
The median household income in McGrath is $8,750, with the highest median household income of $9,375 found in the 45 to 64 years age bracket for the primary householder. A total of 8 households (57.1%) fall into this category.
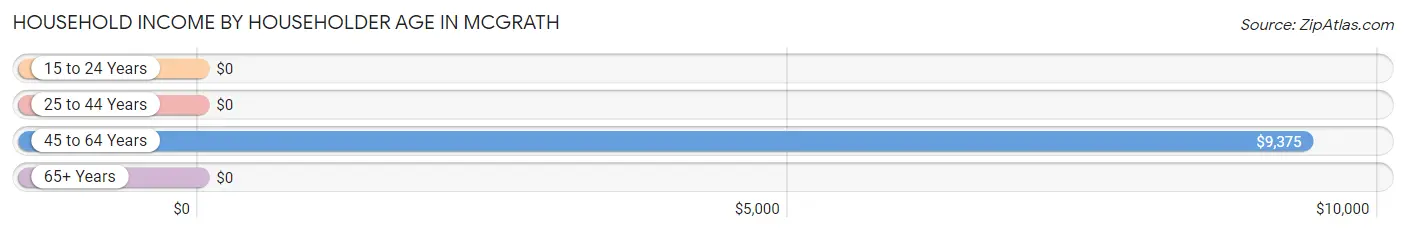
| Income Bracket | # Households | Median Income |
| 15 to 24 Years | 0 (0.0%) | $0 |
| 25 to 44 Years | 4 (28.6%) | $0 |
| 45 to 64 Years | 8 (57.1%) | $9,375 |
| 65+ Years | 2 (14.3%) | $0 |
| Total | 14 (100.0%) | $8,750 |
Poverty in McGrath
Income Below Poverty by Sex and Age in McGrath
With 85.7% poverty level for males and 80.0% for females among the residents of McGrath, 35 to 44 year old males and 25 to 34 year old females are the most vulnerable to poverty, with 4 males (100.0%) and 2 females (100.0%) in their respective age groups living below the poverty level.
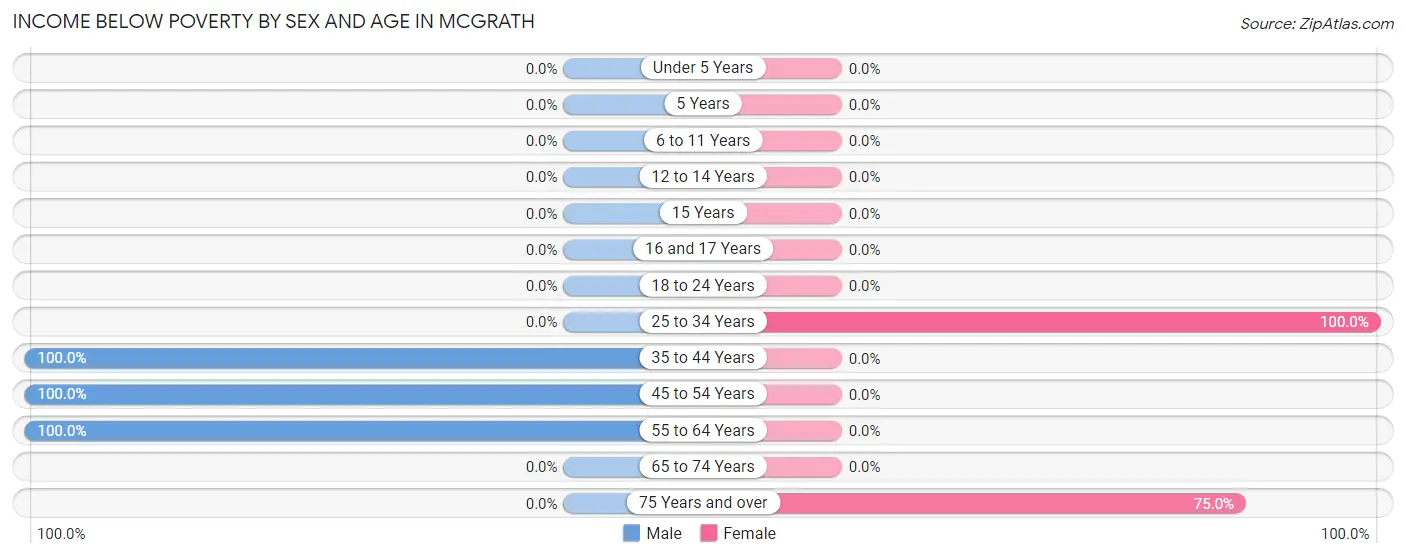
| Age Bracket | Male | Female |
| Under 5 Years | 0 (0.0%) | 0 (0.0%) |
| 5 Years | 0 (0.0%) | 0 (0.0%) |
| 6 to 11 Years | 0 (0.0%) | 0 (0.0%) |
| 12 to 14 Years | 0 (0.0%) | 0 (0.0%) |
| 15 Years | 0 (0.0%) | 0 (0.0%) |
| 16 and 17 Years | 0 (0.0%) | 0 (0.0%) |
| 18 to 24 Years | 0 (0.0%) | 0 (0.0%) |
| 25 to 34 Years | 0 (0.0%) | 2 (100.0%) |
| 35 to 44 Years | 4 (100.0%) | 0 (0.0%) |
| 45 to 54 Years | 3 (100.0%) | 0 (0.0%) |
| 55 to 64 Years | 5 (100.0%) | 0 (0.0%) |
| 65 to 74 Years | 0 (0.0%) | 0 (0.0%) |
| 75 Years and over | 0 (0.0%) | 6 (75.0%) |
| Total | 12 (85.7%) | 8 (80.0%) |
Income Above Poverty by Sex and Age in McGrath
According to the poverty statistics in McGrath, males aged 75 years and over and females aged 75 years and over are the age groups that are most secure financially, with 100.0% of males and 25.0% of females in these age groups living above the poverty line.
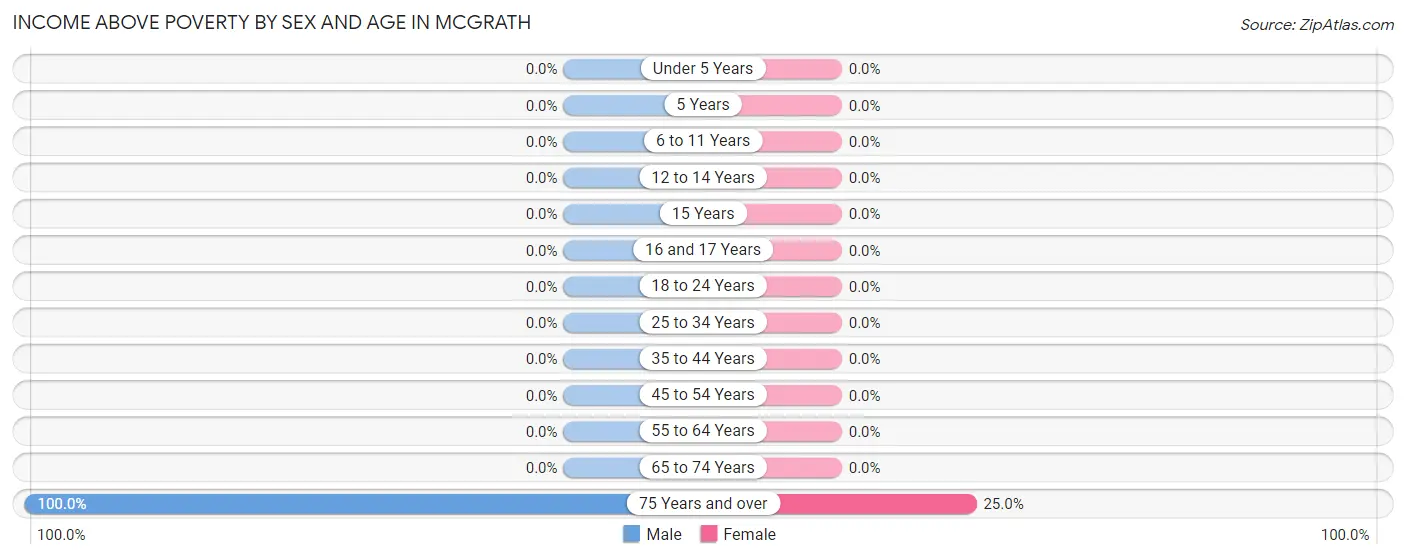
| Age Bracket | Male | Female |
| Under 5 Years | 0 (0.0%) | 0 (0.0%) |
| 5 Years | 0 (0.0%) | 0 (0.0%) |
| 6 to 11 Years | 0 (0.0%) | 0 (0.0%) |
| 12 to 14 Years | 0 (0.0%) | 0 (0.0%) |
| 15 Years | 0 (0.0%) | 0 (0.0%) |
| 16 and 17 Years | 0 (0.0%) | 0 (0.0%) |
| 18 to 24 Years | 0 (0.0%) | 0 (0.0%) |
| 25 to 34 Years | 0 (0.0%) | 0 (0.0%) |
| 35 to 44 Years | 0 (0.0%) | 0 (0.0%) |
| 45 to 54 Years | 0 (0.0%) | 0 (0.0%) |
| 55 to 64 Years | 0 (0.0%) | 0 (0.0%) |
| 65 to 74 Years | 0 (0.0%) | 0 (0.0%) |
| 75 Years and over | 2 (100.0%) | 2 (25.0%) |
| Total | 2 (14.3%) | 2 (20.0%) |
Income Below Poverty Among Married-Couple Families in McGrath
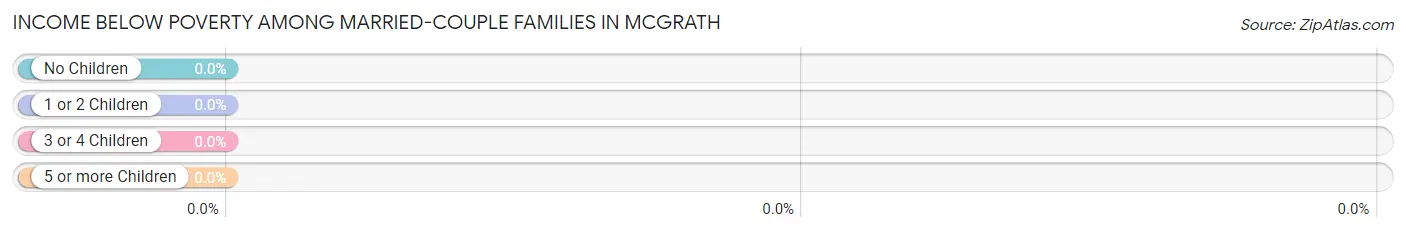
| Children | Above Poverty | Below Poverty |
| No Children | 2 (100.0%) | 0 (0.0%) |
| 1 or 2 Children | 0 (0.0%) | 0 (0.0%) |
| 3 or 4 Children | 0 (0.0%) | 0 (0.0%) |
| 5 or more Children | 0 (0.0%) | 0 (0.0%) |
| Total | 2 (100.0%) | 0 (0.0%) |
Income Below Poverty Among Single-Parent Households in McGrath
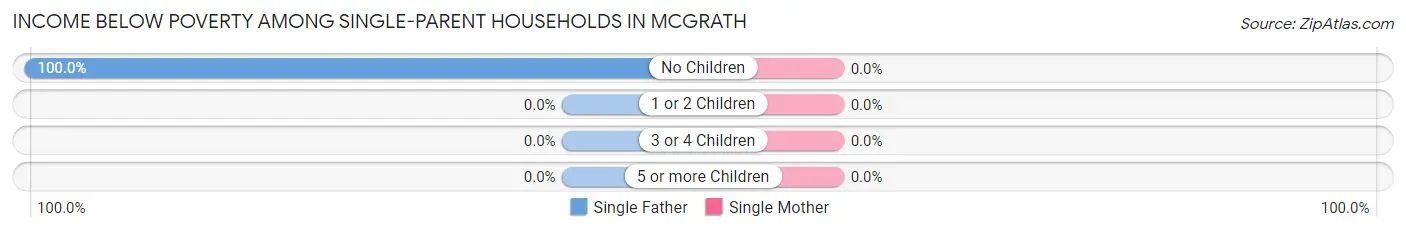
| Children | Single Father | Single Mother |
| No Children | 4 (100.0%) | 0 (0.0%) |
| 1 or 2 Children | 0 (0.0%) | 0 (0.0%) |
| 3 or 4 Children | 0 (0.0%) | 0 (0.0%) |
| 5 or more Children | 0 (0.0%) | 0 (0.0%) |
| Total | 4 (100.0%) | 0 (0.0%) |
Income Below Poverty Among Married-Couple vs Single-Parent Households in McGrath
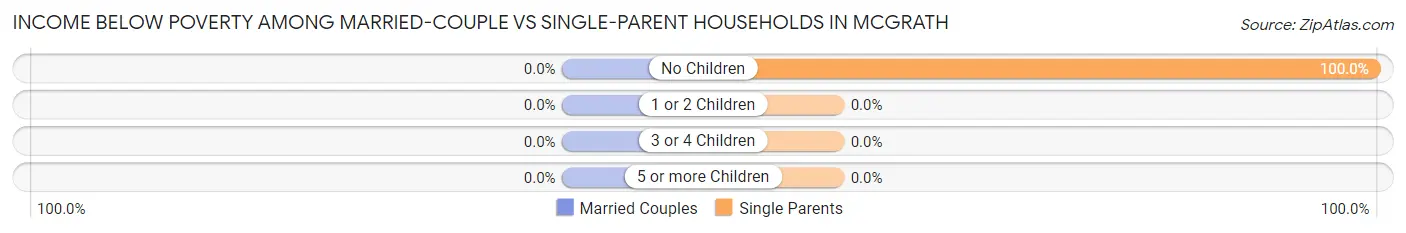
| Children | Married-Couple Families | Single-Parent Households |
| No Children | 0 (0.0%) | 4 (100.0%) |
| 1 or 2 Children | 0 (0.0%) | 0 (0.0%) |
| 3 or 4 Children | 0 (0.0%) | 0 (0.0%) |
| 5 or more Children | 0 (0.0%) | 0 (0.0%) |
| Total | 0 (0.0%) | 4 (100.0%) |
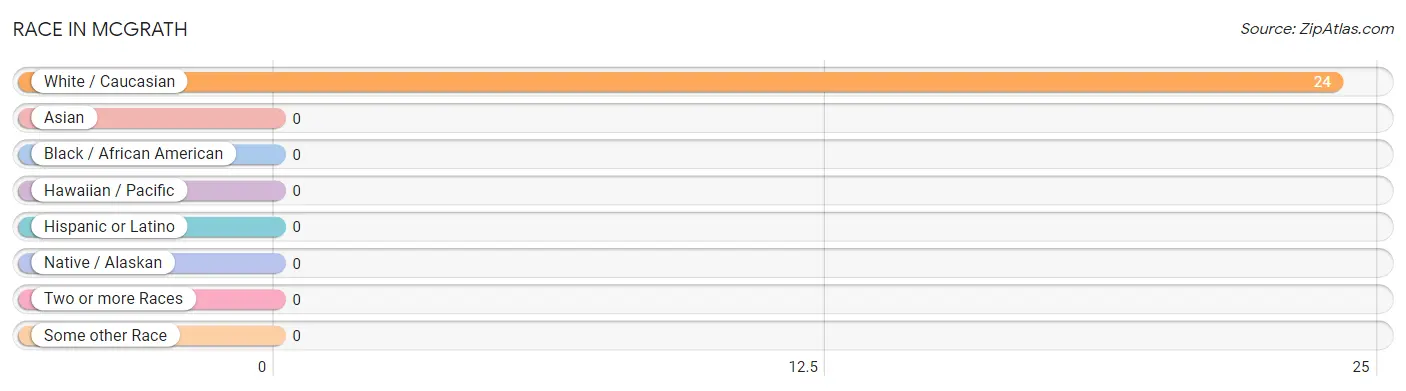
Race in McGrath
The most populous races in McGrath are , and White / Caucasian (24 | 100.0%).
| Race | # Population | % Population |
| Asian | 0 | 0.0% |
| Black / African American | 0 | 0.0% |
| Hawaiian / Pacific | 0 | 0.0% |
| Hispanic or Latino | 0 | 0.0% |
| Native / Alaskan | 0 | 0.0% |
| White / Caucasian | 24 | 100.0% |
| Two or more Races | 0 | 0.0% |
| Some other Race | 0 | 0.0% |
| Total | 24 | 100.0% |
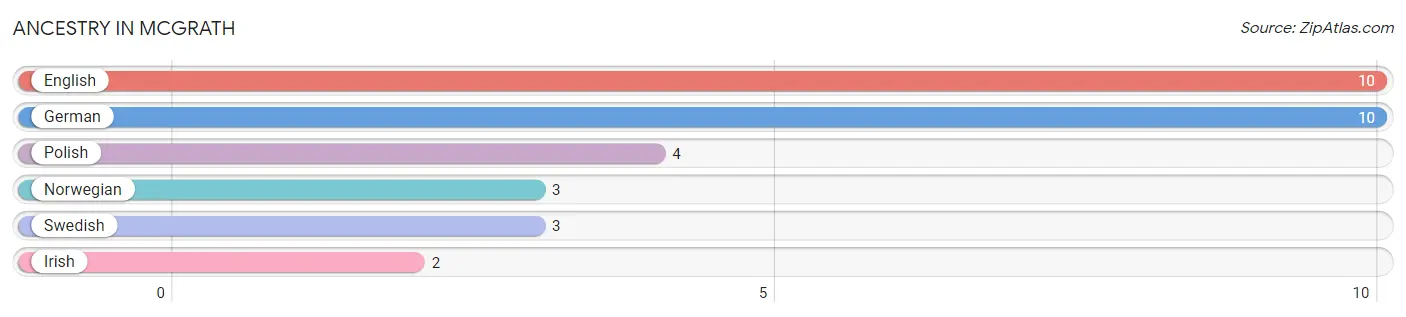
Ancestry in McGrath
The most populous ancestries reported in McGrath are English (10 | 41.7%), German (10 | 41.7%), Polish (4 | 16.7%), Norwegian (3 | 12.5%), and Swedish (3 | 12.5%), together accounting for 125.0% of all McGrath residents.
| Ancestry | # Population | % Population |
| English | 10 | 41.7% |
| German | 10 | 41.7% |
| Irish | 2 | 8.3% |
| Norwegian | 3 | 12.5% |
| Polish | 4 | 16.7% |
| Swedish | 3 | 12.5% | View All 6 Rows |
Immigrants in McGrath
The most numerous immigrant groups reported in McGrath came from , and Canada (10 | 41.7%), together accounting for 41.7% of all McGrath residents.

| Immigration Origin | # Population | % Population |
| Canada | 10 | 41.7% | View All 1 Rows |
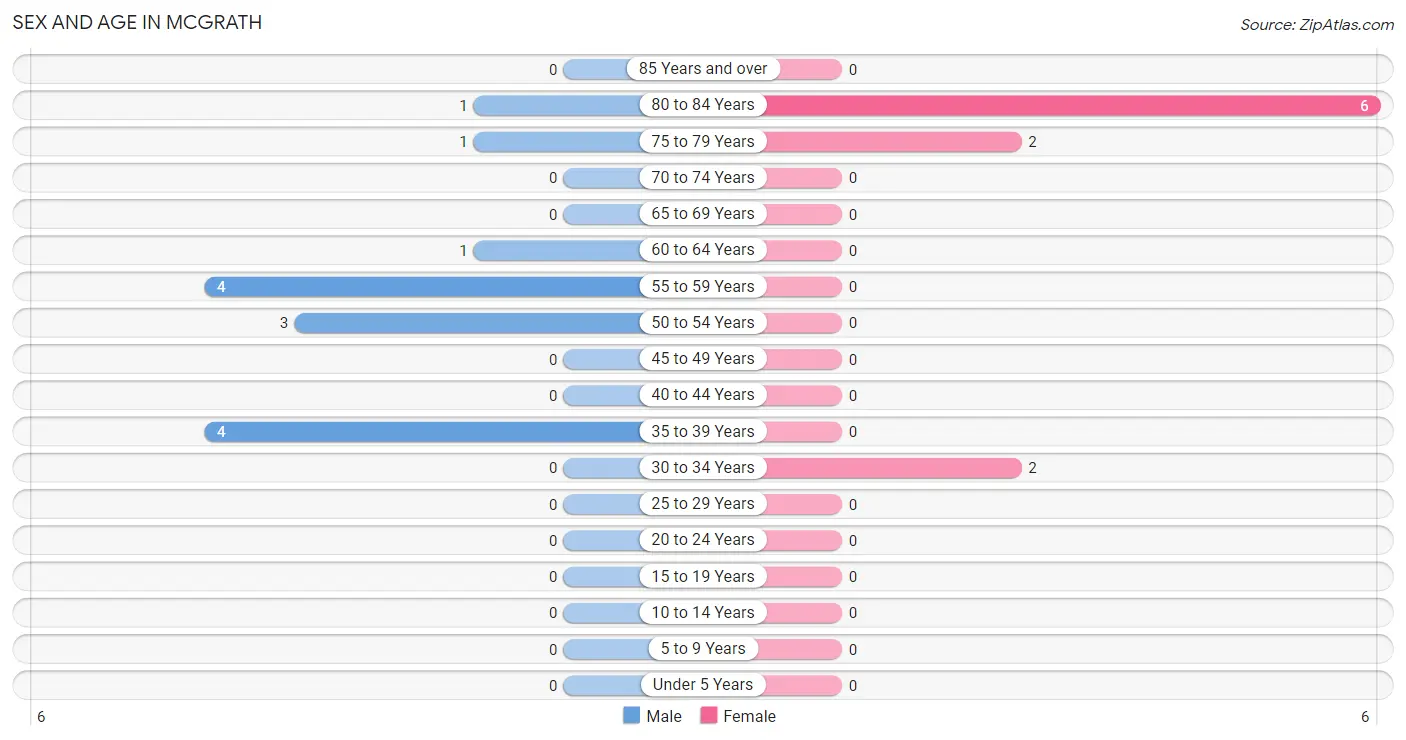
Sex and Age in McGrath
Sex and Age in McGrath
The most populous age groups in McGrath are 35 to 39 Years (4 | 28.6%) for men and 80 to 84 Years (6 | 60.0%) for women.
| Age Bracket | Male | Female |
| Under 5 Years | 0 (0.0%) | 0 (0.0%) |
| 5 to 9 Years | 0 (0.0%) | 0 (0.0%) |
| 10 to 14 Years | 0 (0.0%) | 0 (0.0%) |
| 15 to 19 Years | 0 (0.0%) | 0 (0.0%) |
| 20 to 24 Years | 0 (0.0%) | 0 (0.0%) |
| 25 to 29 Years | 0 (0.0%) | 0 (0.0%) |
| 30 to 34 Years | 0 (0.0%) | 2 (20.0%) |
| 35 to 39 Years | 4 (28.6%) | 0 (0.0%) |
| 40 to 44 Years | 0 (0.0%) | 0 (0.0%) |
| 45 to 49 Years | 0 (0.0%) | 0 (0.0%) |
| 50 to 54 Years | 3 (21.4%) | 0 (0.0%) |
| 55 to 59 Years | 4 (28.6%) | 0 (0.0%) |
| 60 to 64 Years | 1 (7.1%) | 0 (0.0%) |
| 65 to 69 Years | 0 (0.0%) | 0 (0.0%) |
| 70 to 74 Years | 0 (0.0%) | 0 (0.0%) |
| 75 to 79 Years | 1 (7.1%) | 2 (20.0%) |
| 80 to 84 Years | 1 (7.1%) | 6 (60.0%) |
| 85 Years and over | 0 (0.0%) | 0 (0.0%) |
| Total | 14 (100.0%) | 10 (100.0%) |
Families and Households in McGrath
Median Family Size in McGrath
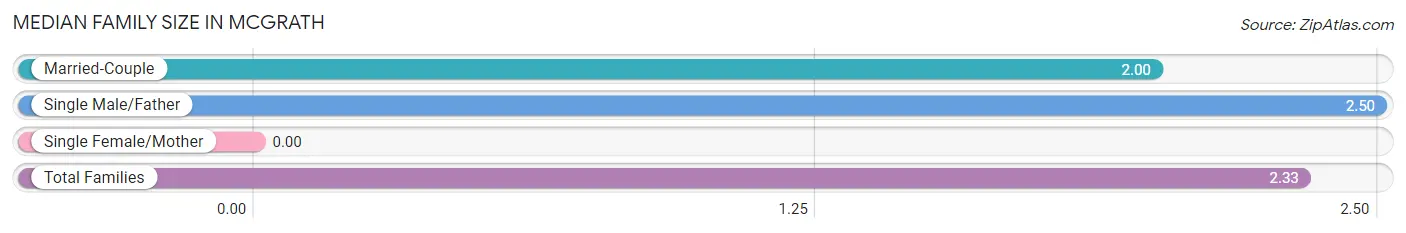
| Family Type | # Families | Family Size |
| Married-Couple | 2 (33.3%) | 2.00 |
| Single Male/Father | 4 (66.7%) | 2.50 |
| Single Female/Mother | 0 (0.0%) | - |
| Total Families | 6 (100.0%) | 2.33 |
Median Household Size in McGrath
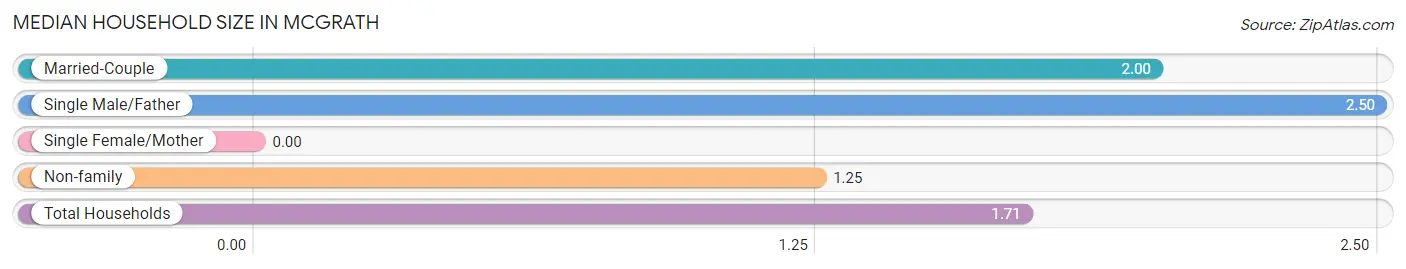
| Household Type | # Households | Household Size |
| Married-Couple | 2 (14.3%) | 2.00 |
| Single Male/Father | 4 (28.6%) | 2.50 |
| Single Female/Mother | 0 (0.0%) | - |
| Non-family | 8 (57.1%) | 1.25 |
| Total Households | 14 (100.0%) | 1.71 |
Household Size by Marriage Status in McGrath
Out of a total of 14 households in McGrath, 6 (42.9%) are family households, while 8 (57.1%) are nonfamily households. The most numerous type of family households are 2-person households, comprising 6, and the most common type of nonfamily households are 1-person households, comprising 5.
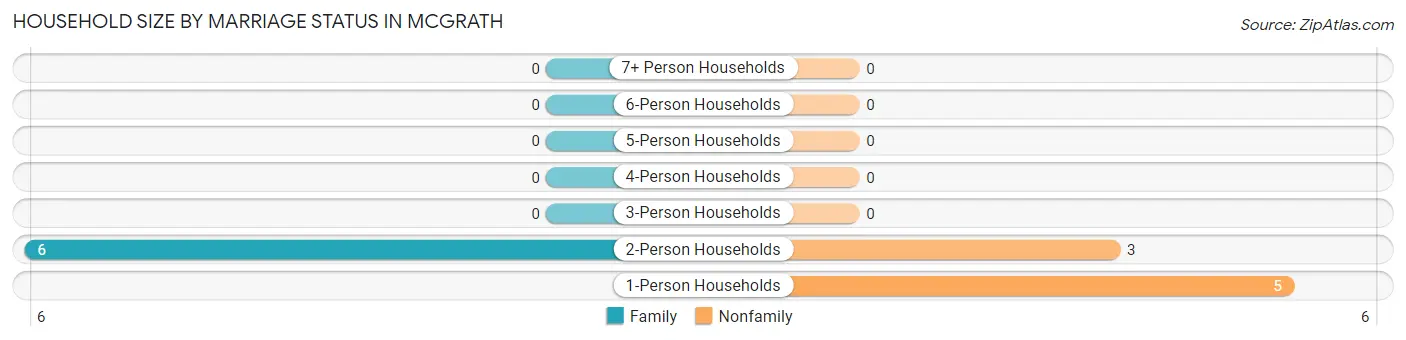
| Household Size | Family Households | Nonfamily Households |
| 1-Person Households | - | 5 (35.7%) |
| 2-Person Households | 6 (42.9%) | 3 (21.4%) |
| 3-Person Households | 0 (0.0%) | 0 (0.0%) |
| 4-Person Households | 0 (0.0%) | 0 (0.0%) |
| 5-Person Households | 0 (0.0%) | 0 (0.0%) |
| 6-Person Households | 0 (0.0%) | 0 (0.0%) |
| 7+ Person Households | 0 (0.0%) | 0 (0.0%) |
| Total | 6 (42.9%) | 8 (57.1%) |
Female Fertility in McGrath
Fertility by Age in McGrath
| Age Bracket | Women with Births | Births / 1,000 Women |
| 15 to 19 years | 0 (0.0%) | 0.0 |
| 20 to 34 years | 0 (0.0%) | 0.0 |
| 35 to 50 years | 0 (0.0%) | 0.0 |
| Total | 0 (0.0%) | 0.0 |
Fertility by Age by Marriage Status in McGrath
| Age Bracket | Married | Unmarried |
| 15 to 19 years | 0 (0.0%) | 0 (0.0%) |
| 20 to 34 years | 0 (0.0%) | 0 (0.0%) |
| 35 to 50 years | 0 (0.0%) | 0 (0.0%) |
| Total | 0 (0.0%) | 0 (0.0%) |
Fertility by Education in McGrath
| Educational Attainment | Women with Births | Births / 1,000 Women |
| Less than High School | 0 (0.0%) | 0.0 |
| High School Diploma | 0 (0.0%) | 0.0 |
| College or Associate's Degree | 0 (0.0%) | 0.0 |
| Bachelor's Degree | 0 (0.0%) | 0.0 |
| Graduate Degree | 0 (0.0%) | 0.0 |
| Total | 0 (0.0%) | 0.0 |
Fertility by Education by Marriage Status in McGrath
| Educational Attainment | Married | Unmarried |
| Less than High School | 0 (0.0%) | 0 (0.0%) |
| High School Diploma | 0 (0.0%) | 0 (0.0%) |
| College or Associate's Degree | 0 (0.0%) | 0 (0.0%) |
| Bachelor's Degree | 0 (0.0%) | 0 (0.0%) |
| Graduate Degree | 0 (0.0%) | 0 (0.0%) |
| Total | 0 (0.0%) | 0 (0.0%) |
Employment Characteristics in McGrath
Employment by Class of Employer in McGrath
| Employer Class | # Employees | % Employees |
| Private Company Employees | 0 | 0.0% |
| Self-Employed (Incorporated) | 0 | 0.0% |
| Self-Employed (Not Incorporated) | 0 | 0.0% |
| Not-for-profit Organizations | 0 | 0.0% |
| Local Government Employees | 0 | 0.0% |
| State Government Employees | 0 | 0.0% |
| Federal Government Employees | 0 | 0.0% |
| Unpaid Family Workers | 0 | 0.0% |
| Total | 0 | 0.0% |
Employment Status by Age in McGrath
| Age Bracket | In Labor Force | Unemployed |
| 16 to 19 Years | 0 (0.0%) | 0 (0.0%) |
| 20 to 24 Years | 0 (0.0%) | 0 (0.0%) |
| 25 to 29 Years | 0 (0.0%) | 0 (0.0%) |
| 30 to 34 Years | 0 (0.0%) | 0 (0.0%) |
| 35 to 44 Years | 0 (0.0%) | 0 (0.0%) |
| 45 to 54 Years | 0 (0.0%) | 0 (0.0%) |
| 55 to 59 Years | 0 (0.0%) | 0 (0.0%) |
| 60 to 64 Years | 0 (0.0%) | 0 (0.0%) |
| 65 to 74 Years | 0 (0.0%) | 0 (0.0%) |
| 75 Years and over | 0 (0.0%) | 0 (0.0%) |
| Total | 0 (0.0%) | 0 (0.0%) |
Employment Status by Educational Attainment in McGrath
| Educational Attainment | In Labor Force | Unemployed |
| Less than High School | 0 (0.0%) | 0 (0.0%) |
| High School Diploma | 0 (0.0%) | 0 (0.0%) |
| College / Associate Degree | 0 (0.0%) | 0 (0.0%) |
| Bachelor's Degree or higher | 0 (0.0%) | 0 (0.0%) |
| Total | 0 (0.0%) | 0 (0.0%) |
Employment Occupations by Sex in McGrath
Management, Business, Science and Arts Occupations
Management, Business, Science and Arts Occupations by Sex
| Occupation | Male | Female |
| Management | 0 (0.0%) | 0 (0.0%) |
| Business & Financial | 0 (0.0%) | 0 (0.0%) |
| Computers, Engineering & Science | 0 (0.0%) | 0 (0.0%) |
| Computers & Mathematics | 0 (0.0%) | 0 (0.0%) |
| Architecture & Engineering | 0 (0.0%) | 0 (0.0%) |
| Life, Physical & Social Science | 0 (0.0%) | 0 (0.0%) |
| Community & Social Service | 0 (0.0%) | 0 (0.0%) |
| Education, Arts & Media | 0 (0.0%) | 0 (0.0%) |
| Legal Services & Support | 0 (0.0%) | 0 (0.0%) |
| Education Instruction & Library | 0 (0.0%) | 0 (0.0%) |
| Arts, Media & Entertainment | 0 (0.0%) | 0 (0.0%) |
| Health Diagnosing & Treating | 0 (0.0%) | 0 (0.0%) |
| Health Technologists | 0 (0.0%) | 0 (0.0%) |
| Total (Category) | 0 (0.0%) | 0 (0.0%) |
| Total (Overall) | 0 (0.0%) | 0 (0.0%) |
Services Occupations
Services Occupations by Sex
| Occupation | Male | Female |
| Healthcare Support | 0 (0.0%) | 0 (0.0%) |
| Security & Protection | 0 (0.0%) | 0 (0.0%) |
| Firefighting & Prevention | 0 (0.0%) | 0 (0.0%) |
| Law Enforcement | 0 (0.0%) | 0 (0.0%) |
| Food Preparation & Serving | 0 (0.0%) | 0 (0.0%) |
| Cleaning & Maintenance | 0 (0.0%) | 0 (0.0%) |
| Personal Care & Service | 0 (0.0%) | 0 (0.0%) |
| Total (Category) | 0 (0.0%) | 0 (0.0%) |
| Total (Overall) | 0 (0.0%) | 0 (0.0%) |
Sales and Office Occupations
Sales and Office Occupations by Sex
| Occupation | Male | Female |
| Sales & Related | 0 (0.0%) | 0 (0.0%) |
| Office & Administration | 0 (0.0%) | 0 (0.0%) |
| Total (Category) | 0 (0.0%) | 0 (0.0%) |
| Total (Overall) | 0 (0.0%) | 0 (0.0%) |
Natural Resources, Construction and Maintenance Occupations
Natural Resources, Construction and Maintenance Occupations by Sex
| Occupation | Male | Female |
| Farming, Fishing & Forestry | 0 (0.0%) | 0 (0.0%) |
| Construction & Extraction | 0 (0.0%) | 0 (0.0%) |
| Installation, Maintenance & Repair | 0 (0.0%) | 0 (0.0%) |
| Total (Category) | 0 (0.0%) | 0 (0.0%) |
| Total (Overall) | 0 (0.0%) | 0 (0.0%) |
Production, Transportation and Moving Occupations
Production, Transportation and Moving Occupations by Sex
| Occupation | Male | Female |
| Production | 0 (0.0%) | 0 (0.0%) |
| Transportation | 0 (0.0%) | 0 (0.0%) |
| Material Moving | 0 (0.0%) | 0 (0.0%) |
| Total (Category) | 0 (0.0%) | 0 (0.0%) |
| Total (Overall) | 0 (0.0%) | 0 (0.0%) |
Employment Industries by Sex in McGrath
Employment Industries in McGrath
Employment Industries by Sex in McGrath
| Industry | Male | Female |
| Agriculture, Fishing & Hunting | 0 (0.0%) | 0 (0.0%) |
| Mining, Quarrying, & Extraction | 0 (0.0%) | 0 (0.0%) |
| Construction | 0 (0.0%) | 0 (0.0%) |
| Manufacturing | 0 (0.0%) | 0 (0.0%) |
| Wholesale Trade | 0 (0.0%) | 0 (0.0%) |
| Retail Trade | 0 (0.0%) | 0 (0.0%) |
| Transportation & Warehousing | 0 (0.0%) | 0 (0.0%) |
| Utilities | 0 (0.0%) | 0 (0.0%) |
| Information | 0 (0.0%) | 0 (0.0%) |
| Finance & Insurance | 0 (0.0%) | 0 (0.0%) |
| Real Estate, Rental & Leasing | 0 (0.0%) | 0 (0.0%) |
| Professional & Scientific | 0 (0.0%) | 0 (0.0%) |
| Enterprise Management | 0 (0.0%) | 0 (0.0%) |
| Administrative & Support | 0 (0.0%) | 0 (0.0%) |
| Educational Services | 0 (0.0%) | 0 (0.0%) |
| Health Care & Social Assistance | 0 (0.0%) | 0 (0.0%) |
| Arts, Entertainment & Recreation | 0 (0.0%) | 0 (0.0%) |
| Accommodation & Food Services | 0 (0.0%) | 0 (0.0%) |
| Public Administration | 0 (0.0%) | 0 (0.0%) |
| Total | 0 (0.0%) | 0 (0.0%) |
Education in McGrath
School Enrollment in McGrath
| School Level | # Students | % Students |
| Nursery / Preschool | 0 | 0.0% |
| Kindergarten | 0 | 0.0% |
| Elementary School | 0 | 0.0% |
| Middle School | 0 | 0.0% |
| High School | 0 | 0.0% |
| College / Undergraduate | 0 | 0.0% |
| Graduate / Professional | 0 | 0.0% |
| Total | 0 | 0.0% |
School Enrollment by Age by Funding Source in McGrath
| Age Bracket | Public School | Private School |
| 3 to 4 Year Olds | 0 (0.0%) | 0 (0.0%) |
| 5 to 9 Year Old | 0 (0.0%) | 0 (0.0%) |
| 10 to 14 Year Olds | 0 (0.0%) | 0 (0.0%) |
| 15 to 17 Year Olds | 0 (0.0%) | 0 (0.0%) |
| 18 to 19 Year Olds | 0 (0.0%) | 0 (0.0%) |
| 20 to 24 Year Olds | 0 (0.0%) | 0 (0.0%) |
| 25 to 34 Year Olds | 0 (0.0%) | 0 (0.0%) |
| 35 Years and over | 0 (0.0%) | 0 (0.0%) |
| Total | 0 (0.0%) | 0 (0.0%) |
Educational Attainment by Field of Study in McGrath
, and business (1 | 100.0%) are the most common fields of study among 1 individuals in McGrath who have obtained a bachelor's degree or higher.
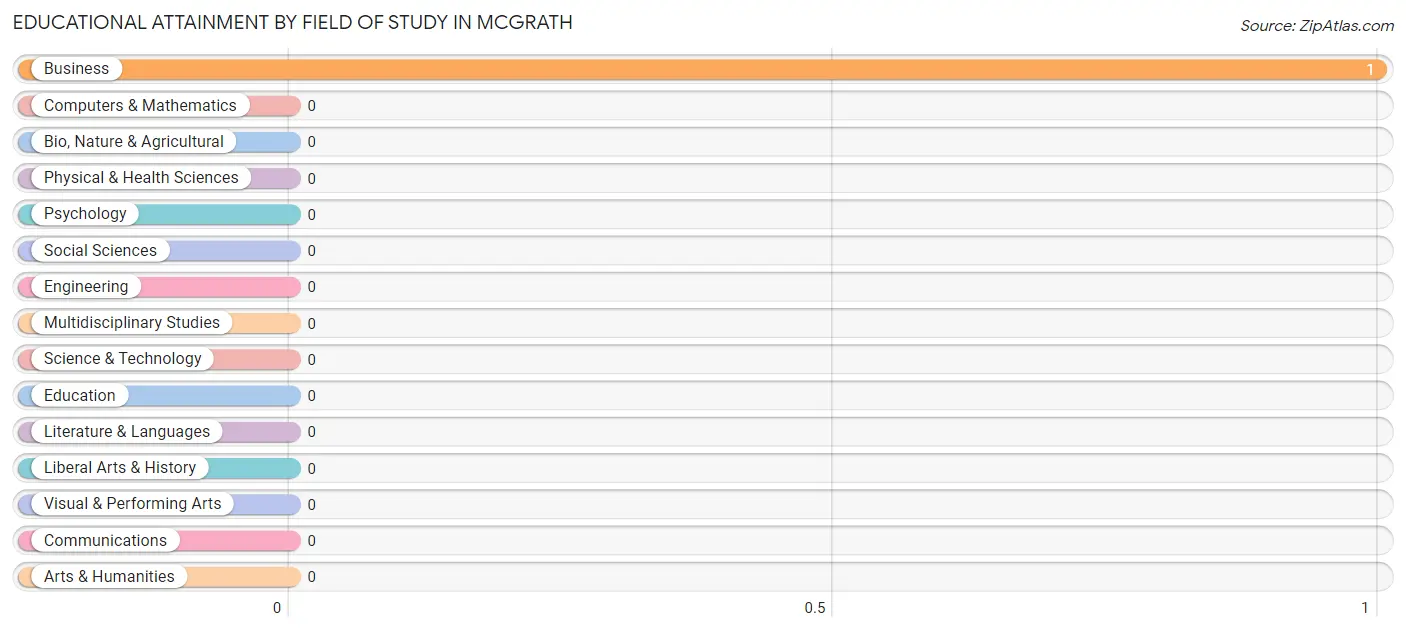
| Field of Study | # Graduates | % Graduates |
| Computers & Mathematics | 0 | 0.0% |
| Bio, Nature & Agricultural | 0 | 0.0% |
| Physical & Health Sciences | 0 | 0.0% |
| Psychology | 0 | 0.0% |
| Social Sciences | 0 | 0.0% |
| Engineering | 0 | 0.0% |
| Multidisciplinary Studies | 0 | 0.0% |
| Science & Technology | 0 | 0.0% |
| Business | 1 | 100.0% |
| Education | 0 | 0.0% |
| Literature & Languages | 0 | 0.0% |
| Liberal Arts & History | 0 | 0.0% |
| Visual & Performing Arts | 0 | 0.0% |
| Communications | 0 | 0.0% |
| Arts & Humanities | 0 | 0.0% |
| Total | 1 | 100.0% |
Transportation & Commute in McGrath
Vehicle Availability by Sex in McGrath
| Vehicles Available | Male | Female |
| No Vehicle | 0 (0.0%) | 0 (0.0%) |
| 1 Vehicle | 0 (0.0%) | 0 (0.0%) |
| 2 Vehicles | 0 (0.0%) | 0 (0.0%) |
| 3 Vehicles | 0 (0.0%) | 0 (0.0%) |
| 4 Vehicles | 0 (0.0%) | 0 (0.0%) |
| 5 or more Vehicles | 0 (0.0%) | 0 (0.0%) |
| Total | 0 (0.0%) | 0 (0.0%) |
Commute Time in McGrath
| Commute Time | # Commuters | % Commuters |
| Less than 5 Minutes | 0 | 0.0% |
| 5 to 9 Minutes | 0 | 0.0% |
| 10 to 14 Minutes | 0 | 0.0% |
| 15 to 19 Minutes | 0 | 0.0% |
| 20 to 24 Minutes | 0 | 0.0% |
| 25 to 29 Minutes | 0 | 0.0% |
| 30 to 34 Minutes | 0 | 0.0% |
| 35 to 39 Minutes | 0 | 0.0% |
| 40 to 44 Minutes | 0 | 0.0% |
| 45 to 59 Minutes | 0 | 0.0% |
| 60 to 89 Minutes | 0 | 0.0% |
| 90 or more Minutes | 0 | 0.0% |
Commute Time by Sex in McGrath
| Commute Time | Male | Female |
| Less than 5 Minutes | 0 (0.0%) | 0 (0.0%) |
| 5 to 9 Minutes | 0 (0.0%) | 0 (0.0%) |
| 10 to 14 Minutes | 0 (0.0%) | 0 (0.0%) |
| 15 to 19 Minutes | 0 (0.0%) | 0 (0.0%) |
| 20 to 24 Minutes | 0 (0.0%) | 0 (0.0%) |
| 25 to 29 Minutes | 0 (0.0%) | 0 (0.0%) |
| 30 to 34 Minutes | 0 (0.0%) | 0 (0.0%) |
| 35 to 39 Minutes | 0 (0.0%) | 0 (0.0%) |
| 40 to 44 Minutes | 0 (0.0%) | 0 (0.0%) |
| 45 to 59 Minutes | 0 (0.0%) | 0 (0.0%) |
| 60 to 89 Minutes | 0 (0.0%) | 0 (0.0%) |
| 90 or more Minutes | 0 (0.0%) | 0 (0.0%) |
Time of Departure to Work by Sex in McGrath
| Time of Departure | Male | Female |
| 12:00 AM to 4:59 AM | 0 (0.0%) | 0 (0.0%) |
| 5:00 AM to 5:29 AM | 0 (0.0%) | 0 (0.0%) |
| 5:30 AM to 5:59 AM | 0 (0.0%) | 0 (0.0%) |
| 6:00 AM to 6:29 AM | 0 (0.0%) | 0 (0.0%) |
| 6:30 AM to 6:59 AM | 0 (0.0%) | 0 (0.0%) |
| 7:00 AM to 7:29 AM | 0 (0.0%) | 0 (0.0%) |
| 7:30 AM to 7:59 AM | 0 (0.0%) | 0 (0.0%) |
| 8:00 AM to 8:29 AM | 0 (0.0%) | 0 (0.0%) |
| 8:30 AM to 8:59 AM | 0 (0.0%) | 0 (0.0%) |
| 9:00 AM to 9:59 AM | 0 (0.0%) | 0 (0.0%) |
| 10:00 AM to 10:59 AM | 0 (0.0%) | 0 (0.0%) |
| 11:00 AM to 11:59 AM | 0 (0.0%) | 0 (0.0%) |
| 12:00 PM to 3:59 PM | 0 (0.0%) | 0 (0.0%) |
| 4:00 PM to 11:59 PM | 0 (0.0%) | 0 (0.0%) |
| Total | 0 (0.0%) | 0 (0.0%) |
Housing Occupancy in McGrath
Occupancy by Ownership in McGrath
Of the total 14 dwellings in McGrath, owner-occupied units account for 10 (71.4%), while renter-occupied units make up 4 (28.6%).
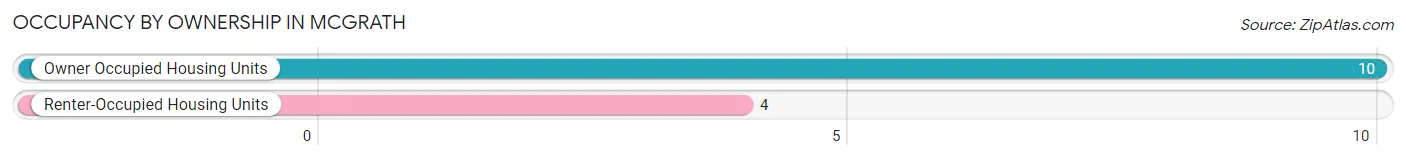
| Occupancy | # Housing Units | % Housing Units |
| Owner Occupied Housing Units | 10 | 71.4% |
| Renter-Occupied Housing Units | 4 | 28.6% |
| Total Occupied Housing Units | 14 | 100.0% |
Occupancy by Household Size in McGrath
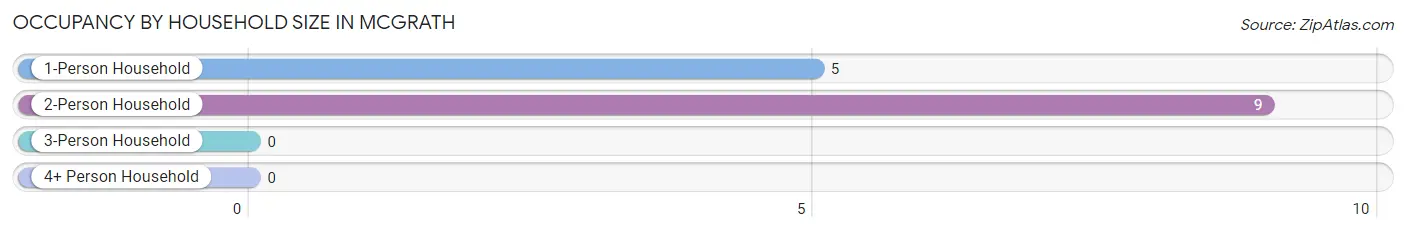
| Household Size | # Housing Units | % Housing Units |
| 1-Person Household | 5 | 35.7% |
| 2-Person Household | 9 | 64.3% |
| 3-Person Household | 0 | 0.0% |
| 4+ Person Household | 0 | 0.0% |
| Total Housing Units | 14 | 100.0% |
Occupancy by Ownership by Household Size in McGrath
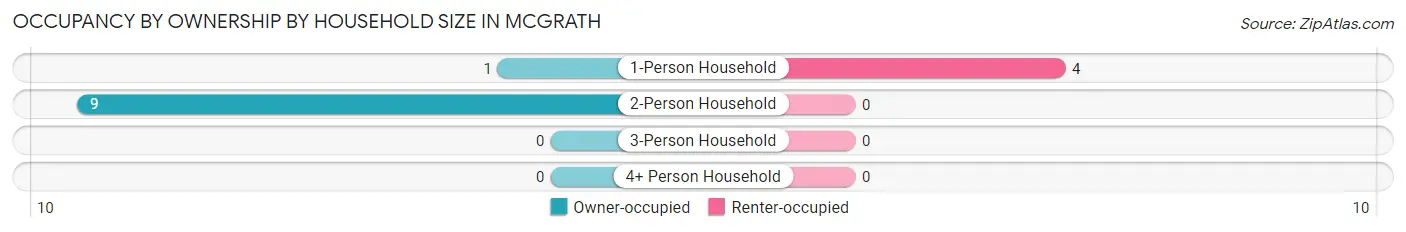
| Household Size | Owner-occupied | Renter-occupied |
| 1-Person Household | 1 (20.0%) | 4 (80.0%) |
| 2-Person Household | 9 (100.0%) | 0 (0.0%) |
| 3-Person Household | 0 (0.0%) | 0 (0.0%) |
| 4+ Person Household | 0 (0.0%) | 0 (0.0%) |
| Total Housing Units | 10 (71.4%) | 4 (28.6%) |
Occupancy by Educational Attainment in McGrath
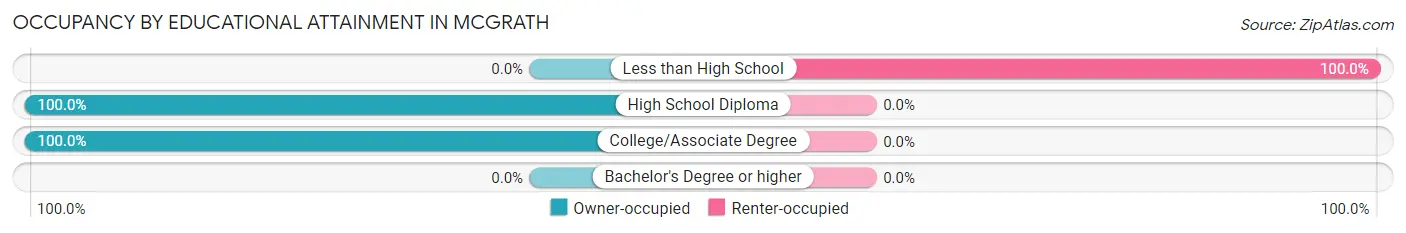
| Household Size | Owner-occupied | Renter-occupied |
| Less than High School | 0 (0.0%) | 4 (100.0%) |
| High School Diploma | 5 (100.0%) | 0 (0.0%) |
| College/Associate Degree | 5 (100.0%) | 0 (0.0%) |
| Bachelor's Degree or higher | 0 (0.0%) | 0 (0.0%) |
Occupancy by Age of Householder in McGrath
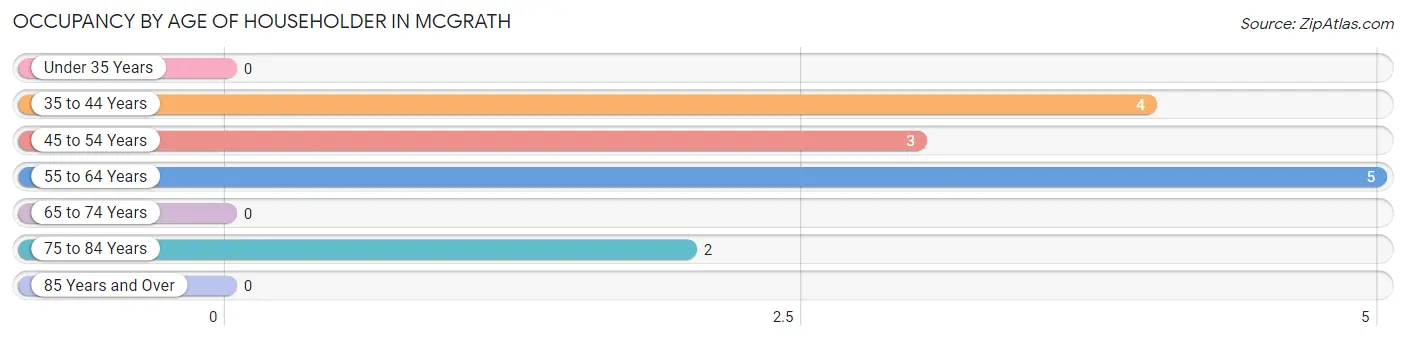
| Age Bracket | # Households | % Households |
| Under 35 Years | 0 | 0.0% |
| 35 to 44 Years | 4 | 28.6% |
| 45 to 54 Years | 3 | 21.4% |
| 55 to 64 Years | 5 | 35.7% |
| 65 to 74 Years | 0 | 0.0% |
| 75 to 84 Years | 2 | 14.3% |
| 85 Years and Over | 0 | 0.0% |
| Total | 14 | 100.0% |
Housing Finances in McGrath
Median Income by Occupancy in McGrath
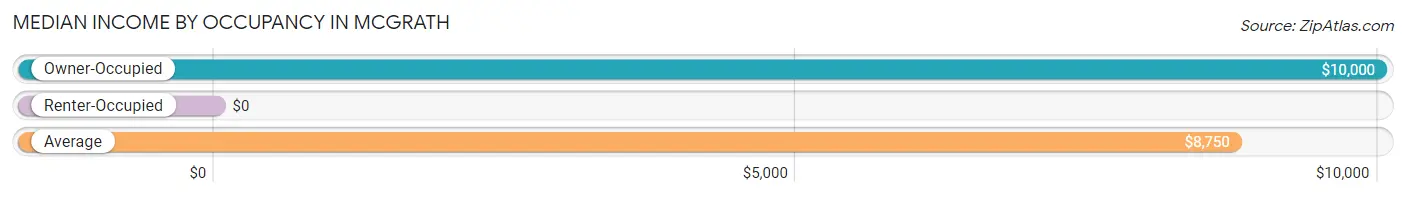
| Occupancy Type | # Households | Median Income |
| Owner-Occupied | 10 (71.4%) | $10,000 |
| Renter-Occupied | 4 (28.6%) | $0 |
| Average | 14 (100.0%) | $8,750 |
Occupancy by Householder Income Bracket in McGrath
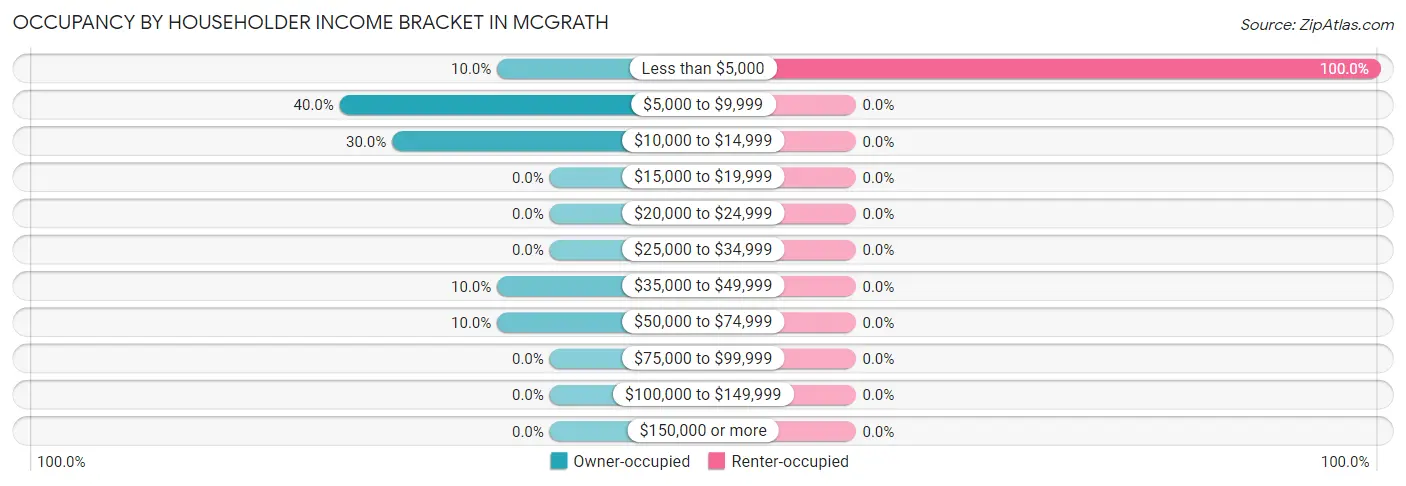
| Income Bracket | Owner-occupied | Renter-occupied |
| Less than $5,000 | 1 (10.0%) | 4 (100.0%) |
| $5,000 to $9,999 | 4 (40.0%) | 0 (0.0%) |
| $10,000 to $14,999 | 3 (30.0%) | 0 (0.0%) |
| $15,000 to $19,999 | 0 (0.0%) | 0 (0.0%) |
| $20,000 to $24,999 | 0 (0.0%) | 0 (0.0%) |
| $25,000 to $34,999 | 0 (0.0%) | 0 (0.0%) |
| $35,000 to $49,999 | 1 (10.0%) | 0 (0.0%) |
| $50,000 to $74,999 | 1 (10.0%) | 0 (0.0%) |
| $75,000 to $99,999 | 0 (0.0%) | 0 (0.0%) |
| $100,000 to $149,999 | 0 (0.0%) | 0 (0.0%) |
| $150,000 or more | 0 (0.0%) | 0 (0.0%) |
| Total | 10 (100.0%) | 4 (100.0%) |
Monthly Housing Cost Tiers in McGrath
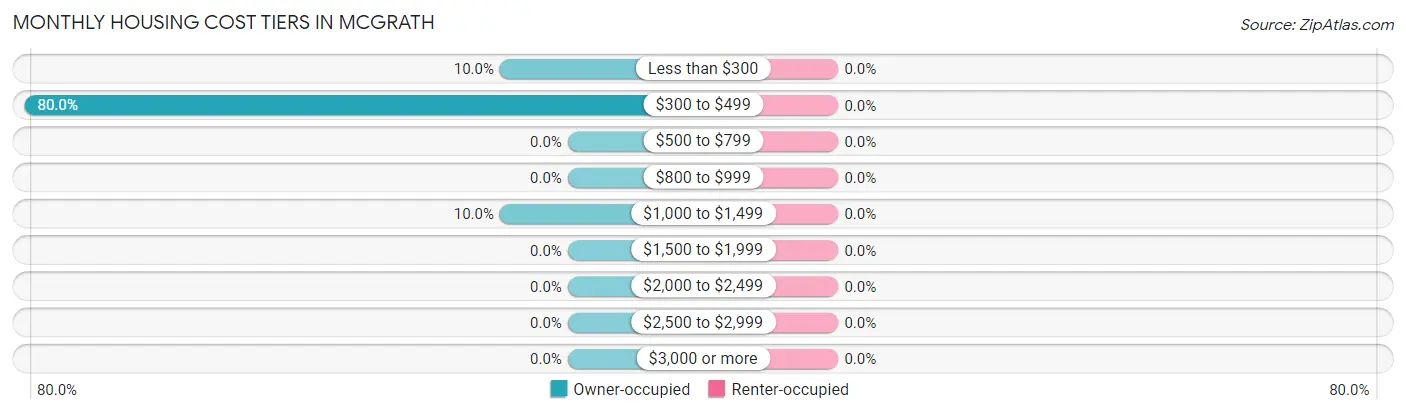
| Monthly Cost | Owner-occupied | Renter-occupied |
| Less than $300 | 1 (10.0%) | 0 (0.0%) |
| $300 to $499 | 8 (80.0%) | 0 (0.0%) |
| $500 to $799 | 0 (0.0%) | 0 (0.0%) |
| $800 to $999 | 0 (0.0%) | 0 (0.0%) |
| $1,000 to $1,499 | 1 (10.0%) | 0 (0.0%) |
| $1,500 to $1,999 | 0 (0.0%) | 0 (0.0%) |
| $2,000 to $2,499 | 0 (0.0%) | 0 (0.0%) |
| $2,500 to $2,999 | 0 (0.0%) | 0 (0.0%) |
| $3,000 or more | 0 (0.0%) | 0 (0.0%) |
| Total | 10 (100.0%) | 4 (100.0%) |
Physical Housing Characteristics in McGrath
Housing Structures in McGrath
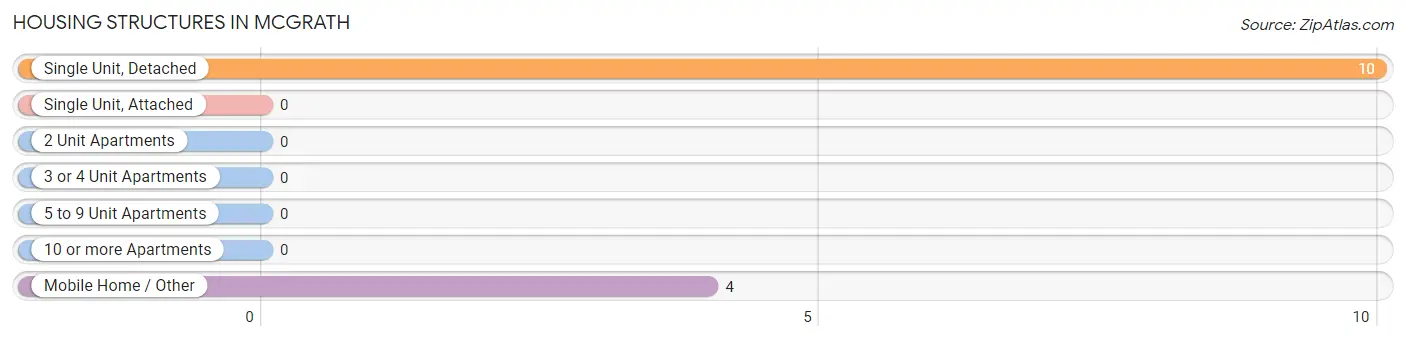
| Structure Type | # Housing Units | % Housing Units |
| Single Unit, Detached | 10 | 71.4% |
| Single Unit, Attached | 0 | 0.0% |
| 2 Unit Apartments | 0 | 0.0% |
| 3 or 4 Unit Apartments | 0 | 0.0% |
| 5 to 9 Unit Apartments | 0 | 0.0% |
| 10 or more Apartments | 0 | 0.0% |
| Mobile Home / Other | 4 | 28.6% |
| Total | 14 | 100.0% |
Housing Structures by Occupancy in McGrath
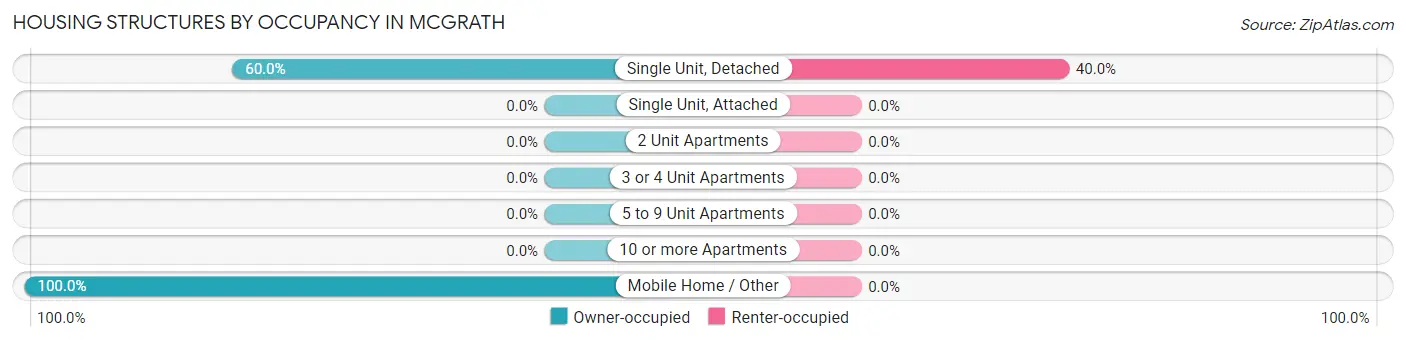
| Structure Type | Owner-occupied | Renter-occupied |
| Single Unit, Detached | 6 (60.0%) | 4 (40.0%) |
| Single Unit, Attached | 0 (0.0%) | 0 (0.0%) |
| 2 Unit Apartments | 0 (0.0%) | 0 (0.0%) |
| 3 or 4 Unit Apartments | 0 (0.0%) | 0 (0.0%) |
| 5 to 9 Unit Apartments | 0 (0.0%) | 0 (0.0%) |
| 10 or more Apartments | 0 (0.0%) | 0 (0.0%) |
| Mobile Home / Other | 4 (100.0%) | 0 (0.0%) |
| Total | 10 (71.4%) | 4 (28.6%) |
Housing Structures by Number of Rooms in McGrath
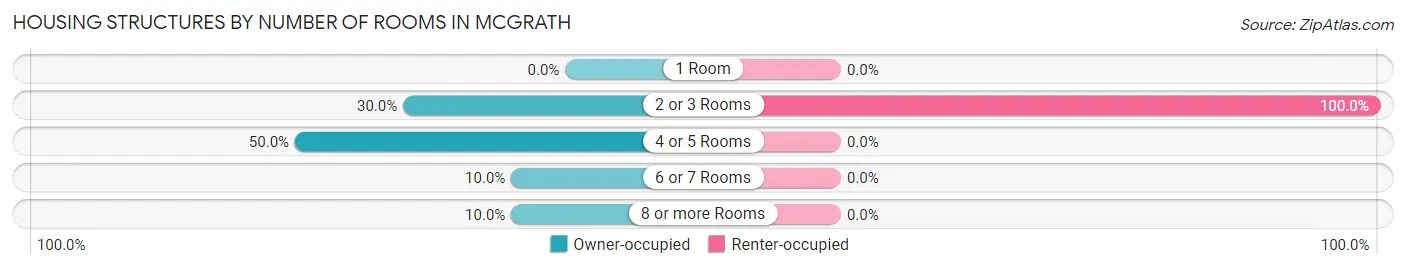
| Number of Rooms | Owner-occupied | Renter-occupied |
| 1 Room | 0 (0.0%) | 0 (0.0%) |
| 2 or 3 Rooms | 3 (30.0%) | 4 (100.0%) |
| 4 or 5 Rooms | 5 (50.0%) | 0 (0.0%) |
| 6 or 7 Rooms | 1 (10.0%) | 0 (0.0%) |
| 8 or more Rooms | 1 (10.0%) | 0 (0.0%) |
| Total | 10 (100.0%) | 4 (100.0%) |
Housing Structure by Heating Type in McGrath
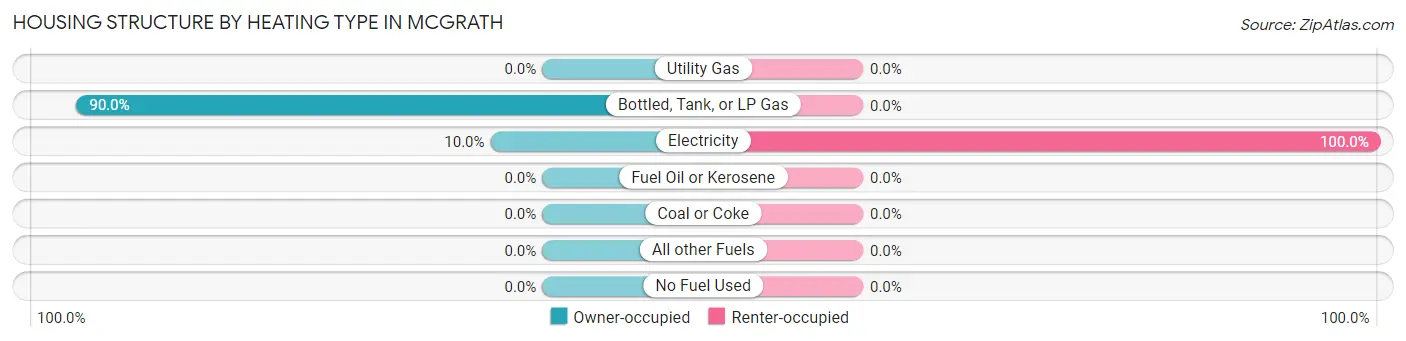
| Heating Type | Owner-occupied | Renter-occupied |
| Utility Gas | 0 (0.0%) | 0 (0.0%) |
| Bottled, Tank, or LP Gas | 9 (90.0%) | 0 (0.0%) |
| Electricity | 1 (10.0%) | 4 (100.0%) |
| Fuel Oil or Kerosene | 0 (0.0%) | 0 (0.0%) |
| Coal or Coke | 0 (0.0%) | 0 (0.0%) |
| All other Fuels | 0 (0.0%) | 0 (0.0%) |
| No Fuel Used | 0 (0.0%) | 0 (0.0%) |
| Total | 10 (100.0%) | 4 (100.0%) |
Household Vehicle Usage in McGrath
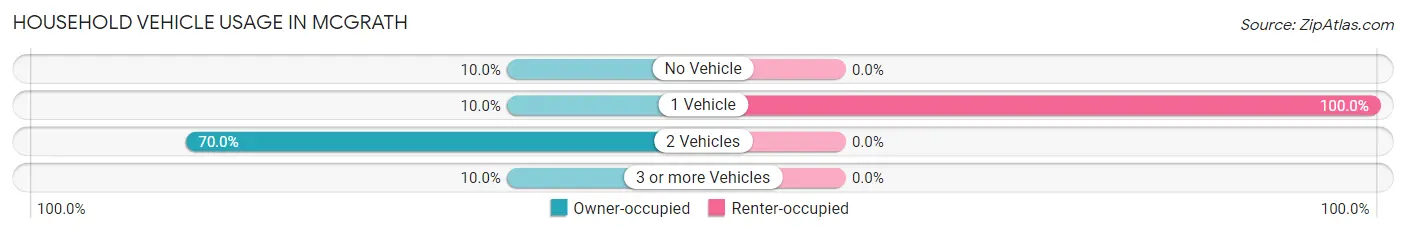
| Vehicles per Household | Owner-occupied | Renter-occupied |
| No Vehicle | 1 (10.0%) | 0 (0.0%) |
| 1 Vehicle | 1 (10.0%) | 4 (100.0%) |
| 2 Vehicles | 7 (70.0%) | 0 (0.0%) |
| 3 or more Vehicles | 1 (10.0%) | 0 (0.0%) |
| Total | 10 (100.0%) | 4 (100.0%) |
Real Estate & Mortgages in McGrath
Real Estate and Mortgage Overview in McGrath
| Characteristic | Without Mortgage | With Mortgage |
| Housing Units | 10 | 0 |
| Median Property Value | - | - |
| Median Household Income | $10,000 | $0 |
| Monthly Housing Costs | $450 | $0 |
| Real Estate Taxes | $325 | $0 |
Property Value by Mortgage Status in McGrath
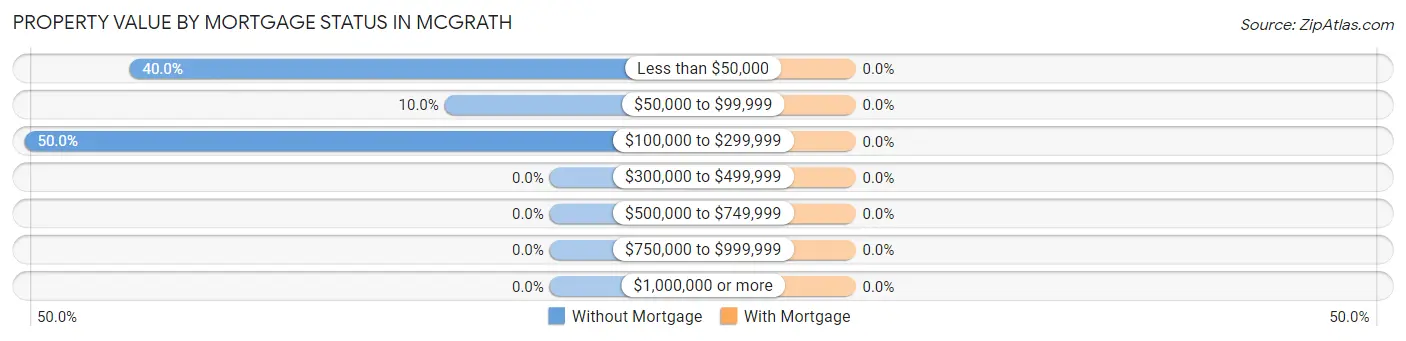
| Property Value | Without Mortgage | With Mortgage |
| Less than $50,000 | 4 (40.0%) | 0 (0.0%) |
| $50,000 to $99,999 | 1 (10.0%) | 0 (0.0%) |
| $100,000 to $299,999 | 5 (50.0%) | 0 (0.0%) |
| $300,000 to $499,999 | 0 (0.0%) | 0 (0.0%) |
| $500,000 to $749,999 | 0 (0.0%) | 0 (0.0%) |
| $750,000 to $999,999 | 0 (0.0%) | 0 (0.0%) |
| $1,000,000 or more | 0 (0.0%) | 0 (0.0%) |
| Total | 10 (100.0%) | 0 (0.0%) |
Household Income by Mortgage Status in McGrath
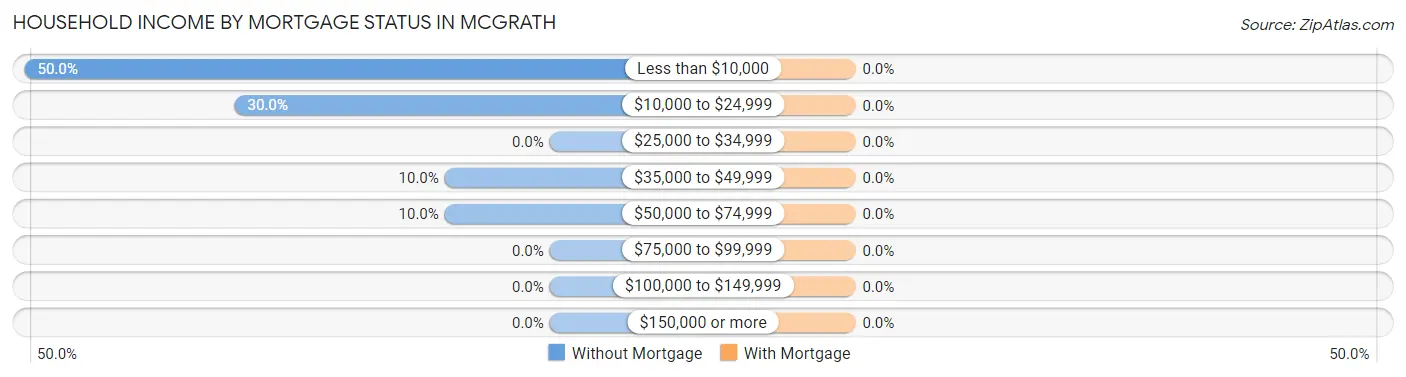
| Household Income | Without Mortgage | With Mortgage |
| Less than $10,000 | 5 (50.0%) | 0 (0.0%) |
| $10,000 to $24,999 | 3 (30.0%) | 0 (0.0%) |
| $25,000 to $34,999 | 0 (0.0%) | 0 (0.0%) |
| $35,000 to $49,999 | 1 (10.0%) | 0 (0.0%) |
| $50,000 to $74,999 | 1 (10.0%) | 0 (0.0%) |
| $75,000 to $99,999 | 0 (0.0%) | 0 (0.0%) |
| $100,000 to $149,999 | 0 (0.0%) | 0 (0.0%) |
| $150,000 or more | 0 (0.0%) | 0 (0.0%) |
| Total | 10 (100.0%) | 0 (0.0%) |
Property Value to Household Income Ratio in McGrath
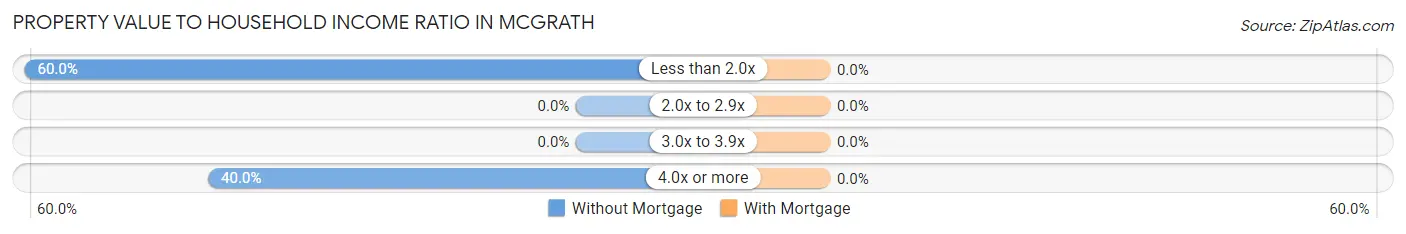
| Value-to-Income Ratio | Without Mortgage | With Mortgage |
| Less than 2.0x | 6 (60.0%) | 0 (0.0%) |
| 2.0x to 2.9x | 0 (0.0%) | 0 (0.0%) |
| 3.0x to 3.9x | 0 (0.0%) | 0 (0.0%) |
| 4.0x or more | 4 (40.0%) | 0 (0.0%) |
| Total | 10 (100.0%) | 0 (0.0%) |
Real Estate Taxes by Mortgage Status in McGrath
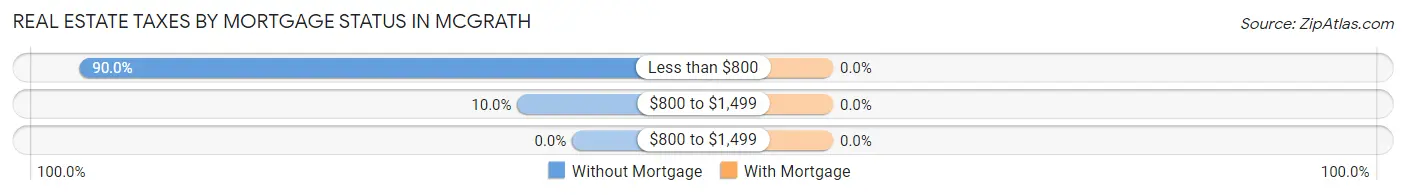
| Property Taxes | Without Mortgage | With Mortgage |
| Less than $800 | 9 (90.0%) | 0 (0.0%) |
| $800 to $1,499 | 1 (10.0%) | 0 (0.0%) |
| $800 to $1,499 | 0 (0.0%) | 0 (0.0%) |
| Total | 10 (100.0%) | 0 (0.0%) |
Health & Disability in McGrath
Health Insurance Coverage by Age in McGrath
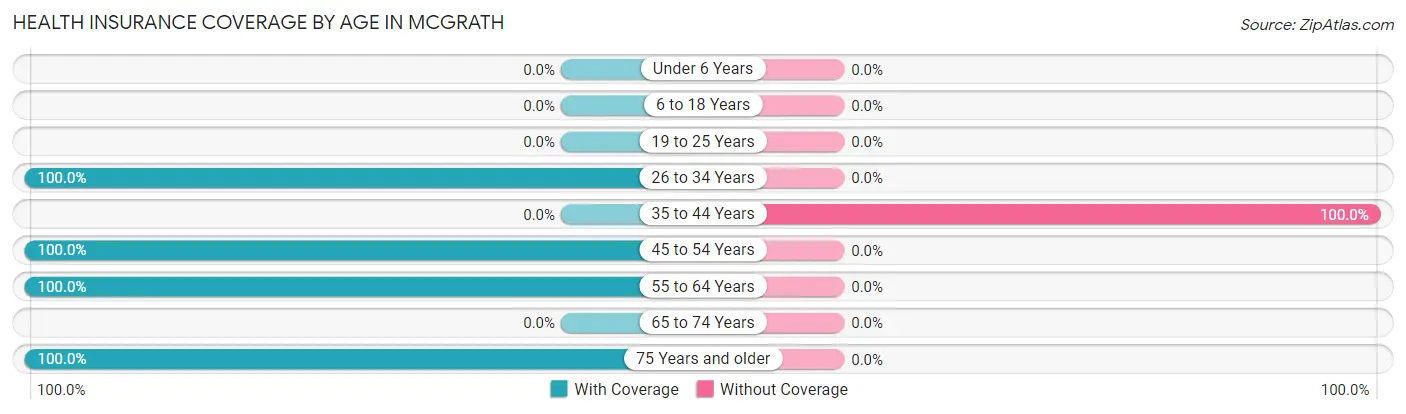
| Age Bracket | With Coverage | Without Coverage |
| Under 6 Years | 0 (0.0%) | 0 (0.0%) |
| 6 to 18 Years | 0 (0.0%) | 0 (0.0%) |
| 19 to 25 Years | 0 (0.0%) | 0 (0.0%) |
| 26 to 34 Years | 2 (100.0%) | 0 (0.0%) |
| 35 to 44 Years | 0 (0.0%) | 4 (100.0%) |
| 45 to 54 Years | 3 (100.0%) | 0 (0.0%) |
| 55 to 64 Years | 5 (100.0%) | 0 (0.0%) |
| 65 to 74 Years | 0 (0.0%) | 0 (0.0%) |
| 75 Years and older | 10 (100.0%) | 0 (0.0%) |
| Total | 20 (83.3%) | 4 (16.7%) |
Health Insurance Coverage by Citizenship Status in McGrath
| Citizenship Status | With Coverage | Without Coverage |
| Native Born | 0 (0.0%) | 0 (0.0%) |
| Foreign Born, Citizen | 0 (0.0%) | 0 (0.0%) |
| Foreign Born, not a Citizen | 0 (0.0%) | 0 (0.0%) |
Health Insurance Coverage by Household Income in McGrath
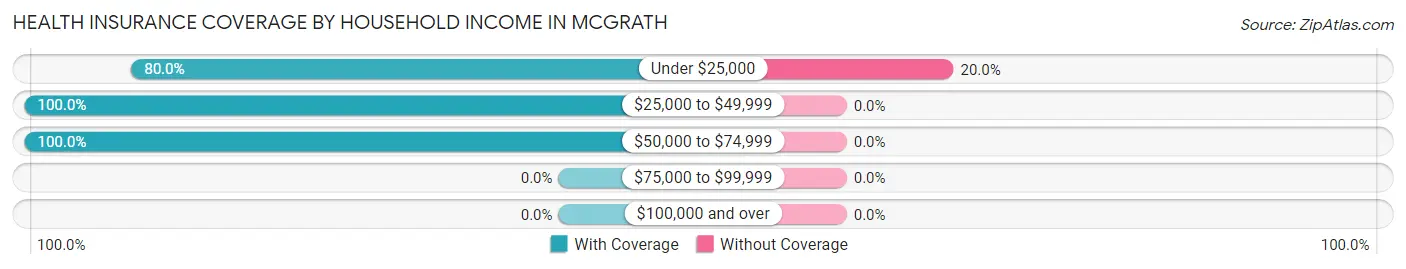
| Household Income | With Coverage | Without Coverage |
| Under $25,000 | 16 (80.0%) | 4 (20.0%) |
| $25,000 to $49,999 | 2 (100.0%) | 0 (0.0%) |
| $50,000 to $74,999 | 2 (100.0%) | 0 (0.0%) |
| $75,000 to $99,999 | 0 (0.0%) | 0 (0.0%) |
| $100,000 and over | 0 (0.0%) | 0 (0.0%) |
Public vs Private Health Insurance Coverage by Age in McGrath
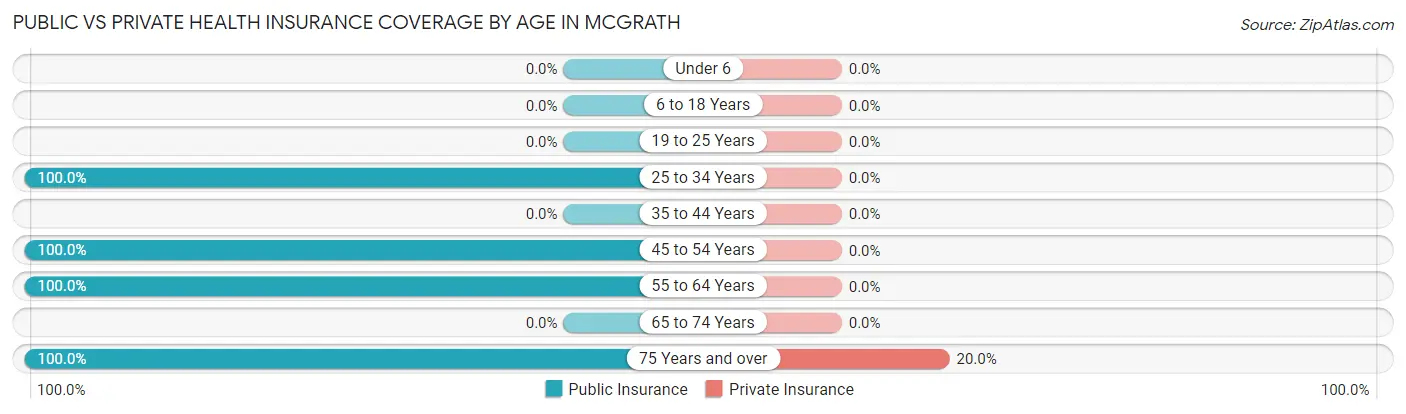
| Age Bracket | Public Insurance | Private Insurance |
| Under 6 | 0 (0.0%) | 0 (0.0%) |
| 6 to 18 Years | 0 (0.0%) | 0 (0.0%) |
| 19 to 25 Years | 0 (0.0%) | 0 (0.0%) |
| 25 to 34 Years | 2 (100.0%) | 0 (0.0%) |
| 35 to 44 Years | 0 (0.0%) | 0 (0.0%) |
| 45 to 54 Years | 3 (100.0%) | 0 (0.0%) |
| 55 to 64 Years | 5 (100.0%) | 0 (0.0%) |
| 65 to 74 Years | 0 (0.0%) | 0 (0.0%) |
| 75 Years and over | 10 (100.0%) | 2 (20.0%) |
| Total | 20 (83.3%) | 2 (8.3%) |
Disability Status by Sex by Age in McGrath
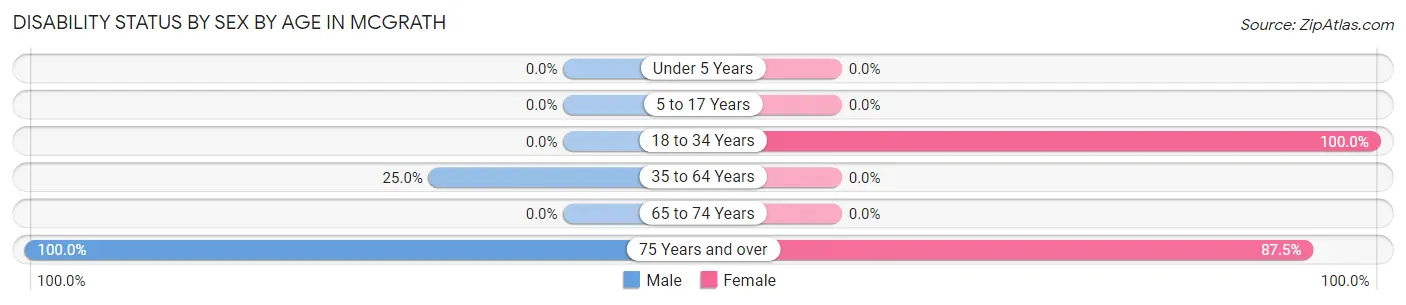
| Age Bracket | Male | Female |
| Under 5 Years | 0 (0.0%) | 0 (0.0%) |
| 5 to 17 Years | 0 (0.0%) | 0 (0.0%) |
| 18 to 34 Years | 0 (0.0%) | 2 (100.0%) |
| 35 to 64 Years | 3 (25.0%) | 0 (0.0%) |
| 65 to 74 Years | 0 (0.0%) | 0 (0.0%) |
| 75 Years and over | 2 (100.0%) | 7 (87.5%) |
Disability Class by Sex by Age in McGrath
Disability Class: Hearing Difficulty
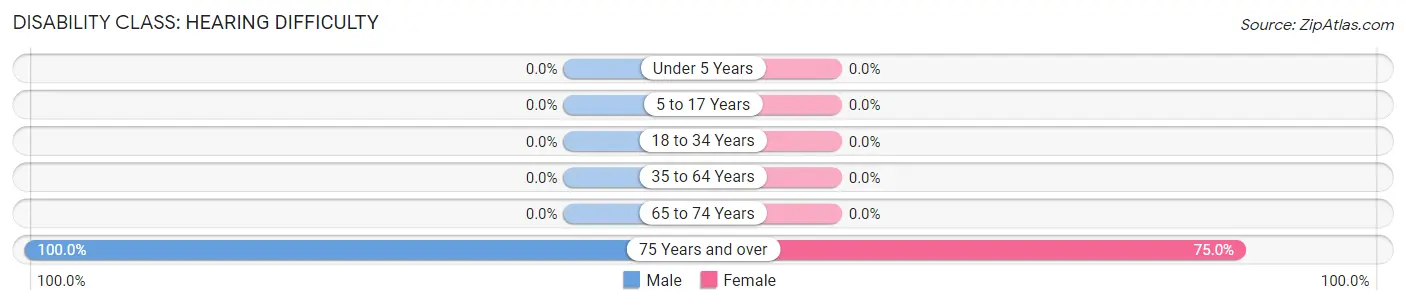
| Age Bracket | Male | Female |
| Under 5 Years | 0 (0.0%) | 0 (0.0%) |
| 5 to 17 Years | 0 (0.0%) | 0 (0.0%) |
| 18 to 34 Years | 0 (0.0%) | 0 (0.0%) |
| 35 to 64 Years | 0 (0.0%) | 0 (0.0%) |
| 65 to 74 Years | 0 (0.0%) | 0 (0.0%) |
| 75 Years and over | 2 (100.0%) | 6 (75.0%) |
Disability Class: Vision Difficulty
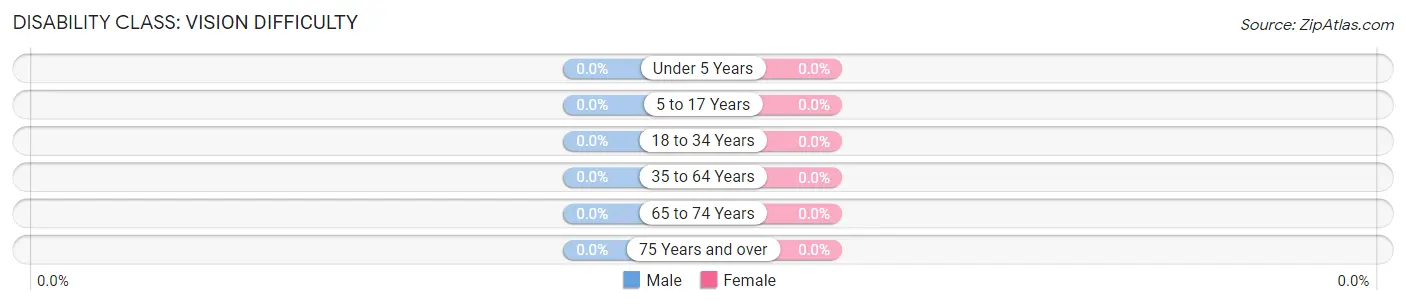
| Age Bracket | Male | Female |
| Under 5 Years | 0 (0.0%) | 0 (0.0%) |
| 5 to 17 Years | 0 (0.0%) | 0 (0.0%) |
| 18 to 34 Years | 0 (0.0%) | 0 (0.0%) |
| 35 to 64 Years | 0 (0.0%) | 0 (0.0%) |
| 65 to 74 Years | 0 (0.0%) | 0 (0.0%) |
| 75 Years and over | 0 (0.0%) | 0 (0.0%) |
Disability Class: Cognitive Difficulty
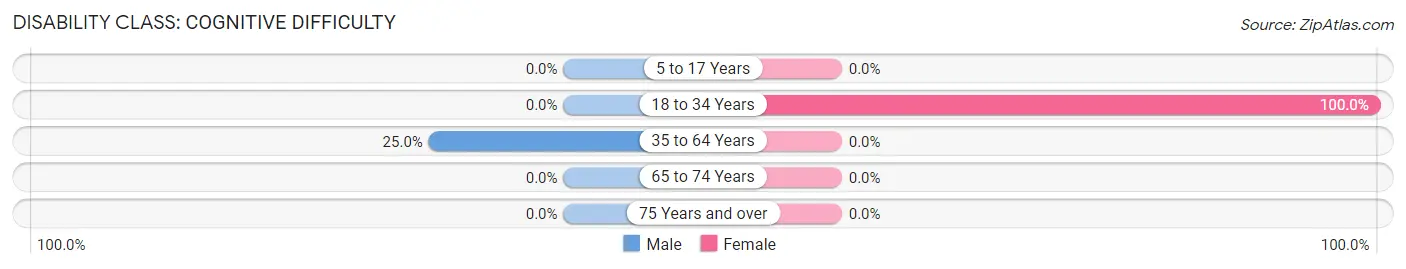
| Age Bracket | Male | Female |
| 5 to 17 Years | 0 (0.0%) | 0 (0.0%) |
| 18 to 34 Years | 0 (0.0%) | 2 (100.0%) |
| 35 to 64 Years | 3 (25.0%) | 0 (0.0%) |
| 65 to 74 Years | 0 (0.0%) | 0 (0.0%) |
| 75 Years and over | 0 (0.0%) | 0 (0.0%) |
Disability Class: Ambulatory Difficulty
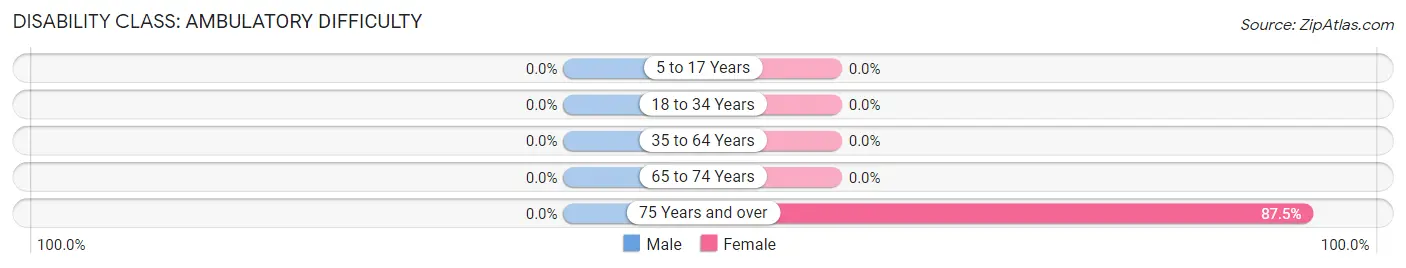
| Age Bracket | Male | Female |
| 5 to 17 Years | 0 (0.0%) | 0 (0.0%) |
| 18 to 34 Years | 0 (0.0%) | 0 (0.0%) |
| 35 to 64 Years | 0 (0.0%) | 0 (0.0%) |
| 65 to 74 Years | 0 (0.0%) | 0 (0.0%) |
| 75 Years and over | 0 (0.0%) | 7 (87.5%) |
Disability Class: Self-Care Difficulty
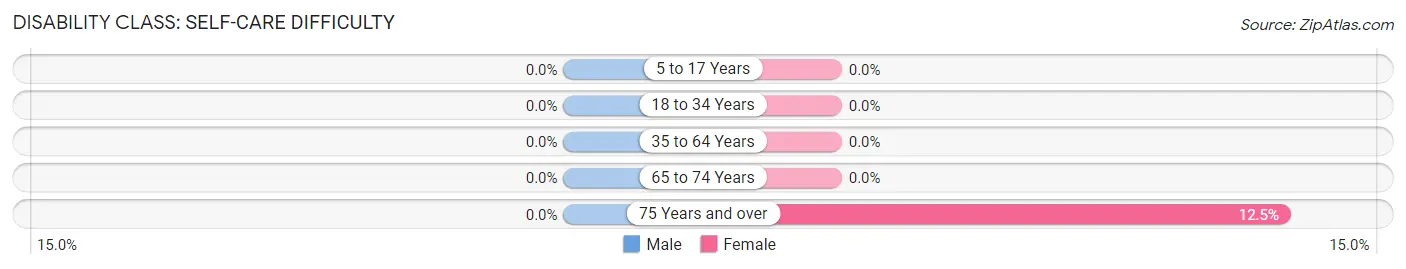
| Age Bracket | Male | Female |
| 5 to 17 Years | 0 (0.0%) | 0 (0.0%) |
| 18 to 34 Years | 0 (0.0%) | 0 (0.0%) |
| 35 to 64 Years | 0 (0.0%) | 0 (0.0%) |
| 65 to 74 Years | 0 (0.0%) | 0 (0.0%) |
| 75 Years and over | 0 (0.0%) | 1 (12.5%) |
Technology Access in McGrath
Computing Device Access in McGrath
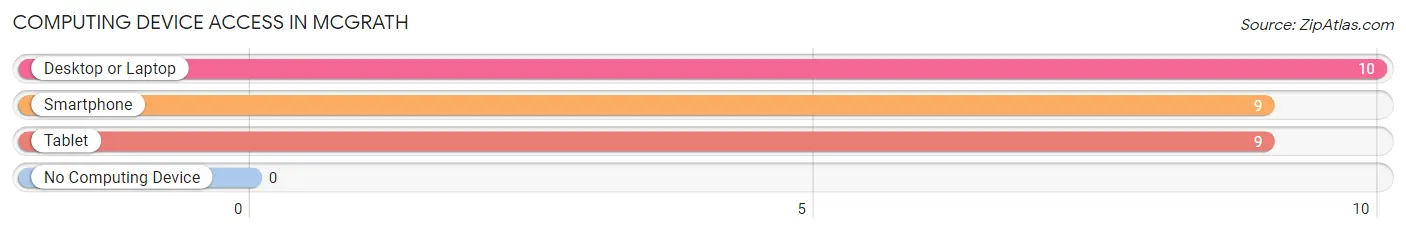
| Device Type | # Households | % Households |
| Desktop or Laptop | 10 | 71.4% |
| Smartphone | 9 | 64.3% |
| Tablet | 9 | 64.3% |
| No Computing Device | 0 | 0.0% |
| Total | 14 | 100.0% |
Internet Access in McGrath
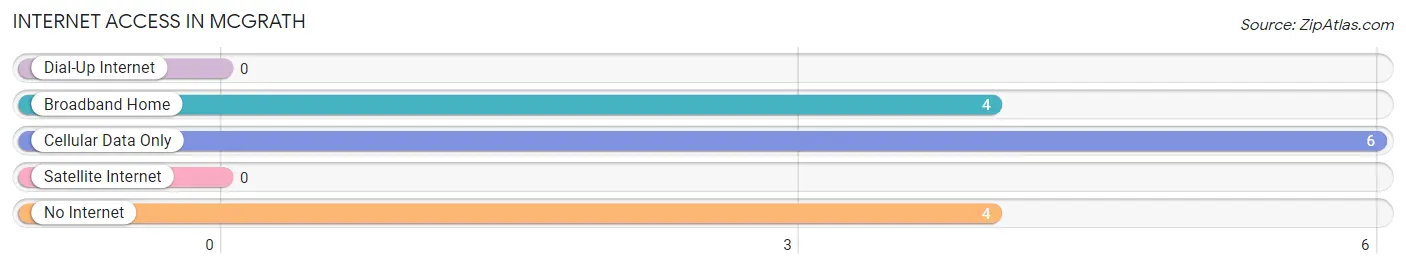
| Internet Type | # Households | % Households |
| Dial-Up Internet | 0 | 0.0% |
| Broadband Home | 4 | 28.6% |
| Cellular Data Only | 6 | 42.9% |
| Satellite Internet | 0 | 0.0% |
| No Internet | 4 | 28.6% |
| Total | 14 | 100.0% |
McGrath Summary
McGrath, Minnesota is a small city located in Aitkin County, Minnesota. It is situated on the banks of the Mississippi River, approximately 30 miles north of Minneapolis. The city has a population of approximately 1,000 people and is the county seat of Aitkin County.
History
McGrath was founded in 1887 by a group of settlers from Wisconsin. The city was named after the first settler, John McGrath, who was a lumberman and a farmer. The city was incorporated in 1891 and was the first city in Aitkin County.
The city was originally a logging and farming community, but in the early 1900s, the city began to develop into a commercial center. The city was home to several businesses, including a sawmill, a flour mill, a creamery, a blacksmith shop, and a general store.
In the 1920s, the city began to experience a period of growth and development. The city was home to several businesses, including a bank, a hotel, a movie theater, and a variety of other businesses.
Geography
McGrath is located in Aitkin County, Minnesota. The city is situated on the banks of the Mississippi River, approximately 30 miles north of Minneapolis. The city has a total area of 1.2 square miles, all of which is land.
The city is located in a rural area and is surrounded by forests and lakes. The city is home to several parks, including the McGrath City Park, which features a playground, picnic areas, and a walking path.
Economy
McGrath is a small city with a population of approximately 1,000 people. The city is home to several businesses, including a bank, a hotel, a movie theater, and a variety of other businesses.
The city is also home to several manufacturing companies, including a sawmill, a flour mill, a creamery, and a blacksmith shop. The city is also home to several agricultural businesses, including a dairy farm, a poultry farm, and a vegetable farm.
Demographics
As of the 2010 census, the population of McGrath was 1,000 people. The racial makeup of the city was 97.2% White, 0.2% African American, 0.2% Native American, 0.2% Asian, 0.2% from other races, and 1.9% from two or more races.
The median income for a household in the city was $37,500, and the median income for a family was $45,000. The per capita income for the city was $18,000. About 10.2% of families and 12.2% of the population were below the poverty line, including 16.7% of those under the age of 18 and none of those 65 and older.
McGrath is a small city with a rich history and a vibrant economy. The city is home to several businesses, including a bank, a hotel, a movie theater, and a variety of other businesses. The city is also home to several manufacturing companies, including a sawmill, a flour mill, a creamery, and a blacksmith shop. The city is also home to several agricultural businesses, including a dairy farm, a poultry farm, and a vegetable farm. The city has a population of approximately 1,000 people and is the county seat of Aitkin County.
Common Questions
What is Per Capita Income in McGrath?
Per Capita income in McGrath is $7,913.
What is the Median Household income in McGrath?
Median Household Income in McGrath is $8,750.
What is Inequality or Gini Index in McGrath?
Inequality or Gini Index in McGrath is 0.62.
What is the Total Population of McGrath?
Total Population of McGrath is 24.
What is the Total Male Population of McGrath?
Total Male Population of McGrath is 14.
What is the Total Female Population of McGrath?
Total Female Population of McGrath is 10.
What is the Ratio of Males per 100 Females in McGrath?
There are 140.00 Males per 100 Females in McGrath.
What is the Ratio of Females per 100 Males in McGrath?
There are 71.43 Females per 100 Males in McGrath.
What is the Median Population Age in McGrath?
Median Population Age in McGrath is 55.8 Years.
What is the Average Family Size in McGrath
Average Family Size in McGrath is 2.3 People.
What is the Average Household Size in McGrath
Average Household Size in McGrath is 1.7 People.