Princeton, IA Map & Demographics
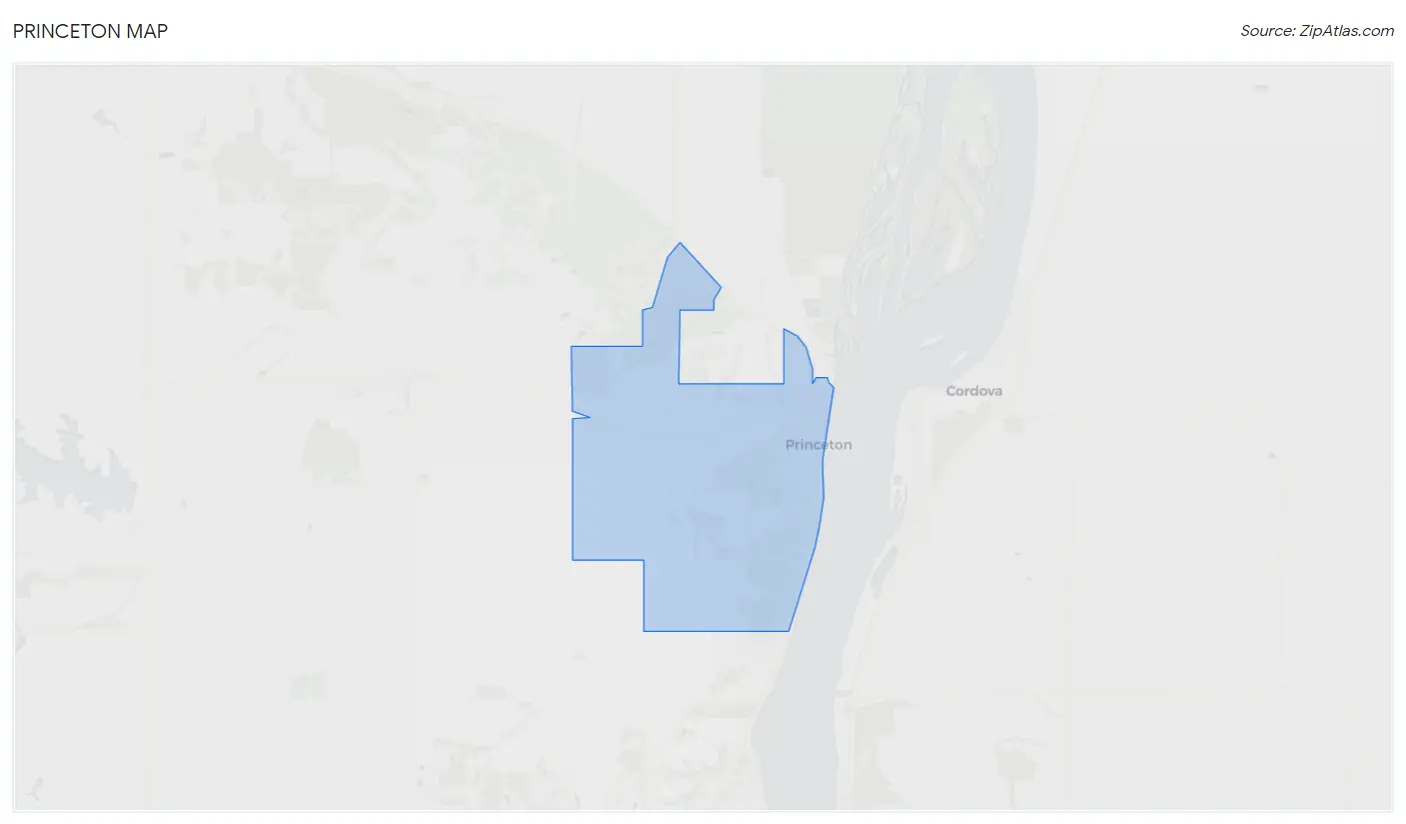
Princeton Map
Princeton Overview
$39,129
PER CAPITA INCOME
$81,875
AVG FAMILY INCOME
$79,940
AVG HOUSEHOLD INCOME
24.4%
WAGE / INCOME GAP [ % ]
75.6¢/ $1
WAGE / INCOME GAP [ $ ]
0.37
INEQUALITY / GINI INDEX
882
TOTAL POPULATION
458
MALE POPULATION
424
FEMALE POPULATION
108.02
MALES / 100 FEMALES
92.58
FEMALES / 100 MALES
45.5
MEDIAN AGE
2.8
AVG FAMILY SIZE
2.4
AVG HOUSEHOLD SIZE
506
LABOR FORCE [ PEOPLE ]
68.3%
PERCENT IN LABOR FORCE
5.7%
UNEMPLOYMENT RATE
Princeton Zip Codes
Princeton Area Codes
Income in Princeton
Income Overview in Princeton
Per Capita Income in Princeton is $39,129, while median incomes of families and households are $81,875 and $79,940 respectively.
| Characteristic | Number | Measure |
| Per Capita Income | 882 | $39,129 |
| Median Family Income | 244 | $81,875 |
| Mean Family Income | 244 | $102,300 |
| Median Household Income | 361 | $79,940 |
| Mean Household Income | 361 | $92,786 |
| Income Deficit | 244 | $0 |
| Wage / Income Gap (%) | 882 | 24.39% |
| Wage / Income Gap ($) | 882 | 75.61¢ per $1 |
| Gini / Inequality Index | 882 | 0.37 |
Earnings by Sex in Princeton
Average Earnings in Princeton are $48,542, $52,697 for men and $39,844 for women, a difference of 24.4%.
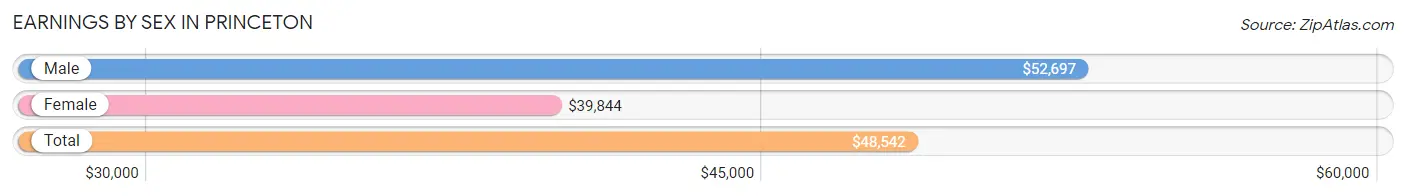
| Sex | Number | Average Earnings |
| Male | 287 (55.8%) | $52,697 |
| Female | 227 (44.2%) | $39,844 |
| Total | 514 (100.0%) | $48,542 |
Earnings by Sex by Income Bracket in Princeton
The most common earnings brackets in Princeton are $75,000 to $99,999 for men (54 | 18.8%) and $65,000 to $74,999 for women (40 | 17.6%).
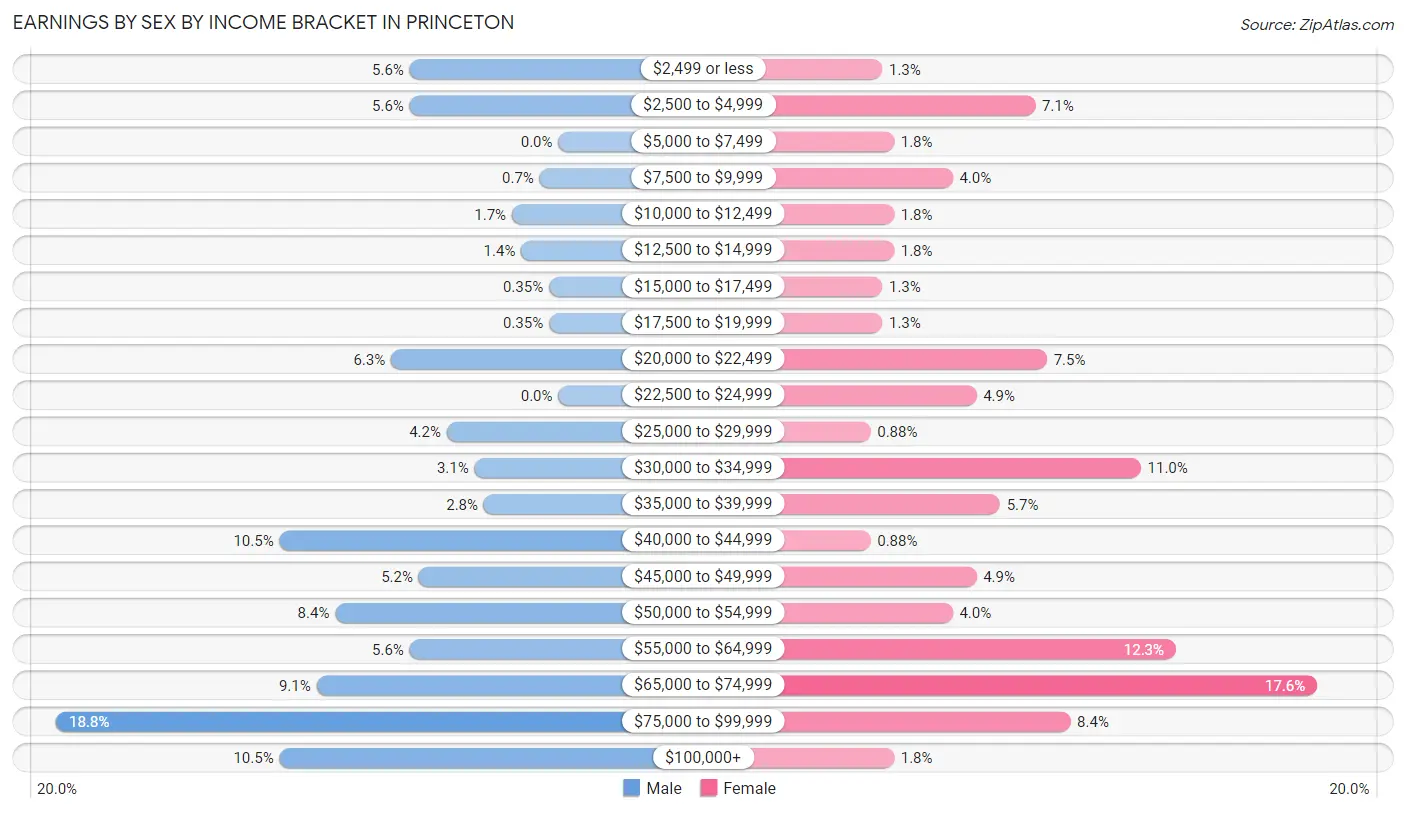
| Income | Male | Female |
| $2,499 or less | 16 (5.6%) | 3 (1.3%) |
| $2,500 to $4,999 | 16 (5.6%) | 16 (7.0%) |
| $5,000 to $7,499 | 0 (0.0%) | 4 (1.8%) |
| $7,500 to $9,999 | 2 (0.7%) | 9 (4.0%) |
| $10,000 to $12,499 | 5 (1.7%) | 4 (1.8%) |
| $12,500 to $14,999 | 4 (1.4%) | 4 (1.8%) |
| $15,000 to $17,499 | 1 (0.4%) | 3 (1.3%) |
| $17,500 to $19,999 | 1 (0.4%) | 3 (1.3%) |
| $20,000 to $22,499 | 18 (6.3%) | 17 (7.5%) |
| $22,500 to $24,999 | 0 (0.0%) | 11 (4.9%) |
| $25,000 to $29,999 | 12 (4.2%) | 2 (0.9%) |
| $30,000 to $34,999 | 9 (3.1%) | 25 (11.0%) |
| $35,000 to $39,999 | 8 (2.8%) | 13 (5.7%) |
| $40,000 to $44,999 | 30 (10.4%) | 2 (0.9%) |
| $45,000 to $49,999 | 15 (5.2%) | 11 (4.9%) |
| $50,000 to $54,999 | 24 (8.4%) | 9 (4.0%) |
| $55,000 to $64,999 | 16 (5.6%) | 28 (12.3%) |
| $65,000 to $74,999 | 26 (9.1%) | 40 (17.6%) |
| $75,000 to $99,999 | 54 (18.8%) | 19 (8.4%) |
| $100,000+ | 30 (10.4%) | 4 (1.8%) |
| Total | 287 (100.0%) | 227 (100.0%) |
Earnings by Sex by Educational Attainment in Princeton
Average earnings in Princeton are $58,125 for men and $46,500 for women, a difference of 20.0%. Men with an educational attainment of graduate degree enjoy the highest average annual earnings of $118,542, while those with high school diploma education earn the least with $29,375. Women with an educational attainment of graduate degree earn the most with the average annual earnings of $86,250, while those with high school diploma education have the smallest earnings of $21,719.
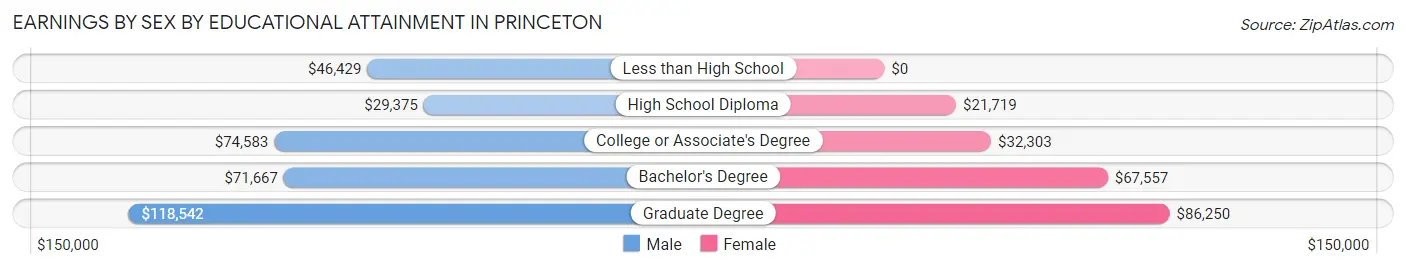
| Educational Attainment | Male Income | Female Income |
| Less than High School | $46,429 | $0 |
| High School Diploma | $29,375 | $21,719 |
| College or Associate's Degree | $74,583 | $32,303 |
| Bachelor's Degree | $71,667 | $67,557 |
| Graduate Degree | $118,542 | $86,250 |
| Total | $58,125 | $46,500 |
Family Income in Princeton
Family Income Brackets in Princeton
According to the Princeton family income data, there are 60 families falling into the $75,000 to $99,999 income range, which is the most common income bracket and makes up 24.6% of all families.
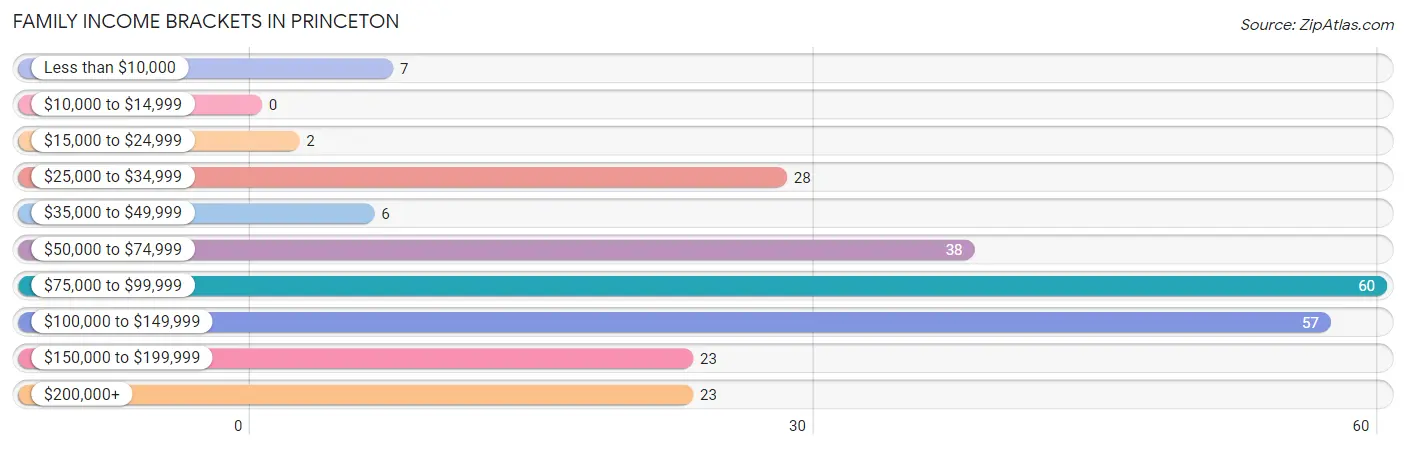
| Income Bracket | # Families | % Families |
| Less than $10,000 | 7 | 2.9% |
| $10,000 to $14,999 | 0 | 0.0% |
| $15,000 to $24,999 | 2 | 0.8% |
| $25,000 to $34,999 | 28 | 11.5% |
| $35,000 to $49,999 | 6 | 2.5% |
| $50,000 to $74,999 | 38 | 15.6% |
| $75,000 to $99,999 | 60 | 24.6% |
| $100,000 to $149,999 | 57 | 23.4% |
| $150,000 to $199,999 | 23 | 9.4% |
| $200,000+ | 23 | 9.4% |
Family Income by Famaliy Size in Princeton
3-person families (36 | 14.7%) account for the highest median family income in Princeton with $145,833 per family, while 3-person families (36 | 14.7%) have the highest median income of $48,611 per family member.
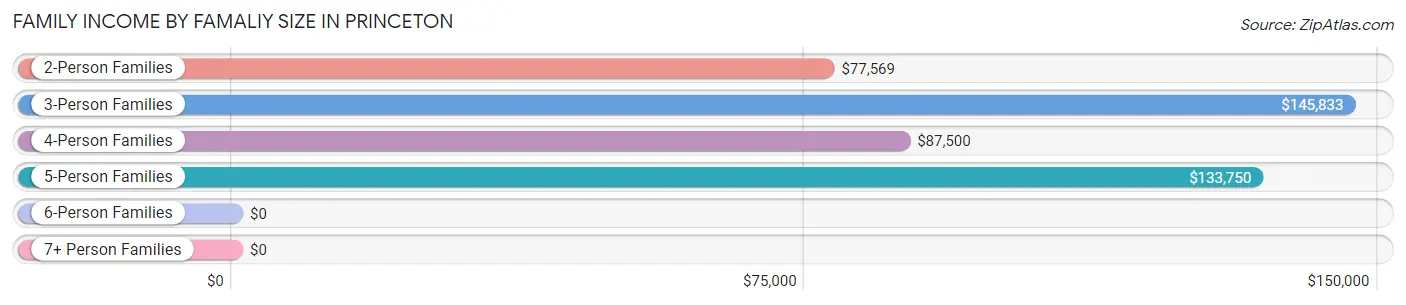
| Income Bracket | # Families | Median Income |
| 2-Person Families | 161 (66.0%) | $77,569 |
| 3-Person Families | 36 (14.7%) | $145,833 |
| 4-Person Families | 28 (11.5%) | $87,500 |
| 5-Person Families | 12 (4.9%) | $133,750 |
| 6-Person Families | 7 (2.9%) | $0 |
| 7+ Person Families | 0 (0.0%) | $0 |
| Total | 244 (100.0%) | $81,875 |
Family Income by Number of Earners in Princeton
The median family income in Princeton is $81,875, with families comprising 3+ earners (13) having the highest median family income of $116,875, while families with no earners (41) have the lowest median family income of $53,125, accounting for 5.3% and 16.8% of families, respectively.
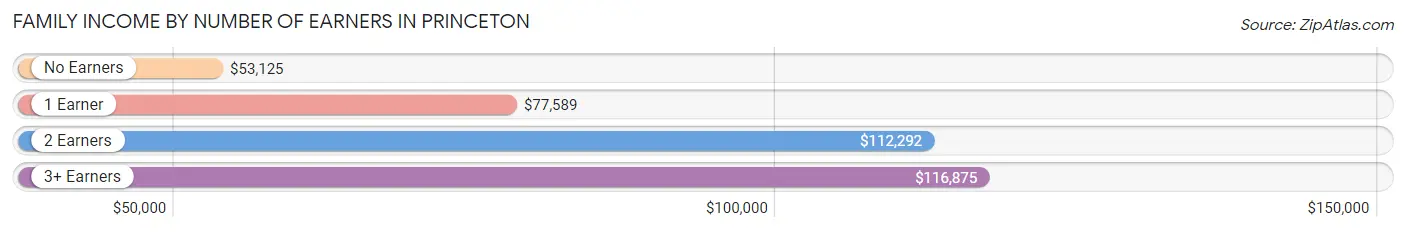
| Number of Earners | # Families | Median Income |
| No Earners | 41 (16.8%) | $53,125 |
| 1 Earner | 69 (28.3%) | $77,589 |
| 2 Earners | 121 (49.6%) | $112,292 |
| 3+ Earners | 13 (5.3%) | $116,875 |
| Total | 244 (100.0%) | $81,875 |
Household Income in Princeton
Household Income Brackets in Princeton
With 75 households falling in the category, the $100,000 to $149,999 income range is the most frequent in Princeton, accounting for 20.8% of all households. In contrast, only 2 households (0.5%) fall into the $10,000 to $14,999 income bracket, making it the least populous group.
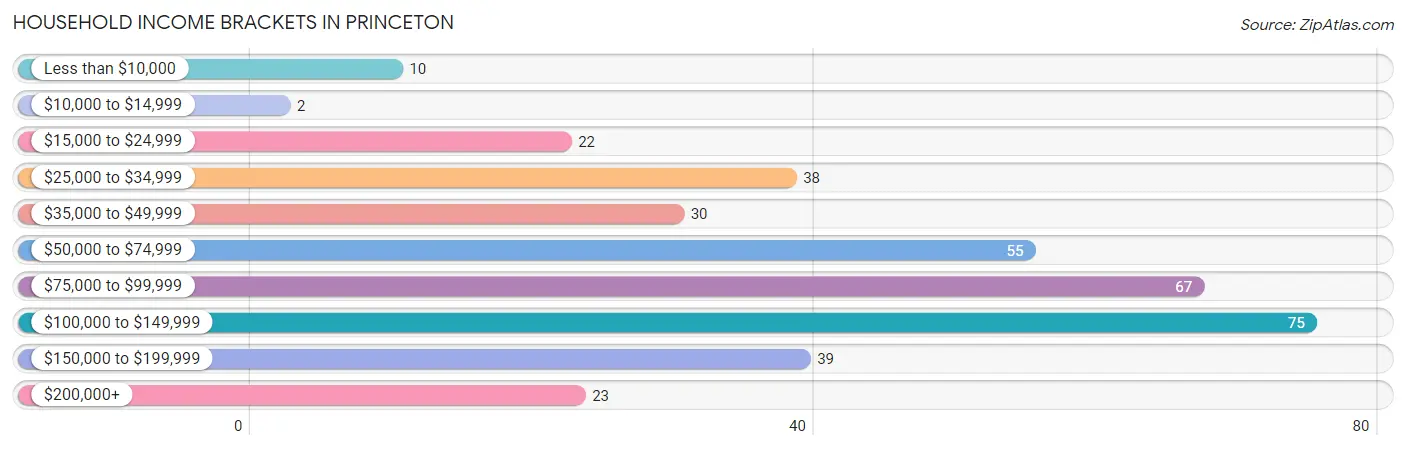
| Income Bracket | # Households | % Households |
| Less than $10,000 | 10 | 2.8% |
| $10,000 to $14,999 | 2 | 0.6% |
| $15,000 to $24,999 | 22 | 6.1% |
| $25,000 to $34,999 | 38 | 10.5% |
| $35,000 to $49,999 | 30 | 8.3% |
| $50,000 to $74,999 | 55 | 15.2% |
| $75,000 to $99,999 | 67 | 18.6% |
| $100,000 to $149,999 | 75 | 20.8% |
| $150,000 to $199,999 | 39 | 10.8% |
| $200,000+ | 23 | 6.4% |
Household Income by Householder Age in Princeton
The median household income in Princeton is $79,940, with the highest median household income of $130,761 found in the 25 to 44 years age bracket for the primary householder. A total of 110 households (30.5%) fall into this category. Meanwhile, the 15 to 24 years age bracket for the primary householder has the lowest median household income of $0, with 5 households (1.4%) in this group.
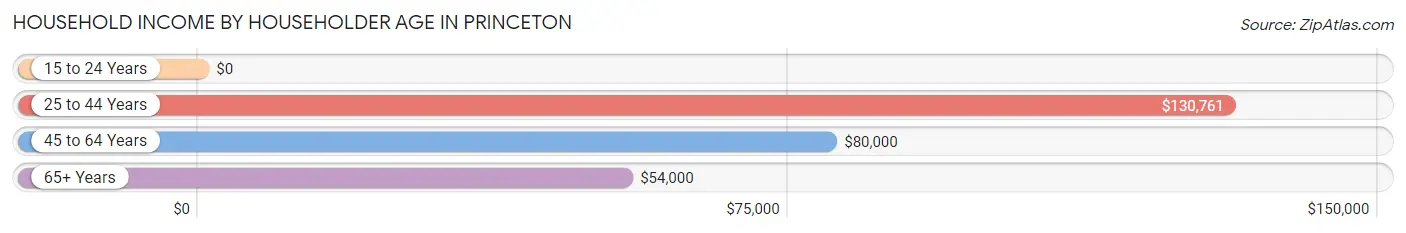
| Income Bracket | # Households | Median Income |
| 15 to 24 Years | 5 (1.4%) | $0 |
| 25 to 44 Years | 110 (30.5%) | $130,761 |
| 45 to 64 Years | 134 (37.1%) | $80,000 |
| 65+ Years | 112 (31.0%) | $54,000 |
| Total | 361 (100.0%) | $79,940 |
Poverty in Princeton
Income Below Poverty by Sex and Age in Princeton
With 7.0% poverty level for males and 3.1% for females among the residents of Princeton, 55 to 64 year old males and 18 to 24 year old females are the most vulnerable to poverty, with 18 males (22.5%) and 2 females (18.2%) in their respective age groups living below the poverty level.
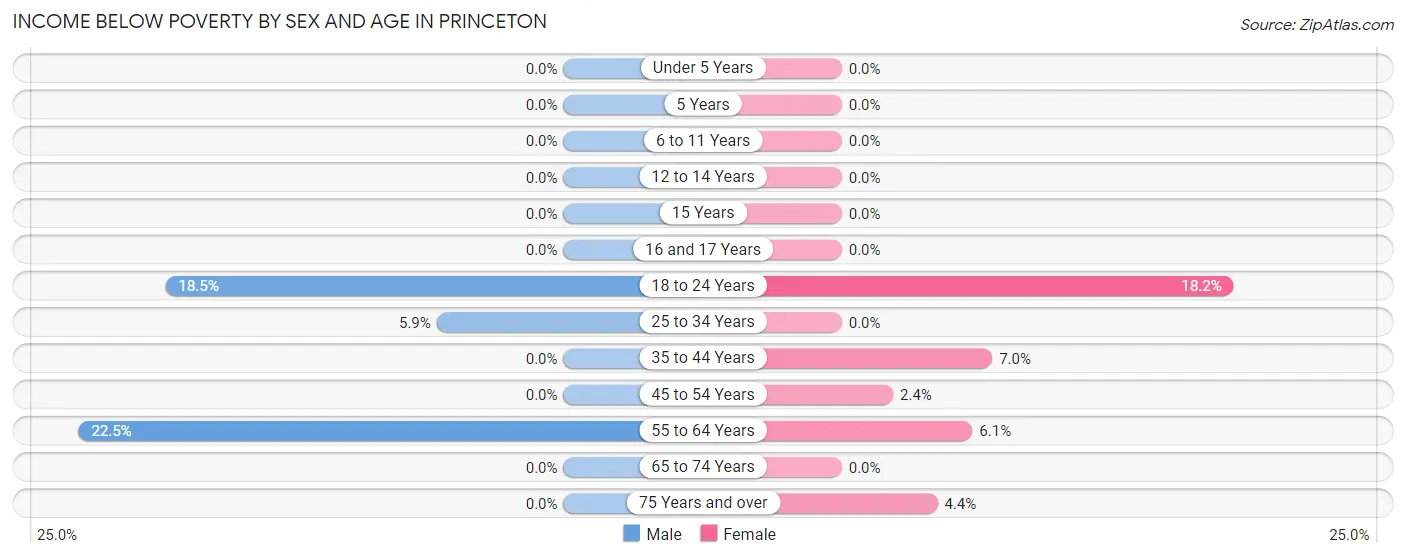
| Age Bracket | Male | Female |
| Under 5 Years | 0 (0.0%) | 0 (0.0%) |
| 5 Years | 0 (0.0%) | 0 (0.0%) |
| 6 to 11 Years | 0 (0.0%) | 0 (0.0%) |
| 12 to 14 Years | 0 (0.0%) | 0 (0.0%) |
| 15 Years | 0 (0.0%) | 0 (0.0%) |
| 16 and 17 Years | 0 (0.0%) | 0 (0.0%) |
| 18 to 24 Years | 12 (18.5%) | 2 (18.2%) |
| 25 to 34 Years | 2 (5.9%) | 0 (0.0%) |
| 35 to 44 Years | 0 (0.0%) | 3 (7.0%) |
| 45 to 54 Years | 0 (0.0%) | 2 (2.4%) |
| 55 to 64 Years | 18 (22.5%) | 4 (6.1%) |
| 65 to 74 Years | 0 (0.0%) | 0 (0.0%) |
| 75 Years and over | 0 (0.0%) | 2 (4.4%) |
| Total | 32 (7.0%) | 13 (3.1%) |
Income Above Poverty by Sex and Age in Princeton
According to the poverty statistics in Princeton, males aged under 5 years and females aged under 5 years are the age groups that are most secure financially, with 100.0% of males and 100.0% of females in these age groups living above the poverty line.
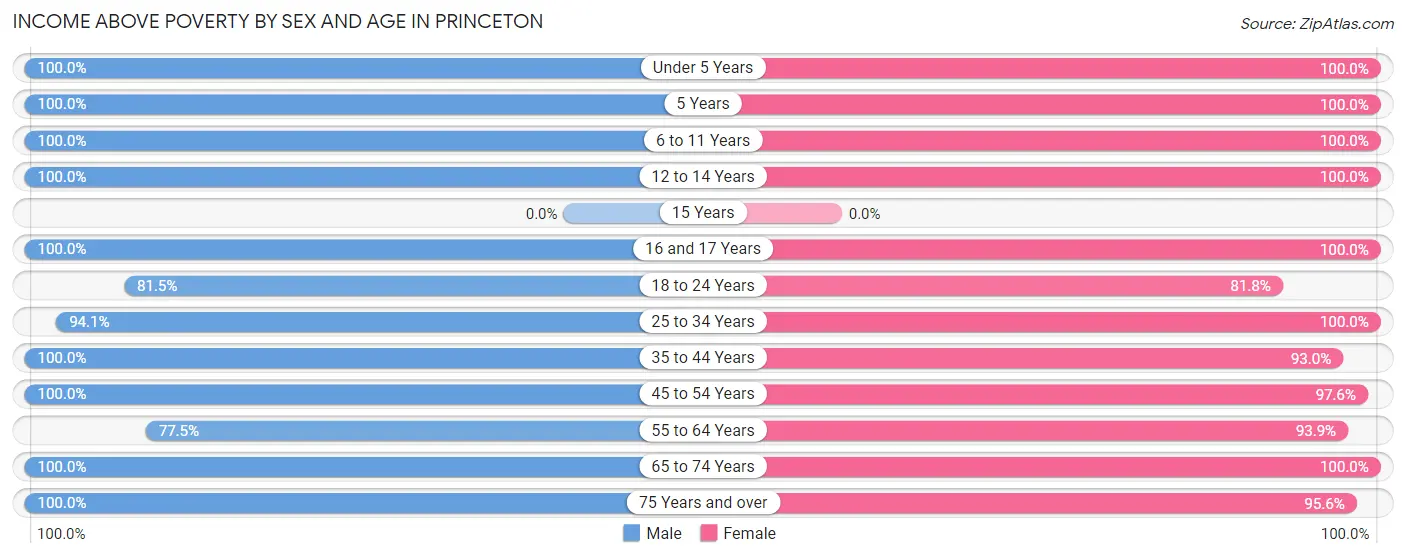
| Age Bracket | Male | Female |
| Under 5 Years | 26 (100.0%) | 21 (100.0%) |
| 5 Years | 4 (100.0%) | 6 (100.0%) |
| 6 to 11 Years | 20 (100.0%) | 52 (100.0%) |
| 12 to 14 Years | 6 (100.0%) | 6 (100.0%) |
| 15 Years | 0 (0.0%) | 0 (0.0%) |
| 16 and 17 Years | 8 (100.0%) | 13 (100.0%) |
| 18 to 24 Years | 53 (81.5%) | 9 (81.8%) |
| 25 to 34 Years | 32 (94.1%) | 35 (100.0%) |
| 35 to 44 Years | 80 (100.0%) | 40 (93.0%) |
| 45 to 54 Years | 40 (100.0%) | 82 (97.6%) |
| 55 to 64 Years | 62 (77.5%) | 62 (93.9%) |
| 65 to 74 Years | 45 (100.0%) | 42 (100.0%) |
| 75 Years and over | 50 (100.0%) | 43 (95.6%) |
| Total | 426 (93.0%) | 411 (96.9%) |
Income Below Poverty Among Married-Couple Families in Princeton
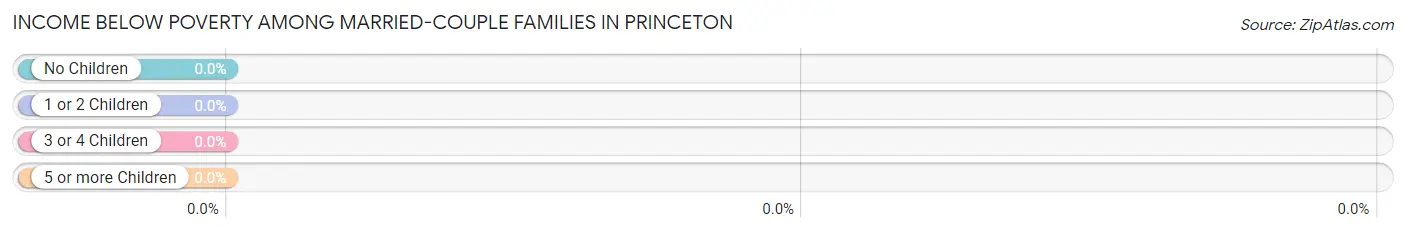
| Children | Above Poverty | Below Poverty |
| No Children | 126 (100.0%) | 0 (0.0%) |
| 1 or 2 Children | 35 (100.0%) | 0 (0.0%) |
| 3 or 4 Children | 19 (100.0%) | 0 (0.0%) |
| 5 or more Children | 0 (0.0%) | 0 (0.0%) |
| Total | 180 (100.0%) | 0 (0.0%) |
Income Below Poverty Among Single-Parent Households in Princeton
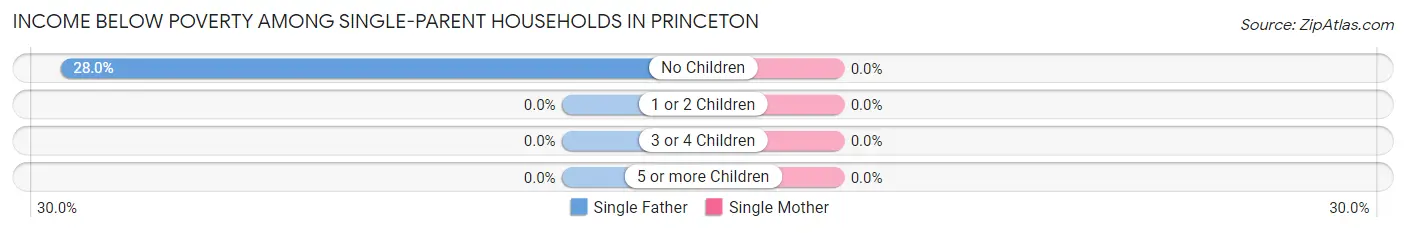
| Children | Single Father | Single Mother |
| No Children | 7 (28.0%) | 0 (0.0%) |
| 1 or 2 Children | 0 (0.0%) | 0 (0.0%) |
| 3 or 4 Children | 0 (0.0%) | 0 (0.0%) |
| 5 or more Children | 0 (0.0%) | 0 (0.0%) |
| Total | 7 (19.4%) | 0 (0.0%) |
Income Below Poverty Among Married-Couple vs Single-Parent Households in Princeton
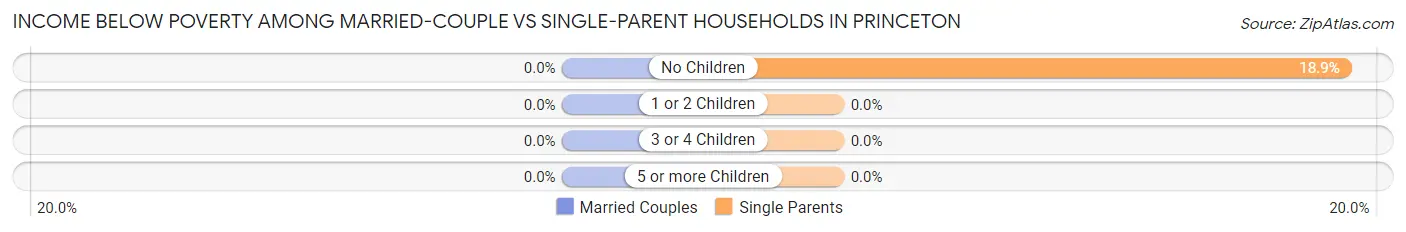
| Children | Married-Couple Families | Single-Parent Households |
| No Children | 0 (0.0%) | 7 (18.9%) |
| 1 or 2 Children | 0 (0.0%) | 0 (0.0%) |
| 3 or 4 Children | 0 (0.0%) | 0 (0.0%) |
| 5 or more Children | 0 (0.0%) | 0 (0.0%) |
| Total | 0 (0.0%) | 7 (10.9%) |
Race in Princeton
The most populous races in Princeton are White / Caucasian (822 | 93.2%), Two or more Races (59 | 6.7%), and Hispanic or Latino (3 | 0.3%).
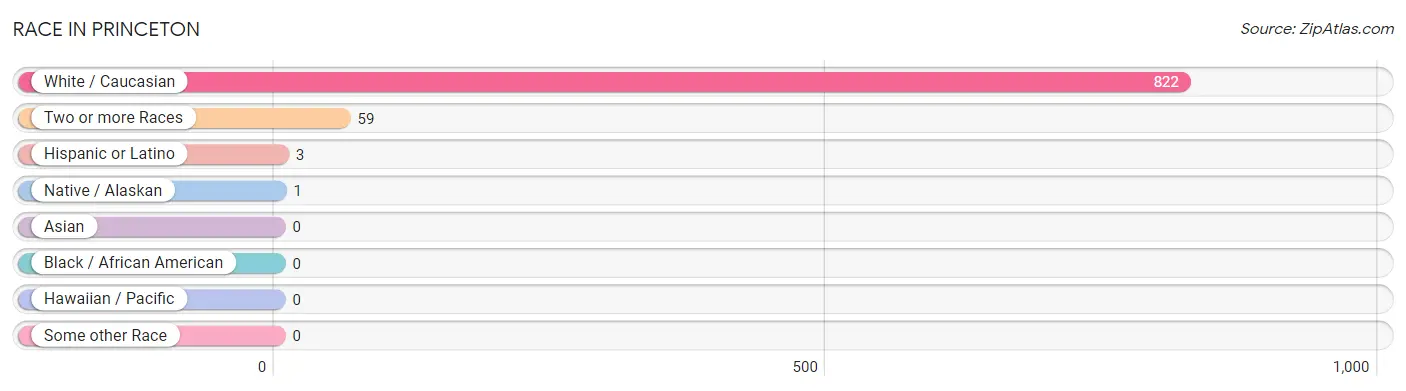
| Race | # Population | % Population |
| Asian | 0 | 0.0% |
| Black / African American | 0 | 0.0% |
| Hawaiian / Pacific | 0 | 0.0% |
| Hispanic or Latino | 3 | 0.3% |
| Native / Alaskan | 1 | 0.1% |
| White / Caucasian | 822 | 93.2% |
| Two or more Races | 59 | 6.7% |
| Some other Race | 0 | 0.0% |
| Total | 882 | 100.0% |
Ancestry in Princeton
The most populous ancestries reported in Princeton are German (371 | 42.1%), Irish (204 | 23.1%), English (95 | 10.8%), Dutch (30 | 3.4%), and Scandinavian (24 | 2.7%), together accounting for 82.1% of all Princeton residents.
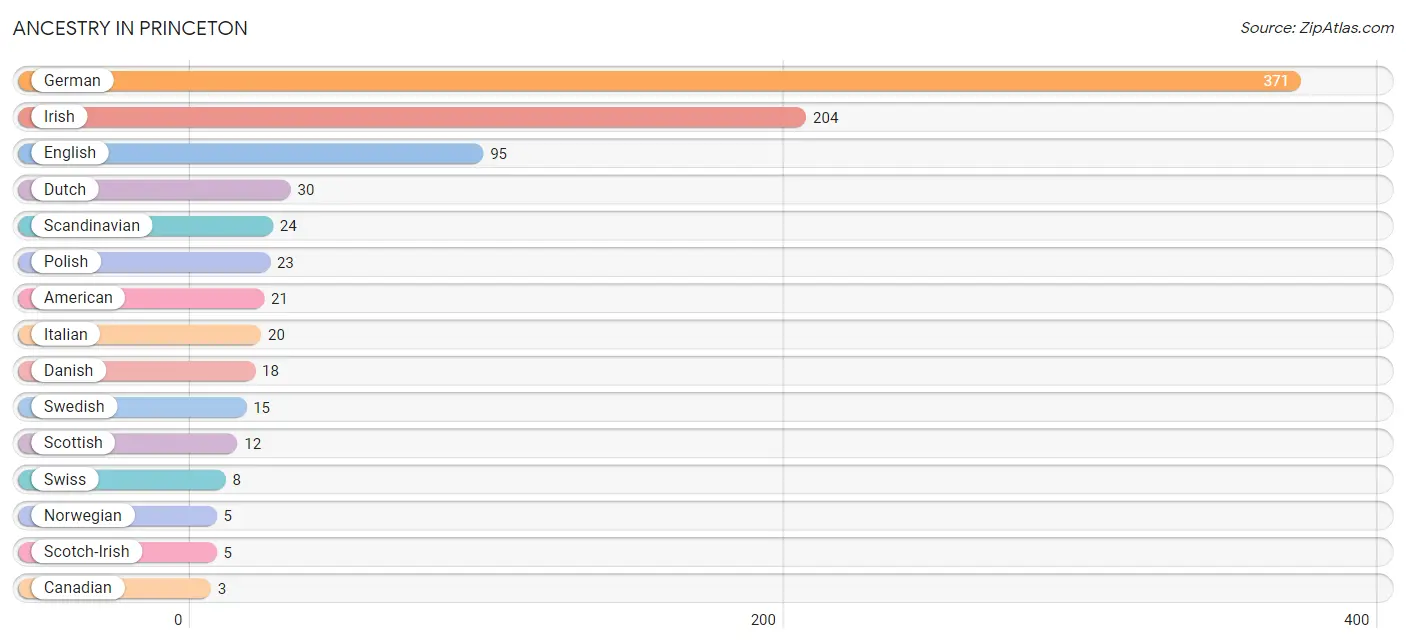
| Ancestry | # Population | % Population |
| American | 21 | 2.4% |
| Belgian | 2 | 0.2% |
| Canadian | 3 | 0.3% |
| Cuban | 1 | 0.1% |
| Czechoslovakian | 2 | 0.2% |
| Danish | 18 | 2.0% |
| Dutch | 30 | 3.4% |
| Eastern European | 2 | 0.2% |
| English | 95 | 10.8% |
| French | 2 | 0.2% |
| German | 371 | 42.1% |
| Irish | 204 | 23.1% |
| Italian | 20 | 2.3% |
| Korean | 2 | 0.2% |
| Mexican | 2 | 0.2% |
| Northern European | 2 | 0.2% |
| Norwegian | 5 | 0.6% |
| Polish | 23 | 2.6% |
| Scandinavian | 24 | 2.7% |
| Scotch-Irish | 5 | 0.6% |
| Scottish | 12 | 1.4% |
| Swedish | 15 | 1.7% |
| Swiss | 8 | 0.9% |
| Welsh | 3 | 0.3% | View All 24 Rows |
Immigrants in Princeton

| Immigration Origin | # Population | % Population | View All 0 Rows |
Sex and Age in Princeton
Sex and Age in Princeton
The most populous age groups in Princeton are 55 to 59 Years (57 | 12.4%) for men and 50 to 54 Years (55 | 13.0%) for women.
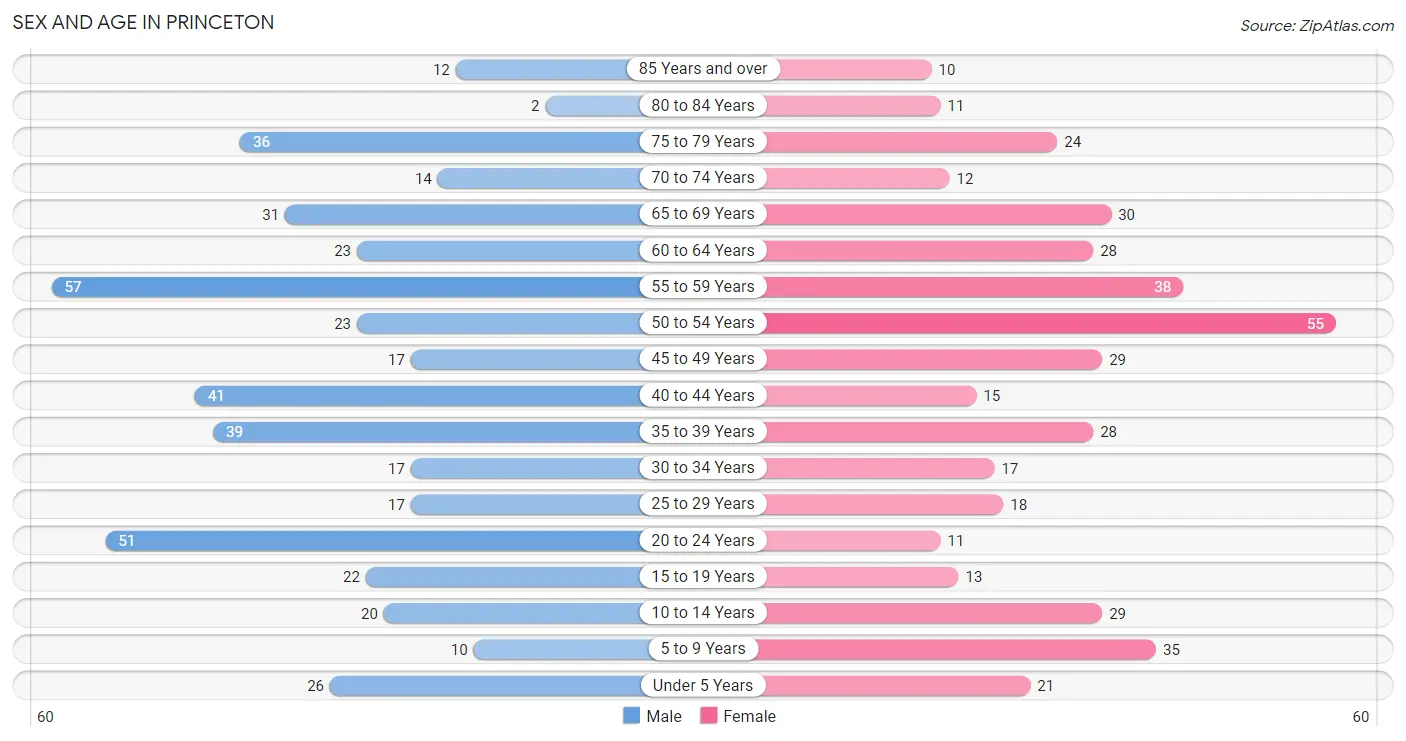
| Age Bracket | Male | Female |
| Under 5 Years | 26 (5.7%) | 21 (5.0%) |
| 5 to 9 Years | 10 (2.2%) | 35 (8.3%) |
| 10 to 14 Years | 20 (4.4%) | 29 (6.8%) |
| 15 to 19 Years | 22 (4.8%) | 13 (3.1%) |
| 20 to 24 Years | 51 (11.1%) | 11 (2.6%) |
| 25 to 29 Years | 17 (3.7%) | 18 (4.3%) |
| 30 to 34 Years | 17 (3.7%) | 17 (4.0%) |
| 35 to 39 Years | 39 (8.5%) | 28 (6.6%) |
| 40 to 44 Years | 41 (8.9%) | 15 (3.5%) |
| 45 to 49 Years | 17 (3.7%) | 29 (6.8%) |
| 50 to 54 Years | 23 (5.0%) | 55 (13.0%) |
| 55 to 59 Years | 57 (12.4%) | 38 (9.0%) |
| 60 to 64 Years | 23 (5.0%) | 28 (6.6%) |
| 65 to 69 Years | 31 (6.8%) | 30 (7.1%) |
| 70 to 74 Years | 14 (3.1%) | 12 (2.8%) |
| 75 to 79 Years | 36 (7.9%) | 24 (5.7%) |
| 80 to 84 Years | 2 (0.4%) | 11 (2.6%) |
| 85 Years and over | 12 (2.6%) | 10 (2.4%) |
| Total | 458 (100.0%) | 424 (100.0%) |
Families and Households in Princeton
Median Family Size in Princeton
The median family size in Princeton is 2.75 persons per family, with single female/mother families (28 | 11.5%) accounting for the largest median family size of 3.29 persons per family. On the other hand, single male/father families (36 | 14.7%) represent the smallest median family size with 2.03 persons per family.
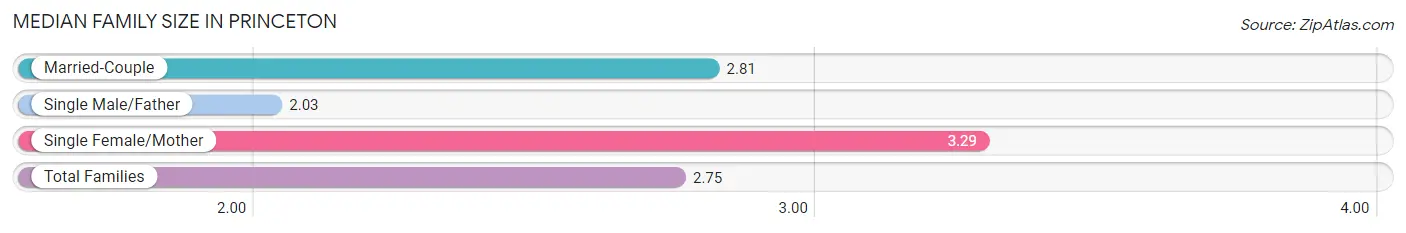
| Family Type | # Families | Family Size |
| Married-Couple | 180 (73.8%) | 2.81 |
| Single Male/Father | 36 (14.7%) | 2.03 |
| Single Female/Mother | 28 (11.5%) | 3.29 |
| Total Families | 244 (100.0%) | 2.75 |
Median Household Size in Princeton
The median household size in Princeton is 2.44 persons per household, with single female/mother households (28 | 7.8%) accounting for the largest median household size of 3.86 persons per household. non-family households (117 | 32.4%) represent the smallest median household size with 1.57 persons per household.
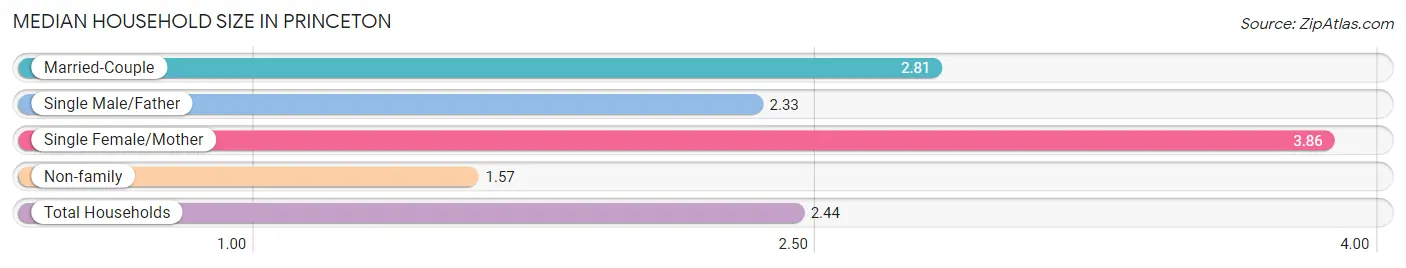
| Household Type | # Households | Household Size |
| Married-Couple | 180 (49.9%) | 2.81 |
| Single Male/Father | 36 (10.0%) | 2.33 |
| Single Female/Mother | 28 (7.8%) | 3.86 |
| Non-family | 117 (32.4%) | 1.57 |
| Total Households | 361 (100.0%) | 2.44 |
Household Size by Marriage Status in Princeton
Out of a total of 361 households in Princeton, 244 (67.6%) are family households, while 117 (32.4%) are nonfamily households. The most numerous type of family households are 2-person households, comprising 150, and the most common type of nonfamily households are 1-person households, comprising 66.
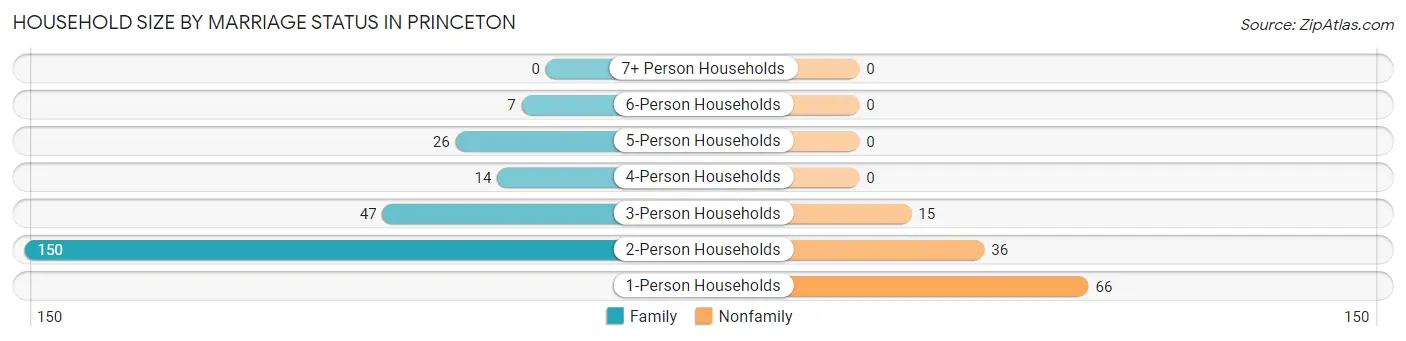
| Household Size | Family Households | Nonfamily Households |
| 1-Person Households | - | 66 (18.3%) |
| 2-Person Households | 150 (41.5%) | 36 (10.0%) |
| 3-Person Households | 47 (13.0%) | 15 (4.2%) |
| 4-Person Households | 14 (3.9%) | 0 (0.0%) |
| 5-Person Households | 26 (7.2%) | 0 (0.0%) |
| 6-Person Households | 7 (1.9%) | 0 (0.0%) |
| 7+ Person Households | 0 (0.0%) | 0 (0.0%) |
| Total | 244 (67.6%) | 117 (32.4%) |
Female Fertility in Princeton
Fertility by Age in Princeton
Average fertility rate in Princeton is 32.0 births per 1,000 women. Women in the age bracket of 20 to 34 years have the highest fertility rate with 109.0 births per 1,000 women. Women in the age bracket of 20 to 34 years acount for 100.0% of all women with births.
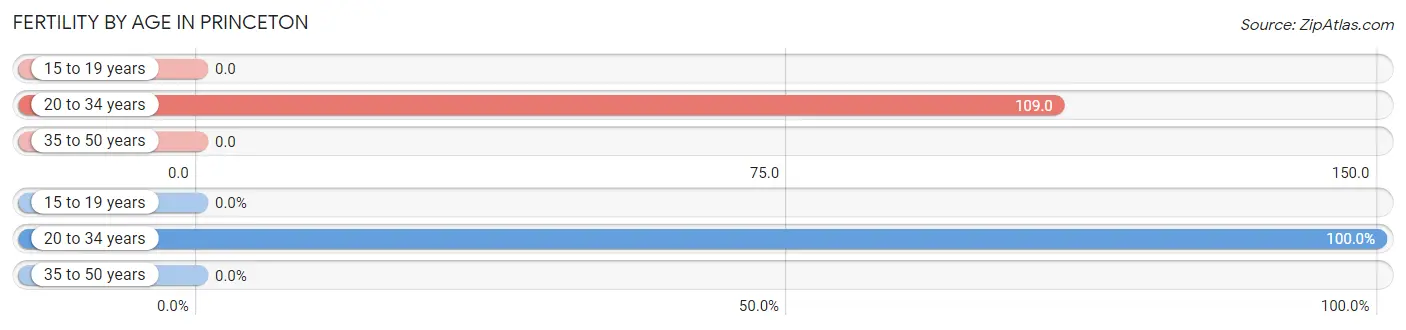
| Age Bracket | Women with Births | Births / 1,000 Women |
| 15 to 19 years | 0 (0.0%) | 0.0 |
| 20 to 34 years | 5 (100.0%) | 109.0 |
| 35 to 50 years | 0 (0.0%) | 0.0 |
| Total | 5 (100.0%) | 32.0 |
Fertility by Age by Marriage Status in Princeton
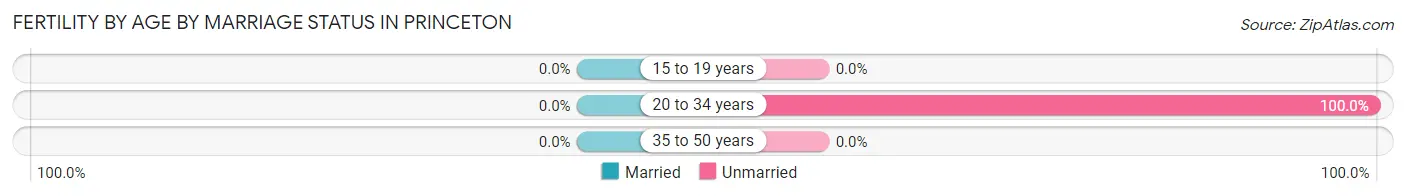
| Age Bracket | Married | Unmarried |
| 15 to 19 years | 0 (0.0%) | 0 (0.0%) |
| 20 to 34 years | 0 (0.0%) | 5 (100.0%) |
| 35 to 50 years | 0 (0.0%) | 0 (0.0%) |
| Total | 0 (0.0%) | 5 (100.0%) |
Fertility by Education in Princeton
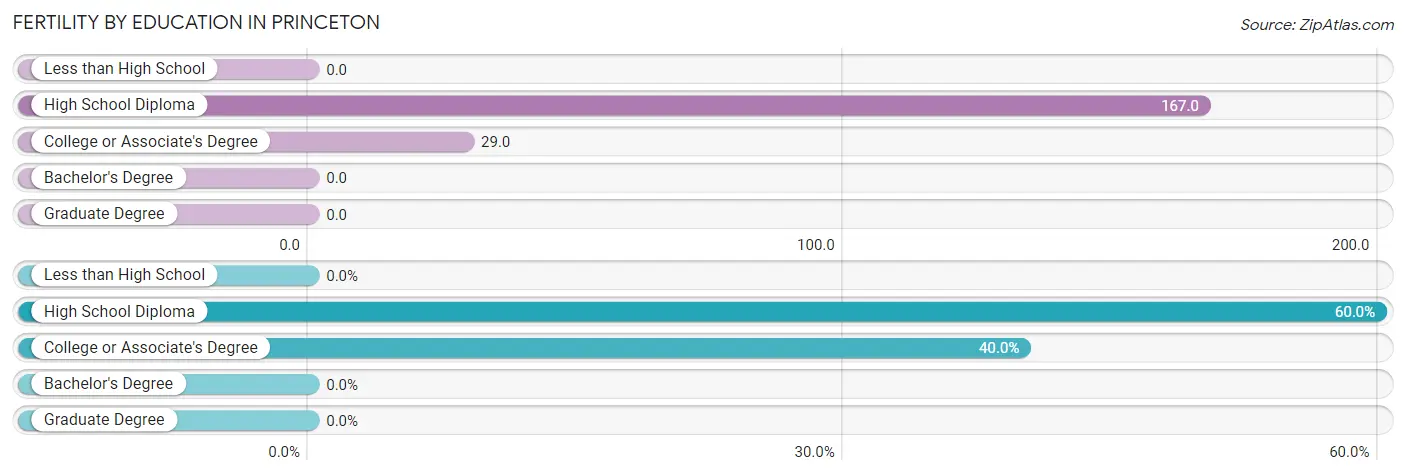
| Educational Attainment | Women with Births | Births / 1,000 Women |
| Less than High School | 0 (0.0%) | 0.0 |
| High School Diploma | 3 (60.0%) | 167.0 |
| College or Associate's Degree | 2 (40.0%) | 29.0 |
| Bachelor's Degree | 0 (0.0%) | 0.0 |
| Graduate Degree | 0 (0.0%) | 0.0 |
| Total | 5 (100.0%) | 32.0 |
Fertility by Education by Marriage Status in Princeton
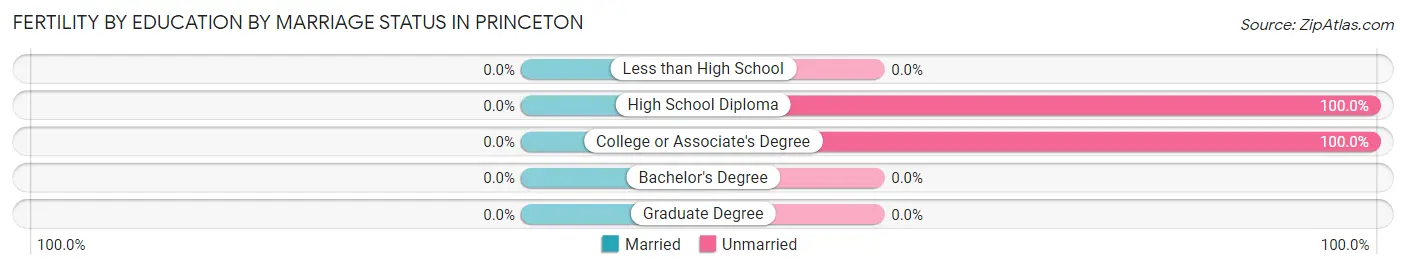
| Educational Attainment | Married | Unmarried |
| Less than High School | 0 (0.0%) | 0 (0.0%) |
| High School Diploma | 0 (0.0%) | 3 (100.0%) |
| College or Associate's Degree | 0 (0.0%) | 2 (100.0%) |
| Bachelor's Degree | 0 (0.0%) | 0 (0.0%) |
| Graduate Degree | 0 (0.0%) | 0 (0.0%) |
| Total | 0 (0.0%) | 5 (100.0%) |
Employment Characteristics in Princeton
Employment by Class of Employer in Princeton
Among the 446 employed individuals in Princeton, private company employees (323 | 72.4%), local government employees (36 | 8.1%), and self-employed (not incorporated) (32 | 7.2%) make up the most common classes of employment.
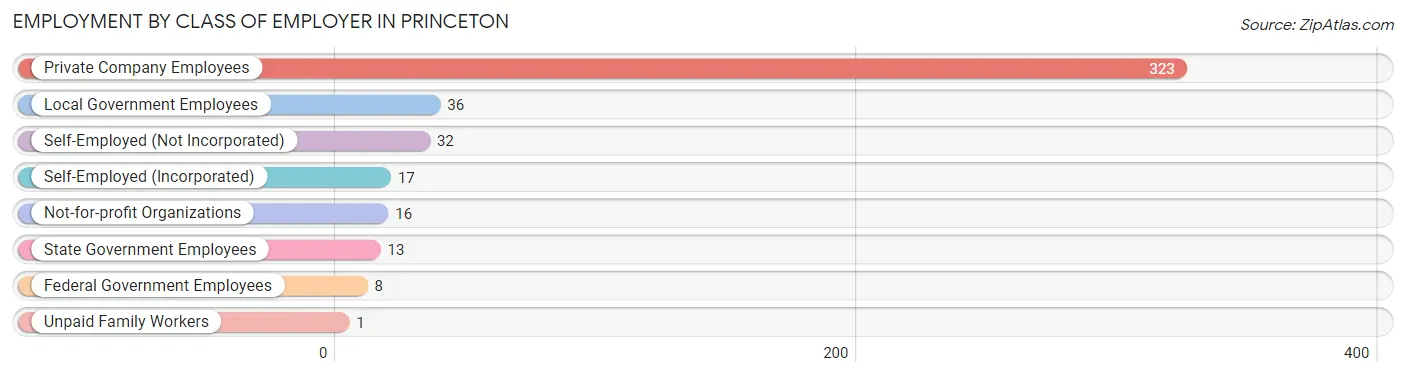
| Employer Class | # Employees | % Employees |
| Private Company Employees | 323 | 72.4% |
| Self-Employed (Incorporated) | 17 | 3.8% |
| Self-Employed (Not Incorporated) | 32 | 7.2% |
| Not-for-profit Organizations | 16 | 3.6% |
| Local Government Employees | 36 | 8.1% |
| State Government Employees | 13 | 2.9% |
| Federal Government Employees | 8 | 1.8% |
| Unpaid Family Workers | 1 | 0.2% |
| Total | 446 | 100.0% |
Employment Status by Age in Princeton
According to the labor force statistics for Princeton, out of the total population over 16 years of age (741), 68.3% or 506 individuals are in the labor force, with 5.7% or 29 of them unemployed. The age group with the highest labor force participation rate is 20 to 24 years, with 100.0% or 62 individuals in the labor force. Within the labor force, the 20 to 24 years age range has the highest percentage of unemployed individuals, with 16.1% or 10 of them being unemployed.
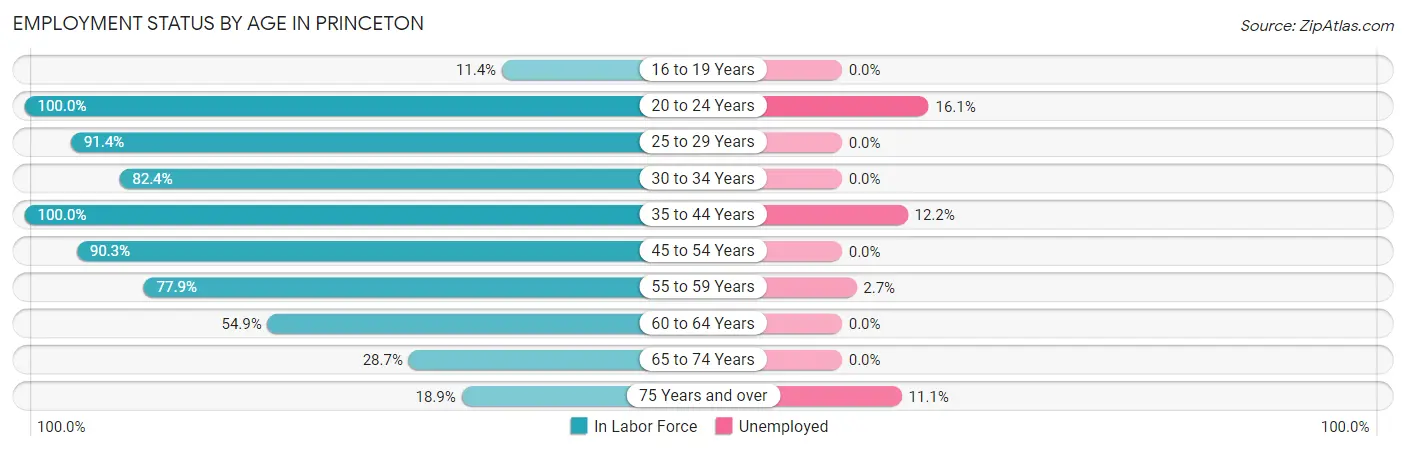
| Age Bracket | In Labor Force | Unemployed |
| 16 to 19 Years | 4 (11.4%) | 0 (0.0%) |
| 20 to 24 Years | 62 (100.0%) | 10 (16.1%) |
| 25 to 29 Years | 32 (91.4%) | 0 (0.0%) |
| 30 to 34 Years | 28 (82.4%) | 0 (0.0%) |
| 35 to 44 Years | 123 (100.0%) | 15 (12.2%) |
| 45 to 54 Years | 112 (90.3%) | 0 (0.0%) |
| 55 to 59 Years | 74 (77.9%) | 2 (2.7%) |
| 60 to 64 Years | 28 (54.9%) | 0 (0.0%) |
| 65 to 74 Years | 25 (28.7%) | 0 (0.0%) |
| 75 Years and over | 18 (18.9%) | 2 (11.1%) |
| Total | 506 (68.3%) | 29 (5.7%) |
Employment Status by Educational Attainment in Princeton
According to labor force statistics for Princeton, 85.9% of individuals (397) out of the total population between 25 and 64 years of age (462) are in the labor force, with 4.3% or 17 of them being unemployed. The group with the highest labor force participation rate are those with the educational attainment of college / associate degree, with 92.3% or 191 individuals in the labor force. Within the labor force, individuals with college / associate degree education have the highest percentage of unemployment, with 7.9% or 15 of them being unemployed.
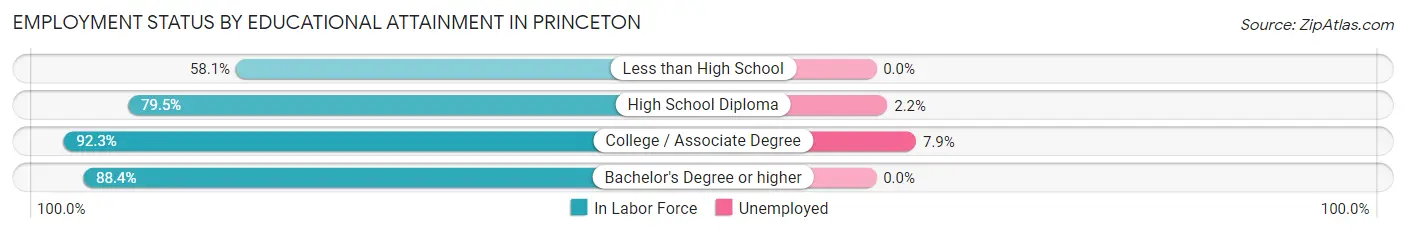
| Educational Attainment | In Labor Force | Unemployed |
| Less than High School | 18 (58.1%) | 0 (0.0%) |
| High School Diploma | 89 (79.5%) | 2 (2.2%) |
| College / Associate Degree | 191 (92.3%) | 16 (7.9%) |
| Bachelor's Degree or higher | 99 (88.4%) | 0 (0.0%) |
| Total | 397 (85.9%) | 20 (4.3%) |
Employment Occupations by Sex in Princeton
Management, Business, Science and Arts Occupations
The most common Management, Business, Science and Arts occupations in Princeton are Health Diagnosing & Treating (56 | 11.7%), Management (54 | 11.3%), Community & Social Service (40 | 8.4%), Health Technologists (38 | 8.0%), and Computers, Engineering & Science (27 | 5.7%).
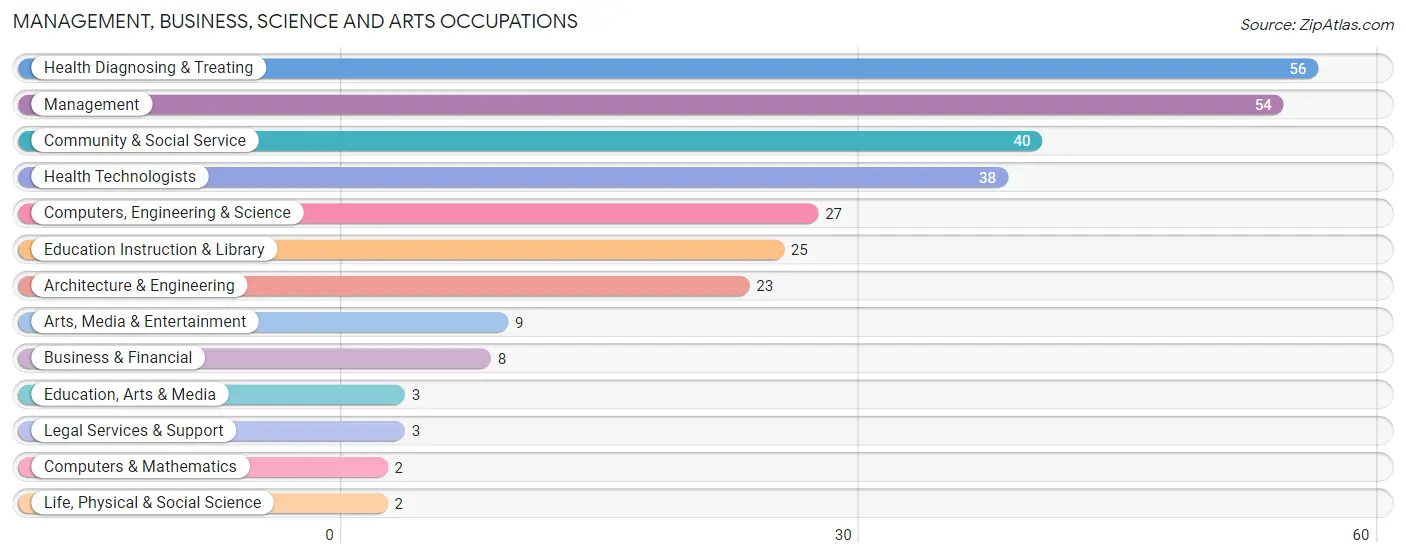
Management, Business, Science and Arts Occupations by Sex
Within the Management, Business, Science and Arts occupations in Princeton, the most male-oriented occupations are Computers & Mathematics (100.0%), Architecture & Engineering (82.6%), and Management (77.8%), while the most female-oriented occupations are Life, Physical & Social Science (100.0%), Arts, Media & Entertainment (88.9%), and Education Instruction & Library (88.0%).
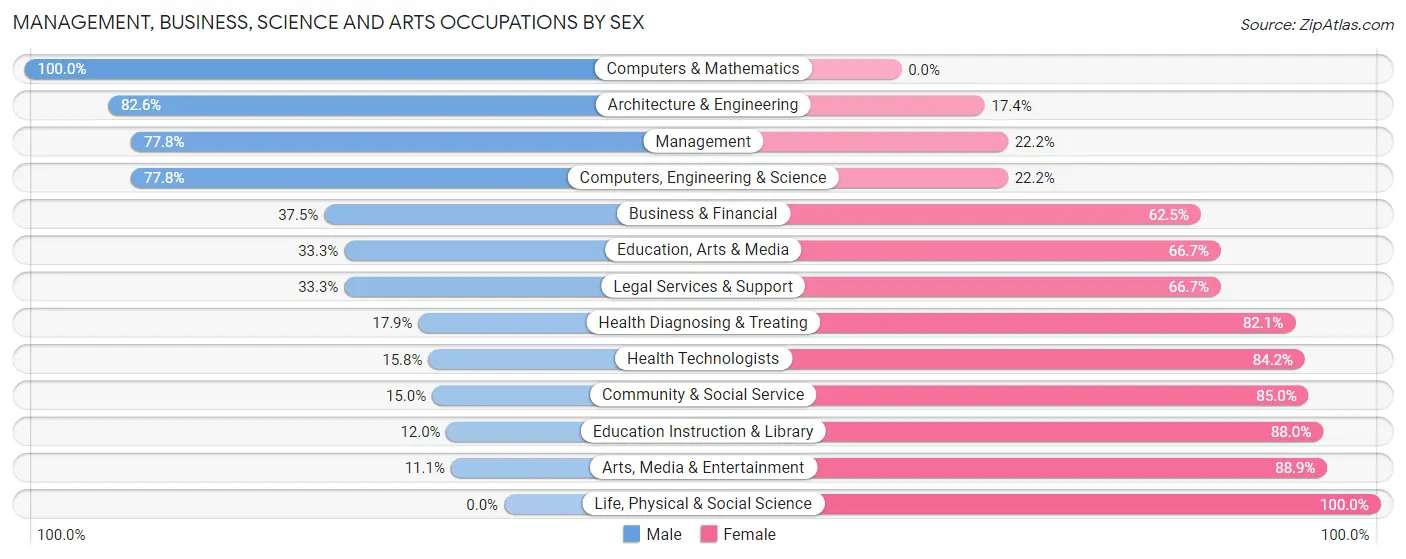
| Occupation | Male | Female |
| Management | 42 (77.8%) | 12 (22.2%) |
| Business & Financial | 3 (37.5%) | 5 (62.5%) |
| Computers, Engineering & Science | 21 (77.8%) | 6 (22.2%) |
| Computers & Mathematics | 2 (100.0%) | 0 (0.0%) |
| Architecture & Engineering | 19 (82.6%) | 4 (17.4%) |
| Life, Physical & Social Science | 0 (0.0%) | 2 (100.0%) |
| Community & Social Service | 6 (15.0%) | 34 (85.0%) |
| Education, Arts & Media | 1 (33.3%) | 2 (66.7%) |
| Legal Services & Support | 1 (33.3%) | 2 (66.7%) |
| Education Instruction & Library | 3 (12.0%) | 22 (88.0%) |
| Arts, Media & Entertainment | 1 (11.1%) | 8 (88.9%) |
| Health Diagnosing & Treating | 10 (17.9%) | 46 (82.1%) |
| Health Technologists | 6 (15.8%) | 32 (84.2%) |
| Total (Category) | 82 (44.3%) | 103 (55.7%) |
| Total (Overall) | 258 (54.1%) | 219 (45.9%) |
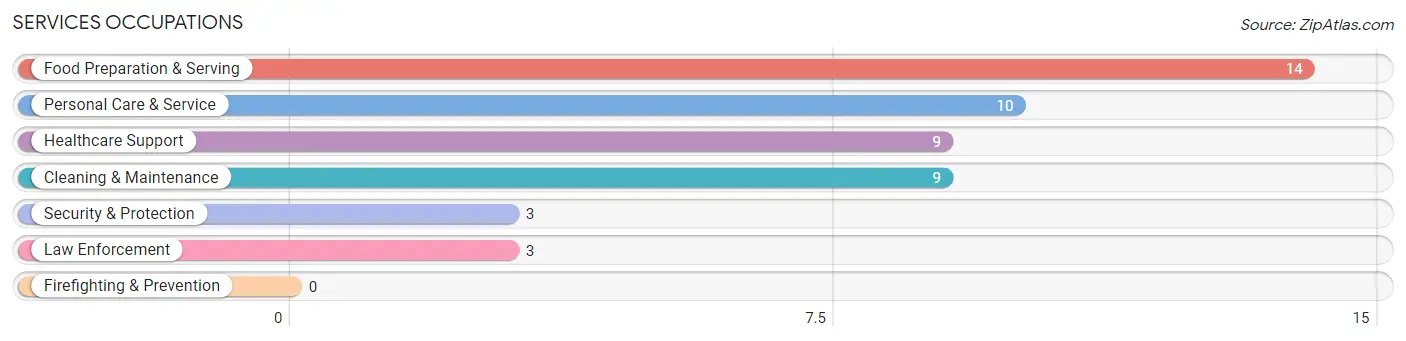
Services Occupations
The most common Services occupations in Princeton are Food Preparation & Serving (14 | 2.9%), Personal Care & Service (10 | 2.1%), Healthcare Support (9 | 1.9%), Cleaning & Maintenance (9 | 1.9%), and Security & Protection (3 | 0.6%).
Services Occupations by Sex
Within the Services occupations in Princeton, the most male-oriented occupations are Cleaning & Maintenance (44.4%), and Food Preparation & Serving (35.7%), while the most female-oriented occupations are Healthcare Support (100.0%), Security & Protection (100.0%), and Law Enforcement (100.0%).
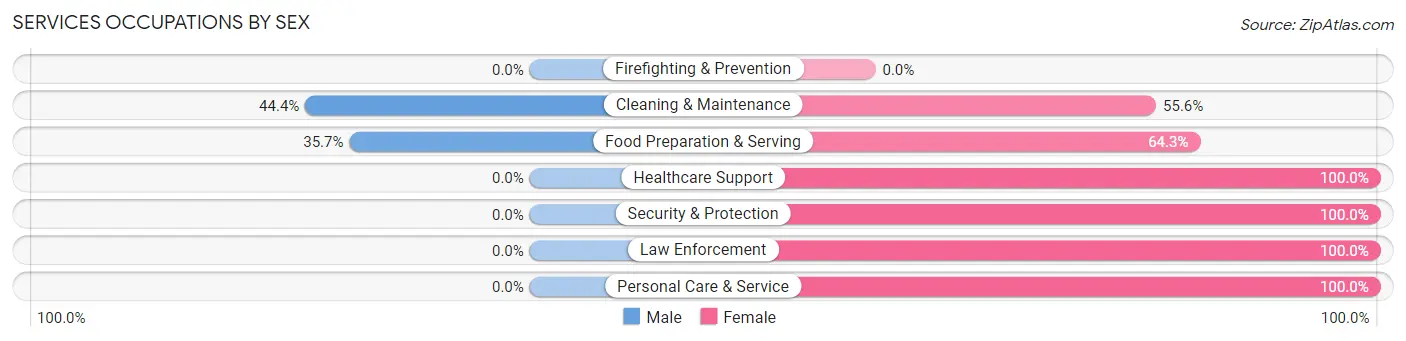
| Occupation | Male | Female |
| Healthcare Support | 0 (0.0%) | 9 (100.0%) |
| Security & Protection | 0 (0.0%) | 3 (100.0%) |
| Firefighting & Prevention | 0 (0.0%) | 0 (0.0%) |
| Law Enforcement | 0 (0.0%) | 3 (100.0%) |
| Food Preparation & Serving | 5 (35.7%) | 9 (64.3%) |
| Cleaning & Maintenance | 4 (44.4%) | 5 (55.6%) |
| Personal Care & Service | 0 (0.0%) | 10 (100.0%) |
| Total (Category) | 9 (20.0%) | 36 (80.0%) |
| Total (Overall) | 258 (54.1%) | 219 (45.9%) |
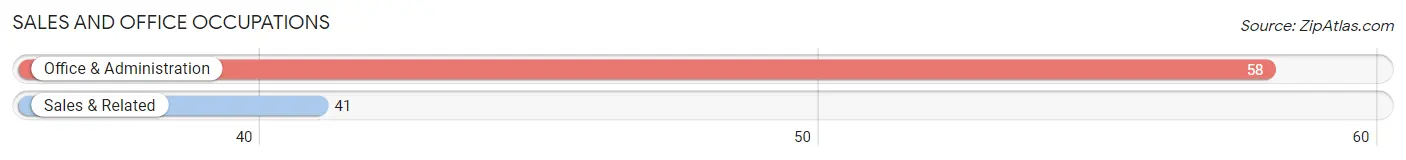
Sales and Office Occupations
The most common Sales and Office occupations in Princeton are Office & Administration (58 | 12.2%), and Sales & Related (41 | 8.6%).
Sales and Office Occupations by Sex
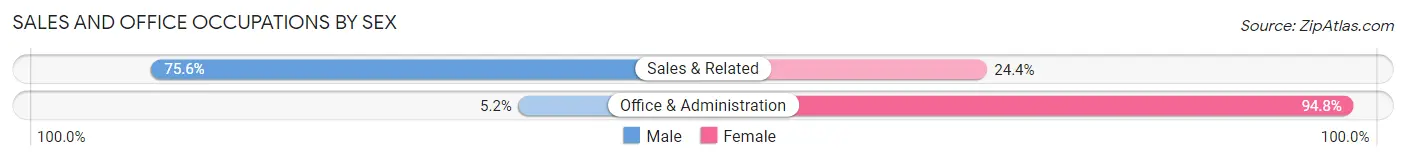
| Occupation | Male | Female |
| Sales & Related | 31 (75.6%) | 10 (24.4%) |
| Office & Administration | 3 (5.2%) | 55 (94.8%) |
| Total (Category) | 34 (34.3%) | 65 (65.7%) |
| Total (Overall) | 258 (54.1%) | 219 (45.9%) |
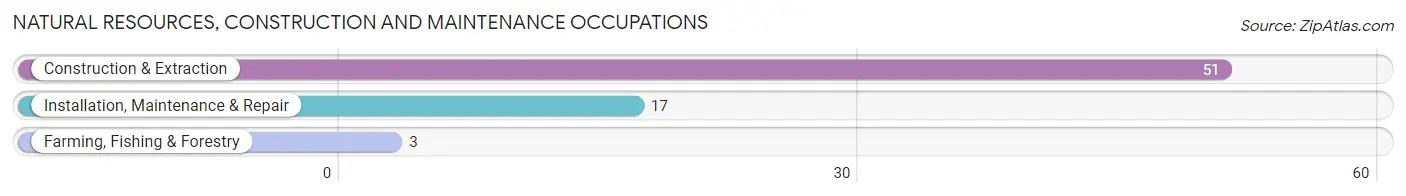
Natural Resources, Construction and Maintenance Occupations
The most common Natural Resources, Construction and Maintenance occupations in Princeton are Construction & Extraction (51 | 10.7%), Installation, Maintenance & Repair (17 | 3.6%), and Farming, Fishing & Forestry (3 | 0.6%).
Natural Resources, Construction and Maintenance Occupations by Sex
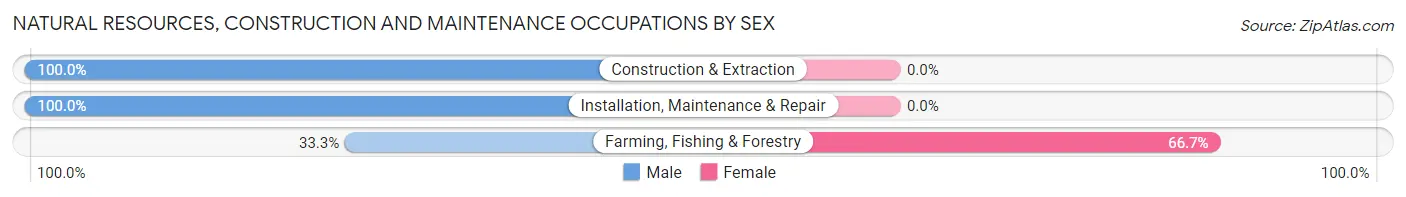
| Occupation | Male | Female |
| Farming, Fishing & Forestry | 1 (33.3%) | 2 (66.7%) |
| Construction & Extraction | 51 (100.0%) | 0 (0.0%) |
| Installation, Maintenance & Repair | 17 (100.0%) | 0 (0.0%) |
| Total (Category) | 69 (97.2%) | 2 (2.8%) |
| Total (Overall) | 258 (54.1%) | 219 (45.9%) |
Production, Transportation and Moving Occupations
The most common Production, Transportation and Moving occupations in Princeton are Production (43 | 9.0%), Material Moving (18 | 3.8%), and Transportation (16 | 3.4%).
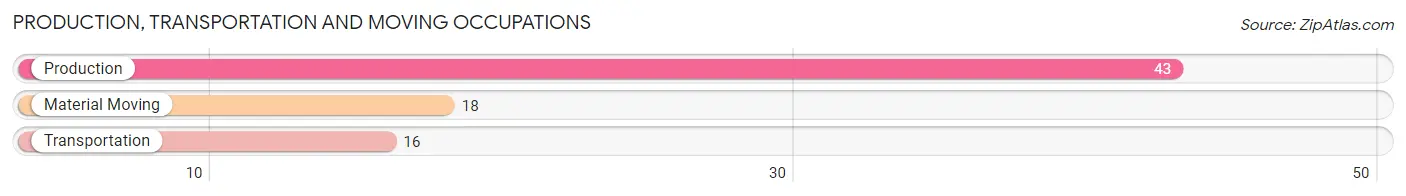
Production, Transportation and Moving Occupations by Sex
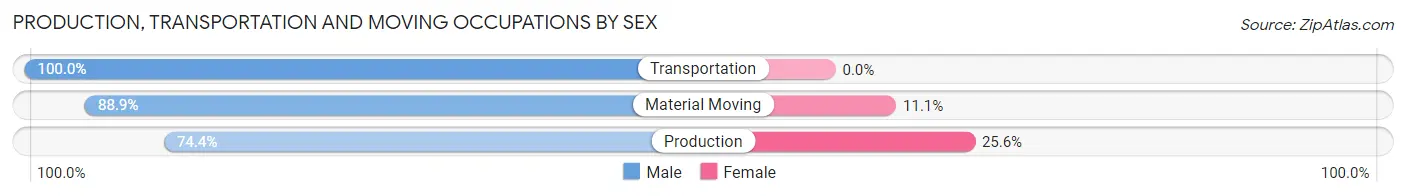
| Occupation | Male | Female |
| Production | 32 (74.4%) | 11 (25.6%) |
| Transportation | 16 (100.0%) | 0 (0.0%) |
| Material Moving | 16 (88.9%) | 2 (11.1%) |
| Total (Category) | 64 (83.1%) | 13 (16.9%) |
| Total (Overall) | 258 (54.1%) | 219 (45.9%) |
Employment Industries by Sex in Princeton
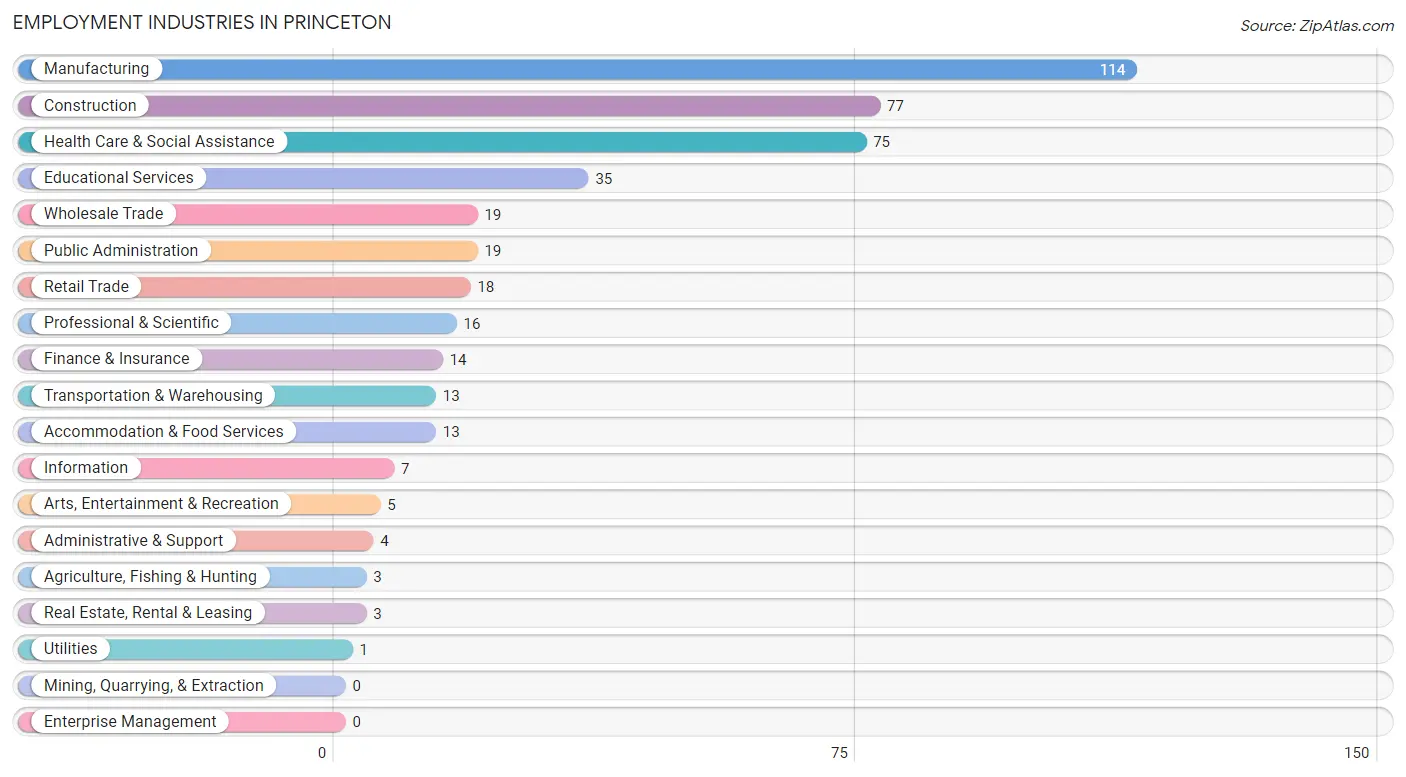
Employment Industries in Princeton
The major employment industries in Princeton include Manufacturing (114 | 23.9%), Construction (77 | 16.1%), Health Care & Social Assistance (75 | 15.7%), Educational Services (35 | 7.3%), and Wholesale Trade (19 | 4.0%).
Employment Industries by Sex in Princeton
The Princeton industries that see more men than women are Real Estate, Rental & Leasing (100.0%), Transportation & Warehousing (92.3%), and Construction (85.7%), whereas the industries that tend to have a higher number of women are Utilities (100.0%), Information (100.0%), and Arts, Entertainment & Recreation (100.0%).
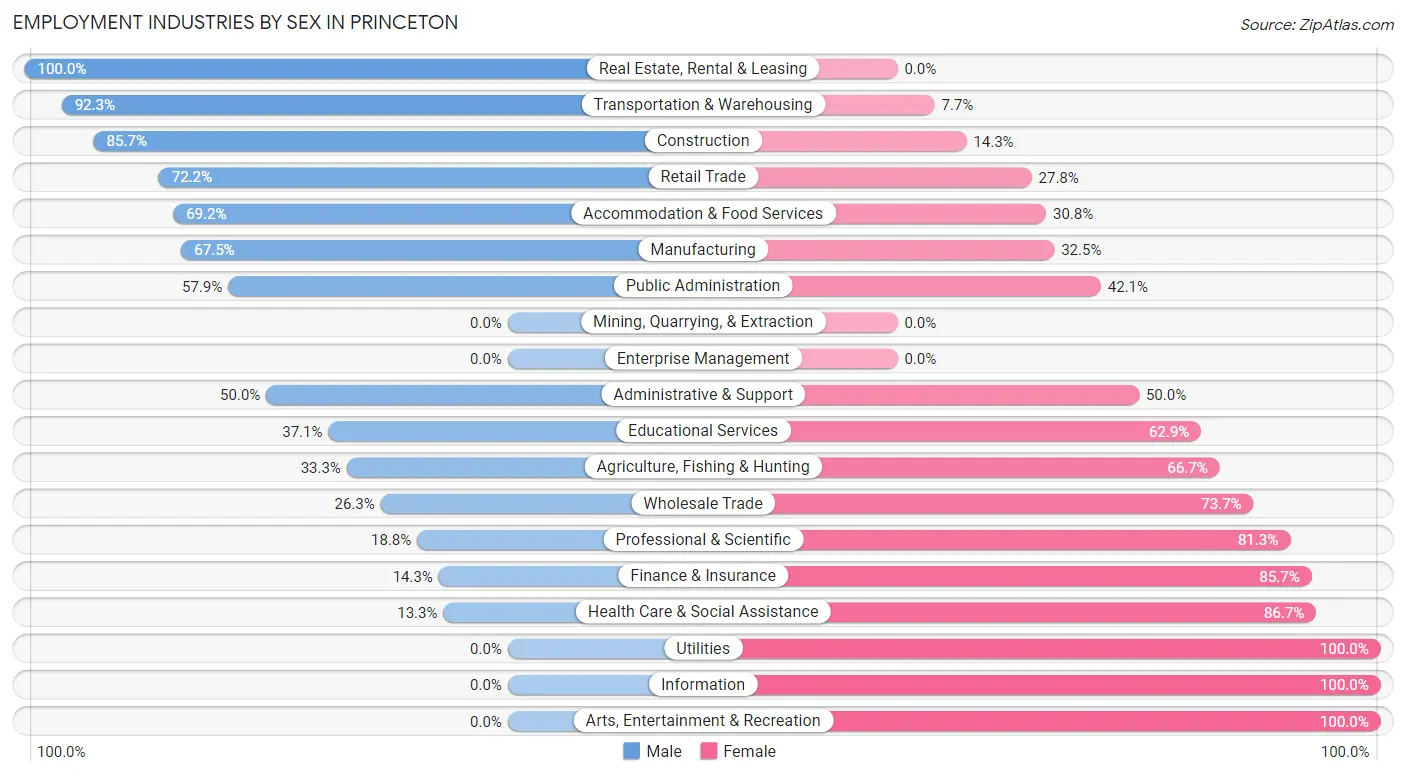
| Industry | Male | Female |
| Agriculture, Fishing & Hunting | 1 (33.3%) | 2 (66.7%) |
| Mining, Quarrying, & Extraction | 0 (0.0%) | 0 (0.0%) |
| Construction | 66 (85.7%) | 11 (14.3%) |
| Manufacturing | 77 (67.5%) | 37 (32.5%) |
| Wholesale Trade | 5 (26.3%) | 14 (73.7%) |
| Retail Trade | 13 (72.2%) | 5 (27.8%) |
| Transportation & Warehousing | 12 (92.3%) | 1 (7.7%) |
| Utilities | 0 (0.0%) | 1 (100.0%) |
| Information | 0 (0.0%) | 7 (100.0%) |
| Finance & Insurance | 2 (14.3%) | 12 (85.7%) |
| Real Estate, Rental & Leasing | 3 (100.0%) | 0 (0.0%) |
| Professional & Scientific | 3 (18.8%) | 13 (81.2%) |
| Enterprise Management | 0 (0.0%) | 0 (0.0%) |
| Administrative & Support | 2 (50.0%) | 2 (50.0%) |
| Educational Services | 13 (37.1%) | 22 (62.9%) |
| Health Care & Social Assistance | 10 (13.3%) | 65 (86.7%) |
| Arts, Entertainment & Recreation | 0 (0.0%) | 5 (100.0%) |
| Accommodation & Food Services | 9 (69.2%) | 4 (30.8%) |
| Public Administration | 11 (57.9%) | 8 (42.1%) |
| Total | 258 (54.1%) | 219 (45.9%) |
Education in Princeton
School Enrollment in Princeton
The most common levels of schooling among the 162 students in Princeton are middle school (42 | 25.9%), elementary school (40 | 24.7%), and high school (37 | 22.8%).
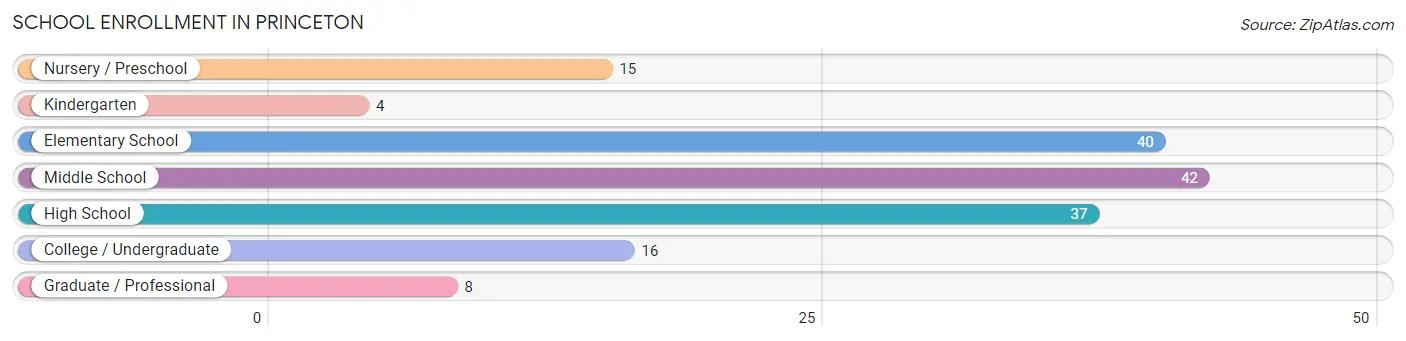
| School Level | # Students | % Students |
| Nursery / Preschool | 15 | 9.3% |
| Kindergarten | 4 | 2.5% |
| Elementary School | 40 | 24.7% |
| Middle School | 42 | 25.9% |
| High School | 37 | 22.8% |
| College / Undergraduate | 16 | 9.9% |
| Graduate / Professional | 8 | 4.9% |
| Total | 162 | 100.0% |
School Enrollment by Age by Funding Source in Princeton
Out of a total of 162 students who are enrolled in schools in Princeton, 5 (3.1%) attend a private institution, while the remaining 157 (96.9%) are enrolled in public schools. The age group of 20 to 24 year olds has the highest likelihood of being enrolled in private schools, with 5 (31.2% in the age bracket) enrolled. Conversely, the age group of 3 to 4 year olds has the lowest likelihood of being enrolled in a private school, with 9 (100.0% in the age bracket) attending a public institution.
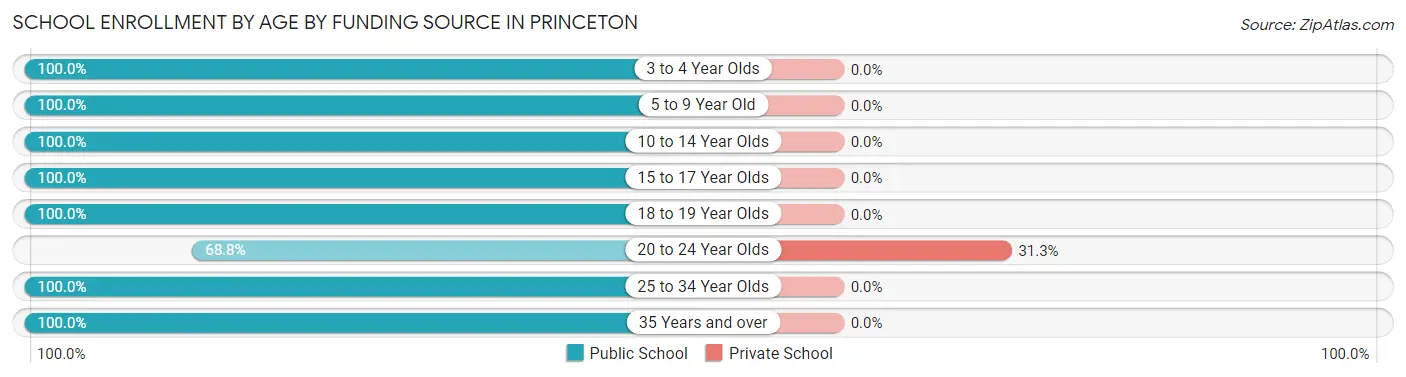
| Age Bracket | Public School | Private School |
| 3 to 4 Year Olds | 9 (100.0%) | 0 (0.0%) |
| 5 to 9 Year Old | 45 (100.0%) | 0 (0.0%) |
| 10 to 14 Year Olds | 49 (100.0%) | 0 (0.0%) |
| 15 to 17 Year Olds | 21 (100.0%) | 0 (0.0%) |
| 18 to 19 Year Olds | 14 (100.0%) | 0 (0.0%) |
| 20 to 24 Year Olds | 11 (68.8%) | 5 (31.2%) |
| 25 to 34 Year Olds | 4 (100.0%) | 0 (0.0%) |
| 35 Years and over | 4 (100.0%) | 0 (0.0%) |
| Total | 157 (96.9%) | 5 (3.1%) |
Educational Attainment by Field of Study in Princeton
Education (46 | 32.2%), science & technology (23 | 16.1%), business (19 | 13.3%), engineering (16 | 11.2%), and bio, nature & agricultural (8 | 5.6%) are the most common fields of study among 143 individuals in Princeton who have obtained a bachelor's degree or higher.
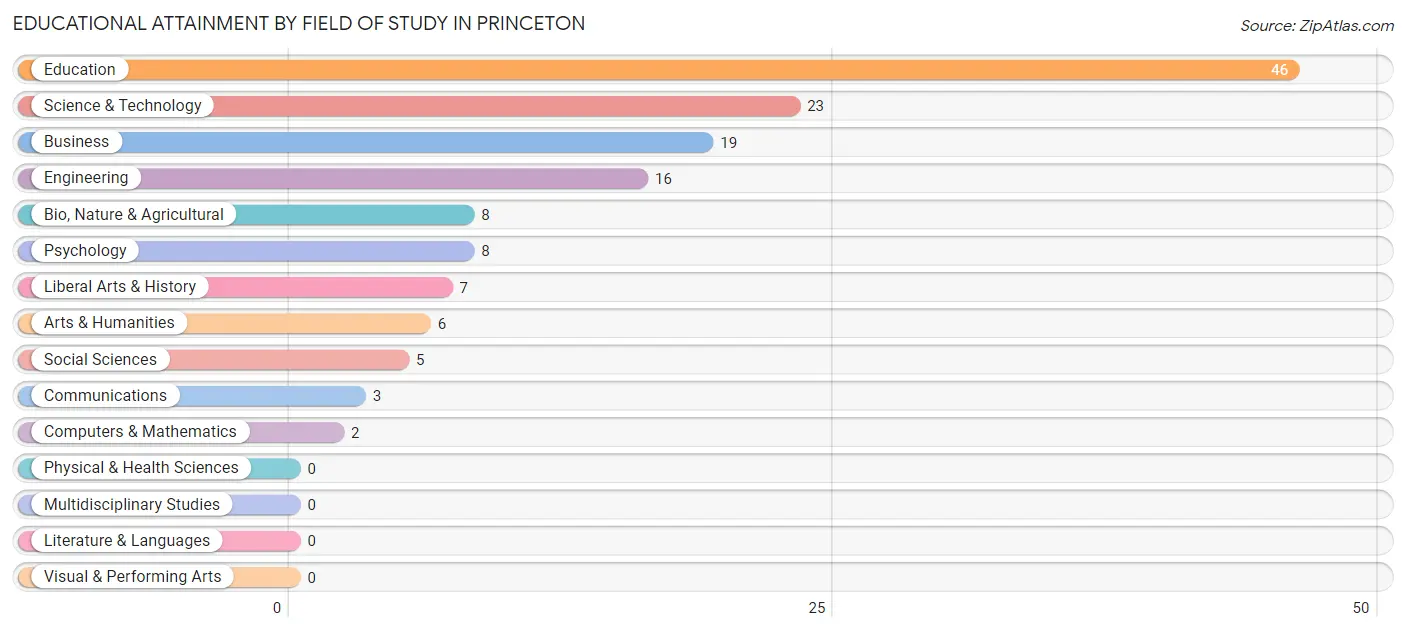
| Field of Study | # Graduates | % Graduates |
| Computers & Mathematics | 2 | 1.4% |
| Bio, Nature & Agricultural | 8 | 5.6% |
| Physical & Health Sciences | 0 | 0.0% |
| Psychology | 8 | 5.6% |
| Social Sciences | 5 | 3.5% |
| Engineering | 16 | 11.2% |
| Multidisciplinary Studies | 0 | 0.0% |
| Science & Technology | 23 | 16.1% |
| Business | 19 | 13.3% |
| Education | 46 | 32.2% |
| Literature & Languages | 0 | 0.0% |
| Liberal Arts & History | 7 | 4.9% |
| Visual & Performing Arts | 0 | 0.0% |
| Communications | 3 | 2.1% |
| Arts & Humanities | 6 | 4.2% |
| Total | 143 | 100.0% |
Transportation & Commute in Princeton
Vehicle Availability by Sex in Princeton
The most prevalent vehicle ownership categories in Princeton are males with 2 vehicles (77, accounting for 32.6%) and females with 2 vehicles (112, making up 36.7%).
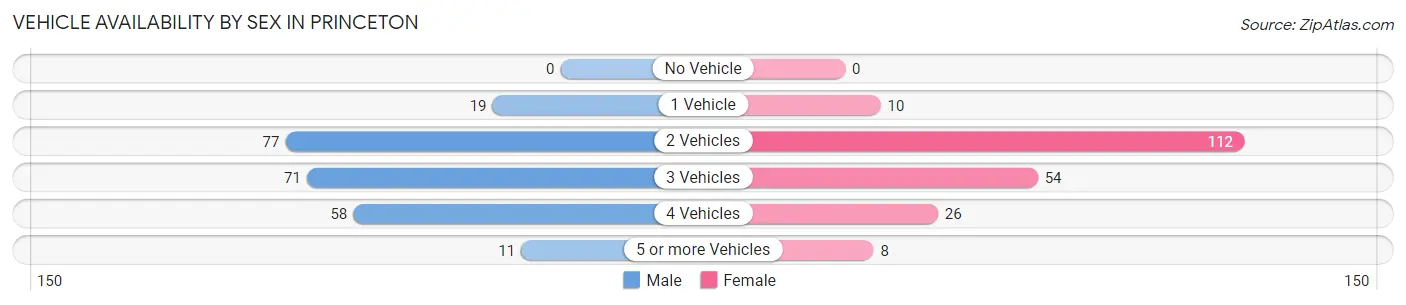
| Vehicles Available | Male | Female |
| No Vehicle | 0 (0.0%) | 0 (0.0%) |
| 1 Vehicle | 19 (8.1%) | 10 (4.8%) |
| 2 Vehicles | 77 (32.6%) | 112 (53.3%) |
| 3 Vehicles | 71 (30.1%) | 54 (25.7%) |
| 4 Vehicles | 58 (24.6%) | 26 (12.4%) |
| 5 or more Vehicles | 11 (4.7%) | 8 (3.8%) |
| Total | 236 (100.0%) | 210 (100.0%) |
Commute Time in Princeton
The most frequently occuring commute durations in Princeton are 25 to 29 minutes (76 commuters, 18.1%), 30 to 34 minutes (76 commuters, 18.1%), and 20 to 24 minutes (47 commuters, 11.2%).
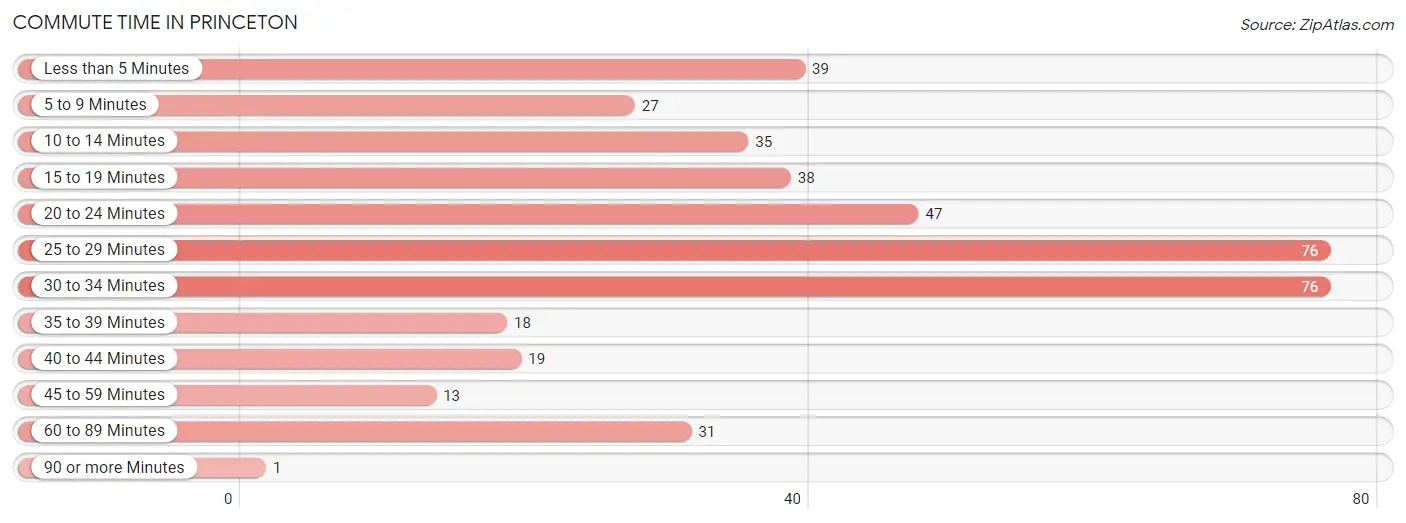
| Commute Time | # Commuters | % Commuters |
| Less than 5 Minutes | 39 | 9.3% |
| 5 to 9 Minutes | 27 | 6.4% |
| 10 to 14 Minutes | 35 | 8.3% |
| 15 to 19 Minutes | 38 | 9.0% |
| 20 to 24 Minutes | 47 | 11.2% |
| 25 to 29 Minutes | 76 | 18.1% |
| 30 to 34 Minutes | 76 | 18.1% |
| 35 to 39 Minutes | 18 | 4.3% |
| 40 to 44 Minutes | 19 | 4.5% |
| 45 to 59 Minutes | 13 | 3.1% |
| 60 to 89 Minutes | 31 | 7.4% |
| 90 or more Minutes | 1 | 0.2% |
Commute Time by Sex in Princeton
The most common commute times in Princeton are 30 to 34 minutes (40 commuters, 17.9%) for males and 25 to 29 minutes (39 commuters, 19.8%) for females.
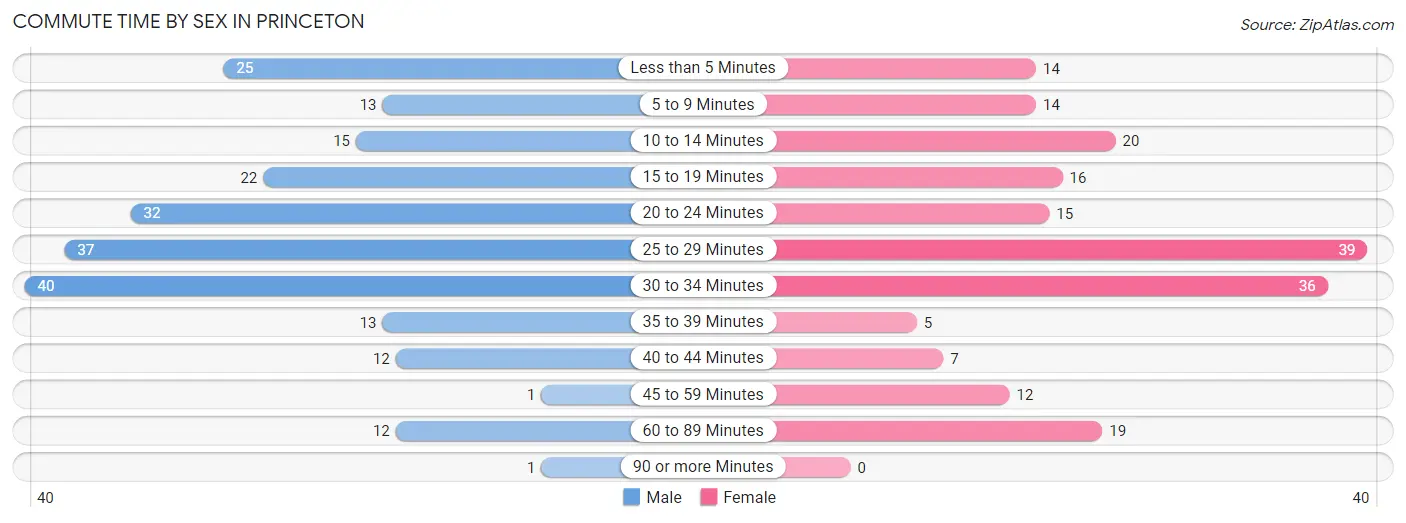
| Commute Time | Male | Female |
| Less than 5 Minutes | 25 (11.2%) | 14 (7.1%) |
| 5 to 9 Minutes | 13 (5.8%) | 14 (7.1%) |
| 10 to 14 Minutes | 15 (6.7%) | 20 (10.2%) |
| 15 to 19 Minutes | 22 (9.9%) | 16 (8.1%) |
| 20 to 24 Minutes | 32 (14.3%) | 15 (7.6%) |
| 25 to 29 Minutes | 37 (16.6%) | 39 (19.8%) |
| 30 to 34 Minutes | 40 (17.9%) | 36 (18.3%) |
| 35 to 39 Minutes | 13 (5.8%) | 5 (2.5%) |
| 40 to 44 Minutes | 12 (5.4%) | 7 (3.5%) |
| 45 to 59 Minutes | 1 (0.4%) | 12 (6.1%) |
| 60 to 89 Minutes | 12 (5.4%) | 19 (9.6%) |
| 90 or more Minutes | 1 (0.4%) | 0 (0.0%) |
Time of Departure to Work by Sex in Princeton
The most frequent times of departure to work in Princeton are 6:30 AM to 6:59 AM (53, 23.8%) for males and 7:00 AM to 7:29 AM (58, 29.4%) for females.
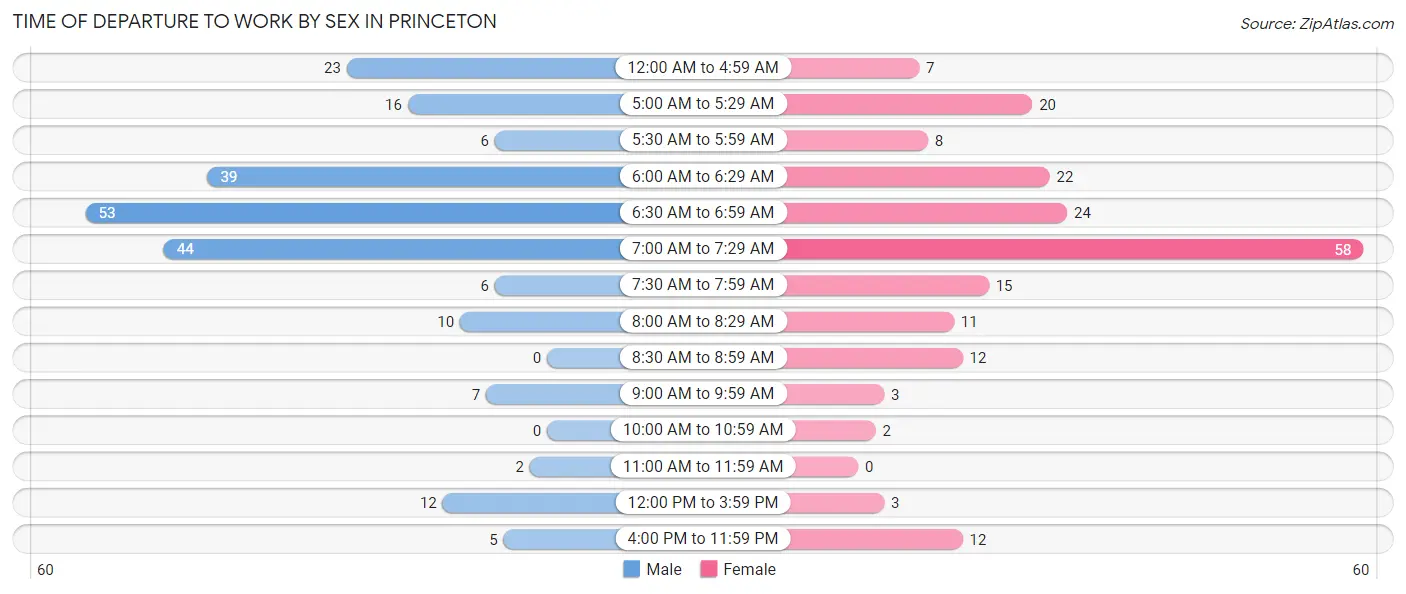
| Time of Departure | Male | Female |
| 12:00 AM to 4:59 AM | 23 (10.3%) | 7 (3.5%) |
| 5:00 AM to 5:29 AM | 16 (7.2%) | 20 (10.2%) |
| 5:30 AM to 5:59 AM | 6 (2.7%) | 8 (4.1%) |
| 6:00 AM to 6:29 AM | 39 (17.5%) | 22 (11.2%) |
| 6:30 AM to 6:59 AM | 53 (23.8%) | 24 (12.2%) |
| 7:00 AM to 7:29 AM | 44 (19.7%) | 58 (29.4%) |
| 7:30 AM to 7:59 AM | 6 (2.7%) | 15 (7.6%) |
| 8:00 AM to 8:29 AM | 10 (4.5%) | 11 (5.6%) |
| 8:30 AM to 8:59 AM | 0 (0.0%) | 12 (6.1%) |
| 9:00 AM to 9:59 AM | 7 (3.1%) | 3 (1.5%) |
| 10:00 AM to 10:59 AM | 0 (0.0%) | 2 (1.0%) |
| 11:00 AM to 11:59 AM | 2 (0.9%) | 0 (0.0%) |
| 12:00 PM to 3:59 PM | 12 (5.4%) | 3 (1.5%) |
| 4:00 PM to 11:59 PM | 5 (2.2%) | 12 (6.1%) |
| Total | 223 (100.0%) | 197 (100.0%) |
Housing Occupancy in Princeton
Occupancy by Ownership in Princeton
Of the total 361 dwellings in Princeton, owner-occupied units account for 297 (82.3%), while renter-occupied units make up 64 (17.7%).
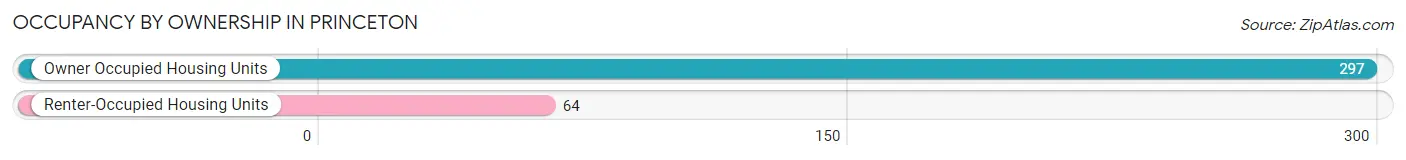
| Occupancy | # Housing Units | % Housing Units |
| Owner Occupied Housing Units | 297 | 82.3% |
| Renter-Occupied Housing Units | 64 | 17.7% |
| Total Occupied Housing Units | 361 | 100.0% |
Occupancy by Household Size in Princeton
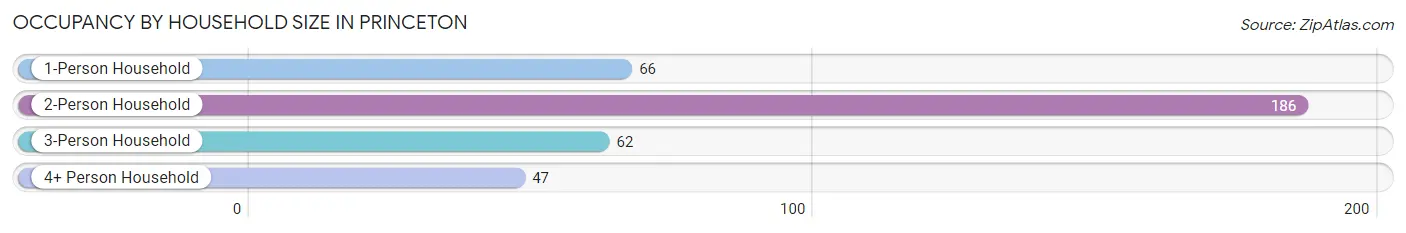
| Household Size | # Housing Units | % Housing Units |
| 1-Person Household | 66 | 18.3% |
| 2-Person Household | 186 | 51.5% |
| 3-Person Household | 62 | 17.2% |
| 4+ Person Household | 47 | 13.0% |
| Total Housing Units | 361 | 100.0% |
Occupancy by Ownership by Household Size in Princeton
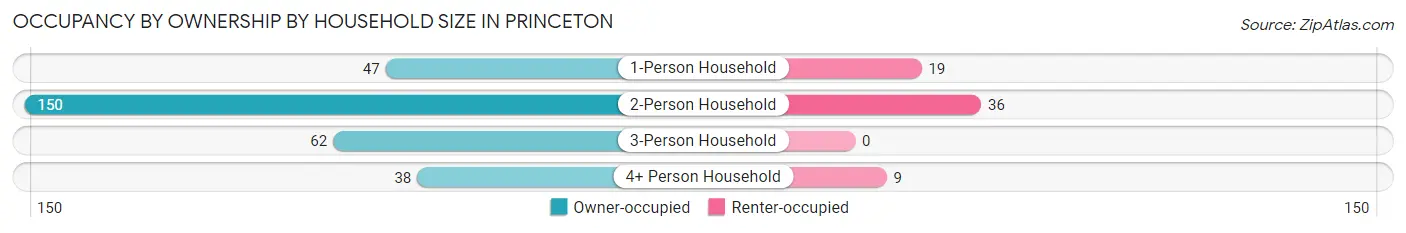
| Household Size | Owner-occupied | Renter-occupied |
| 1-Person Household | 47 (71.2%) | 19 (28.8%) |
| 2-Person Household | 150 (80.6%) | 36 (19.4%) |
| 3-Person Household | 62 (100.0%) | 0 (0.0%) |
| 4+ Person Household | 38 (80.8%) | 9 (19.2%) |
| Total Housing Units | 297 (82.3%) | 64 (17.7%) |
Occupancy by Educational Attainment in Princeton
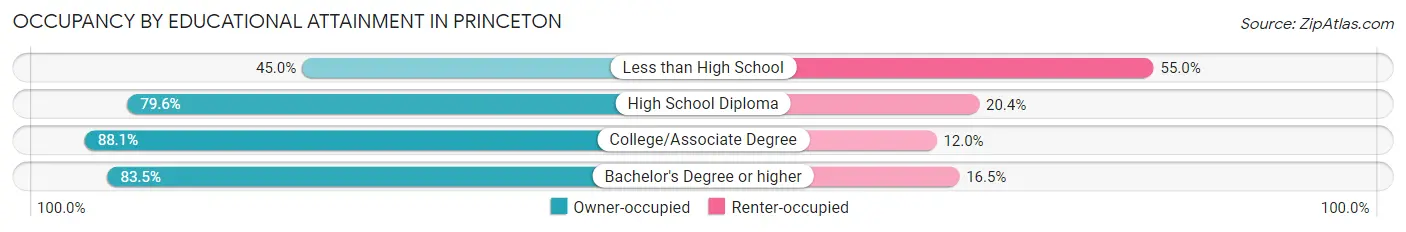
| Household Size | Owner-occupied | Renter-occupied |
| Less than High School | 9 (45.0%) | 11 (55.0%) |
| High School Diploma | 82 (79.6%) | 21 (20.4%) |
| College/Associate Degree | 140 (88.0%) | 19 (11.9%) |
| Bachelor's Degree or higher | 66 (83.5%) | 13 (16.5%) |
Occupancy by Age of Householder in Princeton
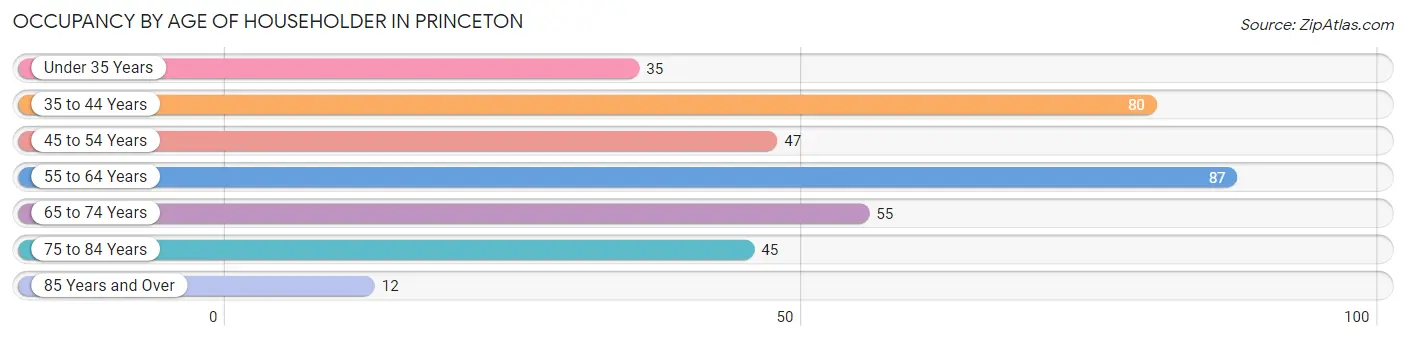
| Age Bracket | # Households | % Households |
| Under 35 Years | 35 | 9.7% |
| 35 to 44 Years | 80 | 22.2% |
| 45 to 54 Years | 47 | 13.0% |
| 55 to 64 Years | 87 | 24.1% |
| 65 to 74 Years | 55 | 15.2% |
| 75 to 84 Years | 45 | 12.5% |
| 85 Years and Over | 12 | 3.3% |
| Total | 361 | 100.0% |
Housing Finances in Princeton
Median Income by Occupancy in Princeton
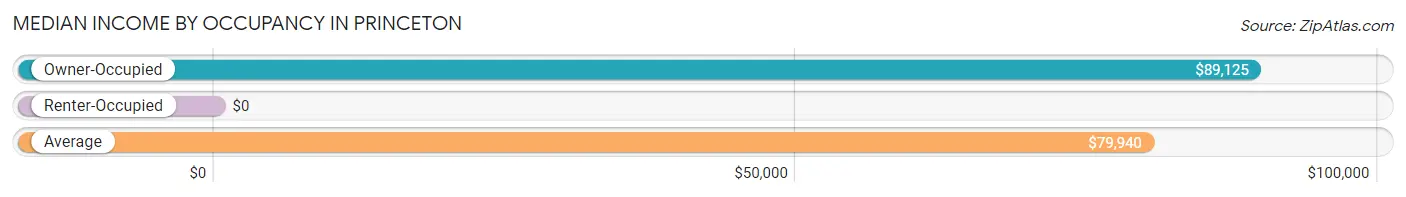
| Occupancy Type | # Households | Median Income |
| Owner-Occupied | 297 (82.3%) | $89,125 |
| Renter-Occupied | 64 (17.7%) | $0 |
| Average | 361 (100.0%) | $79,940 |
Occupancy by Householder Income Bracket in Princeton
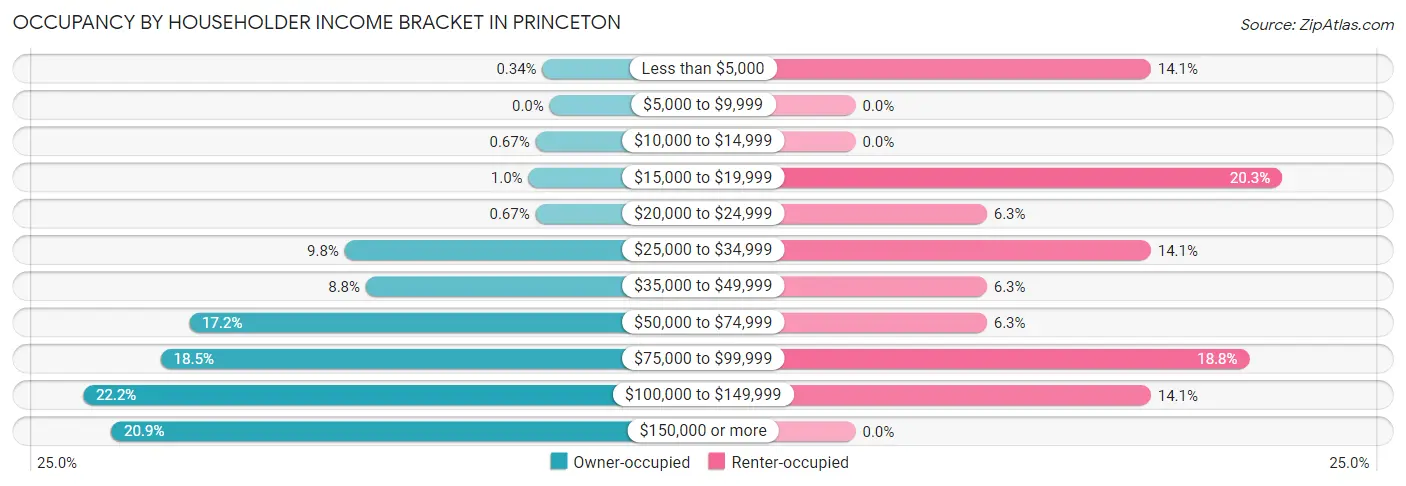
| Income Bracket | Owner-occupied | Renter-occupied |
| Less than $5,000 | 1 (0.3%) | 9 (14.1%) |
| $5,000 to $9,999 | 0 (0.0%) | 0 (0.0%) |
| $10,000 to $14,999 | 2 (0.7%) | 0 (0.0%) |
| $15,000 to $19,999 | 3 (1.0%) | 13 (20.3%) |
| $20,000 to $24,999 | 2 (0.7%) | 4 (6.2%) |
| $25,000 to $34,999 | 29 (9.8%) | 9 (14.1%) |
| $35,000 to $49,999 | 26 (8.7%) | 4 (6.2%) |
| $50,000 to $74,999 | 51 (17.2%) | 4 (6.2%) |
| $75,000 to $99,999 | 55 (18.5%) | 12 (18.8%) |
| $100,000 to $149,999 | 66 (22.2%) | 9 (14.1%) |
| $150,000 or more | 62 (20.9%) | 0 (0.0%) |
| Total | 297 (100.0%) | 64 (100.0%) |
Monthly Housing Cost Tiers in Princeton
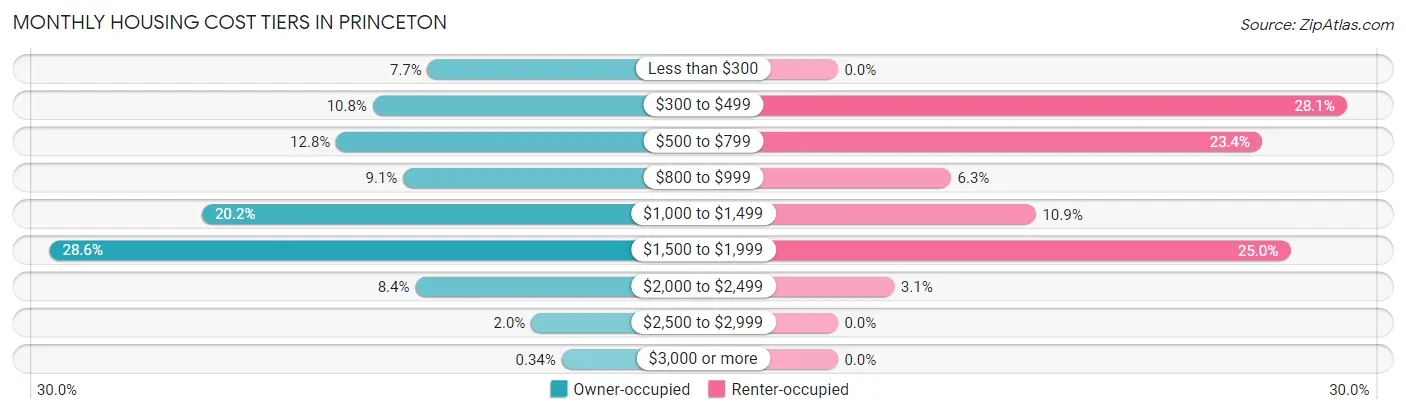
| Monthly Cost | Owner-occupied | Renter-occupied |
| Less than $300 | 23 (7.7%) | 0 (0.0%) |
| $300 to $499 | 32 (10.8%) | 18 (28.1%) |
| $500 to $799 | 38 (12.8%) | 15 (23.4%) |
| $800 to $999 | 27 (9.1%) | 4 (6.2%) |
| $1,000 to $1,499 | 60 (20.2%) | 7 (10.9%) |
| $1,500 to $1,999 | 85 (28.6%) | 16 (25.0%) |
| $2,000 to $2,499 | 25 (8.4%) | 2 (3.1%) |
| $2,500 to $2,999 | 6 (2.0%) | 0 (0.0%) |
| $3,000 or more | 1 (0.3%) | 0 (0.0%) |
| Total | 297 (100.0%) | 64 (100.0%) |
Physical Housing Characteristics in Princeton
Housing Structures in Princeton
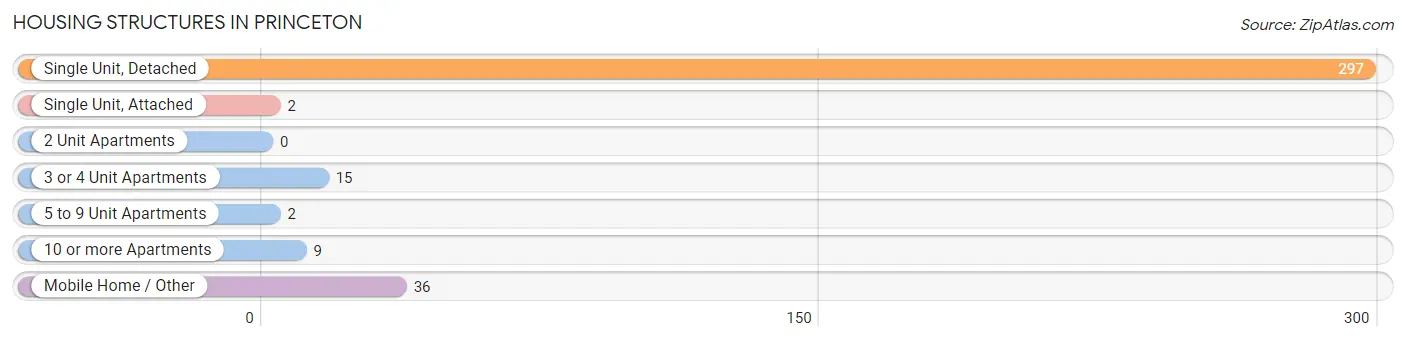
| Structure Type | # Housing Units | % Housing Units |
| Single Unit, Detached | 297 | 82.3% |
| Single Unit, Attached | 2 | 0.5% |
| 2 Unit Apartments | 0 | 0.0% |
| 3 or 4 Unit Apartments | 15 | 4.2% |
| 5 to 9 Unit Apartments | 2 | 0.5% |
| 10 or more Apartments | 9 | 2.5% |
| Mobile Home / Other | 36 | 10.0% |
| Total | 361 | 100.0% |
Housing Structures by Occupancy in Princeton
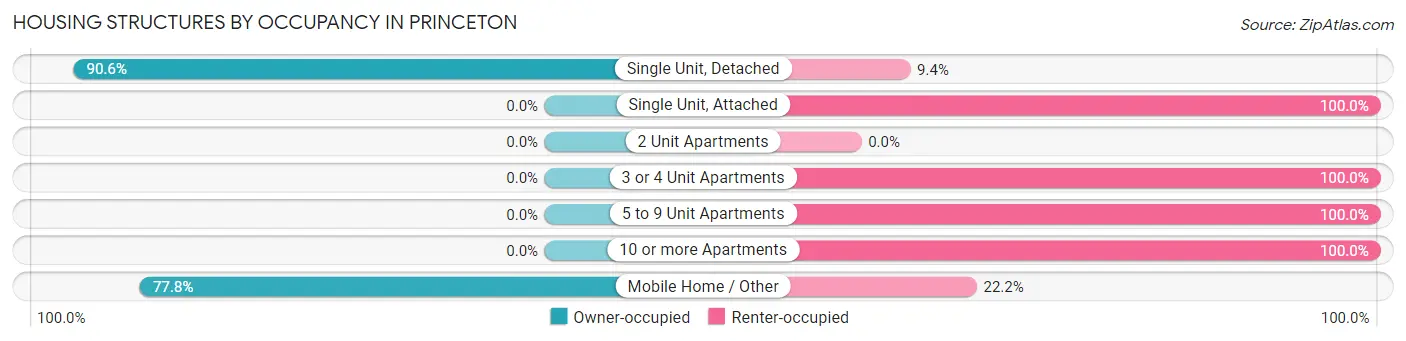
| Structure Type | Owner-occupied | Renter-occupied |
| Single Unit, Detached | 269 (90.6%) | 28 (9.4%) |
| Single Unit, Attached | 0 (0.0%) | 2 (100.0%) |
| 2 Unit Apartments | 0 (0.0%) | 0 (0.0%) |
| 3 or 4 Unit Apartments | 0 (0.0%) | 15 (100.0%) |
| 5 to 9 Unit Apartments | 0 (0.0%) | 2 (100.0%) |
| 10 or more Apartments | 0 (0.0%) | 9 (100.0%) |
| Mobile Home / Other | 28 (77.8%) | 8 (22.2%) |
| Total | 297 (82.3%) | 64 (17.7%) |
Housing Structures by Number of Rooms in Princeton
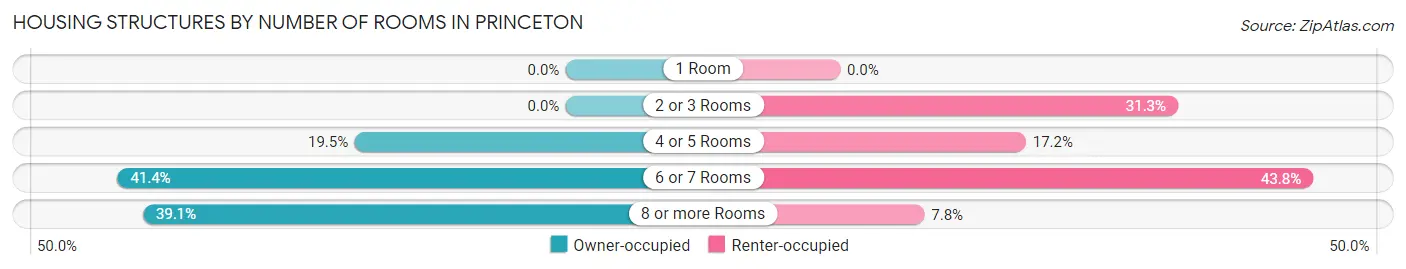
| Number of Rooms | Owner-occupied | Renter-occupied |
| 1 Room | 0 (0.0%) | 0 (0.0%) |
| 2 or 3 Rooms | 0 (0.0%) | 20 (31.2%) |
| 4 or 5 Rooms | 58 (19.5%) | 11 (17.2%) |
| 6 or 7 Rooms | 123 (41.4%) | 28 (43.8%) |
| 8 or more Rooms | 116 (39.1%) | 5 (7.8%) |
| Total | 297 (100.0%) | 64 (100.0%) |
Housing Structure by Heating Type in Princeton
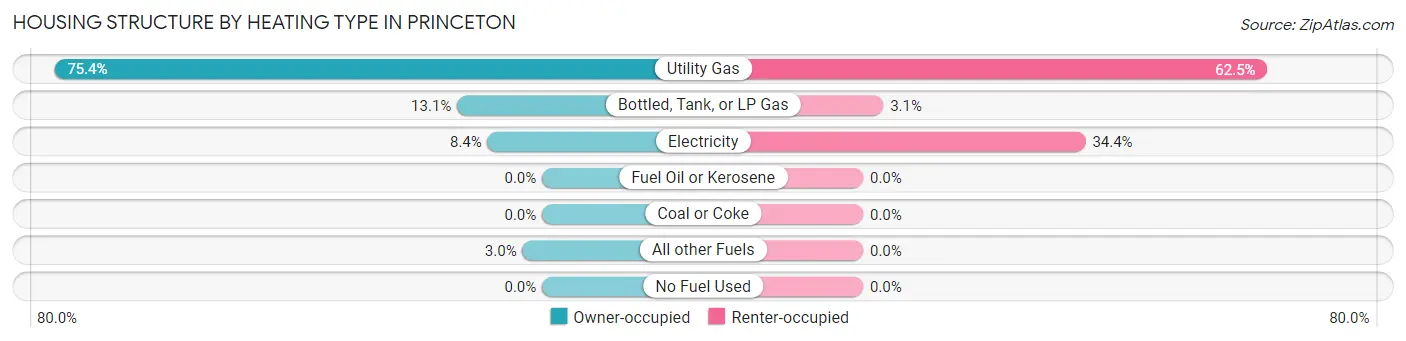
| Heating Type | Owner-occupied | Renter-occupied |
| Utility Gas | 224 (75.4%) | 40 (62.5%) |
| Bottled, Tank, or LP Gas | 39 (13.1%) | 2 (3.1%) |
| Electricity | 25 (8.4%) | 22 (34.4%) |
| Fuel Oil or Kerosene | 0 (0.0%) | 0 (0.0%) |
| Coal or Coke | 0 (0.0%) | 0 (0.0%) |
| All other Fuels | 9 (3.0%) | 0 (0.0%) |
| No Fuel Used | 0 (0.0%) | 0 (0.0%) |
| Total | 297 (100.0%) | 64 (100.0%) |
Household Vehicle Usage in Princeton
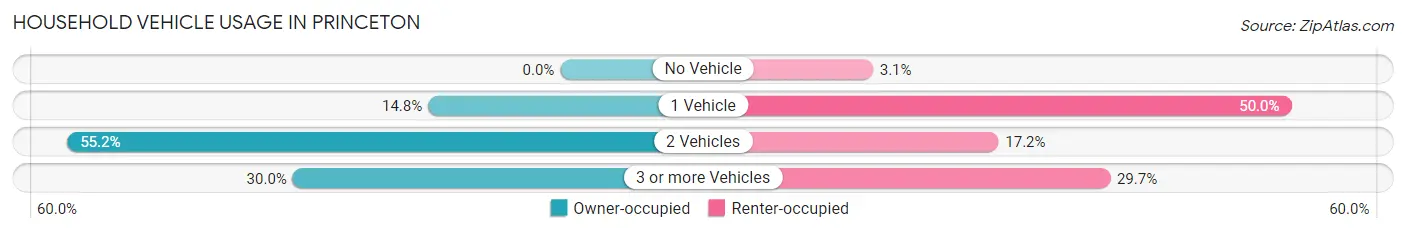
| Vehicles per Household | Owner-occupied | Renter-occupied |
| No Vehicle | 0 (0.0%) | 2 (3.1%) |
| 1 Vehicle | 44 (14.8%) | 32 (50.0%) |
| 2 Vehicles | 164 (55.2%) | 11 (17.2%) |
| 3 or more Vehicles | 89 (30.0%) | 19 (29.7%) |
| Total | 297 (100.0%) | 64 (100.0%) |
Real Estate & Mortgages in Princeton
Real Estate and Mortgage Overview in Princeton
| Characteristic | Without Mortgage | With Mortgage |
| Housing Units | 101 | 196 |
| Median Property Value | $171,900 | $236,300 |
| Median Household Income | $67,188 | $43 |
| Monthly Housing Costs | $523 | $1 |
| Real Estate Taxes | $2,139 | $12 |
Property Value by Mortgage Status in Princeton
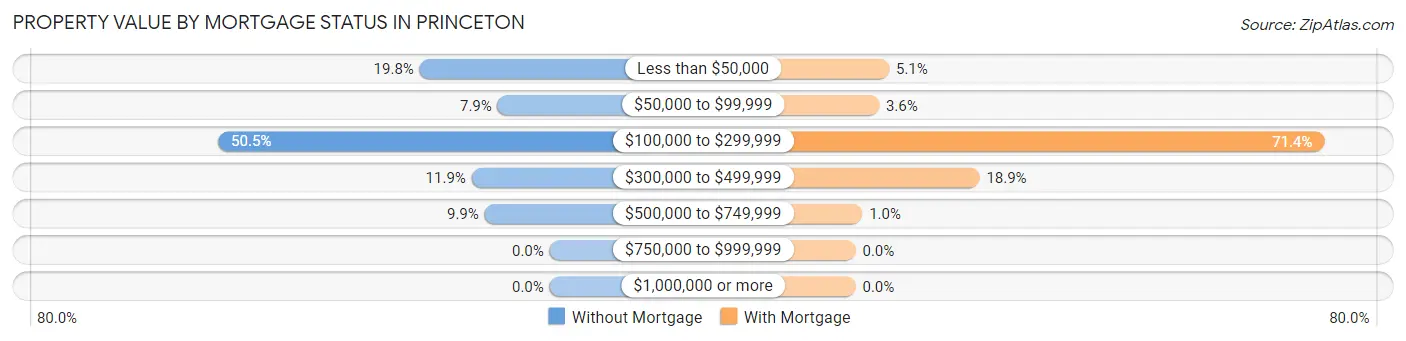
| Property Value | Without Mortgage | With Mortgage |
| Less than $50,000 | 20 (19.8%) | 10 (5.1%) |
| $50,000 to $99,999 | 8 (7.9%) | 7 (3.6%) |
| $100,000 to $299,999 | 51 (50.5%) | 140 (71.4%) |
| $300,000 to $499,999 | 12 (11.9%) | 37 (18.9%) |
| $500,000 to $749,999 | 10 (9.9%) | 2 (1.0%) |
| $750,000 to $999,999 | 0 (0.0%) | 0 (0.0%) |
| $1,000,000 or more | 0 (0.0%) | 0 (0.0%) |
| Total | 101 (100.0%) | 196 (100.0%) |
Household Income by Mortgage Status in Princeton
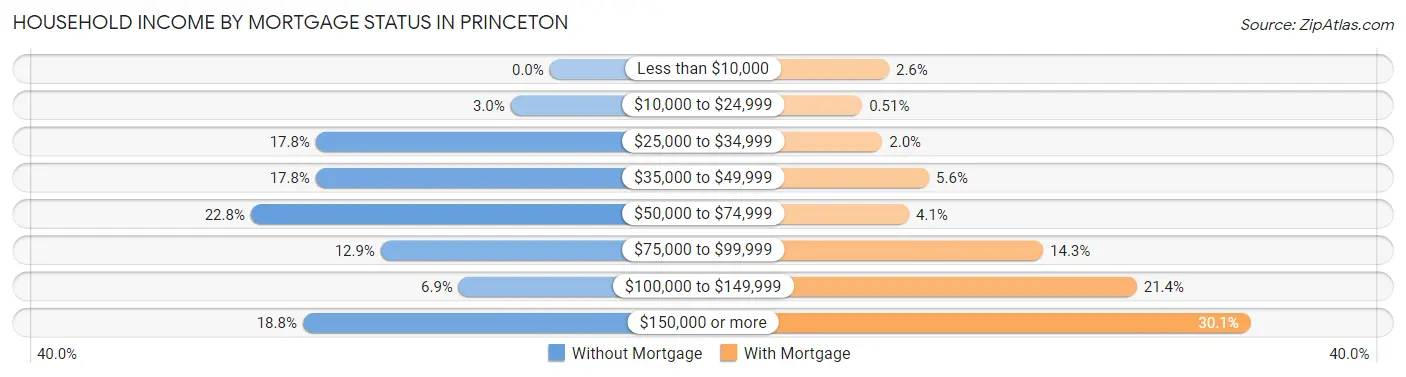
| Household Income | Without Mortgage | With Mortgage |
| Less than $10,000 | 0 (0.0%) | 5 (2.5%) |
| $10,000 to $24,999 | 3 (3.0%) | 1 (0.5%) |
| $25,000 to $34,999 | 18 (17.8%) | 4 (2.0%) |
| $35,000 to $49,999 | 18 (17.8%) | 11 (5.6%) |
| $50,000 to $74,999 | 23 (22.8%) | 8 (4.1%) |
| $75,000 to $99,999 | 13 (12.9%) | 28 (14.3%) |
| $100,000 to $149,999 | 7 (6.9%) | 42 (21.4%) |
| $150,000 or more | 19 (18.8%) | 59 (30.1%) |
| Total | 101 (100.0%) | 196 (100.0%) |
Property Value to Household Income Ratio in Princeton
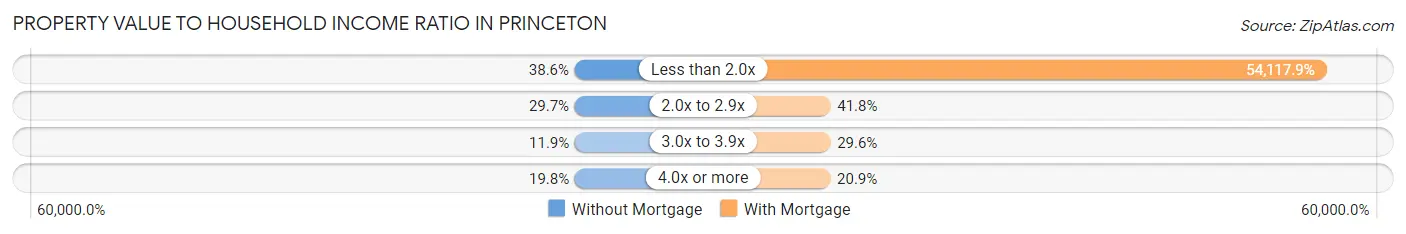
| Value-to-Income Ratio | Without Mortgage | With Mortgage |
| Less than 2.0x | 39 (38.6%) | 106,071 (54,117.9%) |
| 2.0x to 2.9x | 30 (29.7%) | 82 (41.8%) |
| 3.0x to 3.9x | 12 (11.9%) | 58 (29.6%) |
| 4.0x or more | 20 (19.8%) | 41 (20.9%) |
| Total | 101 (100.0%) | 196 (100.0%) |
Real Estate Taxes by Mortgage Status in Princeton
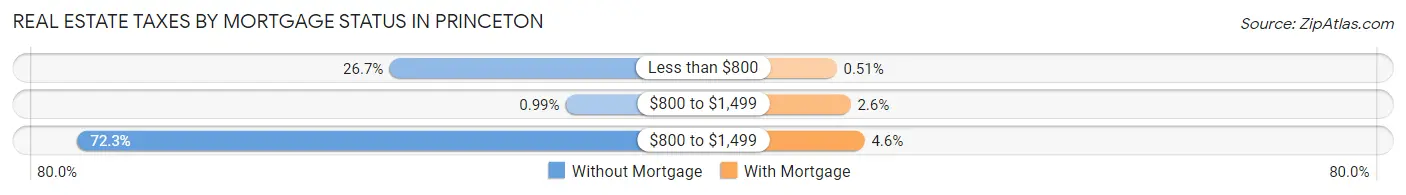
| Property Taxes | Without Mortgage | With Mortgage |
| Less than $800 | 27 (26.7%) | 1 (0.5%) |
| $800 to $1,499 | 1 (1.0%) | 5 (2.5%) |
| $800 to $1,499 | 73 (72.3%) | 9 (4.6%) |
| Total | 101 (100.0%) | 196 (100.0%) |
Health & Disability in Princeton
Health Insurance Coverage by Age in Princeton
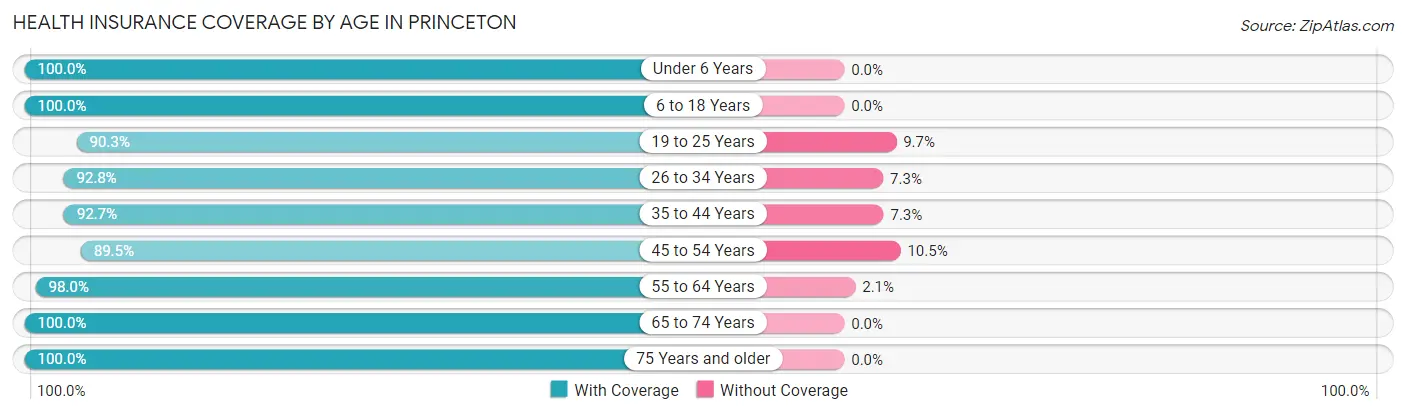
| Age Bracket | With Coverage | Without Coverage |
| Under 6 Years | 57 (100.0%) | 0 (0.0%) |
| 6 to 18 Years | 119 (100.0%) | 0 (0.0%) |
| 19 to 25 Years | 56 (90.3%) | 6 (9.7%) |
| 26 to 34 Years | 64 (92.7%) | 5 (7.2%) |
| 35 to 44 Years | 114 (92.7%) | 9 (7.3%) |
| 45 to 54 Years | 111 (89.5%) | 13 (10.5%) |
| 55 to 64 Years | 143 (98.0%) | 3 (2.1%) |
| 65 to 74 Years | 87 (100.0%) | 0 (0.0%) |
| 75 Years and older | 95 (100.0%) | 0 (0.0%) |
| Total | 846 (95.9%) | 36 (4.1%) |
Health Insurance Coverage by Citizenship Status in Princeton
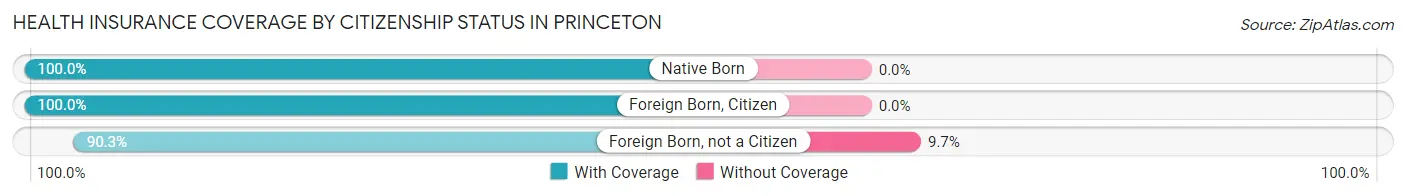
| Citizenship Status | With Coverage | Without Coverage |
| Native Born | 57 (100.0%) | 0 (0.0%) |
| Foreign Born, Citizen | 119 (100.0%) | 0 (0.0%) |
| Foreign Born, not a Citizen | 56 (90.3%) | 6 (9.7%) |
Health Insurance Coverage by Household Income in Princeton
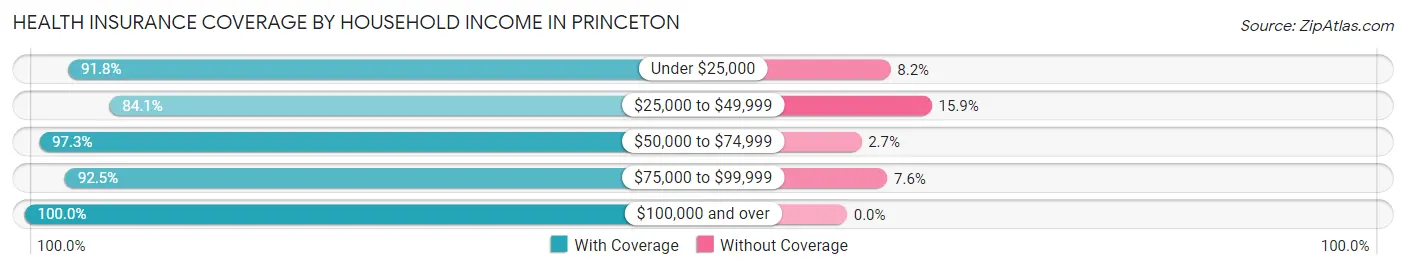
| Household Income | With Coverage | Without Coverage |
| Under $25,000 | 45 (91.8%) | 4 (8.2%) |
| $25,000 to $49,999 | 90 (84.1%) | 17 (15.9%) |
| $50,000 to $74,999 | 108 (97.3%) | 3 (2.7%) |
| $75,000 to $99,999 | 147 (92.4%) | 12 (7.5%) |
| $100,000 and over | 456 (100.0%) | 0 (0.0%) |
Public vs Private Health Insurance Coverage by Age in Princeton
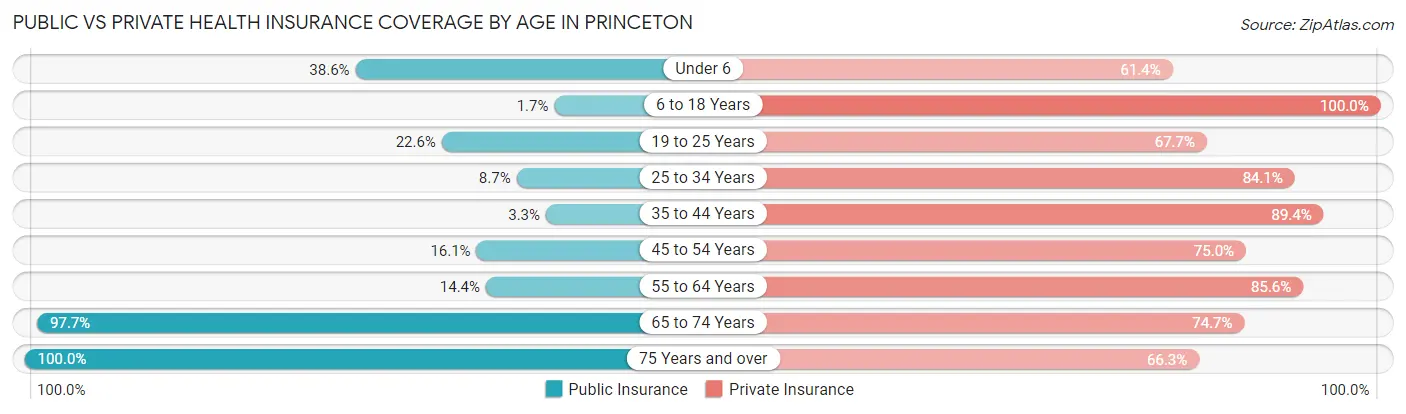
| Age Bracket | Public Insurance | Private Insurance |
| Under 6 | 22 (38.6%) | 35 (61.4%) |
| 6 to 18 Years | 2 (1.7%) | 119 (100.0%) |
| 19 to 25 Years | 14 (22.6%) | 42 (67.7%) |
| 25 to 34 Years | 6 (8.7%) | 58 (84.1%) |
| 35 to 44 Years | 4 (3.3%) | 110 (89.4%) |
| 45 to 54 Years | 20 (16.1%) | 93 (75.0%) |
| 55 to 64 Years | 21 (14.4%) | 125 (85.6%) |
| 65 to 74 Years | 85 (97.7%) | 65 (74.7%) |
| 75 Years and over | 95 (100.0%) | 63 (66.3%) |
| Total | 269 (30.5%) | 710 (80.5%) |
Disability Status by Sex by Age in Princeton
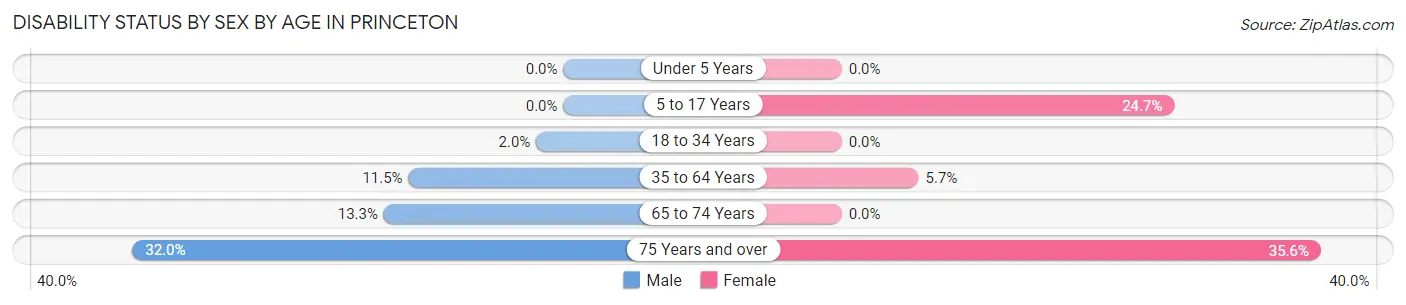
| Age Bracket | Male | Female |
| Under 5 Years | 0 (0.0%) | 0 (0.0%) |
| 5 to 17 Years | 0 (0.0%) | 19 (24.7%) |
| 18 to 34 Years | 2 (2.0%) | 0 (0.0%) |
| 35 to 64 Years | 23 (11.5%) | 11 (5.7%) |
| 65 to 74 Years | 6 (13.3%) | 0 (0.0%) |
| 75 Years and over | 16 (32.0%) | 16 (35.6%) |
Disability Class by Sex by Age in Princeton
Disability Class: Hearing Difficulty
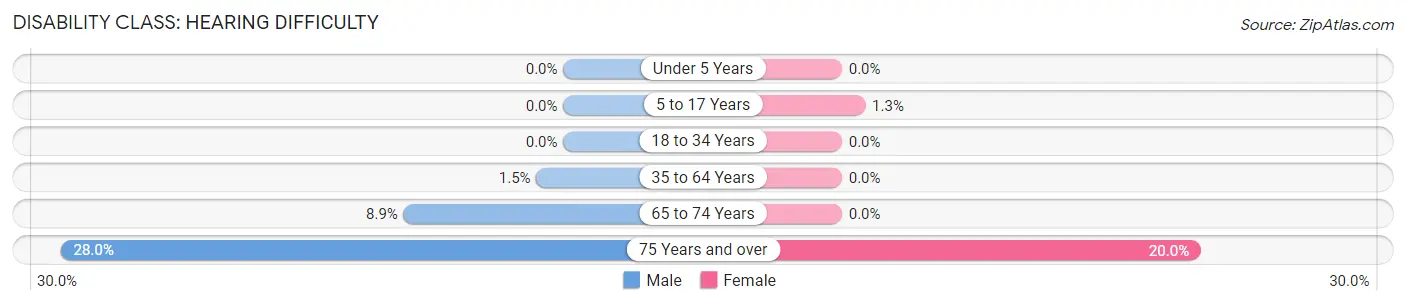
| Age Bracket | Male | Female |
| Under 5 Years | 0 (0.0%) | 0 (0.0%) |
| 5 to 17 Years | 0 (0.0%) | 1 (1.3%) |
| 18 to 34 Years | 0 (0.0%) | 0 (0.0%) |
| 35 to 64 Years | 3 (1.5%) | 0 (0.0%) |
| 65 to 74 Years | 4 (8.9%) | 0 (0.0%) |
| 75 Years and over | 14 (28.0%) | 9 (20.0%) |
Disability Class: Vision Difficulty
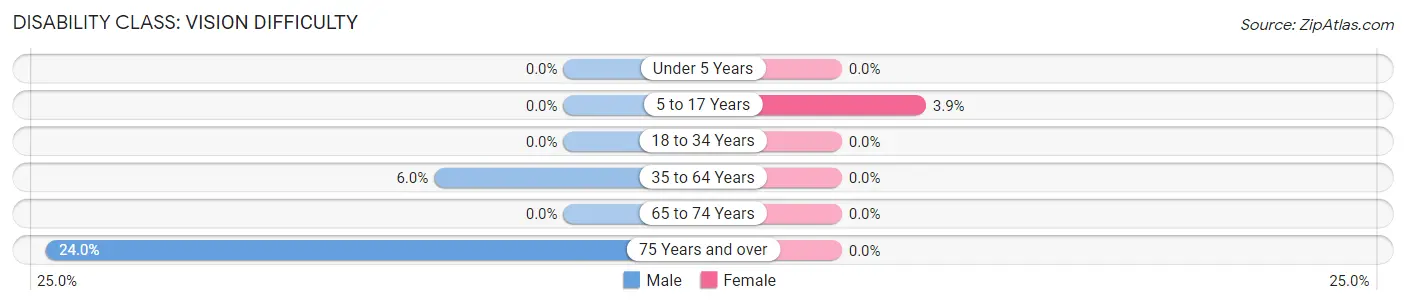
| Age Bracket | Male | Female |
| Under 5 Years | 0 (0.0%) | 0 (0.0%) |
| 5 to 17 Years | 0 (0.0%) | 3 (3.9%) |
| 18 to 34 Years | 0 (0.0%) | 0 (0.0%) |
| 35 to 64 Years | 12 (6.0%) | 0 (0.0%) |
| 65 to 74 Years | 0 (0.0%) | 0 (0.0%) |
| 75 Years and over | 12 (24.0%) | 0 (0.0%) |
Disability Class: Cognitive Difficulty
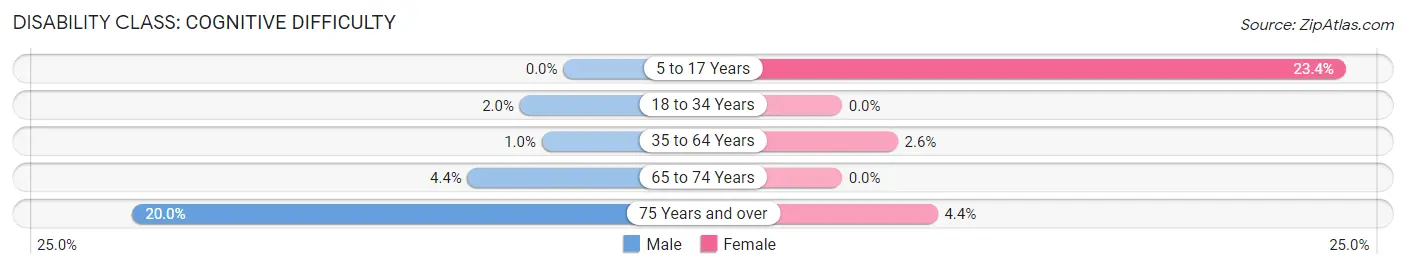
| Age Bracket | Male | Female |
| 5 to 17 Years | 0 (0.0%) | 18 (23.4%) |
| 18 to 34 Years | 2 (2.0%) | 0 (0.0%) |
| 35 to 64 Years | 2 (1.0%) | 5 (2.6%) |
| 65 to 74 Years | 2 (4.4%) | 0 (0.0%) |
| 75 Years and over | 10 (20.0%) | 2 (4.4%) |
Disability Class: Ambulatory Difficulty
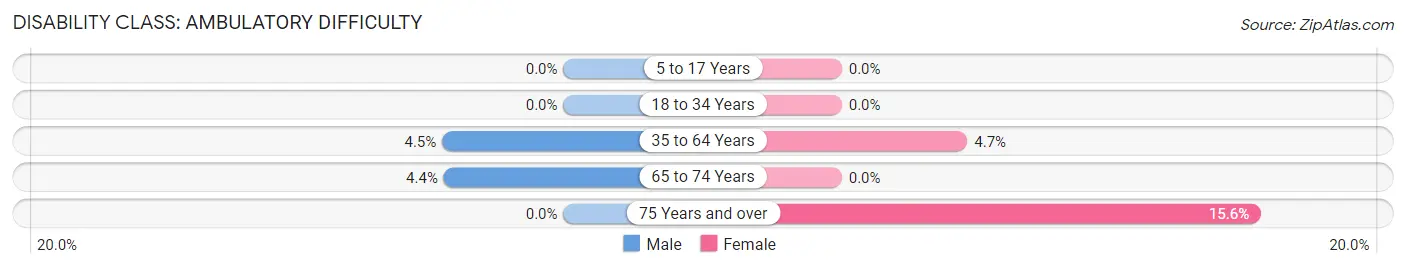
| Age Bracket | Male | Female |
| 5 to 17 Years | 0 (0.0%) | 0 (0.0%) |
| 18 to 34 Years | 0 (0.0%) | 0 (0.0%) |
| 35 to 64 Years | 9 (4.5%) | 9 (4.7%) |
| 65 to 74 Years | 2 (4.4%) | 0 (0.0%) |
| 75 Years and over | 0 (0.0%) | 7 (15.6%) |
Disability Class: Self-Care Difficulty
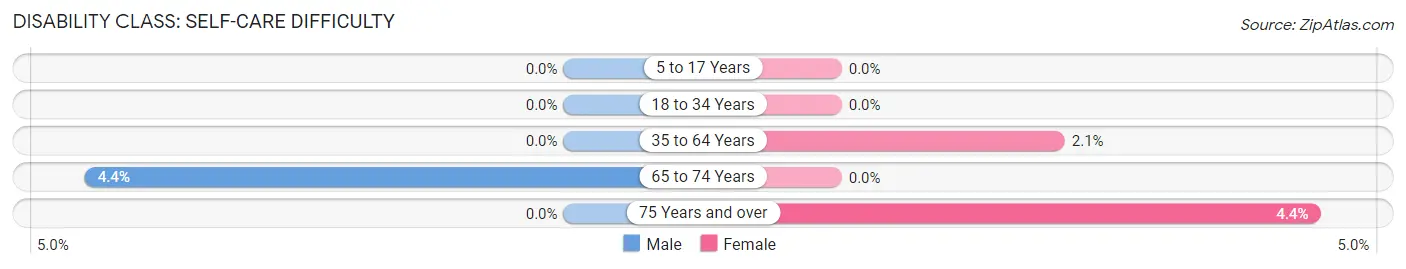
| Age Bracket | Male | Female |
| 5 to 17 Years | 0 (0.0%) | 0 (0.0%) |
| 18 to 34 Years | 0 (0.0%) | 0 (0.0%) |
| 35 to 64 Years | 0 (0.0%) | 4 (2.1%) |
| 65 to 74 Years | 2 (4.4%) | 0 (0.0%) |
| 75 Years and over | 0 (0.0%) | 2 (4.4%) |
Technology Access in Princeton
Computing Device Access in Princeton
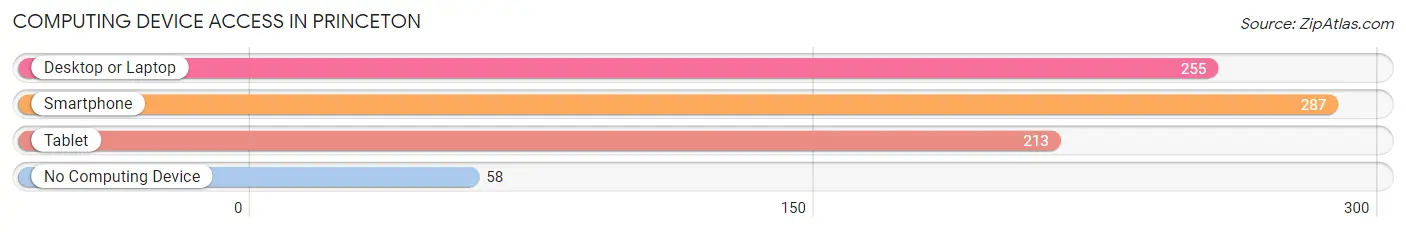
| Device Type | # Households | % Households |
| Desktop or Laptop | 255 | 70.6% |
| Smartphone | 287 | 79.5% |
| Tablet | 213 | 59.0% |
| No Computing Device | 58 | 16.1% |
| Total | 361 | 100.0% |
Internet Access in Princeton
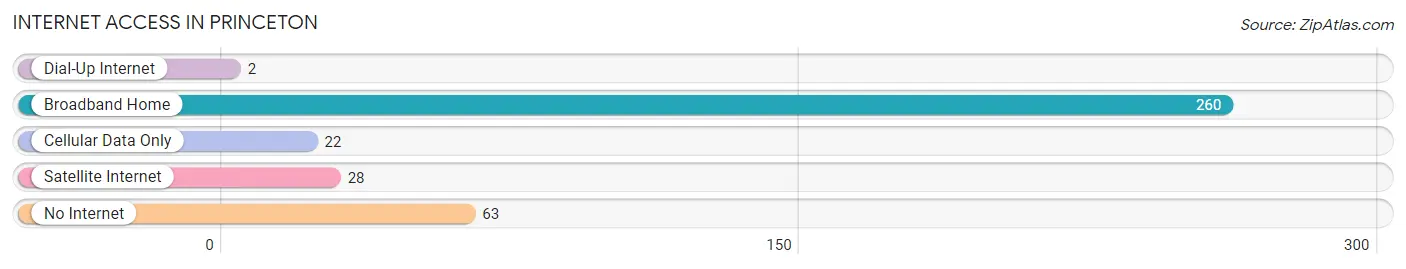
| Internet Type | # Households | % Households |
| Dial-Up Internet | 2 | 0.5% |
| Broadband Home | 260 | 72.0% |
| Cellular Data Only | 22 | 6.1% |
| Satellite Internet | 28 | 7.8% |
| No Internet | 63 | 17.4% |
| Total | 361 | 100.0% |
Princeton Summary
Princeton, Iowa is a small city located in Scott County, Iowa. It is situated on the banks of the Mississippi River, just south of Davenport. The city has a population of approximately 1,500 people and is part of the Quad Cities metropolitan area.
History
The area that is now Princeton was first settled in 1837 by a group of settlers from New York. The settlement was originally called “New York Settlement”, but was later changed to Princeton in 1841. The name was chosen in honor of Princeton University in New Jersey.
The city was incorporated in 1853 and was an important port city on the Mississippi River. It was a major hub for the lumber industry and was home to several sawmills. The city also had a thriving brick-making industry.
In the late 19th century, the city was a popular destination for tourists. It was known for its beautiful scenery and its many resorts.
Geography
Princeton is located in the northwest corner of Scott County, Iowa. It is situated on the banks of the Mississippi River, just south of Davenport. The city has a total area of 1.2 square miles, all of which is land.
The city is located in a hilly area and is surrounded by rolling hills and wooded areas. The city is also located near several lakes, including Lake George, Lake O’Brien, and Lake Wapsipinicon.
Economy
The economy of Princeton is largely based on agriculture and manufacturing. The city is home to several large farms, as well as several small businesses. The city is also home to several manufacturing companies, including a paper mill and a furniture factory.
The city is also home to several retail stores, restaurants, and other businesses. The city is also home to several banks and other financial institutions.
Demographics
As of the 2010 census, the population of Princeton was 1,500 people. The racial makeup of the city was 97.3% White, 0.7% African American, 0.3% Native American, 0.3% Asian, 0.3% from other races, and 1.3% from two or more races. Hispanic or Latino of any race were 1.3% of the population.
The median income for a household in the city was $41,250, and the median income for a family was $50,000. The per capita income for the city was $20,845. About 8.3% of families and 10.3% of the population were below the poverty line, including 14.3% of those under age 18 and 6.7% of those age 65 or over.
Princeton is a small city with a rich history and a diverse economy. It is home to several farms, manufacturing companies, and other businesses. The city is also home to several banks and other financial institutions. The city has a population of approximately 1,500 people and is part of the Quad Cities metropolitan area.
Common Questions
What is Per Capita Income in Princeton?
Per Capita income in Princeton is $39,129.
What is the Median Family Income in Princeton?
Median Family Income in Princeton is $81,875.
What is the Median Household income in Princeton?
Median Household Income in Princeton is $79,940.
What is Income or Wage Gap in Princeton?
Income or Wage Gap in Princeton is 24.4%.
Women in Princeton earn 75.6 cents for every dollar earned by a man.
What is Inequality or Gini Index in Princeton?
Inequality or Gini Index in Princeton is 0.37.
What is the Total Population of Princeton?
Total Population of Princeton is 882.
What is the Total Male Population of Princeton?
Total Male Population of Princeton is 458.
What is the Total Female Population of Princeton?
Total Female Population of Princeton is 424.
What is the Ratio of Males per 100 Females in Princeton?
There are 108.02 Males per 100 Females in Princeton.
What is the Ratio of Females per 100 Males in Princeton?
There are 92.58 Females per 100 Males in Princeton.
What is the Median Population Age in Princeton?
Median Population Age in Princeton is 45.5 Years.
What is the Average Family Size in Princeton
Average Family Size in Princeton is 2.8 People.
What is the Average Household Size in Princeton
Average Household Size in Princeton is 2.4 People.
How Large is the Labor Force in Princeton?
There are 506 People in the Labor Forcein in Princeton.
What is the Percentage of People in the Labor Force in Princeton?
68.3% of People are in the Labor Force in Princeton.
What is the Unemployment Rate in Princeton?
Unemployment Rate in Princeton is 5.7%.