Mediapolis, IA Map & Demographics
Mediapolis Map
Mediapolis Overview
$32,539
PER CAPITA INCOME
$90,313
AVG FAMILY INCOME
$71,761
AVG HOUSEHOLD INCOME
53.0%
WAGE / INCOME GAP [ % ]
47.0¢/ $1
WAGE / INCOME GAP [ $ ]
0.40
INEQUALITY / GINI INDEX
2,214
TOTAL POPULATION
1,144
MALE POPULATION
1,070
FEMALE POPULATION
106.92
MALES / 100 FEMALES
93.53
FEMALES / 100 MALES
34.3
MEDIAN AGE
3.1
AVG FAMILY SIZE
2.5
AVG HOUSEHOLD SIZE
1,117
LABOR FORCE [ PEOPLE ]
69.1%
PERCENT IN LABOR FORCE
3.2%
UNEMPLOYMENT RATE
Mediapolis Zip Codes
Mediapolis Area Codes
Income in Mediapolis
Income Overview in Mediapolis
Per Capita Income in Mediapolis is $32,539, while median incomes of families and households are $90,313 and $71,761 respectively.
| Characteristic | Number | Measure |
| Per Capita Income | 2,214 | $32,539 |
| Median Family Income | 573 | $90,313 |
| Mean Family Income | 573 | $106,124 |
| Median Household Income | 857 | $71,761 |
| Mean Household Income | 857 | $86,268 |
| Income Deficit | 573 | $0 |
| Wage / Income Gap (%) | 2,214 | 52.96% |
| Wage / Income Gap ($) | 2,214 | 47.04¢ per $1 |
| Gini / Inequality Index | 2,214 | 0.40 |
Earnings by Sex in Mediapolis
Average Earnings in Mediapolis are $47,537, $60,781 for men and $28,594 for women, a difference of 53.0%.
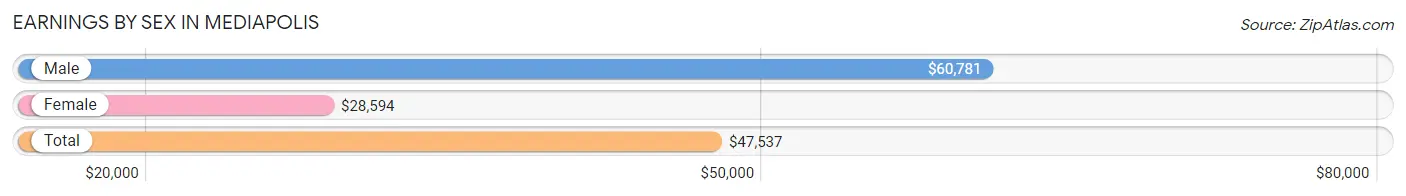
| Sex | Number | Average Earnings |
| Male | 586 (51.7%) | $60,781 |
| Female | 548 (48.3%) | $28,594 |
| Total | 1,134 (100.0%) | $47,537 |
Earnings by Sex by Income Bracket in Mediapolis
The most common earnings brackets in Mediapolis are $75,000 to $99,999 for men (112 | 19.1%) and $2,500 to $4,999 for women (59 | 10.8%).
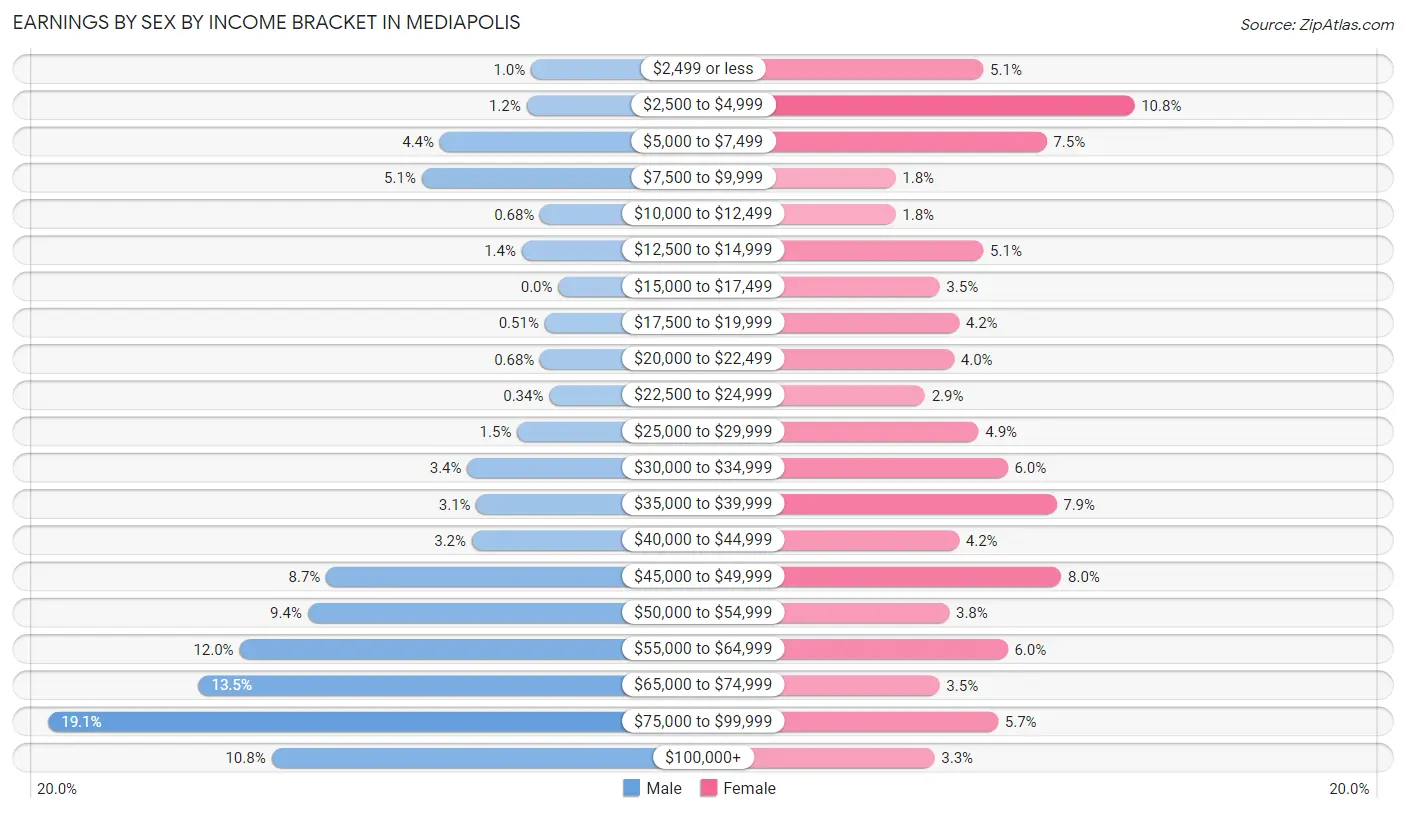
| Income | Male | Female |
| $2,499 or less | 6 (1.0%) | 28 (5.1%) |
| $2,500 to $4,999 | 7 (1.2%) | 59 (10.8%) |
| $5,000 to $7,499 | 26 (4.4%) | 41 (7.5%) |
| $7,500 to $9,999 | 30 (5.1%) | 10 (1.8%) |
| $10,000 to $12,499 | 4 (0.7%) | 10 (1.8%) |
| $12,500 to $14,999 | 8 (1.4%) | 28 (5.1%) |
| $15,000 to $17,499 | 0 (0.0%) | 19 (3.5%) |
| $17,500 to $19,999 | 3 (0.5%) | 23 (4.2%) |
| $20,000 to $22,499 | 4 (0.7%) | 22 (4.0%) |
| $22,500 to $24,999 | 2 (0.3%) | 16 (2.9%) |
| $25,000 to $29,999 | 9 (1.5%) | 27 (4.9%) |
| $30,000 to $34,999 | 20 (3.4%) | 33 (6.0%) |
| $35,000 to $39,999 | 18 (3.1%) | 43 (7.9%) |
| $40,000 to $44,999 | 19 (3.2%) | 23 (4.2%) |
| $45,000 to $49,999 | 51 (8.7%) | 44 (8.0%) |
| $50,000 to $54,999 | 55 (9.4%) | 21 (3.8%) |
| $55,000 to $64,999 | 70 (11.9%) | 33 (6.0%) |
| $65,000 to $74,999 | 79 (13.5%) | 19 (3.5%) |
| $75,000 to $99,999 | 112 (19.1%) | 31 (5.7%) |
| $100,000+ | 63 (10.7%) | 18 (3.3%) |
| Total | 586 (100.0%) | 548 (100.0%) |
Earnings by Sex by Educational Attainment in Mediapolis
Average earnings in Mediapolis are $62,109 for men and $32,167 for women, a difference of 48.2%. Men with an educational attainment of bachelor's degree enjoy the highest average annual earnings of $69,669, while those with high school diploma education earn the least with $48,750. Women with an educational attainment of bachelor's degree earn the most with the average annual earnings of $44,583, while those with less than high school education have the smallest earnings of $20,313.
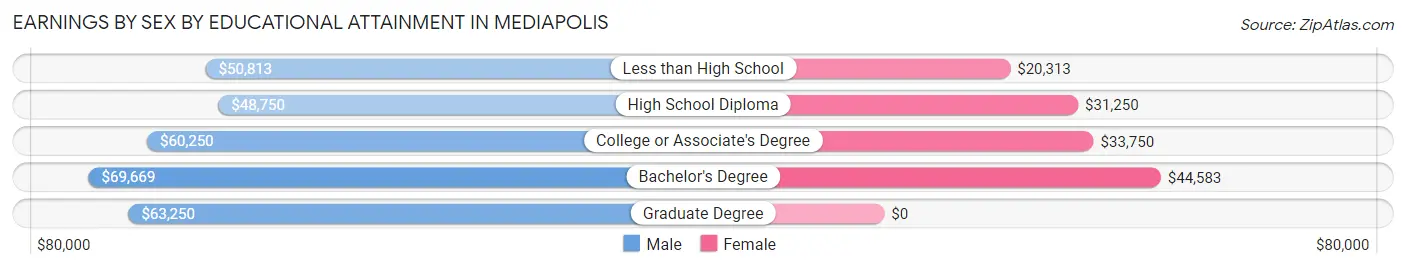
| Educational Attainment | Male Income | Female Income |
| Less than High School | $50,813 | $20,313 |
| High School Diploma | $48,750 | $31,250 |
| College or Associate's Degree | $60,250 | $33,750 |
| Bachelor's Degree | $69,669 | $44,583 |
| Graduate Degree | $63,250 | $0 |
| Total | $62,109 | $32,167 |
Family Income in Mediapolis
Family Income Brackets in Mediapolis
According to the Mediapolis family income data, there are 152 families falling into the $50,000 to $74,999 income range, which is the most common income bracket and makes up 26.5% of all families.
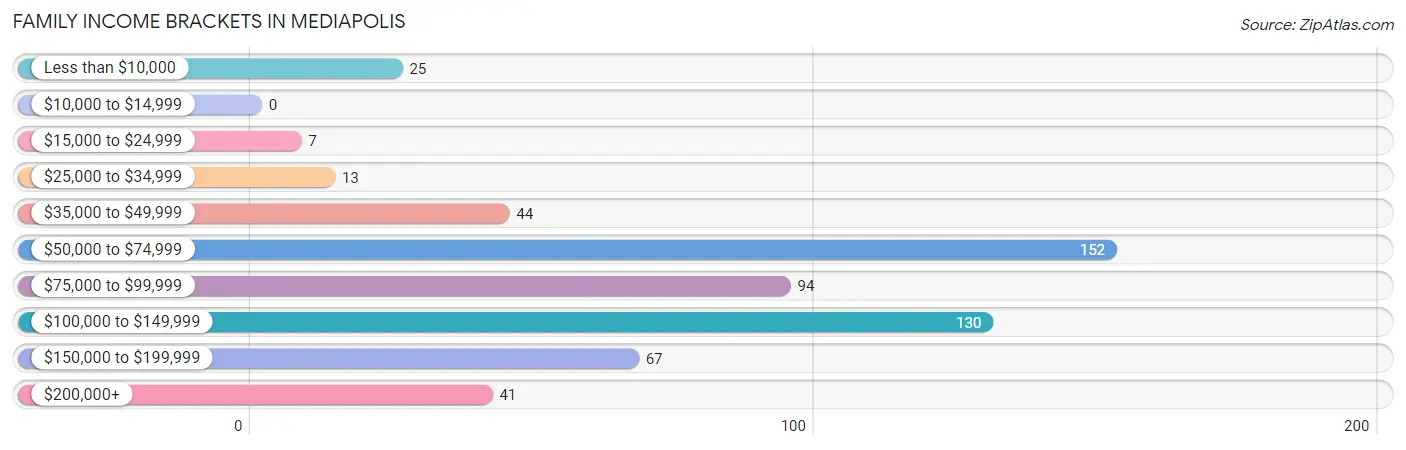
| Income Bracket | # Families | % Families |
| Less than $10,000 | 25 | 4.4% |
| $10,000 to $14,999 | 0 | 0.0% |
| $15,000 to $24,999 | 7 | 1.2% |
| $25,000 to $34,999 | 13 | 2.3% |
| $35,000 to $49,999 | 44 | 7.7% |
| $50,000 to $74,999 | 152 | 26.5% |
| $75,000 to $99,999 | 94 | 16.4% |
| $100,000 to $149,999 | 130 | 22.7% |
| $150,000 to $199,999 | 67 | 11.7% |
| $200,000+ | 41 | 7.2% |
Family Income by Famaliy Size in Mediapolis
6-person families (26 | 4.5%) account for the highest median family income in Mediapolis with $173,750 per family, while 2-person families (214 | 37.3%) have the highest median income of $36,176 per family member.
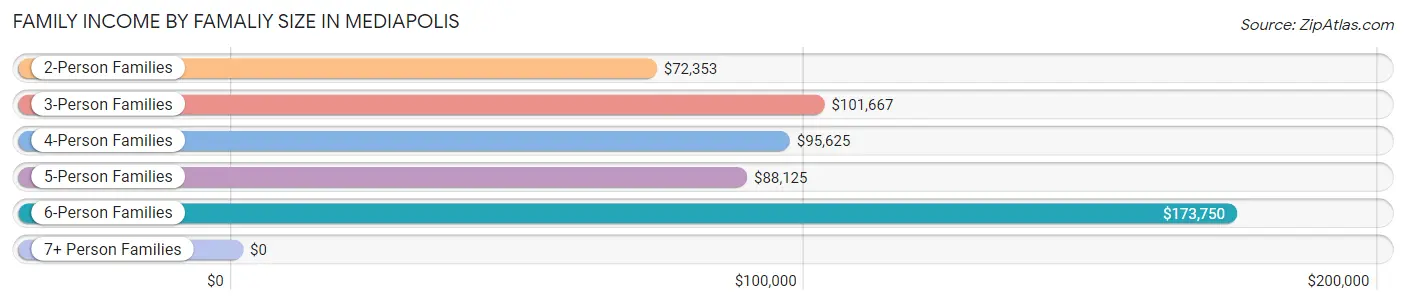
| Income Bracket | # Families | Median Income |
| 2-Person Families | 214 (37.3%) | $72,353 |
| 3-Person Families | 96 (16.8%) | $101,667 |
| 4-Person Families | 155 (27.1%) | $95,625 |
| 5-Person Families | 76 (13.3%) | $88,125 |
| 6-Person Families | 26 (4.5%) | $173,750 |
| 7+ Person Families | 6 (1.1%) | $0 |
| Total | 573 (100.0%) | $90,313 |
Family Income by Number of Earners in Mediapolis
The median family income in Mediapolis is $90,313, with families comprising 3+ earners (78) having the highest median family income of $175,956, while families with 1 earner (117) have the lowest median family income of $60,536, accounting for 13.6% and 20.4% of families, respectively.
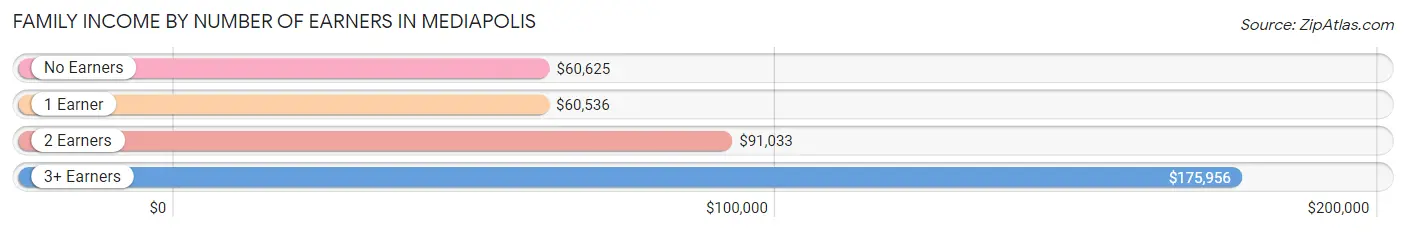
| Number of Earners | # Families | Median Income |
| No Earners | 47 (8.2%) | $60,625 |
| 1 Earner | 117 (20.4%) | $60,536 |
| 2 Earners | 331 (57.8%) | $91,033 |
| 3+ Earners | 78 (13.6%) | $175,956 |
| Total | 573 (100.0%) | $90,313 |
Household Income in Mediapolis
Household Income Brackets in Mediapolis
With 192 households falling in the category, the $50,000 to $74,999 income range is the most frequent in Mediapolis, accounting for 22.4% of all households. In contrast, only 25 households (2.9%) fall into the less than $10,000 income bracket, making it the least populous group.
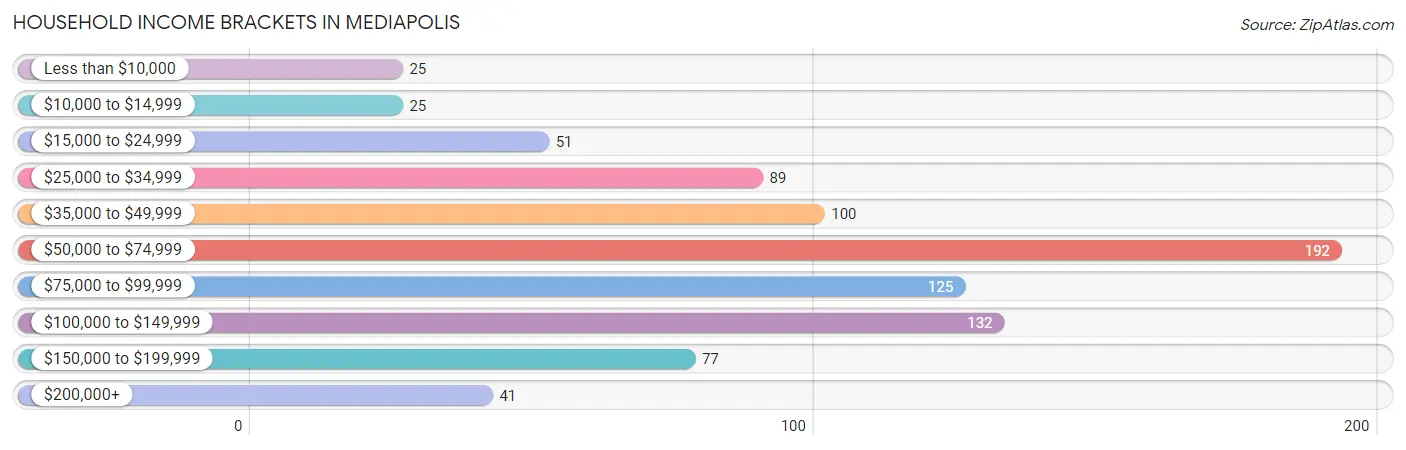
| Income Bracket | # Households | % Households |
| Less than $10,000 | 25 | 2.9% |
| $10,000 to $14,999 | 25 | 2.9% |
| $15,000 to $24,999 | 51 | 6.0% |
| $25,000 to $34,999 | 89 | 10.4% |
| $35,000 to $49,999 | 100 | 11.7% |
| $50,000 to $74,999 | 192 | 22.4% |
| $75,000 to $99,999 | 125 | 14.6% |
| $100,000 to $149,999 | 132 | 15.4% |
| $150,000 to $199,999 | 77 | 9.0% |
| $200,000+ | 41 | 4.8% |
Household Income by Householder Age in Mediapolis
The median household income in Mediapolis is $71,761, with the highest median household income of $85,313 found in the 45 to 64 years age bracket for the primary householder. A total of 245 households (28.6%) fall into this category. Meanwhile, the 15 to 24 years age bracket for the primary householder has the lowest median household income of $0, with 8 households (0.9%) in this group.
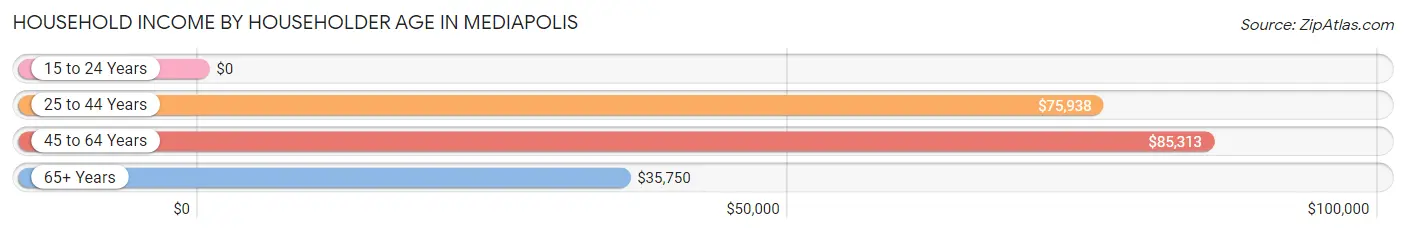
| Income Bracket | # Households | Median Income |
| 15 to 24 Years | 8 (0.9%) | $0 |
| 25 to 44 Years | 362 (42.2%) | $75,938 |
| 45 to 64 Years | 245 (28.6%) | $85,313 |
| 65+ Years | 242 (28.2%) | $35,750 |
| Total | 857 (100.0%) | $71,761 |
Poverty in Mediapolis
Income Below Poverty by Sex and Age in Mediapolis
With 4.3% poverty level for males and 8.9% for females among the residents of Mediapolis, 16 and 17 year old males and 15 year old females are the most vulnerable to poverty, with 7 males (13.5%) and 9 females (64.3%) in their respective age groups living below the poverty level.
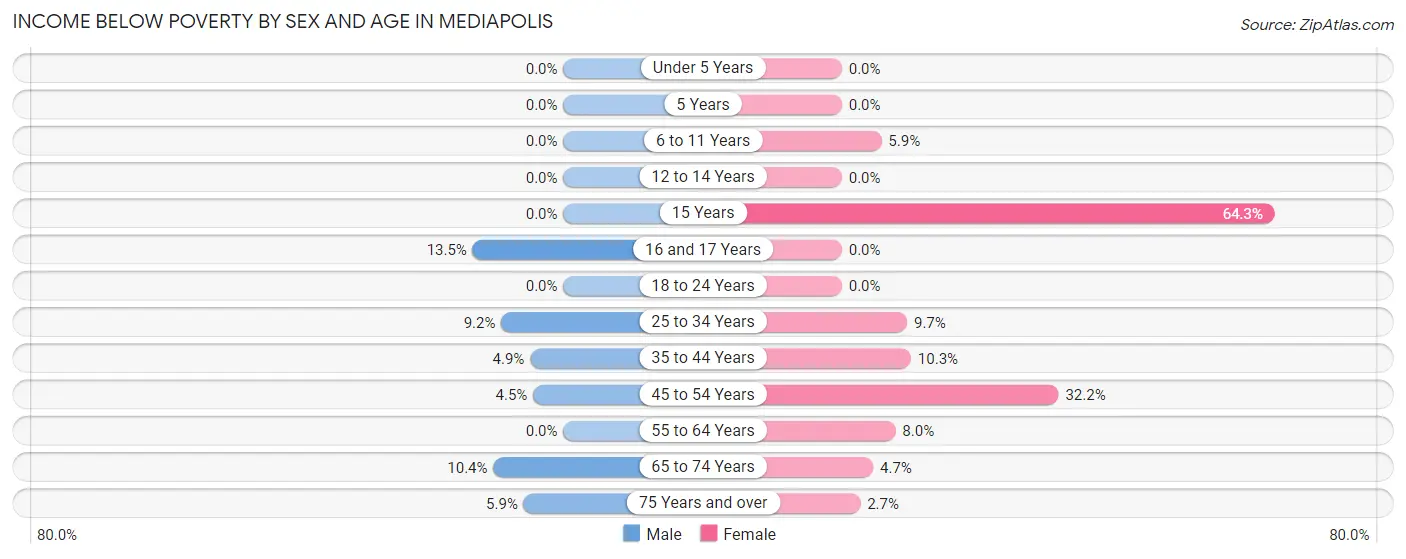
| Age Bracket | Male | Female |
| Under 5 Years | 0 (0.0%) | 0 (0.0%) |
| 5 Years | 0 (0.0%) | 0 (0.0%) |
| 6 to 11 Years | 0 (0.0%) | 3 (5.9%) |
| 12 to 14 Years | 0 (0.0%) | 0 (0.0%) |
| 15 Years | 0 (0.0%) | 9 (64.3%) |
| 16 and 17 Years | 7 (13.5%) | 0 (0.0%) |
| 18 to 24 Years | 0 (0.0%) | 0 (0.0%) |
| 25 to 34 Years | 21 (9.2%) | 19 (9.7%) |
| 35 to 44 Years | 6 (4.9%) | 16 (10.3%) |
| 45 to 54 Years | 3 (4.5%) | 28 (32.2%) |
| 55 to 64 Years | 0 (0.0%) | 9 (8.0%) |
| 65 to 74 Years | 8 (10.4%) | 6 (4.6%) |
| 75 Years and over | 2 (5.9%) | 2 (2.7%) |
| Total | 47 (4.3%) | 92 (8.9%) |
Income Above Poverty by Sex and Age in Mediapolis
According to the poverty statistics in Mediapolis, males aged under 5 years and females aged under 5 years are the age groups that are most secure financially, with 100.0% of males and 100.0% of females in these age groups living above the poverty line.
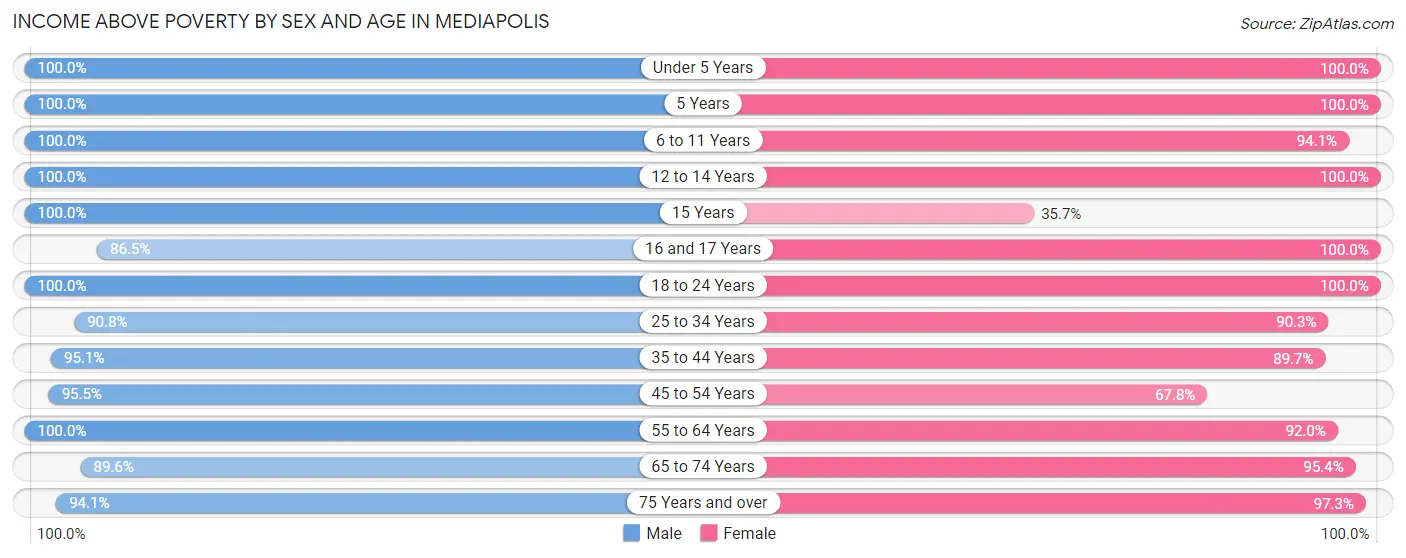
| Age Bracket | Male | Female |
| Under 5 Years | 148 (100.0%) | 103 (100.0%) |
| 5 Years | 24 (100.0%) | 18 (100.0%) |
| 6 to 11 Years | 139 (100.0%) | 48 (94.1%) |
| 12 to 14 Years | 58 (100.0%) | 22 (100.0%) |
| 15 Years | 14 (100.0%) | 5 (35.7%) |
| 16 and 17 Years | 45 (86.5%) | 27 (100.0%) |
| 18 to 24 Years | 16 (100.0%) | 46 (100.0%) |
| 25 to 34 Years | 207 (90.8%) | 177 (90.3%) |
| 35 to 44 Years | 116 (95.1%) | 140 (89.7%) |
| 45 to 54 Years | 64 (95.5%) | 59 (67.8%) |
| 55 to 64 Years | 128 (100.0%) | 104 (92.0%) |
| 65 to 74 Years | 69 (89.6%) | 123 (95.4%) |
| 75 Years and over | 32 (94.1%) | 71 (97.3%) |
| Total | 1,060 (95.8%) | 943 (91.1%) |
Income Below Poverty Among Married-Couple Families in Mediapolis
The poverty statistics for married-couple families in Mediapolis show that 4.0% or 19 of the total 473 families live below the poverty line. Families with no children have the highest poverty rate of 7.8%, comprising of 19 families. On the other hand, families with 1 or 2 children have the lowest poverty rate of 0.0%, which includes 0 families.
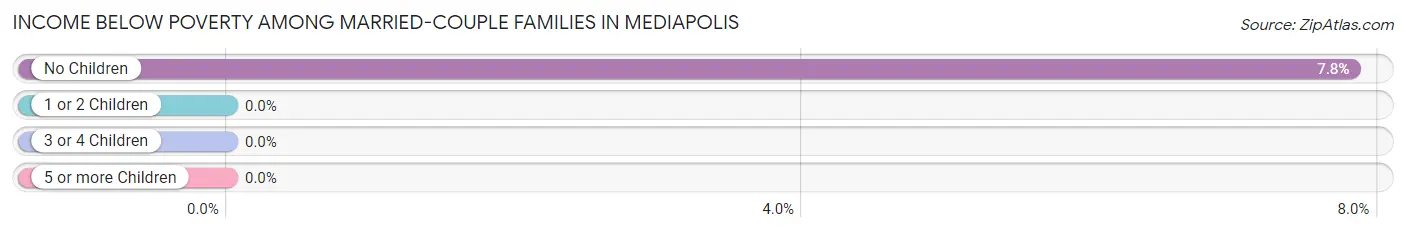
| Children | Above Poverty | Below Poverty |
| No Children | 224 (92.2%) | 19 (7.8%) |
| 1 or 2 Children | 142 (100.0%) | 0 (0.0%) |
| 3 or 4 Children | 82 (100.0%) | 0 (0.0%) |
| 5 or more Children | 6 (100.0%) | 0 (0.0%) |
| Total | 454 (96.0%) | 19 (4.0%) |
Income Below Poverty Among Single-Parent Households in Mediapolis
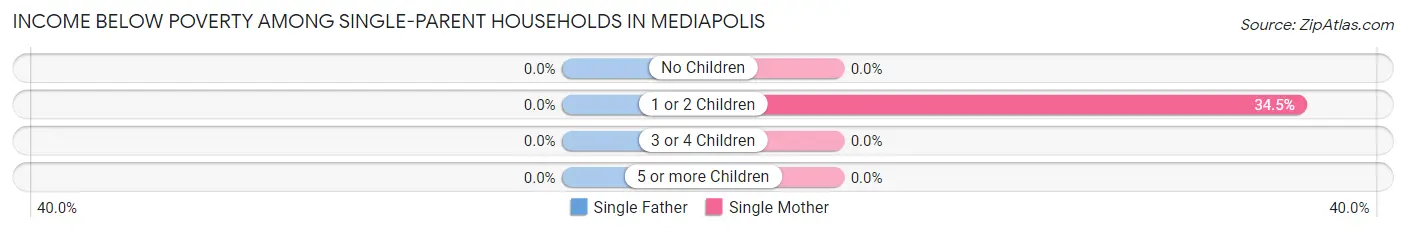
| Children | Single Father | Single Mother |
| No Children | 0 (0.0%) | 0 (0.0%) |
| 1 or 2 Children | 0 (0.0%) | 10 (34.5%) |
| 3 or 4 Children | 0 (0.0%) | 0 (0.0%) |
| 5 or more Children | 0 (0.0%) | 0 (0.0%) |
| Total | 0 (0.0%) | 10 (13.0%) |
Income Below Poverty Among Married-Couple vs Single-Parent Households in Mediapolis
The poverty data for Mediapolis shows that 19 of the married-couple family households (4.0%) and 10 of the single-parent households (10.0%) are living below the poverty level. Within the married-couple family households, those with no children have the highest poverty rate, with 19 households (7.8%) falling below the poverty line. Among the single-parent households, those with 1 or 2 children have the highest poverty rate, with 10 household (20.0%) living below poverty.
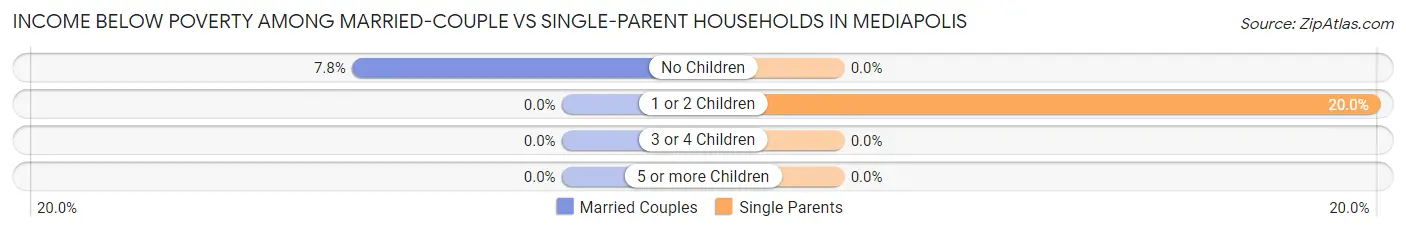
| Children | Married-Couple Families | Single-Parent Households |
| No Children | 19 (7.8%) | 0 (0.0%) |
| 1 or 2 Children | 0 (0.0%) | 10 (20.0%) |
| 3 or 4 Children | 0 (0.0%) | 0 (0.0%) |
| 5 or more Children | 0 (0.0%) | 0 (0.0%) |
| Total | 19 (4.0%) | 10 (10.0%) |
Race in Mediapolis
The most populous races in Mediapolis are White / Caucasian (2,044 | 92.3%), Two or more Races (125 | 5.7%), and Hispanic or Latino (89 | 4.0%).
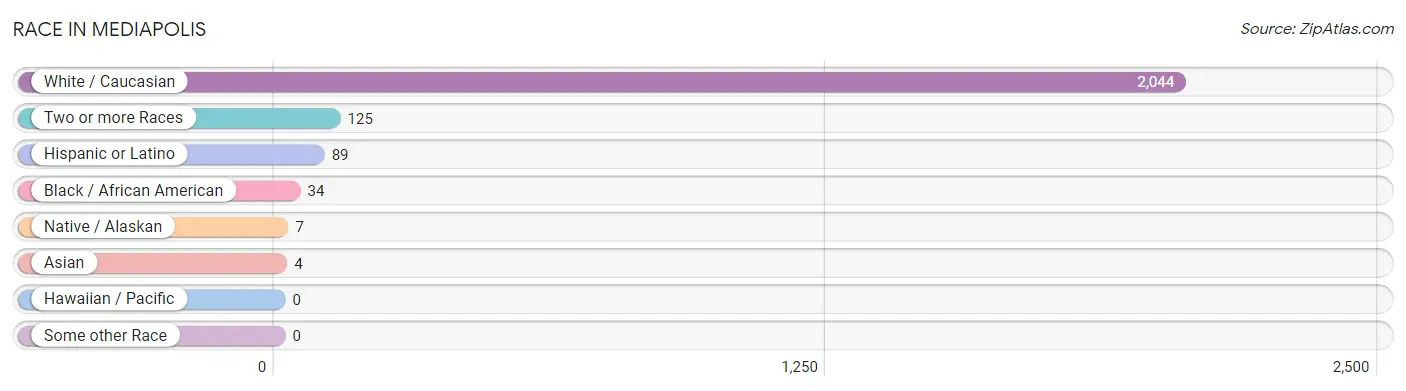
| Race | # Population | % Population |
| Asian | 4 | 0.2% |
| Black / African American | 34 | 1.5% |
| Hawaiian / Pacific | 0 | 0.0% |
| Hispanic or Latino | 89 | 4.0% |
| Native / Alaskan | 7 | 0.3% |
| White / Caucasian | 2,044 | 92.3% |
| Two or more Races | 125 | 5.7% |
| Some other Race | 0 | 0.0% |
| Total | 2,214 | 100.0% |
Ancestry in Mediapolis
The most populous ancestries reported in Mediapolis are German (825 | 37.3%), Swedish (186 | 8.4%), English (182 | 8.2%), Irish (159 | 7.2%), and Norwegian (115 | 5.2%), together accounting for 66.2% of all Mediapolis residents.
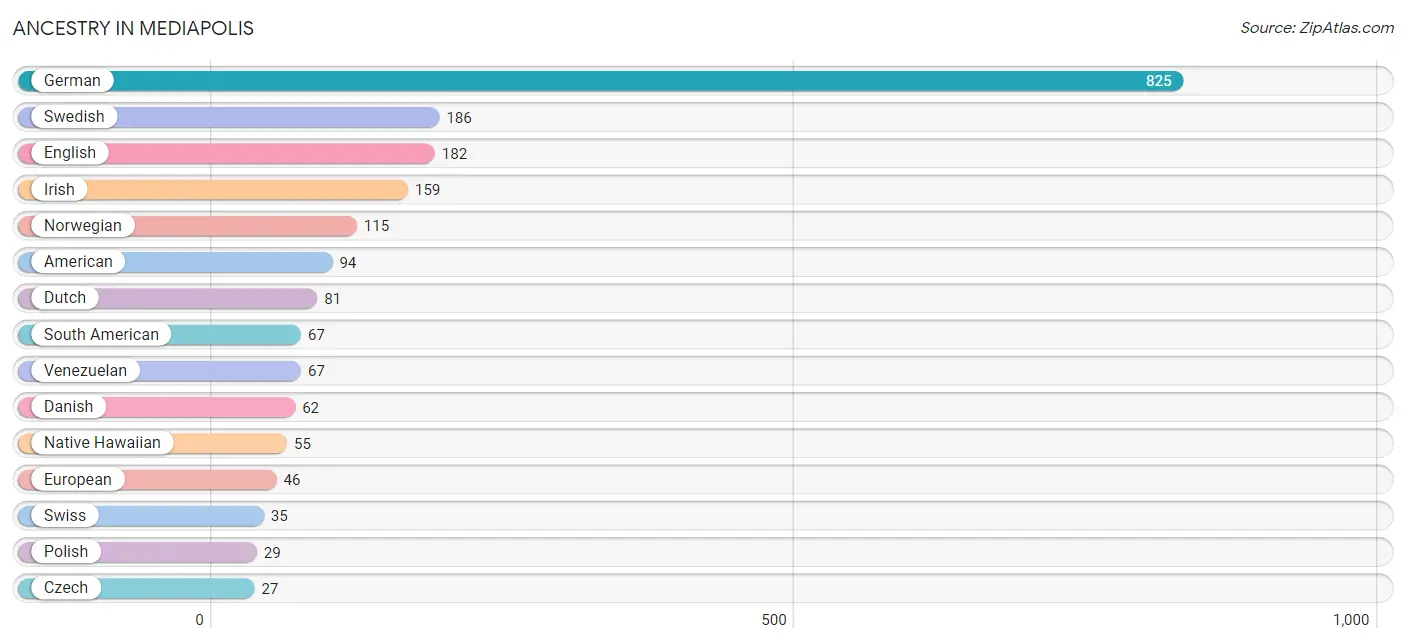
| Ancestry | # Population | % Population |
| American | 94 | 4.3% |
| British | 7 | 0.3% |
| Burmese | 4 | 0.2% |
| Czech | 27 | 1.2% |
| Danish | 62 | 2.8% |
| Dutch | 81 | 3.7% |
| English | 182 | 8.2% |
| European | 46 | 2.1% |
| French | 13 | 0.6% |
| German | 825 | 37.3% |
| Indian (Asian) | 4 | 0.2% |
| Irish | 159 | 7.2% |
| Italian | 20 | 0.9% |
| Lithuanian | 12 | 0.5% |
| Mexican | 7 | 0.3% |
| Mexican American Indian | 7 | 0.3% |
| Native Hawaiian | 55 | 2.5% |
| Norwegian | 115 | 5.2% |
| Polish | 29 | 1.3% |
| Puerto Rican | 15 | 0.7% |
| Romanian | 6 | 0.3% |
| Scottish | 5 | 0.2% |
| Sioux | 3 | 0.1% |
| Slovene | 6 | 0.3% |
| South American | 67 | 3.0% |
| Swedish | 186 | 8.4% |
| Swiss | 35 | 1.6% |
| Venezuelan | 67 | 3.0% |
| Welsh | 10 | 0.4% | View All 29 Rows |
Immigrants in Mediapolis
The most numerous immigrant groups reported in Mediapolis came from Latin America (67 | 3.0%), South America (67 | 3.0%), Venezuela (67 | 3.0%), Asia (4 | 0.2%), and China (4 | 0.2%), together accounting for 9.5% of all Mediapolis residents.
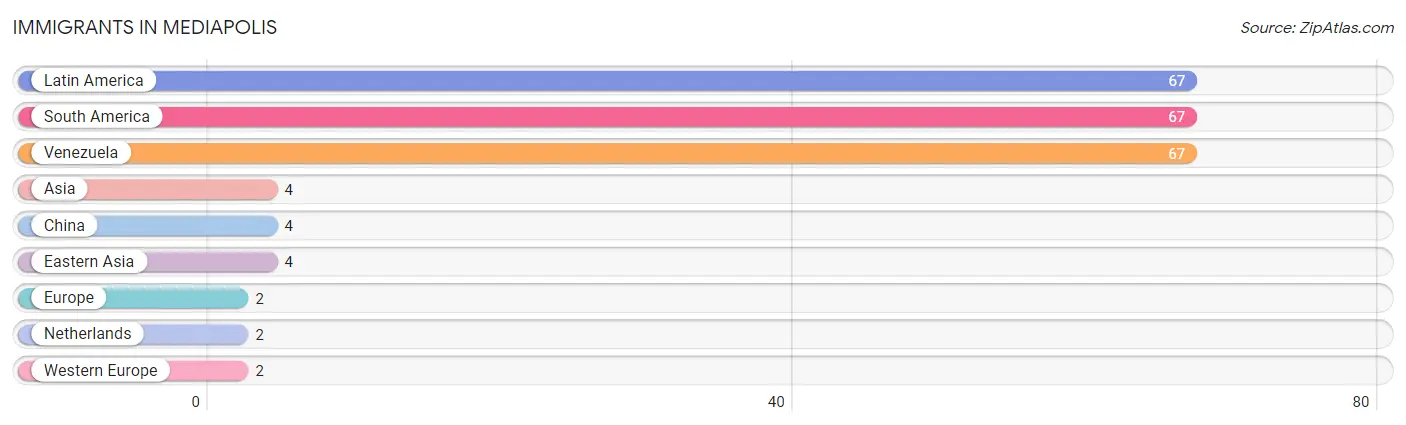
| Immigration Origin | # Population | % Population |
| Asia | 4 | 0.2% |
| China | 4 | 0.2% |
| Eastern Asia | 4 | 0.2% |
| Europe | 2 | 0.1% |
| Latin America | 67 | 3.0% |
| Netherlands | 2 | 0.1% |
| South America | 67 | 3.0% |
| Venezuela | 67 | 3.0% |
| Western Europe | 2 | 0.1% | View All 9 Rows |
Sex and Age in Mediapolis
Sex and Age in Mediapolis
The most populous age groups in Mediapolis are Under 5 Years (148 | 12.9%) for men and 30 to 34 Years (141 | 13.2%) for women.
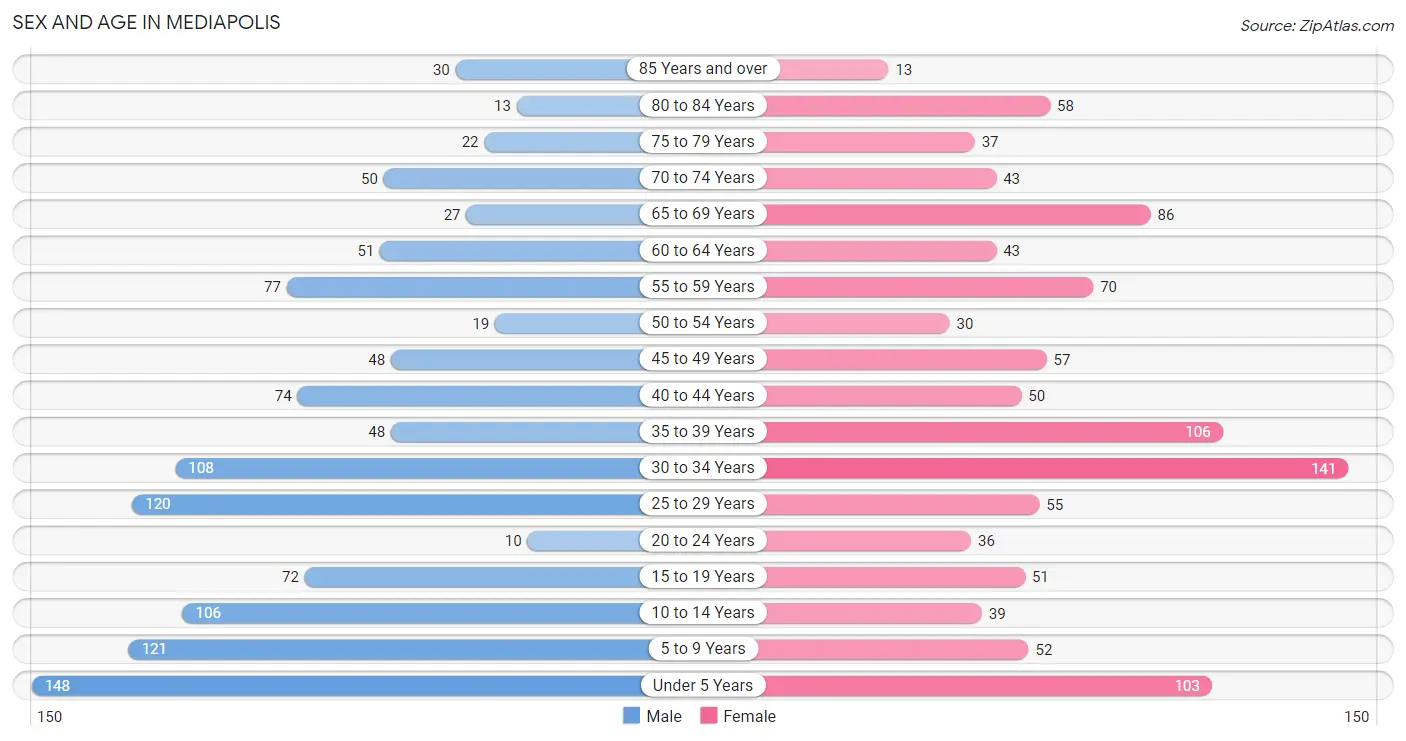
| Age Bracket | Male | Female |
| Under 5 Years | 148 (12.9%) | 103 (9.6%) |
| 5 to 9 Years | 121 (10.6%) | 52 (4.9%) |
| 10 to 14 Years | 106 (9.3%) | 39 (3.6%) |
| 15 to 19 Years | 72 (6.3%) | 51 (4.8%) |
| 20 to 24 Years | 10 (0.9%) | 36 (3.4%) |
| 25 to 29 Years | 120 (10.5%) | 55 (5.1%) |
| 30 to 34 Years | 108 (9.4%) | 141 (13.2%) |
| 35 to 39 Years | 48 (4.2%) | 106 (9.9%) |
| 40 to 44 Years | 74 (6.5%) | 50 (4.7%) |
| 45 to 49 Years | 48 (4.2%) | 57 (5.3%) |
| 50 to 54 Years | 19 (1.7%) | 30 (2.8%) |
| 55 to 59 Years | 77 (6.7%) | 70 (6.5%) |
| 60 to 64 Years | 51 (4.5%) | 43 (4.0%) |
| 65 to 69 Years | 27 (2.4%) | 86 (8.0%) |
| 70 to 74 Years | 50 (4.4%) | 43 (4.0%) |
| 75 to 79 Years | 22 (1.9%) | 37 (3.5%) |
| 80 to 84 Years | 13 (1.1%) | 58 (5.4%) |
| 85 Years and over | 30 (2.6%) | 13 (1.2%) |
| Total | 1,144 (100.0%) | 1,070 (100.0%) |
Families and Households in Mediapolis
Median Family Size in Mediapolis
The median family size in Mediapolis is 3.10 persons per family, with married-couple families (473 | 82.6%) accounting for the largest median family size of 3.14 persons per family. On the other hand, single male/father families (23 | 4.0%) represent the smallest median family size with 2.39 persons per family.
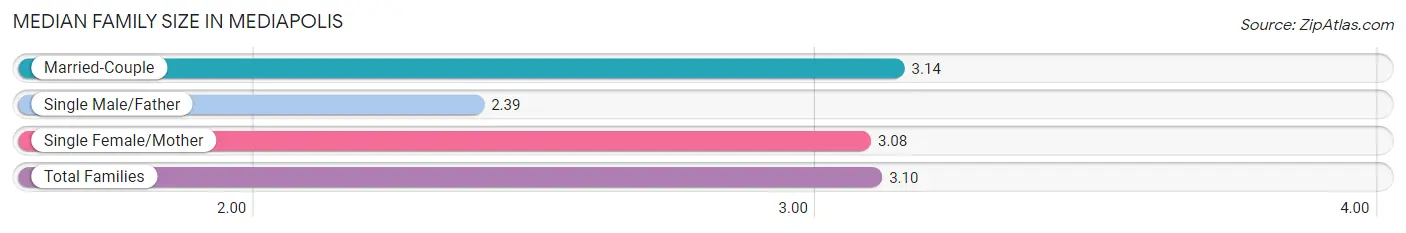
| Family Type | # Families | Family Size |
| Married-Couple | 473 (82.6%) | 3.14 |
| Single Male/Father | 23 (4.0%) | 2.39 |
| Single Female/Mother | 77 (13.4%) | 3.08 |
| Total Families | 573 (100.0%) | 3.10 |
Median Household Size in Mediapolis
The median household size in Mediapolis is 2.49 persons per household, with single female/mother households (77 | 9.0%) accounting for the largest median household size of 3.38 persons per household. non-family households (284 | 33.1%) represent the smallest median household size with 1.15 persons per household.
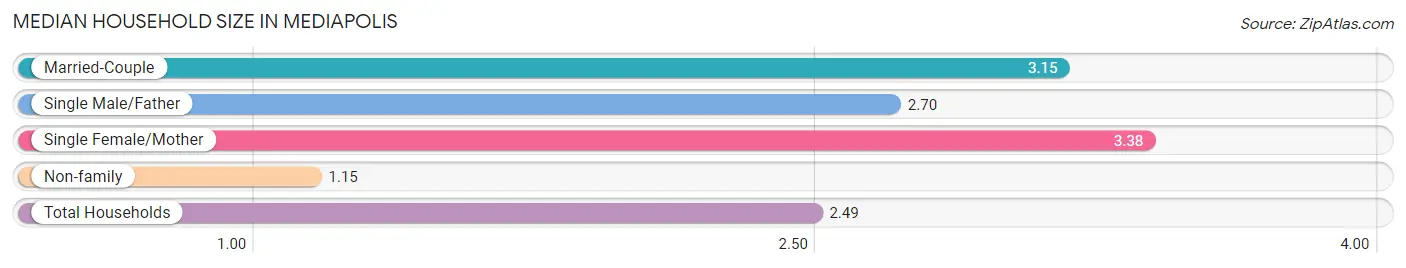
| Household Type | # Households | Household Size |
| Married-Couple | 473 (55.2%) | 3.15 |
| Single Male/Father | 23 (2.7%) | 2.70 |
| Single Female/Mother | 77 (9.0%) | 3.38 |
| Non-family | 284 (33.1%) | 1.15 |
| Total Households | 857 (100.0%) | 2.49 |
Household Size by Marriage Status in Mediapolis
Out of a total of 857 households in Mediapolis, 573 (66.9%) are family households, while 284 (33.1%) are nonfamily households. The most numerous type of family households are 2-person households, comprising 194, and the most common type of nonfamily households are 1-person households, comprising 257.
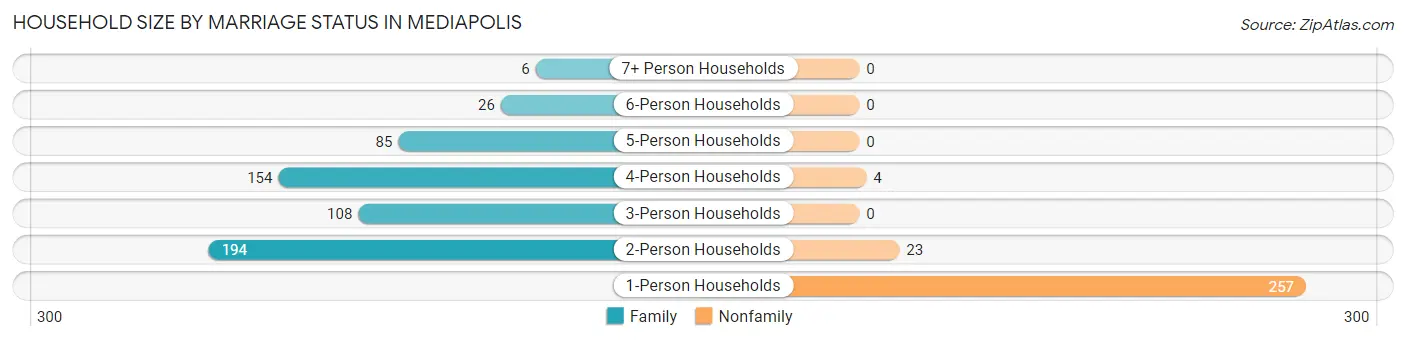
| Household Size | Family Households | Nonfamily Households |
| 1-Person Households | - | 257 (30.0%) |
| 2-Person Households | 194 (22.6%) | 23 (2.7%) |
| 3-Person Households | 108 (12.6%) | 0 (0.0%) |
| 4-Person Households | 154 (18.0%) | 4 (0.5%) |
| 5-Person Households | 85 (9.9%) | 0 (0.0%) |
| 6-Person Households | 26 (3.0%) | 0 (0.0%) |
| 7+ Person Households | 6 (0.7%) | 0 (0.0%) |
| Total | 573 (66.9%) | 284 (33.1%) |
Female Fertility in Mediapolis
Fertility by Age in Mediapolis
Average fertility rate in Mediapolis is 85.0 births per 1,000 women. Women in the age bracket of 20 to 34 years have the highest fertility rate with 164.0 births per 1,000 women. Women in the age bracket of 20 to 34 years acount for 90.5% of all women with births.
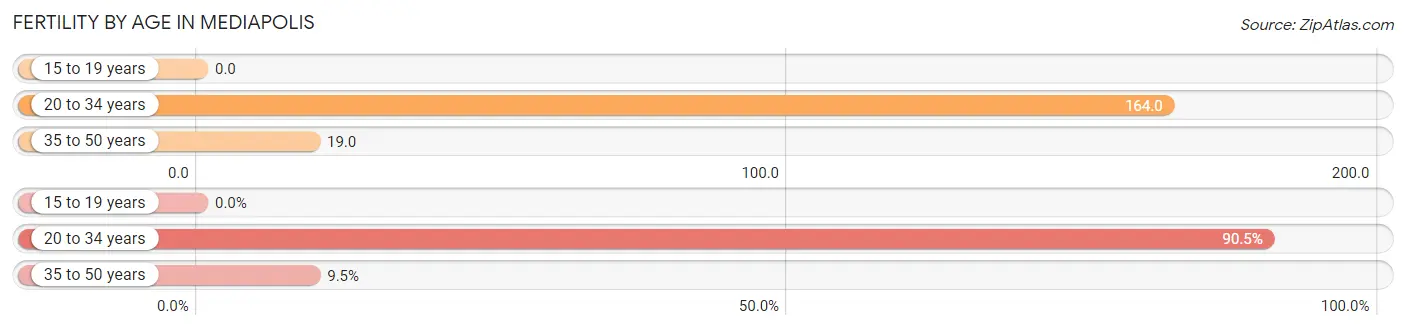
| Age Bracket | Women with Births | Births / 1,000 Women |
| 15 to 19 years | 0 (0.0%) | 0.0 |
| 20 to 34 years | 38 (90.5%) | 164.0 |
| 35 to 50 years | 4 (9.5%) | 19.0 |
| Total | 42 (100.0%) | 85.0 |
Fertility by Age by Marriage Status in Mediapolis
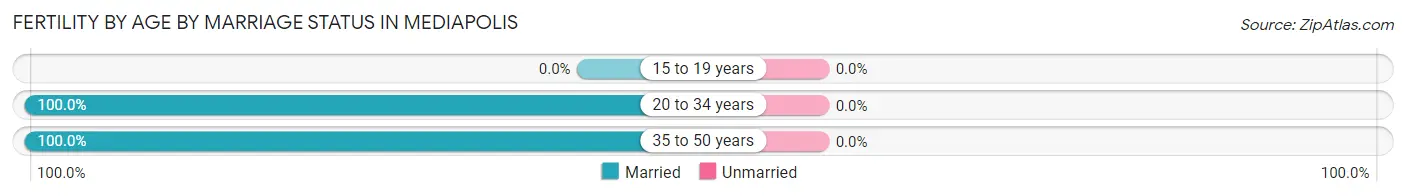
| Age Bracket | Married | Unmarried |
| 15 to 19 years | 0 (0.0%) | 0 (0.0%) |
| 20 to 34 years | 38 (100.0%) | 0 (0.0%) |
| 35 to 50 years | 4 (100.0%) | 0 (0.0%) |
| Total | 42 (100.0%) | 0 (0.0%) |
Fertility by Education in Mediapolis
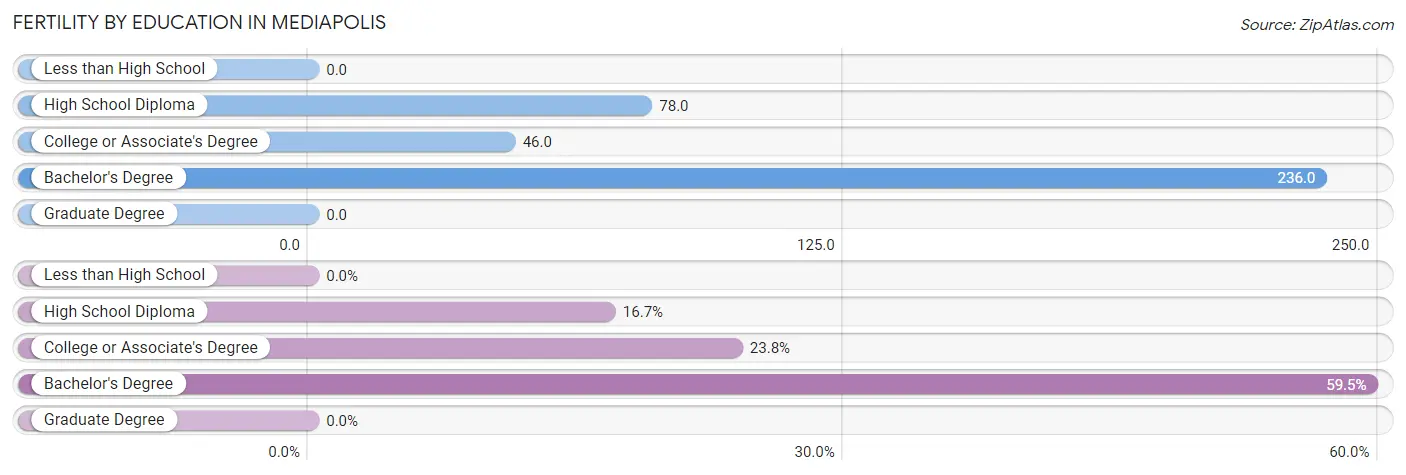
| Educational Attainment | Women with Births | Births / 1,000 Women |
| Less than High School | 0 (0.0%) | 0.0 |
| High School Diploma | 7 (16.7%) | 78.0 |
| College or Associate's Degree | 10 (23.8%) | 46.0 |
| Bachelor's Degree | 25 (59.5%) | 236.0 |
| Graduate Degree | 0 (0.0%) | 0.0 |
| Total | 42 (100.0%) | 85.0 |
Fertility by Education by Marriage Status in Mediapolis
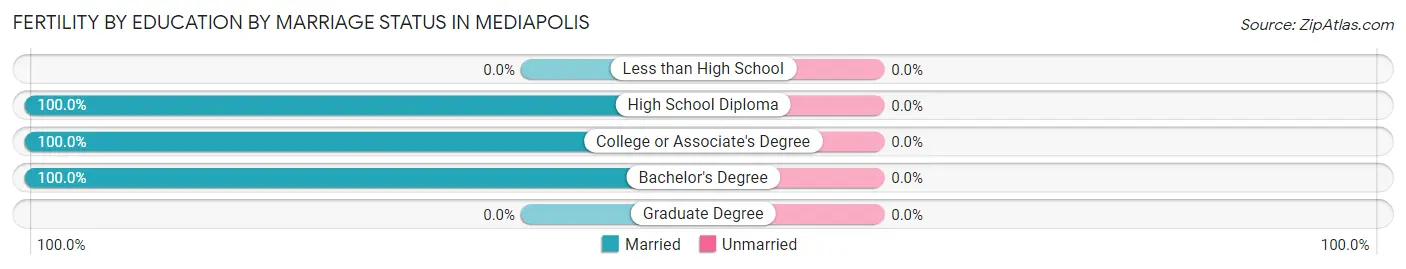
| Educational Attainment | Married | Unmarried |
| Less than High School | 0 (0.0%) | 0 (0.0%) |
| High School Diploma | 7 (100.0%) | 0 (0.0%) |
| College or Associate's Degree | 10 (100.0%) | 0 (0.0%) |
| Bachelor's Degree | 25 (100.0%) | 0 (0.0%) |
| Graduate Degree | 0 (0.0%) | 0 (0.0%) |
| Total | 42 (100.0%) | 0 (0.0%) |
Employment Characteristics in Mediapolis
Employment by Class of Employer in Mediapolis
Among the 1,036 employed individuals in Mediapolis, private company employees (700 | 67.6%), not-for-profit organizations (87 | 8.4%), and local government employees (74 | 7.1%) make up the most common classes of employment.
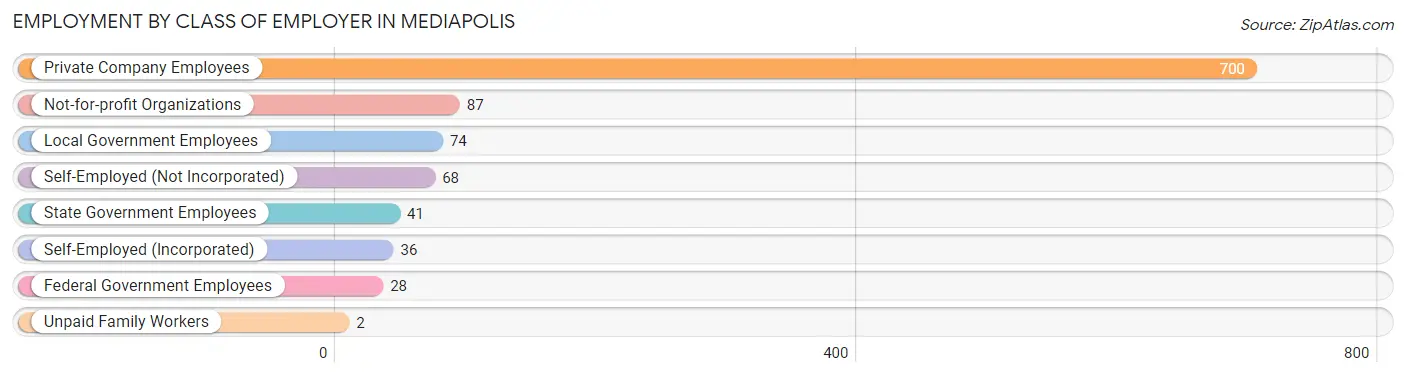
| Employer Class | # Employees | % Employees |
| Private Company Employees | 700 | 67.6% |
| Self-Employed (Incorporated) | 36 | 3.5% |
| Self-Employed (Not Incorporated) | 68 | 6.6% |
| Not-for-profit Organizations | 87 | 8.4% |
| Local Government Employees | 74 | 7.1% |
| State Government Employees | 41 | 4.0% |
| Federal Government Employees | 28 | 2.7% |
| Unpaid Family Workers | 2 | 0.2% |
| Total | 1,036 | 100.0% |
Employment Status by Age in Mediapolis
According to the labor force statistics for Mediapolis, out of the total population over 16 years of age (1,617), 69.1% or 1,117 individuals are in the labor force, with 3.2% or 36 of them unemployed. The age group with the highest labor force participation rate is 25 to 29 years, with 94.3% or 165 individuals in the labor force. Within the labor force, the 20 to 24 years age range has the highest percentage of unemployed individuals, with 13.2% or 5 of them being unemployed.
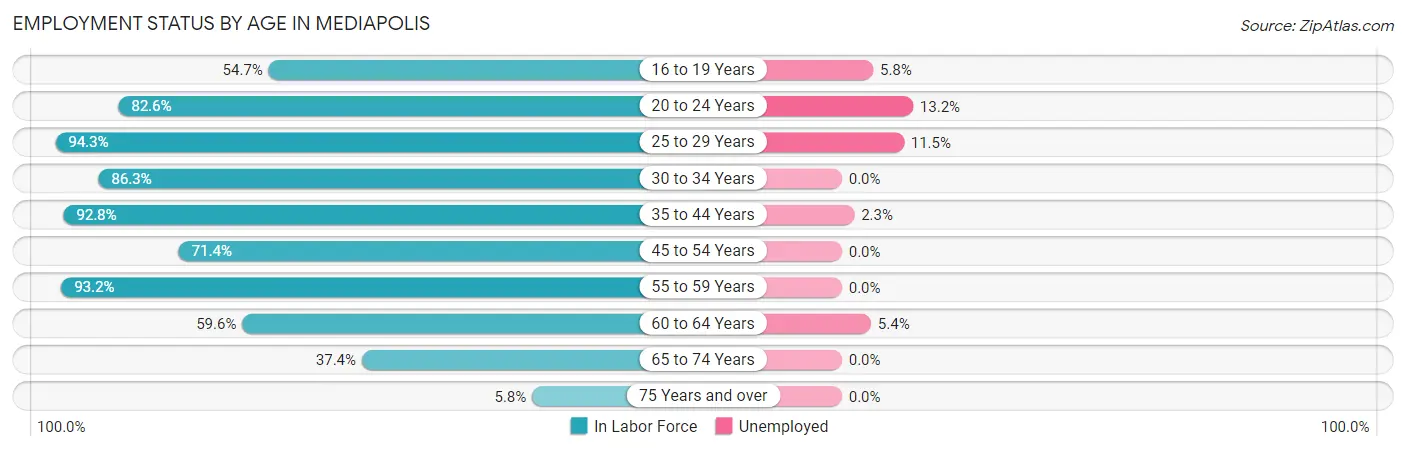
| Age Bracket | In Labor Force | Unemployed |
| 16 to 19 Years | 52 (54.7%) | 3 (5.8%) |
| 20 to 24 Years | 38 (82.6%) | 5 (13.2%) |
| 25 to 29 Years | 165 (94.3%) | 19 (11.5%) |
| 30 to 34 Years | 215 (86.3%) | 0 (0.0%) |
| 35 to 44 Years | 258 (92.8%) | 6 (2.3%) |
| 45 to 54 Years | 110 (71.4%) | 0 (0.0%) |
| 55 to 59 Years | 137 (93.2%) | 0 (0.0%) |
| 60 to 64 Years | 56 (59.6%) | 3 (5.4%) |
| 65 to 74 Years | 77 (37.4%) | 0 (0.0%) |
| 75 Years and over | 10 (5.8%) | 0 (0.0%) |
| Total | 1,117 (69.1%) | 36 (3.2%) |
Employment Status by Educational Attainment in Mediapolis
According to labor force statistics for Mediapolis, 85.8% of individuals (941) out of the total population between 25 and 64 years of age (1,097) are in the labor force, with 3.0% or 28 of them being unemployed. The group with the highest labor force participation rate are those with the educational attainment of less than high school, with 92.3% or 48 individuals in the labor force. Within the labor force, individuals with high school diploma education have the highest percentage of unemployment, with 3.5% or 6 of them being unemployed.
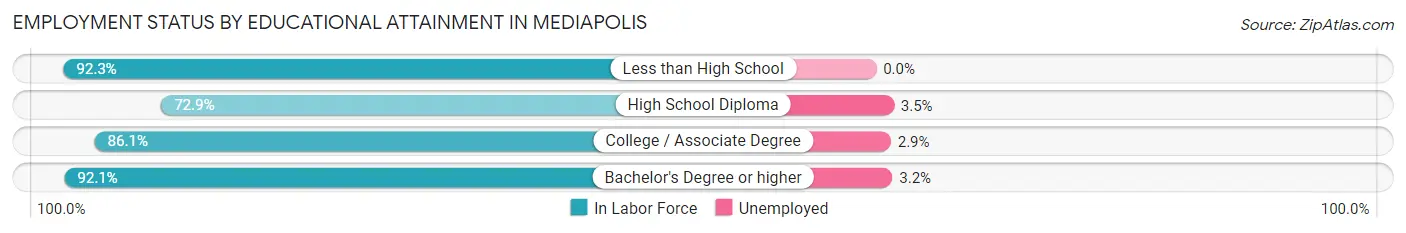
| Educational Attainment | In Labor Force | Unemployed |
| Less than High School | 48 (92.3%) | 0 (0.0%) |
| High School Diploma | 172 (72.9%) | 8 (3.5%) |
| College / Associate Degree | 347 (86.1%) | 12 (2.9%) |
| Bachelor's Degree or higher | 374 (92.1%) | 13 (3.2%) |
| Total | 941 (85.8%) | 33 (3.0%) |
Employment Occupations by Sex in Mediapolis
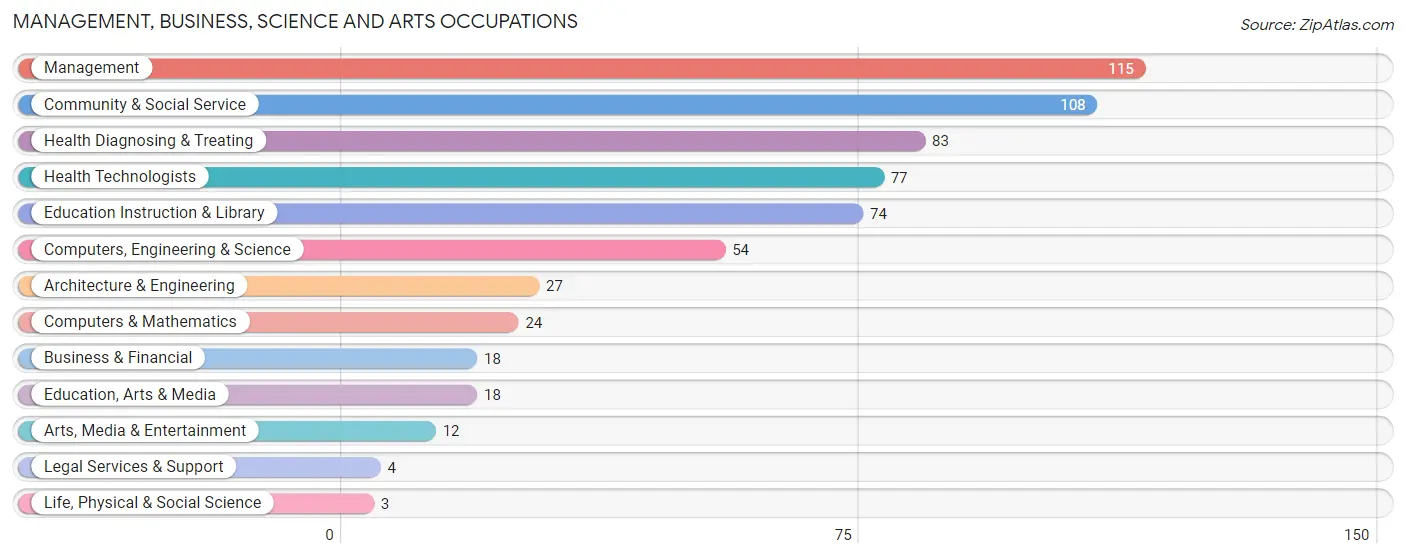
Management, Business, Science and Arts Occupations
The most common Management, Business, Science and Arts occupations in Mediapolis are Management (115 | 10.6%), Community & Social Service (108 | 10.0%), Health Diagnosing & Treating (83 | 7.7%), Health Technologists (77 | 7.1%), and Education Instruction & Library (74 | 6.8%).
Management, Business, Science and Arts Occupations by Sex
Within the Management, Business, Science and Arts occupations in Mediapolis, the most male-oriented occupations are Computers & Mathematics (100.0%), Life, Physical & Social Science (100.0%), and Business & Financial (72.2%), while the most female-oriented occupations are Legal Services & Support (100.0%), Education, Arts & Media (77.8%), and Architecture & Engineering (66.7%).
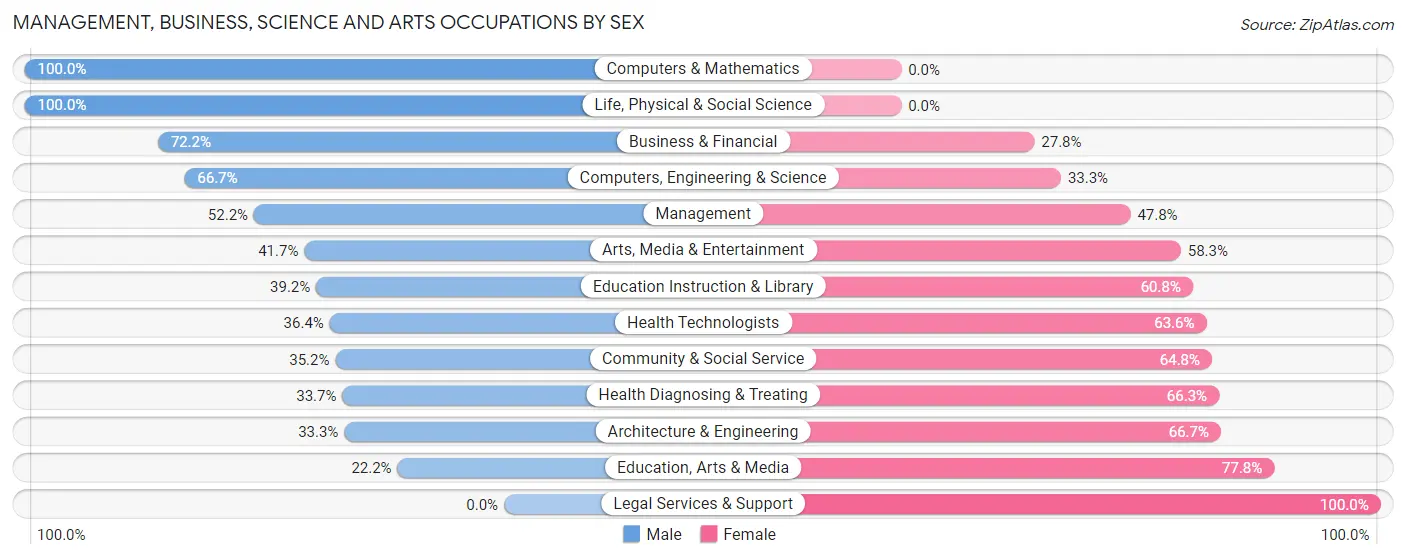
| Occupation | Male | Female |
| Management | 60 (52.2%) | 55 (47.8%) |
| Business & Financial | 13 (72.2%) | 5 (27.8%) |
| Computers, Engineering & Science | 36 (66.7%) | 18 (33.3%) |
| Computers & Mathematics | 24 (100.0%) | 0 (0.0%) |
| Architecture & Engineering | 9 (33.3%) | 18 (66.7%) |
| Life, Physical & Social Science | 3 (100.0%) | 0 (0.0%) |
| Community & Social Service | 38 (35.2%) | 70 (64.8%) |
| Education, Arts & Media | 4 (22.2%) | 14 (77.8%) |
| Legal Services & Support | 0 (0.0%) | 4 (100.0%) |
| Education Instruction & Library | 29 (39.2%) | 45 (60.8%) |
| Arts, Media & Entertainment | 5 (41.7%) | 7 (58.3%) |
| Health Diagnosing & Treating | 28 (33.7%) | 55 (66.3%) |
| Health Technologists | 28 (36.4%) | 49 (63.6%) |
| Total (Category) | 175 (46.3%) | 203 (53.7%) |
| Total (Overall) | 551 (50.9%) | 531 (49.1%) |
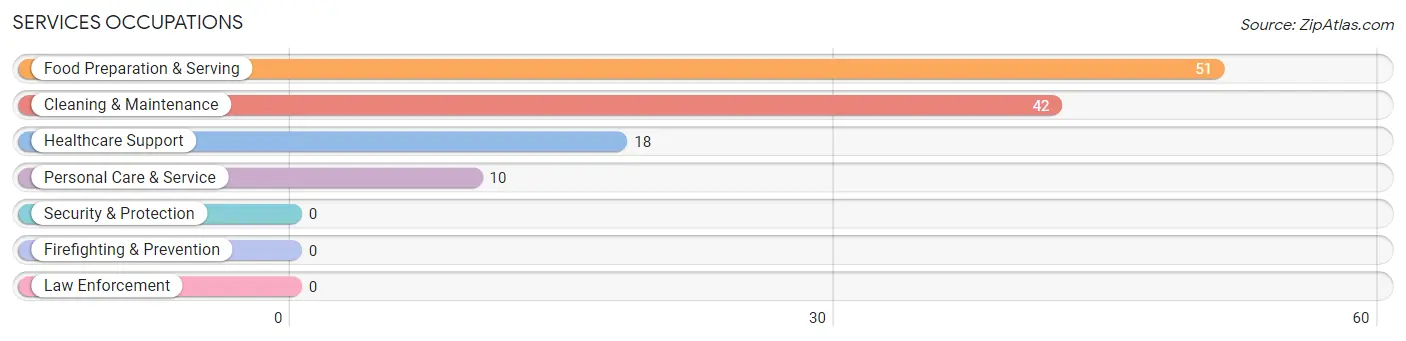
Services Occupations
The most common Services occupations in Mediapolis are Food Preparation & Serving (51 | 4.7%), Cleaning & Maintenance (42 | 3.9%), Healthcare Support (18 | 1.7%), and Personal Care & Service (10 | 0.9%).
Services Occupations by Sex
Within the Services occupations in Mediapolis, the most male-oriented occupations are Cleaning & Maintenance (52.4%), and Food Preparation & Serving (27.5%), while the most female-oriented occupations are Healthcare Support (100.0%), Personal Care & Service (100.0%), and Food Preparation & Serving (72.6%).
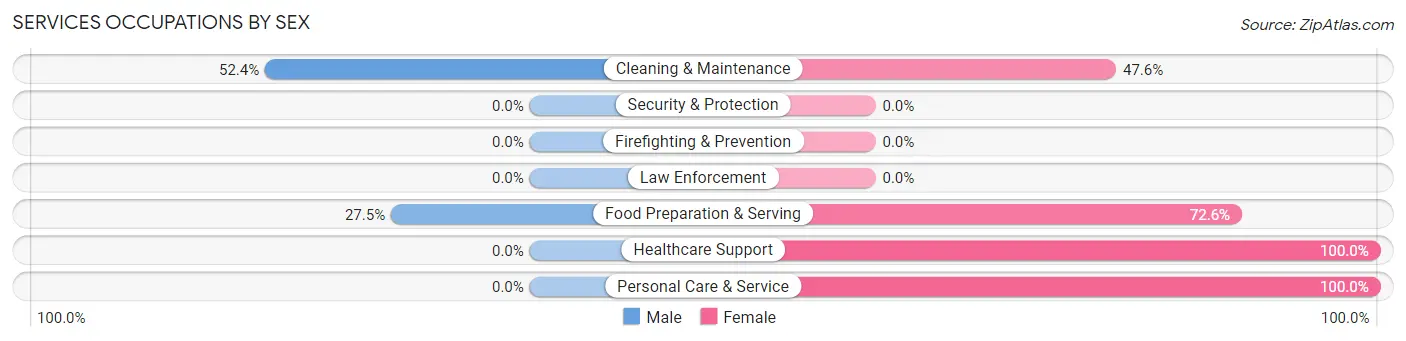
| Occupation | Male | Female |
| Healthcare Support | 0 (0.0%) | 18 (100.0%) |
| Security & Protection | 0 (0.0%) | 0 (0.0%) |
| Firefighting & Prevention | 0 (0.0%) | 0 (0.0%) |
| Law Enforcement | 0 (0.0%) | 0 (0.0%) |
| Food Preparation & Serving | 14 (27.5%) | 37 (72.6%) |
| Cleaning & Maintenance | 22 (52.4%) | 20 (47.6%) |
| Personal Care & Service | 0 (0.0%) | 10 (100.0%) |
| Total (Category) | 36 (29.7%) | 85 (70.3%) |
| Total (Overall) | 551 (50.9%) | 531 (49.1%) |
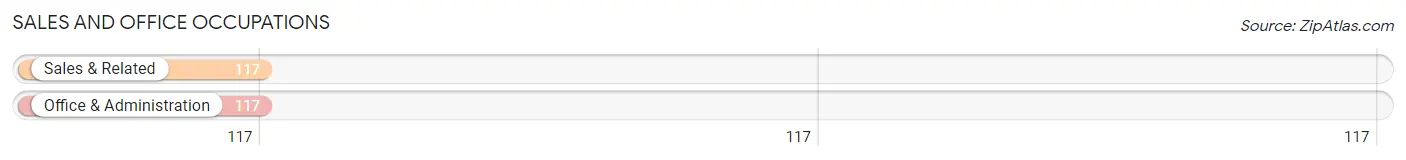
Sales and Office Occupations
The most common Sales and Office occupations in Mediapolis are Sales & Related (117 | 10.8%), and Office & Administration (117 | 10.8%).
Sales and Office Occupations by Sex
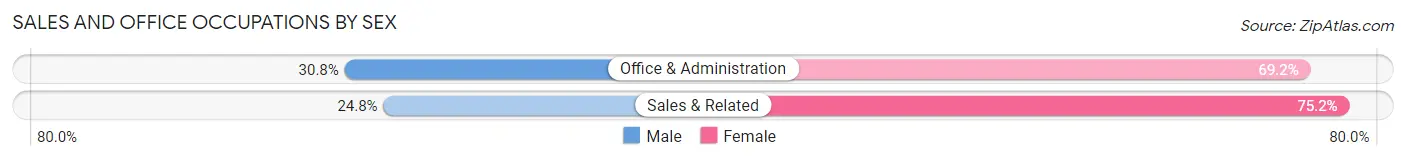
| Occupation | Male | Female |
| Sales & Related | 29 (24.8%) | 88 (75.2%) |
| Office & Administration | 36 (30.8%) | 81 (69.2%) |
| Total (Category) | 65 (27.8%) | 169 (72.2%) |
| Total (Overall) | 551 (50.9%) | 531 (49.1%) |
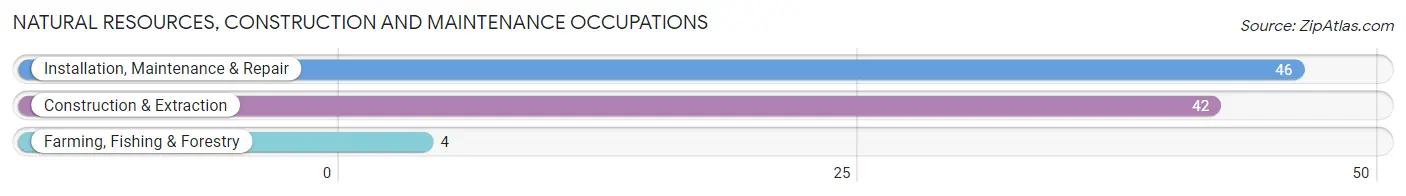
Natural Resources, Construction and Maintenance Occupations
The most common Natural Resources, Construction and Maintenance occupations in Mediapolis are Installation, Maintenance & Repair (46 | 4.3%), Construction & Extraction (42 | 3.9%), and Farming, Fishing & Forestry (4 | 0.4%).
Natural Resources, Construction and Maintenance Occupations by Sex
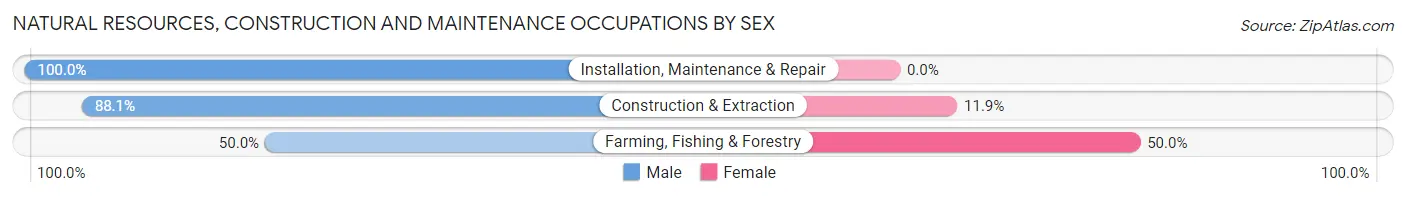
| Occupation | Male | Female |
| Farming, Fishing & Forestry | 2 (50.0%) | 2 (50.0%) |
| Construction & Extraction | 37 (88.1%) | 5 (11.9%) |
| Installation, Maintenance & Repair | 46 (100.0%) | 0 (0.0%) |
| Total (Category) | 85 (92.4%) | 7 (7.6%) |
| Total (Overall) | 551 (50.9%) | 531 (49.1%) |
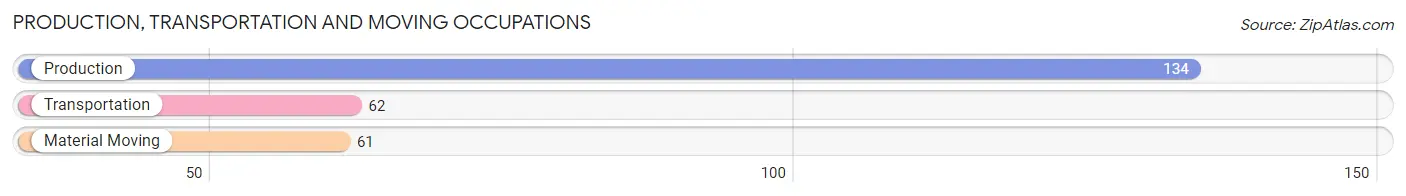
Production, Transportation and Moving Occupations
The most common Production, Transportation and Moving occupations in Mediapolis are Production (134 | 12.4%), Transportation (62 | 5.7%), and Material Moving (61 | 5.6%).
Production, Transportation and Moving Occupations by Sex
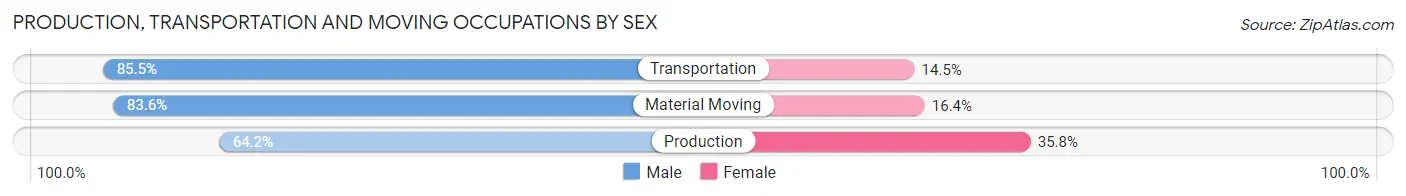
| Occupation | Male | Female |
| Production | 86 (64.2%) | 48 (35.8%) |
| Transportation | 53 (85.5%) | 9 (14.5%) |
| Material Moving | 51 (83.6%) | 10 (16.4%) |
| Total (Category) | 190 (73.9%) | 67 (26.1%) |
| Total (Overall) | 551 (50.9%) | 531 (49.1%) |
Employment Industries by Sex in Mediapolis
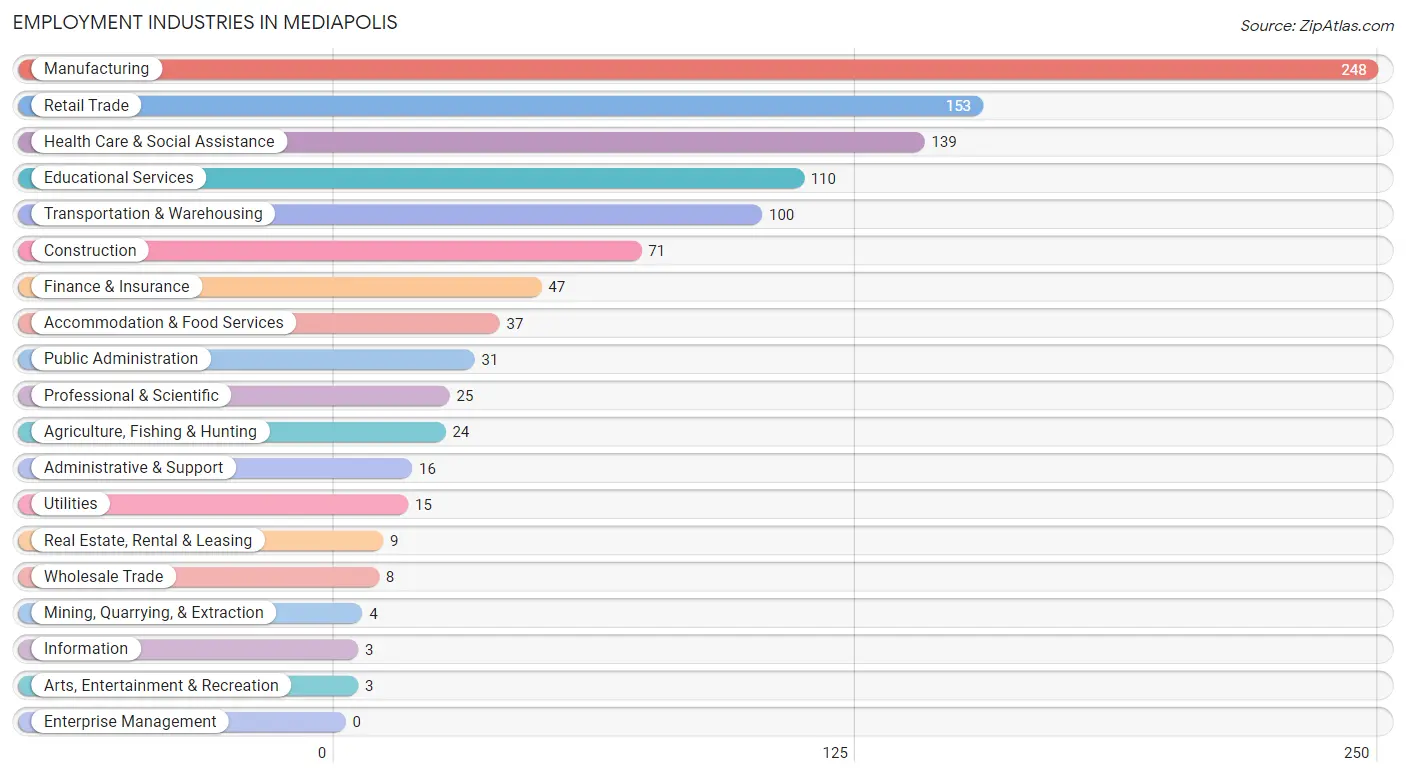
Employment Industries in Mediapolis
The major employment industries in Mediapolis include Manufacturing (248 | 22.9%), Retail Trade (153 | 14.1%), Health Care & Social Assistance (139 | 12.9%), Educational Services (110 | 10.2%), and Transportation & Warehousing (100 | 9.2%).
Employment Industries by Sex in Mediapolis
The Mediapolis industries that see more men than women are Mining, Quarrying, & Extraction (100.0%), Administrative & Support (87.5%), and Construction (84.5%), whereas the industries that tend to have a higher number of women are Information (100.0%), Arts, Entertainment & Recreation (100.0%), and Real Estate, Rental & Leasing (77.8%).
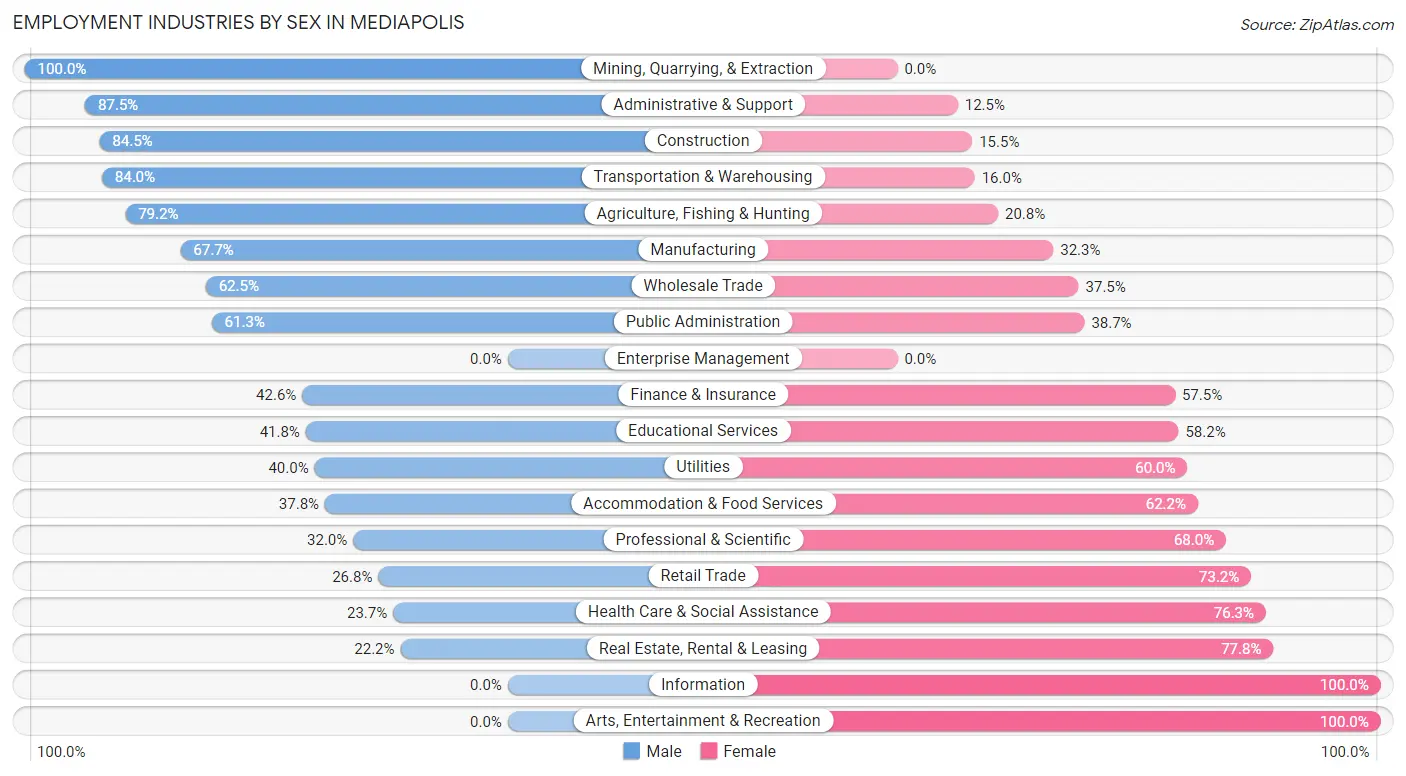
| Industry | Male | Female |
| Agriculture, Fishing & Hunting | 19 (79.2%) | 5 (20.8%) |
| Mining, Quarrying, & Extraction | 4 (100.0%) | 0 (0.0%) |
| Construction | 60 (84.5%) | 11 (15.5%) |
| Manufacturing | 168 (67.7%) | 80 (32.3%) |
| Wholesale Trade | 5 (62.5%) | 3 (37.5%) |
| Retail Trade | 41 (26.8%) | 112 (73.2%) |
| Transportation & Warehousing | 84 (84.0%) | 16 (16.0%) |
| Utilities | 6 (40.0%) | 9 (60.0%) |
| Information | 0 (0.0%) | 3 (100.0%) |
| Finance & Insurance | 20 (42.5%) | 27 (57.5%) |
| Real Estate, Rental & Leasing | 2 (22.2%) | 7 (77.8%) |
| Professional & Scientific | 8 (32.0%) | 17 (68.0%) |
| Enterprise Management | 0 (0.0%) | 0 (0.0%) |
| Administrative & Support | 14 (87.5%) | 2 (12.5%) |
| Educational Services | 46 (41.8%) | 64 (58.2%) |
| Health Care & Social Assistance | 33 (23.7%) | 106 (76.3%) |
| Arts, Entertainment & Recreation | 0 (0.0%) | 3 (100.0%) |
| Accommodation & Food Services | 14 (37.8%) | 23 (62.2%) |
| Public Administration | 19 (61.3%) | 12 (38.7%) |
| Total | 551 (50.9%) | 531 (49.1%) |
Education in Mediapolis
School Enrollment in Mediapolis
The most common levels of schooling among the 492 students in Mediapolis are elementary school (135 | 27.4%), high school (123 | 25.0%), and middle school (112 | 22.8%).
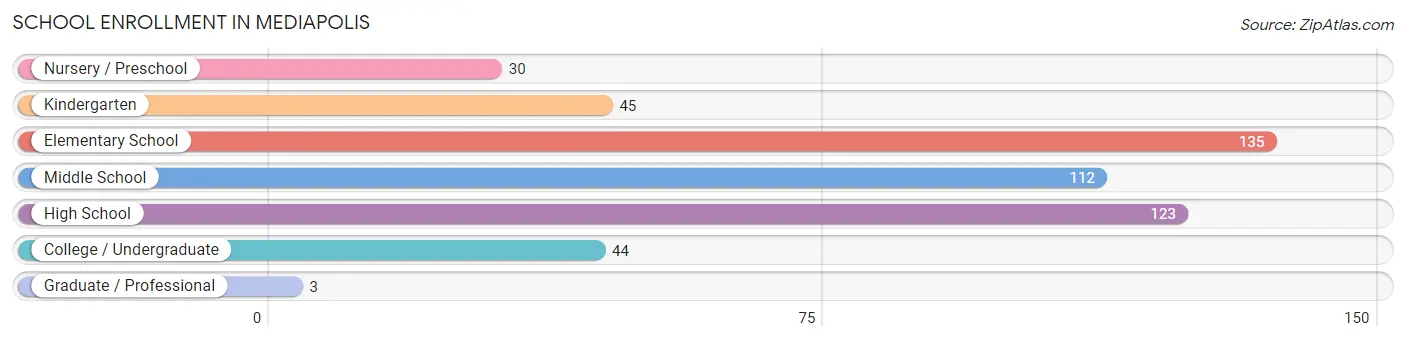
| School Level | # Students | % Students |
| Nursery / Preschool | 30 | 6.1% |
| Kindergarten | 45 | 9.1% |
| Elementary School | 135 | 27.4% |
| Middle School | 112 | 22.8% |
| High School | 123 | 25.0% |
| College / Undergraduate | 44 | 8.9% |
| Graduate / Professional | 3 | 0.6% |
| Total | 492 | 100.0% |
School Enrollment by Age by Funding Source in Mediapolis
Out of a total of 492 students who are enrolled in schools in Mediapolis, 64 (13.0%) attend a private institution, while the remaining 428 (87.0%) are enrolled in public schools. The age group of 3 to 4 year olds has the highest likelihood of being enrolled in private schools, with 10 (55.6% in the age bracket) enrolled. Conversely, the age group of 15 to 17 year olds has the lowest likelihood of being enrolled in a private school, with 107 (100.0% in the age bracket) attending a public institution.
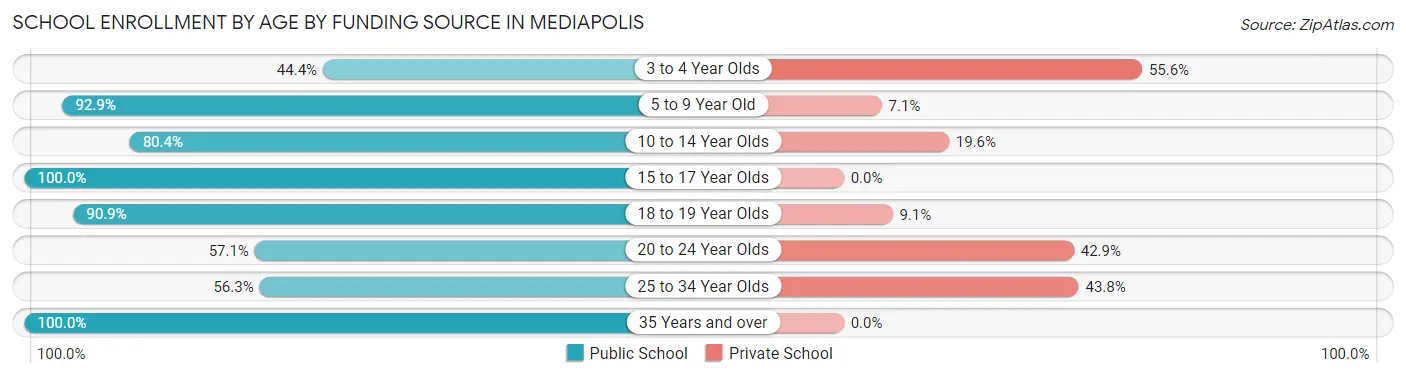
| Age Bracket | Public School | Private School |
| 3 to 4 Year Olds | 8 (44.4%) | 10 (55.6%) |
| 5 to 9 Year Old | 158 (92.9%) | 12 (7.1%) |
| 10 to 14 Year Olds | 115 (80.4%) | 28 (19.6%) |
| 15 to 17 Year Olds | 107 (100.0%) | 0 (0.0%) |
| 18 to 19 Year Olds | 10 (90.9%) | 1 (9.1%) |
| 20 to 24 Year Olds | 8 (57.1%) | 6 (42.9%) |
| 25 to 34 Year Olds | 9 (56.2%) | 7 (43.8%) |
| 35 Years and over | 13 (100.0%) | 0 (0.0%) |
| Total | 428 (87.0%) | 64 (13.0%) |
Educational Attainment by Field of Study in Mediapolis
Education (103 | 18.2%), business (99 | 17.5%), bio, nature & agricultural (97 | 17.1%), engineering (74 | 13.1%), and physical & health sciences (43 | 7.6%) are the most common fields of study among 566 individuals in Mediapolis who have obtained a bachelor's degree or higher.
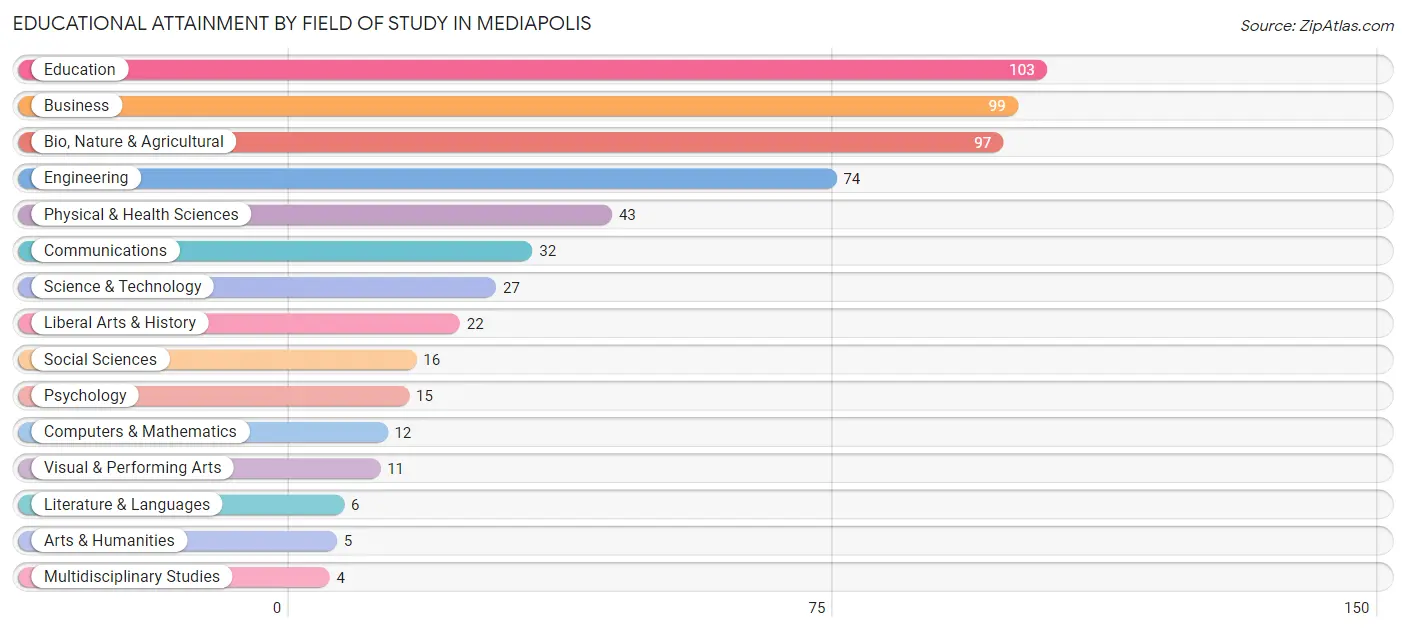
| Field of Study | # Graduates | % Graduates |
| Computers & Mathematics | 12 | 2.1% |
| Bio, Nature & Agricultural | 97 | 17.1% |
| Physical & Health Sciences | 43 | 7.6% |
| Psychology | 15 | 2.6% |
| Social Sciences | 16 | 2.8% |
| Engineering | 74 | 13.1% |
| Multidisciplinary Studies | 4 | 0.7% |
| Science & Technology | 27 | 4.8% |
| Business | 99 | 17.5% |
| Education | 103 | 18.2% |
| Literature & Languages | 6 | 1.1% |
| Liberal Arts & History | 22 | 3.9% |
| Visual & Performing Arts | 11 | 1.9% |
| Communications | 32 | 5.7% |
| Arts & Humanities | 5 | 0.9% |
| Total | 566 | 100.0% |
Transportation & Commute in Mediapolis
Vehicle Availability by Sex in Mediapolis
The most prevalent vehicle ownership categories in Mediapolis are males with 2 vehicles (201, accounting for 37.4%) and females with 2 vehicles (146, making up 40.4%).
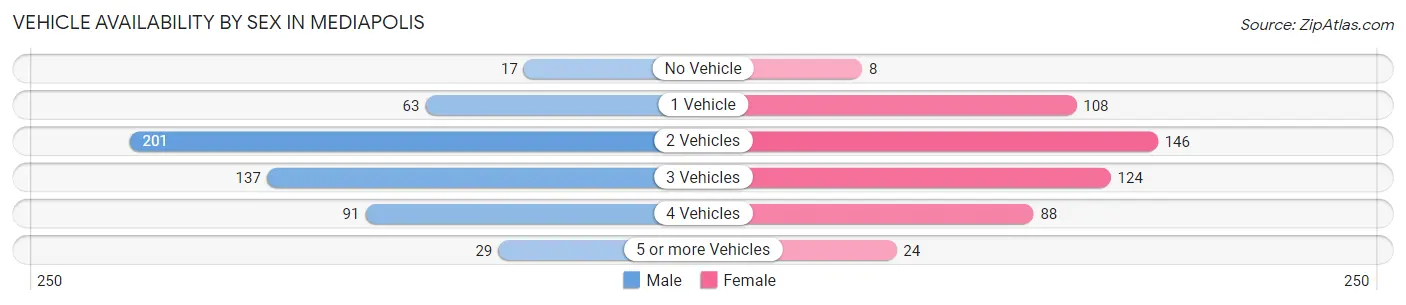
| Vehicles Available | Male | Female |
| No Vehicle | 17 (3.2%) | 8 (1.6%) |
| 1 Vehicle | 63 (11.7%) | 108 (21.7%) |
| 2 Vehicles | 201 (37.4%) | 146 (29.3%) |
| 3 Vehicles | 137 (25.5%) | 124 (24.9%) |
| 4 Vehicles | 91 (16.9%) | 88 (17.7%) |
| 5 or more Vehicles | 29 (5.4%) | 24 (4.8%) |
| Total | 538 (100.0%) | 498 (100.0%) |
Commute Time in Mediapolis
The most frequently occuring commute durations in Mediapolis are 20 to 24 minutes (162 commuters, 16.8%), less than 5 minutes (157 commuters, 16.3%), and 5 to 9 minutes (134 commuters, 13.9%).
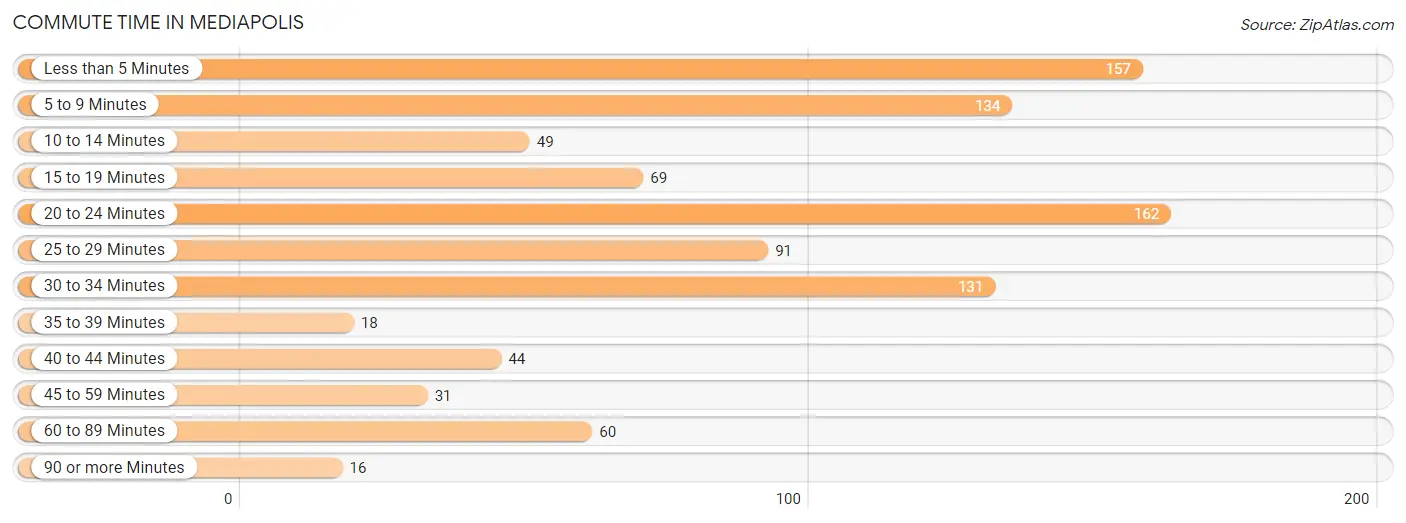
| Commute Time | # Commuters | % Commuters |
| Less than 5 Minutes | 157 | 16.3% |
| 5 to 9 Minutes | 134 | 13.9% |
| 10 to 14 Minutes | 49 | 5.1% |
| 15 to 19 Minutes | 69 | 7.2% |
| 20 to 24 Minutes | 162 | 16.8% |
| 25 to 29 Minutes | 91 | 9.5% |
| 30 to 34 Minutes | 131 | 13.6% |
| 35 to 39 Minutes | 18 | 1.9% |
| 40 to 44 Minutes | 44 | 4.6% |
| 45 to 59 Minutes | 31 | 3.2% |
| 60 to 89 Minutes | 60 | 6.2% |
| 90 or more Minutes | 16 | 1.7% |
Commute Time by Sex in Mediapolis
The most common commute times in Mediapolis are 5 to 9 minutes (73 commuters, 14.7%) for males and 20 to 24 minutes (101 commuters, 21.7%) for females.
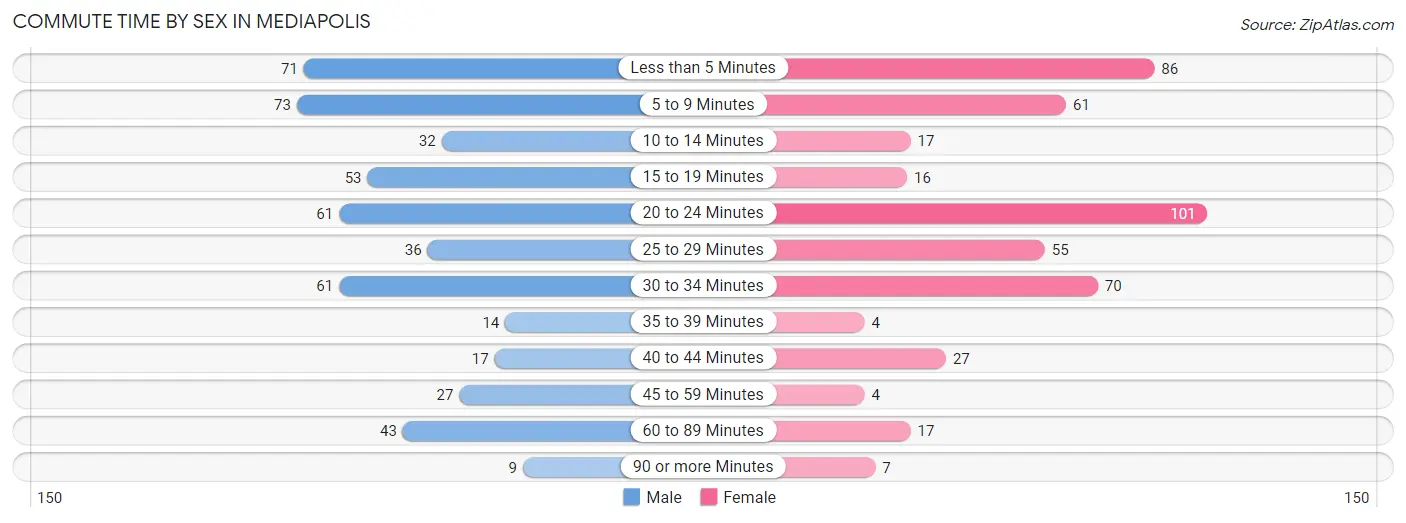
| Commute Time | Male | Female |
| Less than 5 Minutes | 71 (14.3%) | 86 (18.5%) |
| 5 to 9 Minutes | 73 (14.7%) | 61 (13.1%) |
| 10 to 14 Minutes | 32 (6.4%) | 17 (3.7%) |
| 15 to 19 Minutes | 53 (10.7%) | 16 (3.4%) |
| 20 to 24 Minutes | 61 (12.3%) | 101 (21.7%) |
| 25 to 29 Minutes | 36 (7.2%) | 55 (11.8%) |
| 30 to 34 Minutes | 61 (12.3%) | 70 (15.0%) |
| 35 to 39 Minutes | 14 (2.8%) | 4 (0.9%) |
| 40 to 44 Minutes | 17 (3.4%) | 27 (5.8%) |
| 45 to 59 Minutes | 27 (5.4%) | 4 (0.9%) |
| 60 to 89 Minutes | 43 (8.6%) | 17 (3.7%) |
| 90 or more Minutes | 9 (1.8%) | 7 (1.5%) |
Time of Departure to Work by Sex in Mediapolis
The most frequent times of departure to work in Mediapolis are 7:00 AM to 7:29 AM (138, 27.8%) for males and 8:00 AM to 8:29 AM (92, 19.8%) for females.
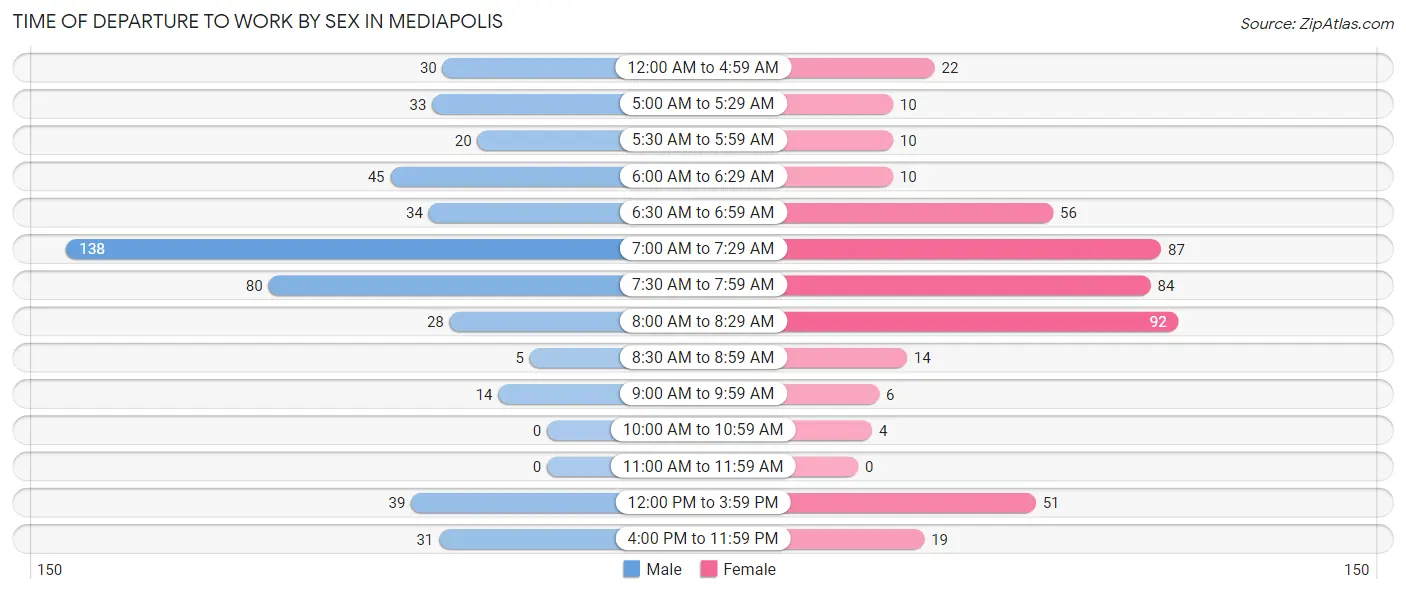
| Time of Departure | Male | Female |
| 12:00 AM to 4:59 AM | 30 (6.0%) | 22 (4.7%) |
| 5:00 AM to 5:29 AM | 33 (6.6%) | 10 (2.1%) |
| 5:30 AM to 5:59 AM | 20 (4.0%) | 10 (2.1%) |
| 6:00 AM to 6:29 AM | 45 (9.0%) | 10 (2.1%) |
| 6:30 AM to 6:59 AM | 34 (6.8%) | 56 (12.0%) |
| 7:00 AM to 7:29 AM | 138 (27.8%) | 87 (18.7%) |
| 7:30 AM to 7:59 AM | 80 (16.1%) | 84 (18.1%) |
| 8:00 AM to 8:29 AM | 28 (5.6%) | 92 (19.8%) |
| 8:30 AM to 8:59 AM | 5 (1.0%) | 14 (3.0%) |
| 9:00 AM to 9:59 AM | 14 (2.8%) | 6 (1.3%) |
| 10:00 AM to 10:59 AM | 0 (0.0%) | 4 (0.9%) |
| 11:00 AM to 11:59 AM | 0 (0.0%) | 0 (0.0%) |
| 12:00 PM to 3:59 PM | 39 (7.9%) | 51 (11.0%) |
| 4:00 PM to 11:59 PM | 31 (6.2%) | 19 (4.1%) |
| Total | 497 (100.0%) | 465 (100.0%) |
Housing Occupancy in Mediapolis
Occupancy by Ownership in Mediapolis
Of the total 857 dwellings in Mediapolis, owner-occupied units account for 625 (72.9%), while renter-occupied units make up 232 (27.1%).
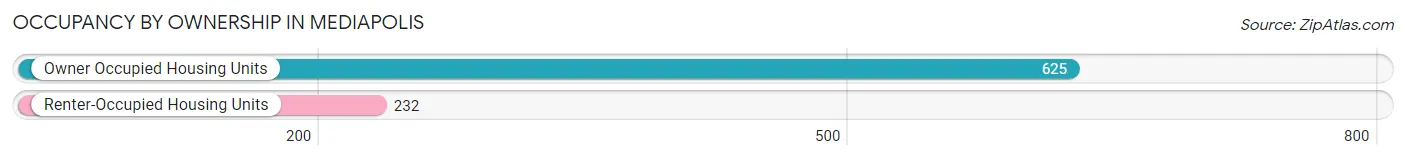
| Occupancy | # Housing Units | % Housing Units |
| Owner Occupied Housing Units | 625 | 72.9% |
| Renter-Occupied Housing Units | 232 | 27.1% |
| Total Occupied Housing Units | 857 | 100.0% |
Occupancy by Household Size in Mediapolis
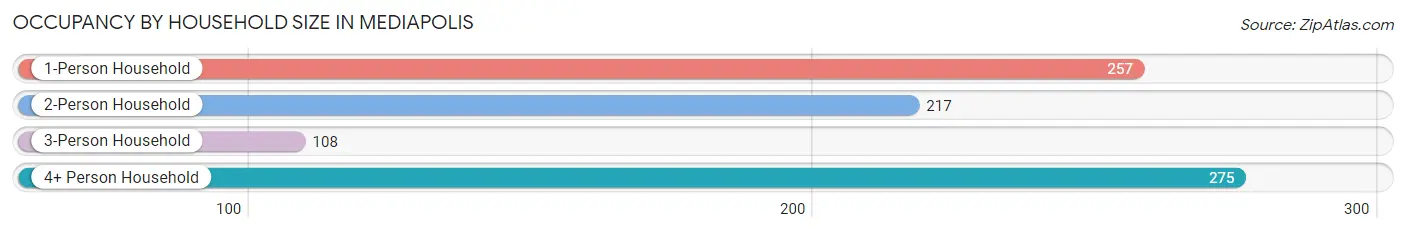
| Household Size | # Housing Units | % Housing Units |
| 1-Person Household | 257 | 30.0% |
| 2-Person Household | 217 | 25.3% |
| 3-Person Household | 108 | 12.6% |
| 4+ Person Household | 275 | 32.1% |
| Total Housing Units | 857 | 100.0% |
Occupancy by Ownership by Household Size in Mediapolis
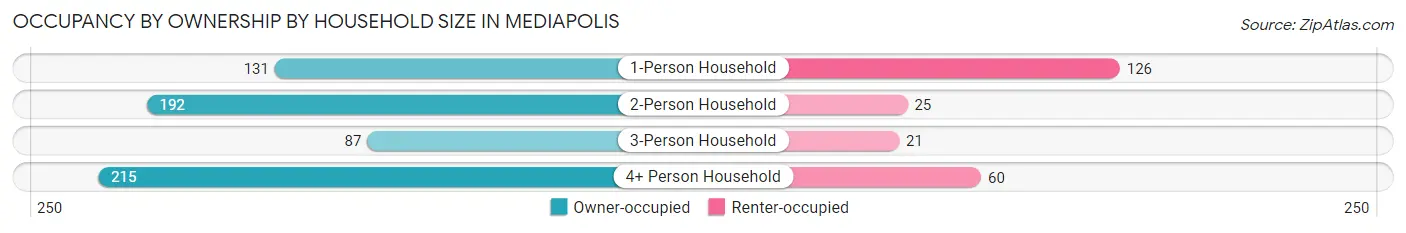
| Household Size | Owner-occupied | Renter-occupied |
| 1-Person Household | 131 (51.0%) | 126 (49.0%) |
| 2-Person Household | 192 (88.5%) | 25 (11.5%) |
| 3-Person Household | 87 (80.6%) | 21 (19.4%) |
| 4+ Person Household | 215 (78.2%) | 60 (21.8%) |
| Total Housing Units | 625 (72.9%) | 232 (27.1%) |
Occupancy by Educational Attainment in Mediapolis
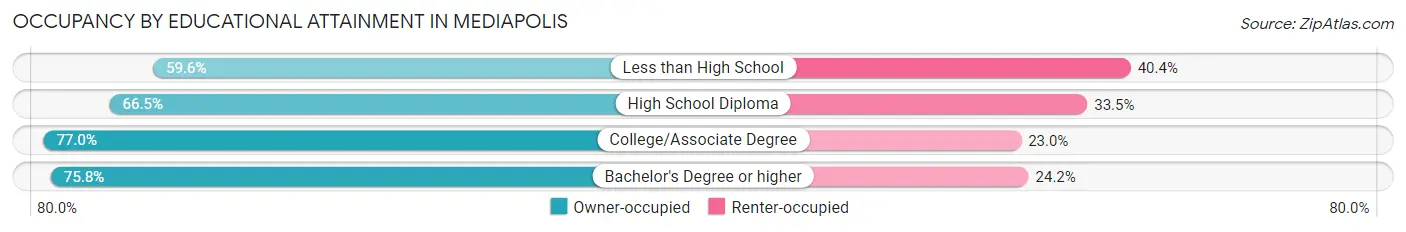
| Household Size | Owner-occupied | Renter-occupied |
| Less than High School | 31 (59.6%) | 21 (40.4%) |
| High School Diploma | 141 (66.5%) | 71 (33.5%) |
| College/Associate Degree | 221 (77.0%) | 66 (23.0%) |
| Bachelor's Degree or higher | 232 (75.8%) | 74 (24.2%) |
Occupancy by Age of Householder in Mediapolis
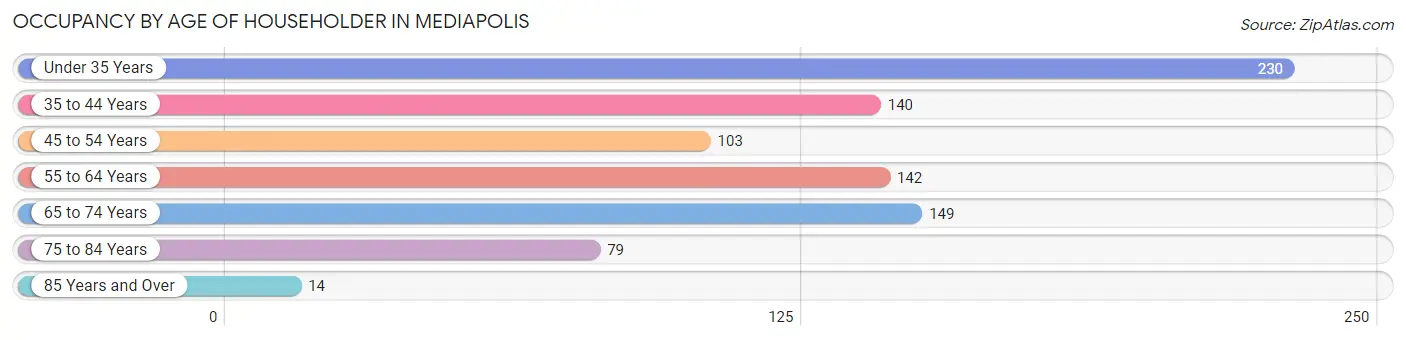
| Age Bracket | # Households | % Households |
| Under 35 Years | 230 | 26.8% |
| 35 to 44 Years | 140 | 16.3% |
| 45 to 54 Years | 103 | 12.0% |
| 55 to 64 Years | 142 | 16.6% |
| 65 to 74 Years | 149 | 17.4% |
| 75 to 84 Years | 79 | 9.2% |
| 85 Years and Over | 14 | 1.6% |
| Total | 857 | 100.0% |
Housing Finances in Mediapolis
Median Income by Occupancy in Mediapolis
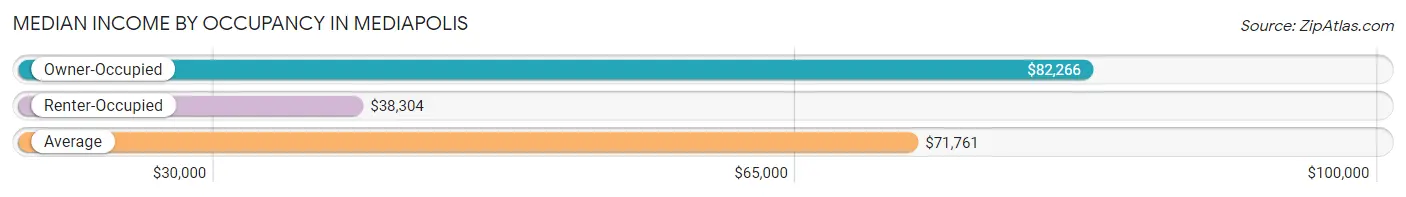
| Occupancy Type | # Households | Median Income |
| Owner-Occupied | 625 (72.9%) | $82,266 |
| Renter-Occupied | 232 (27.1%) | $38,304 |
| Average | 857 (100.0%) | $71,761 |
Occupancy by Householder Income Bracket in Mediapolis
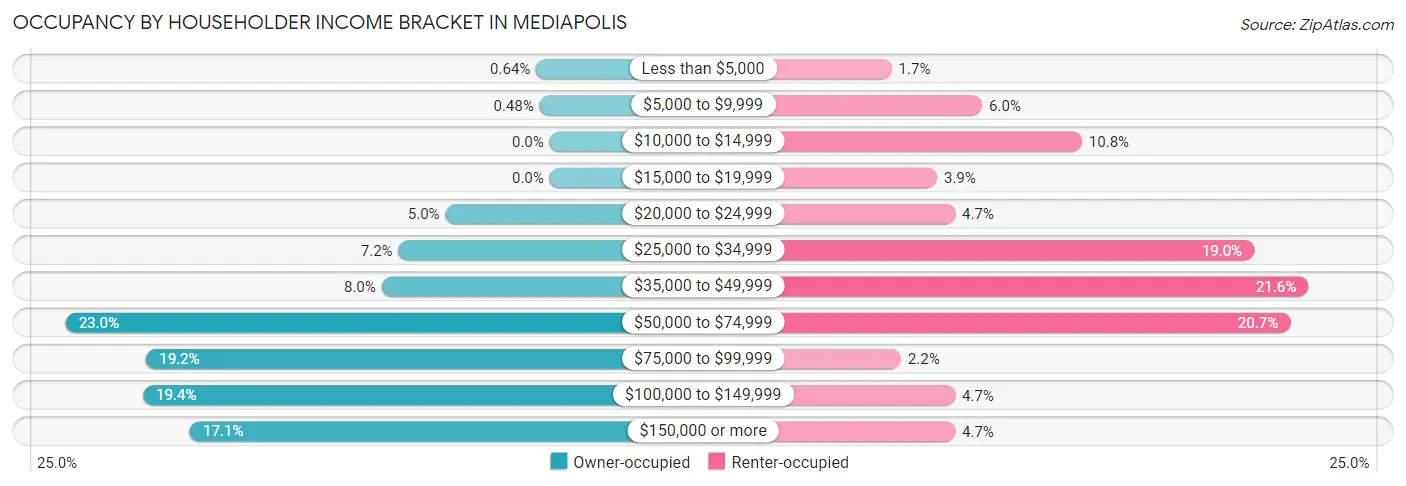
| Income Bracket | Owner-occupied | Renter-occupied |
| Less than $5,000 | 4 (0.6%) | 4 (1.7%) |
| $5,000 to $9,999 | 3 (0.5%) | 14 (6.0%) |
| $10,000 to $14,999 | 0 (0.0%) | 25 (10.8%) |
| $15,000 to $19,999 | 0 (0.0%) | 9 (3.9%) |
| $20,000 to $24,999 | 31 (5.0%) | 11 (4.7%) |
| $25,000 to $34,999 | 45 (7.2%) | 44 (19.0%) |
| $35,000 to $49,999 | 50 (8.0%) | 50 (21.5%) |
| $50,000 to $74,999 | 144 (23.0%) | 48 (20.7%) |
| $75,000 to $99,999 | 120 (19.2%) | 5 (2.2%) |
| $100,000 to $149,999 | 121 (19.4%) | 11 (4.7%) |
| $150,000 or more | 107 (17.1%) | 11 (4.7%) |
| Total | 625 (100.0%) | 232 (100.0%) |
Monthly Housing Cost Tiers in Mediapolis
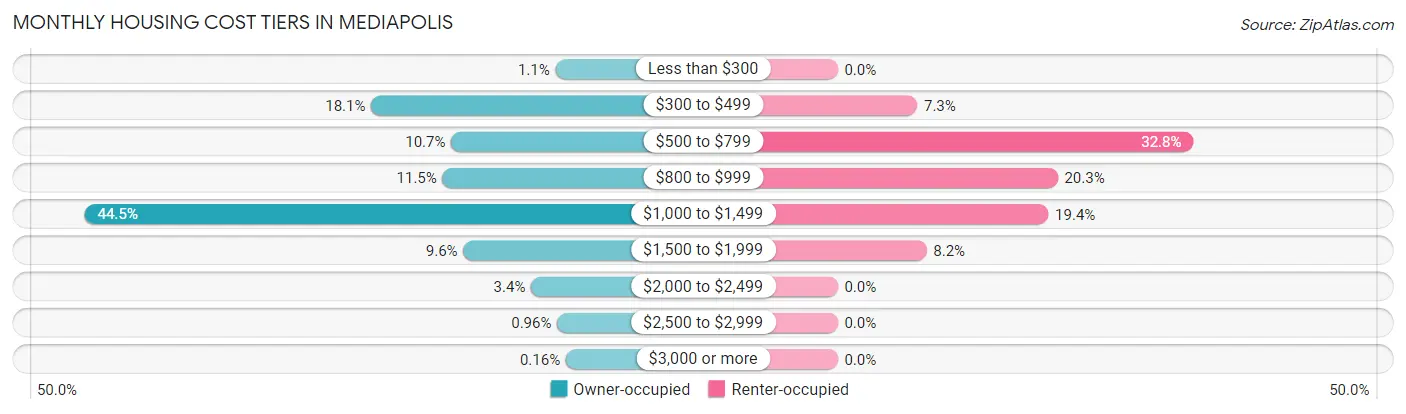
| Monthly Cost | Owner-occupied | Renter-occupied |
| Less than $300 | 7 (1.1%) | 0 (0.0%) |
| $300 to $499 | 113 (18.1%) | 17 (7.3%) |
| $500 to $799 | 67 (10.7%) | 76 (32.8%) |
| $800 to $999 | 72 (11.5%) | 47 (20.3%) |
| $1,000 to $1,499 | 278 (44.5%) | 45 (19.4%) |
| $1,500 to $1,999 | 60 (9.6%) | 19 (8.2%) |
| $2,000 to $2,499 | 21 (3.4%) | 0 (0.0%) |
| $2,500 to $2,999 | 6 (1.0%) | 0 (0.0%) |
| $3,000 or more | 1 (0.2%) | 0 (0.0%) |
| Total | 625 (100.0%) | 232 (100.0%) |
Physical Housing Characteristics in Mediapolis
Housing Structures in Mediapolis
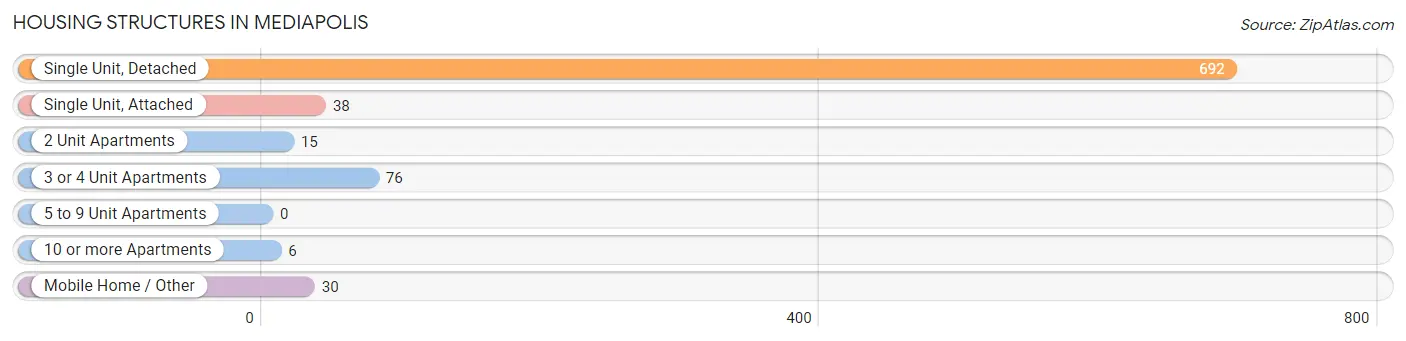
| Structure Type | # Housing Units | % Housing Units |
| Single Unit, Detached | 692 | 80.7% |
| Single Unit, Attached | 38 | 4.4% |
| 2 Unit Apartments | 15 | 1.8% |
| 3 or 4 Unit Apartments | 76 | 8.9% |
| 5 to 9 Unit Apartments | 0 | 0.0% |
| 10 or more Apartments | 6 | 0.7% |
| Mobile Home / Other | 30 | 3.5% |
| Total | 857 | 100.0% |
Housing Structures by Occupancy in Mediapolis
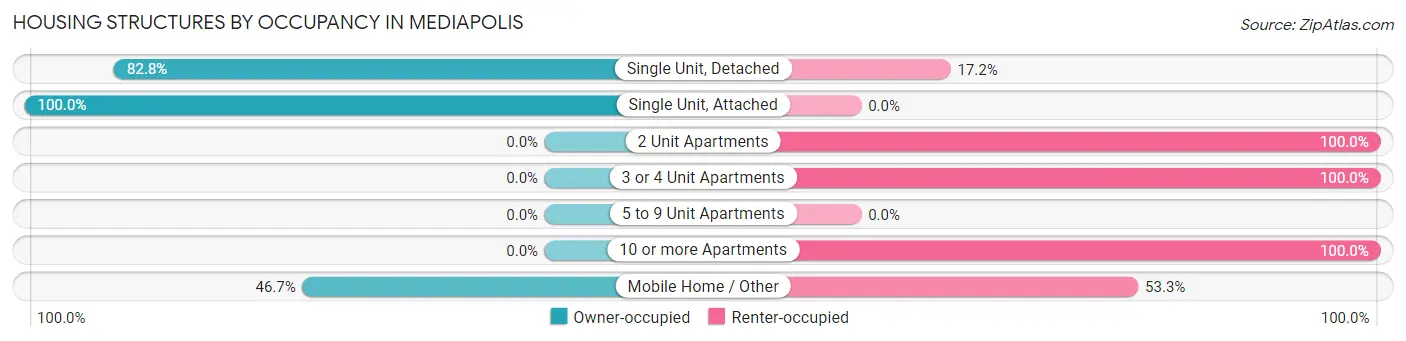
| Structure Type | Owner-occupied | Renter-occupied |
| Single Unit, Detached | 573 (82.8%) | 119 (17.2%) |
| Single Unit, Attached | 38 (100.0%) | 0 (0.0%) |
| 2 Unit Apartments | 0 (0.0%) | 15 (100.0%) |
| 3 or 4 Unit Apartments | 0 (0.0%) | 76 (100.0%) |
| 5 to 9 Unit Apartments | 0 (0.0%) | 0 (0.0%) |
| 10 or more Apartments | 0 (0.0%) | 6 (100.0%) |
| Mobile Home / Other | 14 (46.7%) | 16 (53.3%) |
| Total | 625 (72.9%) | 232 (27.1%) |
Housing Structures by Number of Rooms in Mediapolis
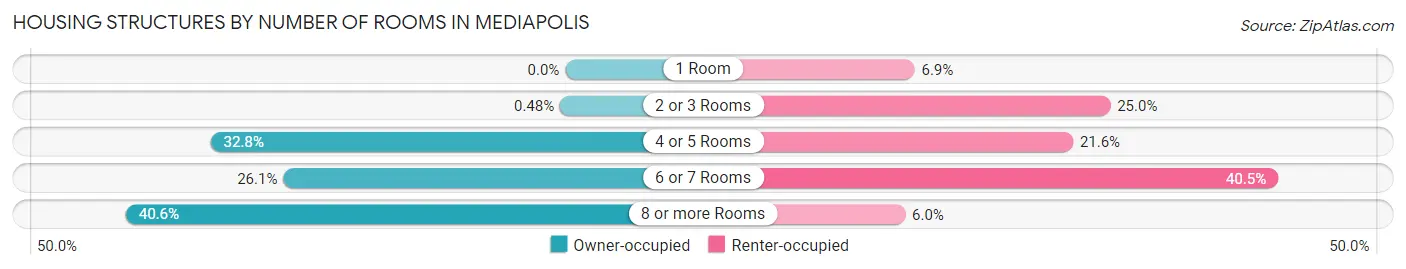
| Number of Rooms | Owner-occupied | Renter-occupied |
| 1 Room | 0 (0.0%) | 16 (6.9%) |
| 2 or 3 Rooms | 3 (0.5%) | 58 (25.0%) |
| 4 or 5 Rooms | 205 (32.8%) | 50 (21.5%) |
| 6 or 7 Rooms | 163 (26.1%) | 94 (40.5%) |
| 8 or more Rooms | 254 (40.6%) | 14 (6.0%) |
| Total | 625 (100.0%) | 232 (100.0%) |
Housing Structure by Heating Type in Mediapolis
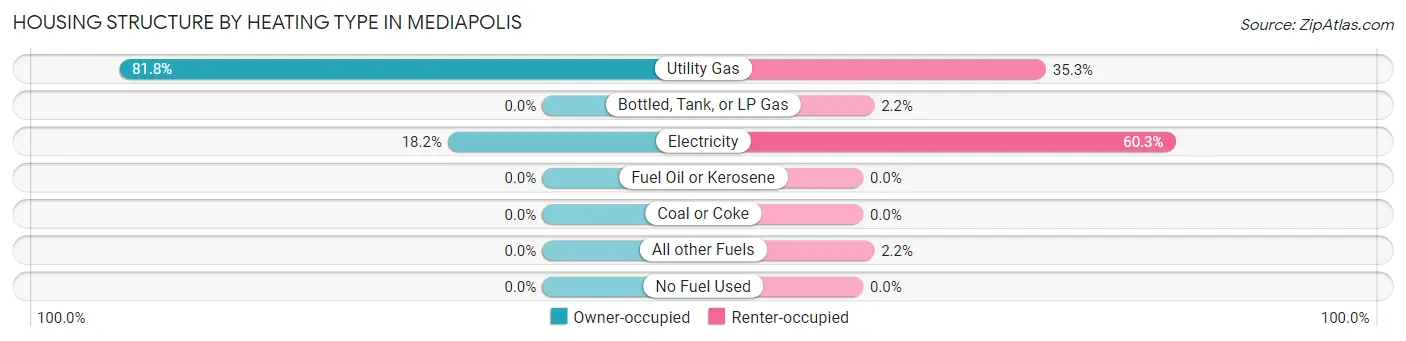
| Heating Type | Owner-occupied | Renter-occupied |
| Utility Gas | 511 (81.8%) | 82 (35.3%) |
| Bottled, Tank, or LP Gas | 0 (0.0%) | 5 (2.2%) |
| Electricity | 114 (18.2%) | 140 (60.3%) |
| Fuel Oil or Kerosene | 0 (0.0%) | 0 (0.0%) |
| Coal or Coke | 0 (0.0%) | 0 (0.0%) |
| All other Fuels | 0 (0.0%) | 5 (2.2%) |
| No Fuel Used | 0 (0.0%) | 0 (0.0%) |
| Total | 625 (100.0%) | 232 (100.0%) |
Household Vehicle Usage in Mediapolis
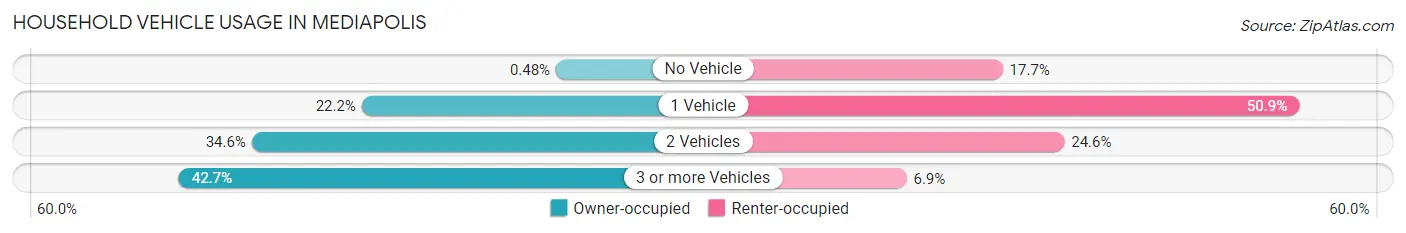
| Vehicles per Household | Owner-occupied | Renter-occupied |
| No Vehicle | 3 (0.5%) | 41 (17.7%) |
| 1 Vehicle | 139 (22.2%) | 118 (50.9%) |
| 2 Vehicles | 216 (34.6%) | 57 (24.6%) |
| 3 or more Vehicles | 267 (42.7%) | 16 (6.9%) |
| Total | 625 (100.0%) | 232 (100.0%) |
Real Estate & Mortgages in Mediapolis
Real Estate and Mortgage Overview in Mediapolis
| Characteristic | Without Mortgage | With Mortgage |
| Housing Units | 191 | 434 |
| Median Property Value | $144,400 | $161,100 |
| Median Household Income | $64,583 | $89 |
| Monthly Housing Costs | $484 | $1 |
| Real Estate Taxes | $1,781 | $7 |
Property Value by Mortgage Status in Mediapolis
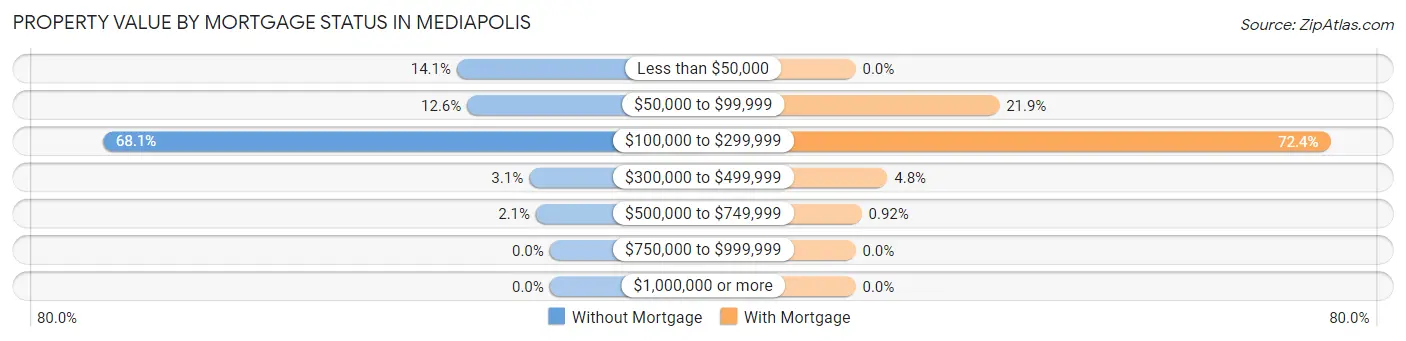
| Property Value | Without Mortgage | With Mortgage |
| Less than $50,000 | 27 (14.1%) | 0 (0.0%) |
| $50,000 to $99,999 | 24 (12.6%) | 95 (21.9%) |
| $100,000 to $299,999 | 130 (68.1%) | 314 (72.4%) |
| $300,000 to $499,999 | 6 (3.1%) | 21 (4.8%) |
| $500,000 to $749,999 | 4 (2.1%) | 4 (0.9%) |
| $750,000 to $999,999 | 0 (0.0%) | 0 (0.0%) |
| $1,000,000 or more | 0 (0.0%) | 0 (0.0%) |
| Total | 191 (100.0%) | 434 (100.0%) |
Household Income by Mortgage Status in Mediapolis
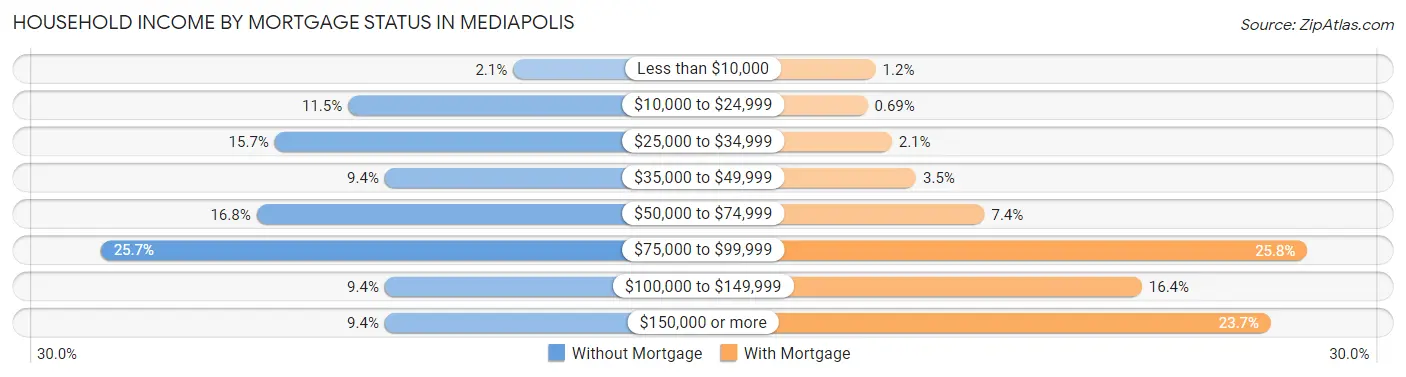
| Household Income | Without Mortgage | With Mortgage |
| Less than $10,000 | 4 (2.1%) | 5 (1.1%) |
| $10,000 to $24,999 | 22 (11.5%) | 3 (0.7%) |
| $25,000 to $34,999 | 30 (15.7%) | 9 (2.1%) |
| $35,000 to $49,999 | 18 (9.4%) | 15 (3.5%) |
| $50,000 to $74,999 | 32 (16.8%) | 32 (7.4%) |
| $75,000 to $99,999 | 49 (25.7%) | 112 (25.8%) |
| $100,000 to $149,999 | 18 (9.4%) | 71 (16.4%) |
| $150,000 or more | 18 (9.4%) | 103 (23.7%) |
| Total | 191 (100.0%) | 434 (100.0%) |
Property Value to Household Income Ratio in Mediapolis
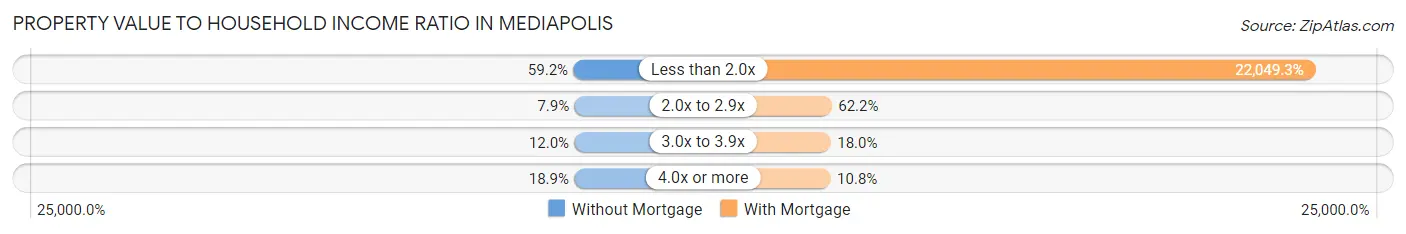
| Value-to-Income Ratio | Without Mortgage | With Mortgage |
| Less than 2.0x | 113 (59.2%) | 95,694 (22,049.3%) |
| 2.0x to 2.9x | 15 (7.9%) | 270 (62.2%) |
| 3.0x to 3.9x | 23 (12.0%) | 78 (18.0%) |
| 4.0x or more | 36 (18.9%) | 47 (10.8%) |
| Total | 191 (100.0%) | 434 (100.0%) |
Real Estate Taxes by Mortgage Status in Mediapolis
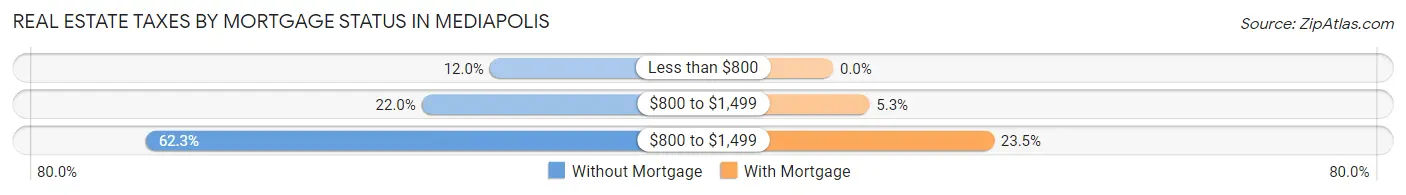
| Property Taxes | Without Mortgage | With Mortgage |
| Less than $800 | 23 (12.0%) | 0 (0.0%) |
| $800 to $1,499 | 42 (22.0%) | 23 (5.3%) |
| $800 to $1,499 | 119 (62.3%) | 102 (23.5%) |
| Total | 191 (100.0%) | 434 (100.0%) |
Health & Disability in Mediapolis
Health Insurance Coverage by Age in Mediapolis
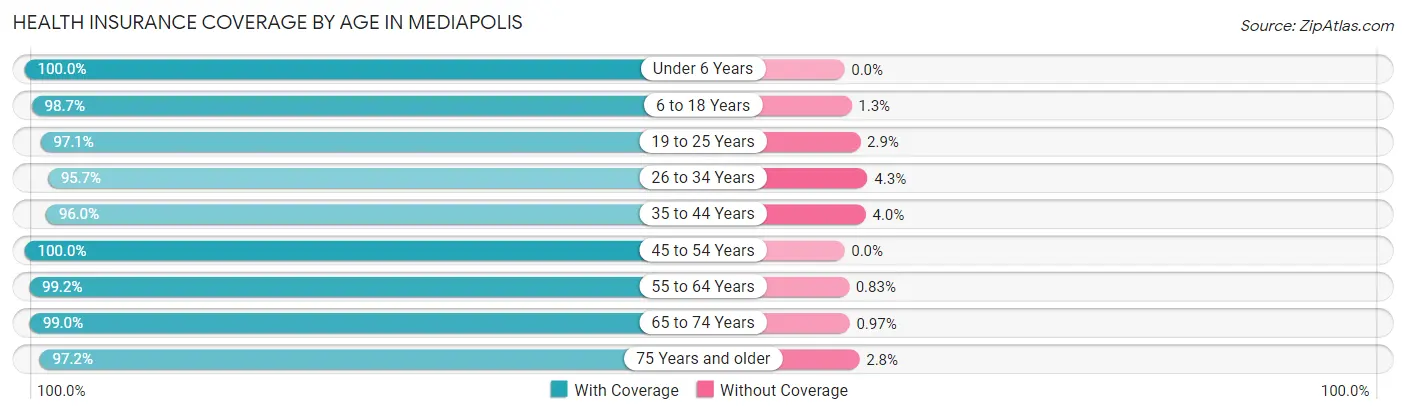
| Age Bracket | With Coverage | Without Coverage |
| Under 6 Years | 293 (100.0%) | 0 (0.0%) |
| 6 to 18 Years | 378 (98.7%) | 5 (1.3%) |
| 19 to 25 Years | 66 (97.1%) | 2 (2.9%) |
| 26 to 34 Years | 400 (95.7%) | 18 (4.3%) |
| 35 to 44 Years | 267 (96.0%) | 11 (4.0%) |
| 45 to 54 Years | 154 (100.0%) | 0 (0.0%) |
| 55 to 64 Years | 239 (99.2%) | 2 (0.8%) |
| 65 to 74 Years | 204 (99.0%) | 2 (1.0%) |
| 75 Years and older | 104 (97.2%) | 3 (2.8%) |
| Total | 2,105 (98.0%) | 43 (2.0%) |
Health Insurance Coverage by Citizenship Status in Mediapolis
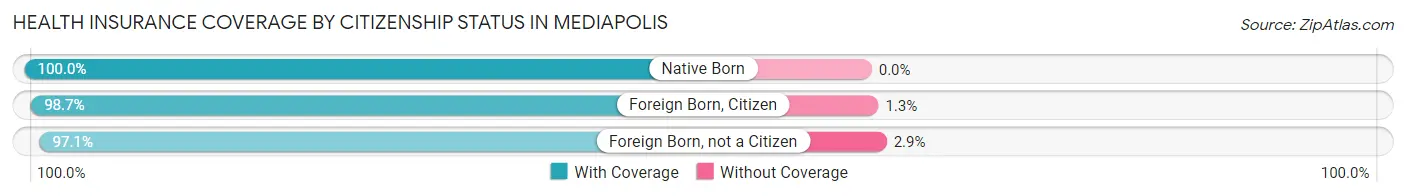
| Citizenship Status | With Coverage | Without Coverage |
| Native Born | 293 (100.0%) | 0 (0.0%) |
| Foreign Born, Citizen | 378 (98.7%) | 5 (1.3%) |
| Foreign Born, not a Citizen | 66 (97.1%) | 2 (2.9%) |
Health Insurance Coverage by Household Income in Mediapolis
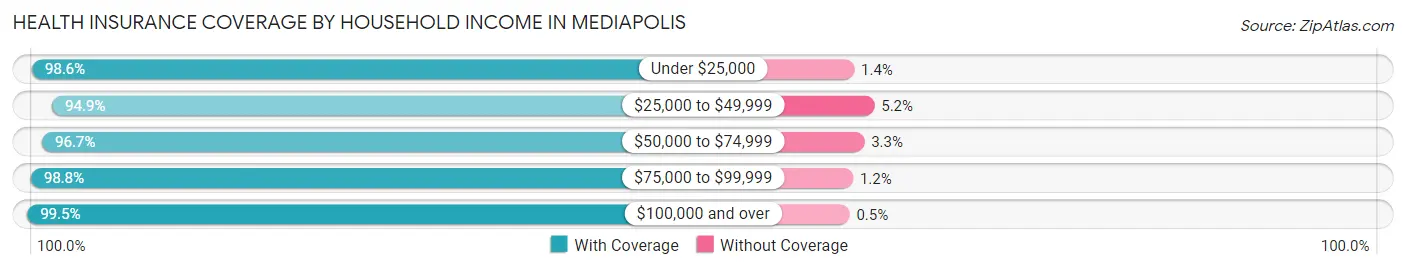
| Household Income | With Coverage | Without Coverage |
| Under $25,000 | 144 (98.6%) | 2 (1.4%) |
| $25,000 to $49,999 | 276 (94.9%) | 15 (5.1%) |
| $50,000 to $74,999 | 532 (96.7%) | 18 (3.3%) |
| $75,000 to $99,999 | 342 (98.8%) | 4 (1.2%) |
| $100,000 and over | 801 (99.5%) | 4 (0.5%) |
Public vs Private Health Insurance Coverage by Age in Mediapolis
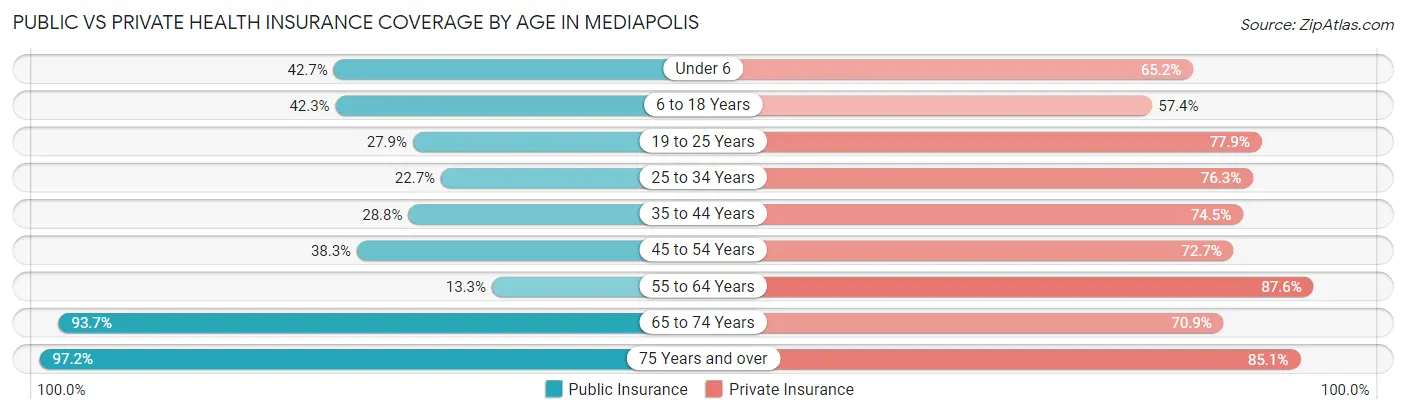
| Age Bracket | Public Insurance | Private Insurance |
| Under 6 | 125 (42.7%) | 191 (65.2%) |
| 6 to 18 Years | 162 (42.3%) | 220 (57.4%) |
| 19 to 25 Years | 19 (27.9%) | 53 (77.9%) |
| 25 to 34 Years | 95 (22.7%) | 319 (76.3%) |
| 35 to 44 Years | 80 (28.8%) | 207 (74.5%) |
| 45 to 54 Years | 59 (38.3%) | 112 (72.7%) |
| 55 to 64 Years | 32 (13.3%) | 211 (87.5%) |
| 65 to 74 Years | 193 (93.7%) | 146 (70.9%) |
| 75 Years and over | 104 (97.2%) | 91 (85.1%) |
| Total | 869 (40.5%) | 1,550 (72.2%) |
Disability Status by Sex by Age in Mediapolis
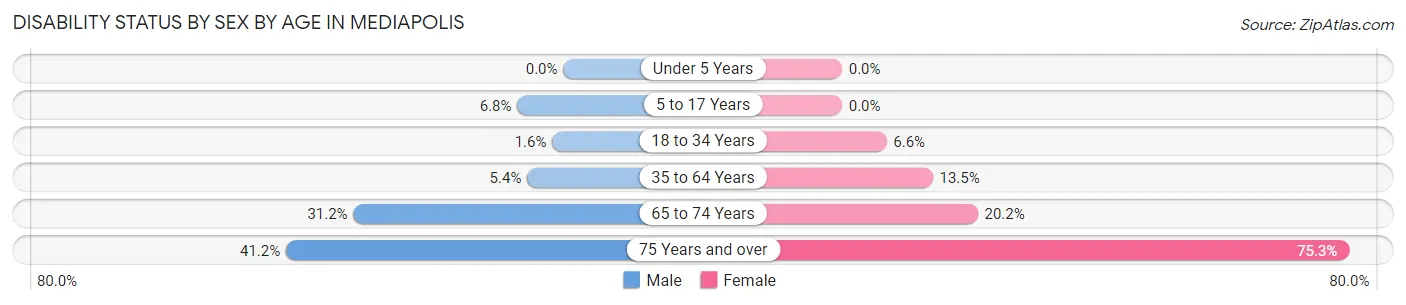
| Age Bracket | Male | Female |
| Under 5 Years | 0 (0.0%) | 0 (0.0%) |
| 5 to 17 Years | 20 (6.8%) | 0 (0.0%) |
| 18 to 34 Years | 4 (1.6%) | 16 (6.6%) |
| 35 to 64 Years | 17 (5.4%) | 48 (13.5%) |
| 65 to 74 Years | 24 (31.2%) | 26 (20.2%) |
| 75 Years and over | 14 (41.2%) | 55 (75.3%) |
Disability Class by Sex by Age in Mediapolis
Disability Class: Hearing Difficulty
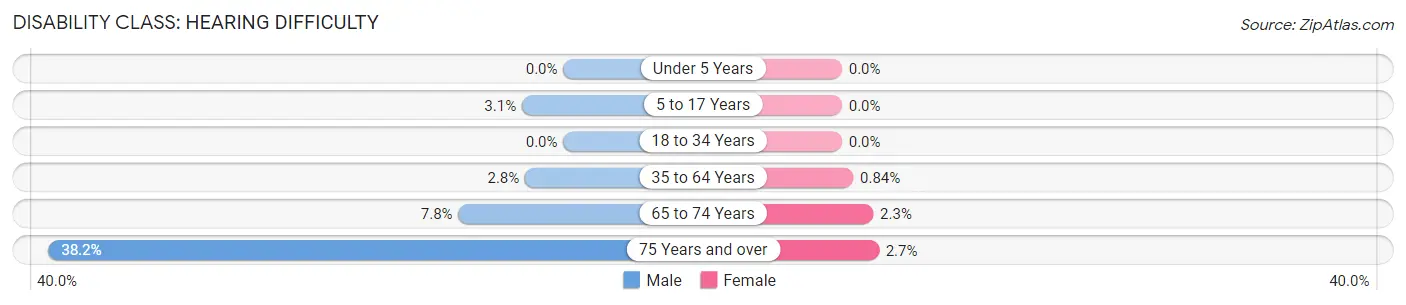
| Age Bracket | Male | Female |
| Under 5 Years | 0 (0.0%) | 0 (0.0%) |
| 5 to 17 Years | 9 (3.1%) | 0 (0.0%) |
| 18 to 34 Years | 0 (0.0%) | 0 (0.0%) |
| 35 to 64 Years | 9 (2.8%) | 3 (0.8%) |
| 65 to 74 Years | 6 (7.8%) | 3 (2.3%) |
| 75 Years and over | 13 (38.2%) | 2 (2.7%) |
Disability Class: Vision Difficulty
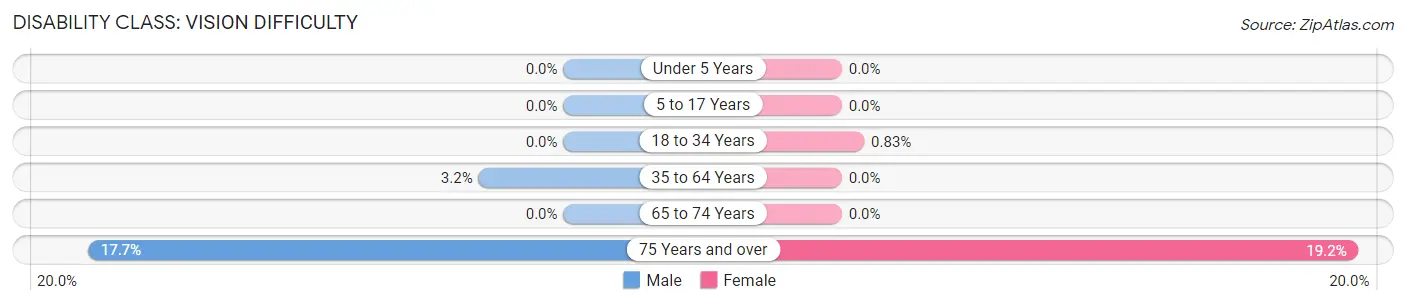
| Age Bracket | Male | Female |
| Under 5 Years | 0 (0.0%) | 0 (0.0%) |
| 5 to 17 Years | 0 (0.0%) | 0 (0.0%) |
| 18 to 34 Years | 0 (0.0%) | 2 (0.8%) |
| 35 to 64 Years | 10 (3.2%) | 0 (0.0%) |
| 65 to 74 Years | 0 (0.0%) | 0 (0.0%) |
| 75 Years and over | 6 (17.6%) | 14 (19.2%) |
Disability Class: Cognitive Difficulty
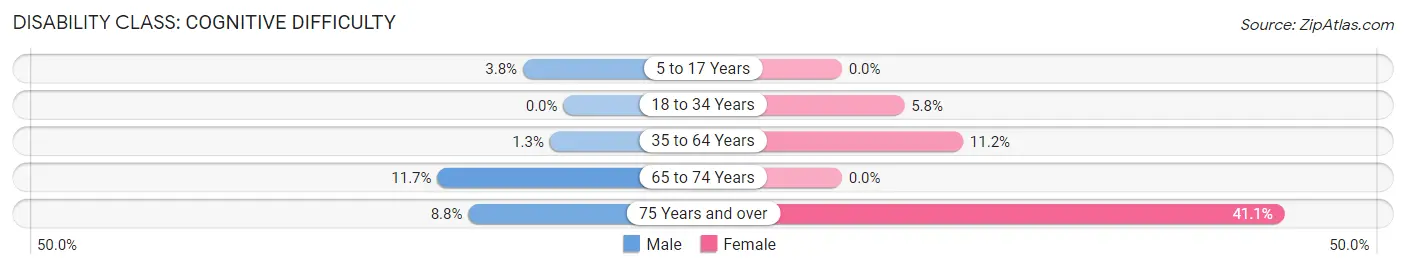
| Age Bracket | Male | Female |
| 5 to 17 Years | 11 (3.7%) | 0 (0.0%) |
| 18 to 34 Years | 0 (0.0%) | 14 (5.8%) |
| 35 to 64 Years | 4 (1.3%) | 40 (11.2%) |
| 65 to 74 Years | 9 (11.7%) | 0 (0.0%) |
| 75 Years and over | 3 (8.8%) | 30 (41.1%) |
Disability Class: Ambulatory Difficulty
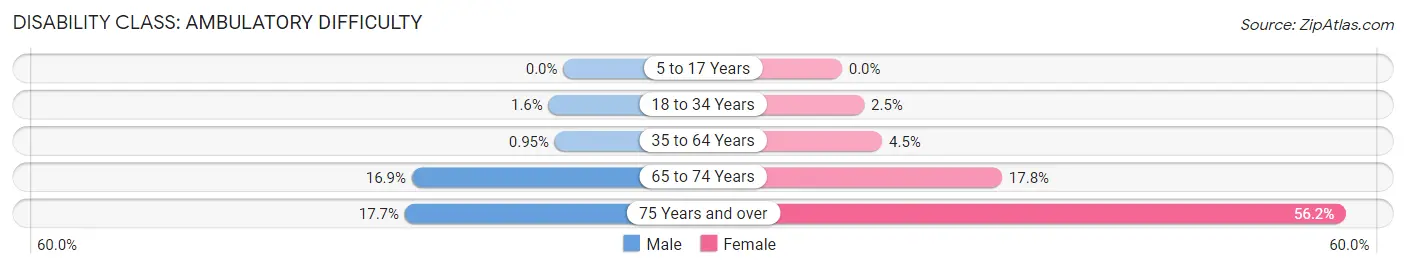
| Age Bracket | Male | Female |
| 5 to 17 Years | 0 (0.0%) | 0 (0.0%) |
| 18 to 34 Years | 4 (1.6%) | 6 (2.5%) |
| 35 to 64 Years | 3 (0.9%) | 16 (4.5%) |
| 65 to 74 Years | 13 (16.9%) | 23 (17.8%) |
| 75 Years and over | 6 (17.6%) | 41 (56.2%) |
Disability Class: Self-Care Difficulty
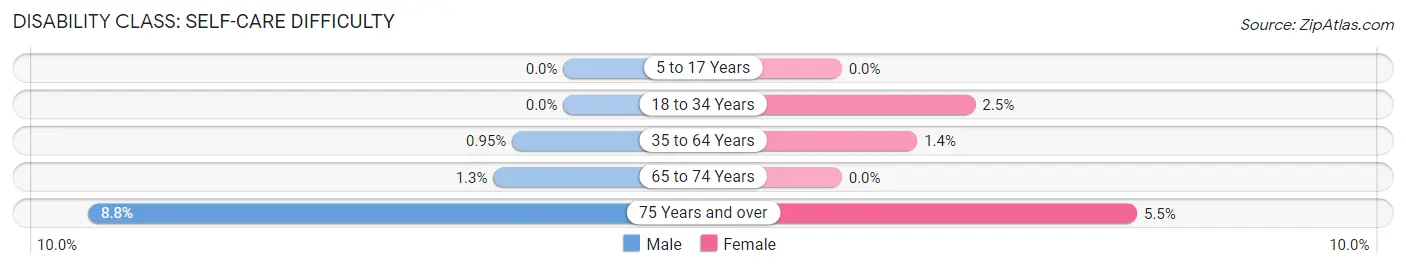
| Age Bracket | Male | Female |
| 5 to 17 Years | 0 (0.0%) | 0 (0.0%) |
| 18 to 34 Years | 0 (0.0%) | 6 (2.5%) |
| 35 to 64 Years | 3 (0.9%) | 5 (1.4%) |
| 65 to 74 Years | 1 (1.3%) | 0 (0.0%) |
| 75 Years and over | 3 (8.8%) | 4 (5.5%) |
Technology Access in Mediapolis
Computing Device Access in Mediapolis
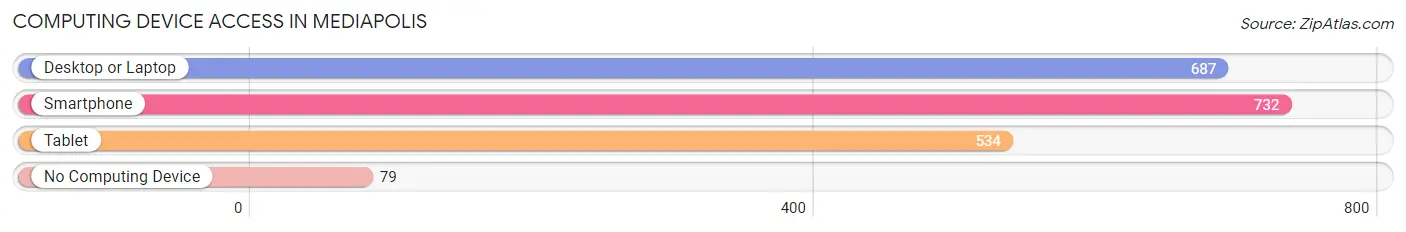
| Device Type | # Households | % Households |
| Desktop or Laptop | 687 | 80.2% |
| Smartphone | 732 | 85.4% |
| Tablet | 534 | 62.3% |
| No Computing Device | 79 | 9.2% |
| Total | 857 | 100.0% |
Internet Access in Mediapolis
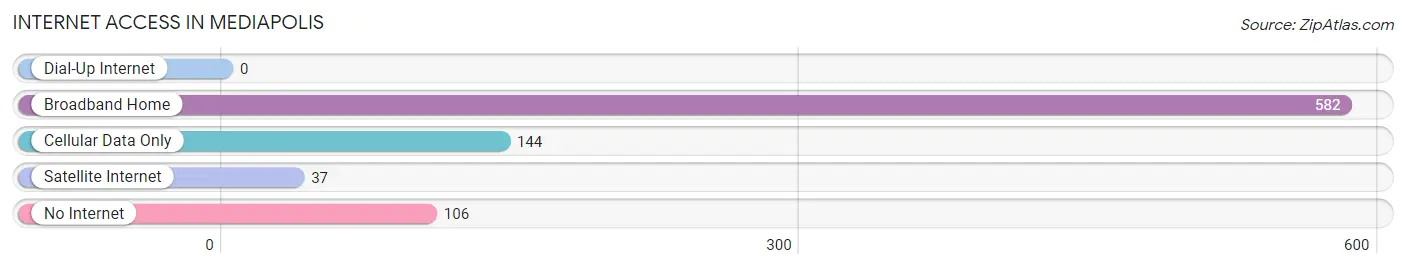
| Internet Type | # Households | % Households |
| Dial-Up Internet | 0 | 0.0% |
| Broadband Home | 582 | 67.9% |
| Cellular Data Only | 144 | 16.8% |
| Satellite Internet | 37 | 4.3% |
| No Internet | 106 | 12.4% |
| Total | 857 | 100.0% |
Mediapolis Summary
Mediapolis, Iowa is a small city located in Des Moines County, Iowa. It is situated in the southeastern part of the state, about 10 miles west of Burlington. The city has a population of 1,845 people, according to the 2010 census.
History
Mediapolis was founded in 1854 by a group of settlers from Ohio. The city was named after the Greek word for “middle city”, as it was located between two other towns. The city was incorporated in 1868 and has remained a small, rural community ever since.
Geography
Mediapolis is located in the southeastern part of Iowa, about 10 miles west of Burlington. The city is situated on the banks of the Des Moines River, which flows through the city. The city is surrounded by rolling hills and farmland, and is located in the heart of the Midwest.
The climate in Mediapolis is typical of the Midwest, with hot summers and cold winters. The average temperature in the summer is around 80 degrees Fahrenheit, while the average temperature in the winter is around 20 degrees Fahrenheit.
Economy
The economy of Mediapolis is largely based on agriculture. The city is home to several large farms, as well as a number of smaller family-owned farms. The city also has a few small businesses, including a grocery store, a hardware store, and a few restaurants.
The city is also home to a number of manufacturing companies, including a plastics factory and a metal fabrication plant. The city is also home to a number of small businesses, including a few retail stores and a few service-based businesses.
Demographics
As of the 2010 census, the population of Mediapolis was 1,845 people. The population is largely white, with a small percentage of African Americans, Hispanics, and Asians. The median household income in the city is $45,000, and the median age is 40 years old.
Mediapolis is a small, rural community that has remained largely unchanged for the past century. The city is home to a number of small businesses, farms, and manufacturing companies, and is a great place to live for those looking for a quiet, rural lifestyle.
Common Questions
What is Per Capita Income in Mediapolis?
Per Capita income in Mediapolis is $32,539.
What is the Median Family Income in Mediapolis?
Median Family Income in Mediapolis is $90,313.
What is the Median Household income in Mediapolis?
Median Household Income in Mediapolis is $71,761.
What is Income or Wage Gap in Mediapolis?
Income or Wage Gap in Mediapolis is 53.0%.
Women in Mediapolis earn 47.0 cents for every dollar earned by a man.
What is Inequality or Gini Index in Mediapolis?
Inequality or Gini Index in Mediapolis is 0.40.
What is the Total Population of Mediapolis?
Total Population of Mediapolis is 2,214.
What is the Total Male Population of Mediapolis?
Total Male Population of Mediapolis is 1,144.
What is the Total Female Population of Mediapolis?
Total Female Population of Mediapolis is 1,070.
What is the Ratio of Males per 100 Females in Mediapolis?
There are 106.92 Males per 100 Females in Mediapolis.
What is the Ratio of Females per 100 Males in Mediapolis?
There are 93.53 Females per 100 Males in Mediapolis.
What is the Median Population Age in Mediapolis?
Median Population Age in Mediapolis is 34.3 Years.
What is the Average Family Size in Mediapolis
Average Family Size in Mediapolis is 3.1 People.
What is the Average Household Size in Mediapolis
Average Household Size in Mediapolis is 2.5 People.
How Large is the Labor Force in Mediapolis?
There are 1,117 People in the Labor Forcein in Mediapolis.
What is the Percentage of People in the Labor Force in Mediapolis?
69.1% of People are in the Labor Force in Mediapolis.
What is the Unemployment Rate in Mediapolis?
Unemployment Rate in Mediapolis is 3.2%.