Zip Codes with the Highest Percentage of Population with a Degree in Engineering in Iowa
RELATED REPORTS & OPTIONS
Engineering
Iowa
Compare Zip Codes
Map of Zip Codes with the Highest Percentage of Population with a Degree in Engineering in Iowa
0.0%
100.0%
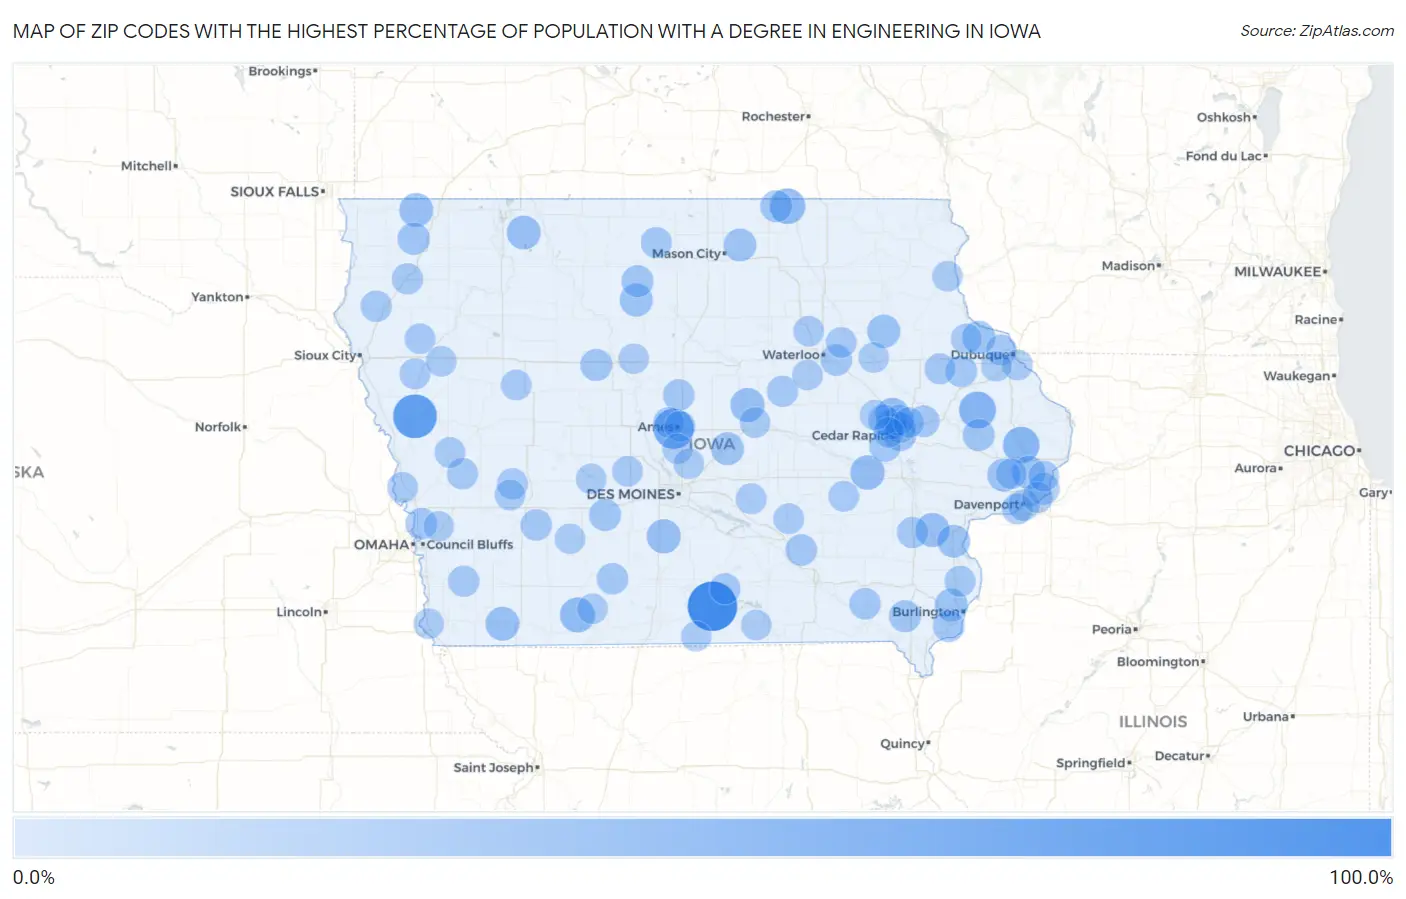
Zip Codes with the Highest Percentage of Population with a Degree in Engineering in Iowa
| Zip Code | % Graduates | vs State | vs National | |
| 1. | 50165 | 100.0% | 5.6% (+94.4)#1 | 7.6% (+92.4)#44 |
| 2. | 51010 | 72.0% | 5.6% (+66.4)#2 | 7.6% (+64.4)#68 |
| 3. | 50013 | 55.6% | 5.6% (+50.0)#3 | 7.6% (+47.9)#101 |
| 4. | 52321 | 39.4% | 5.6% (+33.8)#4 | 7.6% (+31.7)#221 |
| 5. | 52774 | 37.5% | 5.6% (+31.9)#5 | 7.6% (+29.9)#244 |
| 6. | 50455 | 33.3% | 5.6% (+27.8)#6 | 7.6% (+25.7)#293 |
| 7. | 50840 | 30.7% | 5.6% (+25.1)#7 | 7.6% (+23.0)#360 |
| 8. | 52334 | 27.9% | 5.6% (+22.4)#8 | 7.6% (+20.3)#434 |
| 9. | 52341 | 26.8% | 5.6% (+21.2)#9 | 7.6% (+19.2)#472 |
| 10. | 52739 | 26.3% | 5.6% (+20.8)#10 | 7.6% (+18.7)#485 |
| 11. | 50241 | 26.1% | 5.6% (+20.5)#11 | 7.6% (+18.4)#495 |
| 12. | 50148 | 25.9% | 5.6% (+20.4)#12 | 7.6% (+18.3)#505 |
| 13. | 51656 | 25.0% | 5.6% (+19.4)#13 | 7.6% (+17.4)#563 |
| 14. | 51364 | 24.7% | 5.6% (+19.2)#14 | 7.6% (+17.1)#570 |
| 15. | 51243 | 24.7% | 5.6% (+19.1)#15 | 7.6% (+17.0)#572 |
| 16. | 52756 | 22.5% | 5.6% (+17.0)#16 | 7.6% (+14.9)#681 |
| 17. | 52053 | 22.0% | 5.6% (+16.4)#17 | 7.6% (+14.4)#719 |
| 18. | 50671 | 21.6% | 5.6% (+16.1)#18 | 7.6% (+14.0)#748 |
| 19. | 50577 | 21.4% | 5.6% (+15.9)#19 | 7.6% (+13.8)#770 |
| 20. | 52655 | 21.2% | 5.6% (+15.6)#20 | 7.6% (+13.5)#798 |
| 21. | 52745 | 20.7% | 5.6% (+15.1)#21 | 7.6% (+13.0)#842 |
| 22. | 50234 | 20.3% | 5.6% (+14.8)#22 | 7.6% (+12.7)#880 |
| 23. | 52752 | 20.0% | 5.6% (+14.4)#23 | 7.6% (+12.4)#914 |
| 24. | 50467 | 20.0% | 5.6% (+14.4)#24 | 7.6% (+12.4)#922 |
| 25. | 52401 | 17.5% | 5.6% (+11.9)#25 | 7.6% (+9.83)#1,224 |
| 26. | 51244 | 17.4% | 5.6% (+11.8)#26 | 7.6% (+9.74)#1,240 |
| 27. | 50070 | 16.8% | 5.6% (+11.2)#27 | 7.6% (+9.14)#1,346 |
| 28. | 52323 | 16.7% | 5.6% (+11.1)#28 | 7.6% (+9.02)#1,366 |
| 29. | 52631 | 16.7% | 5.6% (+11.1)#29 | 7.6% (+9.02)#1,381 |
| 30. | 50566 | 16.3% | 5.6% (+10.7)#30 | 7.6% (+8.66)#1,437 |
| 31. | 50476 | 16.2% | 5.6% (+10.7)#31 | 7.6% (+8.57)#1,458 |
| 32. | 50430 | 16.2% | 5.6% (+10.7)#32 | 7.6% (+8.57)#1,460 |
| 33. | 50667 | 15.2% | 5.6% (+9.68)#33 | 7.6% (+7.59)#1,694 |
| 34. | 52753 | 15.2% | 5.6% (+9.63)#34 | 7.6% (+7.54)#1,703 |
| 35. | 51526 | 15.2% | 5.6% (+9.61)#35 | 7.6% (+7.52)#1,708 |
| 36. | 52543 | 14.8% | 5.6% (+9.25)#36 | 7.6% (+7.17)#1,795 |
| 37. | 52658 | 14.8% | 5.6% (+9.23)#37 | 7.6% (+7.15)#1,802 |
| 38. | 52078 | 14.8% | 5.6% (+9.19)#38 | 7.6% (+7.11)#1,813 |
| 39. | 52336 | 14.5% | 5.6% (+8.97)#39 | 7.6% (+6.88)#1,859 |
| 40. | 50231 | 14.3% | 5.6% (+8.73)#40 | 7.6% (+6.64)#1,944 |
| 41. | 50274 | 14.3% | 5.6% (+8.73)#41 | 7.6% (+6.64)#1,947 |
| 42. | 52535 | 14.1% | 5.6% (+8.59)#42 | 7.6% (+6.50)#1,978 |
| 43. | 50830 | 14.0% | 5.6% (+8.49)#43 | 7.6% (+6.40)#2,000 |
| 44. | 52228 | 13.8% | 5.6% (+8.24)#44 | 7.6% (+6.15)#2,098 |
| 45. | 52801 | 13.5% | 5.6% (+7.97)#45 | 7.6% (+5.88)#2,203 |
| 46. | 51008 | 13.3% | 5.6% (+7.77)#46 | 7.6% (+5.69)#2,290 |
| 47. | 52201 | 13.2% | 5.6% (+7.60)#47 | 7.6% (+5.51)#2,354 |
| 48. | 51540 | 13.2% | 5.6% (+7.60)#48 | 7.6% (+5.51)#2,355 |
| 49. | 51562 | 13.0% | 5.6% (+7.48)#49 | 7.6% (+5.40)#2,391 |
| 50. | 52411 | 12.9% | 5.6% (+7.29)#50 | 7.6% (+5.20)#2,468 |
| 51. | 51003 | 12.8% | 5.6% (+7.26)#51 | 7.6% (+5.17)#2,480 |
| 52. | 52402 | 12.8% | 5.6% (+7.20)#52 | 7.6% (+5.12)#2,511 |
| 53. | 50432 | 12.5% | 5.6% (+6.94)#53 | 7.6% (+4.85)#2,632 |
| 54. | 50652 | 12.5% | 5.6% (+6.94)#54 | 7.6% (+4.85)#2,638 |
| 55. | 52802 | 12.5% | 5.6% (+6.90)#55 | 7.6% (+4.81)#2,648 |
| 56. | 52223 | 12.0% | 5.6% (+6.49)#56 | 7.6% (+4.40)#2,867 |
| 57. | 52637 | 12.0% | 5.6% (+6.41)#57 | 7.6% (+4.32)#2,910 |
| 58. | 50238 | 11.9% | 5.6% (+6.29)#58 | 7.6% (+4.20)#2,975 |
| 59. | 51004 | 11.8% | 5.6% (+6.25)#59 | 7.6% (+4.16)#2,992 |
| 60. | 51543 | 11.8% | 5.6% (+6.20)#60 | 7.6% (+4.12)#3,017 |
| 61. | 52722 | 11.4% | 5.6% (+5.88)#61 | 7.6% (+3.79)#3,219 |
| 62. | 52328 | 11.3% | 5.6% (+5.71)#62 | 7.6% (+3.63)#3,345 |
| 63. | 51556 | 11.3% | 5.6% (+5.69)#63 | 7.6% (+3.60)#3,362 |
| 64. | 52324 | 11.1% | 5.6% (+5.53)#64 | 7.6% (+3.44)#3,506 |
| 65. | 50207 | 11.0% | 5.6% (+5.46)#65 | 7.6% (+3.38)#3,539 |
| 66. | 50232 | 11.0% | 5.6% (+5.45)#66 | 7.6% (+3.36)#3,545 |
| 67. | 52768 | 11.0% | 5.6% (+5.40)#67 | 7.6% (+3.31)#3,574 |
| 68. | 51450 | 10.8% | 5.6% (+5.28)#68 | 7.6% (+3.19)#3,668 |
| 69. | 52308 | 10.8% | 5.6% (+5.25)#69 | 7.6% (+3.16)#3,694 |
| 70. | 50626 | 10.8% | 5.6% (+5.22)#70 | 7.6% (+3.13)#3,718 |
| 71. | 51529 | 10.7% | 5.6% (+5.12)#71 | 7.6% (+3.03)#3,803 |
| 72. | 50014 | 10.7% | 5.6% (+5.10)#72 | 7.6% (+3.01)#3,819 |
| 73. | 50010 | 10.6% | 5.6% (+5.05)#73 | 7.6% (+2.96)#3,872 |
| 74. | 51048 | 10.5% | 5.6% (+4.97)#74 | 7.6% (+2.88)#3,951 |
| 75. | 52746 | 10.4% | 5.6% (+4.88)#75 | 7.6% (+2.79)#4,035 |
| 76. | 52002 | 10.4% | 5.6% (+4.84)#76 | 7.6% (+2.75)#4,074 |
| 77. | 50167 | 10.4% | 5.6% (+4.82)#77 | 7.6% (+2.73)#4,106 |
| 78. | 50647 | 10.3% | 5.6% (+4.77)#78 | 7.6% (+2.68)#4,149 |
| 79. | 51018 | 10.3% | 5.6% (+4.70)#79 | 7.6% (+2.61)#4,218 |
| 80. | 52003 | 10.2% | 5.6% (+4.67)#80 | 7.6% (+2.58)#4,244 |
| 81. | 51531 | 10.2% | 5.6% (+4.62)#81 | 7.6% (+2.53)#4,286 |
| 82. | 52302 | 10.1% | 5.6% (+4.52)#82 | 7.6% (+2.43)#4,375 |
| 83. | 50845 | 10.0% | 5.6% (+4.44)#83 | 7.6% (+2.35)#4,454 |
| 84. | 52056 | 10.0% | 5.6% (+4.44)#84 | 7.6% (+2.35)#4,466 |
| 85. | 52405 | 9.8% | 5.6% (+4.24)#85 | 7.6% (+2.15)#4,624 |
| 86. | 52544 | 9.8% | 5.6% (+4.22)#86 | 7.6% (+2.14)#4,644 |
| 87. | 51648 | 9.8% | 5.6% (+4.20)#87 | 7.6% (+2.11)#4,674 |
| 88. | 50158 | 9.8% | 5.6% (+4.19)#88 | 7.6% (+2.10)#4,682 |
| 89. | 50124 | 9.7% | 5.6% (+4.16)#89 | 7.6% (+2.08)#4,721 |
| 90. | 50643 | 9.7% | 5.6% (+4.14)#90 | 7.6% (+2.05)#4,754 |
| 91. | 50644 | 9.6% | 5.6% (+4.08)#91 | 7.6% (+1.99)#4,819 |
| 92. | 52157 | 9.6% | 5.6% (+4.08)#92 | 7.6% (+1.99)#4,821 |
| 93. | 50846 | 9.5% | 5.6% (+3.96)#93 | 7.6% (+1.88)#4,945 |
| 94. | 50216 | 9.5% | 5.6% (+3.94)#94 | 7.6% (+1.85)#4,974 |
| 95. | 52068 | 9.4% | 5.6% (+3.86)#95 | 7.6% (+1.78)#5,062 |
| 96. | 50532 | 9.4% | 5.6% (+3.85)#96 | 7.6% (+1.76)#5,077 |
| 97. | 50073 | 9.3% | 5.6% (+3.78)#97 | 7.6% (+1.69)#5,158 |
| 98. | 52332 | 9.1% | 5.6% (+3.57)#98 | 7.6% (+1.48)#5,410 |
| 99. | 51576 | 9.1% | 5.6% (+3.55)#99 | 7.6% (+1.46)#5,430 |
| 100. | 50052 | 9.1% | 5.6% (+3.53)#100 | 7.6% (+1.44)#5,479 |
Common Questions
What are the Top 10 Zip Codes with the Highest Percentage of Population with a Degree in Engineering in Iowa?
Top 10 Zip Codes with the Highest Percentage of Population with a Degree in Engineering in Iowa are:
What zip code has the Highest Percentage of Population with a Degree in Engineering in Iowa?
50165 has the Highest Percentage of Population with a Degree in Engineering in Iowa with 100.0%.
What is the Percentage of Population with a Degree in Engineering in the State of Iowa?
Percentage of Population with a Degree in Engineering in Iowa is 5.6%.
What is the Percentage of Population with a Degree in Engineering in the United States?
Percentage of Population with a Degree in Engineering in the United States is 7.6%.