Duncan, IA Map & Demographics
Duncan Map
Duncan Overview
$22,245
PER CAPITA INCOME
0.56
INEQUALITY / GINI INDEX
80
TOTAL POPULATION
58
MALE POPULATION
22
FEMALE POPULATION
263.64
MALES / 100 FEMALES
37.93
FEMALES / 100 MALES
34.4
MEDIAN AGE
3.4
AVG FAMILY SIZE
1.7
AVG HOUSEHOLD SIZE
28
LABOR FORCE [ PEOPLE ]
40.0%
PERCENT IN LABOR FORCE
Income in Duncan
Income Overview in Duncan
| Characteristic | Number | Measure |
| Per Capita Income | 80 | $22,245 |
| Median Family Income | 7 | $0 |
| Mean Family Income | 7 | $0 |
| Median Household Income | 24 | $0 |
| Mean Household Income | 24 | $45,875 |
| Income Deficit | 7 | $0 |
| Wage / Income Gap (%) | 80 | 0.00% |
| Wage / Income Gap ($) | 80 | 100.00¢ per $1 |
| Gini / Inequality Index | 80 | 0.56 |
Earnings by Sex in Duncan
| Sex | Number | Average Earnings |
| Male | 16 (57.1%) | $0 |
| Female | 12 (42.9%) | $0 |
| Total | 28 (100.0%) | $0 |
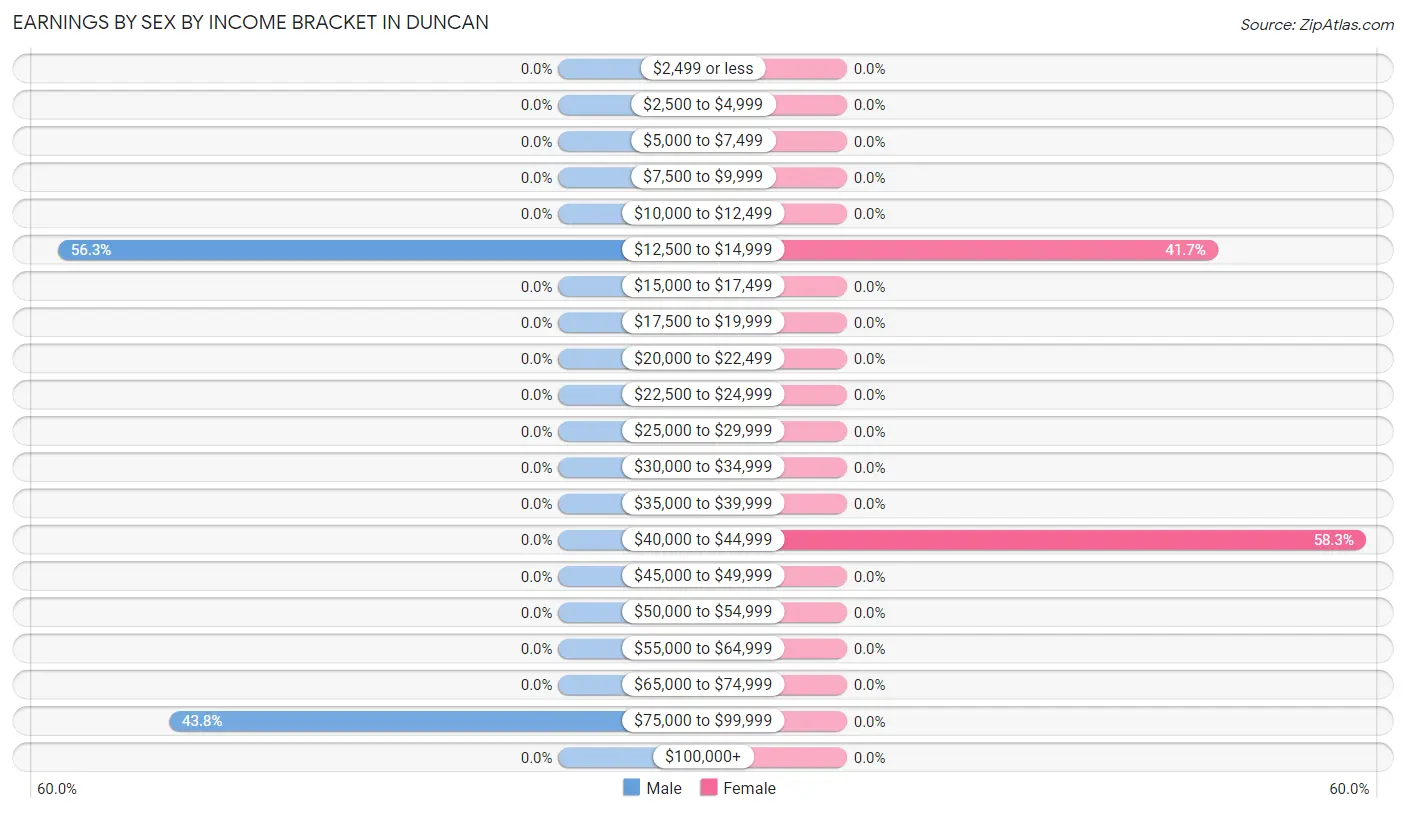
Earnings by Sex by Income Bracket in Duncan
The most common earnings brackets in Duncan are $12,500 to $14,999 for men (9 | 56.2%) and $40,000 to $44,999 for women (7 | 58.3%).
| Income | Male | Female |
| $2,499 or less | 0 (0.0%) | 0 (0.0%) |
| $2,500 to $4,999 | 0 (0.0%) | 0 (0.0%) |
| $5,000 to $7,499 | 0 (0.0%) | 0 (0.0%) |
| $7,500 to $9,999 | 0 (0.0%) | 0 (0.0%) |
| $10,000 to $12,499 | 0 (0.0%) | 0 (0.0%) |
| $12,500 to $14,999 | 9 (56.2%) | 5 (41.7%) |
| $15,000 to $17,499 | 0 (0.0%) | 0 (0.0%) |
| $17,500 to $19,999 | 0 (0.0%) | 0 (0.0%) |
| $20,000 to $22,499 | 0 (0.0%) | 0 (0.0%) |
| $22,500 to $24,999 | 0 (0.0%) | 0 (0.0%) |
| $25,000 to $29,999 | 0 (0.0%) | 0 (0.0%) |
| $30,000 to $34,999 | 0 (0.0%) | 0 (0.0%) |
| $35,000 to $39,999 | 0 (0.0%) | 0 (0.0%) |
| $40,000 to $44,999 | 0 (0.0%) | 7 (58.3%) |
| $45,000 to $49,999 | 0 (0.0%) | 0 (0.0%) |
| $50,000 to $54,999 | 0 (0.0%) | 0 (0.0%) |
| $55,000 to $64,999 | 0 (0.0%) | 0 (0.0%) |
| $65,000 to $74,999 | 0 (0.0%) | 0 (0.0%) |
| $75,000 to $99,999 | 7 (43.8%) | 0 (0.0%) |
| $100,000+ | 0 (0.0%) | 0 (0.0%) |
| Total | 16 (100.0%) | 12 (100.0%) |
Earnings by Sex by Educational Attainment in Duncan
| Educational Attainment | Male Income | Female Income |
| Less than High School | - | - |
| High School Diploma | - | - |
| College or Associate's Degree | - | - |
| Bachelor's Degree | - | - |
| Graduate Degree | - | - |
| Total | - | - |
Family Income in Duncan
Family Income Brackets in Duncan
According to the Duncan family income data, there are 7 families falling into the $100,000 to $149,999 income range, which is the most common income bracket and makes up 100.0% of all families.
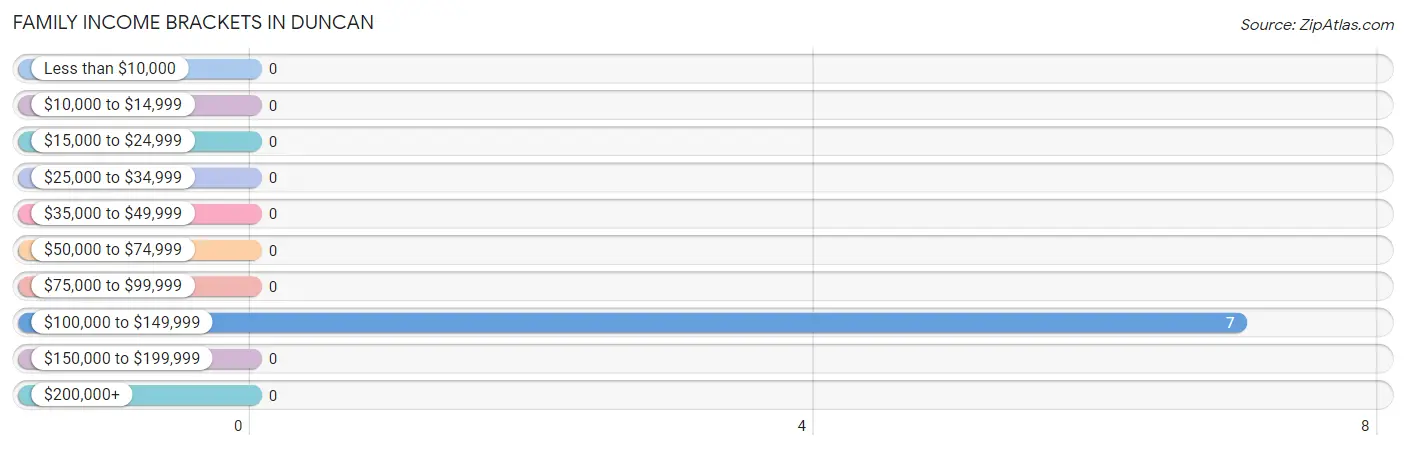
| Income Bracket | # Families | % Families |
| Less than $10,000 | 0 | 0.0% |
| $10,000 to $14,999 | 0 | 0.0% |
| $15,000 to $24,999 | 0 | 0.0% |
| $25,000 to $34,999 | 0 | 0.0% |
| $35,000 to $49,999 | 0 | 0.0% |
| $50,000 to $74,999 | 0 | 0.0% |
| $75,000 to $99,999 | 0 | 0.0% |
| $100,000 to $149,999 | 7 | 100.0% |
| $150,000 to $199,999 | 0 | 0.0% |
| $200,000+ | 0 | 0.0% |
Family Income by Famaliy Size in Duncan
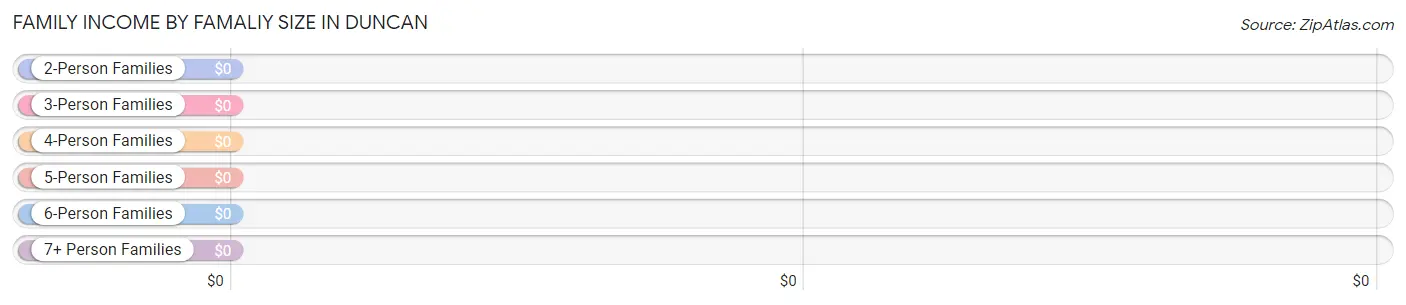
| Income Bracket | # Families | Median Income |
| 2-Person Families | 0 (0.0%) | $0 |
| 3-Person Families | 7 (100.0%) | $0 |
| 4-Person Families | 0 (0.0%) | $0 |
| 5-Person Families | 0 (0.0%) | $0 |
| 6-Person Families | 0 (0.0%) | $0 |
| 7+ Person Families | 0 (0.0%) | $0 |
| Total | 7 (100.0%) | $0 |
Family Income by Number of Earners in Duncan
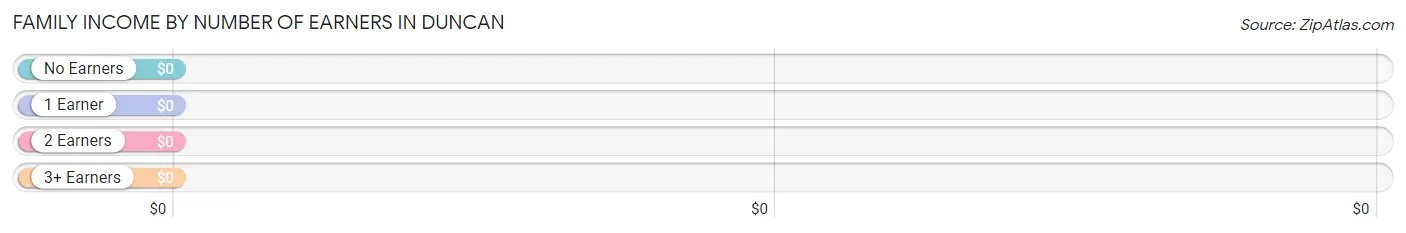
| Number of Earners | # Families | Median Income |
| No Earners | 0 (0.0%) | $0 |
| 1 Earner | 0 (0.0%) | $0 |
| 2 Earners | 7 (100.0%) | $0 |
| 3+ Earners | 0 (0.0%) | $0 |
| Total | 7 (100.0%) | $0 |
Household Income in Duncan
Household Income Brackets in Duncan
With 12 households falling in the category, the less than $10,000 income range is the most frequent in Duncan, accounting for 50.0% of all households.
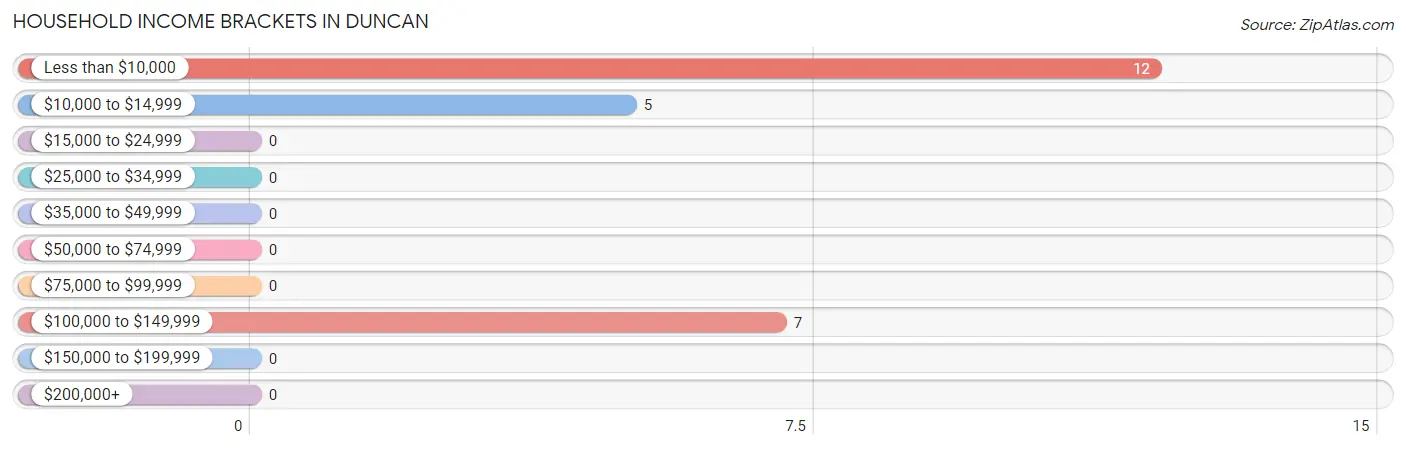
| Income Bracket | # Households | % Households |
| Less than $10,000 | 12 | 50.0% |
| $10,000 to $14,999 | 5 | 20.8% |
| $15,000 to $24,999 | 0 | 0.0% |
| $25,000 to $34,999 | 0 | 0.0% |
| $35,000 to $49,999 | 0 | 0.0% |
| $50,000 to $74,999 | 0 | 0.0% |
| $75,000 to $99,999 | 0 | 0.0% |
| $100,000 to $149,999 | 7 | 29.2% |
| $150,000 to $199,999 | 0 | 0.0% |
| $200,000+ | 0 | 0.0% |
Household Income by Householder Age in Duncan
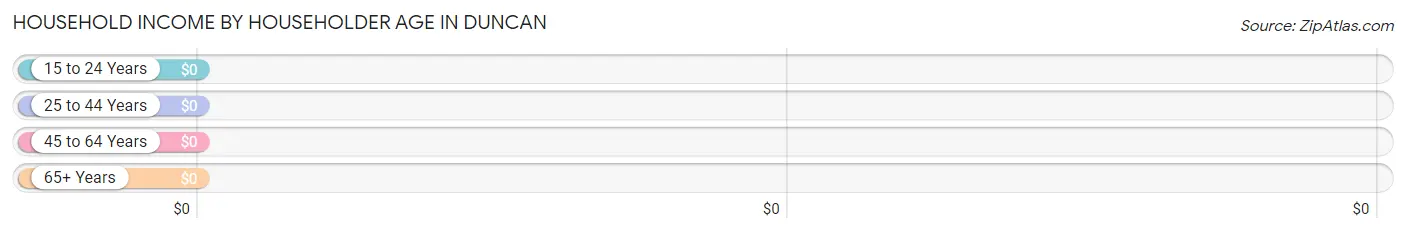
| Income Bracket | # Households | Median Income |
| 15 to 24 Years | 0 (0.0%) | $0 |
| 25 to 44 Years | 7 (29.2%) | $0 |
| 45 to 64 Years | 5 (20.8%) | $0 |
| 65+ Years | 12 (50.0%) | $0 |
| Total | 24 (100.0%) | $0 |
Poverty in Duncan
Income Below Poverty by Sex and Age in Duncan
With 55.2% poverty level for males and 22.7% for females among the residents of Duncan, 65 to 74 year old males and 55 to 64 year old females are the most vulnerable to poverty, with 9 males (100.0%) and 5 females (100.0%) in their respective age groups living below the poverty level.
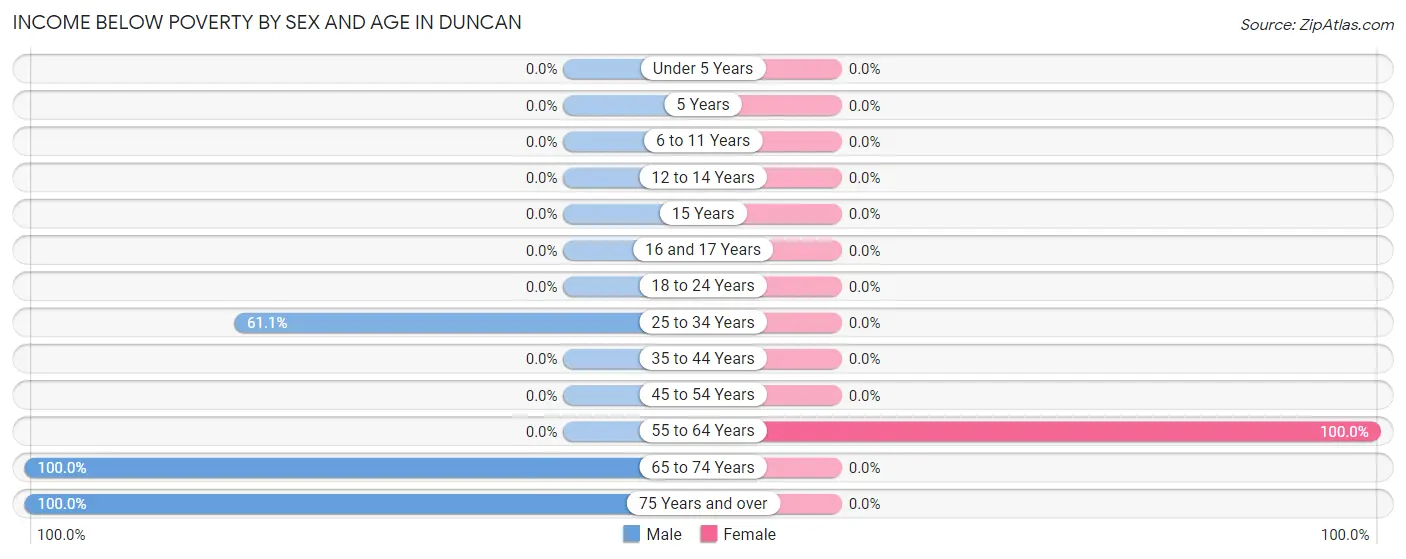
| Age Bracket | Male | Female |
| Under 5 Years | 0 (0.0%) | 0 (0.0%) |
| 5 Years | 0 (0.0%) | 0 (0.0%) |
| 6 to 11 Years | 0 (0.0%) | 0 (0.0%) |
| 12 to 14 Years | 0 (0.0%) | 0 (0.0%) |
| 15 Years | 0 (0.0%) | 0 (0.0%) |
| 16 and 17 Years | 0 (0.0%) | 0 (0.0%) |
| 18 to 24 Years | 0 (0.0%) | 0 (0.0%) |
| 25 to 34 Years | 11 (61.1%) | 0 (0.0%) |
| 35 to 44 Years | 0 (0.0%) | 0 (0.0%) |
| 45 to 54 Years | 0 (0.0%) | 0 (0.0%) |
| 55 to 64 Years | 0 (0.0%) | 5 (100.0%) |
| 65 to 74 Years | 9 (100.0%) | 0 (0.0%) |
| 75 Years and over | 12 (100.0%) | 0 (0.0%) |
| Total | 32 (55.2%) | 5 (22.7%) |
Income Above Poverty by Sex and Age in Duncan
According to the poverty statistics in Duncan, males aged under 5 years and females aged 25 to 34 years are the age groups that are most secure financially, with 100.0% of males and 100.0% of females in these age groups living above the poverty line.
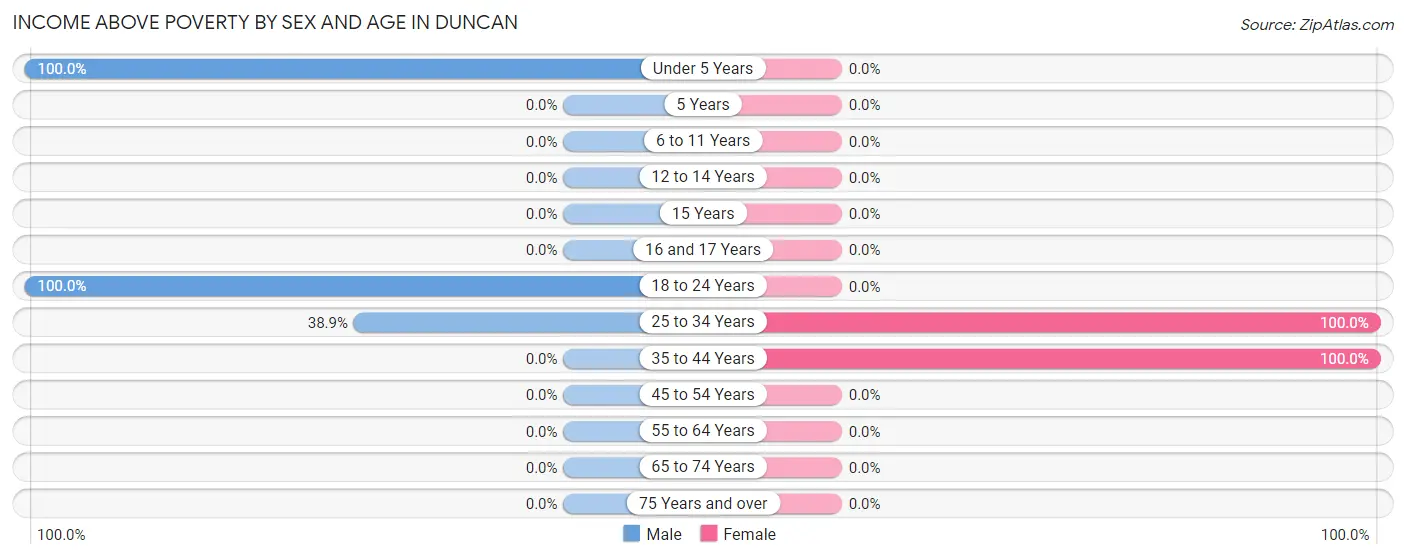
| Age Bracket | Male | Female |
| Under 5 Years | 10 (100.0%) | 0 (0.0%) |
| 5 Years | 0 (0.0%) | 0 (0.0%) |
| 6 to 11 Years | 0 (0.0%) | 0 (0.0%) |
| 12 to 14 Years | 0 (0.0%) | 0 (0.0%) |
| 15 Years | 0 (0.0%) | 0 (0.0%) |
| 16 and 17 Years | 0 (0.0%) | 0 (0.0%) |
| 18 to 24 Years | 9 (100.0%) | 0 (0.0%) |
| 25 to 34 Years | 7 (38.9%) | 7 (100.0%) |
| 35 to 44 Years | 0 (0.0%) | 10 (100.0%) |
| 45 to 54 Years | 0 (0.0%) | 0 (0.0%) |
| 55 to 64 Years | 0 (0.0%) | 0 (0.0%) |
| 65 to 74 Years | 0 (0.0%) | 0 (0.0%) |
| 75 Years and over | 0 (0.0%) | 0 (0.0%) |
| Total | 26 (44.8%) | 17 (77.3%) |
Income Below Poverty Among Married-Couple Families in Duncan
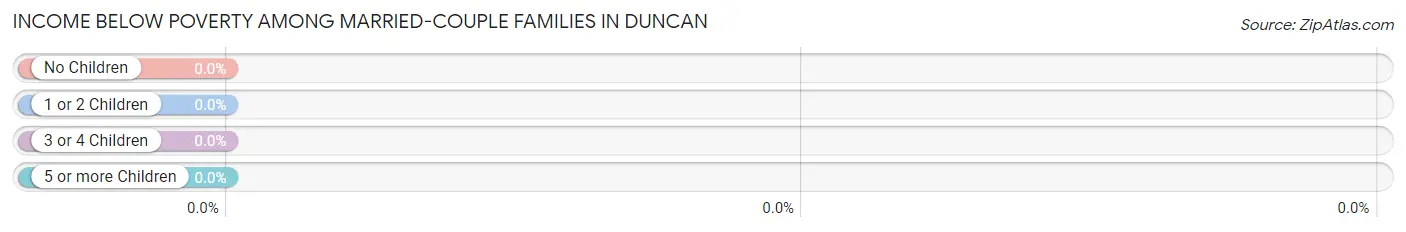
| Children | Above Poverty | Below Poverty |
| No Children | 0 (0.0%) | 0 (0.0%) |
| 1 or 2 Children | 7 (100.0%) | 0 (0.0%) |
| 3 or 4 Children | 0 (0.0%) | 0 (0.0%) |
| 5 or more Children | 0 (0.0%) | 0 (0.0%) |
| Total | 7 (100.0%) | 0 (0.0%) |
Income Below Poverty Among Single-Parent Households in Duncan
| Children | Single Father | Single Mother |
| No Children | 0 (0.0%) | 0 (0.0%) |
| 1 or 2 Children | 0 (0.0%) | 0 (0.0%) |
| 3 or 4 Children | 0 (0.0%) | 0 (0.0%) |
| 5 or more Children | 0 (0.0%) | 0 (0.0%) |
| Total | 0 (0.0%) | 0 (0.0%) |
Income Below Poverty Among Married-Couple vs Single-Parent Households in Duncan
| Children | Married-Couple Families | Single-Parent Households |
| No Children | 0 (0.0%) | 0 (0.0%) |
| 1 or 2 Children | 0 (0.0%) | 0 (0.0%) |
| 3 or 4 Children | 0 (0.0%) | 0 (0.0%) |
| 5 or more Children | 0 (0.0%) | 0 (0.0%) |
| Total | 0 (0.0%) | 0 (0.0%) |
Race in Duncan
The most populous races in Duncan are , and White / Caucasian (80 | 100.0%).
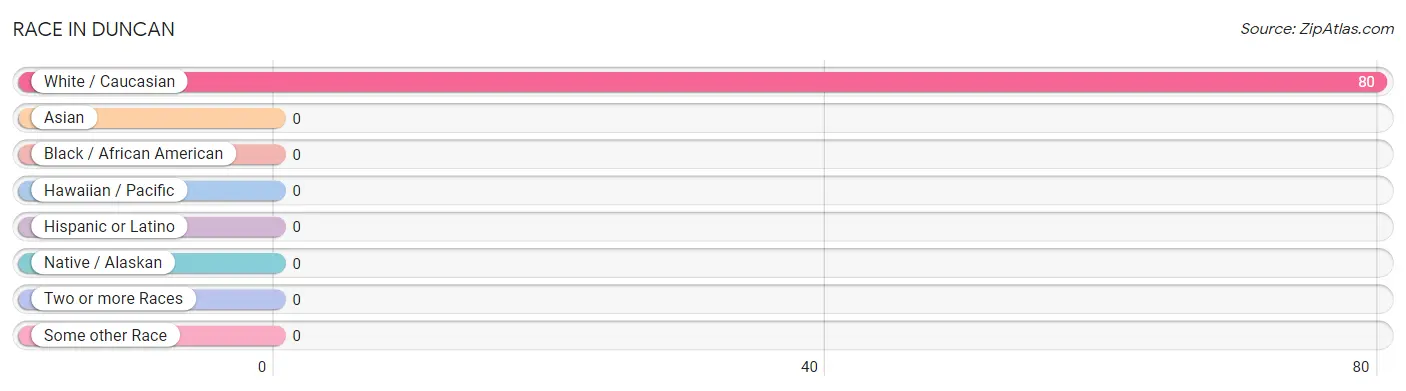
| Race | # Population | % Population |
| Asian | 0 | 0.0% |
| Black / African American | 0 | 0.0% |
| Hawaiian / Pacific | 0 | 0.0% |
| Hispanic or Latino | 0 | 0.0% |
| Native / Alaskan | 0 | 0.0% |
| White / Caucasian | 80 | 100.0% |
| Two or more Races | 0 | 0.0% |
| Some other Race | 0 | 0.0% |
| Total | 80 | 100.0% |
Ancestry in Duncan
The most populous ancestries reported in Duncan are German (38 | 47.5%), Dutch (17 | 21.2%), English (12 | 15.0%), Norwegian (12 | 15.0%), and Scottish (5 | 6.2%), together accounting for 105.0% of all Duncan residents.
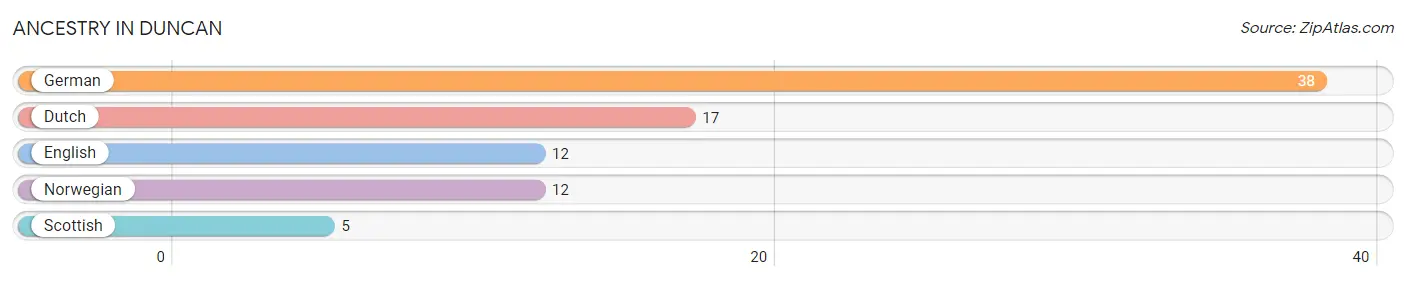
| Ancestry | # Population | % Population |
| Dutch | 17 | 21.2% |
| English | 12 | 15.0% |
| German | 38 | 47.5% |
| Norwegian | 12 | 15.0% |
| Scottish | 5 | 6.2% | View All 5 Rows |
Immigrants in Duncan

| Immigration Origin | # Population | % Population | View All 0 Rows |
Sex and Age in Duncan
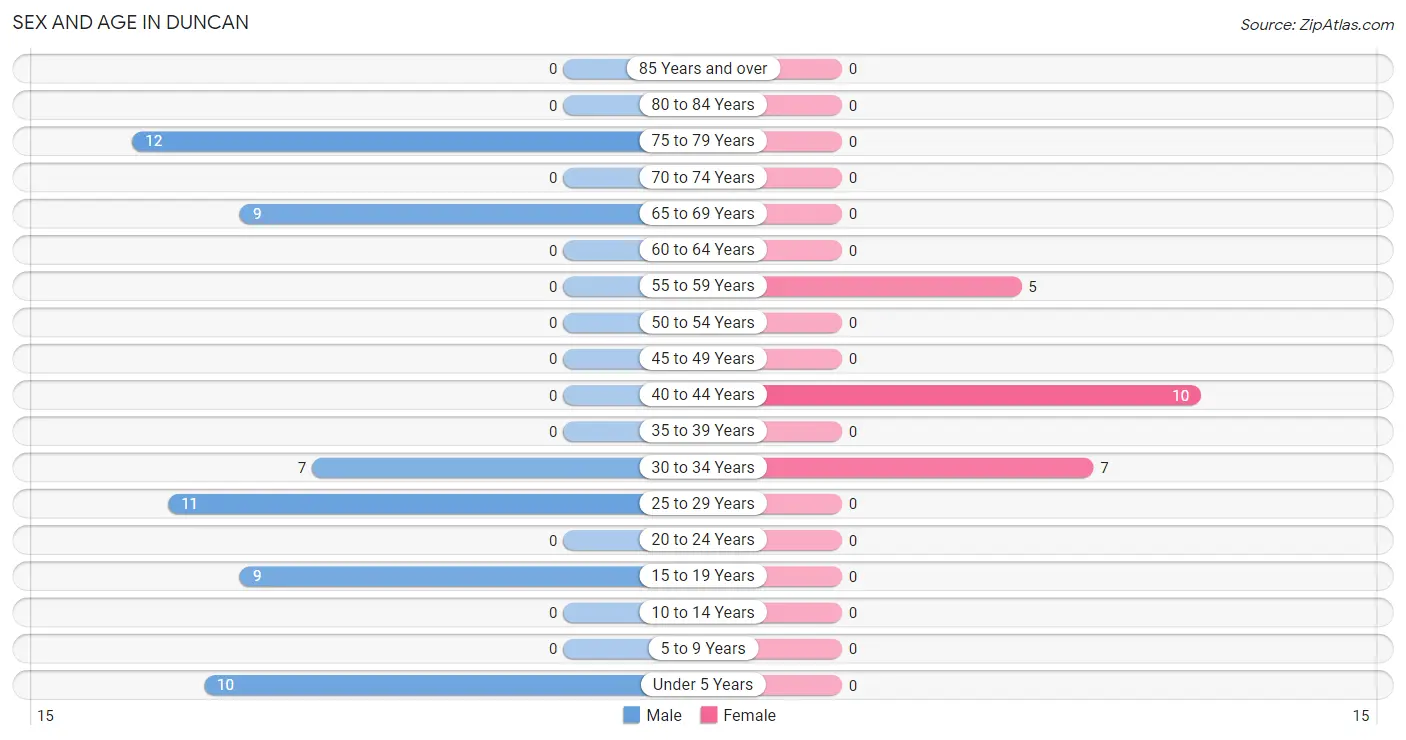
Sex and Age in Duncan
The most populous age groups in Duncan are 75 to 79 Years (12 | 20.7%) for men and 40 to 44 Years (10 | 45.5%) for women.
| Age Bracket | Male | Female |
| Under 5 Years | 10 (17.2%) | 0 (0.0%) |
| 5 to 9 Years | 0 (0.0%) | 0 (0.0%) |
| 10 to 14 Years | 0 (0.0%) | 0 (0.0%) |
| 15 to 19 Years | 9 (15.5%) | 0 (0.0%) |
| 20 to 24 Years | 0 (0.0%) | 0 (0.0%) |
| 25 to 29 Years | 11 (19.0%) | 0 (0.0%) |
| 30 to 34 Years | 7 (12.1%) | 7 (31.8%) |
| 35 to 39 Years | 0 (0.0%) | 0 (0.0%) |
| 40 to 44 Years | 0 (0.0%) | 10 (45.5%) |
| 45 to 49 Years | 0 (0.0%) | 0 (0.0%) |
| 50 to 54 Years | 0 (0.0%) | 0 (0.0%) |
| 55 to 59 Years | 0 (0.0%) | 5 (22.7%) |
| 60 to 64 Years | 0 (0.0%) | 0 (0.0%) |
| 65 to 69 Years | 9 (15.5%) | 0 (0.0%) |
| 70 to 74 Years | 0 (0.0%) | 0 (0.0%) |
| 75 to 79 Years | 12 (20.7%) | 0 (0.0%) |
| 80 to 84 Years | 0 (0.0%) | 0 (0.0%) |
| 85 Years and over | 0 (0.0%) | 0 (0.0%) |
| Total | 58 (100.0%) | 22 (100.0%) |
Families and Households in Duncan
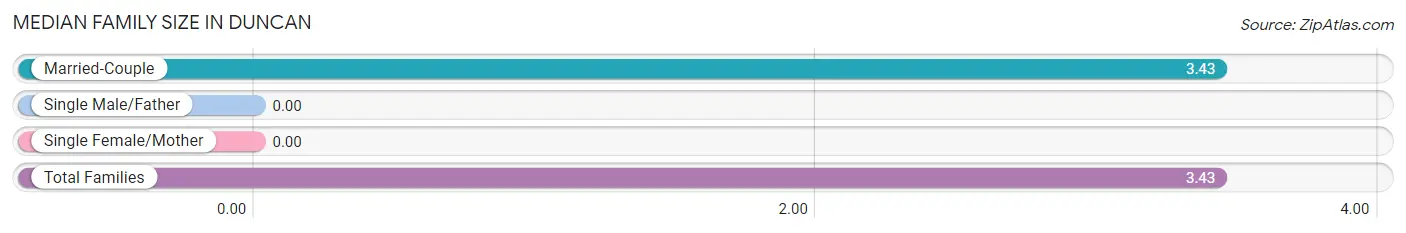
Median Family Size in Duncan
| Family Type | # Families | Family Size |
| Married-Couple | 7 (100.0%) | 3.43 |
| Single Male/Father | 0 (0.0%) | - |
| Single Female/Mother | 0 (0.0%) | - |
| Total Families | 7 (100.0%) | 3.43 |
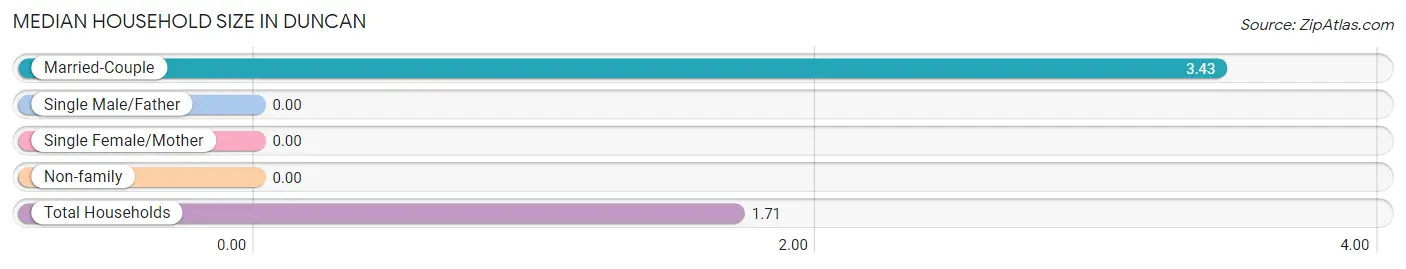
Median Household Size in Duncan
| Household Type | # Households | Household Size |
| Married-Couple | 7 (29.2%) | 3.43 |
| Single Male/Father | 0 (0.0%) | - |
| Single Female/Mother | 0 (0.0%) | - |
| Non-family | 17 (70.8%) | - |
| Total Households | 24 (100.0%) | 1.71 |
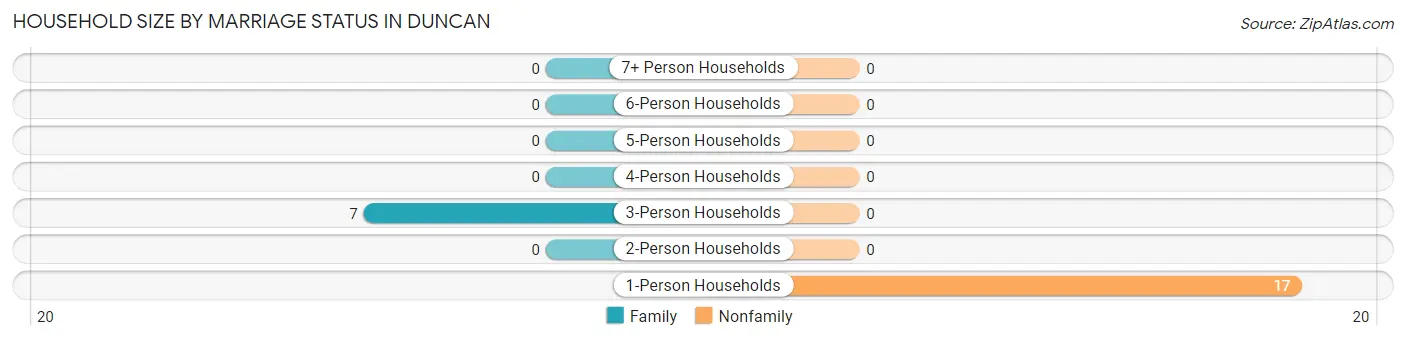
Household Size by Marriage Status in Duncan
Out of a total of 24 households in Duncan, 7 (29.2%) are family households, while 17 (70.8%) are nonfamily households. The most numerous type of family households are 3-person households, comprising 7, and the most common type of nonfamily households are 1-person households, comprising 17.
| Household Size | Family Households | Nonfamily Households |
| 1-Person Households | - | 17 (70.8%) |
| 2-Person Households | 0 (0.0%) | 0 (0.0%) |
| 3-Person Households | 7 (29.2%) | 0 (0.0%) |
| 4-Person Households | 0 (0.0%) | 0 (0.0%) |
| 5-Person Households | 0 (0.0%) | 0 (0.0%) |
| 6-Person Households | 0 (0.0%) | 0 (0.0%) |
| 7+ Person Households | 0 (0.0%) | 0 (0.0%) |
| Total | 7 (29.2%) | 17 (70.8%) |
Female Fertility in Duncan
Fertility by Age in Duncan
| Age Bracket | Women with Births | Births / 1,000 Women |
| 15 to 19 years | 0 (0.0%) | 0.0 |
| 20 to 34 years | 0 (0.0%) | 0.0 |
| 35 to 50 years | 0 (0.0%) | 0.0 |
| Total | 0 (0.0%) | 0.0 |
Fertility by Age by Marriage Status in Duncan
| Age Bracket | Married | Unmarried |
| 15 to 19 years | 0 (0.0%) | 0 (0.0%) |
| 20 to 34 years | 0 (0.0%) | 0 (0.0%) |
| 35 to 50 years | 0 (0.0%) | 0 (0.0%) |
| Total | 0 (0.0%) | 0 (0.0%) |
Fertility by Education in Duncan
| Educational Attainment | Women with Births | Births / 1,000 Women |
| Less than High School | 0 (0.0%) | 0.0 |
| High School Diploma | 0 (0.0%) | 0.0 |
| College or Associate's Degree | 0 (0.0%) | 0.0 |
| Bachelor's Degree | 0 (0.0%) | 0.0 |
| Graduate Degree | 0 (0.0%) | 0.0 |
| Total | 0 (0.0%) | 0.0 |
Fertility by Education by Marriage Status in Duncan
| Educational Attainment | Married | Unmarried |
| Less than High School | 0 (0.0%) | 0 (0.0%) |
| High School Diploma | 0 (0.0%) | 0 (0.0%) |
| College or Associate's Degree | 0 (0.0%) | 0 (0.0%) |
| Bachelor's Degree | 0 (0.0%) | 0 (0.0%) |
| Graduate Degree | 0 (0.0%) | 0 (0.0%) |
| Total | 0 (0.0%) | 0 (0.0%) |
Employment Characteristics in Duncan
Employment by Class of Employer in Duncan
Among the 28 employed individuals in Duncan, private company employees (19 | 67.9%), and state government employees (9 | 32.1%) make up the most common classes of employment.
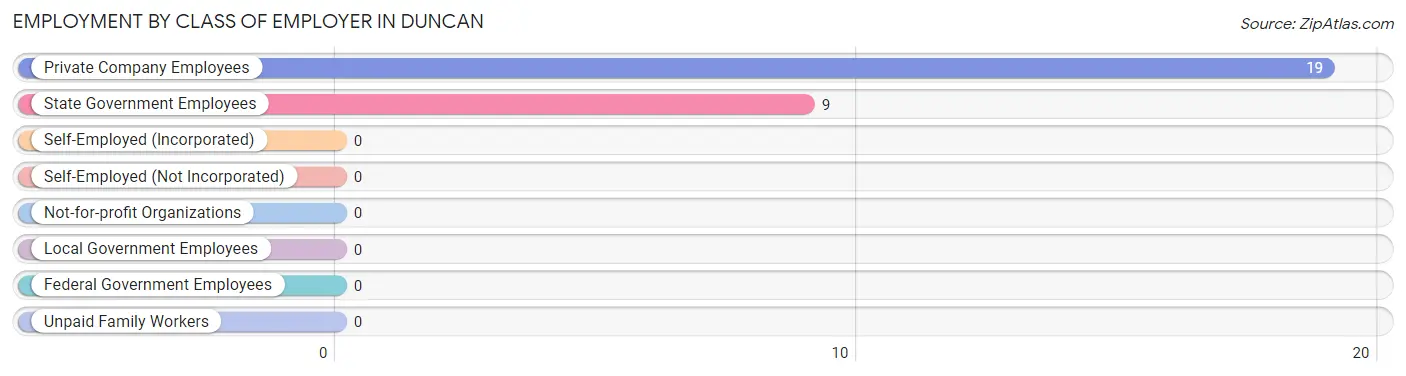
| Employer Class | # Employees | % Employees |
| Private Company Employees | 19 | 67.9% |
| Self-Employed (Incorporated) | 0 | 0.0% |
| Self-Employed (Not Incorporated) | 0 | 0.0% |
| Not-for-profit Organizations | 0 | 0.0% |
| Local Government Employees | 0 | 0.0% |
| State Government Employees | 9 | 32.1% |
| Federal Government Employees | 0 | 0.0% |
| Unpaid Family Workers | 0 | 0.0% |
| Total | 28 | 100.0% |
Employment Status by Age in Duncan
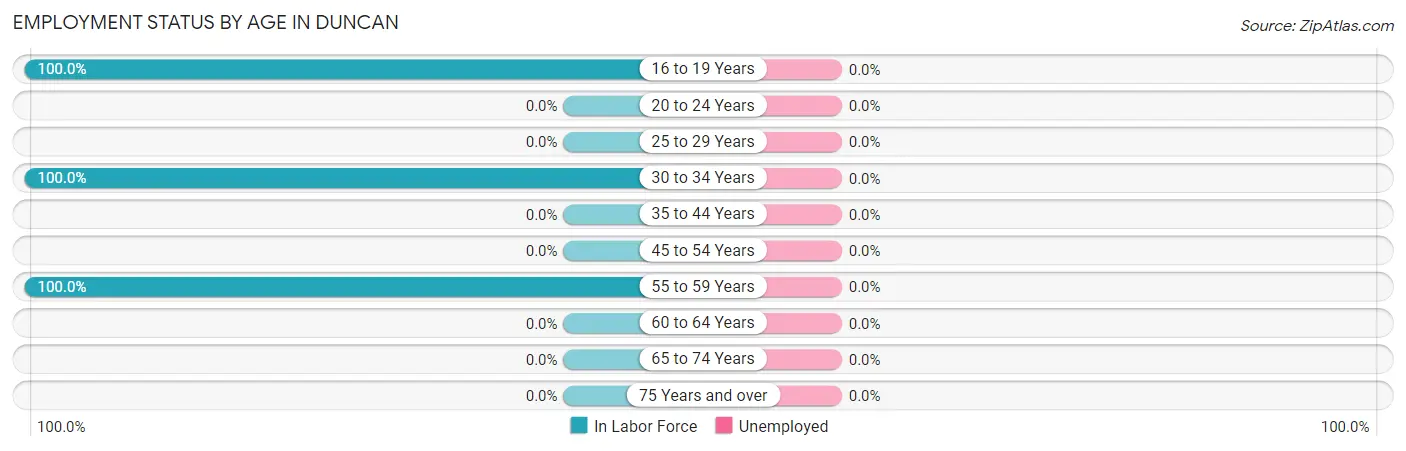
| Age Bracket | In Labor Force | Unemployed |
| 16 to 19 Years | 9 (100.0%) | 0 (0.0%) |
| 20 to 24 Years | 0 (0.0%) | 0 (0.0%) |
| 25 to 29 Years | 0 (0.0%) | 0 (0.0%) |
| 30 to 34 Years | 14 (100.0%) | 0 (0.0%) |
| 35 to 44 Years | 0 (0.0%) | 0 (0.0%) |
| 45 to 54 Years | 0 (0.0%) | 0 (0.0%) |
| 55 to 59 Years | 5 (100.0%) | 0 (0.0%) |
| 60 to 64 Years | 0 (0.0%) | 0 (0.0%) |
| 65 to 74 Years | 0 (0.0%) | 0 (0.0%) |
| 75 Years and over | 0 (0.0%) | 0 (0.0%) |
| Total | 28 (40.0%) | 0 (0.0%) |
Employment Status by Educational Attainment in Duncan
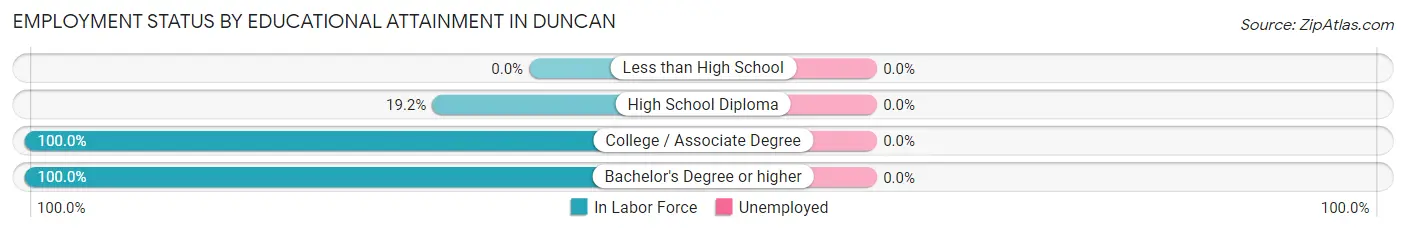
| Educational Attainment | In Labor Force | Unemployed |
| Less than High School | 0 (0.0%) | 0 (0.0%) |
| High School Diploma | 5 (19.2%) | 0 (0.0%) |
| College / Associate Degree | 7 (100.0%) | 0 (0.0%) |
| Bachelor's Degree or higher | 7 (100.0%) | 0 (0.0%) |
| Total | 19 (47.5%) | 0 (0.0%) |
Employment Occupations by Sex in Duncan
Management, Business, Science and Arts Occupations
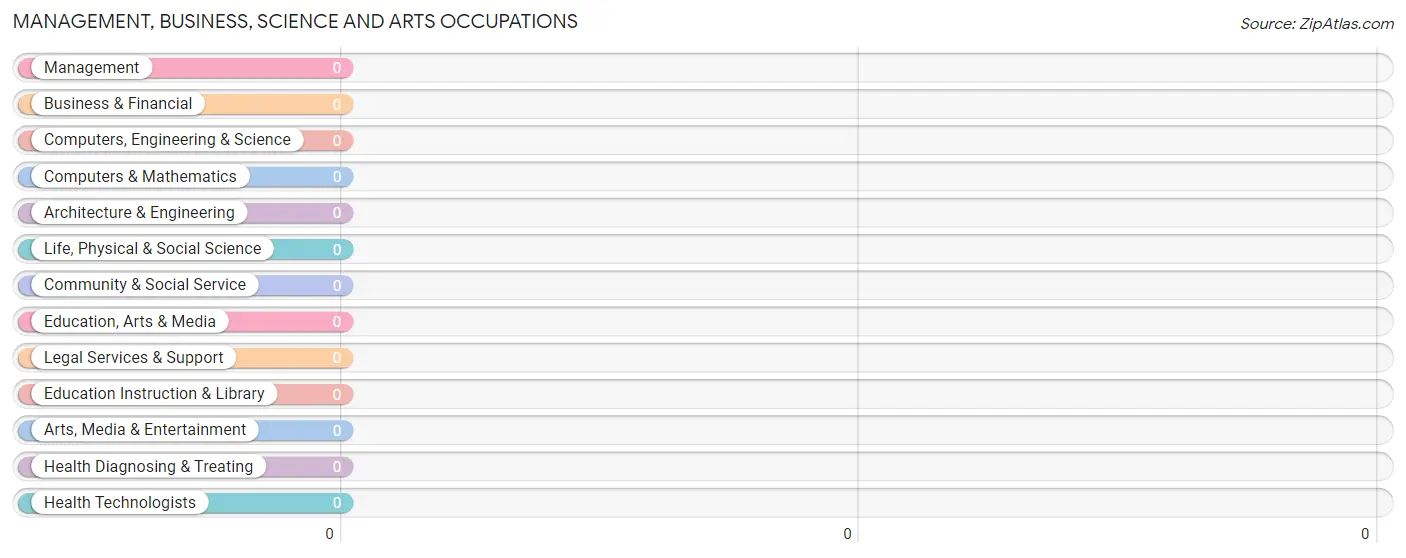
Management, Business, Science and Arts Occupations by Sex
| Occupation | Male | Female |
| Management | 0 (0.0%) | 0 (0.0%) |
| Business & Financial | 0 (0.0%) | 0 (0.0%) |
| Computers, Engineering & Science | 0 (0.0%) | 0 (0.0%) |
| Computers & Mathematics | 0 (0.0%) | 0 (0.0%) |
| Architecture & Engineering | 0 (0.0%) | 0 (0.0%) |
| Life, Physical & Social Science | 0 (0.0%) | 0 (0.0%) |
| Community & Social Service | 0 (0.0%) | 0 (0.0%) |
| Education, Arts & Media | 0 (0.0%) | 0 (0.0%) |
| Legal Services & Support | 0 (0.0%) | 0 (0.0%) |
| Education Instruction & Library | 0 (0.0%) | 0 (0.0%) |
| Arts, Media & Entertainment | 0 (0.0%) | 0 (0.0%) |
| Health Diagnosing & Treating | 0 (0.0%) | 0 (0.0%) |
| Health Technologists | 0 (0.0%) | 0 (0.0%) |
| Total (Category) | 0 (0.0%) | 0 (0.0%) |
| Total (Overall) | 16 (57.1%) | 12 (42.9%) |
Services Occupations
Services Occupations by Sex
| Occupation | Male | Female |
| Healthcare Support | 0 (0.0%) | 0 (0.0%) |
| Security & Protection | 0 (0.0%) | 0 (0.0%) |
| Firefighting & Prevention | 0 (0.0%) | 0 (0.0%) |
| Law Enforcement | 0 (0.0%) | 0 (0.0%) |
| Food Preparation & Serving | 0 (0.0%) | 0 (0.0%) |
| Cleaning & Maintenance | 0 (0.0%) | 0 (0.0%) |
| Personal Care & Service | 0 (0.0%) | 0 (0.0%) |
| Total (Category) | 0 (0.0%) | 0 (0.0%) |
| Total (Overall) | 16 (57.1%) | 12 (42.9%) |
Sales and Office Occupations
The most common Sales and Office occupations in Duncan are , and Office & Administration (12 | 42.9%).
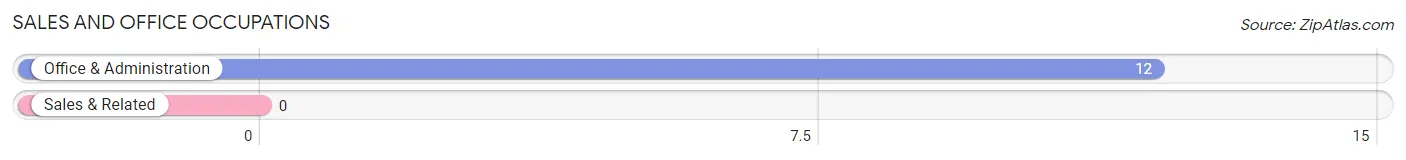
Sales and Office Occupations by Sex
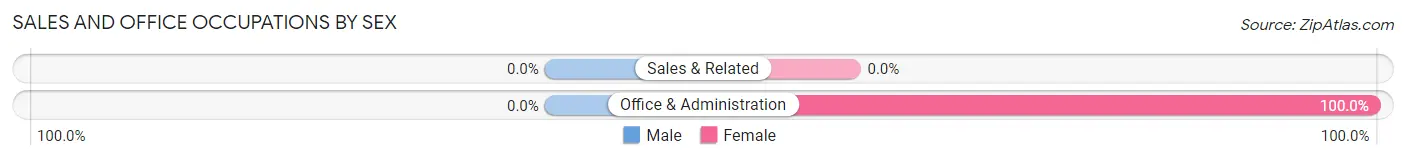
| Occupation | Male | Female |
| Sales & Related | 0 (0.0%) | 0 (0.0%) |
| Office & Administration | 0 (0.0%) | 12 (100.0%) |
| Total (Category) | 0 (0.0%) | 12 (100.0%) |
| Total (Overall) | 16 (57.1%) | 12 (42.9%) |
Natural Resources, Construction and Maintenance Occupations
The most common Natural Resources, Construction and Maintenance occupations in Duncan are , and Installation, Maintenance & Repair (7 | 25.0%).
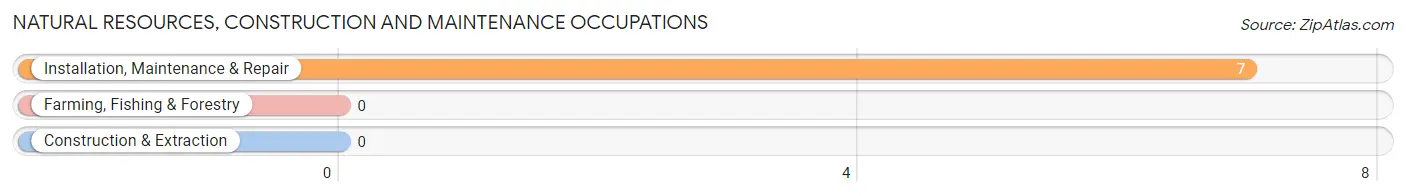
Natural Resources, Construction and Maintenance Occupations by Sex
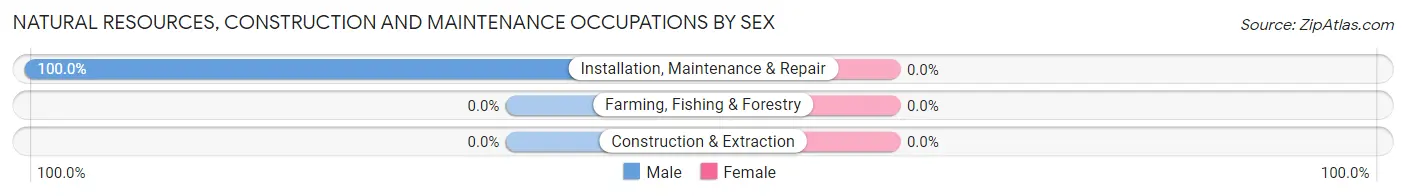
| Occupation | Male | Female |
| Farming, Fishing & Forestry | 0 (0.0%) | 0 (0.0%) |
| Construction & Extraction | 0 (0.0%) | 0 (0.0%) |
| Installation, Maintenance & Repair | 7 (100.0%) | 0 (0.0%) |
| Total (Category) | 7 (100.0%) | 0 (0.0%) |
| Total (Overall) | 16 (57.1%) | 12 (42.9%) |
Production, Transportation and Moving Occupations
The most common Production, Transportation and Moving occupations in Duncan are , and Production (9 | 32.1%).
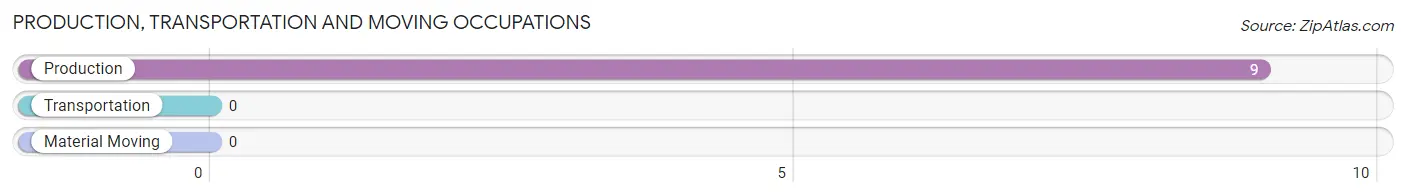
Production, Transportation and Moving Occupations by Sex
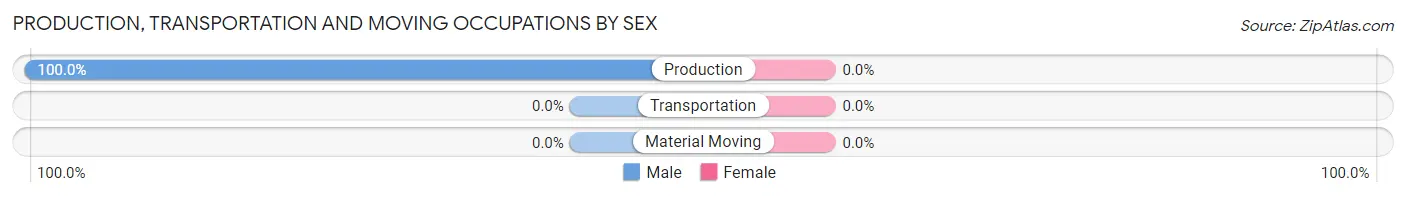
| Occupation | Male | Female |
| Production | 9 (100.0%) | 0 (0.0%) |
| Transportation | 0 (0.0%) | 0 (0.0%) |
| Material Moving | 0 (0.0%) | 0 (0.0%) |
| Total (Category) | 9 (100.0%) | 0 (0.0%) |
| Total (Overall) | 16 (57.1%) | 12 (42.9%) |
Employment Industries by Sex in Duncan
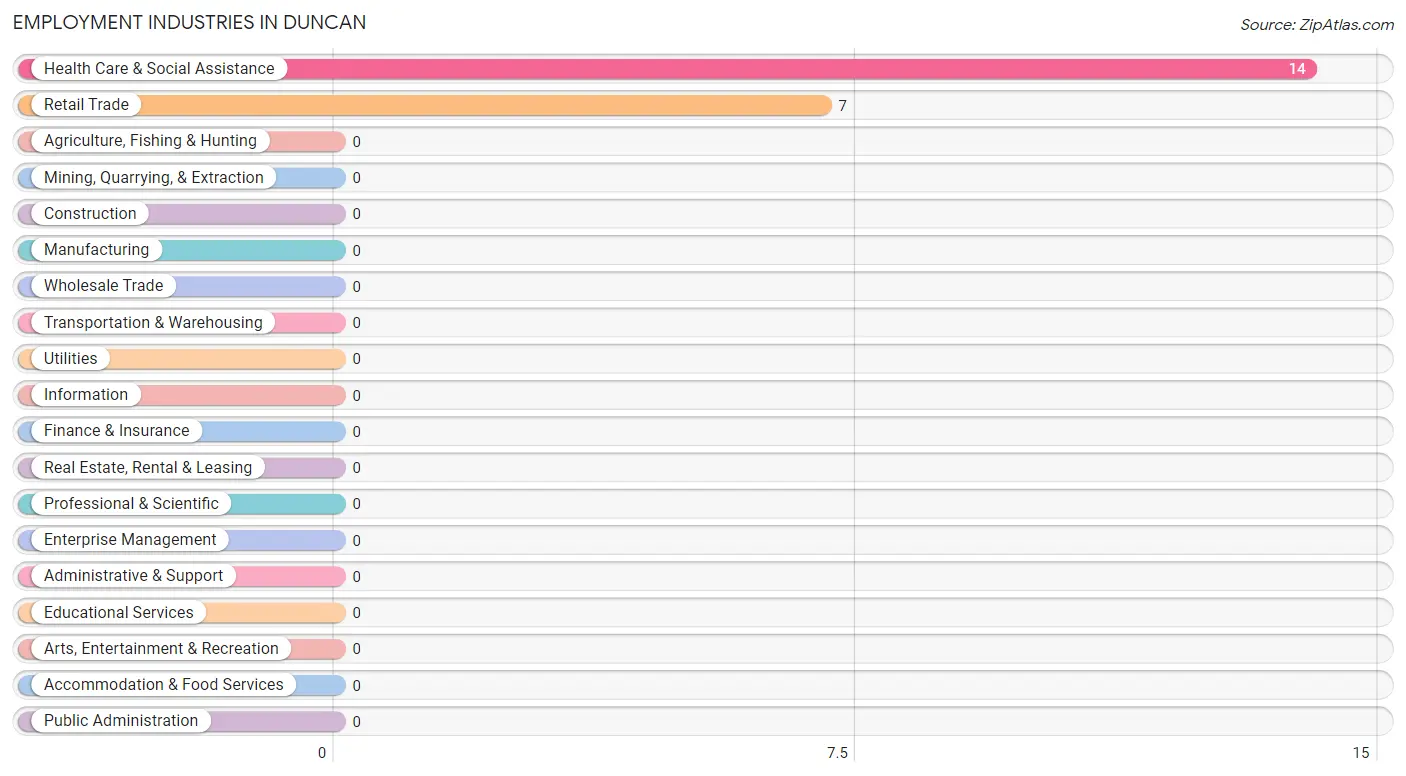
Employment Industries in Duncan
The major employment industries in Duncan include Health Care & Social Assistance (14 | 50.0%), and Retail Trade (7 | 25.0%).
Employment Industries by Sex in Duncan
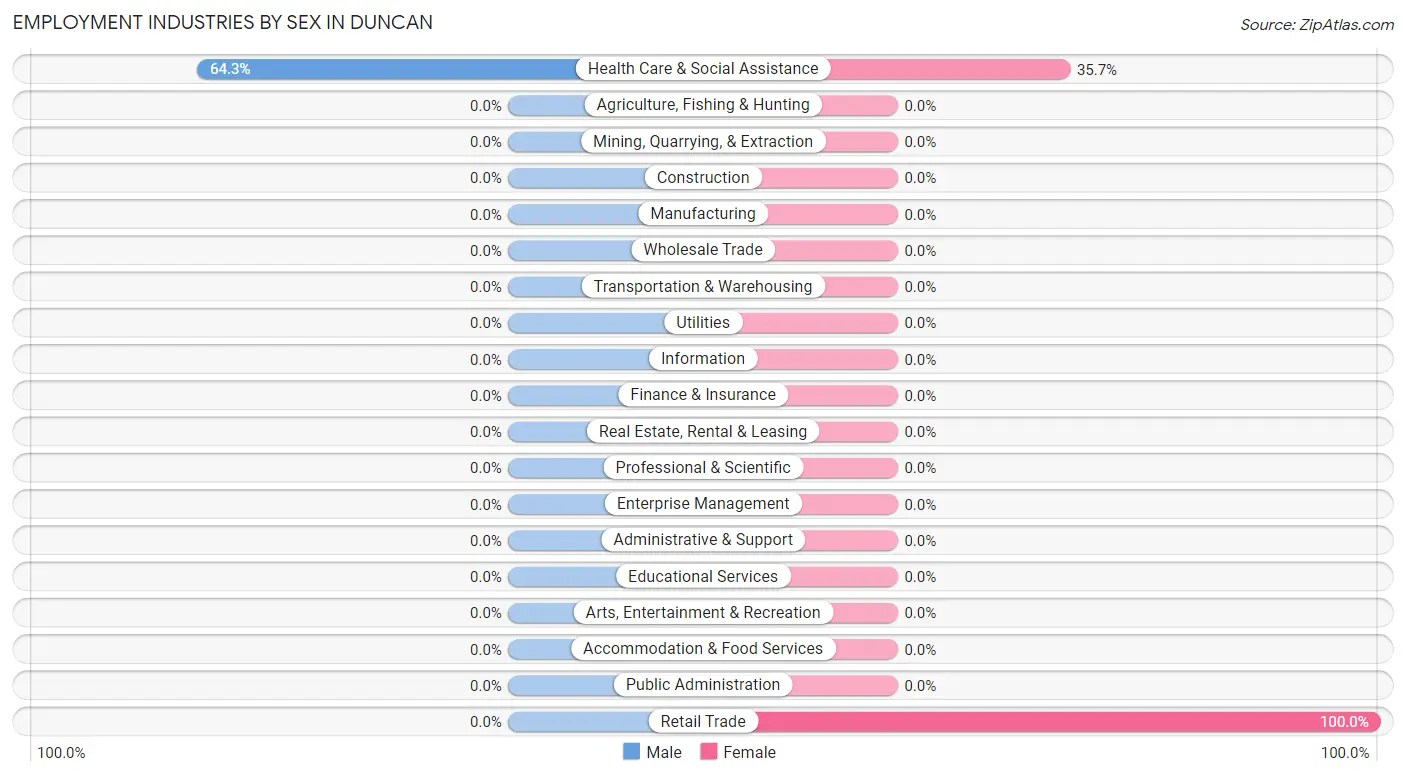
| Industry | Male | Female |
| Agriculture, Fishing & Hunting | 0 (0.0%) | 0 (0.0%) |
| Mining, Quarrying, & Extraction | 0 (0.0%) | 0 (0.0%) |
| Construction | 0 (0.0%) | 0 (0.0%) |
| Manufacturing | 0 (0.0%) | 0 (0.0%) |
| Wholesale Trade | 0 (0.0%) | 0 (0.0%) |
| Retail Trade | 0 (0.0%) | 7 (100.0%) |
| Transportation & Warehousing | 0 (0.0%) | 0 (0.0%) |
| Utilities | 0 (0.0%) | 0 (0.0%) |
| Information | 0 (0.0%) | 0 (0.0%) |
| Finance & Insurance | 0 (0.0%) | 0 (0.0%) |
| Real Estate, Rental & Leasing | 0 (0.0%) | 0 (0.0%) |
| Professional & Scientific | 0 (0.0%) | 0 (0.0%) |
| Enterprise Management | 0 (0.0%) | 0 (0.0%) |
| Administrative & Support | 0 (0.0%) | 0 (0.0%) |
| Educational Services | 0 (0.0%) | 0 (0.0%) |
| Health Care & Social Assistance | 9 (64.3%) | 5 (35.7%) |
| Arts, Entertainment & Recreation | 0 (0.0%) | 0 (0.0%) |
| Accommodation & Food Services | 0 (0.0%) | 0 (0.0%) |
| Public Administration | 0 (0.0%) | 0 (0.0%) |
| Total | 16 (57.1%) | 12 (42.9%) |
Education in Duncan
School Enrollment in Duncan
| School Level | # Students | % Students |
| Nursery / Preschool | 0 | 0.0% |
| Kindergarten | 0 | 0.0% |
| Elementary School | 0 | 0.0% |
| Middle School | 0 | 0.0% |
| High School | 0 | 0.0% |
| College / Undergraduate | 0 | 0.0% |
| Graduate / Professional | 0 | 0.0% |
| Total | 0 | 0.0% |
School Enrollment by Age by Funding Source in Duncan
| Age Bracket | Public School | Private School |
| 3 to 4 Year Olds | 0 (0.0%) | 0 (0.0%) |
| 5 to 9 Year Old | 0 (0.0%) | 0 (0.0%) |
| 10 to 14 Year Olds | 0 (0.0%) | 0 (0.0%) |
| 15 to 17 Year Olds | 0 (0.0%) | 0 (0.0%) |
| 18 to 19 Year Olds | 0 (0.0%) | 0 (0.0%) |
| 20 to 24 Year Olds | 0 (0.0%) | 0 (0.0%) |
| 25 to 34 Year Olds | 0 (0.0%) | 0 (0.0%) |
| 35 Years and over | 0 (0.0%) | 0 (0.0%) |
| Total | 0 (0.0%) | 0 (0.0%) |
Educational Attainment by Field of Study in Duncan
, and bio, nature & agricultural (7 | 100.0%) are the most common fields of study among 7 individuals in Duncan who have obtained a bachelor's degree or higher.
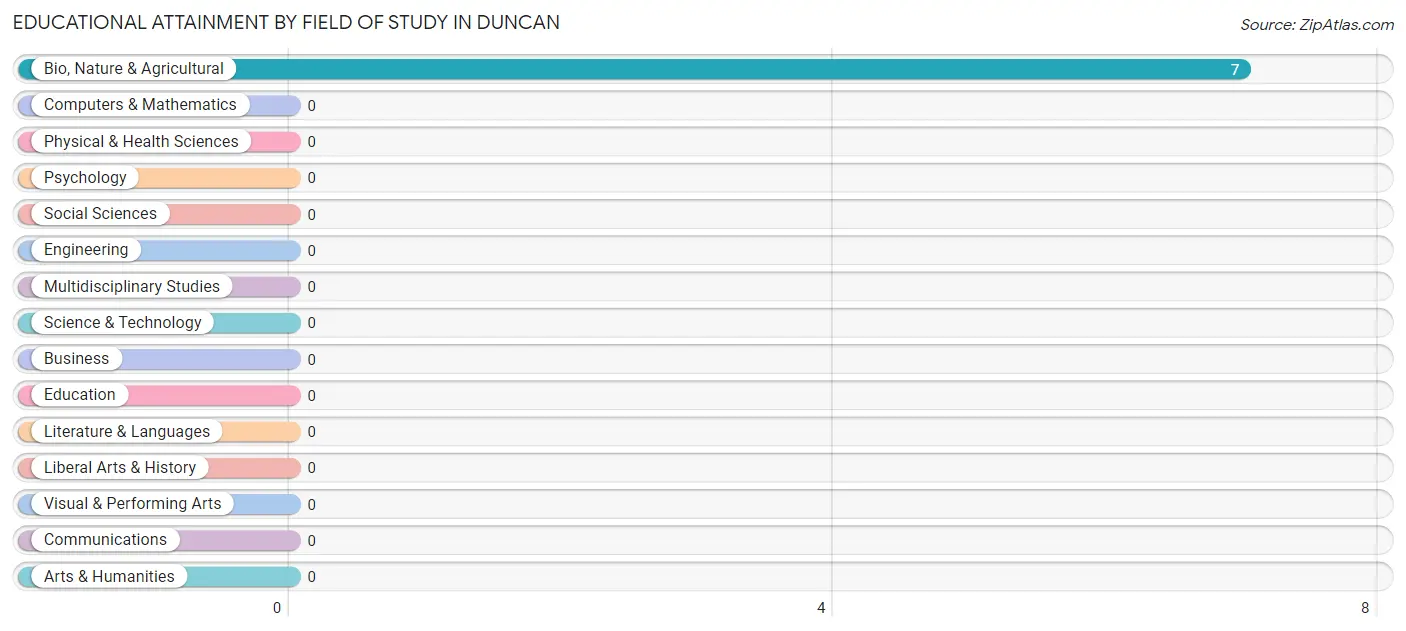
| Field of Study | # Graduates | % Graduates |
| Computers & Mathematics | 0 | 0.0% |
| Bio, Nature & Agricultural | 7 | 100.0% |
| Physical & Health Sciences | 0 | 0.0% |
| Psychology | 0 | 0.0% |
| Social Sciences | 0 | 0.0% |
| Engineering | 0 | 0.0% |
| Multidisciplinary Studies | 0 | 0.0% |
| Science & Technology | 0 | 0.0% |
| Business | 0 | 0.0% |
| Education | 0 | 0.0% |
| Literature & Languages | 0 | 0.0% |
| Liberal Arts & History | 0 | 0.0% |
| Visual & Performing Arts | 0 | 0.0% |
| Communications | 0 | 0.0% |
| Arts & Humanities | 0 | 0.0% |
| Total | 7 | 100.0% |
Transportation & Commute in Duncan
Vehicle Availability by Sex in Duncan
The most prevalent vehicle ownership categories in Duncan are males with 2 vehicles (7, accounting for 100.0%) and females with 2 vehicles (7, making up 58.3%).
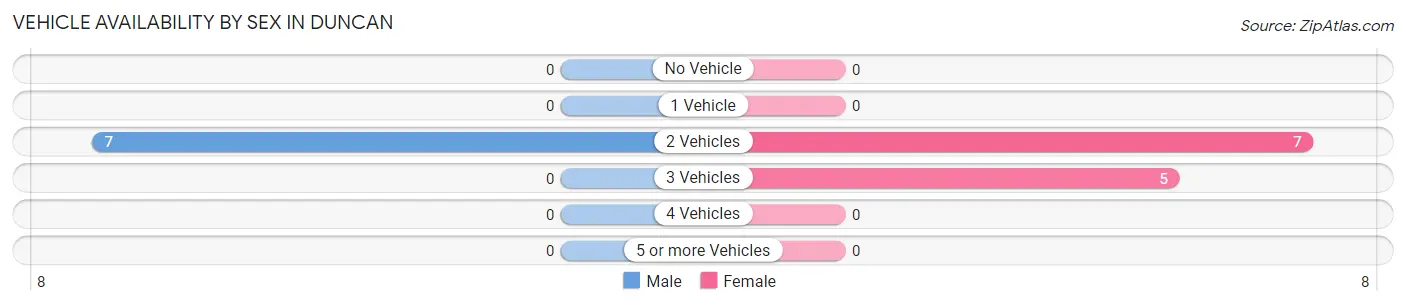
| Vehicles Available | Male | Female |
| No Vehicle | 0 (0.0%) | 0 (0.0%) |
| 1 Vehicle | 0 (0.0%) | 0 (0.0%) |
| 2 Vehicles | 7 (100.0%) | 7 (58.3%) |
| 3 Vehicles | 0 (0.0%) | 5 (41.7%) |
| 4 Vehicles | 0 (0.0%) | 0 (0.0%) |
| 5 or more Vehicles | 0 (0.0%) | 0 (0.0%) |
| Total | 7 (100.0%) | 12 (100.0%) |
Commute Time in Duncan
The most frequently occuring commute durations in Duncan are 5 to 9 minutes (9 commuters, 32.1%), 45 to 59 minutes (7 commuters, 25.0%), and 90 or more minutes (7 commuters, 25.0%).
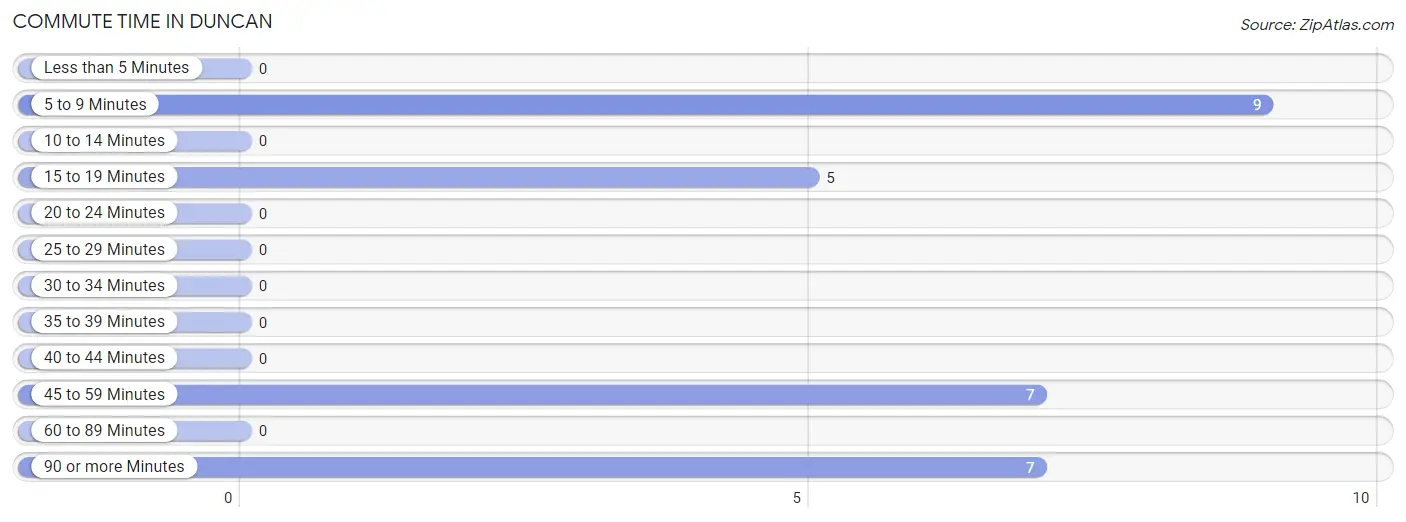
| Commute Time | # Commuters | % Commuters |
| Less than 5 Minutes | 0 | 0.0% |
| 5 to 9 Minutes | 9 | 32.1% |
| 10 to 14 Minutes | 0 | 0.0% |
| 15 to 19 Minutes | 5 | 17.9% |
| 20 to 24 Minutes | 0 | 0.0% |
| 25 to 29 Minutes | 0 | 0.0% |
| 30 to 34 Minutes | 0 | 0.0% |
| 35 to 39 Minutes | 0 | 0.0% |
| 40 to 44 Minutes | 0 | 0.0% |
| 45 to 59 Minutes | 7 | 25.0% |
| 60 to 89 Minutes | 0 | 0.0% |
| 90 or more Minutes | 7 | 25.0% |
Commute Time by Sex in Duncan
The most common commute times in Duncan are 5 to 9 minutes (9 commuters, 56.2%) for males and 45 to 59 minutes (7 commuters, 58.3%) for females.
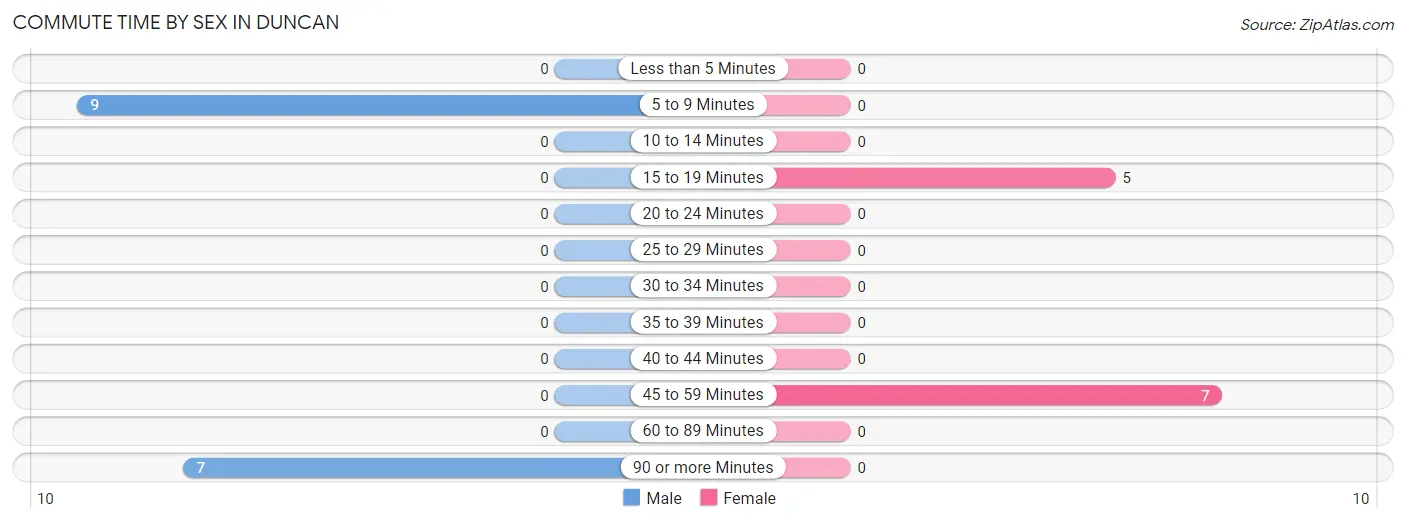
| Commute Time | Male | Female |
| Less than 5 Minutes | 0 (0.0%) | 0 (0.0%) |
| 5 to 9 Minutes | 9 (56.2%) | 0 (0.0%) |
| 10 to 14 Minutes | 0 (0.0%) | 0 (0.0%) |
| 15 to 19 Minutes | 0 (0.0%) | 5 (41.7%) |
| 20 to 24 Minutes | 0 (0.0%) | 0 (0.0%) |
| 25 to 29 Minutes | 0 (0.0%) | 0 (0.0%) |
| 30 to 34 Minutes | 0 (0.0%) | 0 (0.0%) |
| 35 to 39 Minutes | 0 (0.0%) | 0 (0.0%) |
| 40 to 44 Minutes | 0 (0.0%) | 0 (0.0%) |
| 45 to 59 Minutes | 0 (0.0%) | 7 (58.3%) |
| 60 to 89 Minutes | 0 (0.0%) | 0 (0.0%) |
| 90 or more Minutes | 7 (43.8%) | 0 (0.0%) |
Time of Departure to Work by Sex in Duncan
The most frequent times of departure to work in Duncan are 8:00 AM to 8:29 AM (9, 56.2%) for males and 7:30 AM to 7:59 AM (7, 58.3%) for females.
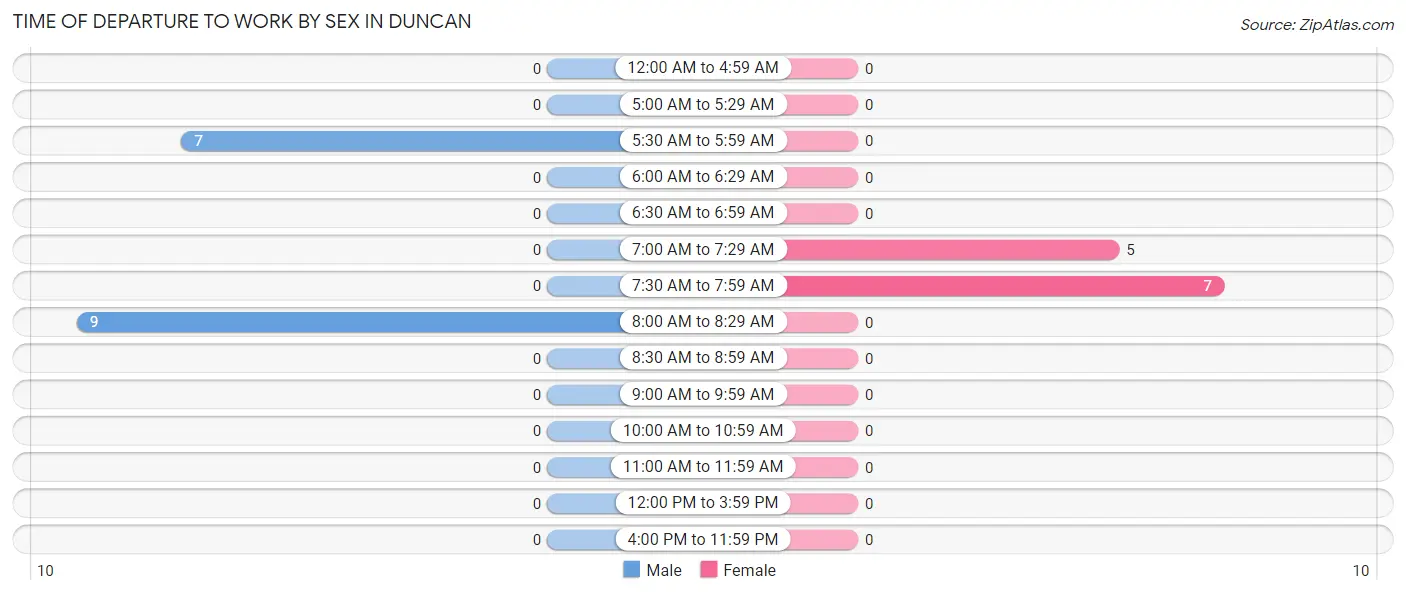
| Time of Departure | Male | Female |
| 12:00 AM to 4:59 AM | 0 (0.0%) | 0 (0.0%) |
| 5:00 AM to 5:29 AM | 0 (0.0%) | 0 (0.0%) |
| 5:30 AM to 5:59 AM | 7 (43.8%) | 0 (0.0%) |
| 6:00 AM to 6:29 AM | 0 (0.0%) | 0 (0.0%) |
| 6:30 AM to 6:59 AM | 0 (0.0%) | 0 (0.0%) |
| 7:00 AM to 7:29 AM | 0 (0.0%) | 5 (41.7%) |
| 7:30 AM to 7:59 AM | 0 (0.0%) | 7 (58.3%) |
| 8:00 AM to 8:29 AM | 9 (56.2%) | 0 (0.0%) |
| 8:30 AM to 8:59 AM | 0 (0.0%) | 0 (0.0%) |
| 9:00 AM to 9:59 AM | 0 (0.0%) | 0 (0.0%) |
| 10:00 AM to 10:59 AM | 0 (0.0%) | 0 (0.0%) |
| 11:00 AM to 11:59 AM | 0 (0.0%) | 0 (0.0%) |
| 12:00 PM to 3:59 PM | 0 (0.0%) | 0 (0.0%) |
| 4:00 PM to 11:59 PM | 0 (0.0%) | 0 (0.0%) |
| Total | 16 (100.0%) | 12 (100.0%) |
Housing Occupancy in Duncan
Occupancy by Ownership in Duncan
Of the total 24 dwellings in Duncan, owner-occupied units account for 19 (79.2%), while renter-occupied units make up 5 (20.8%).
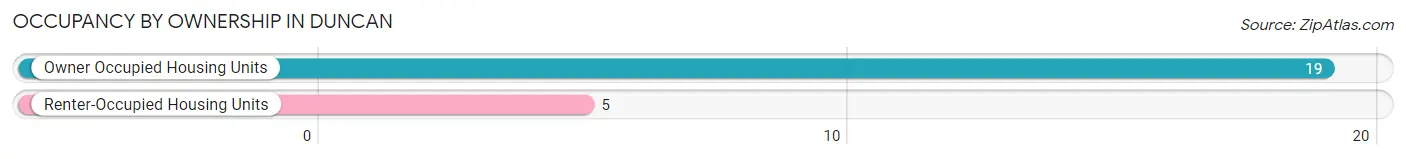
| Occupancy | # Housing Units | % Housing Units |
| Owner Occupied Housing Units | 19 | 79.2% |
| Renter-Occupied Housing Units | 5 | 20.8% |
| Total Occupied Housing Units | 24 | 100.0% |
Occupancy by Household Size in Duncan
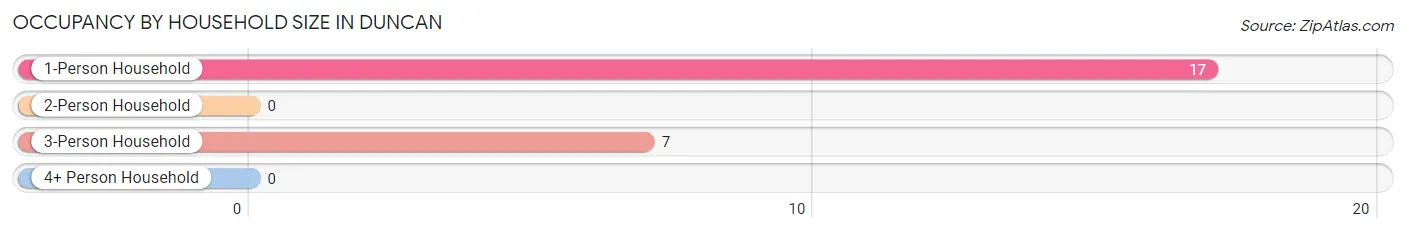
| Household Size | # Housing Units | % Housing Units |
| 1-Person Household | 17 | 70.8% |
| 2-Person Household | 0 | 0.0% |
| 3-Person Household | 7 | 29.2% |
| 4+ Person Household | 0 | 0.0% |
| Total Housing Units | 24 | 100.0% |
Occupancy by Ownership by Household Size in Duncan
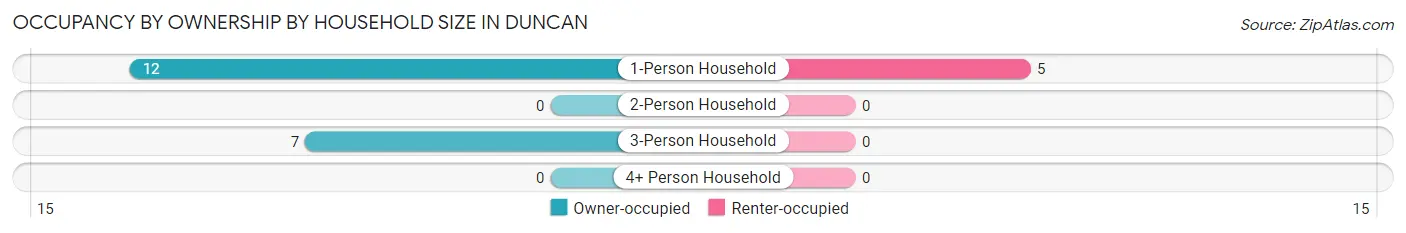
| Household Size | Owner-occupied | Renter-occupied |
| 1-Person Household | 12 (70.6%) | 5 (29.4%) |
| 2-Person Household | 0 (0.0%) | 0 (0.0%) |
| 3-Person Household | 7 (100.0%) | 0 (0.0%) |
| 4+ Person Household | 0 (0.0%) | 0 (0.0%) |
| Total Housing Units | 19 (79.2%) | 5 (20.8%) |
Occupancy by Educational Attainment in Duncan
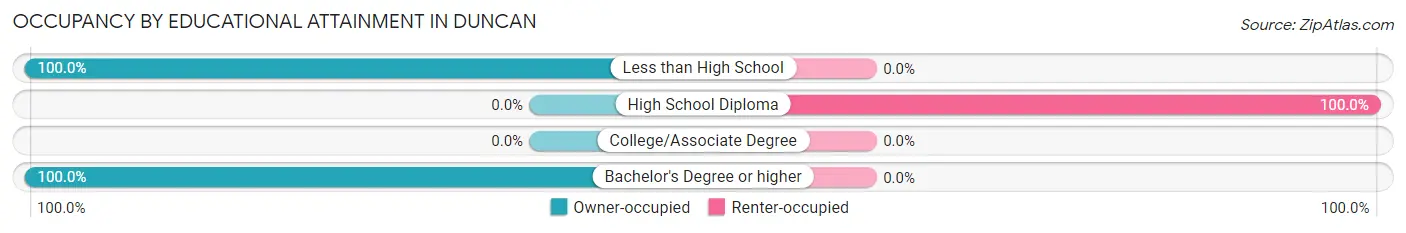
| Household Size | Owner-occupied | Renter-occupied |
| Less than High School | 12 (100.0%) | 0 (0.0%) |
| High School Diploma | 0 (0.0%) | 5 (100.0%) |
| College/Associate Degree | 0 (0.0%) | 0 (0.0%) |
| Bachelor's Degree or higher | 7 (100.0%) | 0 (0.0%) |
Occupancy by Age of Householder in Duncan
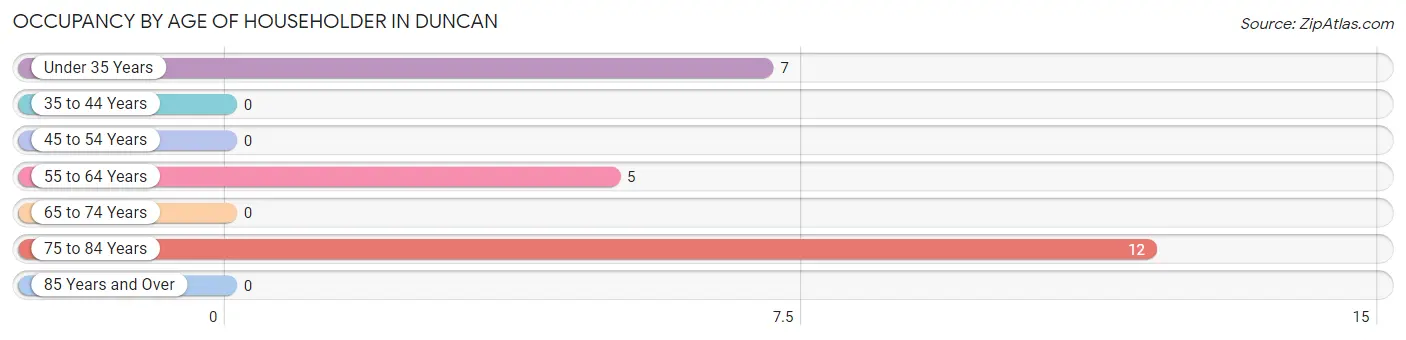
| Age Bracket | # Households | % Households |
| Under 35 Years | 7 | 29.2% |
| 35 to 44 Years | 0 | 0.0% |
| 45 to 54 Years | 0 | 0.0% |
| 55 to 64 Years | 5 | 20.8% |
| 65 to 74 Years | 0 | 0.0% |
| 75 to 84 Years | 12 | 50.0% |
| 85 Years and Over | 0 | 0.0% |
| Total | 24 | 100.0% |
Housing Finances in Duncan
Median Income by Occupancy in Duncan
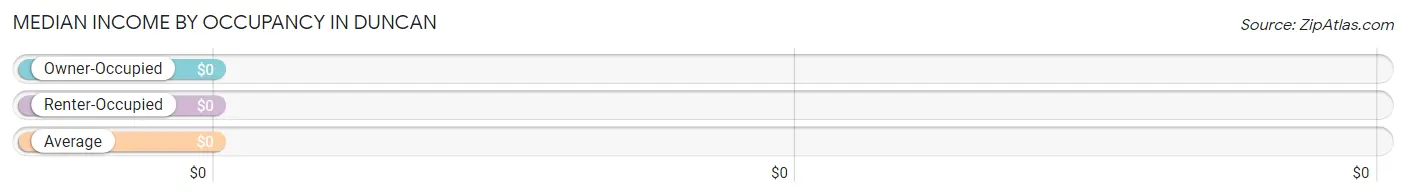
| Occupancy Type | # Households | Median Income |
| Owner-Occupied | 19 (79.2%) | $0 |
| Renter-Occupied | 5 (20.8%) | $0 |
| Average | 24 (100.0%) | $0 |
Occupancy by Householder Income Bracket in Duncan
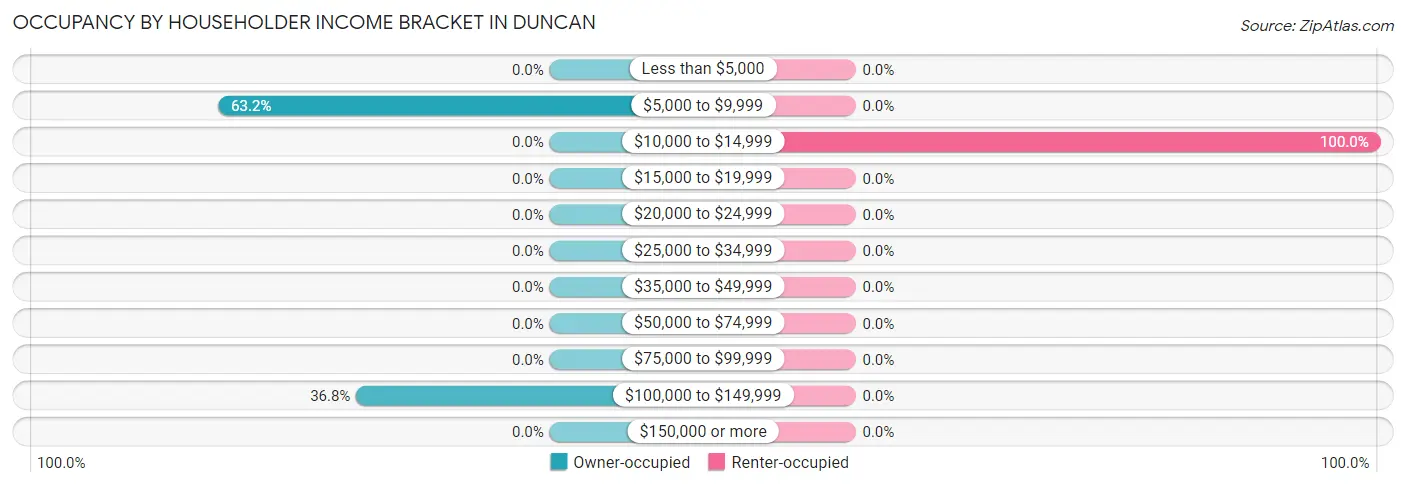
| Income Bracket | Owner-occupied | Renter-occupied |
| Less than $5,000 | 0 (0.0%) | 0 (0.0%) |
| $5,000 to $9,999 | 12 (63.2%) | 0 (0.0%) |
| $10,000 to $14,999 | 0 (0.0%) | 5 (100.0%) |
| $15,000 to $19,999 | 0 (0.0%) | 0 (0.0%) |
| $20,000 to $24,999 | 0 (0.0%) | 0 (0.0%) |
| $25,000 to $34,999 | 0 (0.0%) | 0 (0.0%) |
| $35,000 to $49,999 | 0 (0.0%) | 0 (0.0%) |
| $50,000 to $74,999 | 0 (0.0%) | 0 (0.0%) |
| $75,000 to $99,999 | 0 (0.0%) | 0 (0.0%) |
| $100,000 to $149,999 | 7 (36.8%) | 0 (0.0%) |
| $150,000 or more | 0 (0.0%) | 0 (0.0%) |
| Total | 19 (100.0%) | 5 (100.0%) |
Monthly Housing Cost Tiers in Duncan
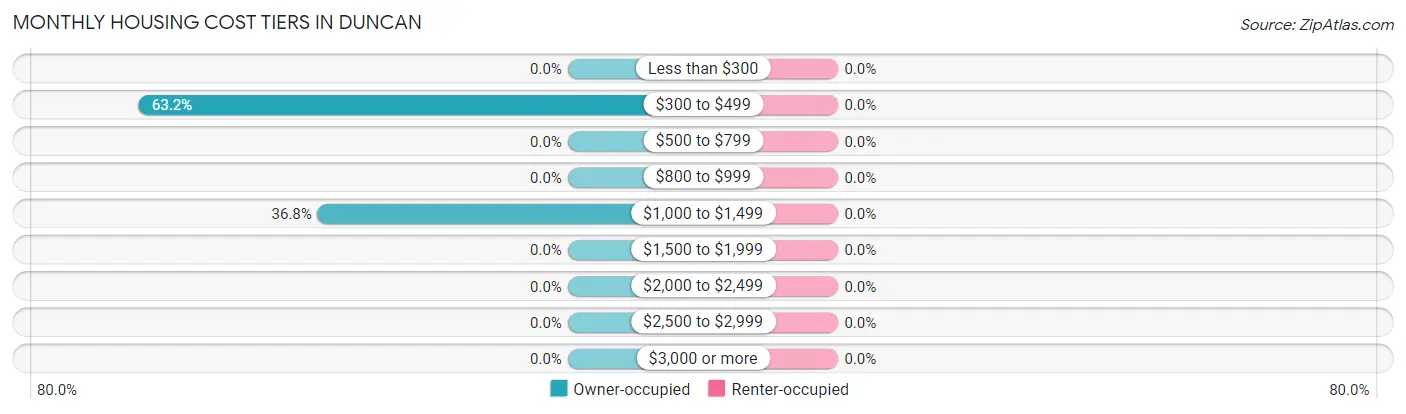
| Monthly Cost | Owner-occupied | Renter-occupied |
| Less than $300 | 0 (0.0%) | 0 (0.0%) |
| $300 to $499 | 12 (63.2%) | 0 (0.0%) |
| $500 to $799 | 0 (0.0%) | 0 (0.0%) |
| $800 to $999 | 0 (0.0%) | 0 (0.0%) |
| $1,000 to $1,499 | 7 (36.8%) | 0 (0.0%) |
| $1,500 to $1,999 | 0 (0.0%) | 0 (0.0%) |
| $2,000 to $2,499 | 0 (0.0%) | 0 (0.0%) |
| $2,500 to $2,999 | 0 (0.0%) | 0 (0.0%) |
| $3,000 or more | 0 (0.0%) | 0 (0.0%) |
| Total | 19 (100.0%) | 5 (100.0%) |
Physical Housing Characteristics in Duncan
Housing Structures in Duncan
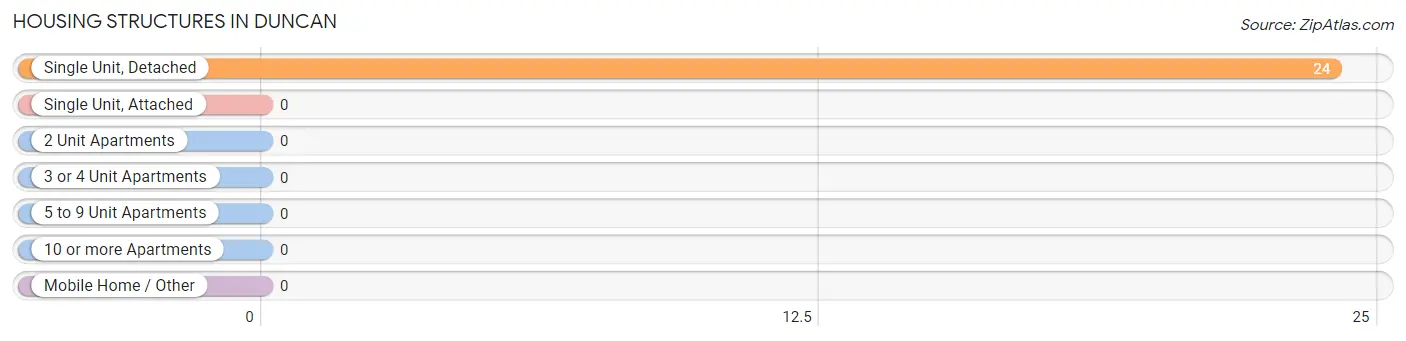
| Structure Type | # Housing Units | % Housing Units |
| Single Unit, Detached | 24 | 100.0% |
| Single Unit, Attached | 0 | 0.0% |
| 2 Unit Apartments | 0 | 0.0% |
| 3 or 4 Unit Apartments | 0 | 0.0% |
| 5 to 9 Unit Apartments | 0 | 0.0% |
| 10 or more Apartments | 0 | 0.0% |
| Mobile Home / Other | 0 | 0.0% |
| Total | 24 | 100.0% |
Housing Structures by Occupancy in Duncan
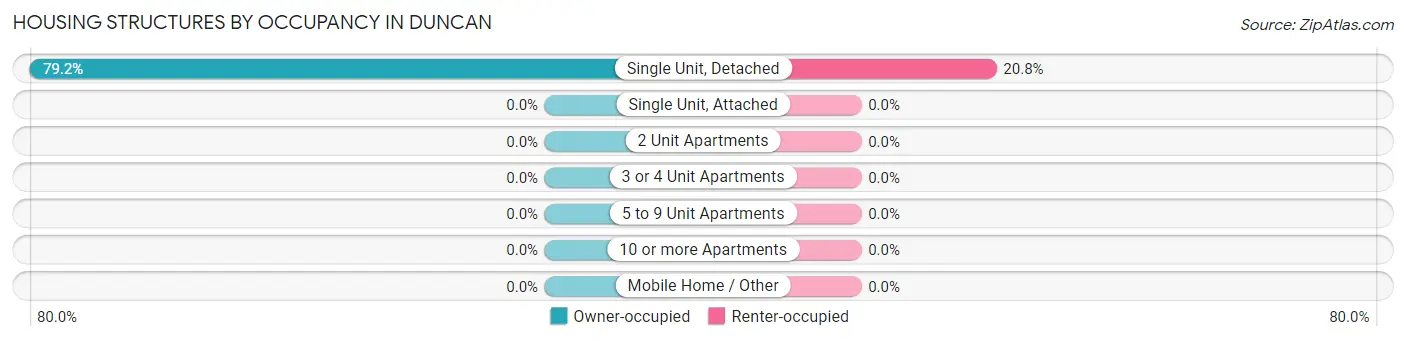
| Structure Type | Owner-occupied | Renter-occupied |
| Single Unit, Detached | 19 (79.2%) | 5 (20.8%) |
| Single Unit, Attached | 0 (0.0%) | 0 (0.0%) |
| 2 Unit Apartments | 0 (0.0%) | 0 (0.0%) |
| 3 or 4 Unit Apartments | 0 (0.0%) | 0 (0.0%) |
| 5 to 9 Unit Apartments | 0 (0.0%) | 0 (0.0%) |
| 10 or more Apartments | 0 (0.0%) | 0 (0.0%) |
| Mobile Home / Other | 0 (0.0%) | 0 (0.0%) |
| Total | 19 (79.2%) | 5 (20.8%) |
Housing Structures by Number of Rooms in Duncan
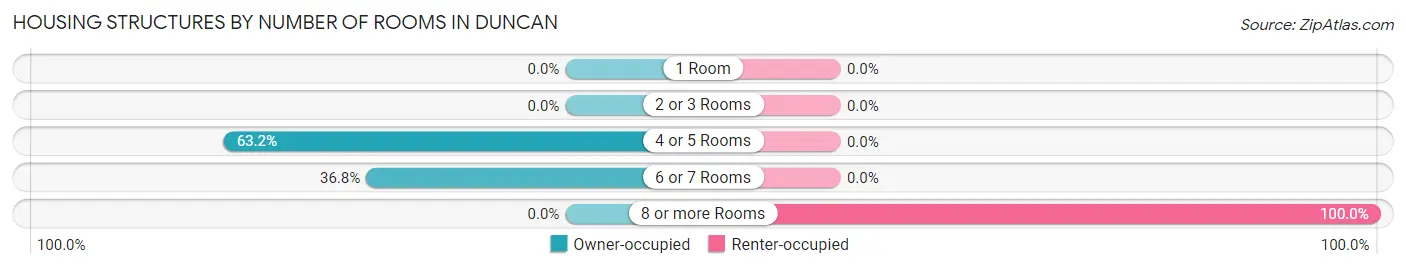
| Number of Rooms | Owner-occupied | Renter-occupied |
| 1 Room | 0 (0.0%) | 0 (0.0%) |
| 2 or 3 Rooms | 0 (0.0%) | 0 (0.0%) |
| 4 or 5 Rooms | 12 (63.2%) | 0 (0.0%) |
| 6 or 7 Rooms | 7 (36.8%) | 0 (0.0%) |
| 8 or more Rooms | 0 (0.0%) | 5 (100.0%) |
| Total | 19 (100.0%) | 5 (100.0%) |
Housing Structure by Heating Type in Duncan
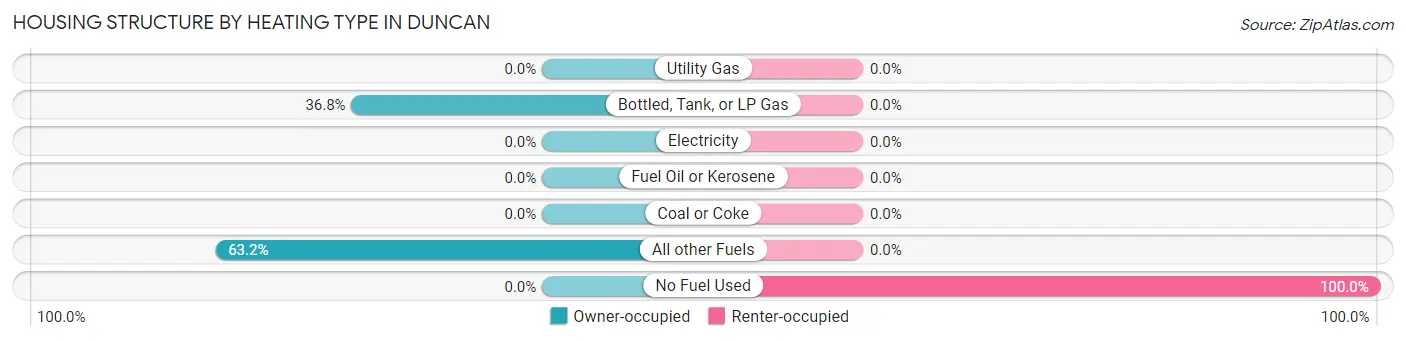
| Heating Type | Owner-occupied | Renter-occupied |
| Utility Gas | 0 (0.0%) | 0 (0.0%) |
| Bottled, Tank, or LP Gas | 7 (36.8%) | 0 (0.0%) |
| Electricity | 0 (0.0%) | 0 (0.0%) |
| Fuel Oil or Kerosene | 0 (0.0%) | 0 (0.0%) |
| Coal or Coke | 0 (0.0%) | 0 (0.0%) |
| All other Fuels | 12 (63.2%) | 0 (0.0%) |
| No Fuel Used | 0 (0.0%) | 5 (100.0%) |
| Total | 19 (100.0%) | 5 (100.0%) |
Household Vehicle Usage in Duncan
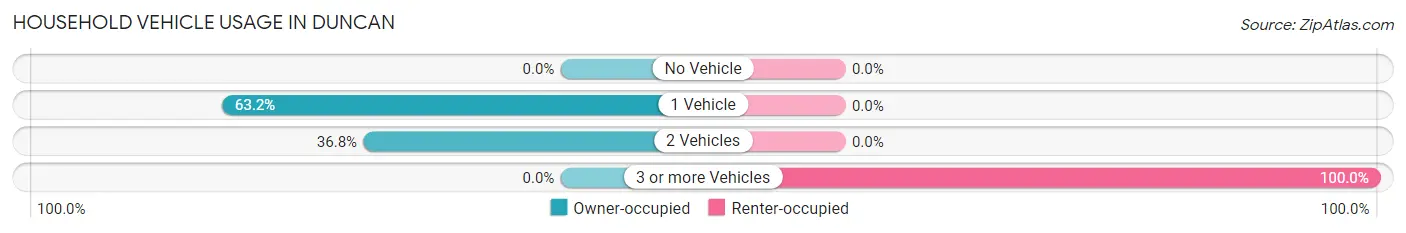
| Vehicles per Household | Owner-occupied | Renter-occupied |
| No Vehicle | 0 (0.0%) | 0 (0.0%) |
| 1 Vehicle | 12 (63.2%) | 0 (0.0%) |
| 2 Vehicles | 7 (36.8%) | 0 (0.0%) |
| 3 or more Vehicles | 0 (0.0%) | 5 (100.0%) |
| Total | 19 (100.0%) | 5 (100.0%) |
Real Estate & Mortgages in Duncan
Real Estate and Mortgage Overview in Duncan
| Characteristic | Without Mortgage | With Mortgage |
| Housing Units | 12 | 7 |
| Median Property Value | - | - |
| Median Household Income | - | - |
| Monthly Housing Costs | - | - |
| Real Estate Taxes | - | - |
Property Value by Mortgage Status in Duncan
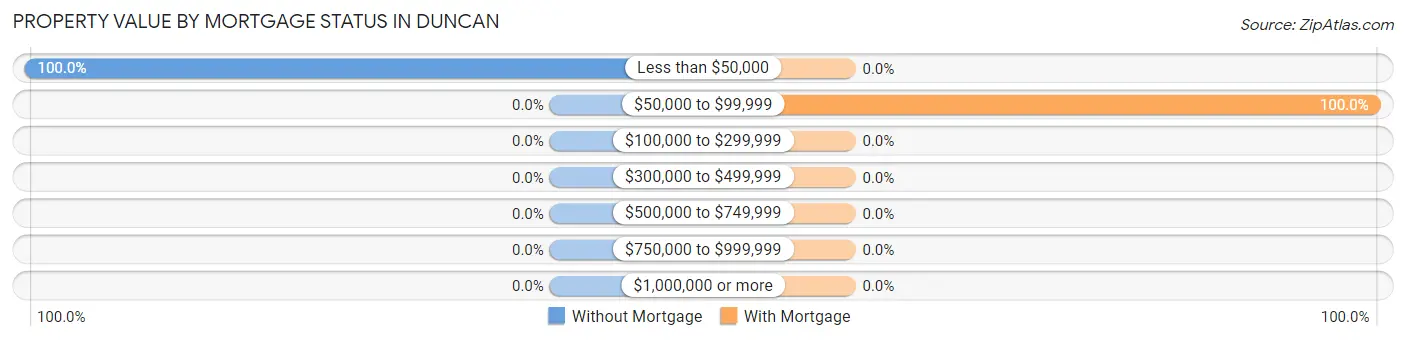
| Property Value | Without Mortgage | With Mortgage |
| Less than $50,000 | 12 (100.0%) | 0 (0.0%) |
| $50,000 to $99,999 | 0 (0.0%) | 7 (100.0%) |
| $100,000 to $299,999 | 0 (0.0%) | 0 (0.0%) |
| $300,000 to $499,999 | 0 (0.0%) | 0 (0.0%) |
| $500,000 to $749,999 | 0 (0.0%) | 0 (0.0%) |
| $750,000 to $999,999 | 0 (0.0%) | 0 (0.0%) |
| $1,000,000 or more | 0 (0.0%) | 0 (0.0%) |
| Total | 12 (100.0%) | 7 (100.0%) |
Household Income by Mortgage Status in Duncan
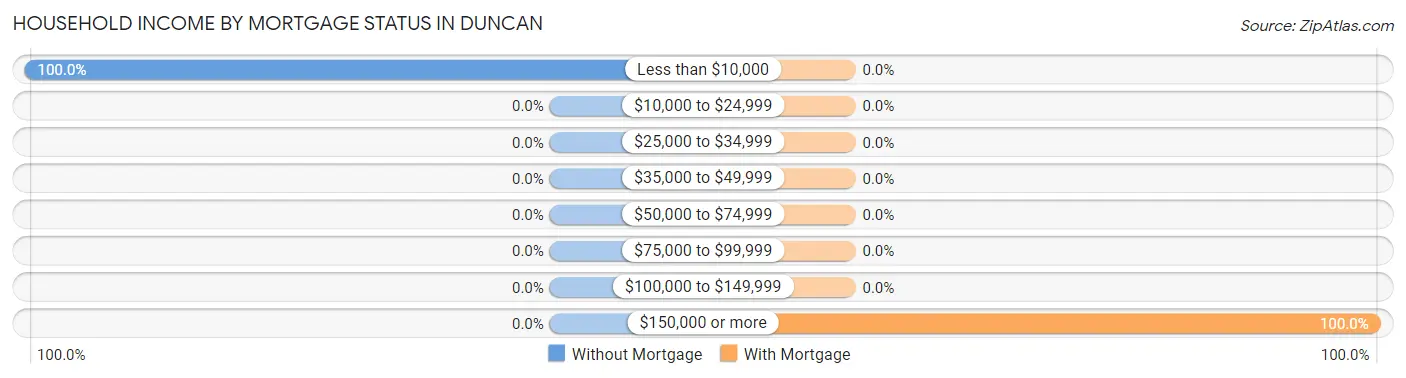
| Household Income | Without Mortgage | With Mortgage |
| Less than $10,000 | 12 (100.0%) | 0 (0.0%) |
| $10,000 to $24,999 | 0 (0.0%) | 0 (0.0%) |
| $25,000 to $34,999 | 0 (0.0%) | 0 (0.0%) |
| $35,000 to $49,999 | 0 (0.0%) | 0 (0.0%) |
| $50,000 to $74,999 | 0 (0.0%) | 0 (0.0%) |
| $75,000 to $99,999 | 0 (0.0%) | 0 (0.0%) |
| $100,000 to $149,999 | 0 (0.0%) | 0 (0.0%) |
| $150,000 or more | 0 (0.0%) | 7 (100.0%) |
| Total | 12 (100.0%) | 7 (100.0%) |
Property Value to Household Income Ratio in Duncan
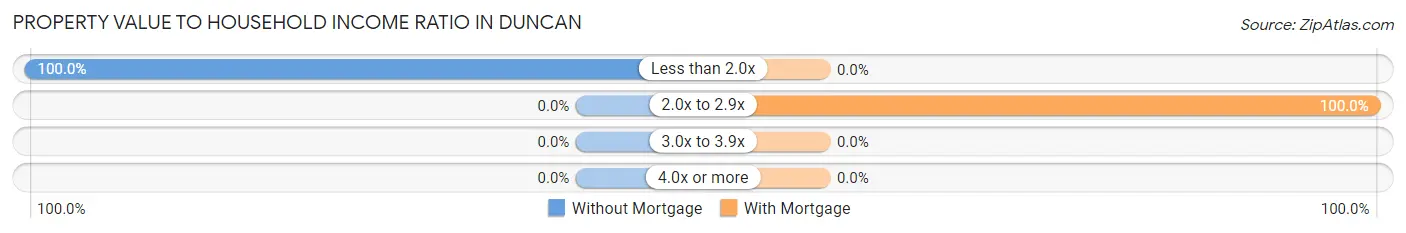
| Value-to-Income Ratio | Without Mortgage | With Mortgage |
| Less than 2.0x | 12 (100.0%) | 0 (0.0%) |
| 2.0x to 2.9x | 0 (0.0%) | 7 (100.0%) |
| 3.0x to 3.9x | 0 (0.0%) | 0 (0.0%) |
| 4.0x or more | 0 (0.0%) | 0 (0.0%) |
| Total | 12 (100.0%) | 7 (100.0%) |
Real Estate Taxes by Mortgage Status in Duncan
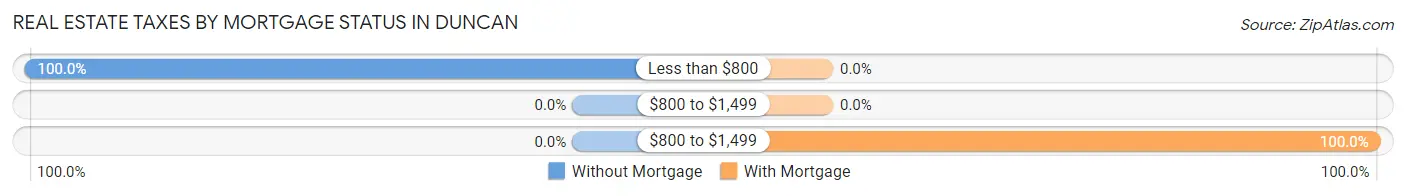
| Property Taxes | Without Mortgage | With Mortgage |
| Less than $800 | 12 (100.0%) | 0 (0.0%) |
| $800 to $1,499 | 0 (0.0%) | 0 (0.0%) |
| $800 to $1,499 | 0 (0.0%) | 7 (100.0%) |
| Total | 12 (100.0%) | 7 (100.0%) |
Health & Disability in Duncan
Health Insurance Coverage by Age in Duncan
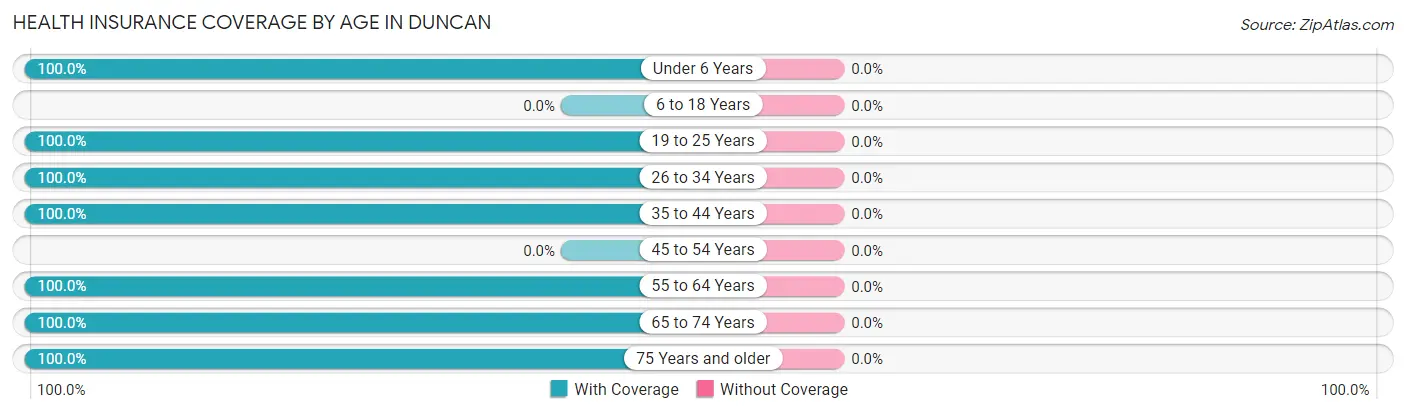
| Age Bracket | With Coverage | Without Coverage |
| Under 6 Years | 10 (100.0%) | 0 (0.0%) |
| 6 to 18 Years | 0 (0.0%) | 0 (0.0%) |
| 19 to 25 Years | 9 (100.0%) | 0 (0.0%) |
| 26 to 34 Years | 25 (100.0%) | 0 (0.0%) |
| 35 to 44 Years | 10 (100.0%) | 0 (0.0%) |
| 45 to 54 Years | 0 (0.0%) | 0 (0.0%) |
| 55 to 64 Years | 5 (100.0%) | 0 (0.0%) |
| 65 to 74 Years | 9 (100.0%) | 0 (0.0%) |
| 75 Years and older | 12 (100.0%) | 0 (0.0%) |
| Total | 80 (100.0%) | 0 (0.0%) |
Health Insurance Coverage by Citizenship Status in Duncan
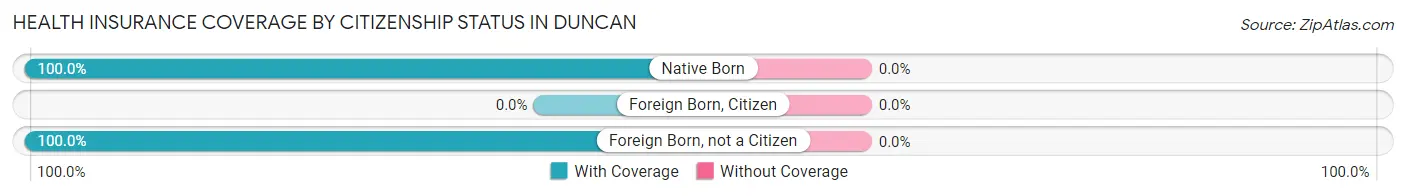
| Citizenship Status | With Coverage | Without Coverage |
| Native Born | 10 (100.0%) | 0 (0.0%) |
| Foreign Born, Citizen | 0 (0.0%) | 0 (0.0%) |
| Foreign Born, not a Citizen | 9 (100.0%) | 0 (0.0%) |
Health Insurance Coverage by Household Income in Duncan
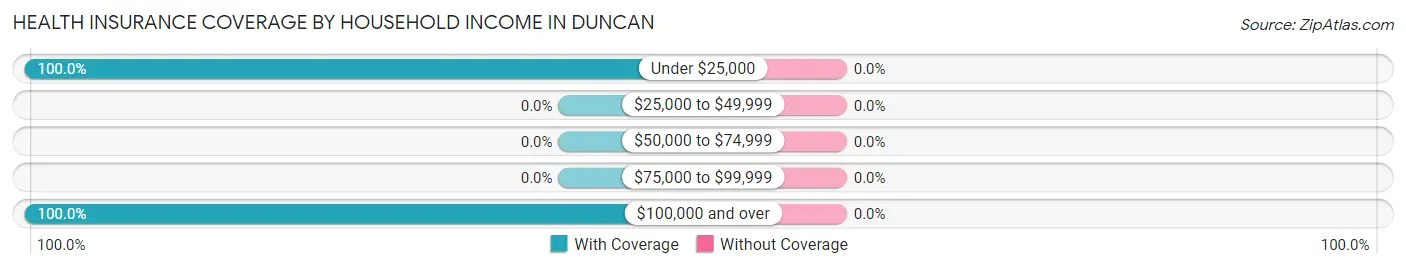
| Household Income | With Coverage | Without Coverage |
| Under $25,000 | 17 (100.0%) | 0 (0.0%) |
| $25,000 to $49,999 | 0 (0.0%) | 0 (0.0%) |
| $50,000 to $74,999 | 0 (0.0%) | 0 (0.0%) |
| $75,000 to $99,999 | 0 (0.0%) | 0 (0.0%) |
| $100,000 and over | 24 (100.0%) | 0 (0.0%) |
Public vs Private Health Insurance Coverage by Age in Duncan
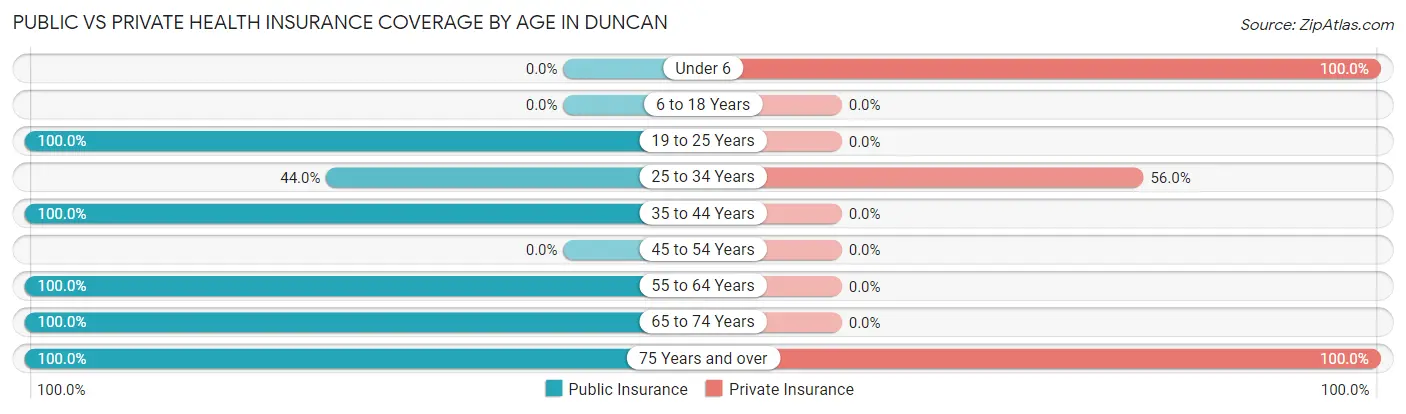
| Age Bracket | Public Insurance | Private Insurance |
| Under 6 | 0 (0.0%) | 10 (100.0%) |
| 6 to 18 Years | 0 (0.0%) | 0 (0.0%) |
| 19 to 25 Years | 9 (100.0%) | 0 (0.0%) |
| 25 to 34 Years | 11 (44.0%) | 14 (56.0%) |
| 35 to 44 Years | 10 (100.0%) | 0 (0.0%) |
| 45 to 54 Years | 0 (0.0%) | 0 (0.0%) |
| 55 to 64 Years | 5 (100.0%) | 0 (0.0%) |
| 65 to 74 Years | 9 (100.0%) | 0 (0.0%) |
| 75 Years and over | 12 (100.0%) | 12 (100.0%) |
| Total | 56 (70.0%) | 36 (45.0%) |
Disability Status by Sex by Age in Duncan
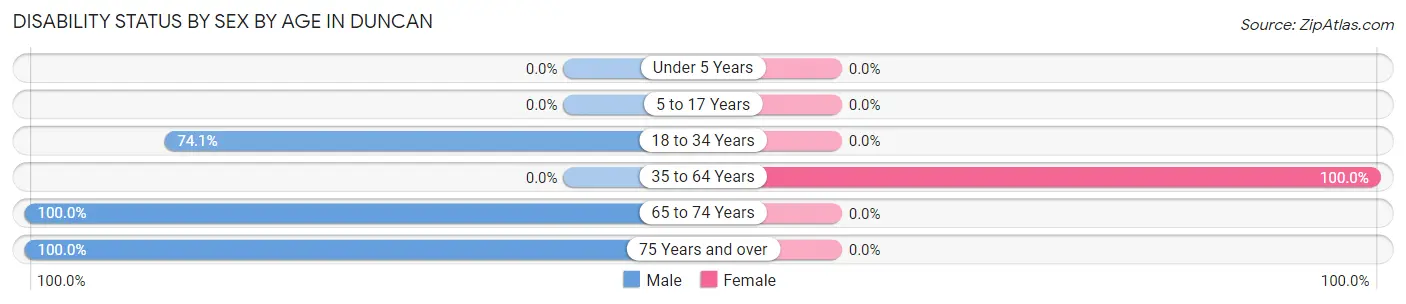
| Age Bracket | Male | Female |
| Under 5 Years | 0 (0.0%) | 0 (0.0%) |
| 5 to 17 Years | 0 (0.0%) | 0 (0.0%) |
| 18 to 34 Years | 20 (74.1%) | 0 (0.0%) |
| 35 to 64 Years | 0 (0.0%) | 15 (100.0%) |
| 65 to 74 Years | 9 (100.0%) | 0 (0.0%) |
| 75 Years and over | 12 (100.0%) | 0 (0.0%) |
Disability Class by Sex by Age in Duncan
Disability Class: Hearing Difficulty
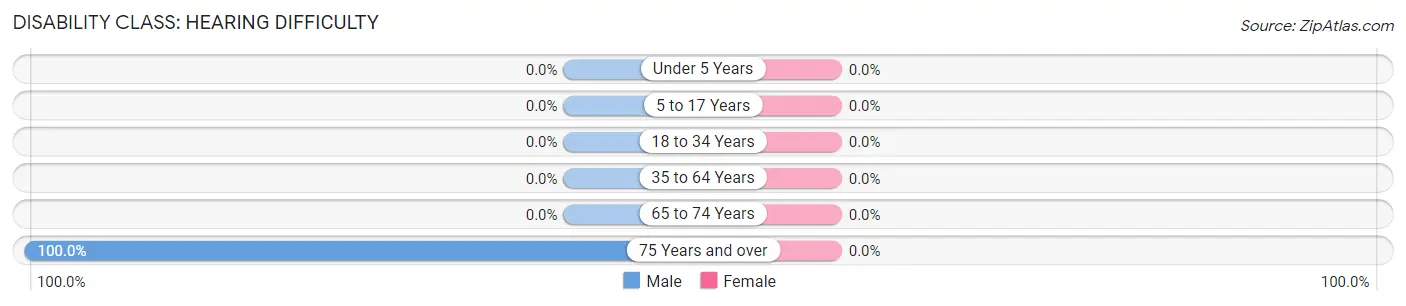
| Age Bracket | Male | Female |
| Under 5 Years | 0 (0.0%) | 0 (0.0%) |
| 5 to 17 Years | 0 (0.0%) | 0 (0.0%) |
| 18 to 34 Years | 0 (0.0%) | 0 (0.0%) |
| 35 to 64 Years | 0 (0.0%) | 0 (0.0%) |
| 65 to 74 Years | 0 (0.0%) | 0 (0.0%) |
| 75 Years and over | 12 (100.0%) | 0 (0.0%) |
Disability Class: Vision Difficulty
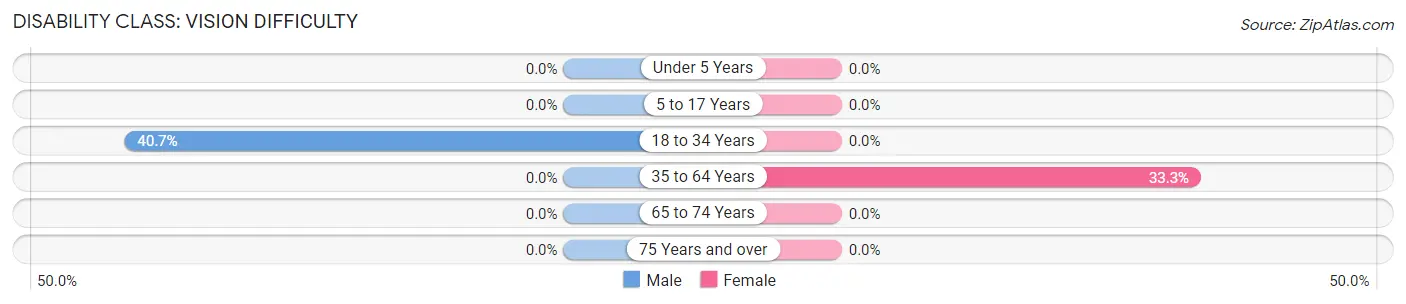
| Age Bracket | Male | Female |
| Under 5 Years | 0 (0.0%) | 0 (0.0%) |
| 5 to 17 Years | 0 (0.0%) | 0 (0.0%) |
| 18 to 34 Years | 11 (40.7%) | 0 (0.0%) |
| 35 to 64 Years | 0 (0.0%) | 5 (33.3%) |
| 65 to 74 Years | 0 (0.0%) | 0 (0.0%) |
| 75 Years and over | 0 (0.0%) | 0 (0.0%) |
Disability Class: Cognitive Difficulty
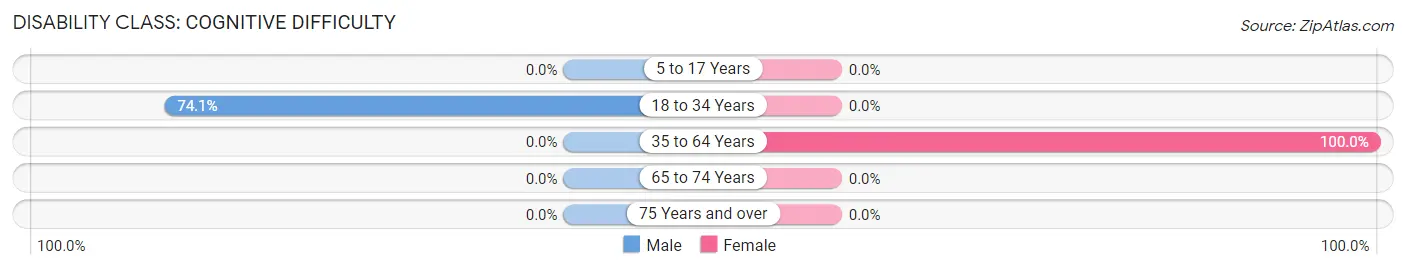
| Age Bracket | Male | Female |
| 5 to 17 Years | 0 (0.0%) | 0 (0.0%) |
| 18 to 34 Years | 20 (74.1%) | 0 (0.0%) |
| 35 to 64 Years | 0 (0.0%) | 15 (100.0%) |
| 65 to 74 Years | 0 (0.0%) | 0 (0.0%) |
| 75 Years and over | 0 (0.0%) | 0 (0.0%) |
Disability Class: Ambulatory Difficulty
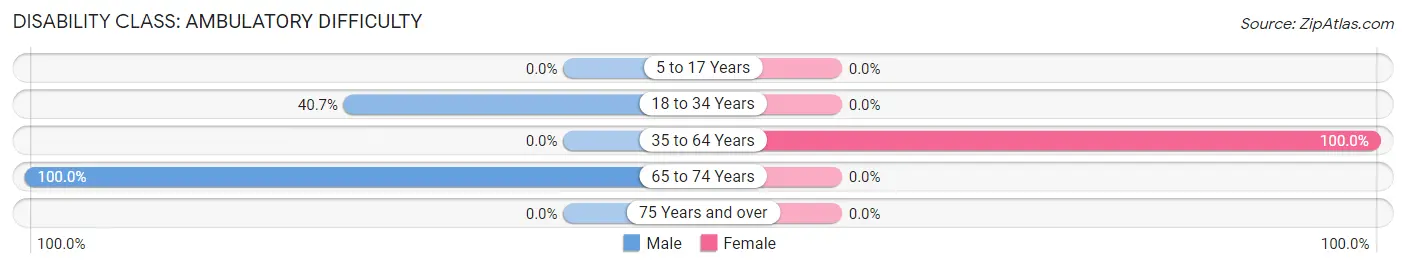
| Age Bracket | Male | Female |
| 5 to 17 Years | 0 (0.0%) | 0 (0.0%) |
| 18 to 34 Years | 11 (40.7%) | 0 (0.0%) |
| 35 to 64 Years | 0 (0.0%) | 15 (100.0%) |
| 65 to 74 Years | 9 (100.0%) | 0 (0.0%) |
| 75 Years and over | 0 (0.0%) | 0 (0.0%) |
Disability Class: Self-Care Difficulty
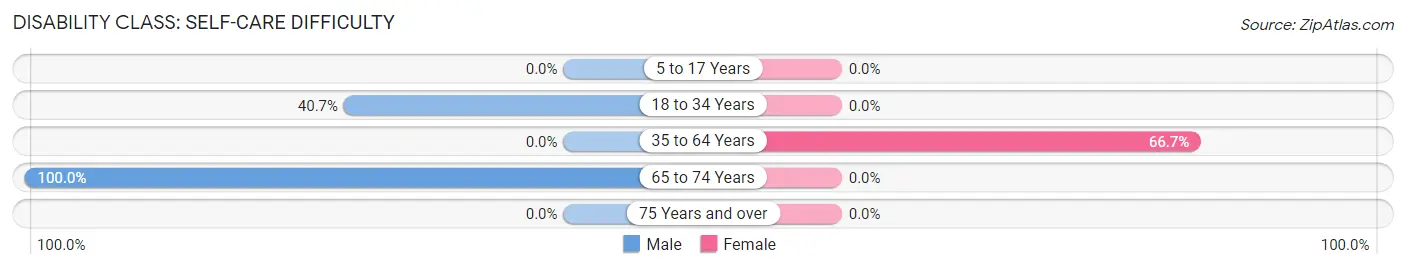
| Age Bracket | Male | Female |
| 5 to 17 Years | 0 (0.0%) | 0 (0.0%) |
| 18 to 34 Years | 11 (40.7%) | 0 (0.0%) |
| 35 to 64 Years | 0 (0.0%) | 10 (66.7%) |
| 65 to 74 Years | 9 (100.0%) | 0 (0.0%) |
| 75 Years and over | 0 (0.0%) | 0 (0.0%) |
Technology Access in Duncan
Computing Device Access in Duncan
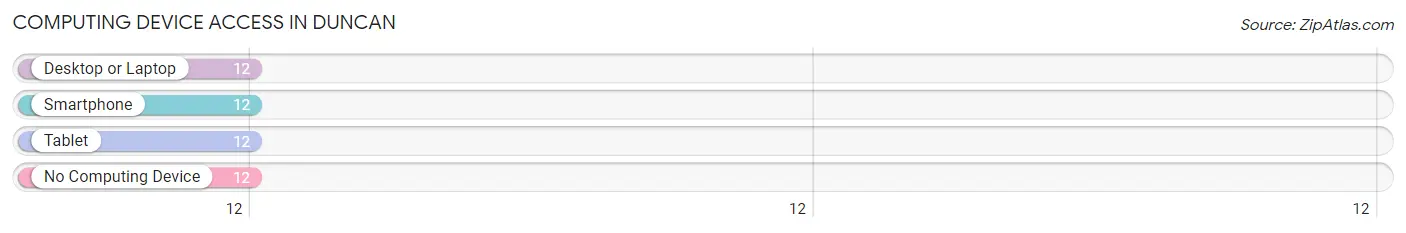
| Device Type | # Households | % Households |
| Desktop or Laptop | 12 | 50.0% |
| Smartphone | 12 | 50.0% |
| Tablet | 12 | 50.0% |
| No Computing Device | 12 | 50.0% |
| Total | 24 | 100.0% |
Internet Access in Duncan
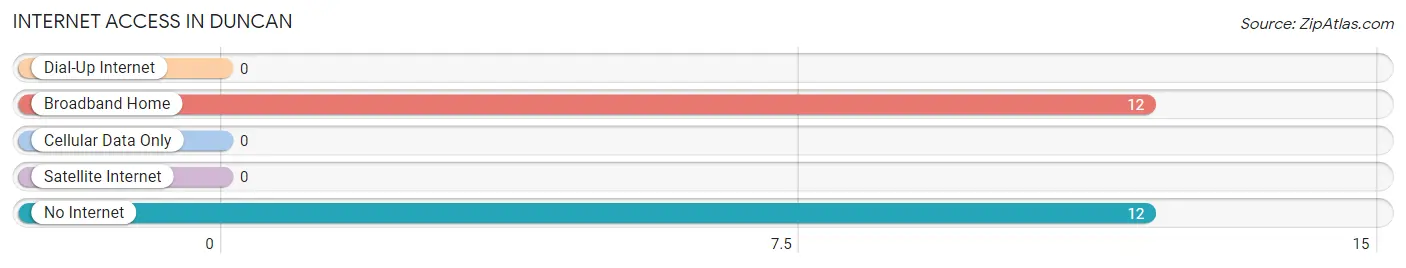
| Internet Type | # Households | % Households |
| Dial-Up Internet | 0 | 0.0% |
| Broadband Home | 12 | 50.0% |
| Cellular Data Only | 0 | 0.0% |
| Satellite Internet | 0 | 0.0% |
| No Internet | 12 | 50.0% |
| Total | 24 | 100.0% |
Duncan Summary
Duncan, Iowa is a small town located in the southwestern corner of the state, in the county of Harrison. It is situated on the banks of the Missouri River, and is home to a population of just over 500 people. The town was founded in 1854, and has a rich history of farming, industry, and commerce.
Geography
Duncan is located in the southwestern corner of Iowa, in Harrison County. It is situated on the banks of the Missouri River, and is surrounded by rolling hills and farmland. The town is located approximately 25 miles from the state capital of Des Moines, and is within easy driving distance of Omaha, Nebraska. The town is also close to the Loess Hills, a region of steep, rolling hills that are unique to the area.
Economy
The economy of Duncan is largely based on agriculture and industry. The town is home to several large farms, which produce a variety of crops, including corn, soybeans, and wheat. The town also has a number of small businesses, including a grocery store, a hardware store, and a few restaurants. In addition, the town is home to a number of manufacturing companies, which produce a variety of products, including furniture, clothing, and automotive parts.
Demographics
As of the 2010 census, the population of Duncan was 514. The town is predominantly white, with a small minority population of African Americans, Hispanics, and Asians. The median household income in the town is $41,250, and the median age is 43. The town has a high rate of homeownership, with nearly 80% of the population owning their own homes.
History
Duncan was founded in 1854, and was originally known as “Harrisonville.” The town was named after William Henry Harrison, the ninth president of the United States. The town was originally a farming community, and the first settlers were primarily of German and Irish descent. In the late 19th century, the town began to experience a period of growth and prosperity, as the railroad was built through the area. This allowed for the transportation of goods and people, and the town began to develop into a commercial center.
In the early 20th century, the town experienced a period of decline, as the railroad was abandoned and the population began to decline. However, in the late 20th century, the town began to experience a resurgence, as new businesses and industries began to move into the area. Today, Duncan is a small but vibrant town, with a strong sense of community and a rich history.
Common Questions
What is Per Capita Income in Duncan?
Per Capita income in Duncan is $22,245.
What is Inequality or Gini Index in Duncan?
Inequality or Gini Index in Duncan is 0.56.
What is the Total Population of Duncan?
Total Population of Duncan is 80.
What is the Total Male Population of Duncan?
Total Male Population of Duncan is 58.
What is the Total Female Population of Duncan?
Total Female Population of Duncan is 22.
What is the Ratio of Males per 100 Females in Duncan?
There are 263.64 Males per 100 Females in Duncan.
What is the Ratio of Females per 100 Males in Duncan?
There are 37.93 Females per 100 Males in Duncan.
What is the Median Population Age in Duncan?
Median Population Age in Duncan is 34.4 Years.
What is the Average Family Size in Duncan
Average Family Size in Duncan is 3.4 People.
What is the Average Household Size in Duncan
Average Household Size in Duncan is 1.7 People.
How Large is the Labor Force in Duncan?
There are 28 People in the Labor Forcein in Duncan.
What is the Percentage of People in the Labor Force in Duncan?
40.0% of People are in the Labor Force in Duncan.