Rickardsville, IA Map & Demographics
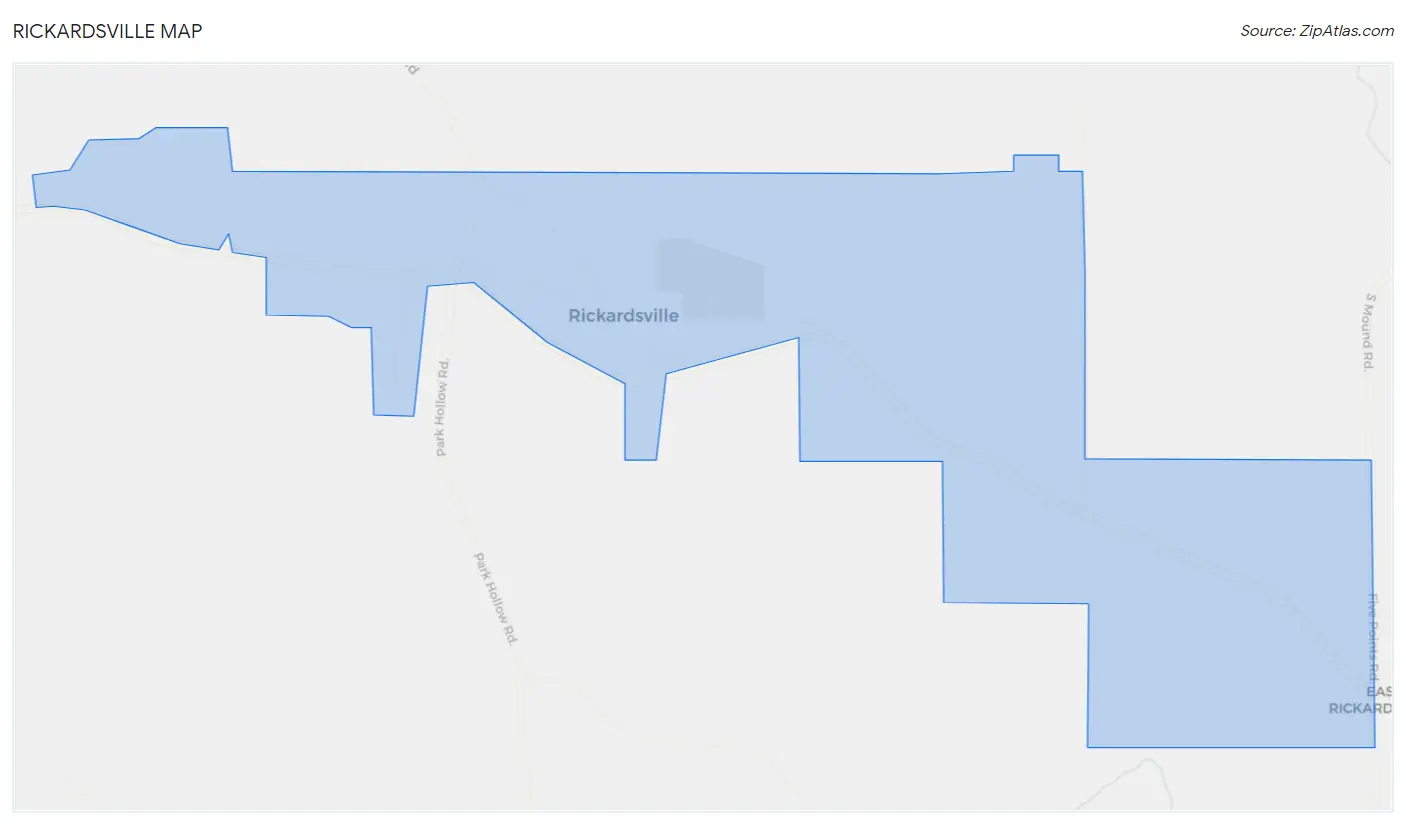
Rickardsville Map
Rickardsville Overview
$33,998
PER CAPITA INCOME
$104,464
AVG FAMILY INCOME
$94,375
AVG HOUSEHOLD INCOME
11.3%
WAGE / INCOME GAP [ % ]
88.7¢/ $1
WAGE / INCOME GAP [ $ ]
0.28
INEQUALITY / GINI INDEX
258
TOTAL POPULATION
136
MALE POPULATION
122
FEMALE POPULATION
111.48
MALES / 100 FEMALES
89.71
FEMALES / 100 MALES
33.9
MEDIAN AGE
3.4
AVG FAMILY SIZE
2.9
AVG HOUSEHOLD SIZE
125
LABOR FORCE [ PEOPLE ]
71.4%
PERCENT IN LABOR FORCE
0.8%
UNEMPLOYMENT RATE
Income in Rickardsville
Income Overview in Rickardsville
Per Capita Income in Rickardsville is $33,998, while median incomes of families and households are $104,464 and $94,375 respectively.
| Characteristic | Number | Measure |
| Per Capita Income | 258 | $33,998 |
| Median Family Income | 67 | $104,464 |
| Mean Family Income | 67 | $113,913 |
| Median Household Income | 90 | $94,375 |
| Mean Household Income | 90 | $97,703 |
| Income Deficit | 67 | $0 |
| Wage / Income Gap (%) | 258 | 11.29% |
| Wage / Income Gap ($) | 258 | 88.71¢ per $1 |
| Gini / Inequality Index | 258 | 0.28 |
Earnings by Sex in Rickardsville
Average Earnings in Rickardsville are $52,250, $53,750 for men and $47,679 for women, a difference of 11.3%.
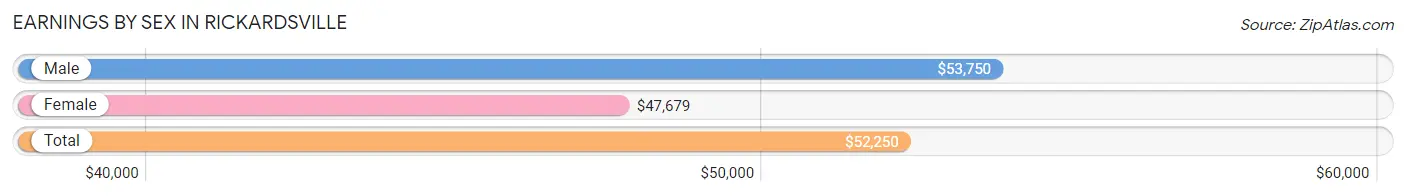
| Sex | Number | Average Earnings |
| Male | 82 (61.7%) | $53,750 |
| Female | 51 (38.4%) | $47,679 |
| Total | 133 (100.0%) | $52,250 |
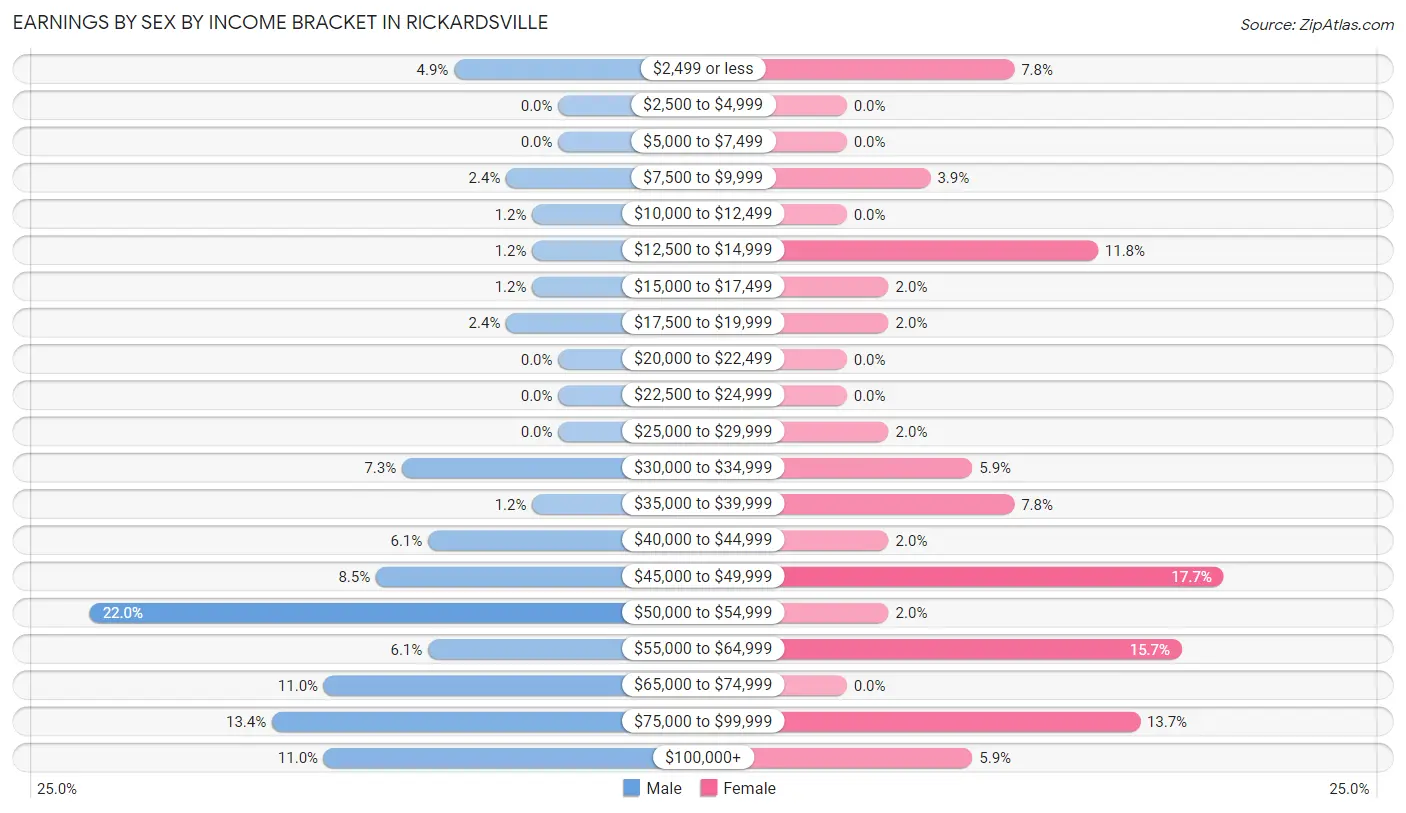
Earnings by Sex by Income Bracket in Rickardsville
The most common earnings brackets in Rickardsville are $50,000 to $54,999 for men (18 | 22.0%) and $45,000 to $49,999 for women (9 | 17.6%).
| Income | Male | Female |
| $2,499 or less | 4 (4.9%) | 4 (7.8%) |
| $2,500 to $4,999 | 0 (0.0%) | 0 (0.0%) |
| $5,000 to $7,499 | 0 (0.0%) | 0 (0.0%) |
| $7,500 to $9,999 | 2 (2.4%) | 2 (3.9%) |
| $10,000 to $12,499 | 1 (1.2%) | 0 (0.0%) |
| $12,500 to $14,999 | 1 (1.2%) | 6 (11.8%) |
| $15,000 to $17,499 | 1 (1.2%) | 1 (2.0%) |
| $17,500 to $19,999 | 2 (2.4%) | 1 (2.0%) |
| $20,000 to $22,499 | 0 (0.0%) | 0 (0.0%) |
| $22,500 to $24,999 | 0 (0.0%) | 0 (0.0%) |
| $25,000 to $29,999 | 0 (0.0%) | 1 (2.0%) |
| $30,000 to $34,999 | 6 (7.3%) | 3 (5.9%) |
| $35,000 to $39,999 | 1 (1.2%) | 4 (7.8%) |
| $40,000 to $44,999 | 5 (6.1%) | 1 (2.0%) |
| $45,000 to $49,999 | 7 (8.5%) | 9 (17.6%) |
| $50,000 to $54,999 | 18 (22.0%) | 1 (2.0%) |
| $55,000 to $64,999 | 5 (6.1%) | 8 (15.7%) |
| $65,000 to $74,999 | 9 (11.0%) | 0 (0.0%) |
| $75,000 to $99,999 | 11 (13.4%) | 7 (13.7%) |
| $100,000+ | 9 (11.0%) | 3 (5.9%) |
| Total | 82 (100.0%) | 51 (100.0%) |
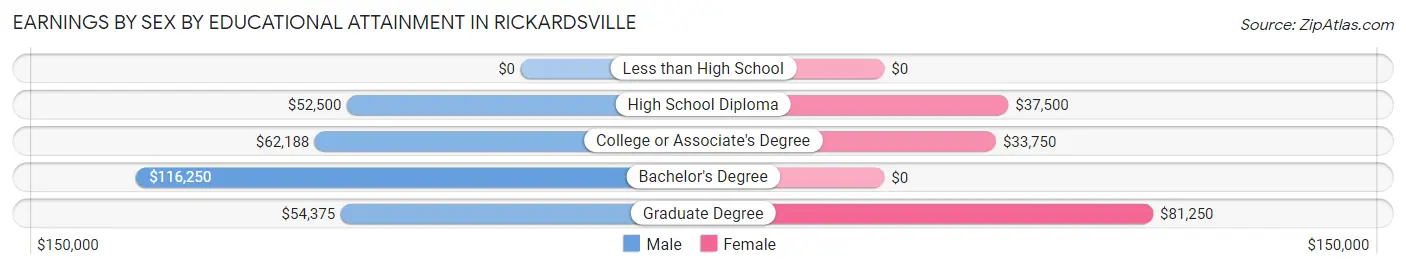
Earnings by Sex by Educational Attainment in Rickardsville
Average earnings in Rickardsville are $54,196 for men and $48,214 for women, a difference of 11.0%. Men with an educational attainment of bachelor's degree enjoy the highest average annual earnings of $116,250, while those with high school diploma education earn the least with $52,500. Women with an educational attainment of graduate degree earn the most with the average annual earnings of $81,250, while those with college or associate's degree education have the smallest earnings of $33,750.
| Educational Attainment | Male Income | Female Income |
| Less than High School | - | - |
| High School Diploma | $52,500 | $37,500 |
| College or Associate's Degree | $62,188 | $33,750 |
| Bachelor's Degree | $116,250 | $0 |
| Graduate Degree | $54,375 | $81,250 |
| Total | $54,196 | $48,214 |
Family Income in Rickardsville
Family Income Brackets in Rickardsville
According to the Rickardsville family income data, there are 31 families falling into the $100,000 to $149,999 income range, which is the most common income bracket and makes up 46.3% of all families.
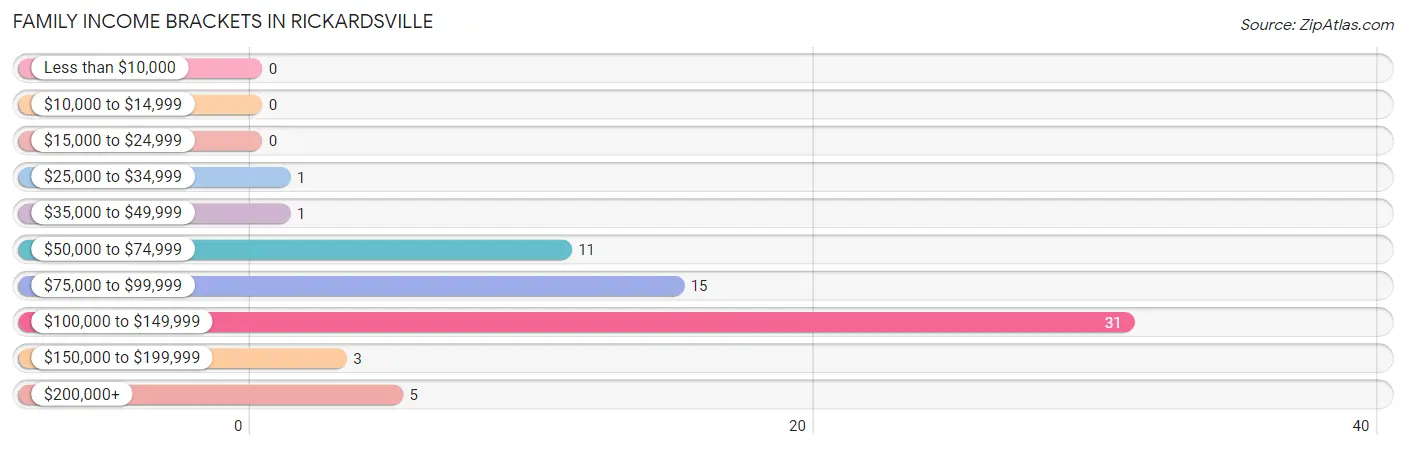
| Income Bracket | # Families | % Families |
| Less than $10,000 | 0 | 0.0% |
| $10,000 to $14,999 | 0 | 0.0% |
| $15,000 to $24,999 | 0 | 0.0% |
| $25,000 to $34,999 | 1 | 1.5% |
| $35,000 to $49,999 | 1 | 1.5% |
| $50,000 to $74,999 | 11 | 16.4% |
| $75,000 to $99,999 | 15 | 22.4% |
| $100,000 to $149,999 | 31 | 46.3% |
| $150,000 to $199,999 | 3 | 4.5% |
| $200,000+ | 5 | 7.5% |
Family Income by Famaliy Size in Rickardsville
5-person families (19 | 28.4%) account for the highest median family income in Rickardsville with $126,875 per family, while 2-person families (31 | 46.3%) have the highest median income of $39,844 per family member.
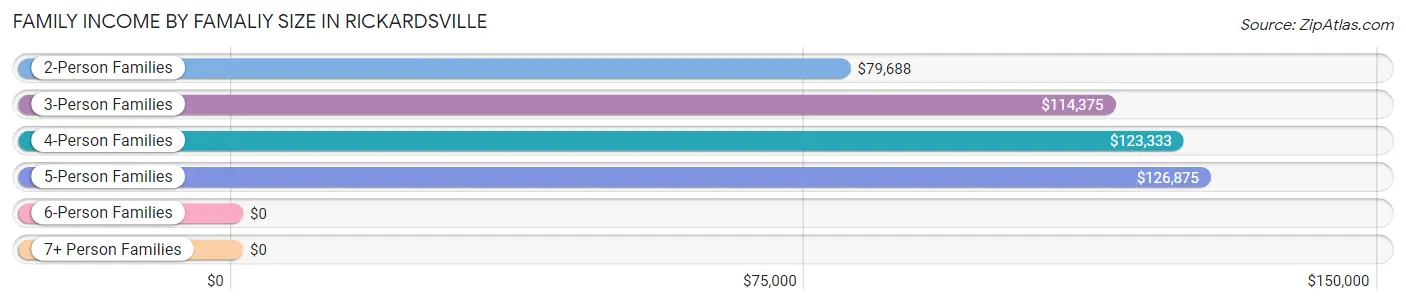
| Income Bracket | # Families | Median Income |
| 2-Person Families | 31 (46.3%) | $79,688 |
| 3-Person Families | 9 (13.4%) | $114,375 |
| 4-Person Families | 6 (9.0%) | $123,333 |
| 5-Person Families | 19 (28.4%) | $126,875 |
| 6-Person Families | 2 (3.0%) | $0 |
| 7+ Person Families | 0 (0.0%) | $0 |
| Total | 67 (100.0%) | $104,464 |
Family Income by Number of Earners in Rickardsville
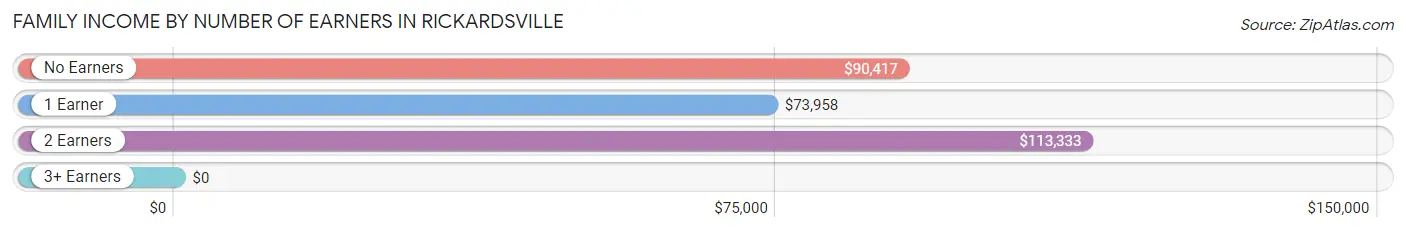
| Number of Earners | # Families | Median Income |
| No Earners | 7 (10.4%) | $90,417 |
| 1 Earner | 15 (22.4%) | $73,958 |
| 2 Earners | 38 (56.7%) | $113,333 |
| 3+ Earners | 7 (10.4%) | $0 |
| Total | 67 (100.0%) | $104,464 |
Household Income in Rickardsville
Household Income Brackets in Rickardsville
With 33 households falling in the category, the $100,000 to $149,999 income range is the most frequent in Rickardsville, accounting for 36.7% of all households.
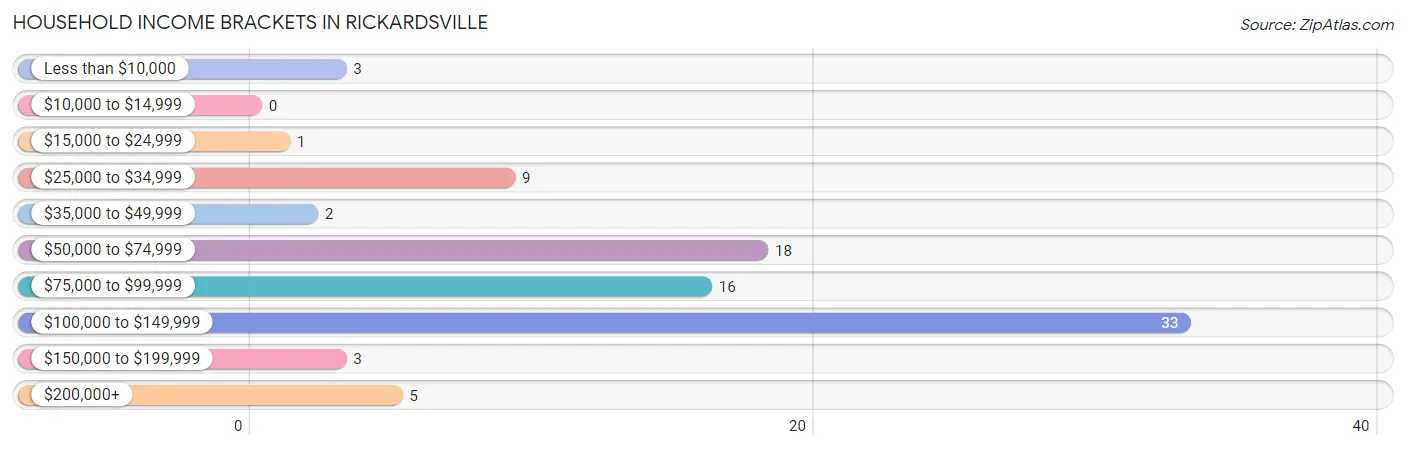
| Income Bracket | # Households | % Households |
| Less than $10,000 | 3 | 3.3% |
| $10,000 to $14,999 | 0 | 0.0% |
| $15,000 to $24,999 | 1 | 1.1% |
| $25,000 to $34,999 | 9 | 10.0% |
| $35,000 to $49,999 | 2 | 2.2% |
| $50,000 to $74,999 | 18 | 20.0% |
| $75,000 to $99,999 | 16 | 17.8% |
| $100,000 to $149,999 | 33 | 36.7% |
| $150,000 to $199,999 | 3 | 3.3% |
| $200,000+ | 5 | 5.6% |
Household Income by Householder Age in Rickardsville
The median household income in Rickardsville is $94,375, with the highest median household income of $104,688 found in the 25 to 44 years age bracket for the primary householder. A total of 38 households (42.2%) fall into this category.
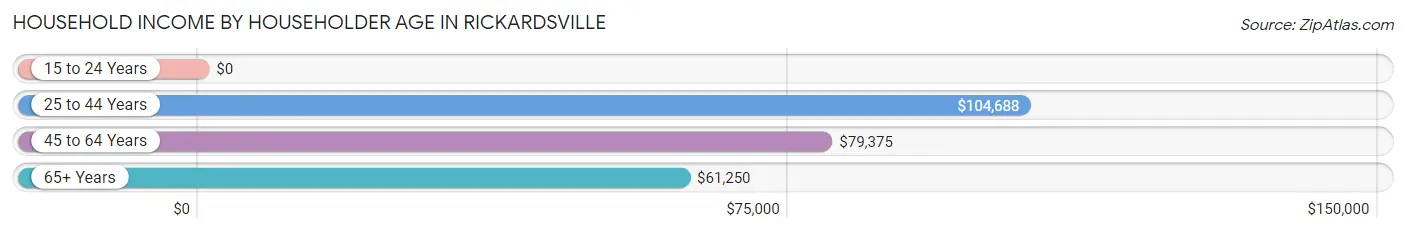
| Income Bracket | # Households | Median Income |
| 15 to 24 Years | 0 (0.0%) | $0 |
| 25 to 44 Years | 38 (42.2%) | $104,688 |
| 45 to 64 Years | 25 (27.8%) | $79,375 |
| 65+ Years | 27 (30.0%) | $61,250 |
| Total | 90 (100.0%) | $94,375 |
Poverty in Rickardsville
Income Below Poverty by Sex and Age in Rickardsville
With 2.2% poverty level for males and 2.5% for females among the residents of Rickardsville, 25 to 34 year old males and 18 to 24 year old females are the most vulnerable to poverty, with 3 males (10.0%) and 1 females (33.3%) in their respective age groups living below the poverty level.
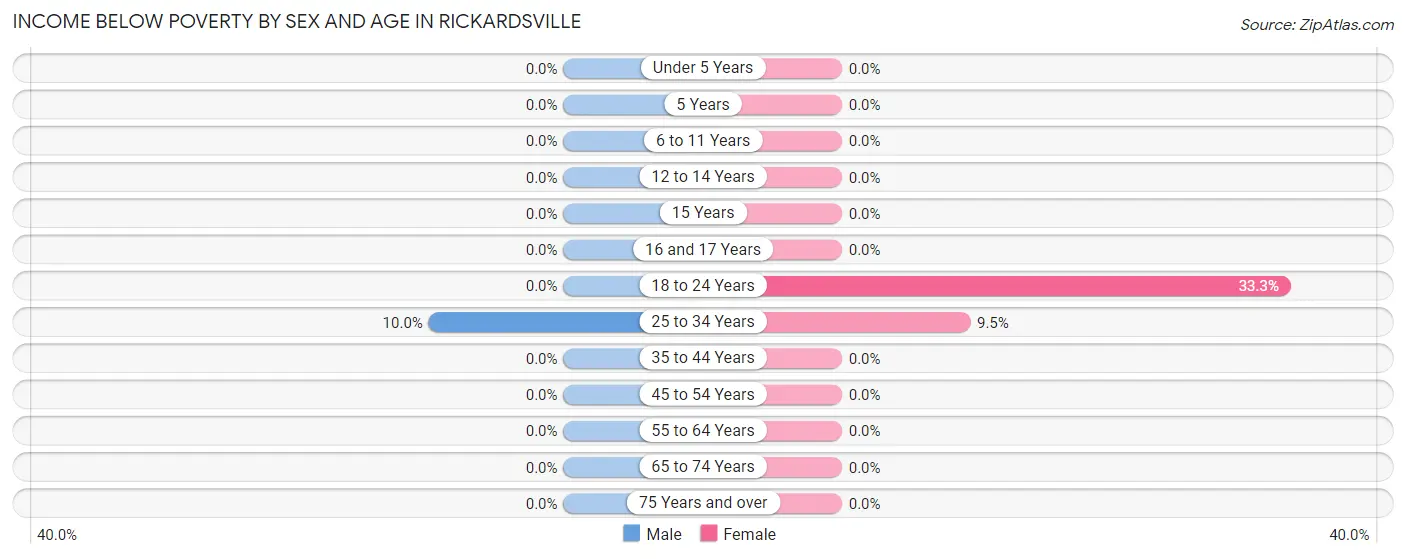
| Age Bracket | Male | Female |
| Under 5 Years | 0 (0.0%) | 0 (0.0%) |
| 5 Years | 0 (0.0%) | 0 (0.0%) |
| 6 to 11 Years | 0 (0.0%) | 0 (0.0%) |
| 12 to 14 Years | 0 (0.0%) | 0 (0.0%) |
| 15 Years | 0 (0.0%) | 0 (0.0%) |
| 16 and 17 Years | 0 (0.0%) | 0 (0.0%) |
| 18 to 24 Years | 0 (0.0%) | 1 (33.3%) |
| 25 to 34 Years | 3 (10.0%) | 2 (9.5%) |
| 35 to 44 Years | 0 (0.0%) | 0 (0.0%) |
| 45 to 54 Years | 0 (0.0%) | 0 (0.0%) |
| 55 to 64 Years | 0 (0.0%) | 0 (0.0%) |
| 65 to 74 Years | 0 (0.0%) | 0 (0.0%) |
| 75 Years and over | 0 (0.0%) | 0 (0.0%) |
| Total | 3 (2.2%) | 3 (2.5%) |
Income Above Poverty by Sex and Age in Rickardsville
According to the poverty statistics in Rickardsville, males aged under 5 years and females aged under 5 years are the age groups that are most secure financially, with 100.0% of males and 100.0% of females in these age groups living above the poverty line.
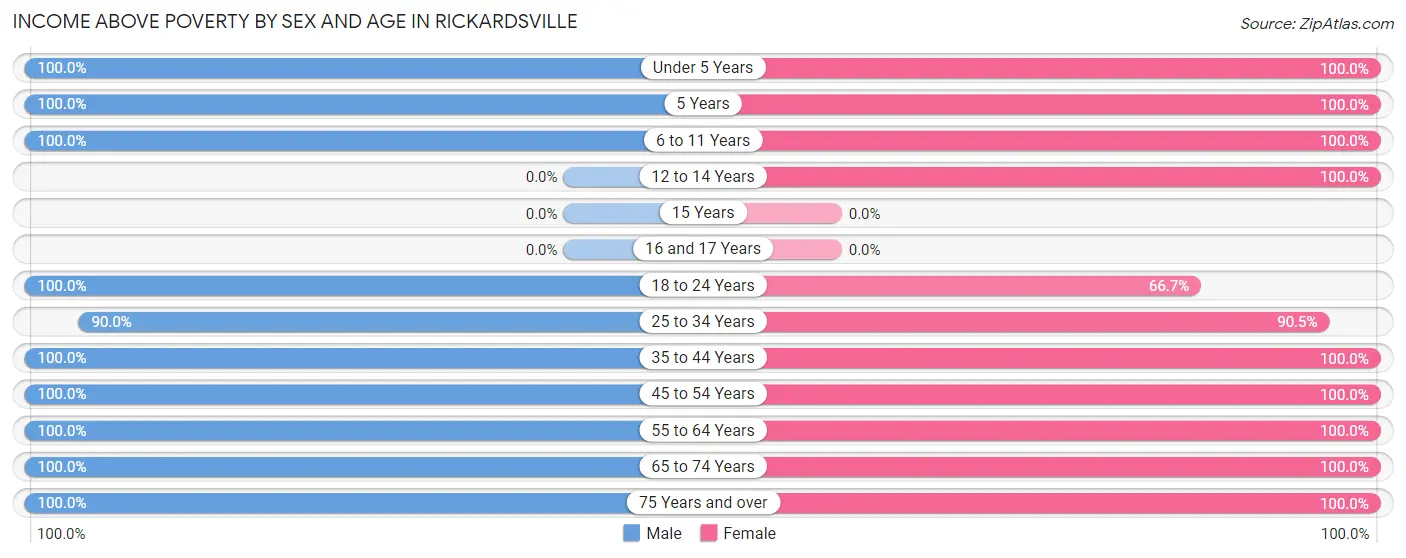
| Age Bracket | Male | Female |
| Under 5 Years | 12 (100.0%) | 11 (100.0%) |
| 5 Years | 3 (100.0%) | 8 (100.0%) |
| 6 to 11 Years | 30 (100.0%) | 13 (100.0%) |
| 12 to 14 Years | 0 (0.0%) | 6 (100.0%) |
| 15 Years | 0 (0.0%) | 0 (0.0%) |
| 16 and 17 Years | 0 (0.0%) | 0 (0.0%) |
| 18 to 24 Years | 5 (100.0%) | 2 (66.7%) |
| 25 to 34 Years | 27 (90.0%) | 19 (90.5%) |
| 35 to 44 Years | 13 (100.0%) | 9 (100.0%) |
| 45 to 54 Years | 10 (100.0%) | 10 (100.0%) |
| 55 to 64 Years | 15 (100.0%) | 13 (100.0%) |
| 65 to 74 Years | 10 (100.0%) | 21 (100.0%) |
| 75 Years and over | 8 (100.0%) | 7 (100.0%) |
| Total | 133 (97.8%) | 119 (97.5%) |
Income Below Poverty Among Married-Couple Families in Rickardsville
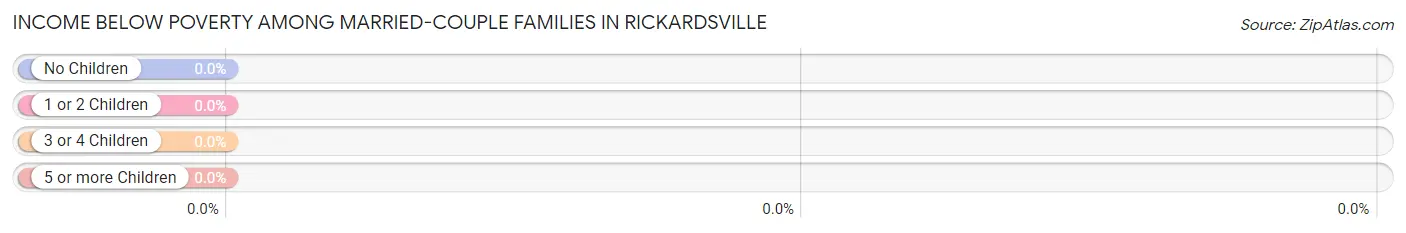
| Children | Above Poverty | Below Poverty |
| No Children | 31 (100.0%) | 0 (0.0%) |
| 1 or 2 Children | 11 (100.0%) | 0 (0.0%) |
| 3 or 4 Children | 19 (100.0%) | 0 (0.0%) |
| 5 or more Children | 0 (0.0%) | 0 (0.0%) |
| Total | 61 (100.0%) | 0 (0.0%) |
Income Below Poverty Among Single-Parent Households in Rickardsville
| Children | Single Father | Single Mother |
| No Children | 0 (0.0%) | 0 (0.0%) |
| 1 or 2 Children | 0 (0.0%) | 0 (0.0%) |
| 3 or 4 Children | 0 (0.0%) | 0 (0.0%) |
| 5 or more Children | 0 (0.0%) | 0 (0.0%) |
| Total | 0 (0.0%) | 0 (0.0%) |
Income Below Poverty Among Married-Couple vs Single-Parent Households in Rickardsville
| Children | Married-Couple Families | Single-Parent Households |
| No Children | 0 (0.0%) | 0 (0.0%) |
| 1 or 2 Children | 0 (0.0%) | 0 (0.0%) |
| 3 or 4 Children | 0 (0.0%) | 0 (0.0%) |
| 5 or more Children | 0 (0.0%) | 0 (0.0%) |
| Total | 0 (0.0%) | 0 (0.0%) |
Race in Rickardsville
The most populous races in Rickardsville are White / Caucasian (252 | 97.7%), and Two or more Races (6 | 2.3%).
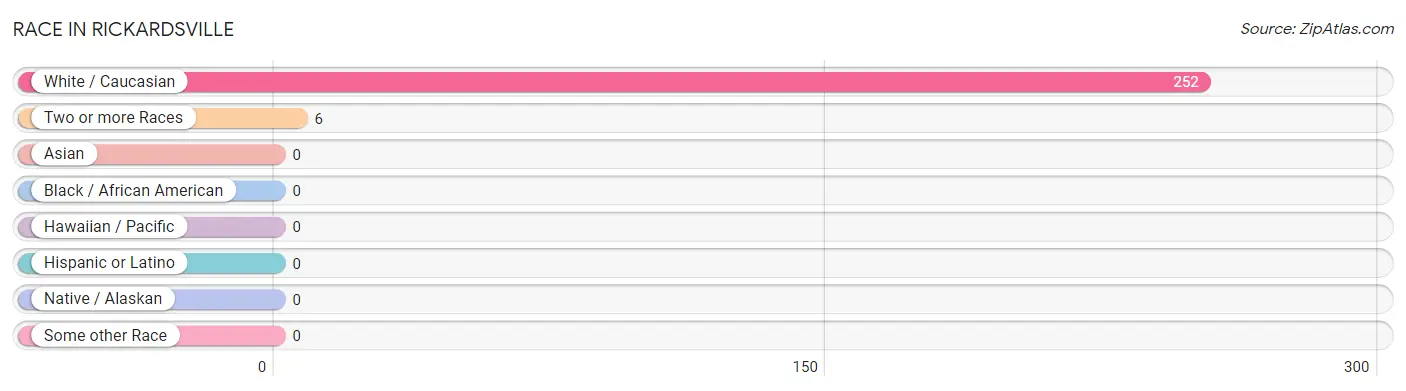
| Race | # Population | % Population |
| Asian | 0 | 0.0% |
| Black / African American | 0 | 0.0% |
| Hawaiian / Pacific | 0 | 0.0% |
| Hispanic or Latino | 0 | 0.0% |
| Native / Alaskan | 0 | 0.0% |
| White / Caucasian | 252 | 97.7% |
| Two or more Races | 6 | 2.3% |
| Some other Race | 0 | 0.0% |
| Total | 258 | 100.0% |
Ancestry in Rickardsville
The most populous ancestries reported in Rickardsville are German (166 | 64.3%), Irish (35 | 13.6%), Austrian (26 | 10.1%), English (15 | 5.8%), and American (8 | 3.1%), together accounting for 96.9% of all Rickardsville residents.
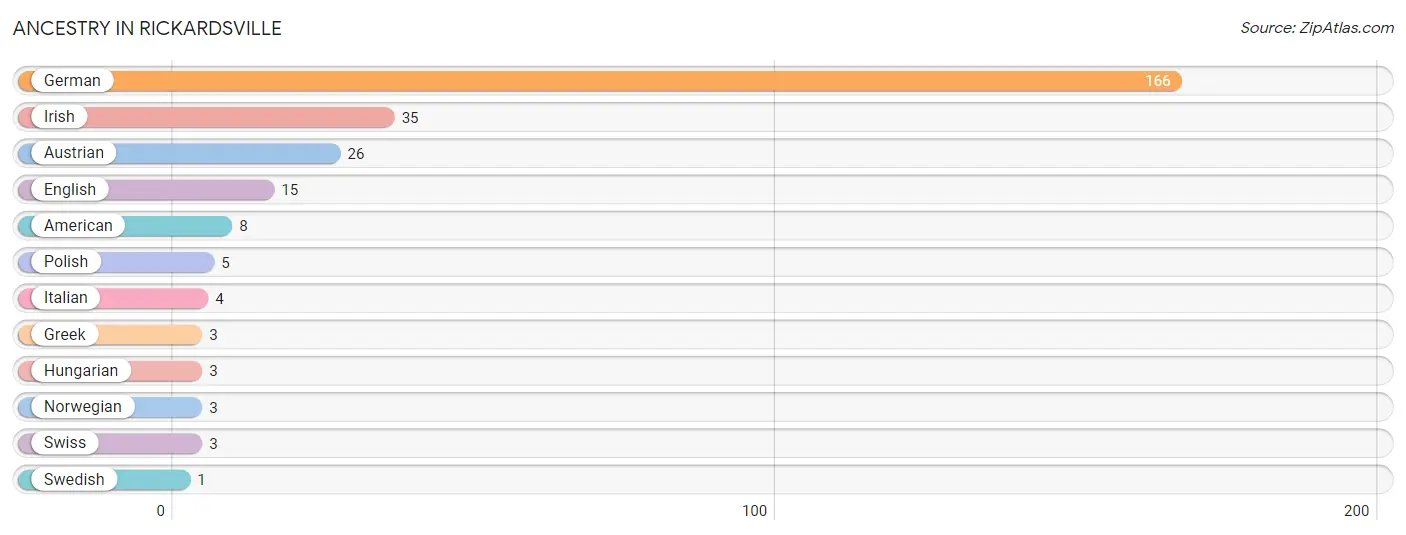
| Ancestry | # Population | % Population |
| American | 8 | 3.1% |
| Austrian | 26 | 10.1% |
| English | 15 | 5.8% |
| German | 166 | 64.3% |
| Greek | 3 | 1.2% |
| Hungarian | 3 | 1.2% |
| Irish | 35 | 13.6% |
| Italian | 4 | 1.5% |
| Norwegian | 3 | 1.2% |
| Polish | 5 | 1.9% |
| Swedish | 1 | 0.4% |
| Swiss | 3 | 1.2% | View All 12 Rows |
Immigrants in Rickardsville
The most numerous immigrant groups reported in Rickardsville came from Canada (1 | 0.4%), Eastern Europe (1 | 0.4%), Europe (1 | 0.4%), and Hungary (1 | 0.4%), together accounting for 1.6% of all Rickardsville residents.
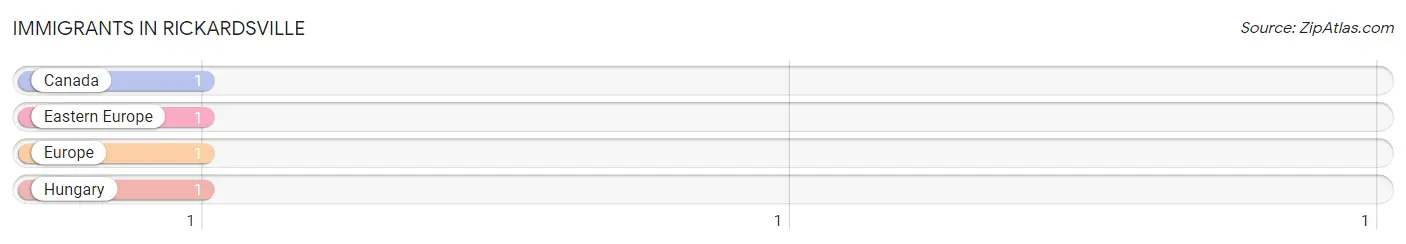
| Immigration Origin | # Population | % Population |
| Canada | 1 | 0.4% |
| Eastern Europe | 1 | 0.4% |
| Europe | 1 | 0.4% |
| Hungary | 1 | 0.4% | View All 4 Rows |
Sex and Age in Rickardsville
Sex and Age in Rickardsville
The most populous age groups in Rickardsville are 5 to 9 Years (23 | 16.9%) for men and 70 to 74 Years (18 | 14.7%) for women.
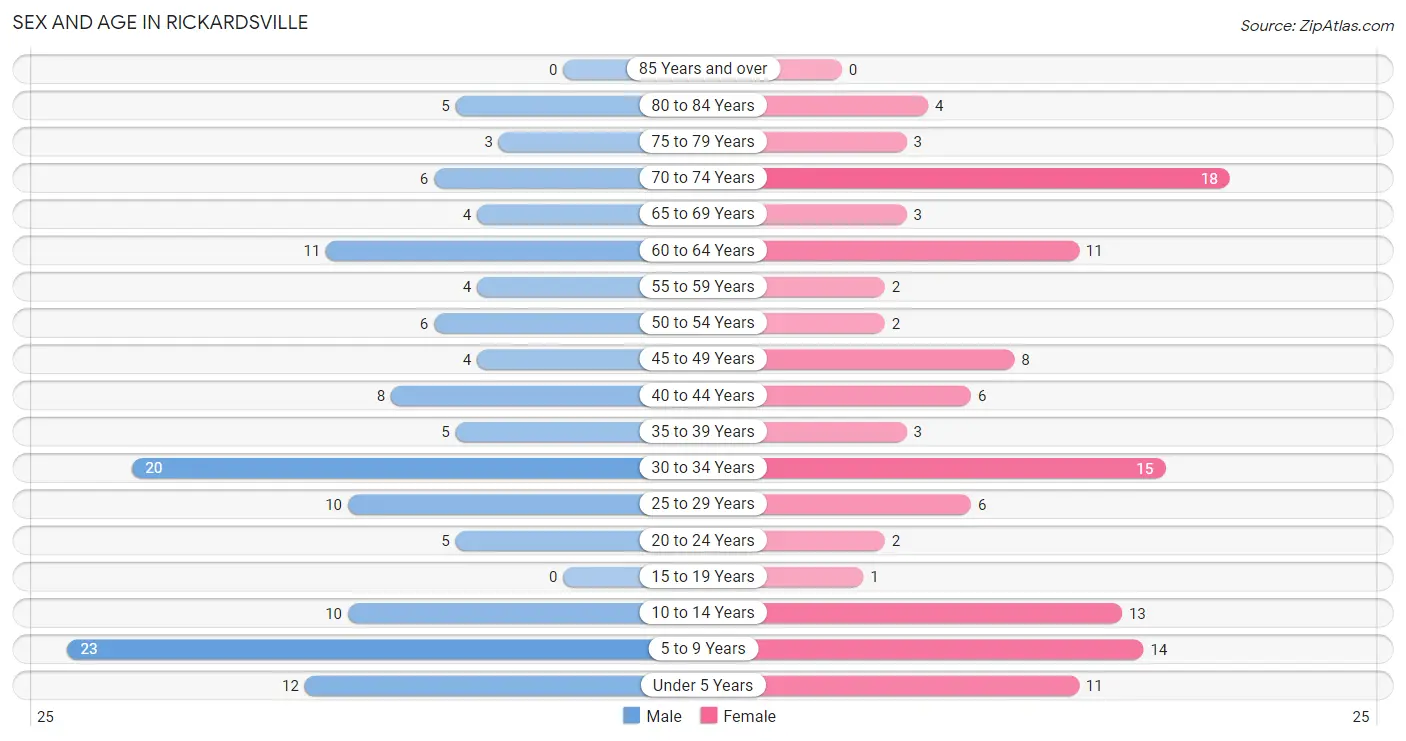
| Age Bracket | Male | Female |
| Under 5 Years | 12 (8.8%) | 11 (9.0%) |
| 5 to 9 Years | 23 (16.9%) | 14 (11.5%) |
| 10 to 14 Years | 10 (7.3%) | 13 (10.7%) |
| 15 to 19 Years | 0 (0.0%) | 1 (0.8%) |
| 20 to 24 Years | 5 (3.7%) | 2 (1.6%) |
| 25 to 29 Years | 10 (7.3%) | 6 (4.9%) |
| 30 to 34 Years | 20 (14.7%) | 15 (12.3%) |
| 35 to 39 Years | 5 (3.7%) | 3 (2.5%) |
| 40 to 44 Years | 8 (5.9%) | 6 (4.9%) |
| 45 to 49 Years | 4 (2.9%) | 8 (6.6%) |
| 50 to 54 Years | 6 (4.4%) | 2 (1.6%) |
| 55 to 59 Years | 4 (2.9%) | 2 (1.6%) |
| 60 to 64 Years | 11 (8.1%) | 11 (9.0%) |
| 65 to 69 Years | 4 (2.9%) | 3 (2.5%) |
| 70 to 74 Years | 6 (4.4%) | 18 (14.7%) |
| 75 to 79 Years | 3 (2.2%) | 3 (2.5%) |
| 80 to 84 Years | 5 (3.7%) | 4 (3.3%) |
| 85 Years and over | 0 (0.0%) | 0 (0.0%) |
| Total | 136 (100.0%) | 122 (100.0%) |
Families and Households in Rickardsville
Median Family Size in Rickardsville
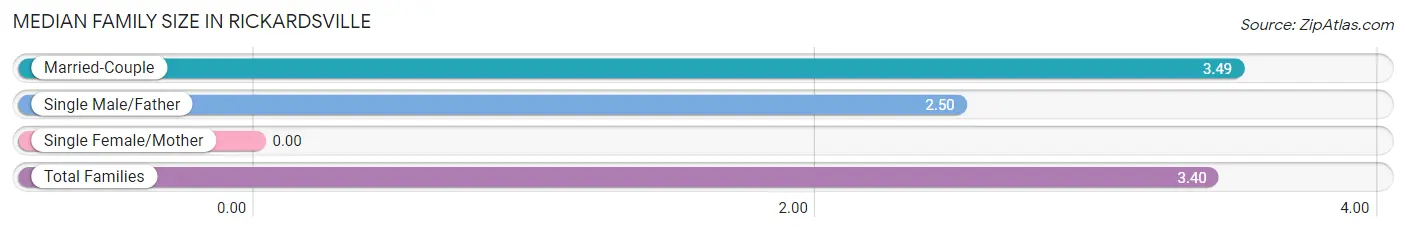
| Family Type | # Families | Family Size |
| Married-Couple | 61 (91.0%) | 3.49 |
| Single Male/Father | 6 (9.0%) | 2.50 |
| Single Female/Mother | 0 (0.0%) | - |
| Total Families | 67 (100.0%) | 3.40 |
Median Household Size in Rickardsville
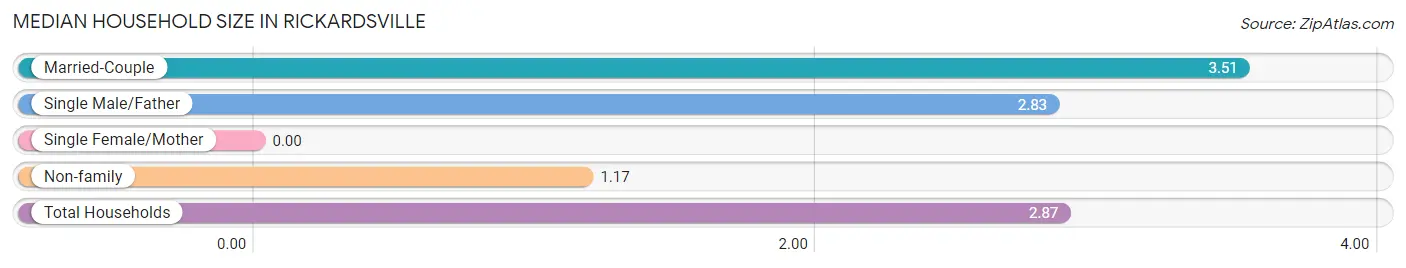
| Household Type | # Households | Household Size |
| Married-Couple | 61 (67.8%) | 3.51 |
| Single Male/Father | 6 (6.7%) | 2.83 |
| Single Female/Mother | 0 (0.0%) | - |
| Non-family | 23 (25.6%) | 1.17 |
| Total Households | 90 (100.0%) | 2.87 |
Household Size by Marriage Status in Rickardsville
Out of a total of 90 households in Rickardsville, 67 (74.4%) are family households, while 23 (25.6%) are nonfamily households. The most numerous type of family households are 2-person households, comprising 30, and the most common type of nonfamily households are 1-person households, comprising 21.
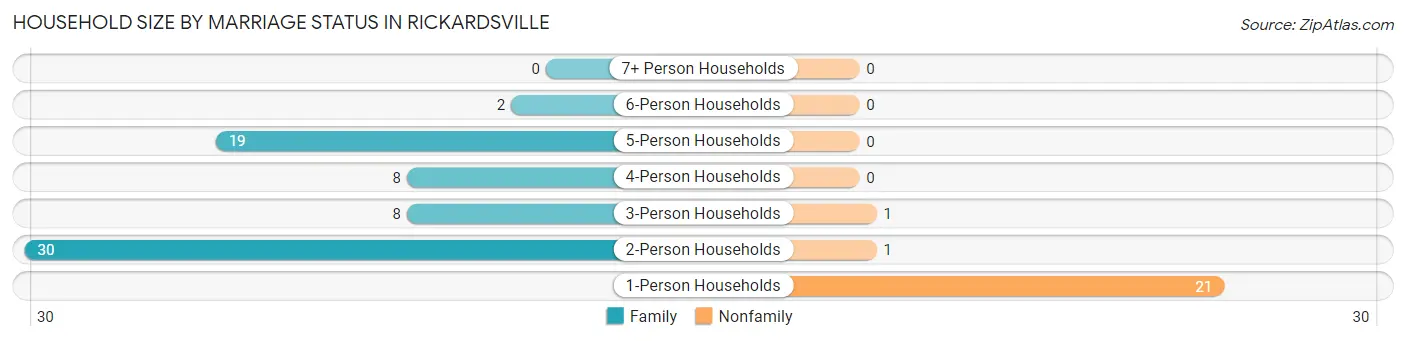
| Household Size | Family Households | Nonfamily Households |
| 1-Person Households | - | 21 (23.3%) |
| 2-Person Households | 30 (33.3%) | 1 (1.1%) |
| 3-Person Households | 8 (8.9%) | 1 (1.1%) |
| 4-Person Households | 8 (8.9%) | 0 (0.0%) |
| 5-Person Households | 19 (21.1%) | 0 (0.0%) |
| 6-Person Households | 2 (2.2%) | 0 (0.0%) |
| 7+ Person Households | 0 (0.0%) | 0 (0.0%) |
| Total | 67 (74.4%) | 23 (25.6%) |
Female Fertility in Rickardsville
Fertility by Age in Rickardsville
Average fertility rate in Rickardsville is 49.0 births per 1,000 women. Women in the age bracket of 20 to 34 years have the highest fertility rate with 87.0 births per 1,000 women. Women in the age bracket of 20 to 34 years acount for 100.0% of all women with births.
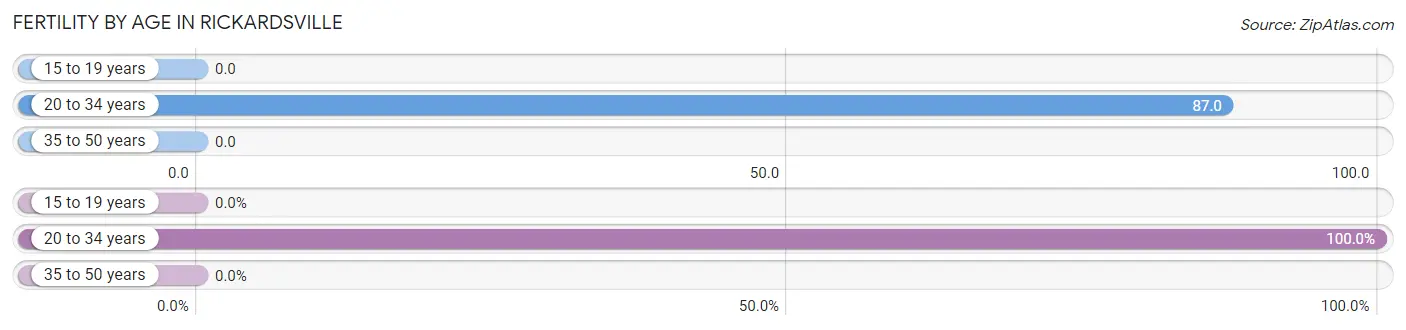
| Age Bracket | Women with Births | Births / 1,000 Women |
| 15 to 19 years | 0 (0.0%) | 0.0 |
| 20 to 34 years | 2 (100.0%) | 87.0 |
| 35 to 50 years | 0 (0.0%) | 0.0 |
| Total | 2 (100.0%) | 49.0 |
Fertility by Age by Marriage Status in Rickardsville

| Age Bracket | Married | Unmarried |
| 15 to 19 years | 0 (0.0%) | 0 (0.0%) |
| 20 to 34 years | 0 (0.0%) | 2 (100.0%) |
| 35 to 50 years | 0 (0.0%) | 0 (0.0%) |
| Total | 0 (0.0%) | 2 (100.0%) |
Fertility by Education in Rickardsville
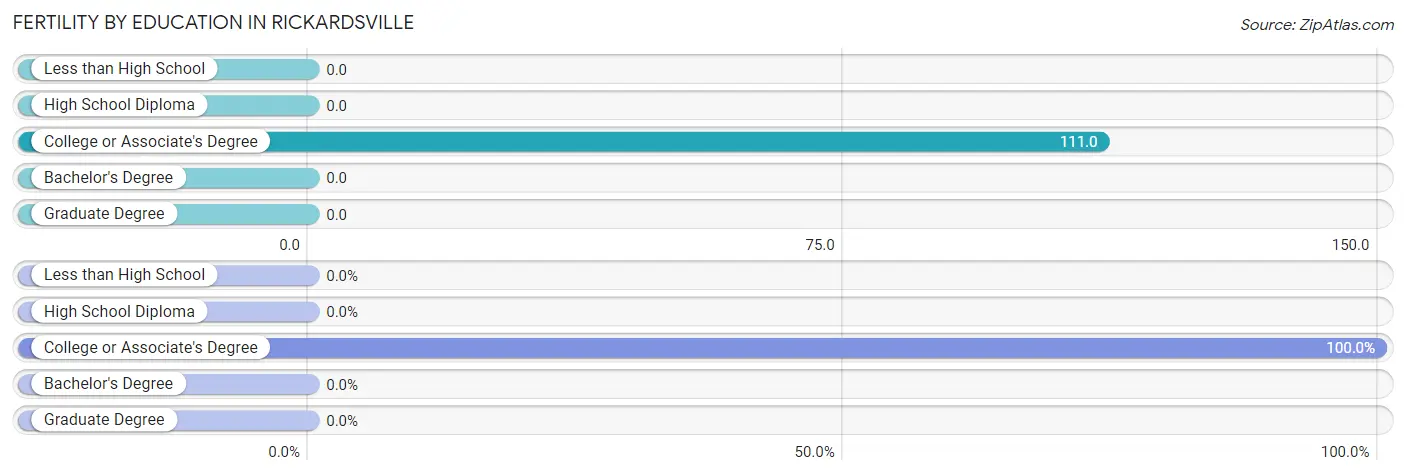
| Educational Attainment | Women with Births | Births / 1,000 Women |
| Less than High School | 0 (0.0%) | 0.0 |
| High School Diploma | 0 (0.0%) | 0.0 |
| College or Associate's Degree | 2 (100.0%) | 111.0 |
| Bachelor's Degree | 0 (0.0%) | 0.0 |
| Graduate Degree | 0 (0.0%) | 0.0 |
| Total | 2 (100.0%) | 49.0 |
Fertility by Education by Marriage Status in Rickardsville
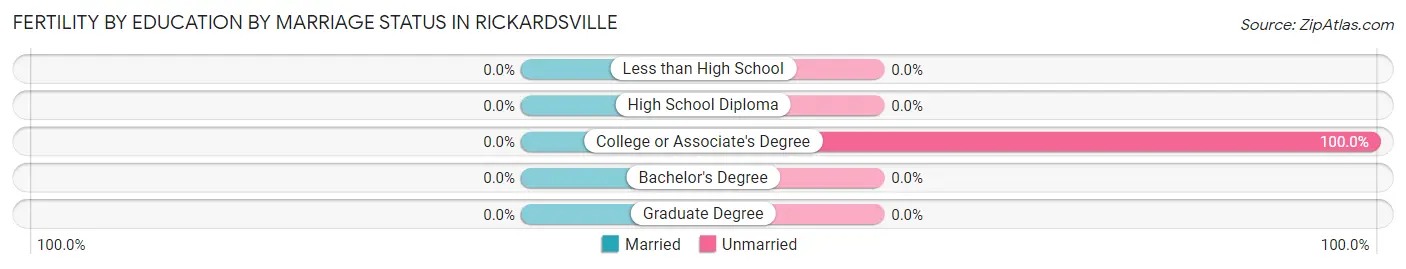
| Educational Attainment | Married | Unmarried |
| Less than High School | 0 (0.0%) | 0 (0.0%) |
| High School Diploma | 0 (0.0%) | 0 (0.0%) |
| College or Associate's Degree | 0 (0.0%) | 2 (100.0%) |
| Bachelor's Degree | 0 (0.0%) | 0 (0.0%) |
| Graduate Degree | 0 (0.0%) | 0 (0.0%) |
| Total | 0 (0.0%) | 2 (100.0%) |
Employment Characteristics in Rickardsville
Employment by Class of Employer in Rickardsville
Among the 124 employed individuals in Rickardsville, private company employees (72 | 58.1%), not-for-profit organizations (18 | 14.5%), and local government employees (13 | 10.5%) make up the most common classes of employment.
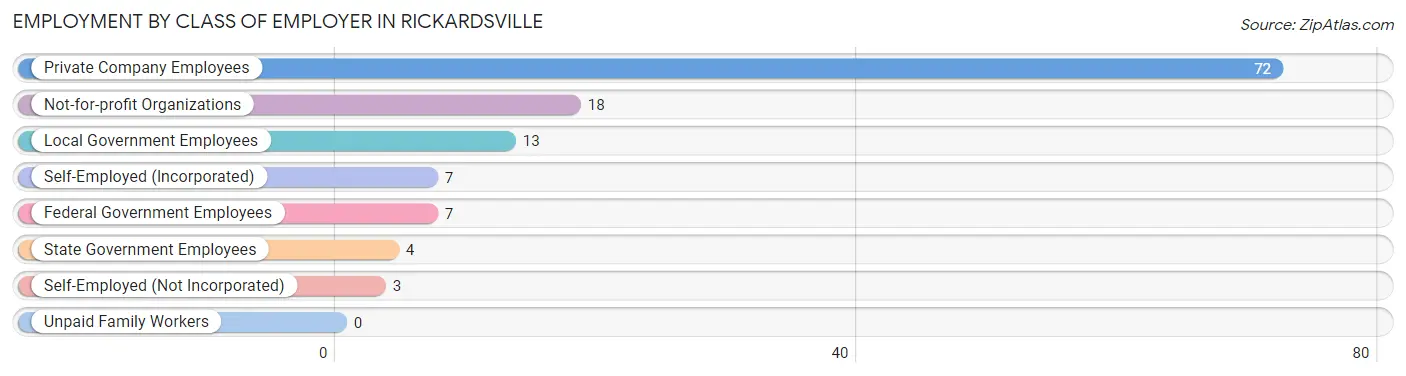
| Employer Class | # Employees | % Employees |
| Private Company Employees | 72 | 58.1% |
| Self-Employed (Incorporated) | 7 | 5.7% |
| Self-Employed (Not Incorporated) | 3 | 2.4% |
| Not-for-profit Organizations | 18 | 14.5% |
| Local Government Employees | 13 | 10.5% |
| State Government Employees | 4 | 3.2% |
| Federal Government Employees | 7 | 5.7% |
| Unpaid Family Workers | 0 | 0.0% |
| Total | 124 | 100.0% |
Employment Status by Age in Rickardsville
According to the labor force statistics for Rickardsville, out of the total population over 16 years of age (175), 71.4% or 125 individuals are in the labor force, with 0.8% or 1 of them unemployed. The age group with the highest labor force participation rate is 20 to 24 years, with 100.0% or 7 individuals in the labor force. Within the labor force, the 20 to 24 years age range has the highest percentage of unemployed individuals, with 14.3% or 1 of them being unemployed.
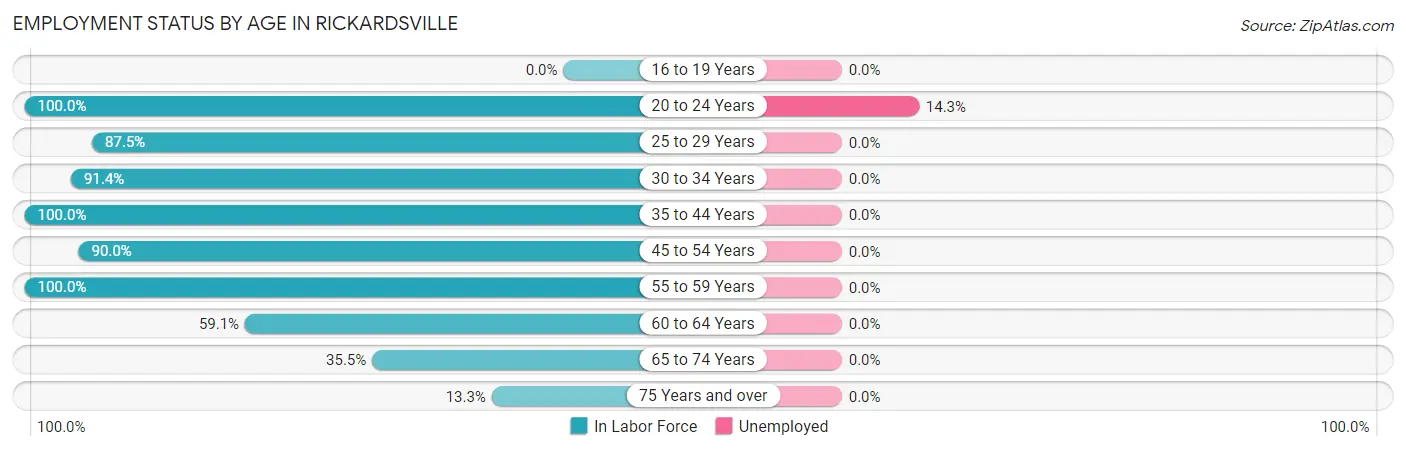
| Age Bracket | In Labor Force | Unemployed |
| 16 to 19 Years | 0 (0.0%) | 0 (0.0%) |
| 20 to 24 Years | 7 (100.0%) | 1 (14.3%) |
| 25 to 29 Years | 14 (87.5%) | 0 (0.0%) |
| 30 to 34 Years | 32 (91.4%) | 0 (0.0%) |
| 35 to 44 Years | 22 (100.0%) | 0 (0.0%) |
| 45 to 54 Years | 18 (90.0%) | 0 (0.0%) |
| 55 to 59 Years | 6 (100.0%) | 0 (0.0%) |
| 60 to 64 Years | 13 (59.1%) | 0 (0.0%) |
| 65 to 74 Years | 11 (35.5%) | 0 (0.0%) |
| 75 Years and over | 2 (13.3%) | 0 (0.0%) |
| Total | 125 (71.4%) | 1 (0.8%) |
Employment Status by Educational Attainment in Rickardsville
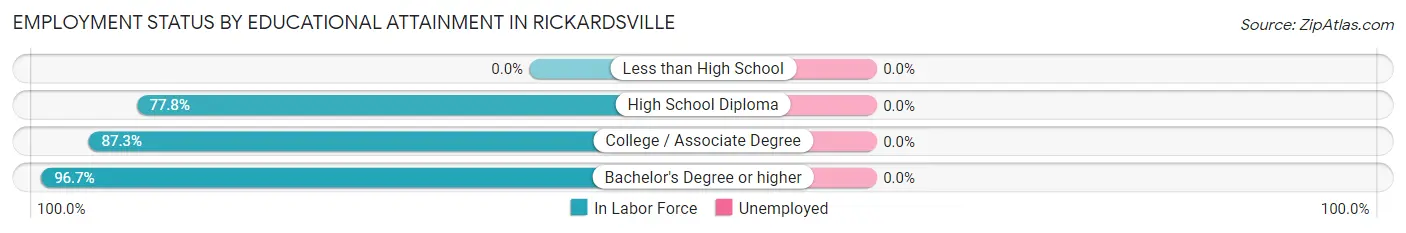
| Educational Attainment | In Labor Force | Unemployed |
| Less than High School | 0 (0.0%) | 0 (0.0%) |
| High School Diploma | 28 (77.8%) | 0 (0.0%) |
| College / Associate Degree | 48 (87.3%) | 0 (0.0%) |
| Bachelor's Degree or higher | 29 (96.7%) | 0 (0.0%) |
| Total | 105 (86.8%) | 0 (0.0%) |
Employment Occupations by Sex in Rickardsville
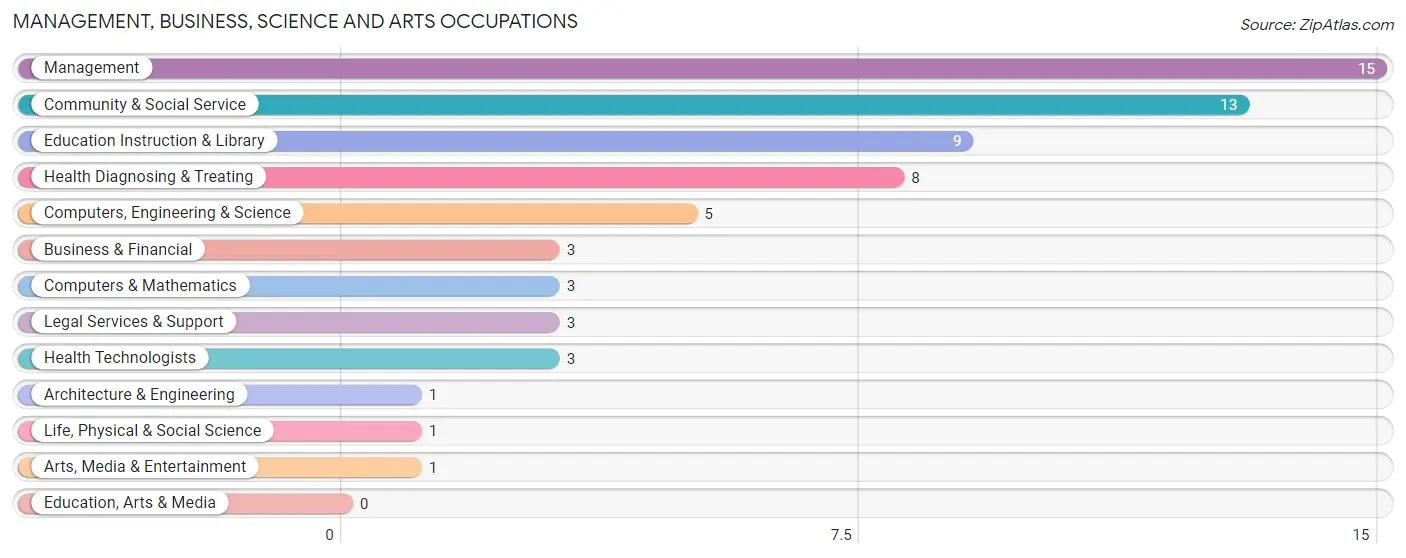
Management, Business, Science and Arts Occupations
The most common Management, Business, Science and Arts occupations in Rickardsville are Management (15 | 12.1%), Community & Social Service (13 | 10.5%), Education Instruction & Library (9 | 7.3%), Health Diagnosing & Treating (8 | 6.5%), and Computers, Engineering & Science (5 | 4.0%).
Management, Business, Science and Arts Occupations by Sex
Within the Management, Business, Science and Arts occupations in Rickardsville, the most male-oriented occupations are Business & Financial (100.0%), Computers, Engineering & Science (100.0%), and Computers & Mathematics (100.0%), while the most female-oriented occupations are Legal Services & Support (100.0%), Health Diagnosing & Treating (100.0%), and Health Technologists (100.0%).
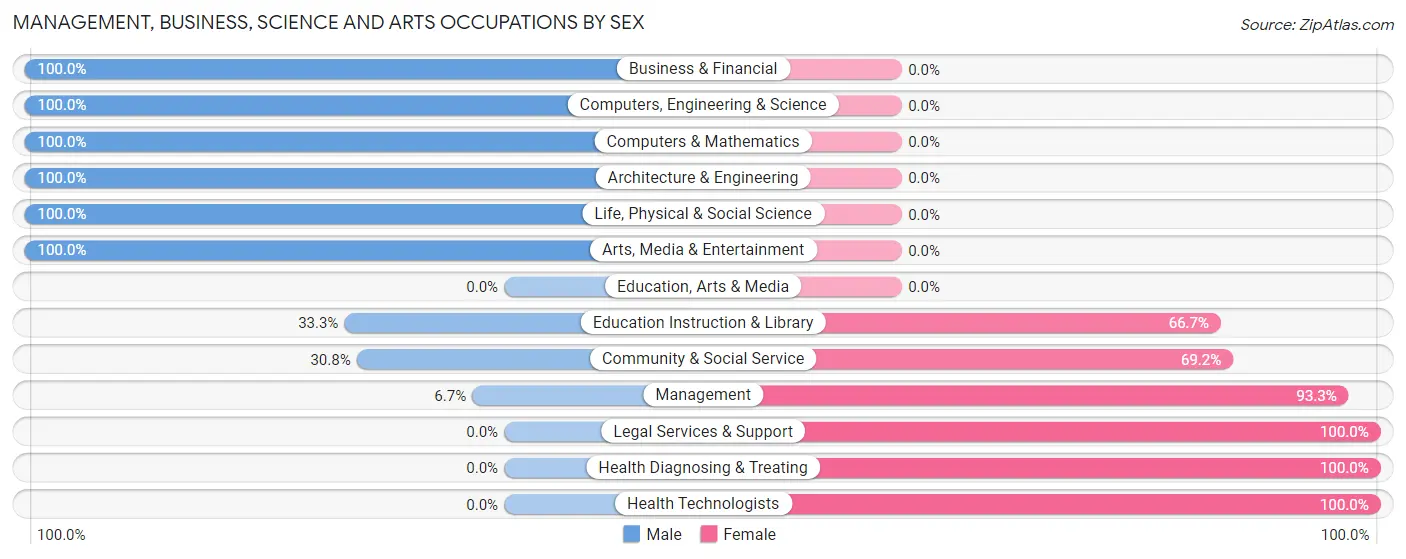
| Occupation | Male | Female |
| Management | 1 (6.7%) | 14 (93.3%) |
| Business & Financial | 3 (100.0%) | 0 (0.0%) |
| Computers, Engineering & Science | 5 (100.0%) | 0 (0.0%) |
| Computers & Mathematics | 3 (100.0%) | 0 (0.0%) |
| Architecture & Engineering | 1 (100.0%) | 0 (0.0%) |
| Life, Physical & Social Science | 1 (100.0%) | 0 (0.0%) |
| Community & Social Service | 4 (30.8%) | 9 (69.2%) |
| Education, Arts & Media | 0 (0.0%) | 0 (0.0%) |
| Legal Services & Support | 0 (0.0%) | 3 (100.0%) |
| Education Instruction & Library | 3 (33.3%) | 6 (66.7%) |
| Arts, Media & Entertainment | 1 (100.0%) | 0 (0.0%) |
| Health Diagnosing & Treating | 0 (0.0%) | 8 (100.0%) |
| Health Technologists | 0 (0.0%) | 3 (100.0%) |
| Total (Category) | 13 (29.5%) | 31 (70.5%) |
| Total (Overall) | 81 (65.3%) | 43 (34.7%) |
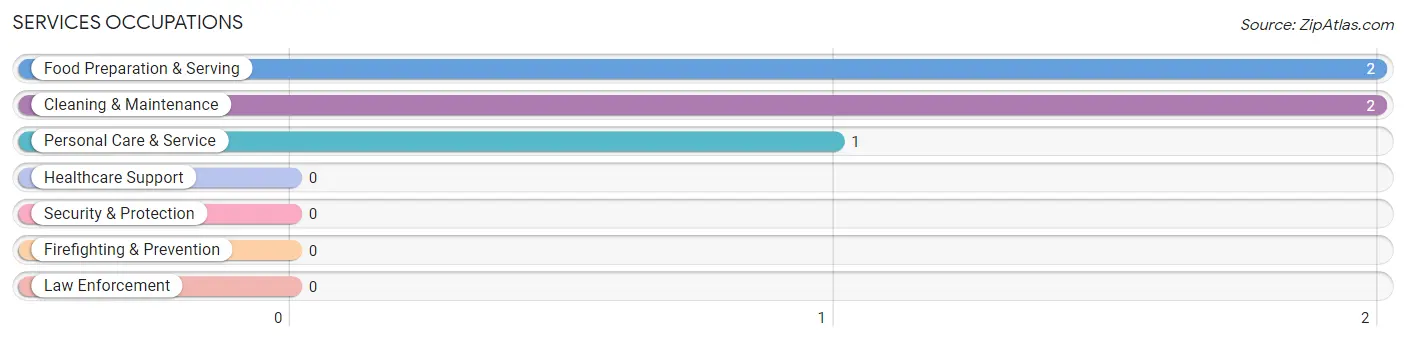
Services Occupations
The most common Services occupations in Rickardsville are Food Preparation & Serving (2 | 1.6%), Cleaning & Maintenance (2 | 1.6%), and Personal Care & Service (1 | 0.8%).
Services Occupations by Sex
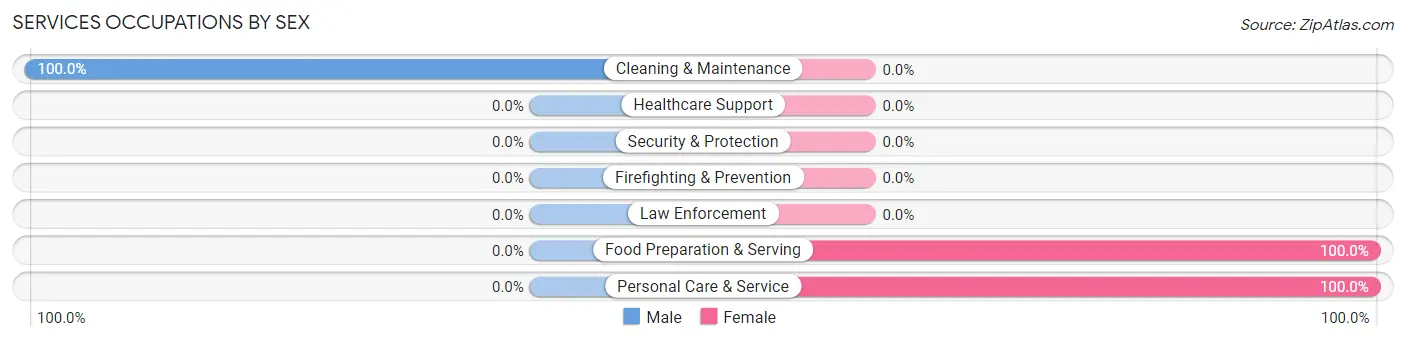
| Occupation | Male | Female |
| Healthcare Support | 0 (0.0%) | 0 (0.0%) |
| Security & Protection | 0 (0.0%) | 0 (0.0%) |
| Firefighting & Prevention | 0 (0.0%) | 0 (0.0%) |
| Law Enforcement | 0 (0.0%) | 0 (0.0%) |
| Food Preparation & Serving | 0 (0.0%) | 2 (100.0%) |
| Cleaning & Maintenance | 2 (100.0%) | 0 (0.0%) |
| Personal Care & Service | 0 (0.0%) | 1 (100.0%) |
| Total (Category) | 2 (40.0%) | 3 (60.0%) |
| Total (Overall) | 81 (65.3%) | 43 (34.7%) |
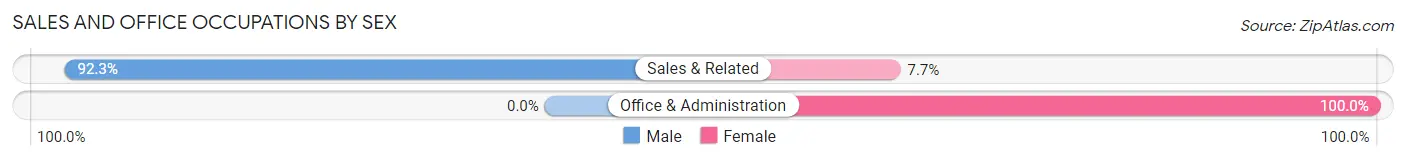
Sales and Office Occupations
The most common Sales and Office occupations in Rickardsville are Sales & Related (13 | 10.5%), and Office & Administration (2 | 1.6%).
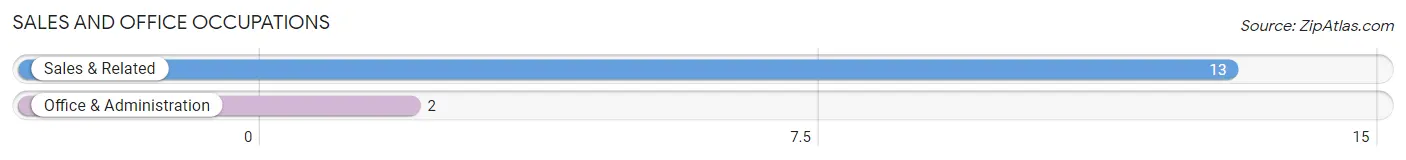
Sales and Office Occupations by Sex
| Occupation | Male | Female |
| Sales & Related | 12 (92.3%) | 1 (7.7%) |
| Office & Administration | 0 (0.0%) | 2 (100.0%) |
| Total (Category) | 12 (80.0%) | 3 (20.0%) |
| Total (Overall) | 81 (65.3%) | 43 (34.7%) |
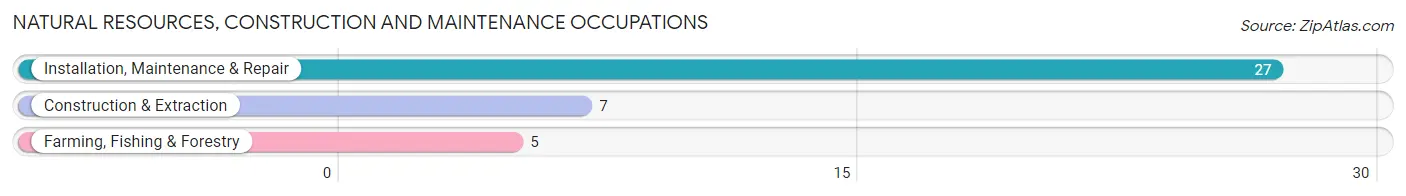
Natural Resources, Construction and Maintenance Occupations
The most common Natural Resources, Construction and Maintenance occupations in Rickardsville are Installation, Maintenance & Repair (27 | 21.8%), Construction & Extraction (7 | 5.7%), and Farming, Fishing & Forestry (5 | 4.0%).
Natural Resources, Construction and Maintenance Occupations by Sex

| Occupation | Male | Female |
| Farming, Fishing & Forestry | 0 (0.0%) | 5 (100.0%) |
| Construction & Extraction | 7 (100.0%) | 0 (0.0%) |
| Installation, Maintenance & Repair | 27 (100.0%) | 0 (0.0%) |
| Total (Category) | 34 (87.2%) | 5 (12.8%) |
| Total (Overall) | 81 (65.3%) | 43 (34.7%) |
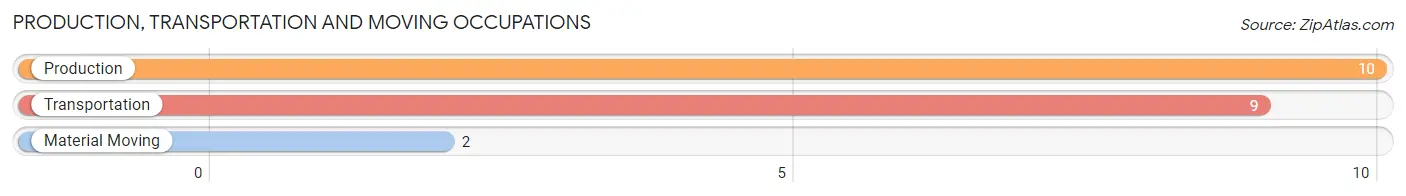
Production, Transportation and Moving Occupations
The most common Production, Transportation and Moving occupations in Rickardsville are Production (10 | 8.1%), Transportation (9 | 7.3%), and Material Moving (2 | 1.6%).
Production, Transportation and Moving Occupations by Sex
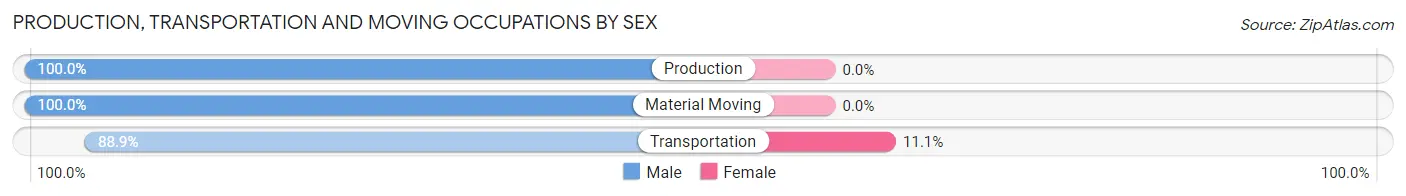
| Occupation | Male | Female |
| Production | 10 (100.0%) | 0 (0.0%) |
| Transportation | 8 (88.9%) | 1 (11.1%) |
| Material Moving | 2 (100.0%) | 0 (0.0%) |
| Total (Category) | 20 (95.2%) | 1 (4.8%) |
| Total (Overall) | 81 (65.3%) | 43 (34.7%) |
Employment Industries by Sex in Rickardsville
Employment Industries in Rickardsville
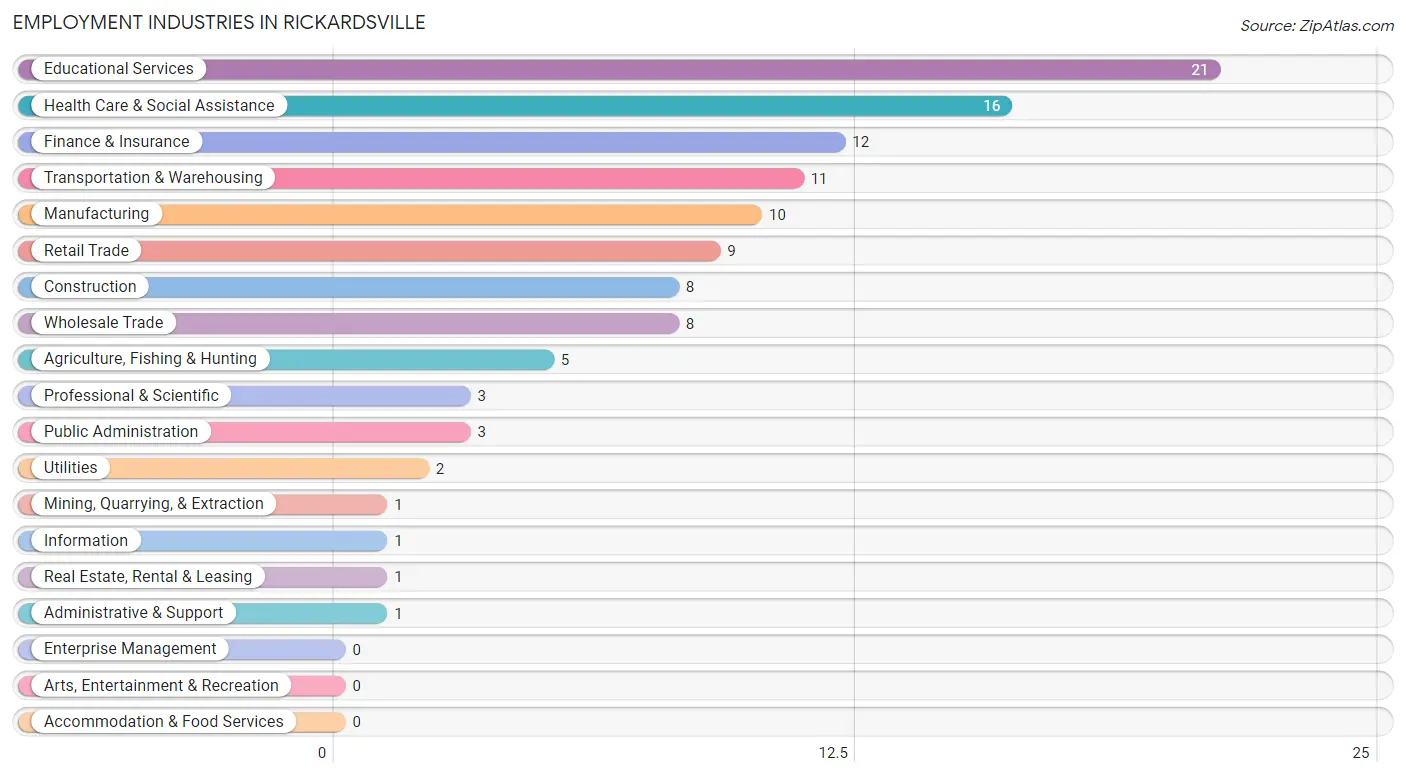
The major employment industries in Rickardsville include Educational Services (21 | 16.9%), Health Care & Social Assistance (16 | 12.9%), Finance & Insurance (12 | 9.7%), Transportation & Warehousing (11 | 8.9%), and Manufacturing (10 | 8.1%).
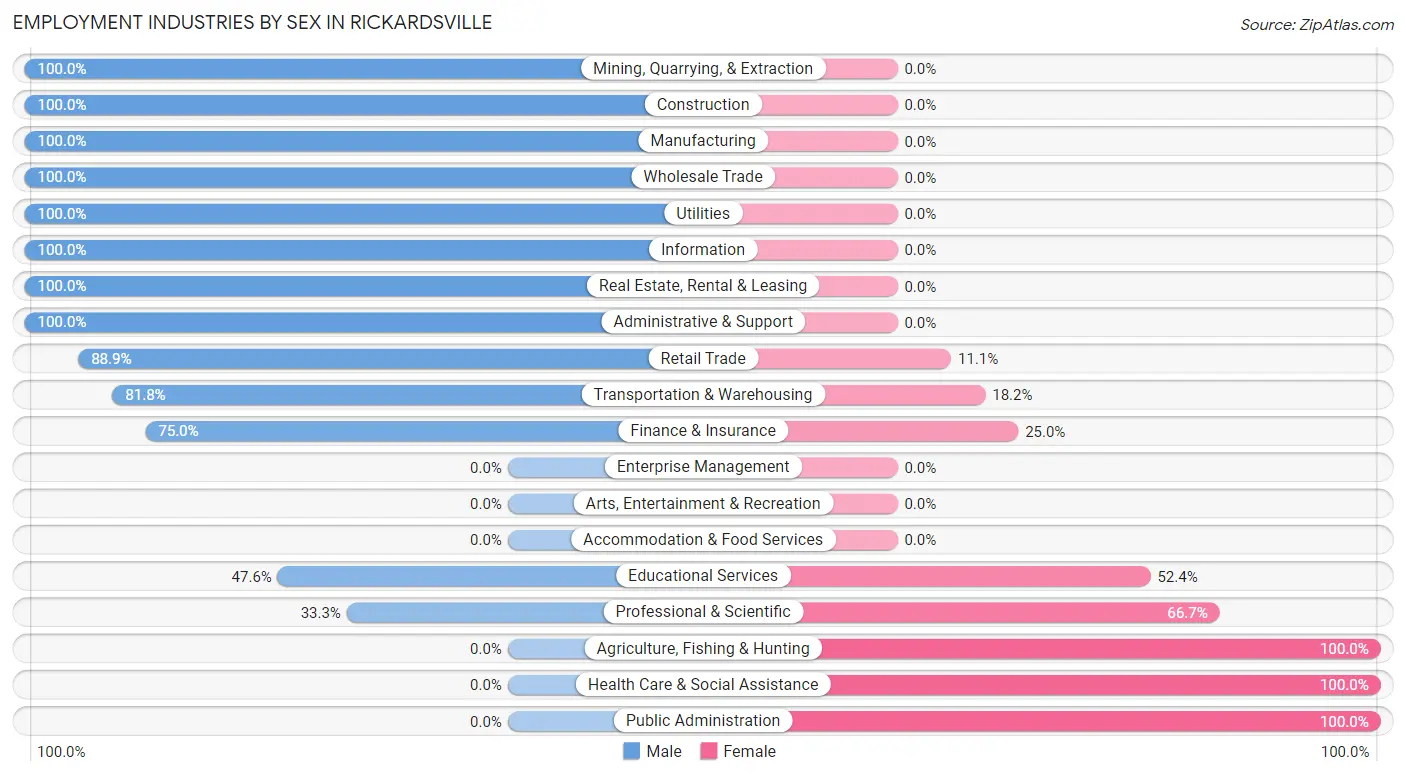
Employment Industries by Sex in Rickardsville
The Rickardsville industries that see more men than women are Mining, Quarrying, & Extraction (100.0%), Construction (100.0%), and Manufacturing (100.0%), whereas the industries that tend to have a higher number of women are Agriculture, Fishing & Hunting (100.0%), Health Care & Social Assistance (100.0%), and Public Administration (100.0%).
| Industry | Male | Female |
| Agriculture, Fishing & Hunting | 0 (0.0%) | 5 (100.0%) |
| Mining, Quarrying, & Extraction | 1 (100.0%) | 0 (0.0%) |
| Construction | 8 (100.0%) | 0 (0.0%) |
| Manufacturing | 10 (100.0%) | 0 (0.0%) |
| Wholesale Trade | 8 (100.0%) | 0 (0.0%) |
| Retail Trade | 8 (88.9%) | 1 (11.1%) |
| Transportation & Warehousing | 9 (81.8%) | 2 (18.2%) |
| Utilities | 2 (100.0%) | 0 (0.0%) |
| Information | 1 (100.0%) | 0 (0.0%) |
| Finance & Insurance | 9 (75.0%) | 3 (25.0%) |
| Real Estate, Rental & Leasing | 1 (100.0%) | 0 (0.0%) |
| Professional & Scientific | 1 (33.3%) | 2 (66.7%) |
| Enterprise Management | 0 (0.0%) | 0 (0.0%) |
| Administrative & Support | 1 (100.0%) | 0 (0.0%) |
| Educational Services | 10 (47.6%) | 11 (52.4%) |
| Health Care & Social Assistance | 0 (0.0%) | 16 (100.0%) |
| Arts, Entertainment & Recreation | 0 (0.0%) | 0 (0.0%) |
| Accommodation & Food Services | 0 (0.0%) | 0 (0.0%) |
| Public Administration | 0 (0.0%) | 3 (100.0%) |
| Total | 81 (65.3%) | 43 (34.7%) |
Education in Rickardsville
School Enrollment in Rickardsville
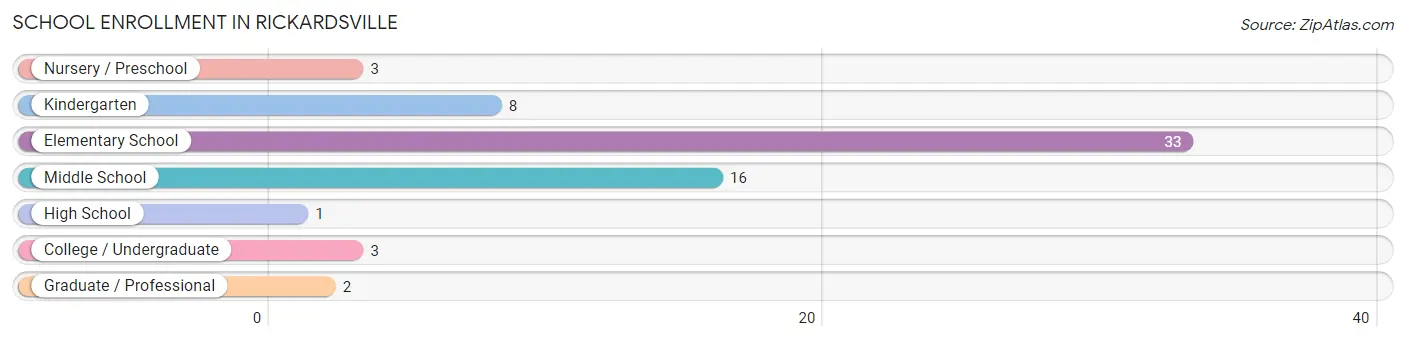
The most common levels of schooling among the 66 students in Rickardsville are elementary school (33 | 50.0%), middle school (16 | 24.2%), and kindergarten (8 | 12.1%).
| School Level | # Students | % Students |
| Nursery / Preschool | 3 | 4.5% |
| Kindergarten | 8 | 12.1% |
| Elementary School | 33 | 50.0% |
| Middle School | 16 | 24.2% |
| High School | 1 | 1.5% |
| College / Undergraduate | 3 | 4.5% |
| Graduate / Professional | 2 | 3.0% |
| Total | 66 | 100.0% |
School Enrollment by Age by Funding Source in Rickardsville
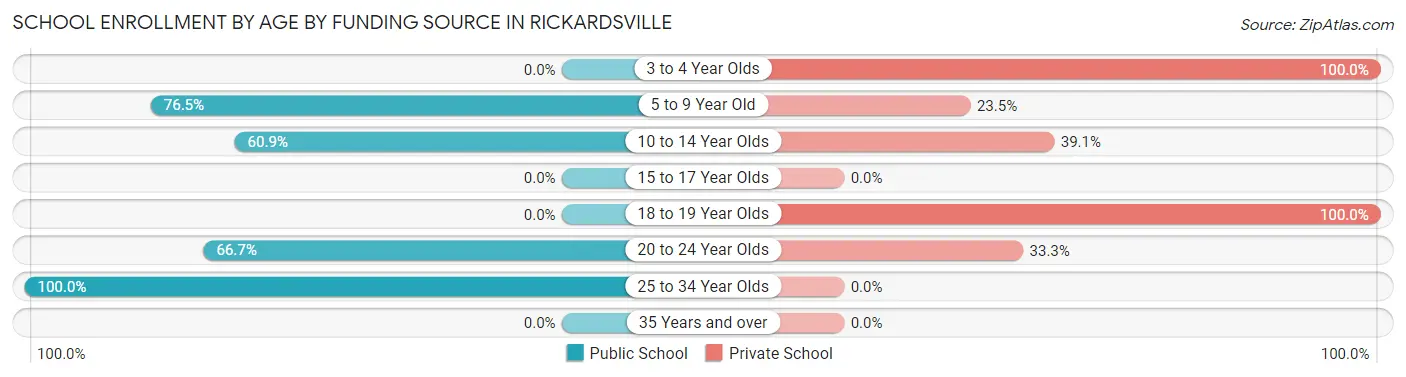
Out of a total of 66 students who are enrolled in schools in Rickardsville, 22 (33.3%) attend a private institution, while the remaining 44 (66.7%) are enrolled in public schools. The age group of 3 to 4 year olds has the highest likelihood of being enrolled in private schools, with 3 (100.0% in the age bracket) enrolled. Conversely, the age group of 25 to 34 year olds has the lowest likelihood of being enrolled in a private school, with 2 (100.0% in the age bracket) attending a public institution.
| Age Bracket | Public School | Private School |
| 3 to 4 Year Olds | 0 (0.0%) | 3 (100.0%) |
| 5 to 9 Year Old | 26 (76.5%) | 8 (23.5%) |
| 10 to 14 Year Olds | 14 (60.9%) | 9 (39.1%) |
| 15 to 17 Year Olds | 0 (0.0%) | 0 (0.0%) |
| 18 to 19 Year Olds | 0 (0.0%) | 1 (100.0%) |
| 20 to 24 Year Olds | 2 (66.7%) | 1 (33.3%) |
| 25 to 34 Year Olds | 2 (100.0%) | 0 (0.0%) |
| 35 Years and over | 0 (0.0%) | 0 (0.0%) |
| Total | 44 (66.7%) | 22 (33.3%) |
Educational Attainment by Field of Study in Rickardsville
Arts & humanities (12 | 32.4%), education (7 | 18.9%), business (6 | 16.2%), liberal arts & history (3 | 8.1%), and bio, nature & agricultural (2 | 5.4%) are the most common fields of study among 37 individuals in Rickardsville who have obtained a bachelor's degree or higher.
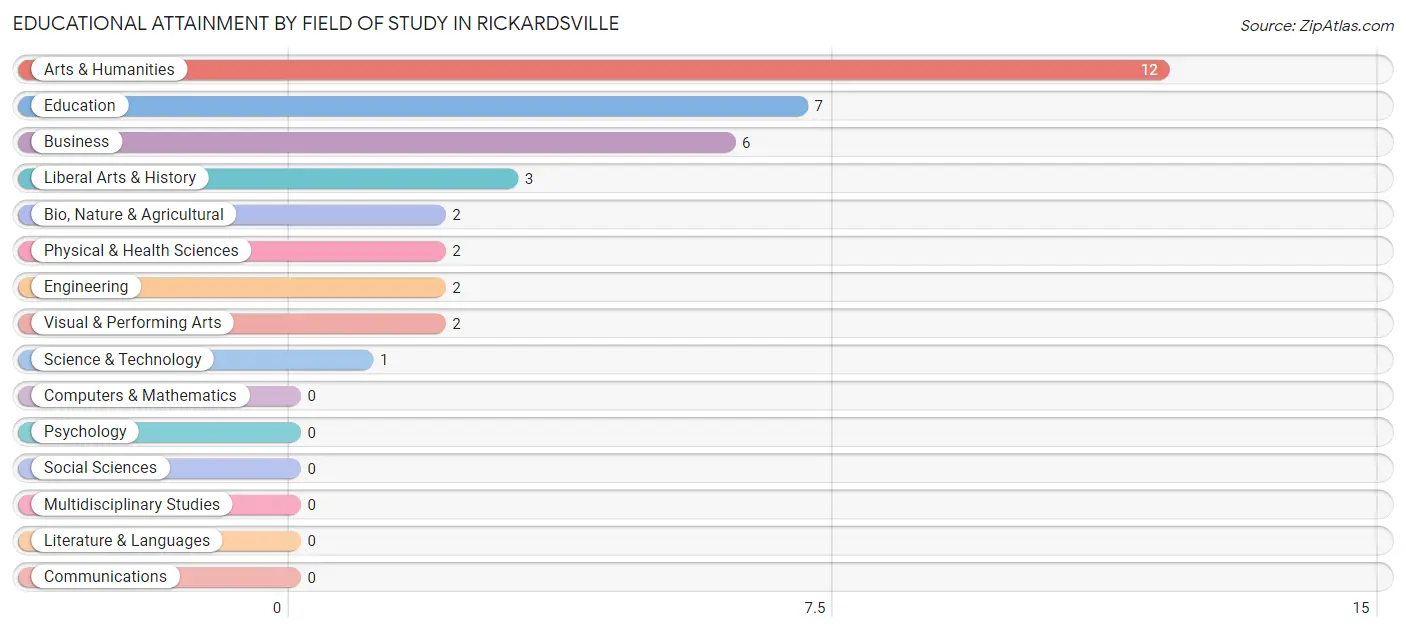
| Field of Study | # Graduates | % Graduates |
| Computers & Mathematics | 0 | 0.0% |
| Bio, Nature & Agricultural | 2 | 5.4% |
| Physical & Health Sciences | 2 | 5.4% |
| Psychology | 0 | 0.0% |
| Social Sciences | 0 | 0.0% |
| Engineering | 2 | 5.4% |
| Multidisciplinary Studies | 0 | 0.0% |
| Science & Technology | 1 | 2.7% |
| Business | 6 | 16.2% |
| Education | 7 | 18.9% |
| Literature & Languages | 0 | 0.0% |
| Liberal Arts & History | 3 | 8.1% |
| Visual & Performing Arts | 2 | 5.4% |
| Communications | 0 | 0.0% |
| Arts & Humanities | 12 | 32.4% |
| Total | 37 | 100.0% |
Transportation & Commute in Rickardsville
Vehicle Availability by Sex in Rickardsville
The most prevalent vehicle ownership categories in Rickardsville are males with 2 vehicles (28, accounting for 34.6%) and females with 2 vehicles (14, making up 65.1%).
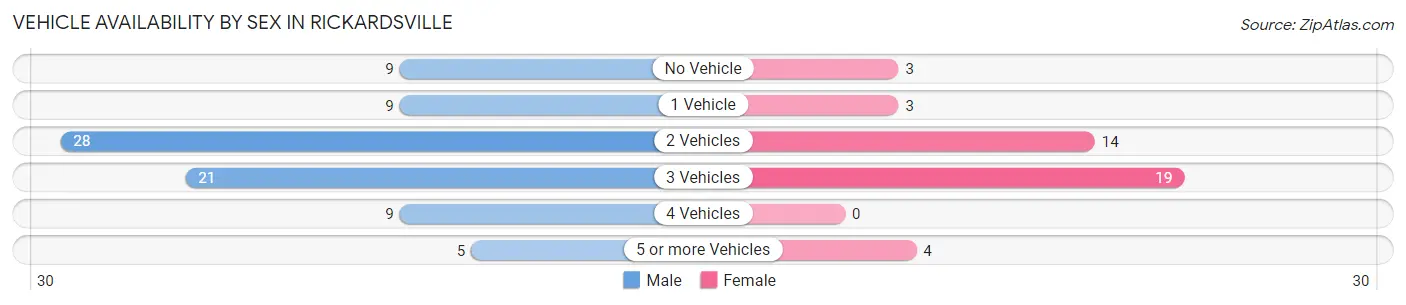
| Vehicles Available | Male | Female |
| No Vehicle | 9 (11.1%) | 3 (7.0%) |
| 1 Vehicle | 9 (11.1%) | 3 (7.0%) |
| 2 Vehicles | 28 (34.6%) | 14 (32.6%) |
| 3 Vehicles | 21 (25.9%) | 19 (44.2%) |
| 4 Vehicles | 9 (11.1%) | 0 (0.0%) |
| 5 or more Vehicles | 5 (6.2%) | 4 (9.3%) |
| Total | 81 (100.0%) | 43 (100.0%) |
Commute Time in Rickardsville
The most frequently occuring commute durations in Rickardsville are 20 to 24 minutes (34 commuters, 29.6%), 30 to 34 minutes (31 commuters, 27.0%), and less than 5 minutes (15 commuters, 13.0%).
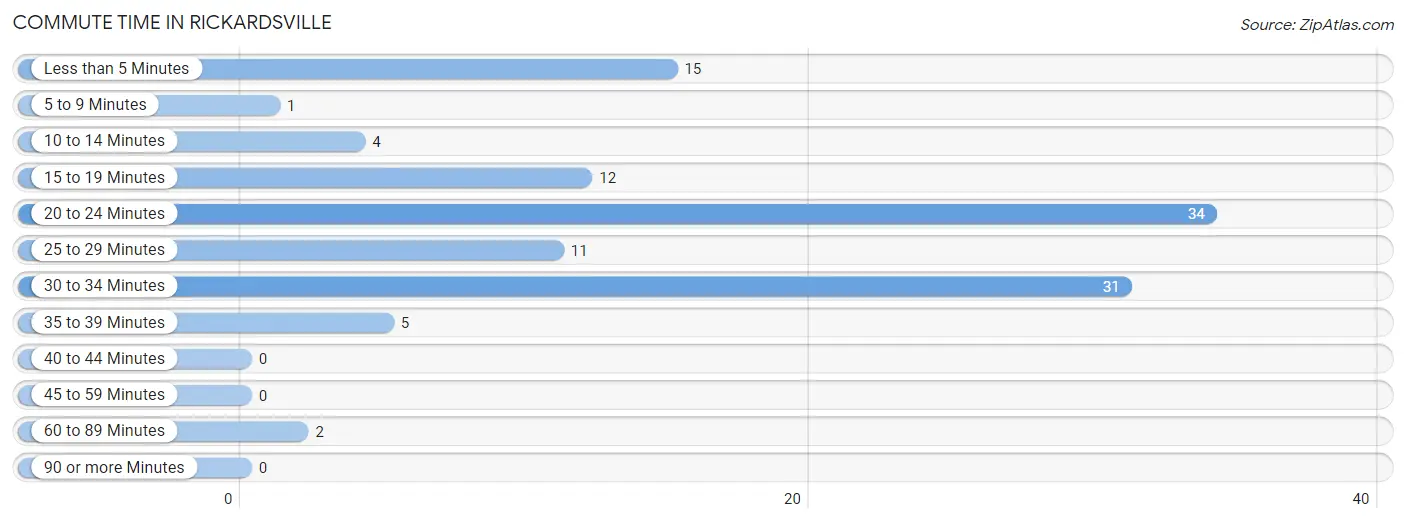
| Commute Time | # Commuters | % Commuters |
| Less than 5 Minutes | 15 | 13.0% |
| 5 to 9 Minutes | 1 | 0.9% |
| 10 to 14 Minutes | 4 | 3.5% |
| 15 to 19 Minutes | 12 | 10.4% |
| 20 to 24 Minutes | 34 | 29.6% |
| 25 to 29 Minutes | 11 | 9.6% |
| 30 to 34 Minutes | 31 | 27.0% |
| 35 to 39 Minutes | 5 | 4.3% |
| 40 to 44 Minutes | 0 | 0.0% |
| 45 to 59 Minutes | 0 | 0.0% |
| 60 to 89 Minutes | 2 | 1.7% |
| 90 or more Minutes | 0 | 0.0% |
Commute Time by Sex in Rickardsville
The most common commute times in Rickardsville are 20 to 24 minutes (20 commuters, 27.0%) for males and 20 to 24 minutes (14 commuters, 34.2%) for females.
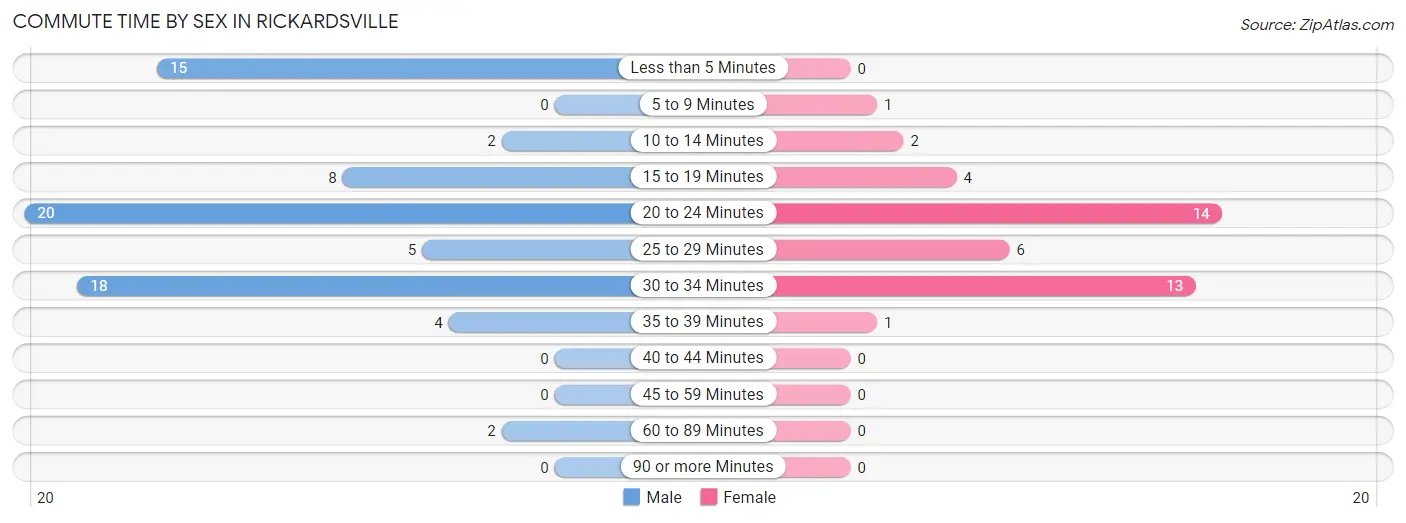
| Commute Time | Male | Female |
| Less than 5 Minutes | 15 (20.3%) | 0 (0.0%) |
| 5 to 9 Minutes | 0 (0.0%) | 1 (2.4%) |
| 10 to 14 Minutes | 2 (2.7%) | 2 (4.9%) |
| 15 to 19 Minutes | 8 (10.8%) | 4 (9.8%) |
| 20 to 24 Minutes | 20 (27.0%) | 14 (34.2%) |
| 25 to 29 Minutes | 5 (6.8%) | 6 (14.6%) |
| 30 to 34 Minutes | 18 (24.3%) | 13 (31.7%) |
| 35 to 39 Minutes | 4 (5.4%) | 1 (2.4%) |
| 40 to 44 Minutes | 0 (0.0%) | 0 (0.0%) |
| 45 to 59 Minutes | 0 (0.0%) | 0 (0.0%) |
| 60 to 89 Minutes | 2 (2.7%) | 0 (0.0%) |
| 90 or more Minutes | 0 (0.0%) | 0 (0.0%) |
Time of Departure to Work by Sex in Rickardsville
The most frequent times of departure to work in Rickardsville are 7:30 AM to 7:59 AM (16, 21.6%) for males and 7:00 AM to 7:29 AM (12, 29.3%) for females.
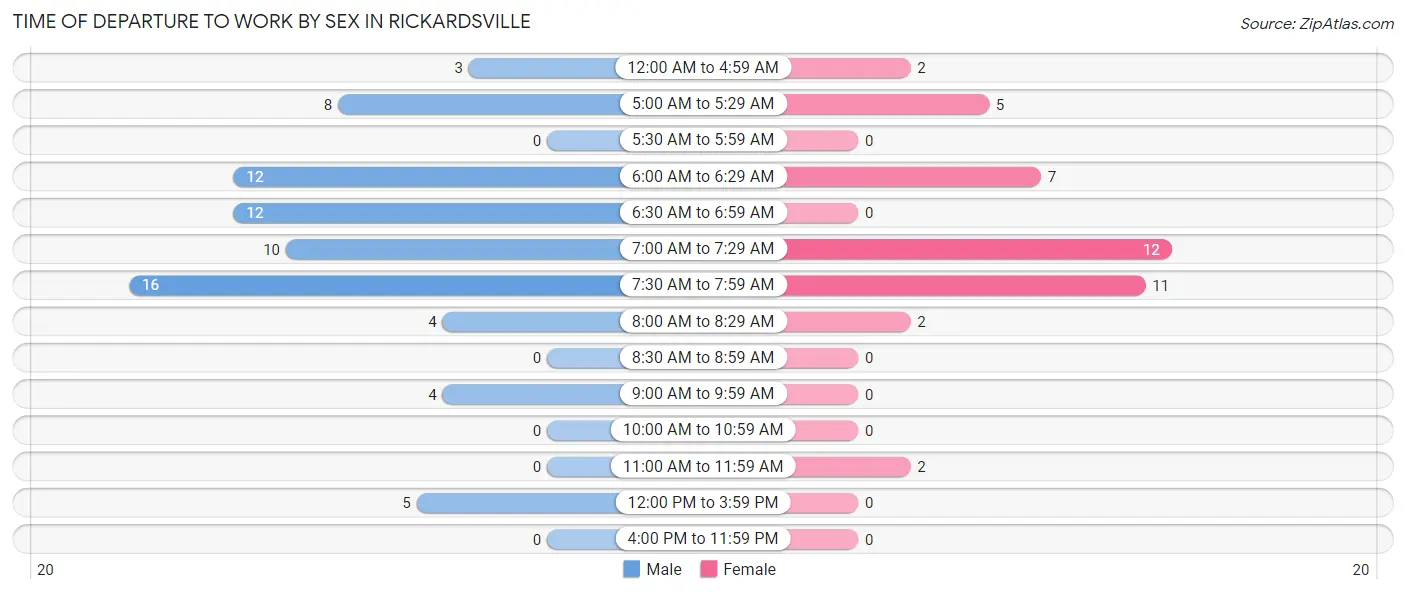
| Time of Departure | Male | Female |
| 12:00 AM to 4:59 AM | 3 (4.1%) | 2 (4.9%) |
| 5:00 AM to 5:29 AM | 8 (10.8%) | 5 (12.2%) |
| 5:30 AM to 5:59 AM | 0 (0.0%) | 0 (0.0%) |
| 6:00 AM to 6:29 AM | 12 (16.2%) | 7 (17.1%) |
| 6:30 AM to 6:59 AM | 12 (16.2%) | 0 (0.0%) |
| 7:00 AM to 7:29 AM | 10 (13.5%) | 12 (29.3%) |
| 7:30 AM to 7:59 AM | 16 (21.6%) | 11 (26.8%) |
| 8:00 AM to 8:29 AM | 4 (5.4%) | 2 (4.9%) |
| 8:30 AM to 8:59 AM | 0 (0.0%) | 0 (0.0%) |
| 9:00 AM to 9:59 AM | 4 (5.4%) | 0 (0.0%) |
| 10:00 AM to 10:59 AM | 0 (0.0%) | 0 (0.0%) |
| 11:00 AM to 11:59 AM | 0 (0.0%) | 2 (4.9%) |
| 12:00 PM to 3:59 PM | 5 (6.8%) | 0 (0.0%) |
| 4:00 PM to 11:59 PM | 0 (0.0%) | 0 (0.0%) |
| Total | 74 (100.0%) | 41 (100.0%) |
Housing Occupancy in Rickardsville
Occupancy by Ownership in Rickardsville
Of the total 90 dwellings in Rickardsville, owner-occupied units account for 87 (96.7%), while renter-occupied units make up 3 (3.3%).
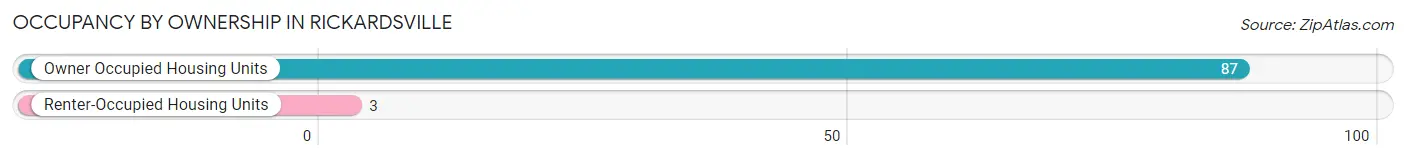
| Occupancy | # Housing Units | % Housing Units |
| Owner Occupied Housing Units | 87 | 96.7% |
| Renter-Occupied Housing Units | 3 | 3.3% |
| Total Occupied Housing Units | 90 | 100.0% |
Occupancy by Household Size in Rickardsville
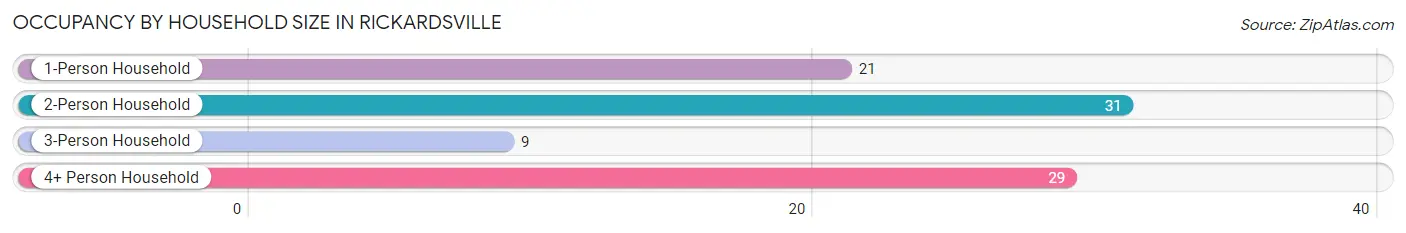
| Household Size | # Housing Units | % Housing Units |
| 1-Person Household | 21 | 23.3% |
| 2-Person Household | 31 | 34.4% |
| 3-Person Household | 9 | 10.0% |
| 4+ Person Household | 29 | 32.2% |
| Total Housing Units | 90 | 100.0% |
Occupancy by Ownership by Household Size in Rickardsville
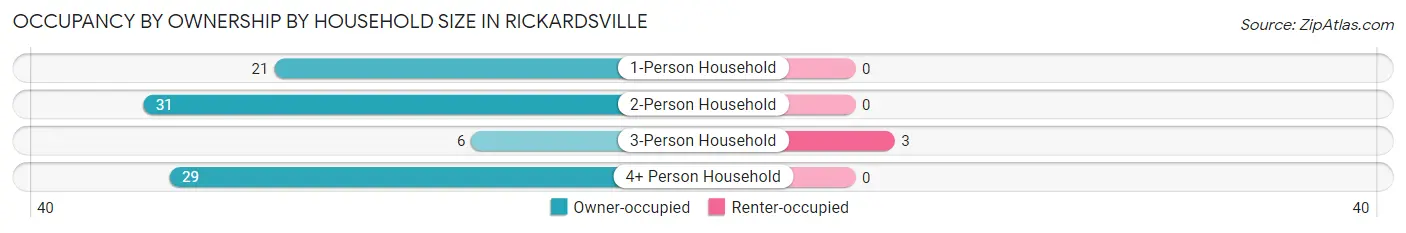
| Household Size | Owner-occupied | Renter-occupied |
| 1-Person Household | 21 (100.0%) | 0 (0.0%) |
| 2-Person Household | 31 (100.0%) | 0 (0.0%) |
| 3-Person Household | 6 (66.7%) | 3 (33.3%) |
| 4+ Person Household | 29 (100.0%) | 0 (0.0%) |
| Total Housing Units | 87 (96.7%) | 3 (3.3%) |
Occupancy by Educational Attainment in Rickardsville
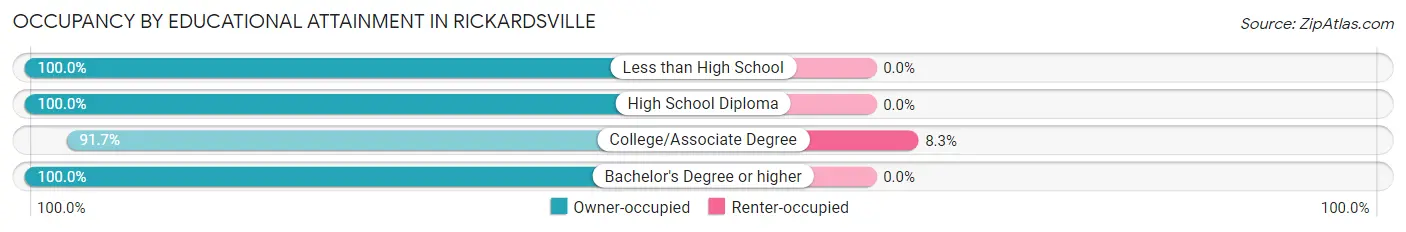
| Household Size | Owner-occupied | Renter-occupied |
| Less than High School | 1 (100.0%) | 0 (0.0%) |
| High School Diploma | 27 (100.0%) | 0 (0.0%) |
| College/Associate Degree | 33 (91.7%) | 3 (8.3%) |
| Bachelor's Degree or higher | 26 (100.0%) | 0 (0.0%) |
Occupancy by Age of Householder in Rickardsville
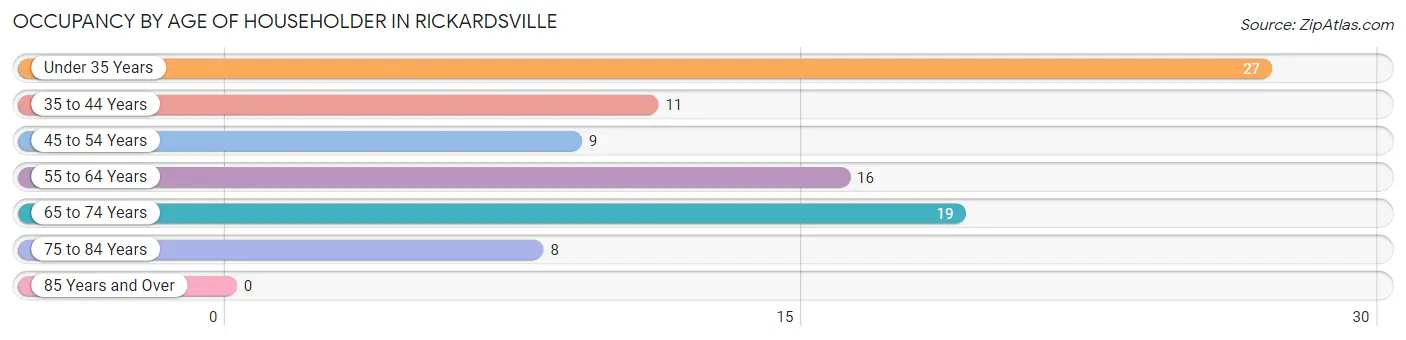
| Age Bracket | # Households | % Households |
| Under 35 Years | 27 | 30.0% |
| 35 to 44 Years | 11 | 12.2% |
| 45 to 54 Years | 9 | 10.0% |
| 55 to 64 Years | 16 | 17.8% |
| 65 to 74 Years | 19 | 21.1% |
| 75 to 84 Years | 8 | 8.9% |
| 85 Years and Over | 0 | 0.0% |
| Total | 90 | 100.0% |
Housing Finances in Rickardsville
Median Income by Occupancy in Rickardsville
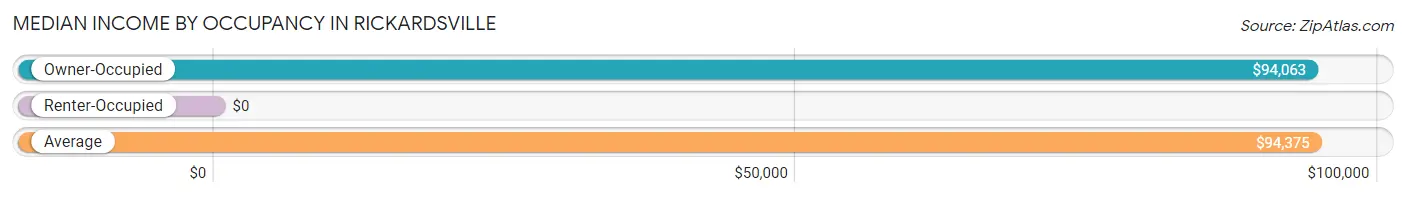
| Occupancy Type | # Households | Median Income |
| Owner-Occupied | 87 (96.7%) | $94,063 |
| Renter-Occupied | 3 (3.3%) | $0 |
| Average | 90 (100.0%) | $94,375 |
Occupancy by Householder Income Bracket in Rickardsville
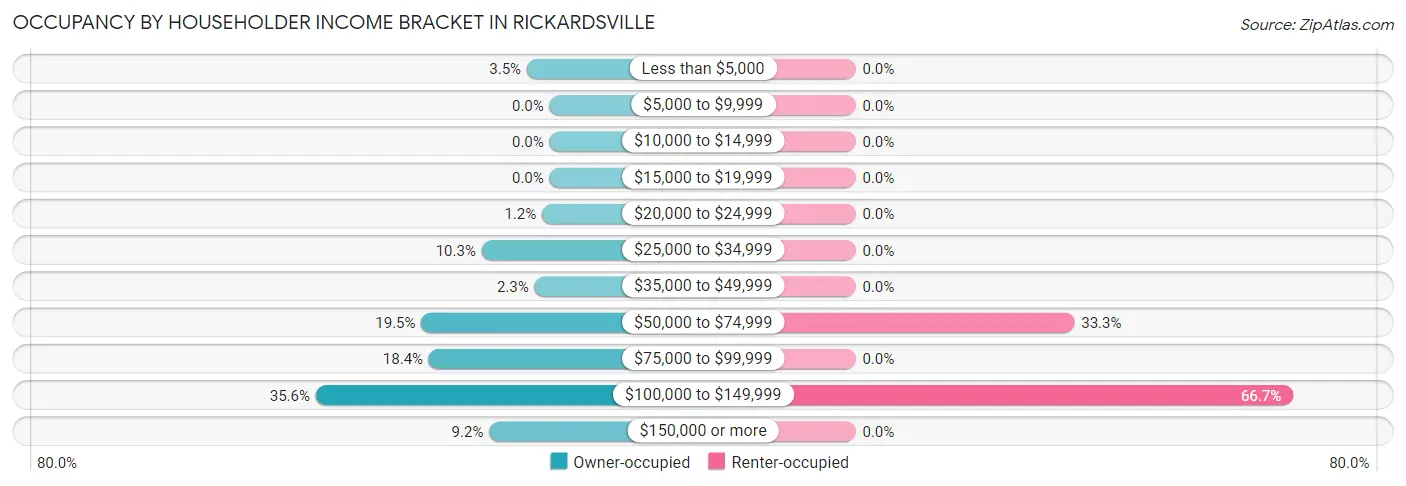
| Income Bracket | Owner-occupied | Renter-occupied |
| Less than $5,000 | 3 (3.5%) | 0 (0.0%) |
| $5,000 to $9,999 | 0 (0.0%) | 0 (0.0%) |
| $10,000 to $14,999 | 0 (0.0%) | 0 (0.0%) |
| $15,000 to $19,999 | 0 (0.0%) | 0 (0.0%) |
| $20,000 to $24,999 | 1 (1.1%) | 0 (0.0%) |
| $25,000 to $34,999 | 9 (10.3%) | 0 (0.0%) |
| $35,000 to $49,999 | 2 (2.3%) | 0 (0.0%) |
| $50,000 to $74,999 | 17 (19.5%) | 1 (33.3%) |
| $75,000 to $99,999 | 16 (18.4%) | 0 (0.0%) |
| $100,000 to $149,999 | 31 (35.6%) | 2 (66.7%) |
| $150,000 or more | 8 (9.2%) | 0 (0.0%) |
| Total | 87 (100.0%) | 3 (100.0%) |
Monthly Housing Cost Tiers in Rickardsville
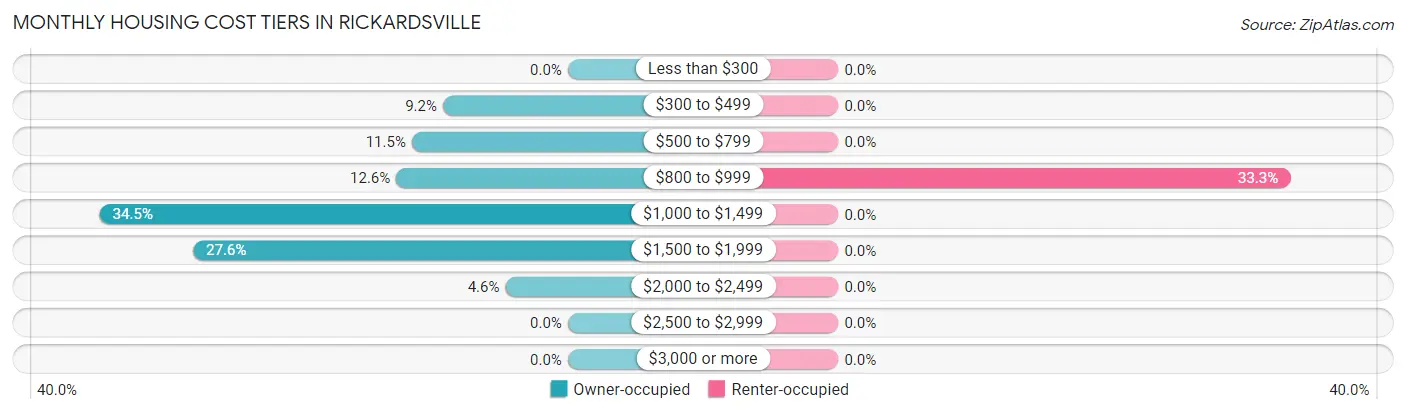
| Monthly Cost | Owner-occupied | Renter-occupied |
| Less than $300 | 0 (0.0%) | 0 (0.0%) |
| $300 to $499 | 8 (9.2%) | 0 (0.0%) |
| $500 to $799 | 10 (11.5%) | 0 (0.0%) |
| $800 to $999 | 11 (12.6%) | 1 (33.3%) |
| $1,000 to $1,499 | 30 (34.5%) | 0 (0.0%) |
| $1,500 to $1,999 | 24 (27.6%) | 0 (0.0%) |
| $2,000 to $2,499 | 4 (4.6%) | 0 (0.0%) |
| $2,500 to $2,999 | 0 (0.0%) | 0 (0.0%) |
| $3,000 or more | 0 (0.0%) | 0 (0.0%) |
| Total | 87 (100.0%) | 3 (100.0%) |
Physical Housing Characteristics in Rickardsville
Housing Structures in Rickardsville
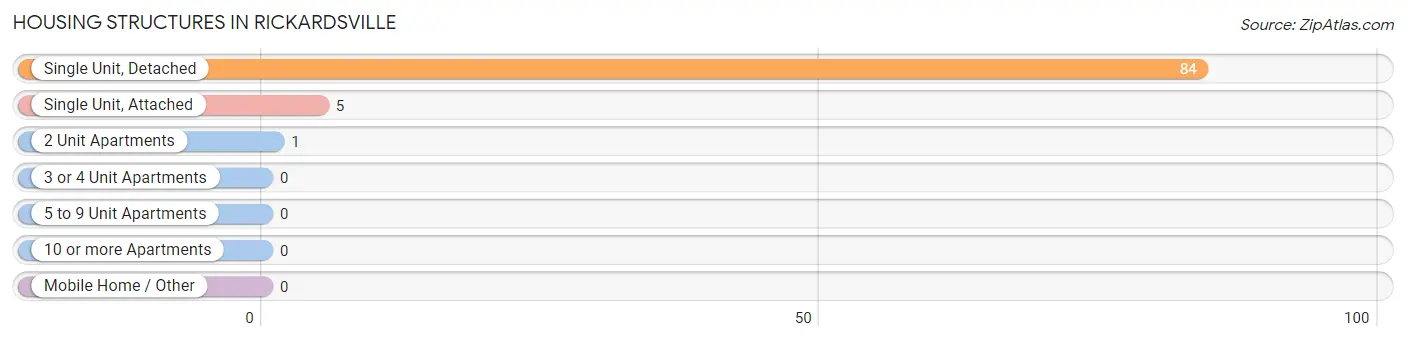
| Structure Type | # Housing Units | % Housing Units |
| Single Unit, Detached | 84 | 93.3% |
| Single Unit, Attached | 5 | 5.6% |
| 2 Unit Apartments | 1 | 1.1% |
| 3 or 4 Unit Apartments | 0 | 0.0% |
| 5 to 9 Unit Apartments | 0 | 0.0% |
| 10 or more Apartments | 0 | 0.0% |
| Mobile Home / Other | 0 | 0.0% |
| Total | 90 | 100.0% |
Housing Structures by Occupancy in Rickardsville
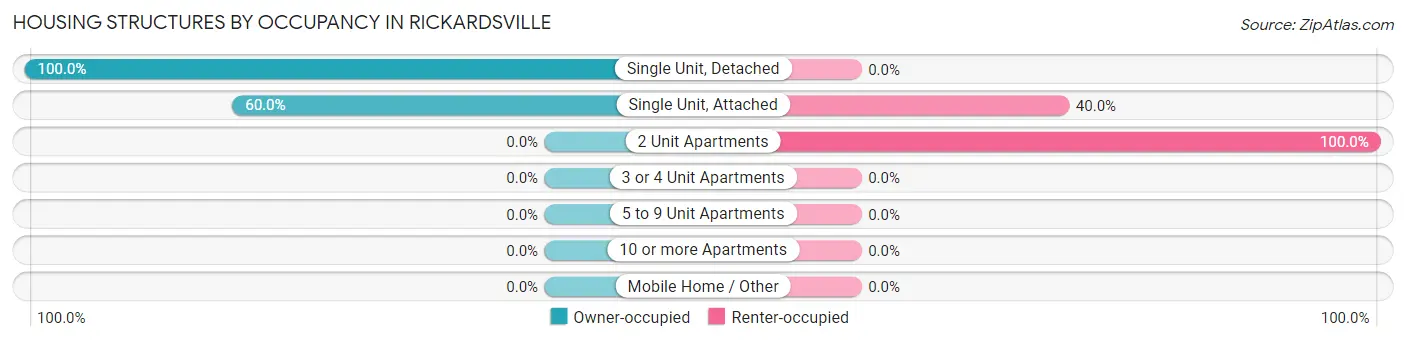
| Structure Type | Owner-occupied | Renter-occupied |
| Single Unit, Detached | 84 (100.0%) | 0 (0.0%) |
| Single Unit, Attached | 3 (60.0%) | 2 (40.0%) |
| 2 Unit Apartments | 0 (0.0%) | 1 (100.0%) |
| 3 or 4 Unit Apartments | 0 (0.0%) | 0 (0.0%) |
| 5 to 9 Unit Apartments | 0 (0.0%) | 0 (0.0%) |
| 10 or more Apartments | 0 (0.0%) | 0 (0.0%) |
| Mobile Home / Other | 0 (0.0%) | 0 (0.0%) |
| Total | 87 (96.7%) | 3 (3.3%) |
Housing Structures by Number of Rooms in Rickardsville
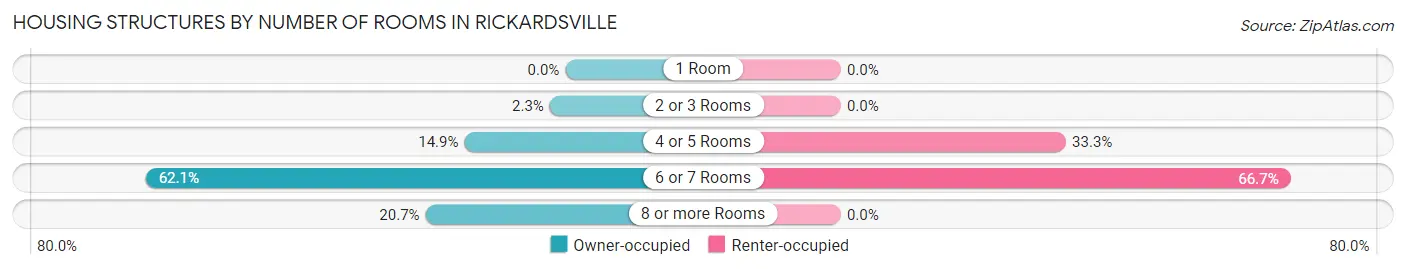
| Number of Rooms | Owner-occupied | Renter-occupied |
| 1 Room | 0 (0.0%) | 0 (0.0%) |
| 2 or 3 Rooms | 2 (2.3%) | 0 (0.0%) |
| 4 or 5 Rooms | 13 (14.9%) | 1 (33.3%) |
| 6 or 7 Rooms | 54 (62.1%) | 2 (66.7%) |
| 8 or more Rooms | 18 (20.7%) | 0 (0.0%) |
| Total | 87 (100.0%) | 3 (100.0%) |
Housing Structure by Heating Type in Rickardsville
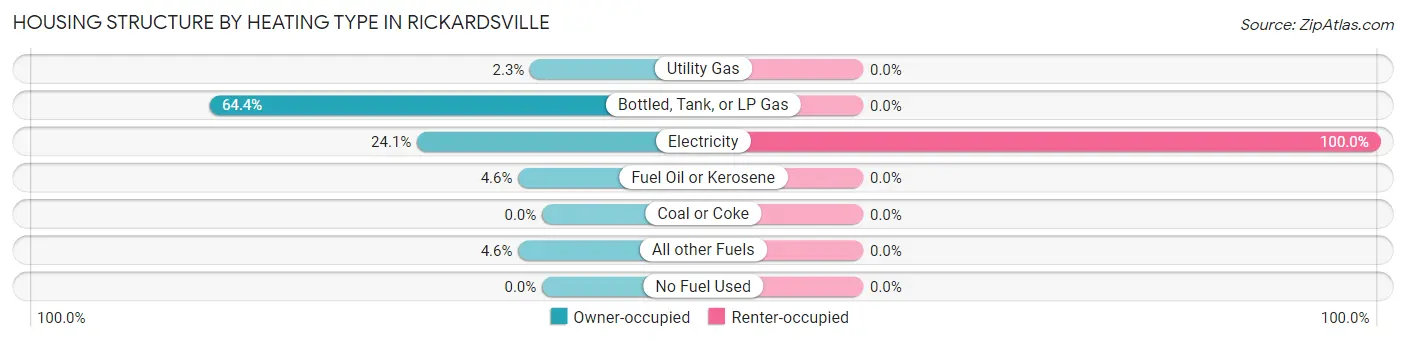
| Heating Type | Owner-occupied | Renter-occupied |
| Utility Gas | 2 (2.3%) | 0 (0.0%) |
| Bottled, Tank, or LP Gas | 56 (64.4%) | 0 (0.0%) |
| Electricity | 21 (24.1%) | 3 (100.0%) |
| Fuel Oil or Kerosene | 4 (4.6%) | 0 (0.0%) |
| Coal or Coke | 0 (0.0%) | 0 (0.0%) |
| All other Fuels | 4 (4.6%) | 0 (0.0%) |
| No Fuel Used | 0 (0.0%) | 0 (0.0%) |
| Total | 87 (100.0%) | 3 (100.0%) |
Household Vehicle Usage in Rickardsville
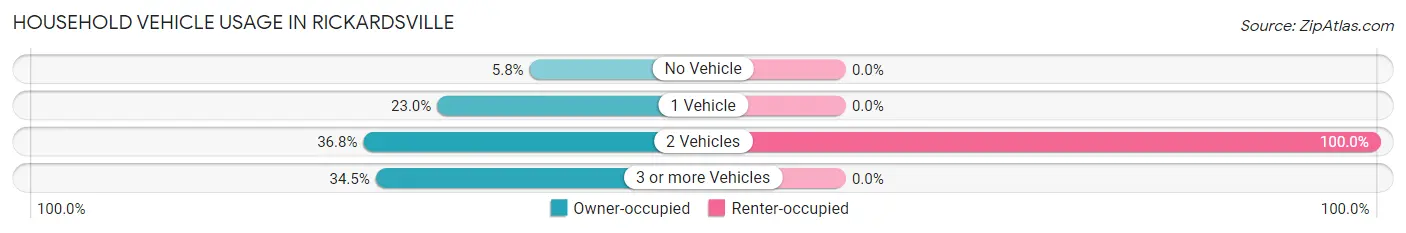
| Vehicles per Household | Owner-occupied | Renter-occupied |
| No Vehicle | 5 (5.8%) | 0 (0.0%) |
| 1 Vehicle | 20 (23.0%) | 0 (0.0%) |
| 2 Vehicles | 32 (36.8%) | 3 (100.0%) |
| 3 or more Vehicles | 30 (34.5%) | 0 (0.0%) |
| Total | 87 (100.0%) | 3 (100.0%) |
Real Estate & Mortgages in Rickardsville
Real Estate and Mortgage Overview in Rickardsville
| Characteristic | Without Mortgage | With Mortgage |
| Housing Units | 34 | 53 |
| Median Property Value | $290,000 | $233,900 |
| Median Household Income | $76,250 | $7 |
| Monthly Housing Costs | $800 | $0 |
| Real Estate Taxes | $3,167 | $0 |
Property Value by Mortgage Status in Rickardsville
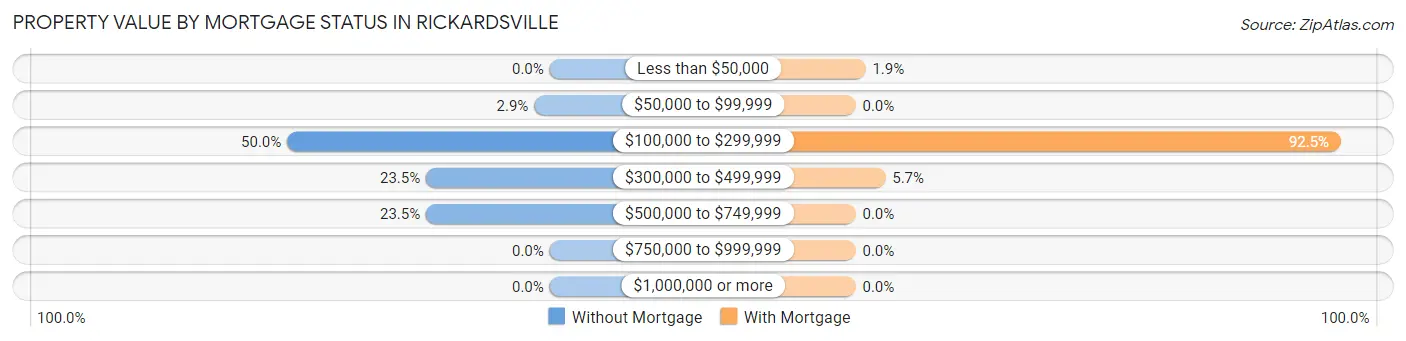
| Property Value | Without Mortgage | With Mortgage |
| Less than $50,000 | 0 (0.0%) | 1 (1.9%) |
| $50,000 to $99,999 | 1 (2.9%) | 0 (0.0%) |
| $100,000 to $299,999 | 17 (50.0%) | 49 (92.4%) |
| $300,000 to $499,999 | 8 (23.5%) | 3 (5.7%) |
| $500,000 to $749,999 | 8 (23.5%) | 0 (0.0%) |
| $750,000 to $999,999 | 0 (0.0%) | 0 (0.0%) |
| $1,000,000 or more | 0 (0.0%) | 0 (0.0%) |
| Total | 34 (100.0%) | 53 (100.0%) |
Household Income by Mortgage Status in Rickardsville
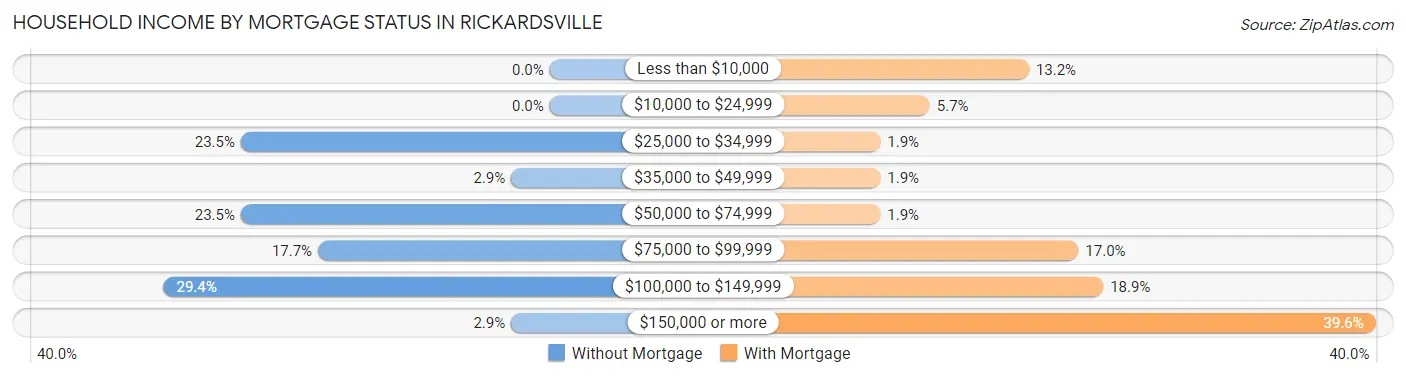
| Household Income | Without Mortgage | With Mortgage |
| Less than $10,000 | 0 (0.0%) | 7 (13.2%) |
| $10,000 to $24,999 | 0 (0.0%) | 3 (5.7%) |
| $25,000 to $34,999 | 8 (23.5%) | 1 (1.9%) |
| $35,000 to $49,999 | 1 (2.9%) | 1 (1.9%) |
| $50,000 to $74,999 | 8 (23.5%) | 1 (1.9%) |
| $75,000 to $99,999 | 6 (17.6%) | 9 (17.0%) |
| $100,000 to $149,999 | 10 (29.4%) | 10 (18.9%) |
| $150,000 or more | 1 (2.9%) | 21 (39.6%) |
| Total | 34 (100.0%) | 53 (100.0%) |
Property Value to Household Income Ratio in Rickardsville
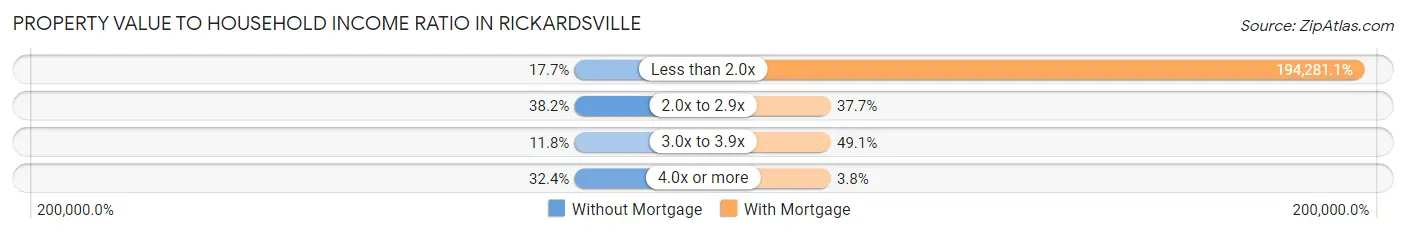
| Value-to-Income Ratio | Without Mortgage | With Mortgage |
| Less than 2.0x | 6 (17.6%) | 102,969 (194,281.1%) |
| 2.0x to 2.9x | 13 (38.2%) | 20 (37.7%) |
| 3.0x to 3.9x | 4 (11.8%) | 26 (49.1%) |
| 4.0x or more | 11 (32.4%) | 2 (3.8%) |
| Total | 34 (100.0%) | 53 (100.0%) |
Real Estate Taxes by Mortgage Status in Rickardsville
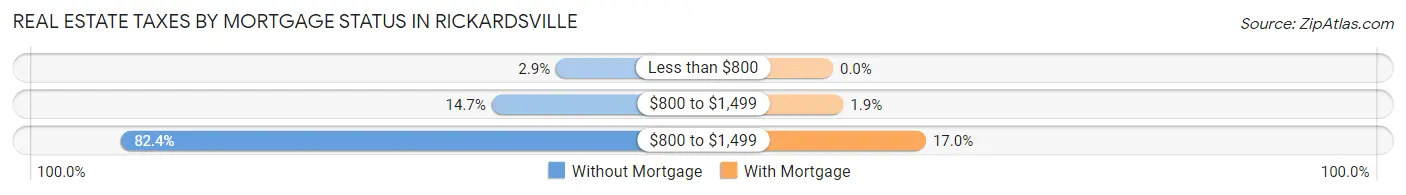
| Property Taxes | Without Mortgage | With Mortgage |
| Less than $800 | 1 (2.9%) | 0 (0.0%) |
| $800 to $1,499 | 5 (14.7%) | 1 (1.9%) |
| $800 to $1,499 | 28 (82.4%) | 9 (17.0%) |
| Total | 34 (100.0%) | 53 (100.0%) |
Health & Disability in Rickardsville
Health Insurance Coverage by Age in Rickardsville
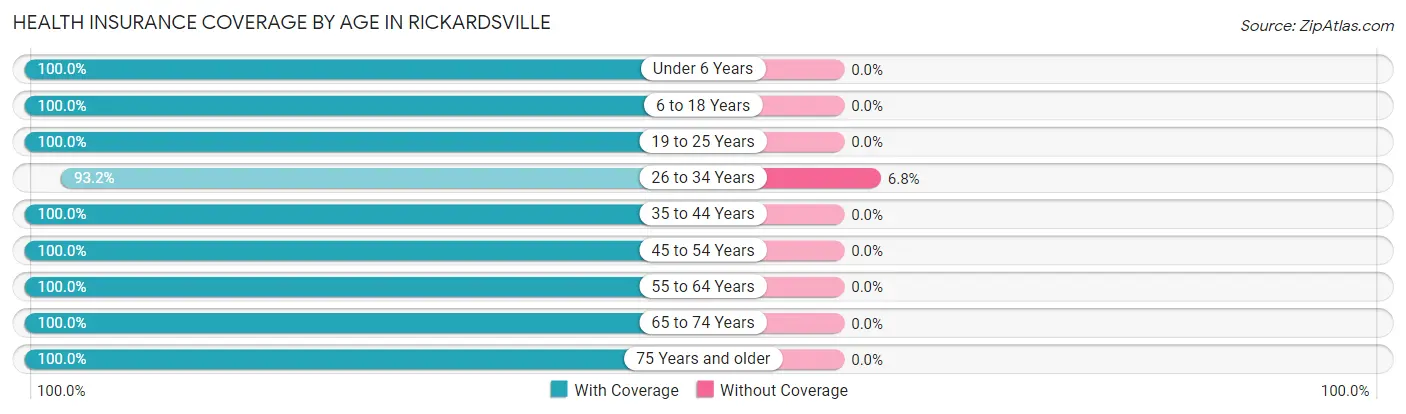
| Age Bracket | With Coverage | Without Coverage |
| Under 6 Years | 34 (100.0%) | 0 (0.0%) |
| 6 to 18 Years | 50 (100.0%) | 0 (0.0%) |
| 19 to 25 Years | 14 (100.0%) | 0 (0.0%) |
| 26 to 34 Years | 41 (93.2%) | 3 (6.8%) |
| 35 to 44 Years | 22 (100.0%) | 0 (0.0%) |
| 45 to 54 Years | 20 (100.0%) | 0 (0.0%) |
| 55 to 64 Years | 28 (100.0%) | 0 (0.0%) |
| 65 to 74 Years | 31 (100.0%) | 0 (0.0%) |
| 75 Years and older | 15 (100.0%) | 0 (0.0%) |
| Total | 255 (98.8%) | 3 (1.2%) |
Health Insurance Coverage by Citizenship Status in Rickardsville
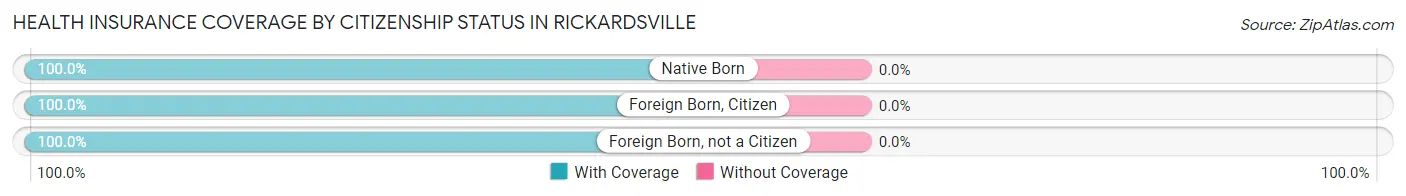
| Citizenship Status | With Coverage | Without Coverage |
| Native Born | 34 (100.0%) | 0 (0.0%) |
| Foreign Born, Citizen | 50 (100.0%) | 0 (0.0%) |
| Foreign Born, not a Citizen | 14 (100.0%) | 0 (0.0%) |
Health Insurance Coverage by Household Income in Rickardsville
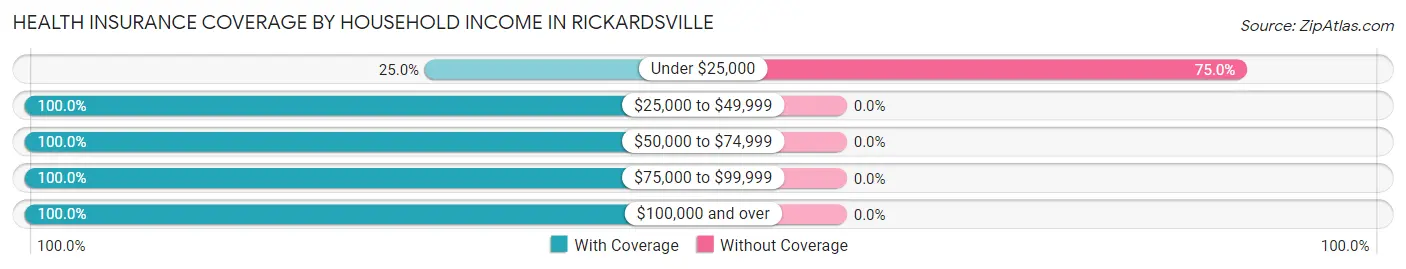
| Household Income | With Coverage | Without Coverage |
| Under $25,000 | 1 (25.0%) | 3 (75.0%) |
| $25,000 to $49,999 | 12 (100.0%) | 0 (0.0%) |
| $50,000 to $74,999 | 37 (100.0%) | 0 (0.0%) |
| $75,000 to $99,999 | 36 (100.0%) | 0 (0.0%) |
| $100,000 and over | 169 (100.0%) | 0 (0.0%) |
Public vs Private Health Insurance Coverage by Age in Rickardsville
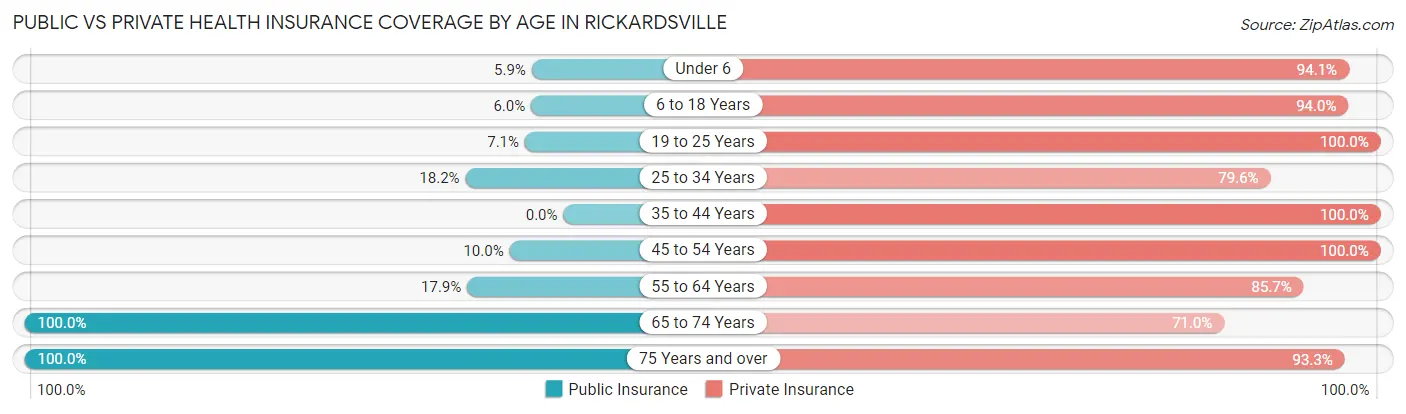
| Age Bracket | Public Insurance | Private Insurance |
| Under 6 | 2 (5.9%) | 32 (94.1%) |
| 6 to 18 Years | 3 (6.0%) | 47 (94.0%) |
| 19 to 25 Years | 1 (7.1%) | 14 (100.0%) |
| 25 to 34 Years | 8 (18.2%) | 35 (79.5%) |
| 35 to 44 Years | 0 (0.0%) | 22 (100.0%) |
| 45 to 54 Years | 2 (10.0%) | 20 (100.0%) |
| 55 to 64 Years | 5 (17.9%) | 24 (85.7%) |
| 65 to 74 Years | 31 (100.0%) | 22 (71.0%) |
| 75 Years and over | 15 (100.0%) | 14 (93.3%) |
| Total | 67 (26.0%) | 230 (89.1%) |
Disability Status by Sex by Age in Rickardsville
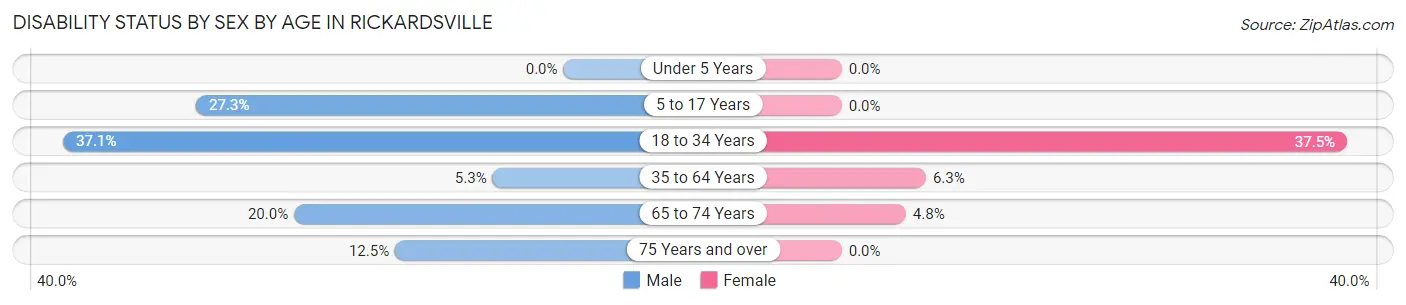
| Age Bracket | Male | Female |
| Under 5 Years | 0 (0.0%) | 0 (0.0%) |
| 5 to 17 Years | 9 (27.3%) | 0 (0.0%) |
| 18 to 34 Years | 13 (37.1%) | 9 (37.5%) |
| 35 to 64 Years | 2 (5.3%) | 2 (6.2%) |
| 65 to 74 Years | 2 (20.0%) | 1 (4.8%) |
| 75 Years and over | 1 (12.5%) | 0 (0.0%) |
Disability Class by Sex by Age in Rickardsville
Disability Class: Hearing Difficulty
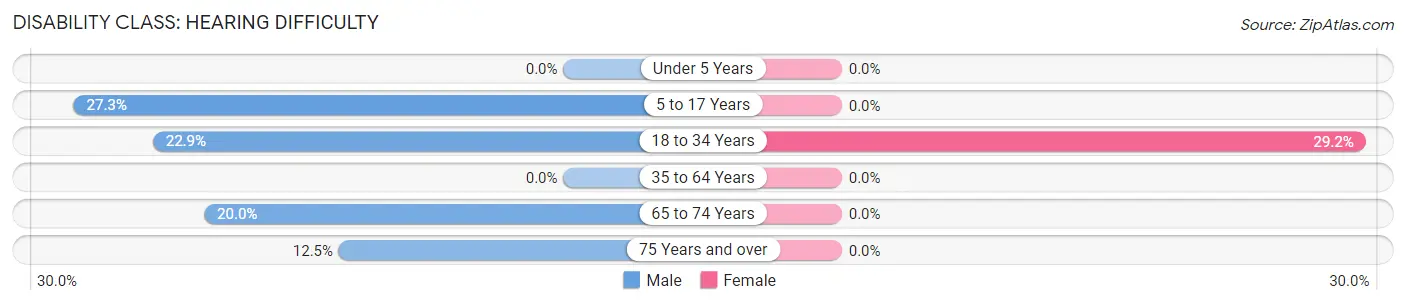
| Age Bracket | Male | Female |
| Under 5 Years | 0 (0.0%) | 0 (0.0%) |
| 5 to 17 Years | 9 (27.3%) | 0 (0.0%) |
| 18 to 34 Years | 8 (22.9%) | 7 (29.2%) |
| 35 to 64 Years | 0 (0.0%) | 0 (0.0%) |
| 65 to 74 Years | 2 (20.0%) | 0 (0.0%) |
| 75 Years and over | 1 (12.5%) | 0 (0.0%) |
Disability Class: Vision Difficulty
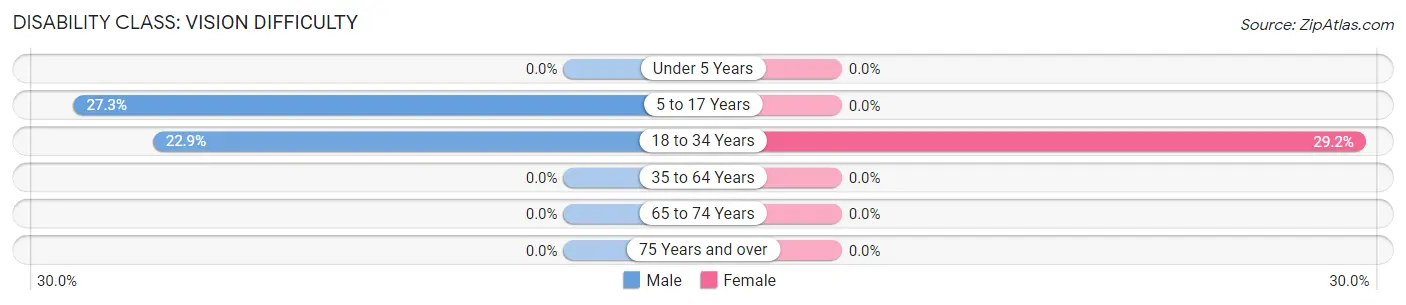
| Age Bracket | Male | Female |
| Under 5 Years | 0 (0.0%) | 0 (0.0%) |
| 5 to 17 Years | 9 (27.3%) | 0 (0.0%) |
| 18 to 34 Years | 8 (22.9%) | 7 (29.2%) |
| 35 to 64 Years | 0 (0.0%) | 0 (0.0%) |
| 65 to 74 Years | 0 (0.0%) | 0 (0.0%) |
| 75 Years and over | 0 (0.0%) | 0 (0.0%) |
Disability Class: Cognitive Difficulty
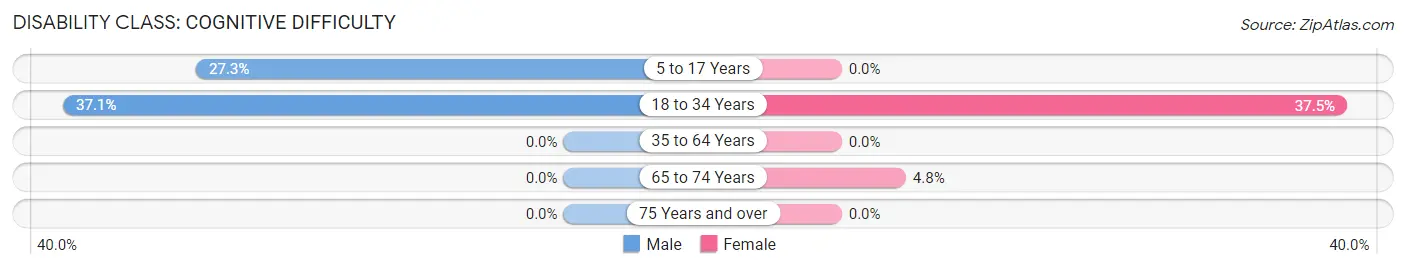
| Age Bracket | Male | Female |
| 5 to 17 Years | 9 (27.3%) | 0 (0.0%) |
| 18 to 34 Years | 13 (37.1%) | 9 (37.5%) |
| 35 to 64 Years | 0 (0.0%) | 0 (0.0%) |
| 65 to 74 Years | 0 (0.0%) | 1 (4.8%) |
| 75 Years and over | 0 (0.0%) | 0 (0.0%) |
Disability Class: Ambulatory Difficulty
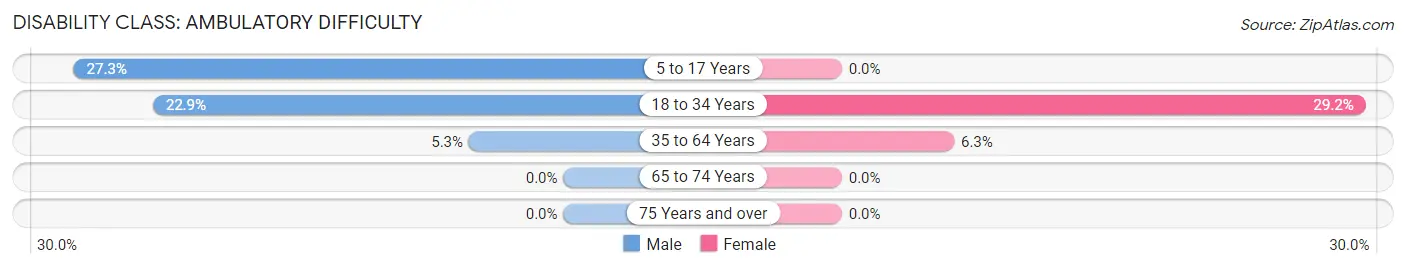
| Age Bracket | Male | Female |
| 5 to 17 Years | 9 (27.3%) | 0 (0.0%) |
| 18 to 34 Years | 8 (22.9%) | 7 (29.2%) |
| 35 to 64 Years | 2 (5.3%) | 2 (6.2%) |
| 65 to 74 Years | 0 (0.0%) | 0 (0.0%) |
| 75 Years and over | 0 (0.0%) | 0 (0.0%) |
Disability Class: Self-Care Difficulty
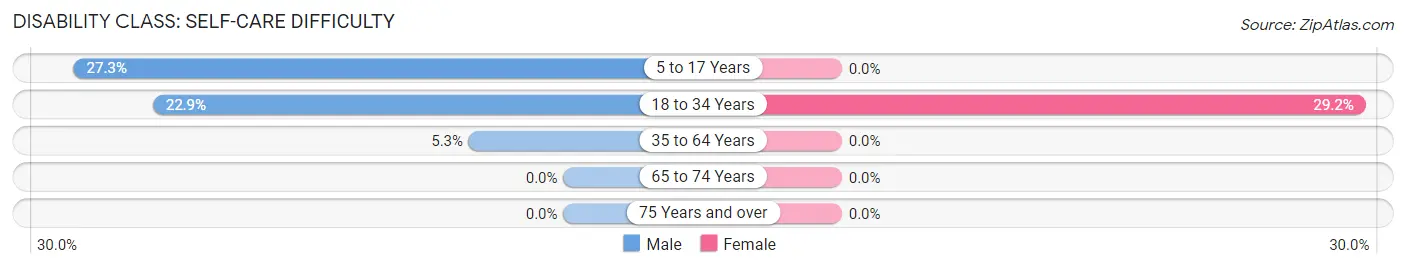
| Age Bracket | Male | Female |
| 5 to 17 Years | 9 (27.3%) | 0 (0.0%) |
| 18 to 34 Years | 8 (22.9%) | 7 (29.2%) |
| 35 to 64 Years | 2 (5.3%) | 0 (0.0%) |
| 65 to 74 Years | 0 (0.0%) | 0 (0.0%) |
| 75 Years and over | 0 (0.0%) | 0 (0.0%) |
Technology Access in Rickardsville
Computing Device Access in Rickardsville
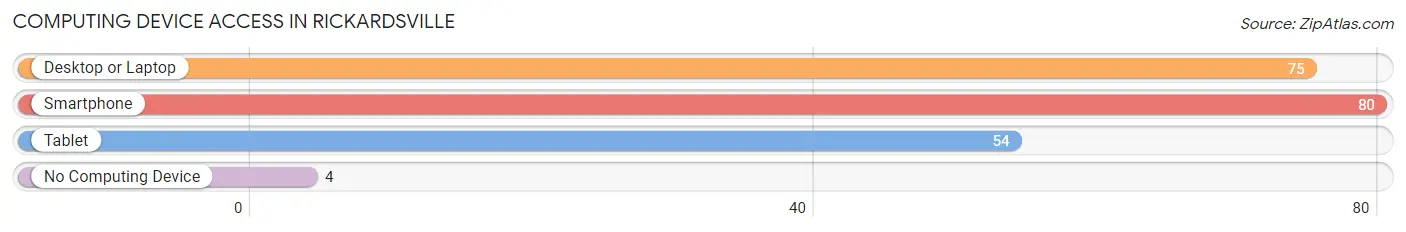
| Device Type | # Households | % Households |
| Desktop or Laptop | 75 | 83.3% |
| Smartphone | 80 | 88.9% |
| Tablet | 54 | 60.0% |
| No Computing Device | 4 | 4.4% |
| Total | 90 | 100.0% |
Internet Access in Rickardsville
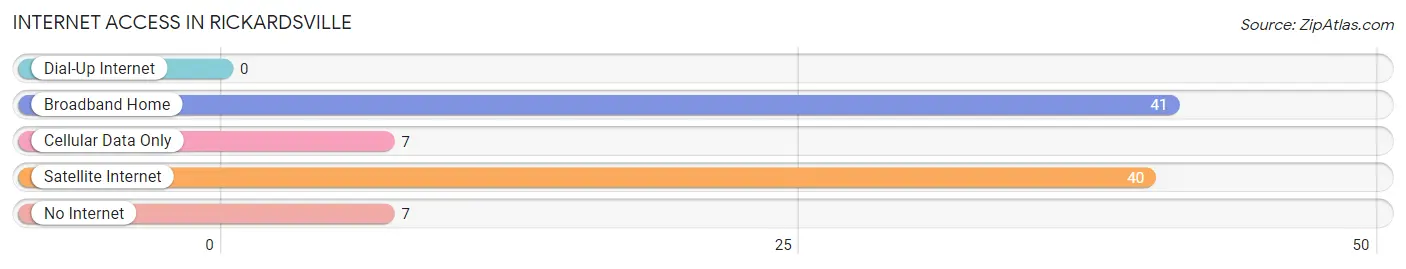
| Internet Type | # Households | % Households |
| Dial-Up Internet | 0 | 0.0% |
| Broadband Home | 41 | 45.6% |
| Cellular Data Only | 7 | 7.8% |
| Satellite Internet | 40 | 44.4% |
| No Internet | 7 | 7.8% |
| Total | 90 | 100.0% |
Rickardsville Summary
Rickardsville is a small town located in Dubuque County, Iowa. It is situated on the banks of the Little Maquoketa River, and is part of the Dubuque Metropolitan Statistical Area. The town has a population of just over 500 people, and is known for its small-town charm and rural atmosphere.
History
Rickardsville was founded in 1854 by William Rickard, a settler from Pennsylvania. He purchased the land from the government and began to build a small settlement. The town was originally called Rickardstown, but the name was changed to Rickardsville in 1856. The town was incorporated in 1858, and the first post office was established in 1859.
The town grew slowly over the years, and by the turn of the century, it had a population of just over 500 people. The town was primarily an agricultural community, with most of the population working in the fields or in the local businesses.
Geography
Rickardsville is located in the rolling hills of Dubuque County, Iowa. The town is situated on the banks of the Little Maquoketa River, and is surrounded by farmland and wooded areas. The town is located about 10 miles south of Dubuque, and is accessible by Highway 52.
The town has a total area of 0.7 square miles, all of which is land. The town has a humid continental climate, with hot summers and cold winters. The average annual temperature is around 50 degrees Fahrenheit, and the average annual precipitation is around 36 inches.
Economy
The economy of Rickardsville is primarily based on agriculture and tourism. The town is home to several small businesses, including a grocery store, a hardware store, and a few restaurants. The town also has a few small manufacturing companies, which produce a variety of products.
The town is also home to several tourist attractions, including the Little Maquoketa River, which is popular for fishing and canoeing. The town also has several parks and trails, which are popular with hikers and nature lovers.
Demographics
As of the 2010 census, the population of Rickardsville was 514 people. The racial makeup of the town was 97.3% White, 0.6% African American, 0.2% Native American, 0.4% Asian, 0.2% from other races, and 1.3% from two or more races. Hispanic or Latino of any race were 1.2% of the population.
The median income for a household in the town was $45,000, and the median income for a family was $50,000. The per capita income for the town was $20,000. About 8.3% of families and 10.2% of the population were below the poverty line, including 11.3% of those under age 18 and 8.3% of those age 65 or over.
Common Questions
What is Per Capita Income in Rickardsville?
Per Capita income in Rickardsville is $33,998.
What is the Median Family Income in Rickardsville?
Median Family Income in Rickardsville is $104,464.
What is the Median Household income in Rickardsville?
Median Household Income in Rickardsville is $94,375.
What is Income or Wage Gap in Rickardsville?
Income or Wage Gap in Rickardsville is 11.3%.
Women in Rickardsville earn 88.7 cents for every dollar earned by a man.
What is Inequality or Gini Index in Rickardsville?
Inequality or Gini Index in Rickardsville is 0.28.
What is the Total Population of Rickardsville?
Total Population of Rickardsville is 258.
What is the Total Male Population of Rickardsville?
Total Male Population of Rickardsville is 136.
What is the Total Female Population of Rickardsville?
Total Female Population of Rickardsville is 122.
What is the Ratio of Males per 100 Females in Rickardsville?
There are 111.48 Males per 100 Females in Rickardsville.
What is the Ratio of Females per 100 Males in Rickardsville?
There are 89.71 Females per 100 Males in Rickardsville.
What is the Median Population Age in Rickardsville?
Median Population Age in Rickardsville is 33.9 Years.
What is the Average Family Size in Rickardsville
Average Family Size in Rickardsville is 3.4 People.
What is the Average Household Size in Rickardsville
Average Household Size in Rickardsville is 2.9 People.
How Large is the Labor Force in Rickardsville?
There are 125 People in the Labor Forcein in Rickardsville.
What is the Percentage of People in the Labor Force in Rickardsville?
71.4% of People are in the Labor Force in Rickardsville.
What is the Unemployment Rate in Rickardsville?
Unemployment Rate in Rickardsville is 0.8%.