Davenport, IA Map & Demographics
Davenport Map
Davenport Overview
$34,702
PER CAPITA INCOME
$79,367
AVG FAMILY INCOME
$59,890
AVG HOUSEHOLD INCOME
28.8%
WAGE / INCOME GAP [ % ]
71.2¢/ $1
WAGE / INCOME GAP [ $ ]
$11,857
FAMILY INCOME DEFICIT
0.45
INEQUALITY / GINI INDEX
101,448
TOTAL POPULATION
50,222
MALE POPULATION
51,226
FEMALE POPULATION
98.04
MALES / 100 FEMALES
102.00
FEMALES / 100 MALES
37.4
MEDIAN AGE
3.0
AVG FAMILY SIZE
2.3
AVG HOUSEHOLD SIZE
53,634
LABOR FORCE [ PEOPLE ]
65.3%
PERCENT IN LABOR FORCE
5.0%
UNEMPLOYMENT RATE
Davenport Area Codes
Income in Davenport
Income Overview in Davenport
Per Capita Income in Davenport is $34,702, while median incomes of families and households are $79,367 and $59,890 respectively.
| Characteristic | Number | Measure |
| Per Capita Income | 101,448 | $34,702 |
| Median Family Income | 24,104 | $79,367 |
| Mean Family Income | 24,104 | $97,344 |
| Median Household Income | 42,667 | $59,890 |
| Mean Household Income | 42,667 | $80,641 |
| Income Deficit | 24,104 | $11,857 |
| Wage / Income Gap (%) | 101,448 | 28.79% |
| Wage / Income Gap ($) | 101,448 | 71.21¢ per $1 |
| Gini / Inequality Index | 101,448 | 0.45 |
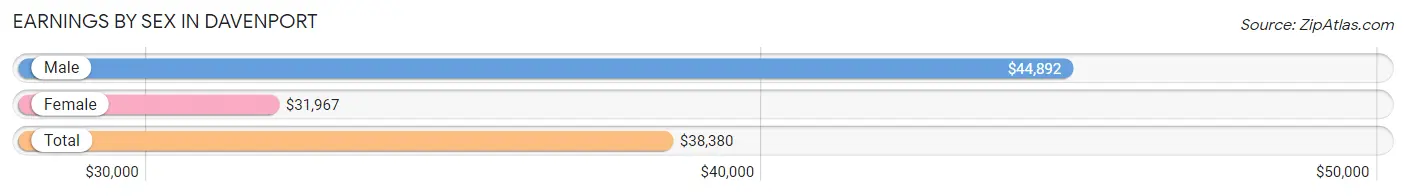
Earnings by Sex in Davenport
Average Earnings in Davenport are $38,380, $44,892 for men and $31,967 for women, a difference of 28.8%.
| Sex | Number | Average Earnings |
| Male | 28,808 (51.6%) | $44,892 |
| Female | 26,982 (48.4%) | $31,967 |
| Total | 55,790 (100.0%) | $38,380 |
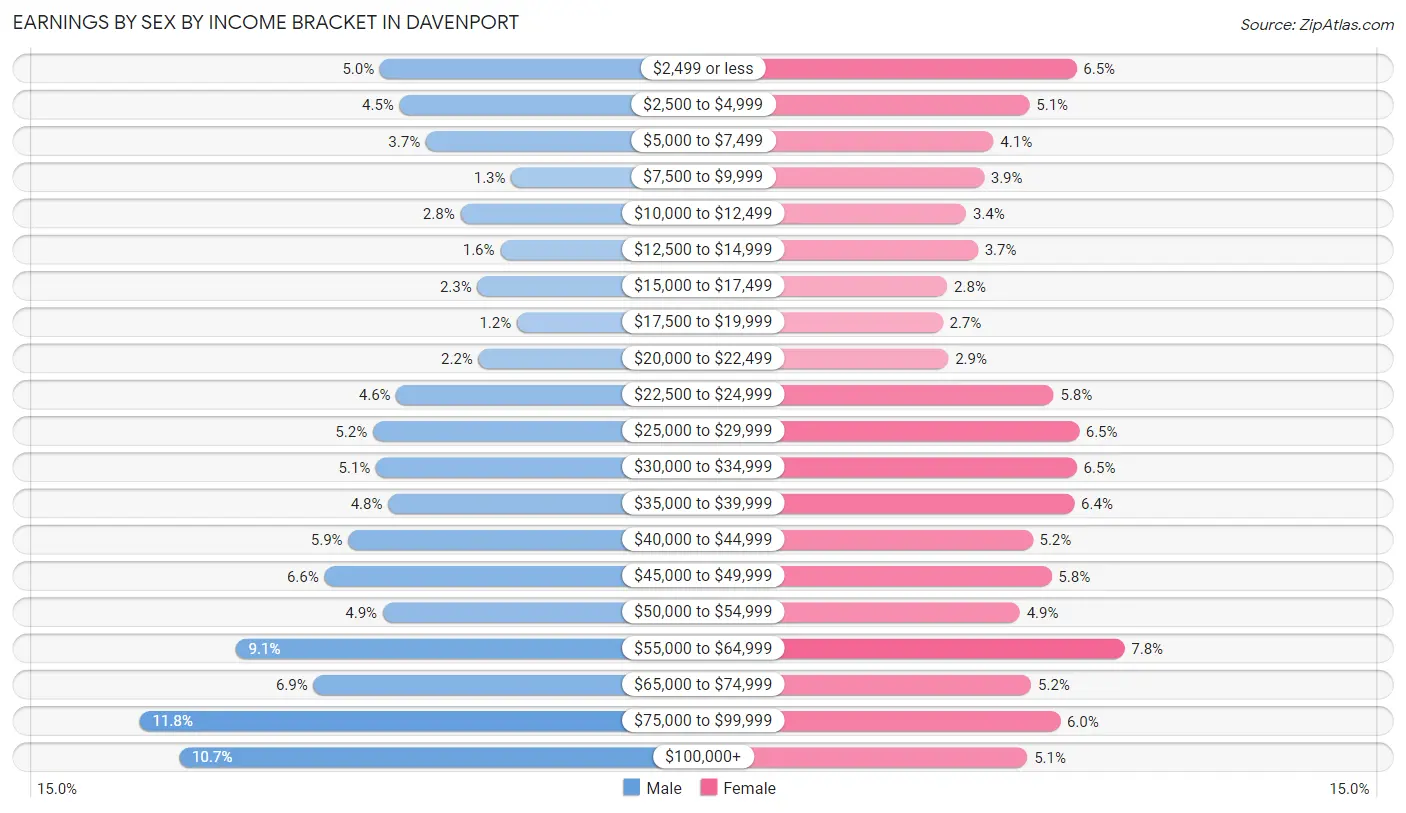
Earnings by Sex by Income Bracket in Davenport
The most common earnings brackets in Davenport are $75,000 to $99,999 for men (3,390 | 11.8%) and $55,000 to $64,999 for women (2,104 | 7.8%).
| Income | Male | Female |
| $2,499 or less | 1,443 (5.0%) | 1,739 (6.5%) |
| $2,500 to $4,999 | 1,284 (4.5%) | 1,385 (5.1%) |
| $5,000 to $7,499 | 1,072 (3.7%) | 1,113 (4.1%) |
| $7,500 to $9,999 | 381 (1.3%) | 1,038 (3.8%) |
| $10,000 to $12,499 | 791 (2.8%) | 905 (3.4%) |
| $12,500 to $14,999 | 471 (1.6%) | 994 (3.7%) |
| $15,000 to $17,499 | 653 (2.3%) | 762 (2.8%) |
| $17,500 to $19,999 | 334 (1.2%) | 727 (2.7%) |
| $20,000 to $22,499 | 645 (2.2%) | 770 (2.9%) |
| $22,500 to $24,999 | 1,311 (4.5%) | 1,569 (5.8%) |
| $25,000 to $29,999 | 1,501 (5.2%) | 1,758 (6.5%) |
| $30,000 to $34,999 | 1,475 (5.1%) | 1,742 (6.5%) |
| $35,000 to $39,999 | 1,377 (4.8%) | 1,724 (6.4%) |
| $40,000 to $44,999 | 1,700 (5.9%) | 1,409 (5.2%) |
| $45,000 to $49,999 | 1,893 (6.6%) | 1,551 (5.8%) |
| $50,000 to $54,999 | 1,420 (4.9%) | 1,310 (4.9%) |
| $55,000 to $64,999 | 2,614 (9.1%) | 2,104 (7.8%) |
| $65,000 to $74,999 | 1,981 (6.9%) | 1,399 (5.2%) |
| $75,000 to $99,999 | 3,390 (11.8%) | 1,616 (6.0%) |
| $100,000+ | 3,072 (10.7%) | 1,367 (5.1%) |
| Total | 28,808 (100.0%) | 26,982 (100.0%) |
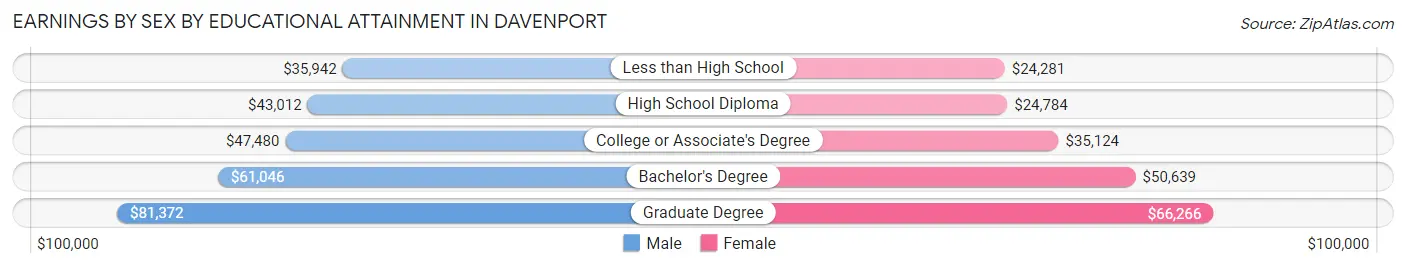
Earnings by Sex by Educational Attainment in Davenport
Average earnings in Davenport are $49,752 for men and $37,527 for women, a difference of 24.6%. Men with an educational attainment of graduate degree enjoy the highest average annual earnings of $81,372, while those with less than high school education earn the least with $35,942. Women with an educational attainment of graduate degree earn the most with the average annual earnings of $66,266, while those with less than high school education have the smallest earnings of $24,281.
| Educational Attainment | Male Income | Female Income |
| Less than High School | $35,942 | $24,281 |
| High School Diploma | $43,012 | $24,784 |
| College or Associate's Degree | $47,480 | $35,124 |
| Bachelor's Degree | $61,046 | $50,639 |
| Graduate Degree | $81,372 | $66,266 |
| Total | $49,752 | $37,527 |
Family Income in Davenport
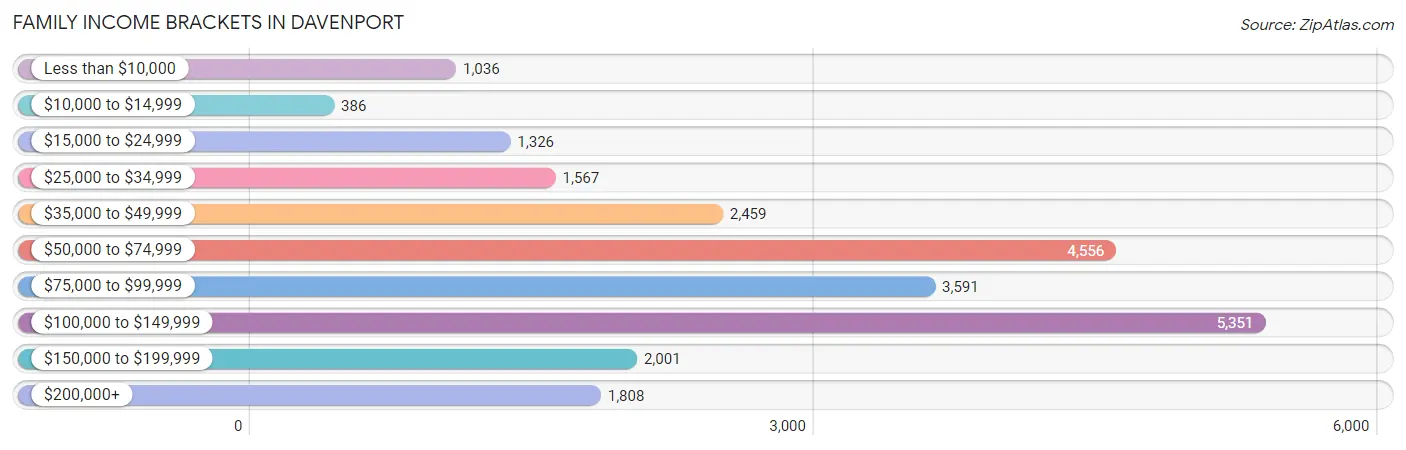
Family Income Brackets in Davenport
According to the Davenport family income data, there are 5,351 families falling into the $100,000 to $149,999 income range, which is the most common income bracket and makes up 22.2% of all families. Conversely, the $10,000 to $14,999 income bracket is the least frequent group with only 386 families (1.6%) belonging to this category.
| Income Bracket | # Families | % Families |
| Less than $10,000 | 1,036 | 4.3% |
| $10,000 to $14,999 | 386 | 1.6% |
| $15,000 to $24,999 | 1,326 | 5.5% |
| $25,000 to $34,999 | 1,567 | 6.5% |
| $35,000 to $49,999 | 2,459 | 10.2% |
| $50,000 to $74,999 | 4,556 | 18.9% |
| $75,000 to $99,999 | 3,591 | 14.9% |
| $100,000 to $149,999 | 5,351 | 22.2% |
| $150,000 to $199,999 | 2,001 | 8.3% |
| $200,000+ | 1,808 | 7.5% |
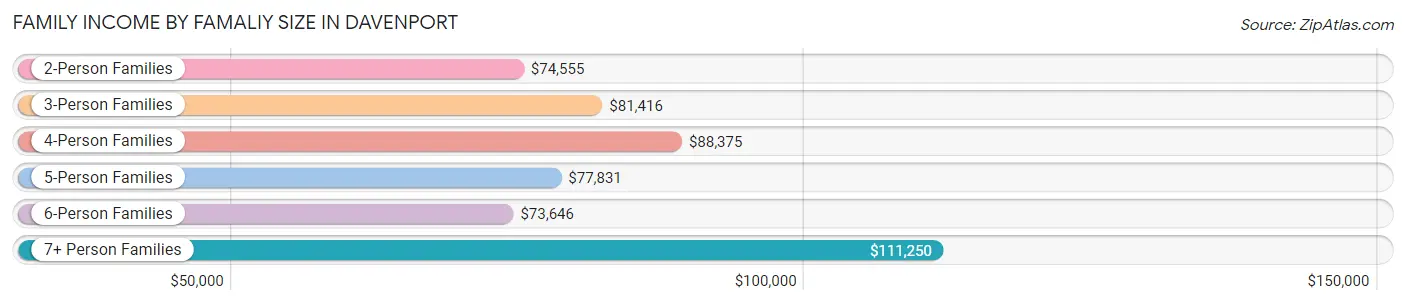
Family Income by Famaliy Size in Davenport
7+ person families (201 | 0.8%) account for the highest median family income in Davenport with $111,250 per family, while 2-person families (12,498 | 51.8%) have the highest median income of $37,278 per family member.
| Income Bracket | # Families | Median Income |
| 2-Person Families | 12,498 (51.8%) | $74,555 |
| 3-Person Families | 5,290 (22.0%) | $81,416 |
| 4-Person Families | 3,758 (15.6%) | $88,375 |
| 5-Person Families | 1,945 (8.1%) | $77,831 |
| 6-Person Families | 412 (1.7%) | $73,646 |
| 7+ Person Families | 201 (0.8%) | $111,250 |
| Total | 24,104 (100.0%) | $79,367 |
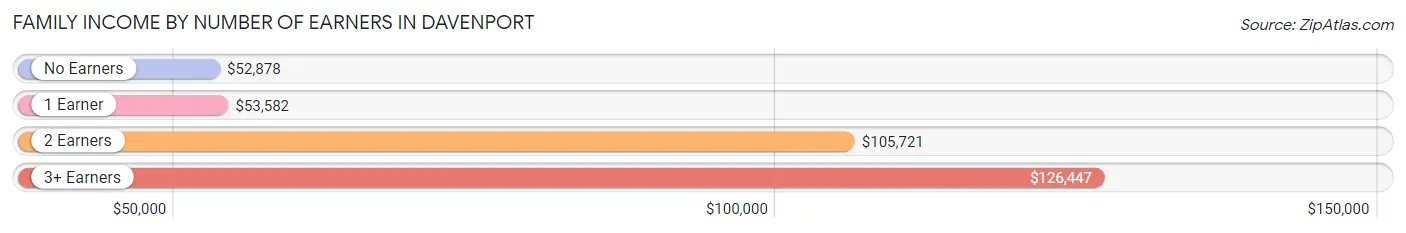
Family Income by Number of Earners in Davenport
The median family income in Davenport is $79,367, with families comprising 3+ earners (1,988) having the highest median family income of $126,447, while families with no earners (3,873) have the lowest median family income of $52,878, accounting for 8.3% and 16.1% of families, respectively.
| Number of Earners | # Families | Median Income |
| No Earners | 3,873 (16.1%) | $52,878 |
| 1 Earner | 7,761 (32.2%) | $53,582 |
| 2 Earners | 10,482 (43.5%) | $105,721 |
| 3+ Earners | 1,988 (8.3%) | $126,447 |
| Total | 24,104 (100.0%) | $79,367 |
Household Income in Davenport
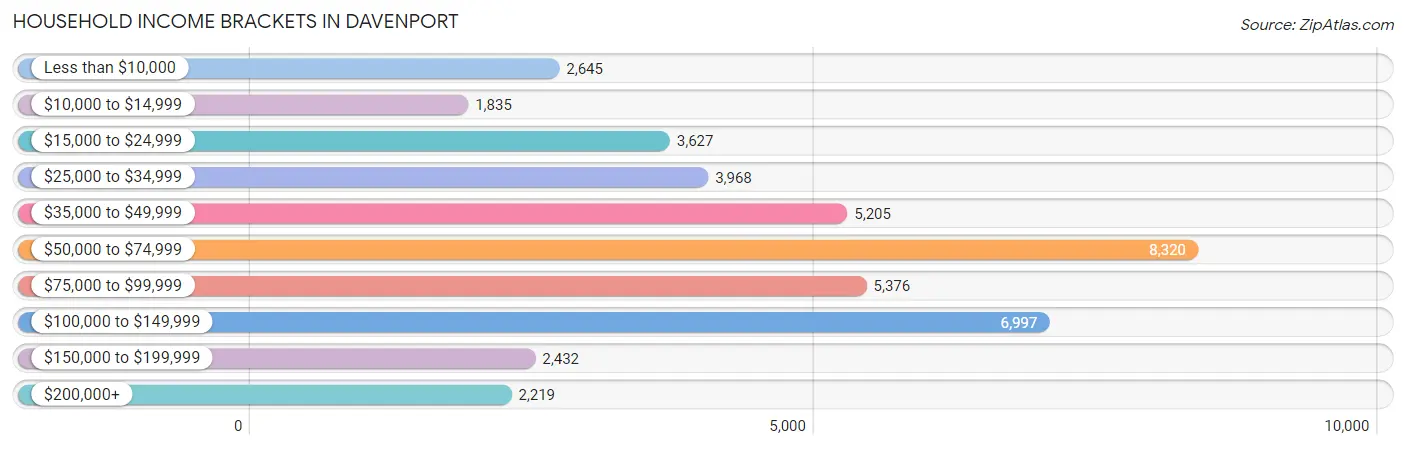
Household Income Brackets in Davenport
With 8,320 households falling in the category, the $50,000 to $74,999 income range is the most frequent in Davenport, accounting for 19.5% of all households. In contrast, only 1,835 households (4.3%) fall into the $10,000 to $14,999 income bracket, making it the least populous group.
| Income Bracket | # Households | % Households |
| Less than $10,000 | 2,645 | 6.2% |
| $10,000 to $14,999 | 1,835 | 4.3% |
| $15,000 to $24,999 | 3,627 | 8.5% |
| $25,000 to $34,999 | 3,968 | 9.3% |
| $35,000 to $49,999 | 5,205 | 12.2% |
| $50,000 to $74,999 | 8,320 | 19.5% |
| $75,000 to $99,999 | 5,376 | 12.6% |
| $100,000 to $149,999 | 6,997 | 16.4% |
| $150,000 to $199,999 | 2,432 | 5.7% |
| $200,000+ | 2,219 | 5.2% |
Household Income by Householder Age in Davenport
The median household income in Davenport is $59,890, with the highest median household income of $71,307 found in the 45 to 64 years age bracket for the primary householder. A total of 14,451 households (33.9%) fall into this category. Meanwhile, the 15 to 24 years age bracket for the primary householder has the lowest median household income of $30,667, with 2,682 households (6.3%) in this group.
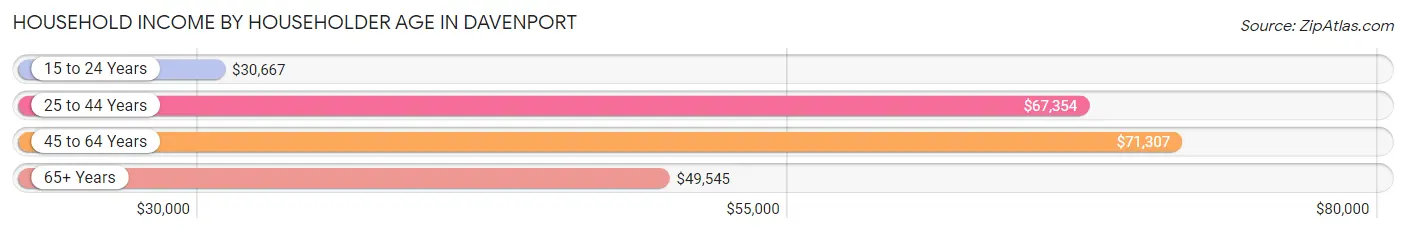
| Income Bracket | # Households | Median Income |
| 15 to 24 Years | 2,682 (6.3%) | $30,667 |
| 25 to 44 Years | 14,702 (34.5%) | $67,354 |
| 45 to 64 Years | 14,451 (33.9%) | $71,307 |
| 65+ Years | 10,832 (25.4%) | $49,545 |
| Total | 42,667 (100.0%) | $59,890 |
Poverty in Davenport
Income Below Poverty by Sex and Age in Davenport
With 14.2% poverty level for males and 17.4% for females among the residents of Davenport, 12 to 14 year old males and 18 to 24 year old females are the most vulnerable to poverty, with 507 males (30.2%) and 1,457 females (32.5%) in their respective age groups living below the poverty level.
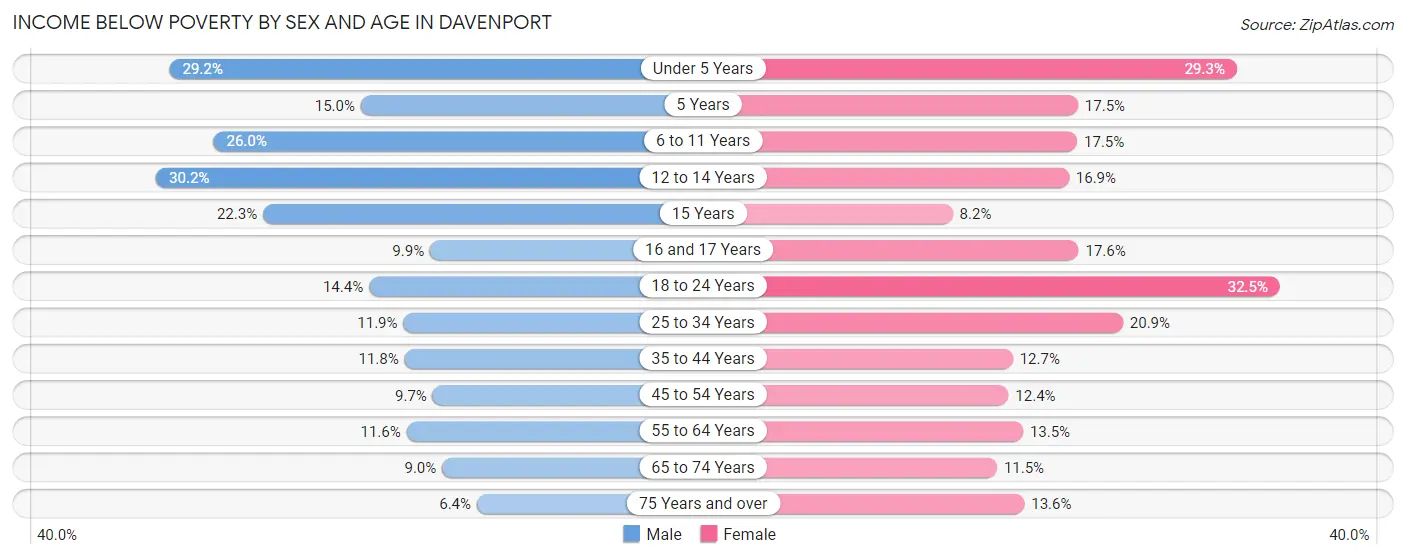
| Age Bracket | Male | Female |
| Under 5 Years | 911 (29.2%) | 940 (29.3%) |
| 5 Years | 74 (15.0%) | 95 (17.5%) |
| 6 to 11 Years | 930 (26.0%) | 555 (17.5%) |
| 12 to 14 Years | 507 (30.2%) | 316 (16.9%) |
| 15 Years | 161 (22.3%) | 45 (8.2%) |
| 16 and 17 Years | 113 (9.9%) | 211 (17.6%) |
| 18 to 24 Years | 669 (14.4%) | 1,457 (32.5%) |
| 25 to 34 Years | 866 (11.9%) | 1,564 (20.9%) |
| 35 to 44 Years | 802 (11.8%) | 792 (12.7%) |
| 45 to 54 Years | 574 (9.7%) | 671 (12.4%) |
| 55 to 64 Years | 719 (11.6%) | 932 (13.5%) |
| 65 to 74 Years | 421 (9.0%) | 578 (11.5%) |
| 75 Years and over | 155 (6.4%) | 495 (13.6%) |
| Total | 6,902 (14.2%) | 8,651 (17.4%) |
Income Above Poverty by Sex and Age in Davenport
According to the poverty statistics in Davenport, males aged 75 years and over and females aged 15 years are the age groups that are most secure financially, with 93.6% of males and 91.8% of females in these age groups living above the poverty line.
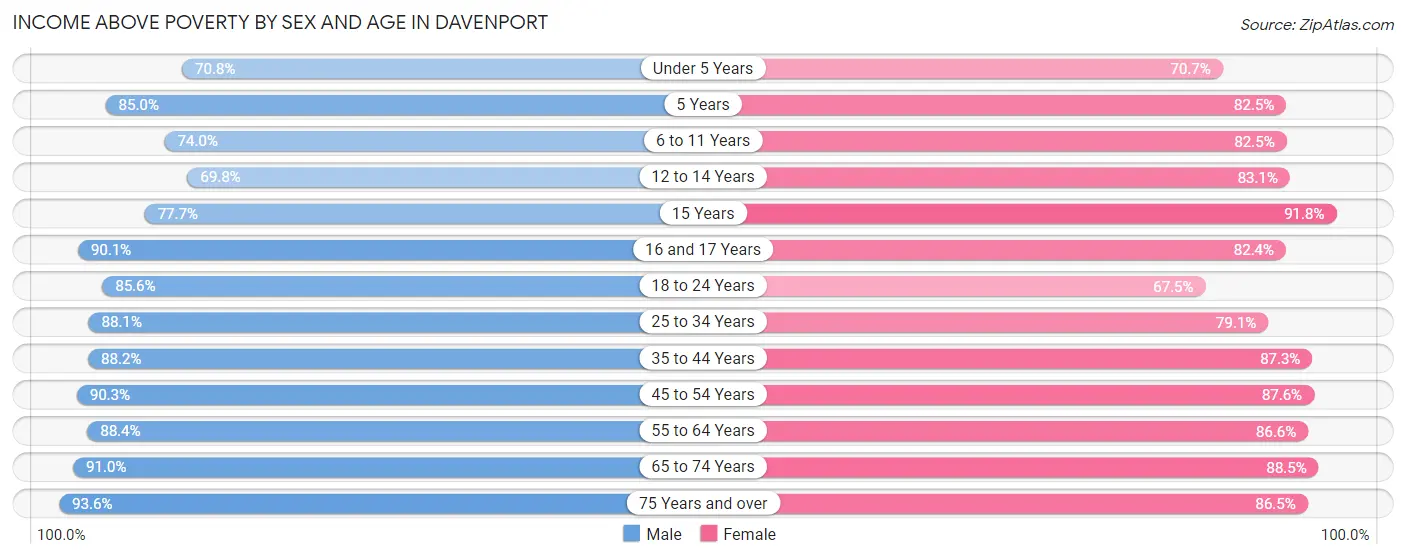
| Age Bracket | Male | Female |
| Under 5 Years | 2,205 (70.8%) | 2,266 (70.7%) |
| 5 Years | 418 (85.0%) | 447 (82.5%) |
| 6 to 11 Years | 2,651 (74.0%) | 2,622 (82.5%) |
| 12 to 14 Years | 1,170 (69.8%) | 1,558 (83.1%) |
| 15 Years | 561 (77.7%) | 502 (91.8%) |
| 16 and 17 Years | 1,028 (90.1%) | 989 (82.4%) |
| 18 to 24 Years | 3,968 (85.6%) | 3,024 (67.5%) |
| 25 to 34 Years | 6,422 (88.1%) | 5,929 (79.1%) |
| 35 to 44 Years | 5,998 (88.2%) | 5,451 (87.3%) |
| 45 to 54 Years | 5,341 (90.3%) | 4,755 (87.6%) |
| 55 to 64 Years | 5,459 (88.4%) | 5,995 (86.6%) |
| 65 to 74 Years | 4,259 (91.0%) | 4,438 (88.5%) |
| 75 Years and over | 2,260 (93.6%) | 3,159 (86.5%) |
| Total | 41,740 (85.8%) | 41,135 (82.6%) |
Income Below Poverty Among Married-Couple Families in Davenport
The poverty statistics for married-couple families in Davenport show that 4.2% or 713 of the total 16,973 families live below the poverty line. Families with 3 or 4 children have the highest poverty rate of 15.9%, comprising of 193 families. On the other hand, families with no children have the lowest poverty rate of 2.6%, which includes 280 families.
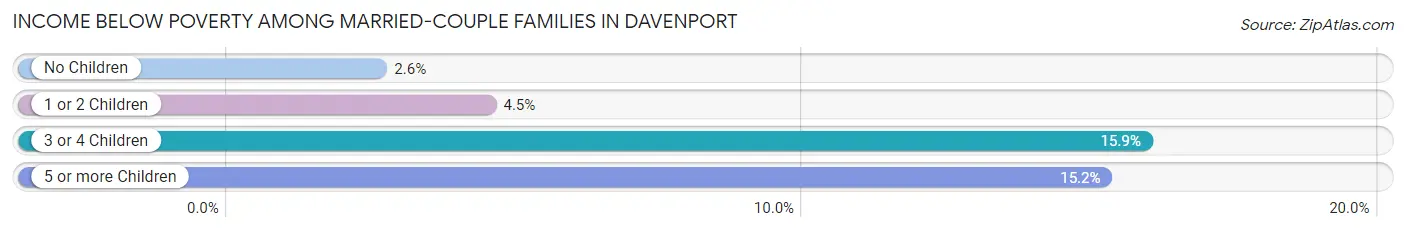
| Children | Above Poverty | Below Poverty |
| No Children | 10,473 (97.4%) | 280 (2.6%) |
| 1 or 2 Children | 4,651 (95.5%) | 219 (4.5%) |
| 3 or 4 Children | 1,019 (84.1%) | 193 (15.9%) |
| 5 or more Children | 117 (84.8%) | 21 (15.2%) |
| Total | 16,260 (95.8%) | 713 (4.2%) |
Income Below Poverty Among Single-Parent Households in Davenport
According to the poverty data in Davenport, 7.4% or 130 single-father households and 32.9% or 1,768 single-mother households are living below the poverty line. Among single-father households, those with 5 or more children have the highest poverty rate, with 22 households (100.0%) experiencing poverty. Likewise, among single-mother households, those with 3 or 4 children have the highest poverty rate, with 575 households (71.1%) falling below the poverty line.
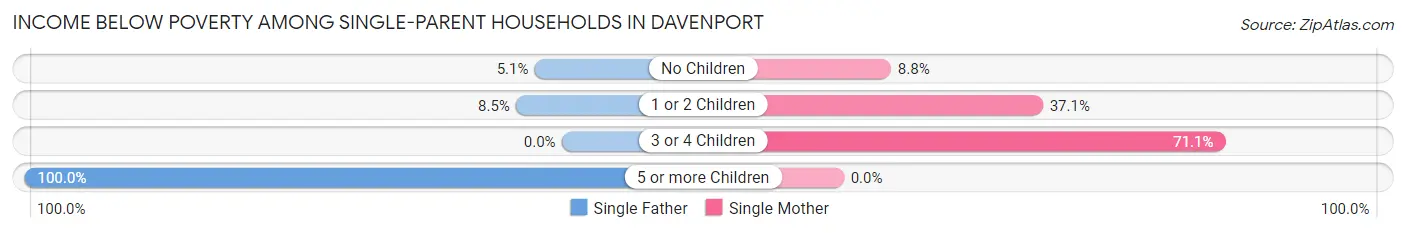
| Children | Single Father | Single Mother |
| No Children | 32 (5.1%) | 155 (8.8%) |
| 1 or 2 Children | 76 (8.5%) | 1,038 (37.1%) |
| 3 or 4 Children | 0 (0.0%) | 575 (71.1%) |
| 5 or more Children | 22 (100.0%) | 0 (0.0%) |
| Total | 130 (7.4%) | 1,768 (32.9%) |
Income Below Poverty Among Married-Couple vs Single-Parent Households in Davenport
The poverty data for Davenport shows that 713 of the married-couple family households (4.2%) and 1,898 of the single-parent households (26.6%) are living below the poverty level. Within the married-couple family households, those with 3 or 4 children have the highest poverty rate, with 193 households (15.9%) falling below the poverty line. Among the single-parent households, those with 5 or more children have the highest poverty rate, with 22 household (75.9%) living below poverty.
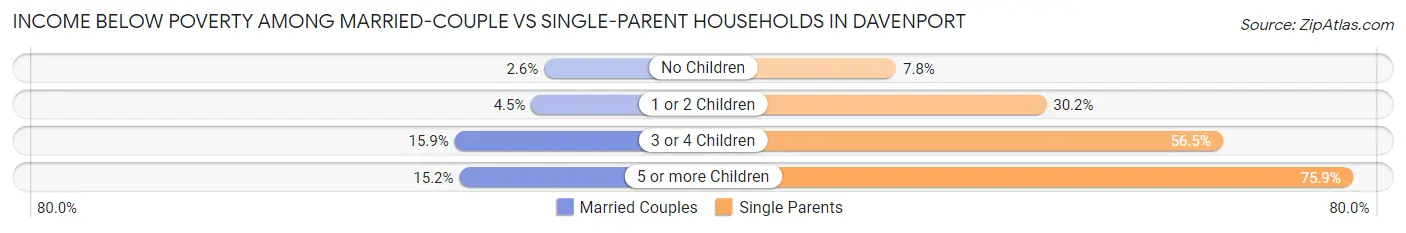
| Children | Married-Couple Families | Single-Parent Households |
| No Children | 280 (2.6%) | 187 (7.8%) |
| 1 or 2 Children | 219 (4.5%) | 1,114 (30.2%) |
| 3 or 4 Children | 193 (15.9%) | 575 (56.5%) |
| 5 or more Children | 21 (15.2%) | 22 (75.9%) |
| Total | 713 (4.2%) | 1,898 (26.6%) |
Race in Davenport
The most populous races in Davenport are White / Caucasian (78,343 | 77.2%), Black / African American (11,195 | 11.0%), and Hispanic or Latino (9,200 | 9.1%).
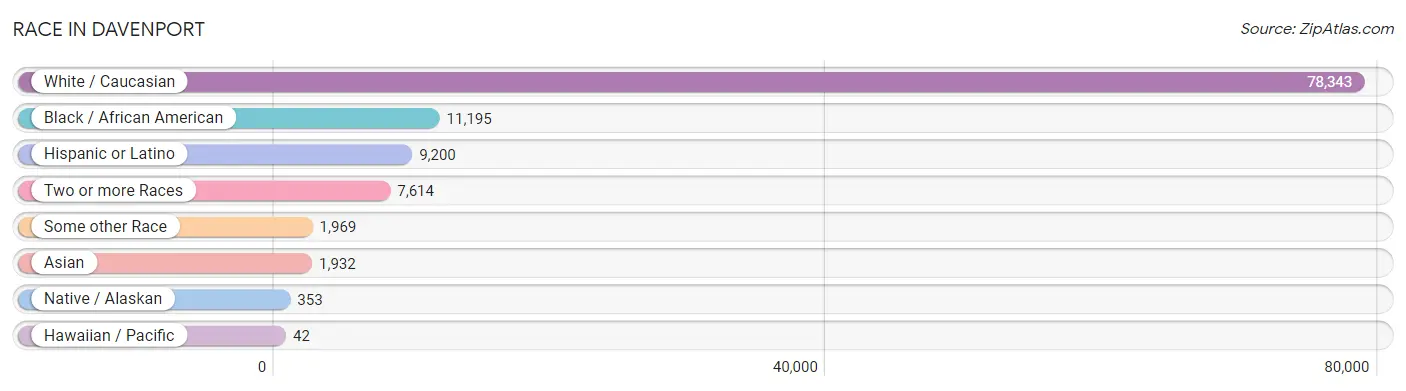
| Race | # Population | % Population |
| Asian | 1,932 | 1.9% |
| Black / African American | 11,195 | 11.0% |
| Hawaiian / Pacific | 42 | 0.0% |
| Hispanic or Latino | 9,200 | 9.1% |
| Native / Alaskan | 353 | 0.4% |
| White / Caucasian | 78,343 | 77.2% |
| Two or more Races | 7,614 | 7.5% |
| Some other Race | 1,969 | 1.9% |
| Total | 101,448 | 100.0% |
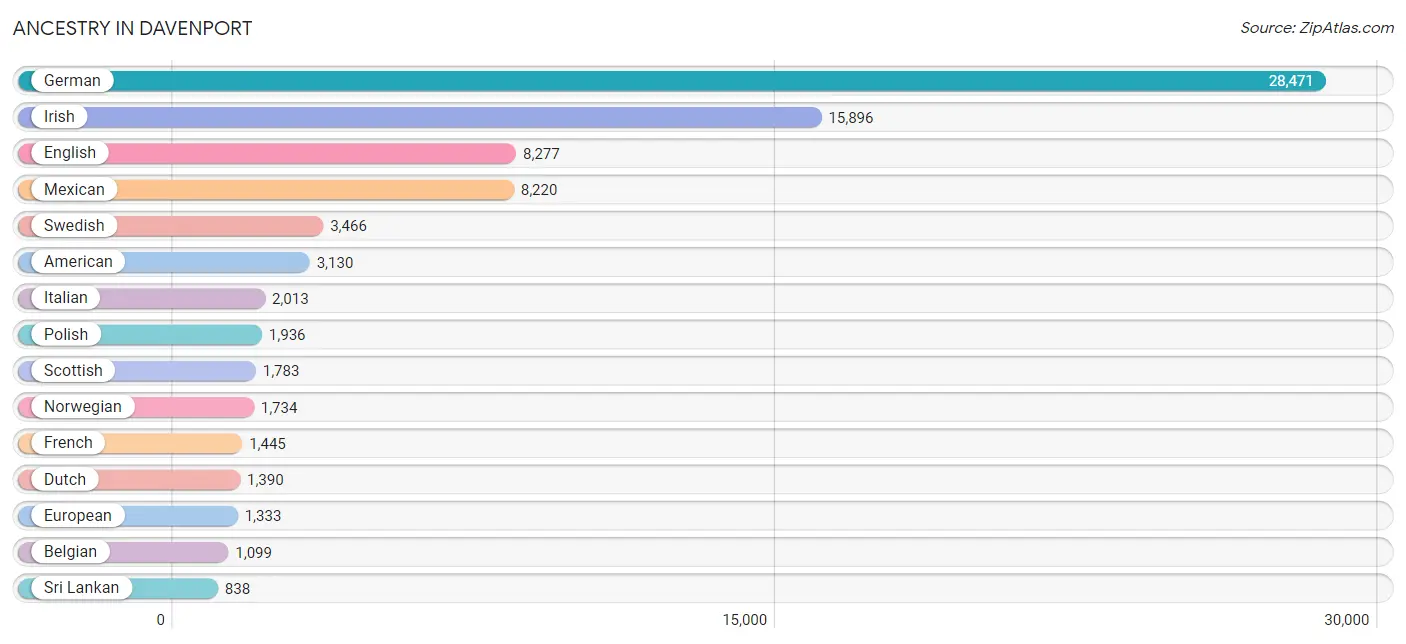
Ancestry in Davenport
The most populous ancestries reported in Davenport are German (28,471 | 28.1%), Irish (15,896 | 15.7%), English (8,277 | 8.2%), Mexican (8,220 | 8.1%), and Swedish (3,466 | 3.4%), together accounting for 63.4% of all Davenport residents.
| Ancestry | # Population | % Population |
| Afghan | 12 | 0.0% |
| African | 461 | 0.4% |
| Alaskan Athabascan | 15 | 0.0% |
| American | 3,130 | 3.1% |
| Apache | 23 | 0.0% |
| Arab | 188 | 0.2% |
| Armenian | 14 | 0.0% |
| Austrian | 219 | 0.2% |
| Belgian | 1,099 | 1.1% |
| Bhutanese | 200 | 0.2% |
| Blackfeet | 27 | 0.0% |
| Brazilian | 14 | 0.0% |
| British | 532 | 0.5% |
| Bulgarian | 13 | 0.0% |
| Burmese | 422 | 0.4% |
| Canadian | 89 | 0.1% |
| Central American | 261 | 0.3% |
| Cherokee | 144 | 0.1% |
| Cheyenne | 7 | 0.0% |
| Chilean | 41 | 0.0% |
| Chippewa | 20 | 0.0% |
| Choctaw | 12 | 0.0% |
| Colombian | 10 | 0.0% |
| Costa Rican | 14 | 0.0% |
| Croatian | 150 | 0.2% |
| Crow | 7 | 0.0% |
| Cuban | 57 | 0.1% |
| Czech | 802 | 0.8% |
| Czechoslovakian | 107 | 0.1% |
| Danish | 791 | 0.8% |
| Dominican | 17 | 0.0% |
| Dutch | 1,390 | 1.4% |
| Eastern European | 125 | 0.1% |
| Egyptian | 34 | 0.0% |
| English | 8,277 | 8.2% |
| European | 1,333 | 1.3% |
| Filipino | 8 | 0.0% |
| Finnish | 70 | 0.1% |
| French | 1,445 | 1.4% |
| French Canadian | 237 | 0.2% |
| German | 28,471 | 28.1% |
| German Russian | 9 | 0.0% |
| Greek | 560 | 0.5% |
| Guamanian / Chamorro | 38 | 0.0% |
| Guatemalan | 13 | 0.0% |
| Haitian | 350 | 0.4% |
| Honduran | 105 | 0.1% |
| Hopi | 17 | 0.0% |
| Hungarian | 137 | 0.1% |
| Indian (Asian) | 275 | 0.3% |
| Indonesian | 20 | 0.0% |
| Inupiat | 17 | 0.0% |
| Iranian | 43 | 0.0% |
| Irish | 15,896 | 15.7% |
| Israeli | 28 | 0.0% |
| Italian | 2,013 | 2.0% |
| Jamaican | 61 | 0.1% |
| Japanese | 14 | 0.0% |
| Kenyan | 23 | 0.0% |
| Kiowa | 1 | 0.0% |
| Korean | 325 | 0.3% |
| Laotian | 50 | 0.1% |
| Latvian | 56 | 0.1% |
| Lebanese | 46 | 0.1% |
| Lithuanian | 25 | 0.0% |
| Lumbee | 2 | 0.0% |
| Luxembourger | 48 | 0.1% |
| Malaysian | 14 | 0.0% |
| Mexican | 8,220 | 8.1% |
| Mexican American Indian | 10 | 0.0% |
| Native Hawaiian | 89 | 0.1% |
| Navajo | 62 | 0.1% |
| Nigerian | 11 | 0.0% |
| Northern European | 99 | 0.1% |
| Norwegian | 1,734 | 1.7% |
| Pakistani | 72 | 0.1% |
| Pennsylvania German | 59 | 0.1% |
| Pima | 1 | 0.0% |
| Polish | 1,936 | 1.9% |
| Portuguese | 68 | 0.1% |
| Puerto Rican | 368 | 0.4% |
| Romanian | 22 | 0.0% |
| Russian | 168 | 0.2% |
| Salvadoran | 129 | 0.1% |
| Samoan | 35 | 0.0% |
| Scandinavian | 418 | 0.4% |
| Scotch-Irish | 487 | 0.5% |
| Scottish | 1,783 | 1.8% |
| Serbian | 24 | 0.0% |
| Sioux | 82 | 0.1% |
| Slavic | 43 | 0.0% |
| Slovak | 32 | 0.0% |
| South African | 10 | 0.0% |
| South American | 94 | 0.1% |
| Spaniard | 20 | 0.0% |
| Spanish | 68 | 0.1% |
| Sri Lankan | 838 | 0.8% |
| Subsaharan African | 564 | 0.6% |
| Swedish | 3,466 | 3.4% |
| Swiss | 317 | 0.3% |
| Thai | 157 | 0.2% |
| Turkish | 7 | 0.0% |
| Ukrainian | 127 | 0.1% |
| Welsh | 523 | 0.5% |
| Yaqui | 15 | 0.0% |
| Yugoslavian | 200 | 0.2% | View All 106 Rows |
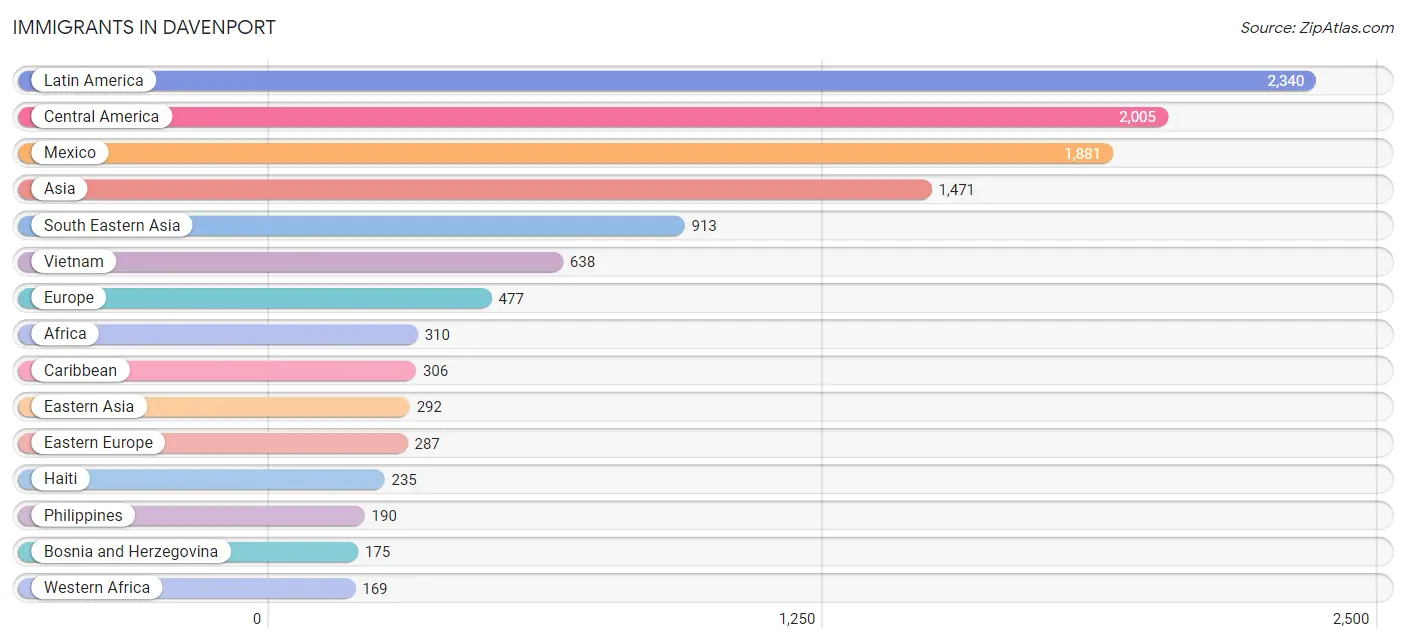
Immigrants in Davenport
The most numerous immigrant groups reported in Davenport came from Latin America (2,340 | 2.3%), Central America (2,005 | 2.0%), Mexico (1,881 | 1.8%), Asia (1,471 | 1.5%), and South Eastern Asia (913 | 0.9%), together accounting for 8.5% of all Davenport residents.
| Immigration Origin | # Population | % Population |
| Africa | 310 | 0.3% |
| Asia | 1,471 | 1.5% |
| Bosnia and Herzegovina | 175 | 0.2% |
| Bulgaria | 13 | 0.0% |
| Canada | 121 | 0.1% |
| Caribbean | 306 | 0.3% |
| Central America | 2,005 | 2.0% |
| Chile | 19 | 0.0% |
| China | 101 | 0.1% |
| Colombia | 10 | 0.0% |
| Cuba | 10 | 0.0% |
| Eastern Africa | 53 | 0.1% |
| Eastern Asia | 292 | 0.3% |
| Eastern Europe | 287 | 0.3% |
| Egypt | 23 | 0.0% |
| El Salvador | 93 | 0.1% |
| England | 13 | 0.0% |
| Europe | 477 | 0.5% |
| Germany | 69 | 0.1% |
| Guatemala | 13 | 0.0% |
| Haiti | 235 | 0.2% |
| Honduras | 18 | 0.0% |
| Hong Kong | 23 | 0.0% |
| Hungary | 12 | 0.0% |
| India | 4 | 0.0% |
| Indonesia | 14 | 0.0% |
| Iran | 13 | 0.0% |
| Iraq | 59 | 0.1% |
| Ireland | 20 | 0.0% |
| Israel | 16 | 0.0% |
| Jamaica | 12 | 0.0% |
| Japan | 60 | 0.1% |
| Kenya | 31 | 0.0% |
| Korea | 131 | 0.1% |
| Latin America | 2,340 | 2.3% |
| Latvia | 17 | 0.0% |
| Lebanon | 15 | 0.0% |
| Mexico | 1,881 | 1.8% |
| Nepal | 107 | 0.1% |
| Nigeria | 12 | 0.0% |
| Northern Africa | 23 | 0.0% |
| Northern Europe | 97 | 0.1% |
| Norway | 30 | 0.0% |
| Oceania | 13 | 0.0% |
| Pakistan | 40 | 0.0% |
| Philippines | 190 | 0.2% |
| Poland | 45 | 0.0% |
| Portugal | 24 | 0.0% |
| Romania | 2 | 0.0% |
| Russia | 13 | 0.0% |
| Saudi Arabia | 5 | 0.0% |
| Scotland | 21 | 0.0% |
| South Africa | 13 | 0.0% |
| South America | 29 | 0.0% |
| South Central Asia | 164 | 0.2% |
| South Eastern Asia | 913 | 0.9% |
| Southern Europe | 24 | 0.0% |
| Taiwan | 8 | 0.0% |
| Thailand | 57 | 0.1% |
| Turkey | 7 | 0.0% |
| Ukraine | 10 | 0.0% |
| Vietnam | 638 | 0.6% |
| Western Africa | 169 | 0.2% |
| Western Asia | 102 | 0.1% |
| Western Europe | 69 | 0.1% |
| Zimbabwe | 6 | 0.0% | View All 66 Rows |
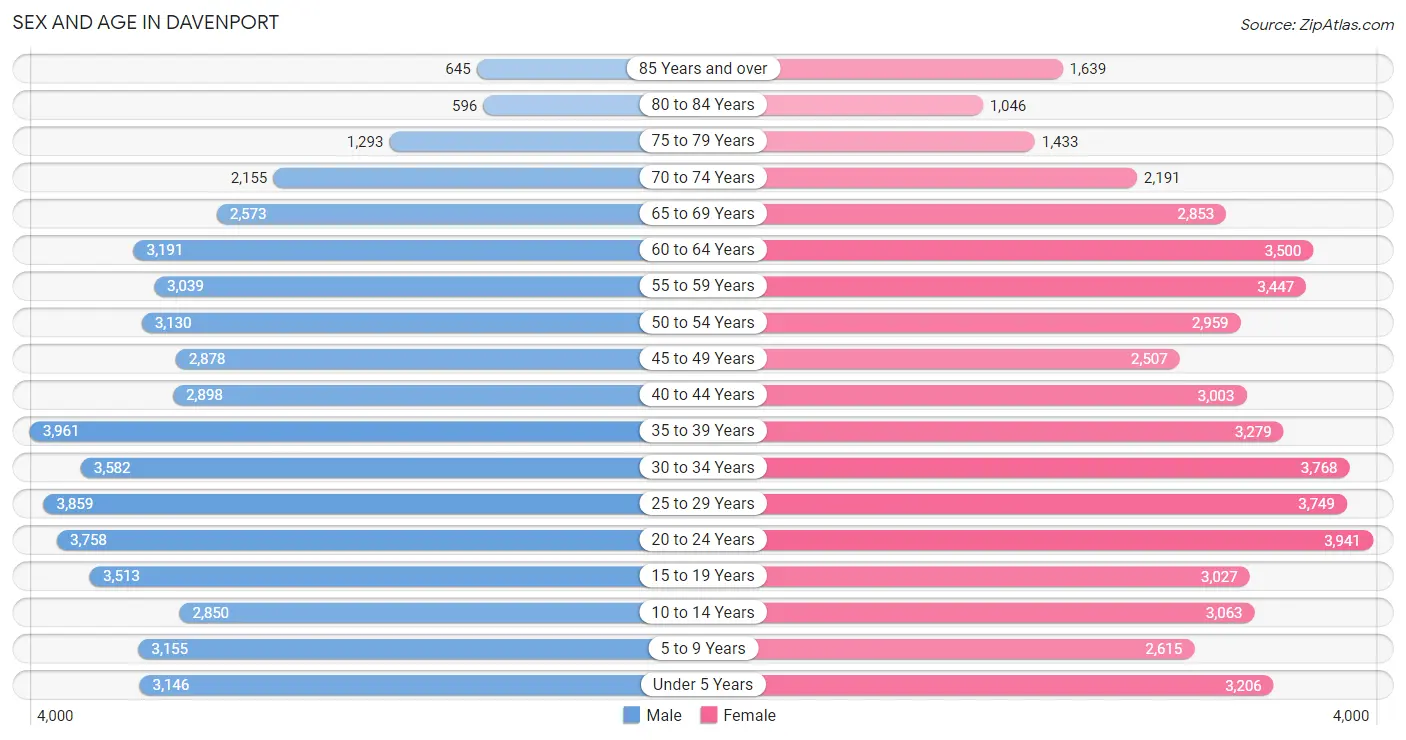
Sex and Age in Davenport
Sex and Age in Davenport
The most populous age groups in Davenport are 35 to 39 Years (3,961 | 7.9%) for men and 20 to 24 Years (3,941 | 7.7%) for women.
| Age Bracket | Male | Female |
| Under 5 Years | 3,146 (6.3%) | 3,206 (6.3%) |
| 5 to 9 Years | 3,155 (6.3%) | 2,615 (5.1%) |
| 10 to 14 Years | 2,850 (5.7%) | 3,063 (6.0%) |
| 15 to 19 Years | 3,513 (7.0%) | 3,027 (5.9%) |
| 20 to 24 Years | 3,758 (7.5%) | 3,941 (7.7%) |
| 25 to 29 Years | 3,859 (7.7%) | 3,749 (7.3%) |
| 30 to 34 Years | 3,582 (7.1%) | 3,768 (7.4%) |
| 35 to 39 Years | 3,961 (7.9%) | 3,279 (6.4%) |
| 40 to 44 Years | 2,898 (5.8%) | 3,003 (5.9%) |
| 45 to 49 Years | 2,878 (5.7%) | 2,507 (4.9%) |
| 50 to 54 Years | 3,130 (6.2%) | 2,959 (5.8%) |
| 55 to 59 Years | 3,039 (6.0%) | 3,447 (6.7%) |
| 60 to 64 Years | 3,191 (6.4%) | 3,500 (6.8%) |
| 65 to 69 Years | 2,573 (5.1%) | 2,853 (5.6%) |
| 70 to 74 Years | 2,155 (4.3%) | 2,191 (4.3%) |
| 75 to 79 Years | 1,293 (2.6%) | 1,433 (2.8%) |
| 80 to 84 Years | 596 (1.2%) | 1,046 (2.0%) |
| 85 Years and over | 645 (1.3%) | 1,639 (3.2%) |
| Total | 50,222 (100.0%) | 51,226 (100.0%) |
Families and Households in Davenport
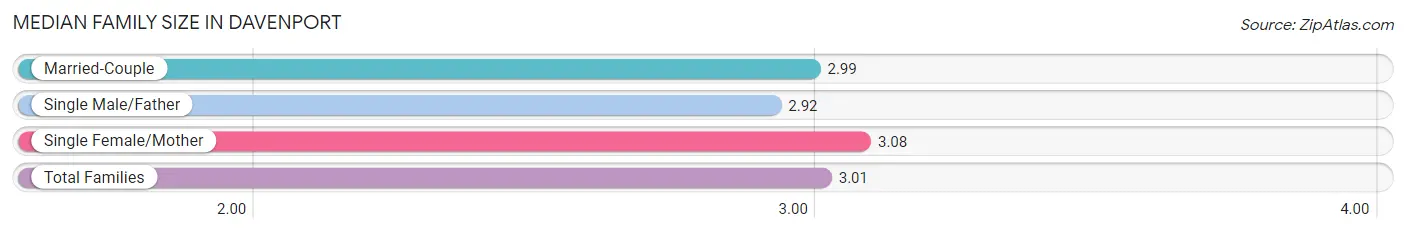
Median Family Size in Davenport
The median family size in Davenport is 3.01 persons per family, with single female/mother families (5,376 | 22.3%) accounting for the largest median family size of 3.08 persons per family. On the other hand, single male/father families (1,755 | 7.3%) represent the smallest median family size with 2.92 persons per family.
| Family Type | # Families | Family Size |
| Married-Couple | 16,973 (70.4%) | 2.99 |
| Single Male/Father | 1,755 (7.3%) | 2.92 |
| Single Female/Mother | 5,376 (22.3%) | 3.08 |
| Total Families | 24,104 (100.0%) | 3.01 |
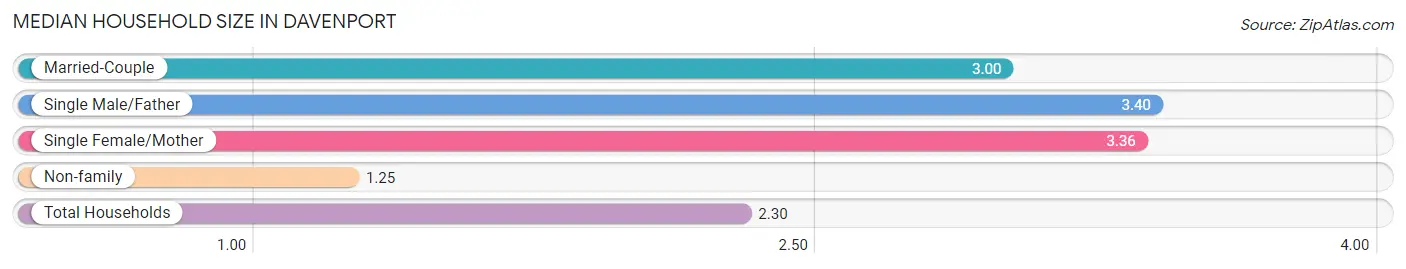
Median Household Size in Davenport
The median household size in Davenport is 2.30 persons per household, with single male/father households (1,755 | 4.1%) accounting for the largest median household size of 3.4 persons per household. non-family households (18,563 | 43.5%) represent the smallest median household size with 1.25 persons per household.
| Household Type | # Households | Household Size |
| Married-Couple | 16,973 (39.8%) | 3.00 |
| Single Male/Father | 1,755 (4.1%) | 3.40 |
| Single Female/Mother | 5,376 (12.6%) | 3.36 |
| Non-family | 18,563 (43.5%) | 1.25 |
| Total Households | 42,667 (100.0%) | 2.30 |
Household Size by Marriage Status in Davenport
Out of a total of 42,667 households in Davenport, 24,104 (56.5%) are family households, while 18,563 (43.5%) are nonfamily households. The most numerous type of family households are 2-person households, comprising 11,777, and the most common type of nonfamily households are 1-person households, comprising 14,803.
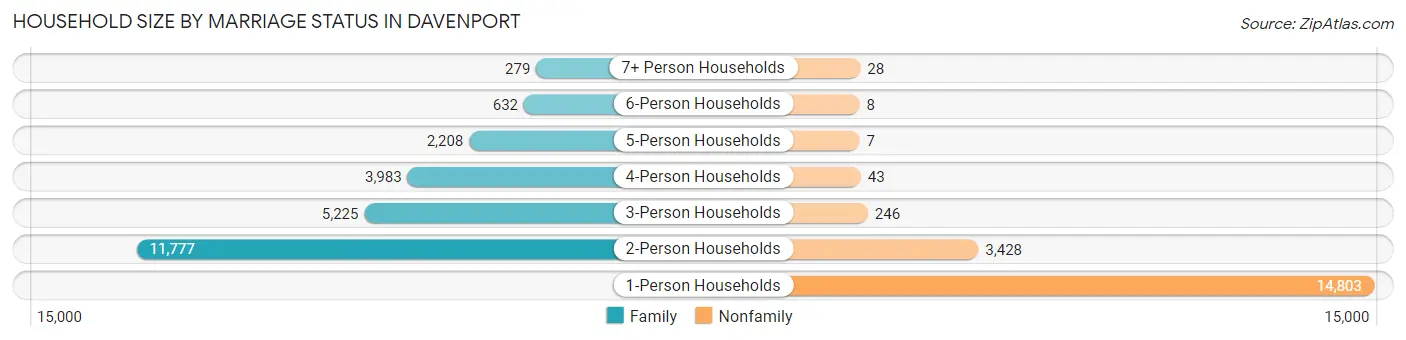
| Household Size | Family Households | Nonfamily Households |
| 1-Person Households | - | 14,803 (34.7%) |
| 2-Person Households | 11,777 (27.6%) | 3,428 (8.0%) |
| 3-Person Households | 5,225 (12.2%) | 246 (0.6%) |
| 4-Person Households | 3,983 (9.3%) | 43 (0.1%) |
| 5-Person Households | 2,208 (5.2%) | 7 (0.0%) |
| 6-Person Households | 632 (1.5%) | 8 (0.0%) |
| 7+ Person Households | 279 (0.6%) | 28 (0.1%) |
| Total | 24,104 (56.5%) | 18,563 (43.5%) |
Female Fertility in Davenport
Fertility by Age in Davenport
Average fertility rate in Davenport is 52.0 births per 1,000 women. Women in the age bracket of 20 to 34 years have the highest fertility rate with 89.0 births per 1,000 women. Women in the age bracket of 20 to 34 years acount for 83.2% of all women with births.
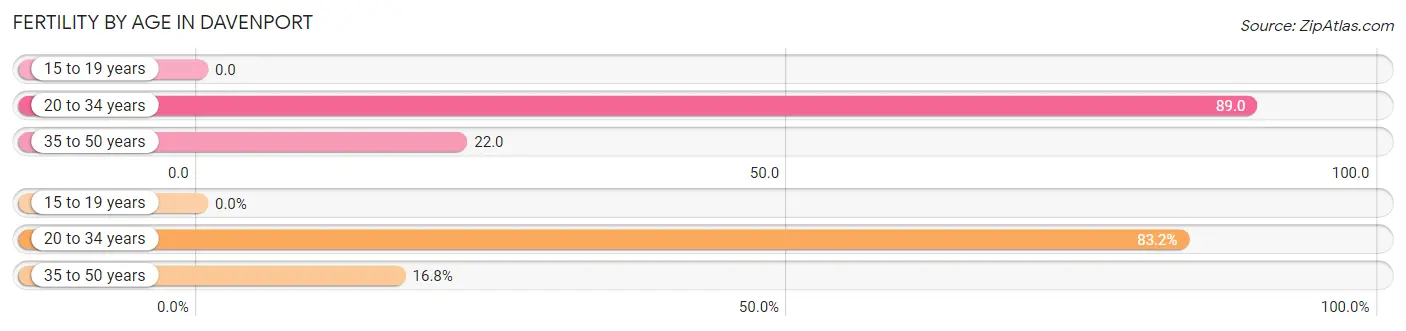
| Age Bracket | Women with Births | Births / 1,000 Women |
| 15 to 19 years | 0 (0.0%) | 0.0 |
| 20 to 34 years | 1,023 (83.2%) | 89.0 |
| 35 to 50 years | 206 (16.8%) | 22.0 |
| Total | 1,229 (100.0%) | 52.0 |
Fertility by Age by Marriage Status in Davenport
54.9% of women with births (1,229) in Davenport are married. The highest percentage of unmarried women with births falls into 20 to 34 years age bracket with 49.2% of them unmarried at the time of birth, while the lowest percentage of unmarried women with births belong to 35 to 50 years age bracket with 24.8% of them unmarried.
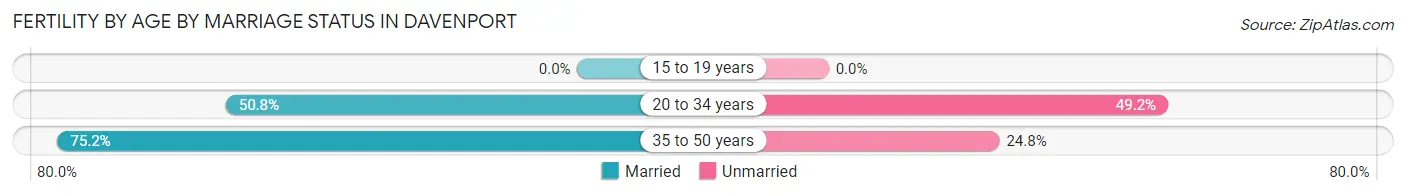
| Age Bracket | Married | Unmarried |
| 15 to 19 years | 0 (0.0%) | 0 (0.0%) |
| 20 to 34 years | 520 (50.8%) | 503 (49.2%) |
| 35 to 50 years | 155 (75.2%) | 51 (24.8%) |
| Total | 675 (54.9%) | 554 (45.1%) |
Fertility by Education in Davenport
Average fertility rate in Davenport is 52.0 births per 1,000 women. Women with the education attainment of graduate degree have the highest fertility rate of 123.0 births per 1,000 women, while women with the education attainment of less than high school have the lowest fertility at 32.0 births per 1,000 women. Women with the education attainment of college or associate's degree represent 35.7% of all women with births.
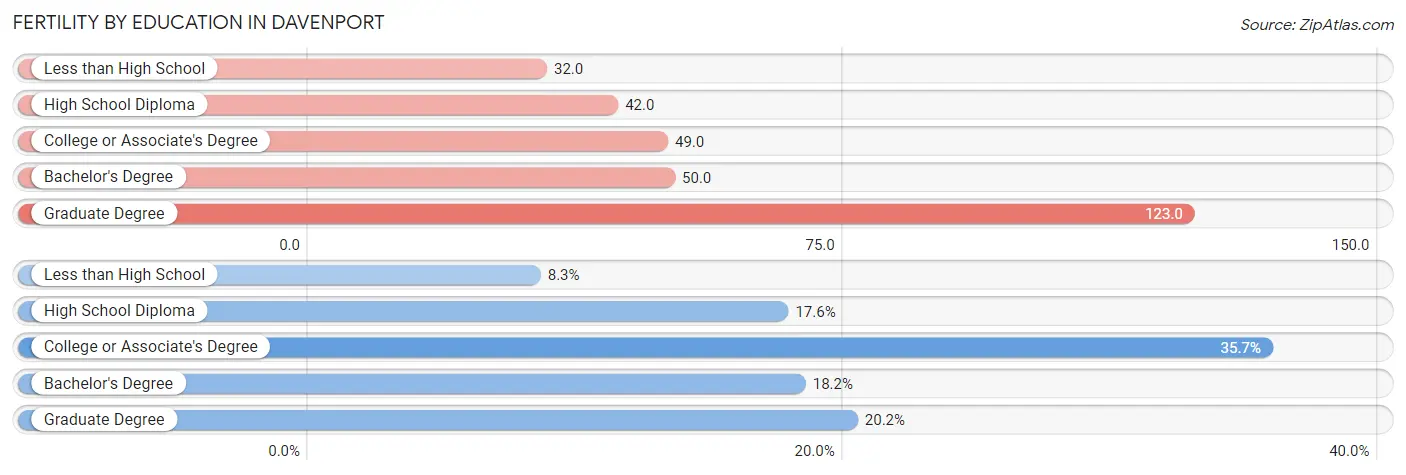
| Educational Attainment | Women with Births | Births / 1,000 Women |
| Less than High School | 102 (8.3%) | 32.0 |
| High School Diploma | 216 (17.6%) | 42.0 |
| College or Associate's Degree | 439 (35.7%) | 49.0 |
| Bachelor's Degree | 224 (18.2%) | 50.0 |
| Graduate Degree | 248 (20.2%) | 123.0 |
| Total | 1,229 (100.0%) | 52.0 |
Fertility by Education by Marriage Status in Davenport
45.1% of women with births in Davenport are unmarried. Women with the educational attainment of bachelor's degree are most likely to be married with 85.7% of them married at childbirth, while women with the educational attainment of high school diploma are least likely to be married with 81.9% of them unmarried at childbirth.
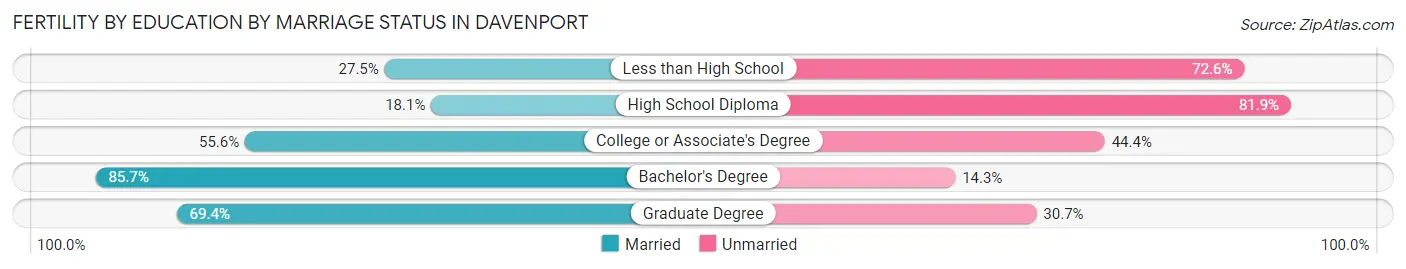
| Educational Attainment | Married | Unmarried |
| Less than High School | 28 (27.5%) | 74 (72.6%) |
| High School Diploma | 39 (18.1%) | 177 (81.9%) |
| College or Associate's Degree | 244 (55.6%) | 195 (44.4%) |
| Bachelor's Degree | 192 (85.7%) | 32 (14.3%) |
| Graduate Degree | 172 (69.4%) | 76 (30.6%) |
| Total | 675 (54.9%) | 554 (45.1%) |
Employment Characteristics in Davenport
Employment by Class of Employer in Davenport
Among the 49,889 employed individuals in Davenport, private company employees (35,603 | 71.4%), not-for-profit organizations (4,956 | 9.9%), and local government employees (2,625 | 5.3%) make up the most common classes of employment.
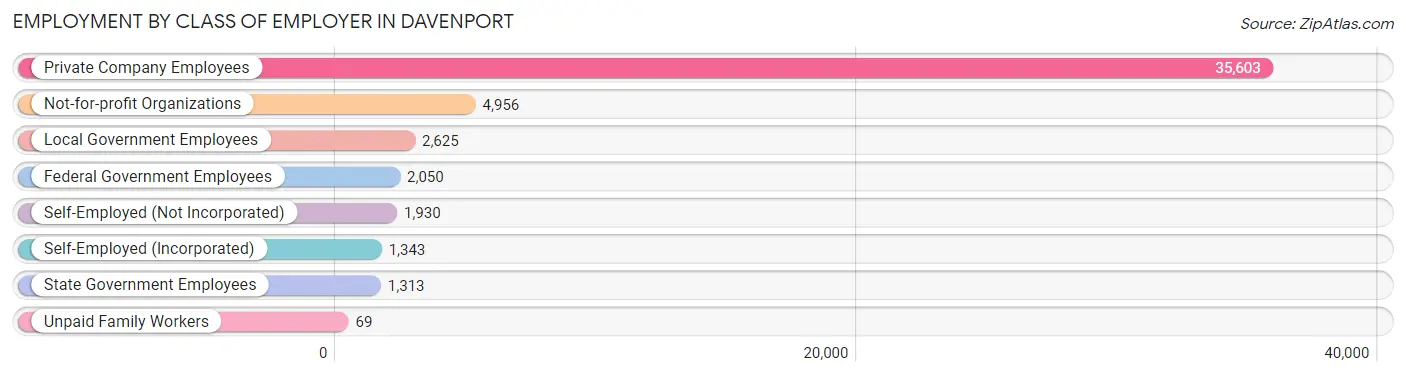
| Employer Class | # Employees | % Employees |
| Private Company Employees | 35,603 | 71.4% |
| Self-Employed (Incorporated) | 1,343 | 2.7% |
| Self-Employed (Not Incorporated) | 1,930 | 3.9% |
| Not-for-profit Organizations | 4,956 | 9.9% |
| Local Government Employees | 2,625 | 5.3% |
| State Government Employees | 1,313 | 2.6% |
| Federal Government Employees | 2,050 | 4.1% |
| Unpaid Family Workers | 69 | 0.1% |
| Total | 49,889 | 100.0% |
Employment Status by Age in Davenport
According to the labor force statistics for Davenport, out of the total population over 16 years of age (82,135), 65.3% or 53,634 individuals are in the labor force, with 5.0% or 2,682 of them unemployed. The age group with the highest labor force participation rate is 35 to 44 years, with 86.9% or 11,420 individuals in the labor force. Within the labor force, the 20 to 24 years age range has the highest percentage of unemployed individuals, with 6.8% or 414 of them being unemployed.
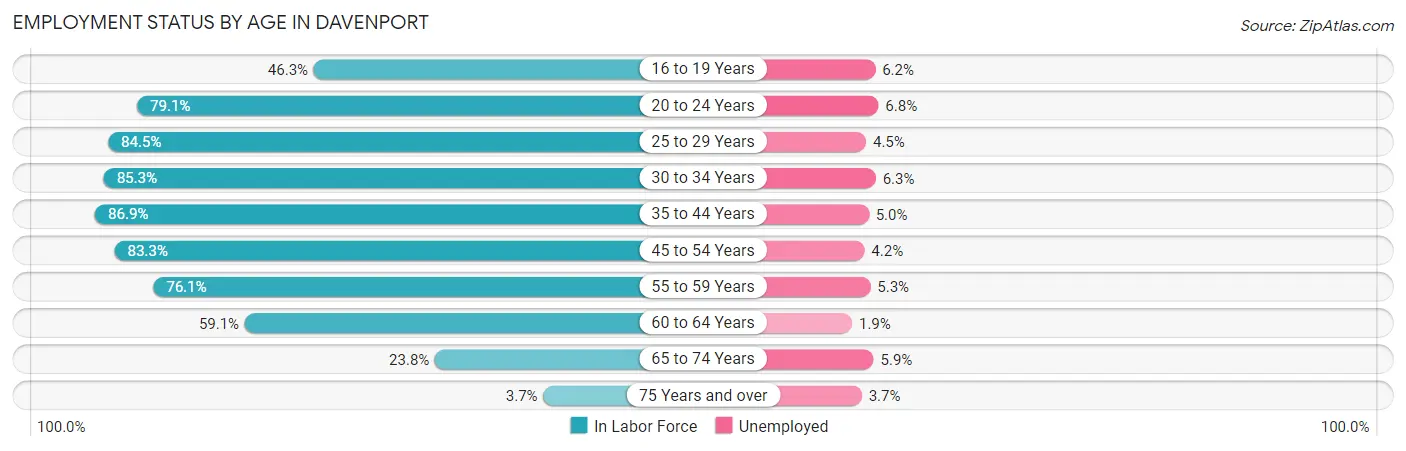
| Age Bracket | In Labor Force | Unemployed |
| 16 to 19 Years | 2,436 (46.3%) | 151 (6.2%) |
| 20 to 24 Years | 6,090 (79.1%) | 414 (6.8%) |
| 25 to 29 Years | 6,429 (84.5%) | 289 (4.5%) |
| 30 to 34 Years | 6,270 (85.3%) | 395 (6.3%) |
| 35 to 44 Years | 11,420 (86.9%) | 571 (5.0%) |
| 45 to 54 Years | 9,558 (83.3%) | 401 (4.2%) |
| 55 to 59 Years | 4,936 (76.1%) | 262 (5.3%) |
| 60 to 64 Years | 3,954 (59.1%) | 75 (1.9%) |
| 65 to 74 Years | 2,326 (23.8%) | 137 (5.9%) |
| 75 Years and over | 246 (3.7%) | 9 (3.7%) |
| Total | 53,634 (65.3%) | 2,682 (5.0%) |
Employment Status by Educational Attainment in Davenport
According to labor force statistics for Davenport, 80.7% of individuals (42,569) out of the total population between 25 and 64 years of age (52,750) are in the labor force, with 4.7% or 2,001 of them being unemployed. The group with the highest labor force participation rate are those with the educational attainment of bachelor's degree or higher, with 88.0% or 13,391 individuals in the labor force. Within the labor force, individuals with high school diploma education have the highest percentage of unemployment, with 8.3% or 939 of them being unemployed.
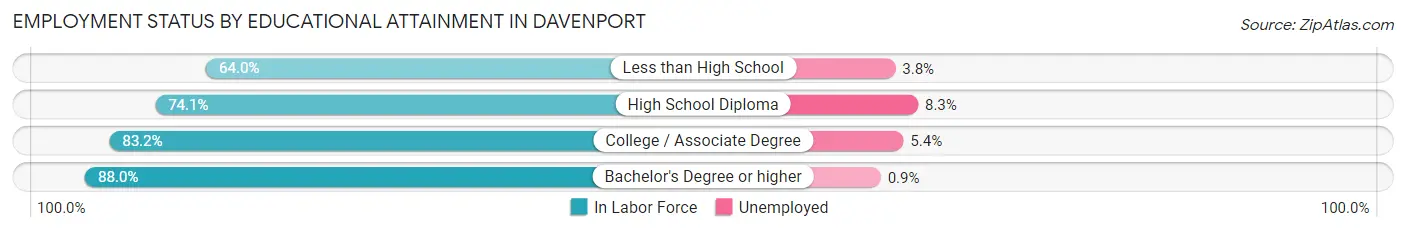
| Educational Attainment | In Labor Force | Unemployed |
| Less than High School | 2,275 (64.0%) | 135 (3.8%) |
| High School Diploma | 11,309 (74.1%) | 1,267 (8.3%) |
| College / Associate Degree | 15,572 (83.2%) | 1,011 (5.4%) |
| Bachelor's Degree or higher | 13,391 (88.0%) | 137 (0.9%) |
| Total | 42,569 (80.7%) | 2,479 (4.7%) |
Employment Occupations by Sex in Davenport
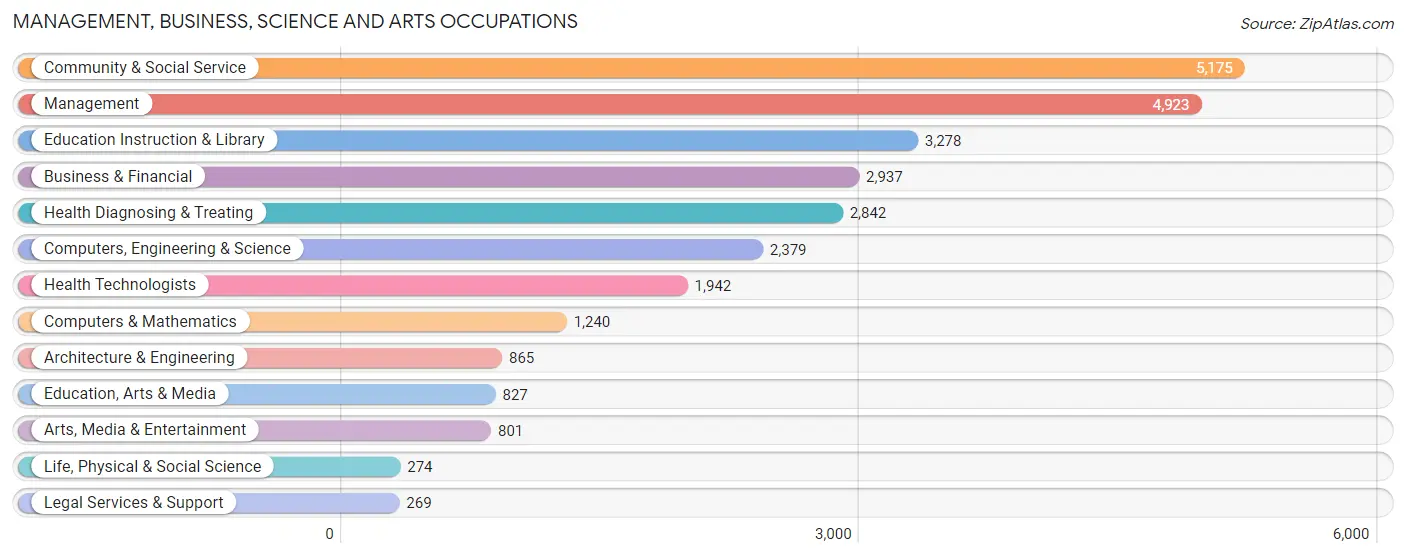
Management, Business, Science and Arts Occupations
The most common Management, Business, Science and Arts occupations in Davenport are Community & Social Service (5,175 | 10.2%), Management (4,923 | 9.7%), Education Instruction & Library (3,278 | 6.5%), Business & Financial (2,937 | 5.8%), and Health Diagnosing & Treating (2,842 | 5.6%).
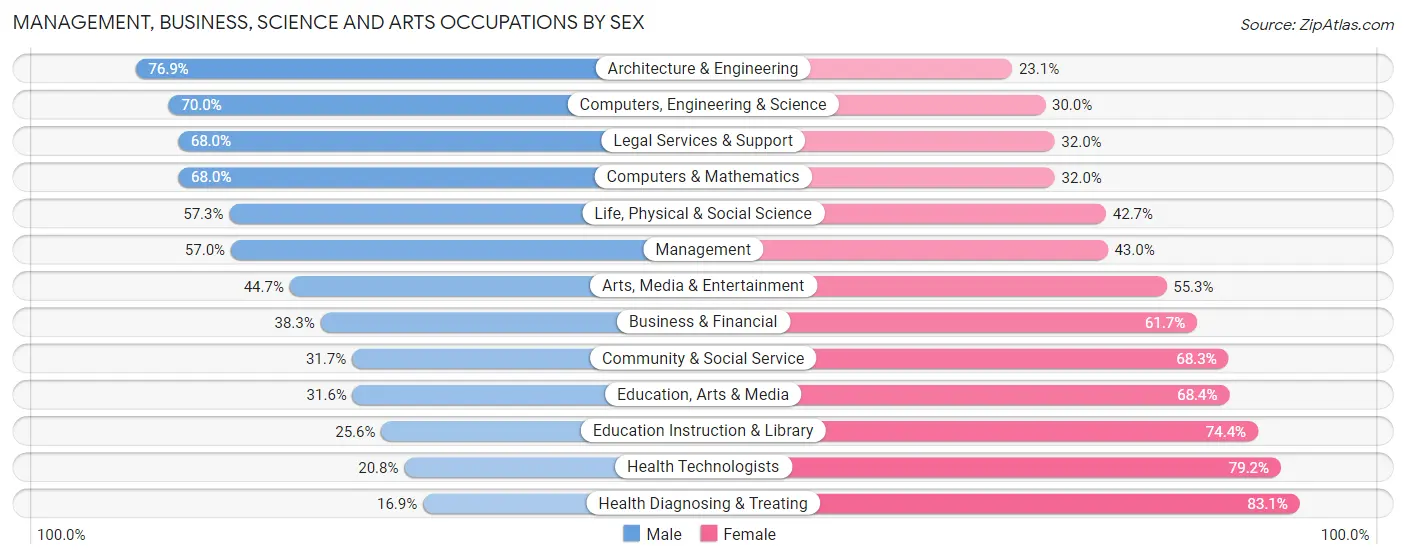
Management, Business, Science and Arts Occupations by Sex
Within the Management, Business, Science and Arts occupations in Davenport, the most male-oriented occupations are Architecture & Engineering (76.9%), Computers, Engineering & Science (70.0%), and Legal Services & Support (68.0%), while the most female-oriented occupations are Health Diagnosing & Treating (83.1%), Health Technologists (79.2%), and Education Instruction & Library (74.4%).
| Occupation | Male | Female |
| Management | 2,804 (57.0%) | 2,119 (43.0%) |
| Business & Financial | 1,124 (38.3%) | 1,813 (61.7%) |
| Computers, Engineering & Science | 1,665 (70.0%) | 714 (30.0%) |
| Computers & Mathematics | 843 (68.0%) | 397 (32.0%) |
| Architecture & Engineering | 665 (76.9%) | 200 (23.1%) |
| Life, Physical & Social Science | 157 (57.3%) | 117 (42.7%) |
| Community & Social Service | 1,641 (31.7%) | 3,534 (68.3%) |
| Education, Arts & Media | 261 (31.6%) | 566 (68.4%) |
| Legal Services & Support | 183 (68.0%) | 86 (32.0%) |
| Education Instruction & Library | 839 (25.6%) | 2,439 (74.4%) |
| Arts, Media & Entertainment | 358 (44.7%) | 443 (55.3%) |
| Health Diagnosing & Treating | 480 (16.9%) | 2,362 (83.1%) |
| Health Technologists | 404 (20.8%) | 1,538 (79.2%) |
| Total (Category) | 7,714 (42.2%) | 10,542 (57.8%) |
| Total (Overall) | 26,409 (52.0%) | 24,415 (48.0%) |
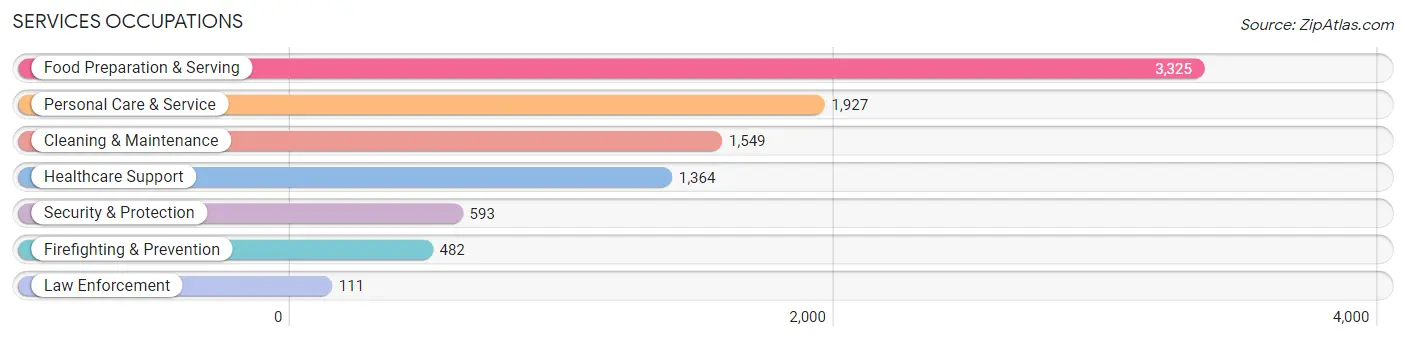
Services Occupations
The most common Services occupations in Davenport are Food Preparation & Serving (3,325 | 6.5%), Personal Care & Service (1,927 | 3.8%), Cleaning & Maintenance (1,549 | 3.0%), Healthcare Support (1,364 | 2.7%), and Security & Protection (593 | 1.2%).
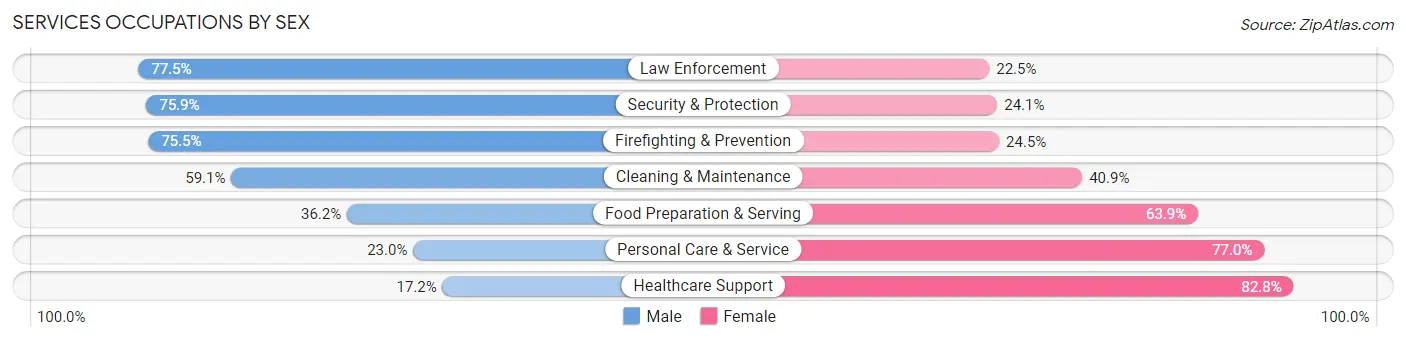
Services Occupations by Sex
Within the Services occupations in Davenport, the most male-oriented occupations are Law Enforcement (77.5%), Security & Protection (75.9%), and Firefighting & Prevention (75.5%), while the most female-oriented occupations are Healthcare Support (82.8%), Personal Care & Service (77.0%), and Food Preparation & Serving (63.8%).
| Occupation | Male | Female |
| Healthcare Support | 235 (17.2%) | 1,129 (82.8%) |
| Security & Protection | 450 (75.9%) | 143 (24.1%) |
| Firefighting & Prevention | 364 (75.5%) | 118 (24.5%) |
| Law Enforcement | 86 (77.5%) | 25 (22.5%) |
| Food Preparation & Serving | 1,202 (36.1%) | 2,123 (63.8%) |
| Cleaning & Maintenance | 915 (59.1%) | 634 (40.9%) |
| Personal Care & Service | 444 (23.0%) | 1,483 (77.0%) |
| Total (Category) | 3,246 (37.1%) | 5,512 (62.9%) |
| Total (Overall) | 26,409 (52.0%) | 24,415 (48.0%) |
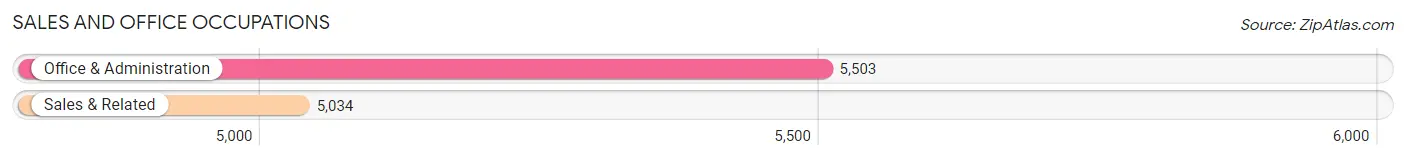
Sales and Office Occupations
The most common Sales and Office occupations in Davenport are Office & Administration (5,503 | 10.8%), and Sales & Related (5,034 | 9.9%).
Sales and Office Occupations by Sex
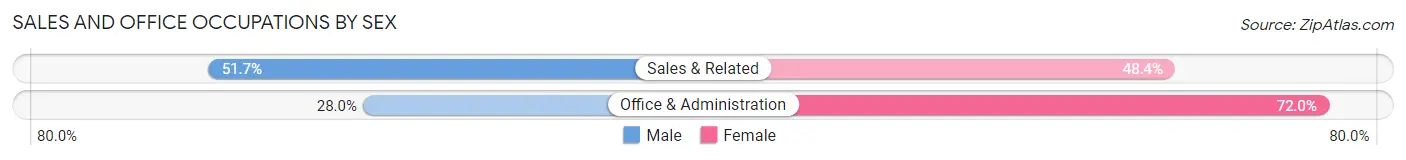
| Occupation | Male | Female |
| Sales & Related | 2,600 (51.6%) | 2,434 (48.3%) |
| Office & Administration | 1,539 (28.0%) | 3,964 (72.0%) |
| Total (Category) | 4,139 (39.3%) | 6,398 (60.7%) |
| Total (Overall) | 26,409 (52.0%) | 24,415 (48.0%) |
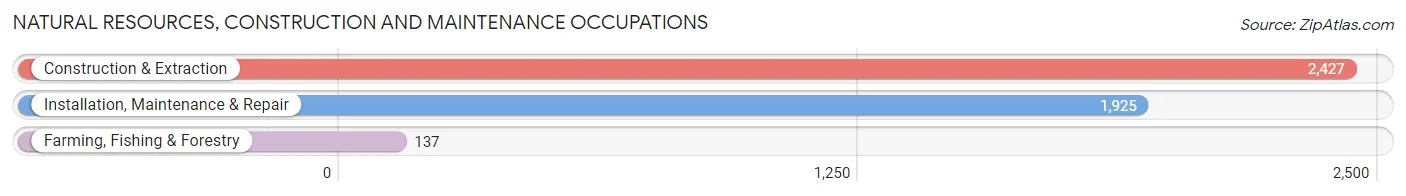
Natural Resources, Construction and Maintenance Occupations
The most common Natural Resources, Construction and Maintenance occupations in Davenport are Construction & Extraction (2,427 | 4.8%), Installation, Maintenance & Repair (1,925 | 3.8%), and Farming, Fishing & Forestry (137 | 0.3%).
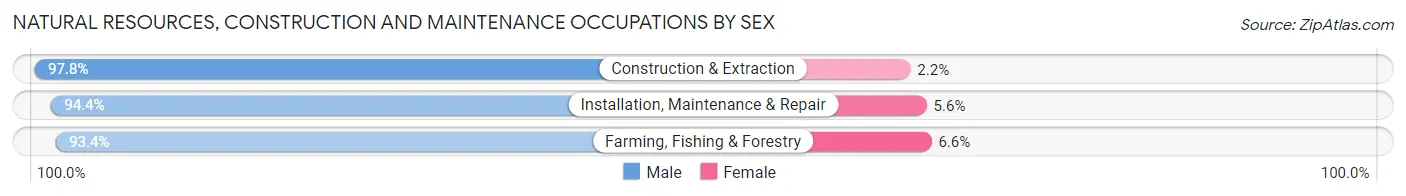
Natural Resources, Construction and Maintenance Occupations by Sex
| Occupation | Male | Female |
| Farming, Fishing & Forestry | 128 (93.4%) | 9 (6.6%) |
| Construction & Extraction | 2,374 (97.8%) | 53 (2.2%) |
| Installation, Maintenance & Repair | 1,818 (94.4%) | 107 (5.6%) |
| Total (Category) | 4,320 (96.2%) | 169 (3.8%) |
| Total (Overall) | 26,409 (52.0%) | 24,415 (48.0%) |
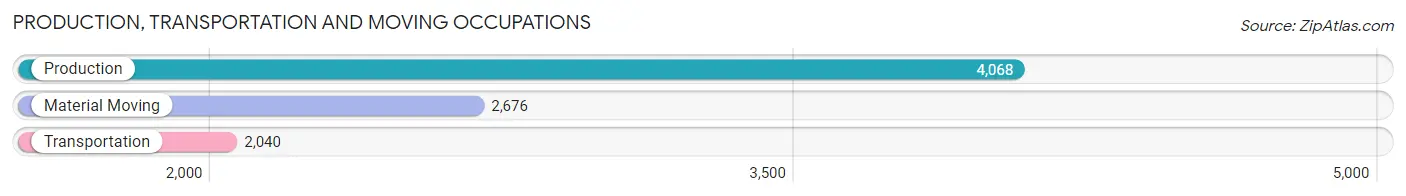
Production, Transportation and Moving Occupations
The most common Production, Transportation and Moving occupations in Davenport are Production (4,068 | 8.0%), Material Moving (2,676 | 5.3%), and Transportation (2,040 | 4.0%).
Production, Transportation and Moving Occupations by Sex
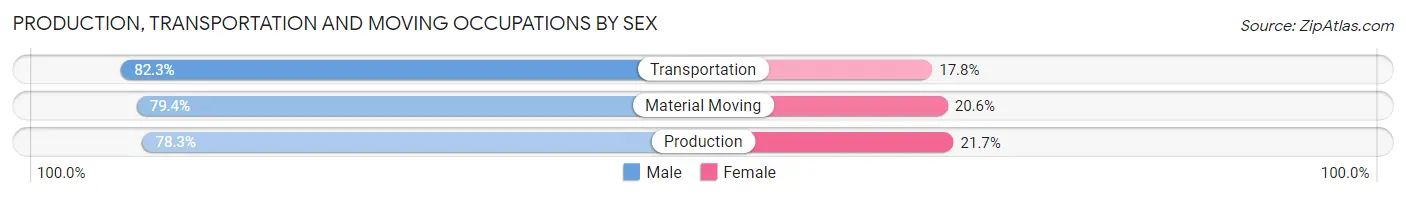
| Occupation | Male | Female |
| Production | 3,187 (78.3%) | 881 (21.7%) |
| Transportation | 1,678 (82.3%) | 362 (17.7%) |
| Material Moving | 2,125 (79.4%) | 551 (20.6%) |
| Total (Category) | 6,990 (79.6%) | 1,794 (20.4%) |
| Total (Overall) | 26,409 (52.0%) | 24,415 (48.0%) |
Employment Industries by Sex in Davenport
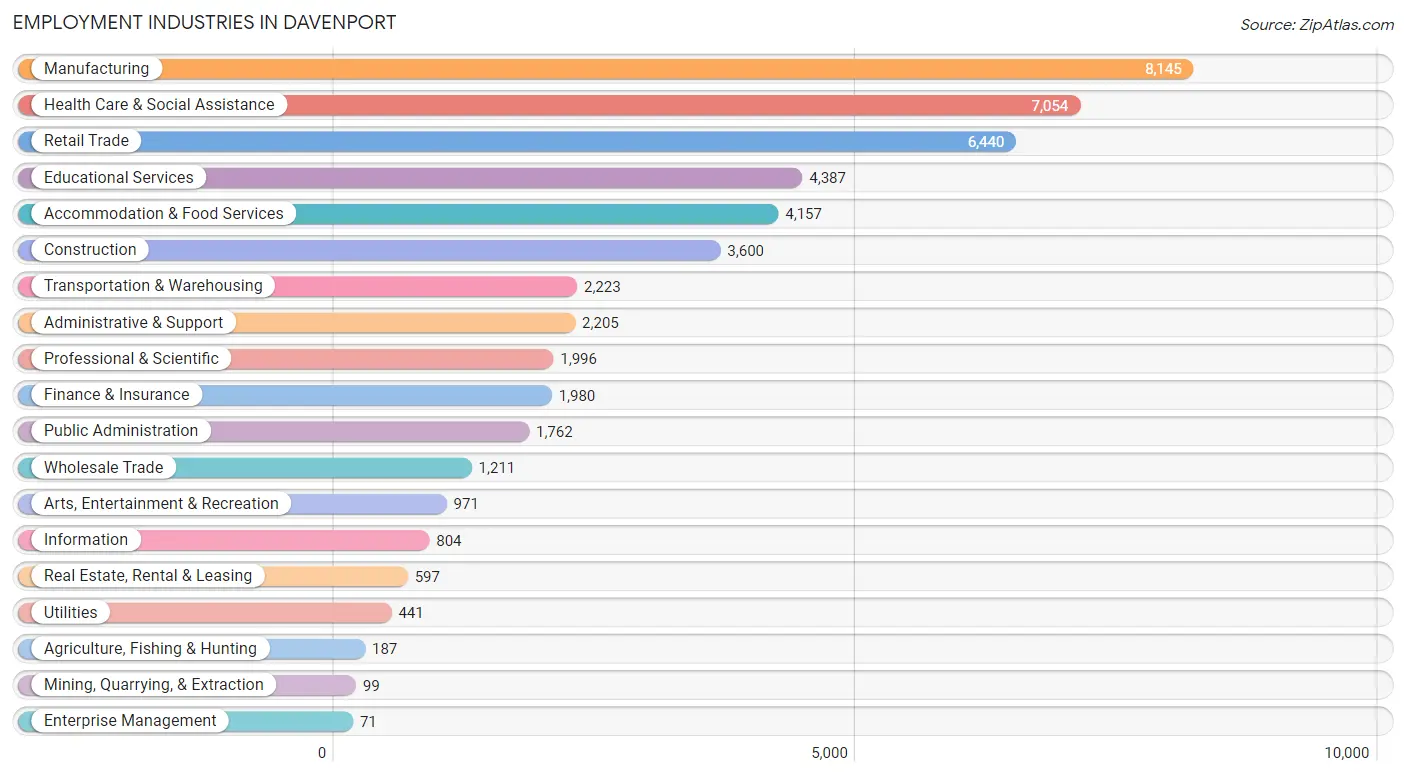
Employment Industries in Davenport
The major employment industries in Davenport include Manufacturing (8,145 | 16.0%), Health Care & Social Assistance (7,054 | 13.9%), Retail Trade (6,440 | 12.7%), Educational Services (4,387 | 8.6%), and Accommodation & Food Services (4,157 | 8.2%).
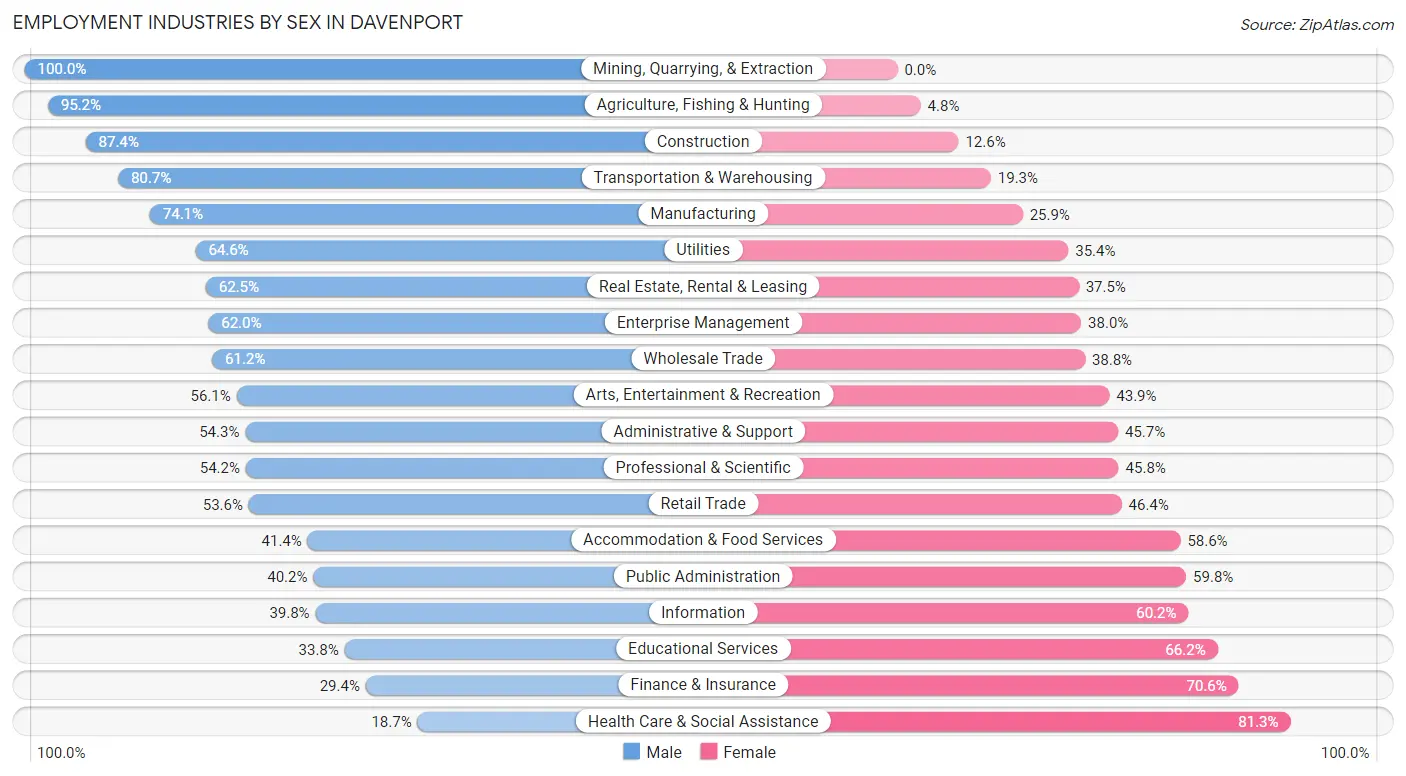
Employment Industries by Sex in Davenport
The Davenport industries that see more men than women are Mining, Quarrying, & Extraction (100.0%), Agriculture, Fishing & Hunting (95.2%), and Construction (87.4%), whereas the industries that tend to have a higher number of women are Health Care & Social Assistance (81.3%), Finance & Insurance (70.6%), and Educational Services (66.2%).
| Industry | Male | Female |
| Agriculture, Fishing & Hunting | 178 (95.2%) | 9 (4.8%) |
| Mining, Quarrying, & Extraction | 99 (100.0%) | 0 (0.0%) |
| Construction | 3,145 (87.4%) | 455 (12.6%) |
| Manufacturing | 6,033 (74.1%) | 2,112 (25.9%) |
| Wholesale Trade | 741 (61.2%) | 470 (38.8%) |
| Retail Trade | 3,451 (53.6%) | 2,989 (46.4%) |
| Transportation & Warehousing | 1,793 (80.7%) | 430 (19.3%) |
| Utilities | 285 (64.6%) | 156 (35.4%) |
| Information | 320 (39.8%) | 484 (60.2%) |
| Finance & Insurance | 582 (29.4%) | 1,398 (70.6%) |
| Real Estate, Rental & Leasing | 373 (62.5%) | 224 (37.5%) |
| Professional & Scientific | 1,082 (54.2%) | 914 (45.8%) |
| Enterprise Management | 44 (62.0%) | 27 (38.0%) |
| Administrative & Support | 1,198 (54.3%) | 1,007 (45.7%) |
| Educational Services | 1,481 (33.8%) | 2,906 (66.2%) |
| Health Care & Social Assistance | 1,318 (18.7%) | 5,736 (81.3%) |
| Arts, Entertainment & Recreation | 545 (56.1%) | 426 (43.9%) |
| Accommodation & Food Services | 1,722 (41.4%) | 2,435 (58.6%) |
| Public Administration | 709 (40.2%) | 1,053 (59.8%) |
| Total | 26,409 (52.0%) | 24,415 (48.0%) |
Education in Davenport
School Enrollment in Davenport
The most common levels of schooling among the 22,908 students in Davenport are middle school (5,048 | 22.0%), college / undergraduate (4,953 | 21.6%), and high school (4,513 | 19.7%).
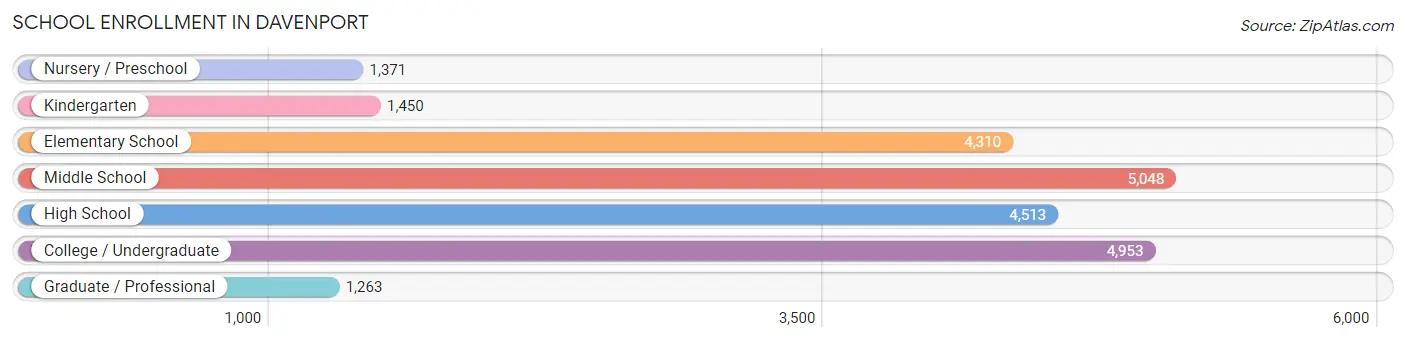
| School Level | # Students | % Students |
| Nursery / Preschool | 1,371 | 6.0% |
| Kindergarten | 1,450 | 6.3% |
| Elementary School | 4,310 | 18.8% |
| Middle School | 5,048 | 22.0% |
| High School | 4,513 | 19.7% |
| College / Undergraduate | 4,953 | 21.6% |
| Graduate / Professional | 1,263 | 5.5% |
| Total | 22,908 | 100.0% |
School Enrollment by Age by Funding Source in Davenport
Out of a total of 22,908 students who are enrolled in schools in Davenport, 5,154 (22.5%) attend a private institution, while the remaining 17,754 (77.5%) are enrolled in public schools. The age group of 20 to 24 year olds has the highest likelihood of being enrolled in private schools, with 1,387 (50.8% in the age bracket) enrolled. Conversely, the age group of 15 to 17 year olds has the lowest likelihood of being enrolled in a private school, with 3,222 (91.8% in the age bracket) attending a public institution.
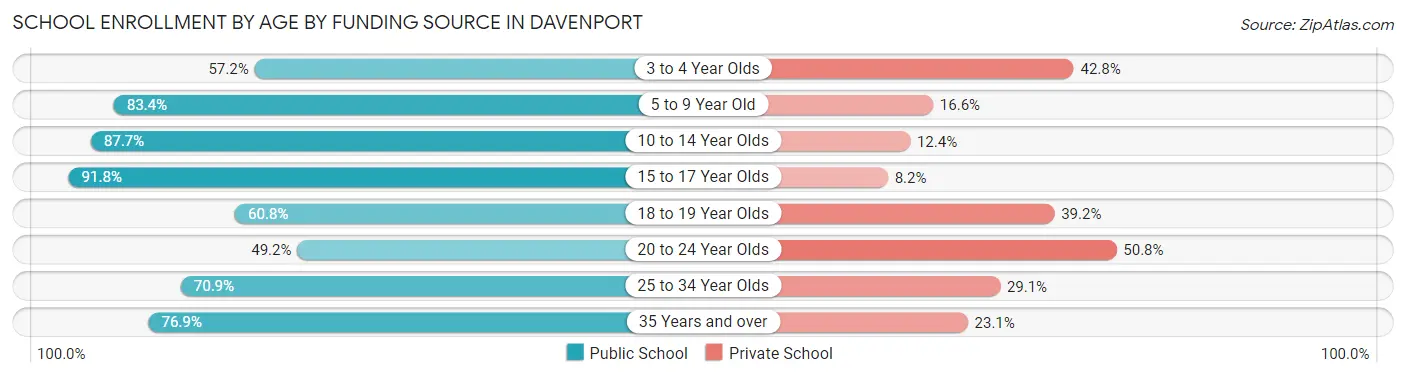
| Age Bracket | Public School | Private School |
| 3 to 4 Year Olds | 673 (57.2%) | 504 (42.8%) |
| 5 to 9 Year Old | 4,585 (83.4%) | 914 (16.6%) |
| 10 to 14 Year Olds | 5,112 (87.6%) | 720 (12.3%) |
| 15 to 17 Year Olds | 3,222 (91.8%) | 288 (8.2%) |
| 18 to 19 Year Olds | 1,122 (60.8%) | 724 (39.2%) |
| 20 to 24 Year Olds | 1,344 (49.2%) | 1,387 (50.8%) |
| 25 to 34 Year Olds | 1,047 (70.9%) | 430 (29.1%) |
| 35 Years and over | 643 (76.9%) | 193 (23.1%) |
| Total | 17,754 (77.5%) | 5,154 (22.5%) |
Educational Attainment by Field of Study in Davenport
Business (4,382 | 20.3%), education (3,868 | 17.9%), science & technology (2,054 | 9.5%), arts & humanities (1,801 | 8.3%), and engineering (1,606 | 7.4%) are the most common fields of study among 21,588 individuals in Davenport who have obtained a bachelor's degree or higher.
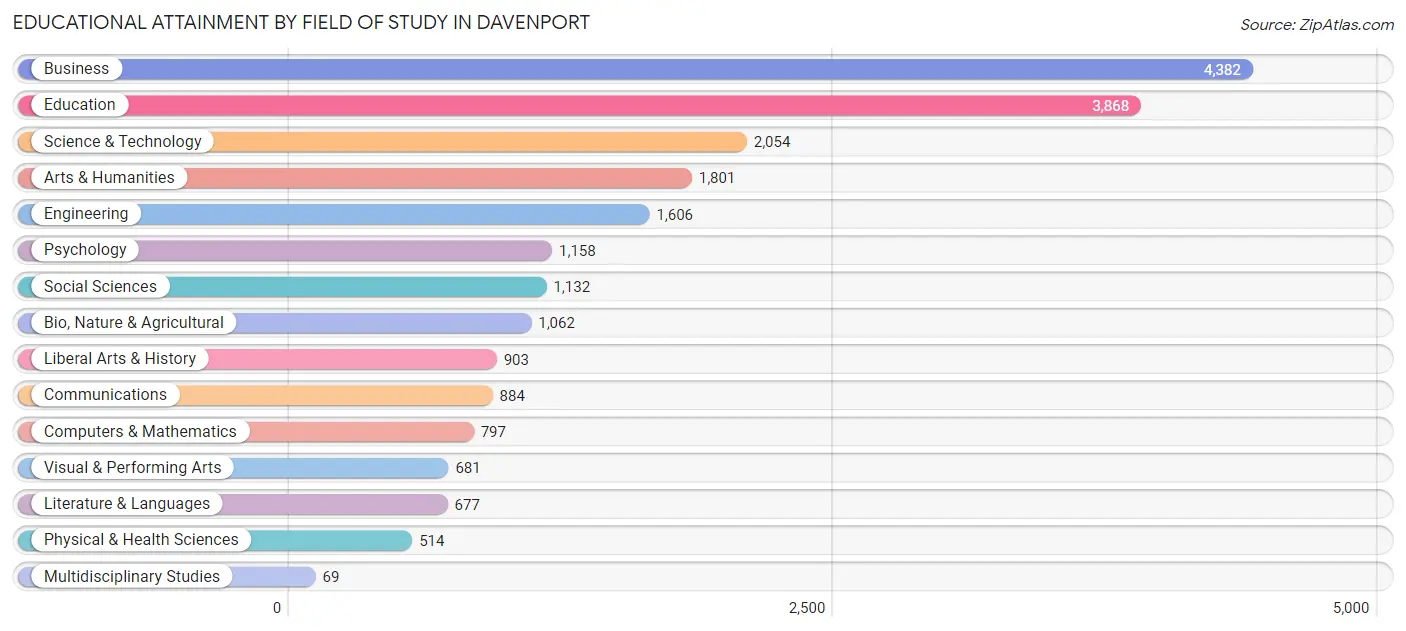
| Field of Study | # Graduates | % Graduates |
| Computers & Mathematics | 797 | 3.7% |
| Bio, Nature & Agricultural | 1,062 | 4.9% |
| Physical & Health Sciences | 514 | 2.4% |
| Psychology | 1,158 | 5.4% |
| Social Sciences | 1,132 | 5.2% |
| Engineering | 1,606 | 7.4% |
| Multidisciplinary Studies | 69 | 0.3% |
| Science & Technology | 2,054 | 9.5% |
| Business | 4,382 | 20.3% |
| Education | 3,868 | 17.9% |
| Literature & Languages | 677 | 3.1% |
| Liberal Arts & History | 903 | 4.2% |
| Visual & Performing Arts | 681 | 3.2% |
| Communications | 884 | 4.1% |
| Arts & Humanities | 1,801 | 8.3% |
| Total | 21,588 | 100.0% |
Transportation & Commute in Davenport
Vehicle Availability by Sex in Davenport
The most prevalent vehicle ownership categories in Davenport are males with 2 vehicles (11,395, accounting for 44.6%) and females with 2 vehicles (10,067, making up 48.6%).
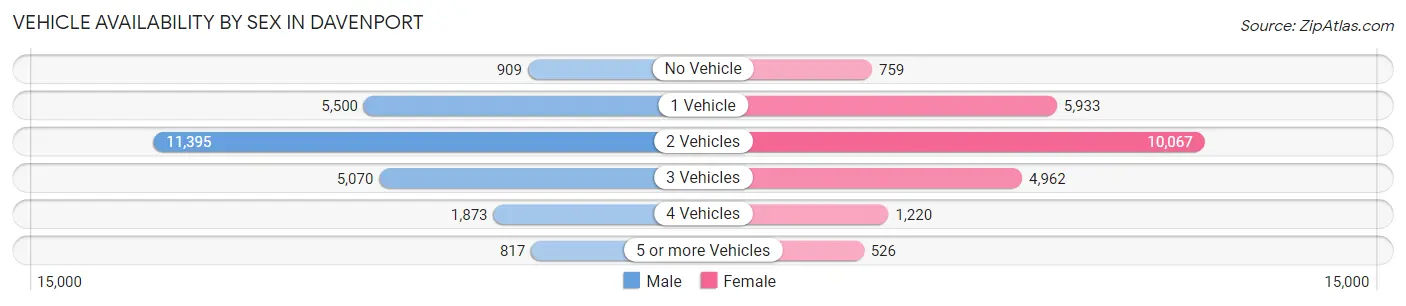
| Vehicles Available | Male | Female |
| No Vehicle | 909 (3.6%) | 759 (3.2%) |
| 1 Vehicle | 5,500 (21.5%) | 5,933 (25.3%) |
| 2 Vehicles | 11,395 (44.6%) | 10,067 (42.9%) |
| 3 Vehicles | 5,070 (19.8%) | 4,962 (21.1%) |
| 4 Vehicles | 1,873 (7.3%) | 1,220 (5.2%) |
| 5 or more Vehicles | 817 (3.2%) | 526 (2.2%) |
| Total | 25,564 (100.0%) | 23,467 (100.0%) |
Commute Time in Davenport
The most frequently occuring commute durations in Davenport are 15 to 19 minutes (11,832 commuters, 25.7%), 10 to 14 minutes (9,727 commuters, 21.1%), and 20 to 24 minutes (7,586 commuters, 16.5%).
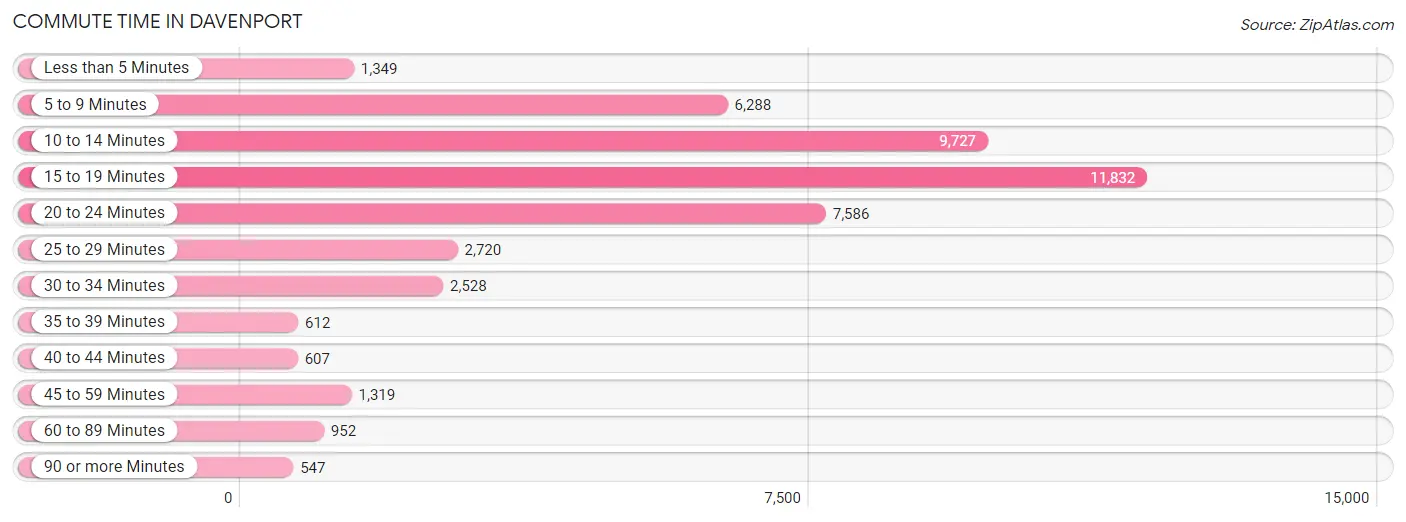
| Commute Time | # Commuters | % Commuters |
| Less than 5 Minutes | 1,349 | 2.9% |
| 5 to 9 Minutes | 6,288 | 13.7% |
| 10 to 14 Minutes | 9,727 | 21.1% |
| 15 to 19 Minutes | 11,832 | 25.7% |
| 20 to 24 Minutes | 7,586 | 16.5% |
| 25 to 29 Minutes | 2,720 | 5.9% |
| 30 to 34 Minutes | 2,528 | 5.5% |
| 35 to 39 Minutes | 612 | 1.3% |
| 40 to 44 Minutes | 607 | 1.3% |
| 45 to 59 Minutes | 1,319 | 2.9% |
| 60 to 89 Minutes | 952 | 2.1% |
| 90 or more Minutes | 547 | 1.2% |
Commute Time by Sex in Davenport
The most common commute times in Davenport are 15 to 19 minutes (5,974 commuters, 24.5%) for males and 15 to 19 minutes (5,858 commuters, 27.0%) for females.
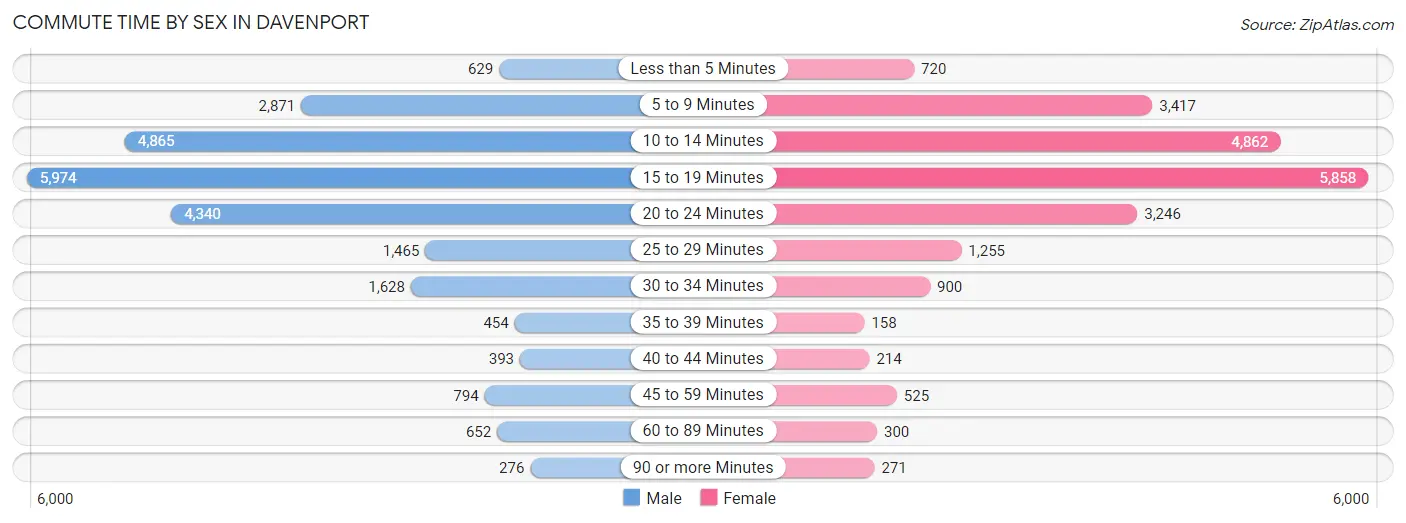
| Commute Time | Male | Female |
| Less than 5 Minutes | 629 (2.6%) | 720 (3.3%) |
| 5 to 9 Minutes | 2,871 (11.8%) | 3,417 (15.7%) |
| 10 to 14 Minutes | 4,865 (20.0%) | 4,862 (22.4%) |
| 15 to 19 Minutes | 5,974 (24.5%) | 5,858 (27.0%) |
| 20 to 24 Minutes | 4,340 (17.8%) | 3,246 (14.9%) |
| 25 to 29 Minutes | 1,465 (6.0%) | 1,255 (5.8%) |
| 30 to 34 Minutes | 1,628 (6.7%) | 900 (4.1%) |
| 35 to 39 Minutes | 454 (1.9%) | 158 (0.7%) |
| 40 to 44 Minutes | 393 (1.6%) | 214 (1.0%) |
| 45 to 59 Minutes | 794 (3.3%) | 525 (2.4%) |
| 60 to 89 Minutes | 652 (2.7%) | 300 (1.4%) |
| 90 or more Minutes | 276 (1.1%) | 271 (1.3%) |
Time of Departure to Work by Sex in Davenport
The most frequent times of departure to work in Davenport are 7:30 AM to 7:59 AM (3,673, 15.1%) for males and 7:30 AM to 7:59 AM (3,609, 16.6%) for females.
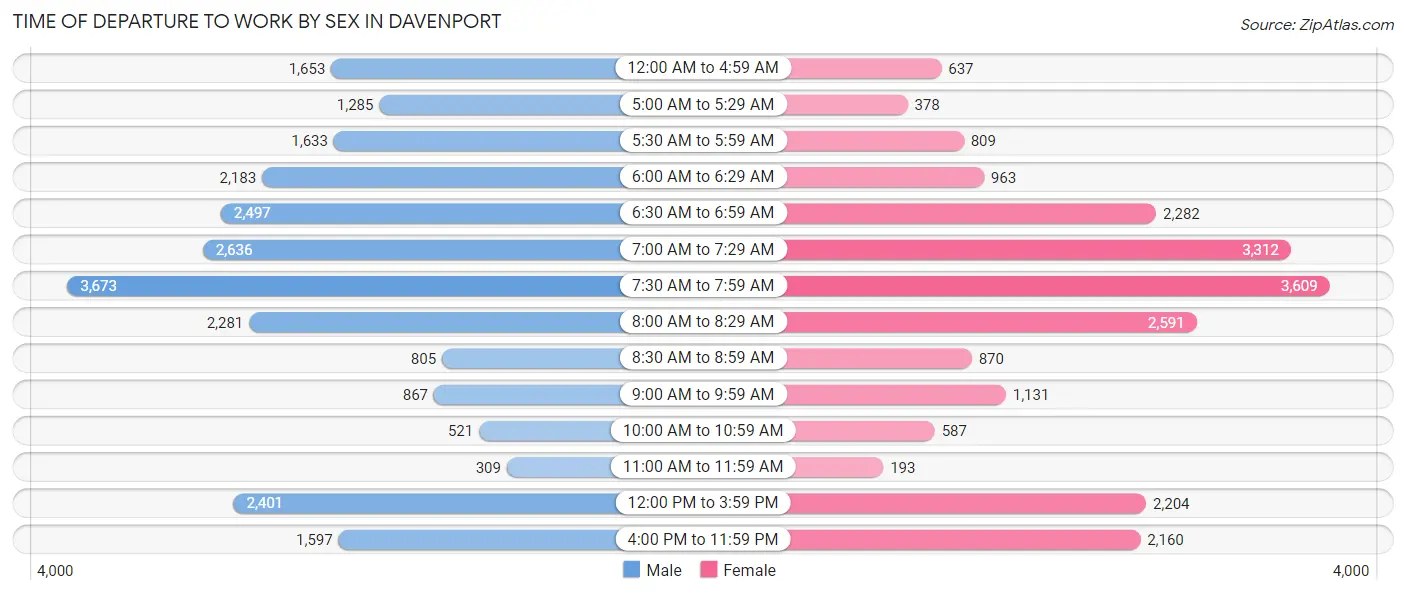
| Time of Departure | Male | Female |
| 12:00 AM to 4:59 AM | 1,653 (6.8%) | 637 (2.9%) |
| 5:00 AM to 5:29 AM | 1,285 (5.3%) | 378 (1.7%) |
| 5:30 AM to 5:59 AM | 1,633 (6.7%) | 809 (3.7%) |
| 6:00 AM to 6:29 AM | 2,183 (9.0%) | 963 (4.4%) |
| 6:30 AM to 6:59 AM | 2,497 (10.3%) | 2,282 (10.5%) |
| 7:00 AM to 7:29 AM | 2,636 (10.8%) | 3,312 (15.2%) |
| 7:30 AM to 7:59 AM | 3,673 (15.1%) | 3,609 (16.6%) |
| 8:00 AM to 8:29 AM | 2,281 (9.4%) | 2,591 (11.9%) |
| 8:30 AM to 8:59 AM | 805 (3.3%) | 870 (4.0%) |
| 9:00 AM to 9:59 AM | 867 (3.6%) | 1,131 (5.2%) |
| 10:00 AM to 10:59 AM | 521 (2.1%) | 587 (2.7%) |
| 11:00 AM to 11:59 AM | 309 (1.3%) | 193 (0.9%) |
| 12:00 PM to 3:59 PM | 2,401 (9.9%) | 2,204 (10.1%) |
| 4:00 PM to 11:59 PM | 1,597 (6.6%) | 2,160 (9.9%) |
| Total | 24,341 (100.0%) | 21,726 (100.0%) |
Housing Occupancy in Davenport
Occupancy by Ownership in Davenport
Of the total 42,667 dwellings in Davenport, owner-occupied units account for 26,536 (62.2%), while renter-occupied units make up 16,131 (37.8%).
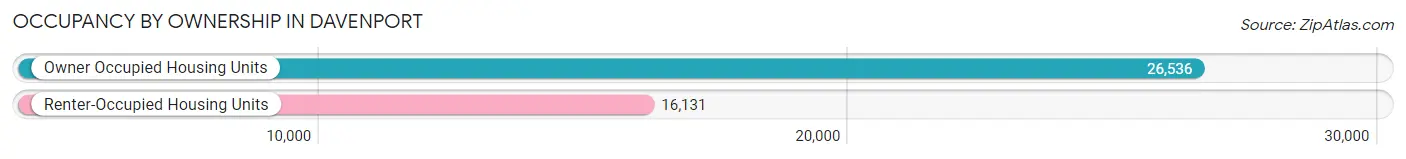
| Occupancy | # Housing Units | % Housing Units |
| Owner Occupied Housing Units | 26,536 | 62.2% |
| Renter-Occupied Housing Units | 16,131 | 37.8% |
| Total Occupied Housing Units | 42,667 | 100.0% |
Occupancy by Household Size in Davenport
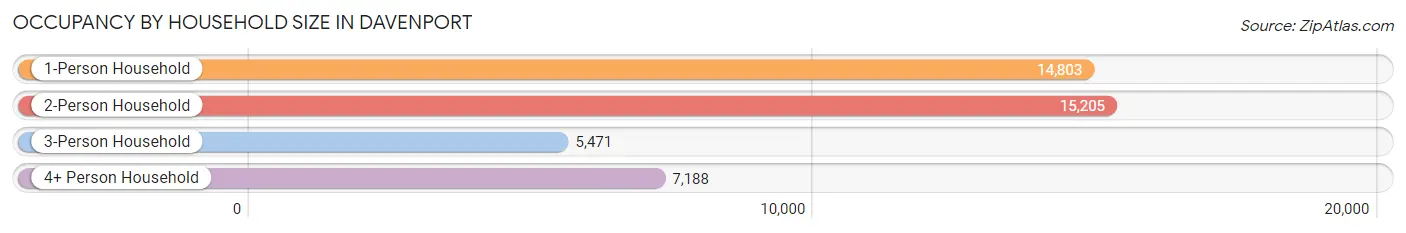
| Household Size | # Housing Units | % Housing Units |
| 1-Person Household | 14,803 | 34.7% |
| 2-Person Household | 15,205 | 35.6% |
| 3-Person Household | 5,471 | 12.8% |
| 4+ Person Household | 7,188 | 16.9% |
| Total Housing Units | 42,667 | 100.0% |
Occupancy by Ownership by Household Size in Davenport
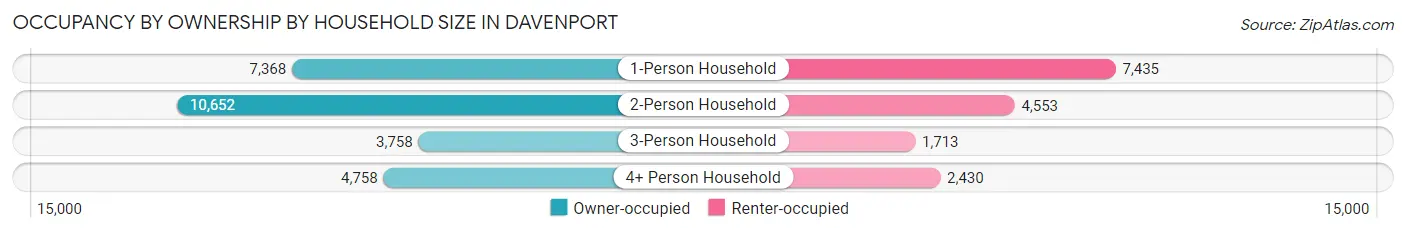
| Household Size | Owner-occupied | Renter-occupied |
| 1-Person Household | 7,368 (49.8%) | 7,435 (50.2%) |
| 2-Person Household | 10,652 (70.1%) | 4,553 (29.9%) |
| 3-Person Household | 3,758 (68.7%) | 1,713 (31.3%) |
| 4+ Person Household | 4,758 (66.2%) | 2,430 (33.8%) |
| Total Housing Units | 26,536 (62.2%) | 16,131 (37.8%) |
Occupancy by Educational Attainment in Davenport
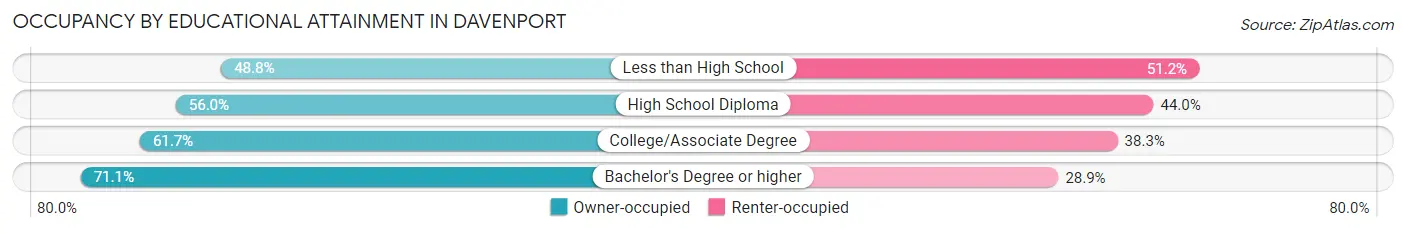
| Household Size | Owner-occupied | Renter-occupied |
| Less than High School | 1,392 (48.8%) | 1,460 (51.2%) |
| High School Diploma | 6,246 (56.0%) | 4,908 (44.0%) |
| College/Associate Degree | 9,707 (61.7%) | 6,026 (38.3%) |
| Bachelor's Degree or higher | 9,191 (71.1%) | 3,737 (28.9%) |
Occupancy by Age of Householder in Davenport
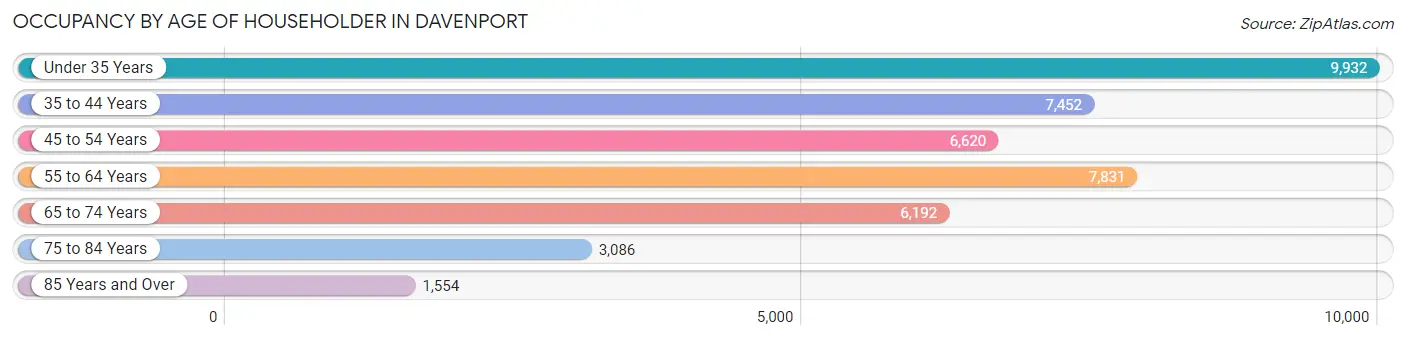
| Age Bracket | # Households | % Households |
| Under 35 Years | 9,932 | 23.3% |
| 35 to 44 Years | 7,452 | 17.5% |
| 45 to 54 Years | 6,620 | 15.5% |
| 55 to 64 Years | 7,831 | 18.3% |
| 65 to 74 Years | 6,192 | 14.5% |
| 75 to 84 Years | 3,086 | 7.2% |
| 85 Years and Over | 1,554 | 3.6% |
| Total | 42,667 | 100.0% |
Housing Finances in Davenport
Median Income by Occupancy in Davenport
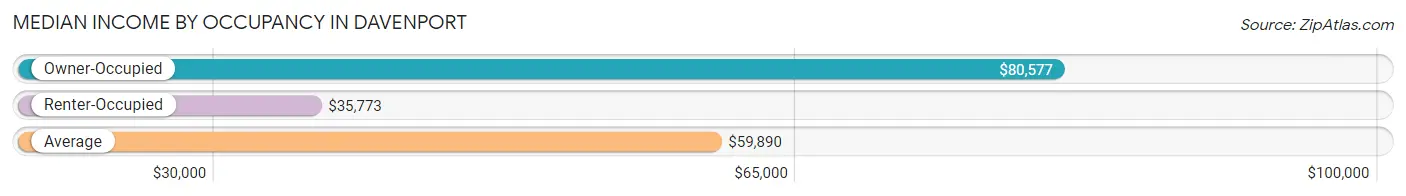
| Occupancy Type | # Households | Median Income |
| Owner-Occupied | 26,536 (62.2%) | $80,577 |
| Renter-Occupied | 16,131 (37.8%) | $35,773 |
| Average | 42,667 (100.0%) | $59,890 |
Occupancy by Householder Income Bracket in Davenport
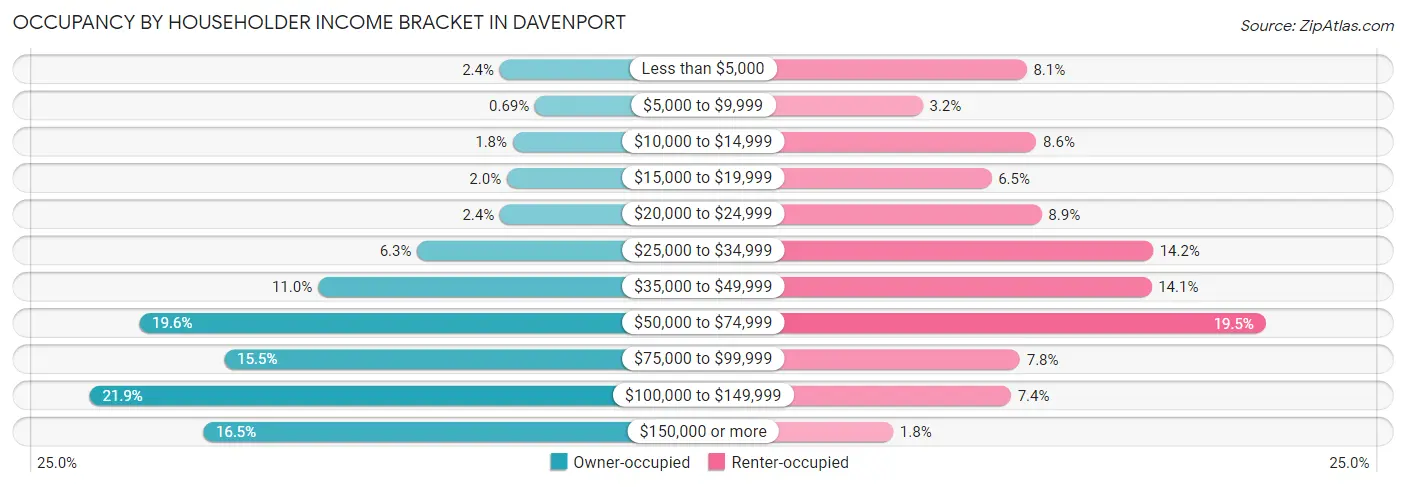
| Income Bracket | Owner-occupied | Renter-occupied |
| Less than $5,000 | 628 (2.4%) | 1,313 (8.1%) |
| $5,000 to $9,999 | 182 (0.7%) | 515 (3.2%) |
| $10,000 to $14,999 | 464 (1.8%) | 1,388 (8.6%) |
| $15,000 to $19,999 | 540 (2.0%) | 1,042 (6.5%) |
| $20,000 to $24,999 | 627 (2.4%) | 1,428 (8.8%) |
| $25,000 to $34,999 | 1,672 (6.3%) | 2,283 (14.1%) |
| $35,000 to $49,999 | 2,928 (11.0%) | 2,271 (14.1%) |
| $50,000 to $74,999 | 5,187 (19.6%) | 3,150 (19.5%) |
| $75,000 to $99,999 | 4,114 (15.5%) | 1,262 (7.8%) |
| $100,000 to $149,999 | 5,813 (21.9%) | 1,192 (7.4%) |
| $150,000 or more | 4,381 (16.5%) | 287 (1.8%) |
| Total | 26,536 (100.0%) | 16,131 (100.0%) |
Monthly Housing Cost Tiers in Davenport
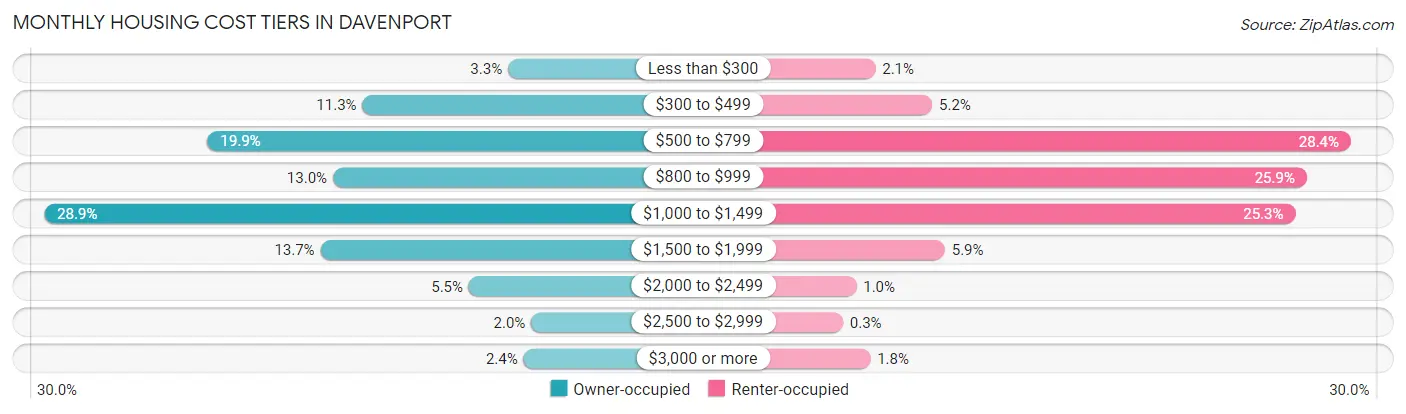
| Monthly Cost | Owner-occupied | Renter-occupied |
| Less than $300 | 876 (3.3%) | 337 (2.1%) |
| $300 to $499 | 3,009 (11.3%) | 843 (5.2%) |
| $500 to $799 | 5,280 (19.9%) | 4,574 (28.4%) |
| $800 to $999 | 3,441 (13.0%) | 4,181 (25.9%) |
| $1,000 to $1,499 | 7,675 (28.9%) | 4,079 (25.3%) |
| $1,500 to $1,999 | 3,625 (13.7%) | 956 (5.9%) |
| $2,000 to $2,499 | 1,448 (5.5%) | 168 (1.0%) |
| $2,500 to $2,999 | 535 (2.0%) | 49 (0.3%) |
| $3,000 or more | 647 (2.4%) | 292 (1.8%) |
| Total | 26,536 (100.0%) | 16,131 (100.0%) |
Physical Housing Characteristics in Davenport
Housing Structures in Davenport
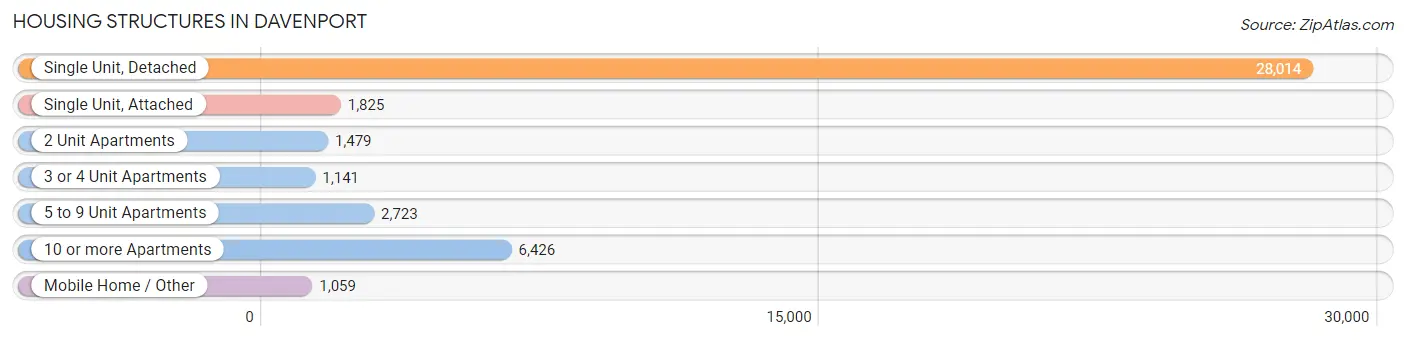
| Structure Type | # Housing Units | % Housing Units |
| Single Unit, Detached | 28,014 | 65.7% |
| Single Unit, Attached | 1,825 | 4.3% |
| 2 Unit Apartments | 1,479 | 3.5% |
| 3 or 4 Unit Apartments | 1,141 | 2.7% |
| 5 to 9 Unit Apartments | 2,723 | 6.4% |
| 10 or more Apartments | 6,426 | 15.1% |
| Mobile Home / Other | 1,059 | 2.5% |
| Total | 42,667 | 100.0% |
Housing Structures by Occupancy in Davenport
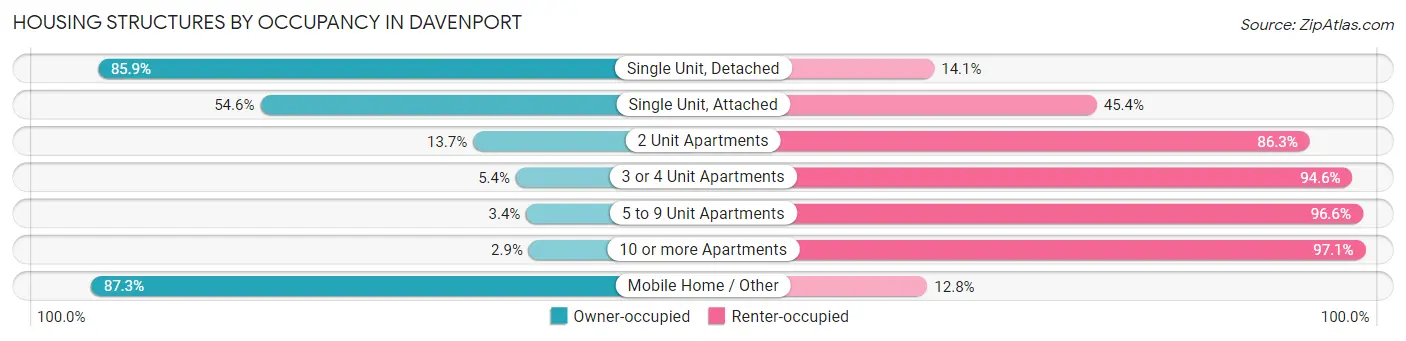
| Structure Type | Owner-occupied | Renter-occupied |
| Single Unit, Detached | 24,070 (85.9%) | 3,944 (14.1%) |
| Single Unit, Attached | 997 (54.6%) | 828 (45.4%) |
| 2 Unit Apartments | 202 (13.7%) | 1,277 (86.3%) |
| 3 or 4 Unit Apartments | 62 (5.4%) | 1,079 (94.6%) |
| 5 to 9 Unit Apartments | 93 (3.4%) | 2,630 (96.6%) |
| 10 or more Apartments | 188 (2.9%) | 6,238 (97.1%) |
| Mobile Home / Other | 924 (87.3%) | 135 (12.8%) |
| Total | 26,536 (62.2%) | 16,131 (37.8%) |
Housing Structures by Number of Rooms in Davenport
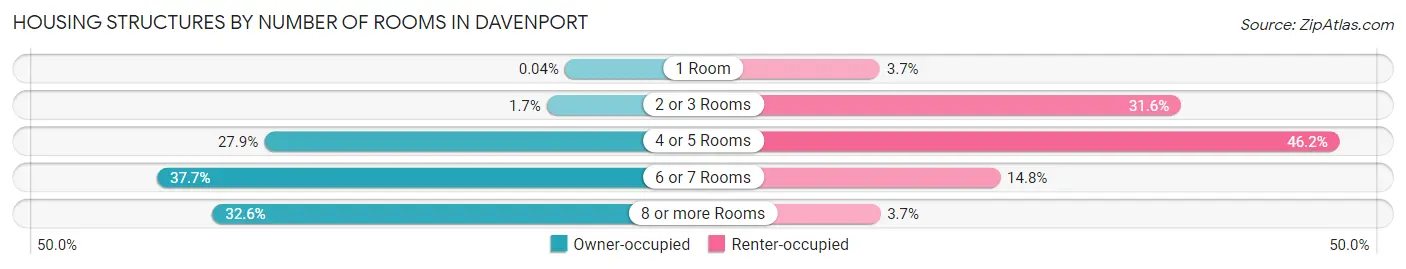
| Number of Rooms | Owner-occupied | Renter-occupied |
| 1 Room | 11 (0.0%) | 596 (3.7%) |
| 2 or 3 Rooms | 457 (1.7%) | 5,089 (31.6%) |
| 4 or 5 Rooms | 7,394 (27.9%) | 7,453 (46.2%) |
| 6 or 7 Rooms | 10,014 (37.7%) | 2,391 (14.8%) |
| 8 or more Rooms | 8,660 (32.6%) | 602 (3.7%) |
| Total | 26,536 (100.0%) | 16,131 (100.0%) |
Housing Structure by Heating Type in Davenport
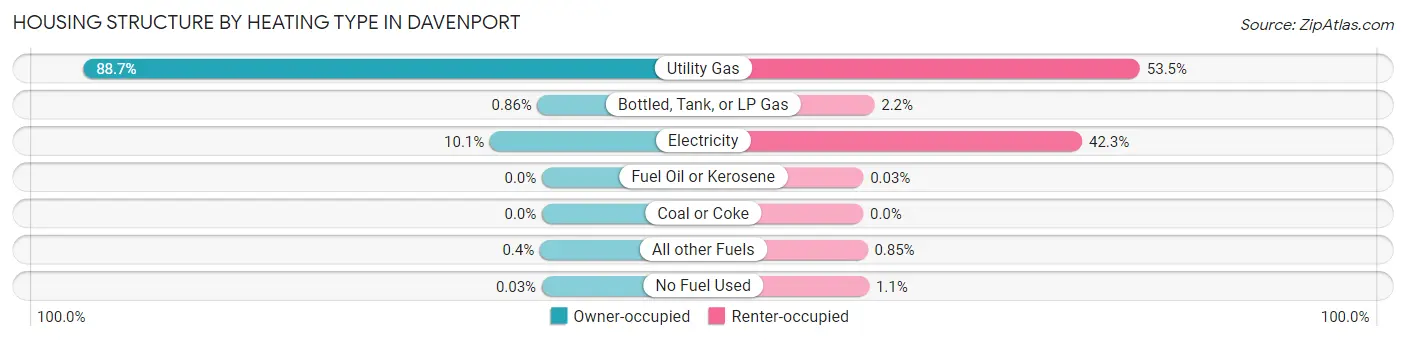
| Heating Type | Owner-occupied | Renter-occupied |
| Utility Gas | 23,530 (88.7%) | 8,628 (53.5%) |
| Bottled, Tank, or LP Gas | 227 (0.9%) | 350 (2.2%) |
| Electricity | 2,666 (10.1%) | 6,827 (42.3%) |
| Fuel Oil or Kerosene | 0 (0.0%) | 5 (0.0%) |
| Coal or Coke | 0 (0.0%) | 0 (0.0%) |
| All other Fuels | 105 (0.4%) | 137 (0.9%) |
| No Fuel Used | 8 (0.0%) | 184 (1.1%) |
| Total | 26,536 (100.0%) | 16,131 (100.0%) |
Household Vehicle Usage in Davenport
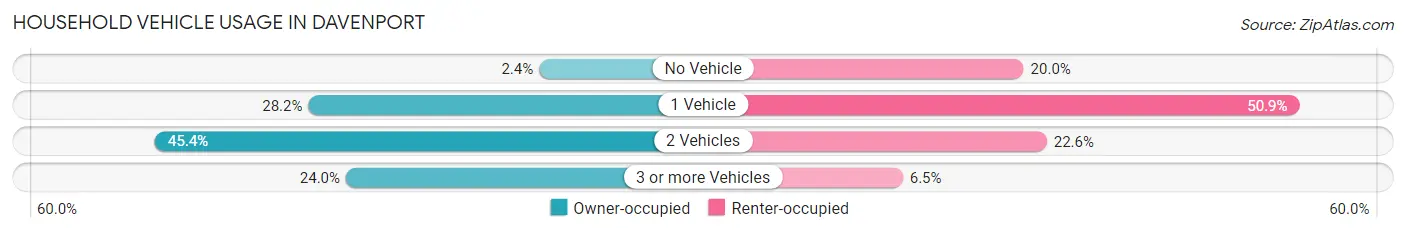
| Vehicles per Household | Owner-occupied | Renter-occupied |
| No Vehicle | 628 (2.4%) | 3,229 (20.0%) |
| 1 Vehicle | 7,488 (28.2%) | 8,210 (50.9%) |
| 2 Vehicles | 12,048 (45.4%) | 3,647 (22.6%) |
| 3 or more Vehicles | 6,372 (24.0%) | 1,045 (6.5%) |
| Total | 26,536 (100.0%) | 16,131 (100.0%) |
Real Estate & Mortgages in Davenport
Real Estate and Mortgage Overview in Davenport
| Characteristic | Without Mortgage | With Mortgage |
| Housing Units | 9,428 | 17,108 |
| Median Property Value | $148,200 | $158,800 |
| Median Household Income | $62,000 | $3,182 |
| Monthly Housing Costs | $555 | $642 |
| Real Estate Taxes | $2,704 | $260 |
Property Value by Mortgage Status in Davenport
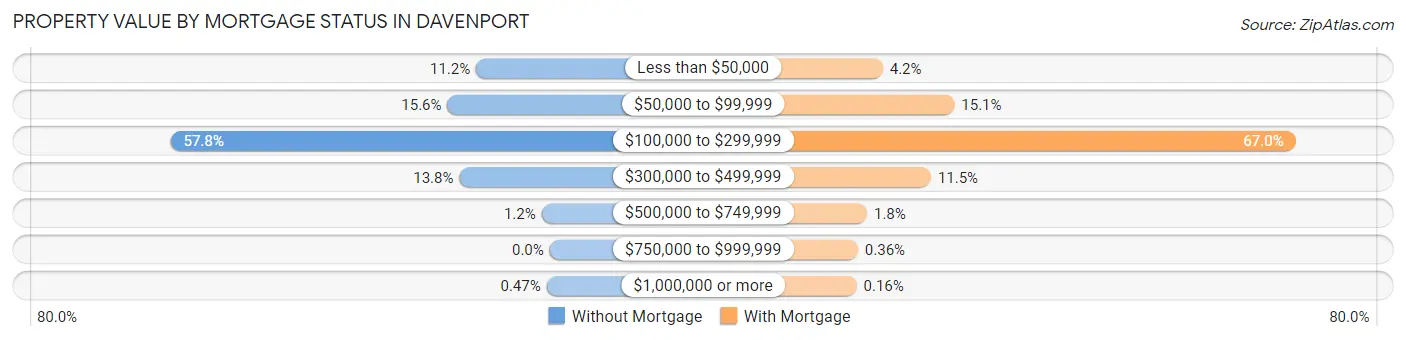
| Property Value | Without Mortgage | With Mortgage |
| Less than $50,000 | 1,057 (11.2%) | 710 (4.2%) |
| $50,000 to $99,999 | 1,469 (15.6%) | 2,577 (15.1%) |
| $100,000 to $299,999 | 5,445 (57.8%) | 11,468 (67.0%) |
| $300,000 to $499,999 | 1,297 (13.8%) | 1,965 (11.5%) |
| $500,000 to $749,999 | 116 (1.2%) | 299 (1.8%) |
| $750,000 to $999,999 | 0 (0.0%) | 61 (0.4%) |
| $1,000,000 or more | 44 (0.5%) | 28 (0.2%) |
| Total | 9,428 (100.0%) | 17,108 (100.0%) |
Household Income by Mortgage Status in Davenport
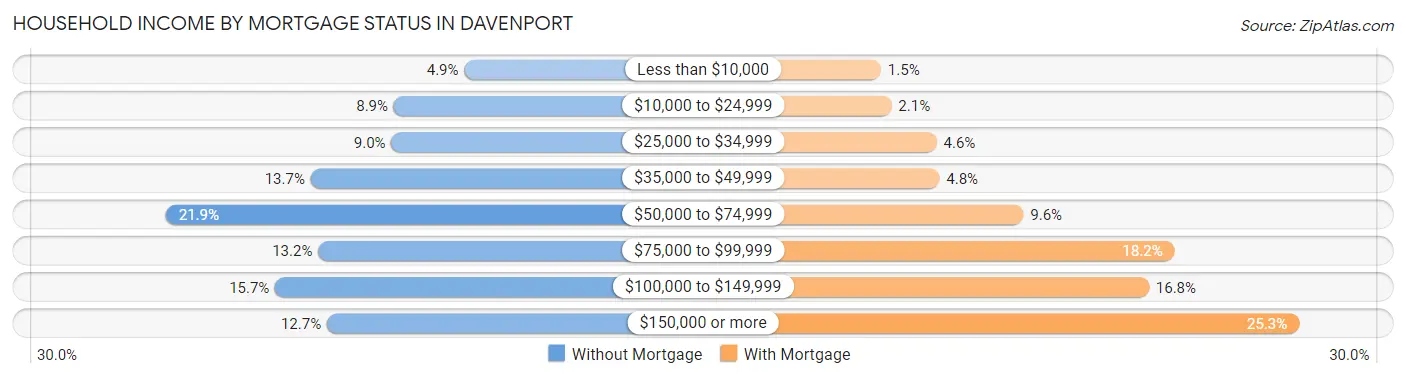
| Household Income | Without Mortgage | With Mortgage |
| Less than $10,000 | 459 (4.9%) | 248 (1.5%) |
| $10,000 to $24,999 | 839 (8.9%) | 351 (2.1%) |
| $25,000 to $34,999 | 852 (9.0%) | 792 (4.6%) |
| $35,000 to $49,999 | 1,287 (13.7%) | 820 (4.8%) |
| $50,000 to $74,999 | 2,068 (21.9%) | 1,641 (9.6%) |
| $75,000 to $99,999 | 1,246 (13.2%) | 3,119 (18.2%) |
| $100,000 to $149,999 | 1,478 (15.7%) | 2,868 (16.8%) |
| $150,000 or more | 1,199 (12.7%) | 4,335 (25.3%) |
| Total | 9,428 (100.0%) | 17,108 (100.0%) |
Property Value to Household Income Ratio in Davenport
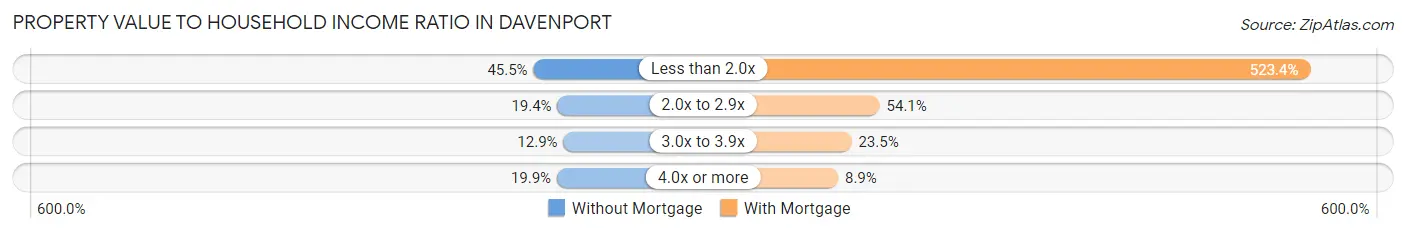
| Value-to-Income Ratio | Without Mortgage | With Mortgage |
| Less than 2.0x | 4,293 (45.5%) | 89,542 (523.4%) |
| 2.0x to 2.9x | 1,827 (19.4%) | 9,261 (54.1%) |
| 3.0x to 3.9x | 1,215 (12.9%) | 4,021 (23.5%) |
| 4.0x or more | 1,877 (19.9%) | 1,516 (8.9%) |
| Total | 9,428 (100.0%) | 17,108 (100.0%) |
Real Estate Taxes by Mortgage Status in Davenport
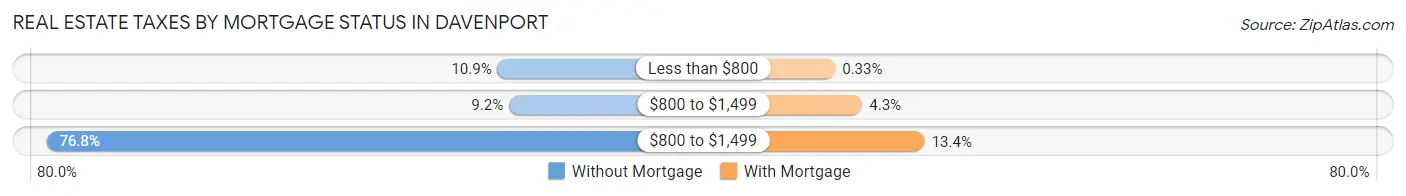
| Property Taxes | Without Mortgage | With Mortgage |
| Less than $800 | 1,028 (10.9%) | 57 (0.3%) |
| $800 to $1,499 | 869 (9.2%) | 732 (4.3%) |
| $800 to $1,499 | 7,241 (76.8%) | 2,292 (13.4%) |
| Total | 9,428 (100.0%) | 17,108 (100.0%) |
Health & Disability in Davenport
Health Insurance Coverage by Age in Davenport
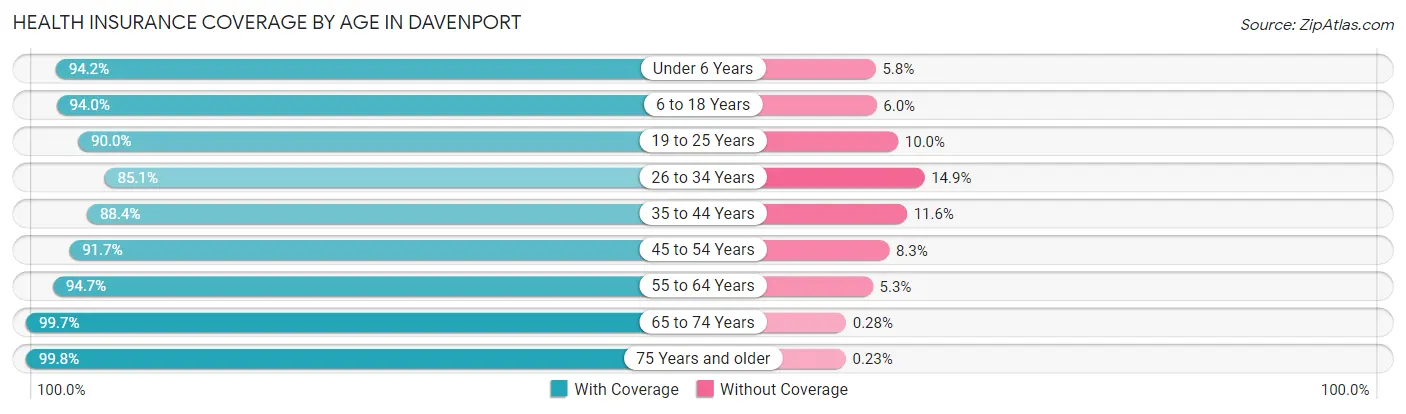
| Age Bracket | With Coverage | Without Coverage |
| Under 6 Years | 7,057 (94.2%) | 436 (5.8%) |
| 6 to 18 Years | 14,448 (94.0%) | 919 (6.0%) |
| 19 to 25 Years | 9,543 (90.0%) | 1,059 (10.0%) |
| 26 to 34 Years | 11,434 (85.1%) | 2,003 (14.9%) |
| 35 to 44 Years | 11,467 (88.4%) | 1,510 (11.6%) |
| 45 to 54 Years | 10,396 (91.7%) | 945 (8.3%) |
| 55 to 64 Years | 12,413 (94.7%) | 692 (5.3%) |
| 65 to 74 Years | 9,669 (99.7%) | 27 (0.3%) |
| 75 Years and older | 6,055 (99.8%) | 14 (0.2%) |
| Total | 92,482 (92.4%) | 7,605 (7.6%) |
Health Insurance Coverage by Citizenship Status in Davenport
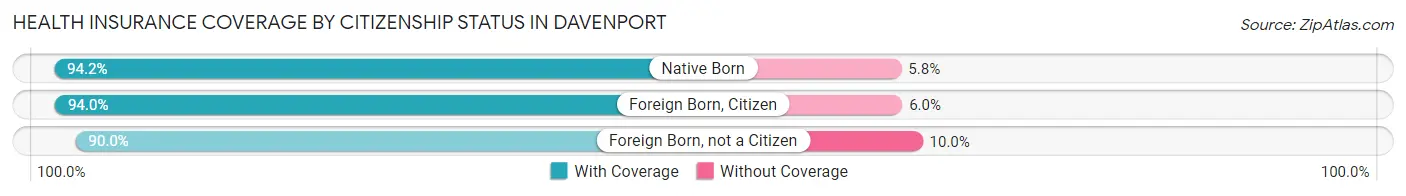
| Citizenship Status | With Coverage | Without Coverage |
| Native Born | 7,057 (94.2%) | 436 (5.8%) |
| Foreign Born, Citizen | 14,448 (94.0%) | 919 (6.0%) |
| Foreign Born, not a Citizen | 9,543 (90.0%) | 1,059 (10.0%) |
Health Insurance Coverage by Household Income in Davenport
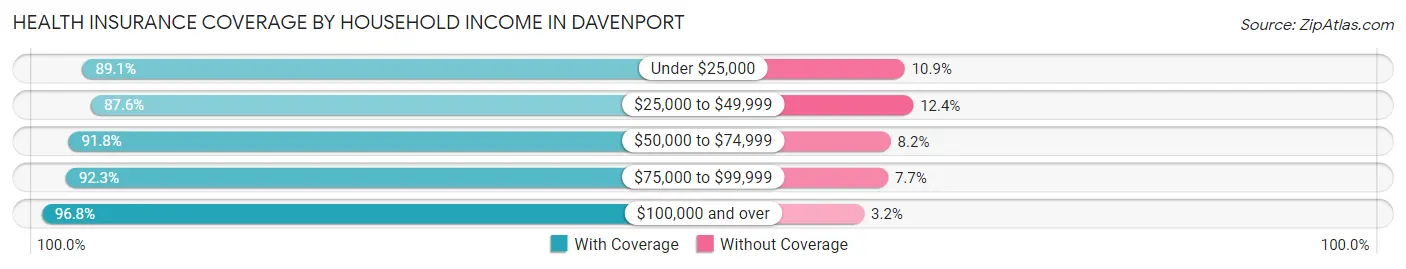
| Household Income | With Coverage | Without Coverage |
| Under $25,000 | 12,047 (89.1%) | 1,468 (10.9%) |
| $25,000 to $49,999 | 16,161 (87.6%) | 2,297 (12.4%) |
| $50,000 to $74,999 | 16,693 (91.8%) | 1,495 (8.2%) |
| $75,000 to $99,999 | 13,417 (92.3%) | 1,123 (7.7%) |
| $100,000 and over | 32,330 (96.8%) | 1,084 (3.2%) |
Public vs Private Health Insurance Coverage by Age in Davenport
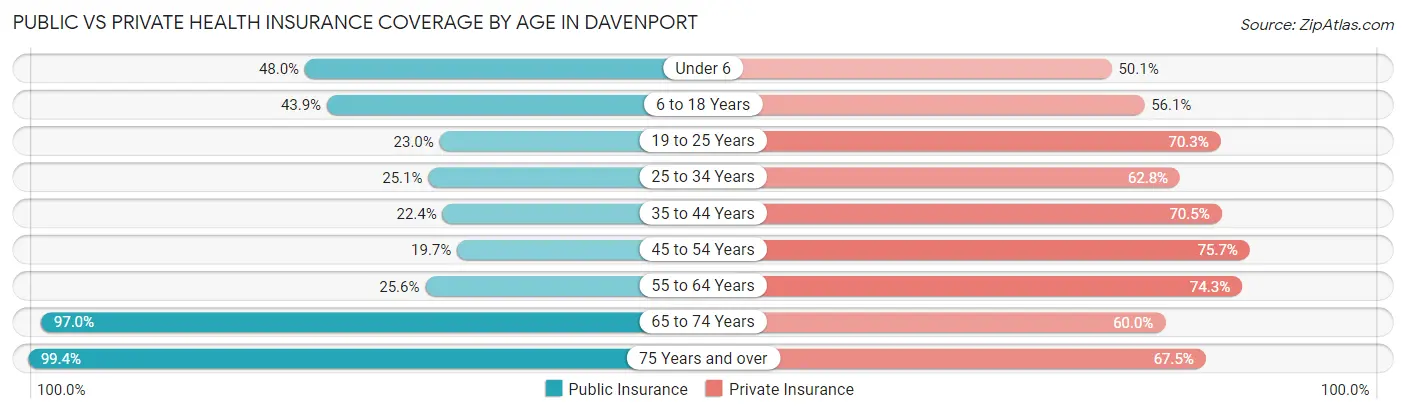
| Age Bracket | Public Insurance | Private Insurance |
| Under 6 | 3,594 (48.0%) | 3,751 (50.1%) |
| 6 to 18 Years | 6,743 (43.9%) | 8,626 (56.1%) |
| 19 to 25 Years | 2,435 (23.0%) | 7,452 (70.3%) |
| 25 to 34 Years | 3,368 (25.1%) | 8,433 (62.8%) |
| 35 to 44 Years | 2,910 (22.4%) | 9,145 (70.5%) |
| 45 to 54 Years | 2,237 (19.7%) | 8,586 (75.7%) |
| 55 to 64 Years | 3,359 (25.6%) | 9,736 (74.3%) |
| 65 to 74 Years | 9,403 (97.0%) | 5,820 (60.0%) |
| 75 Years and over | 6,034 (99.4%) | 4,099 (67.5%) |
| Total | 40,083 (40.1%) | 65,648 (65.6%) |
Disability Status by Sex by Age in Davenport
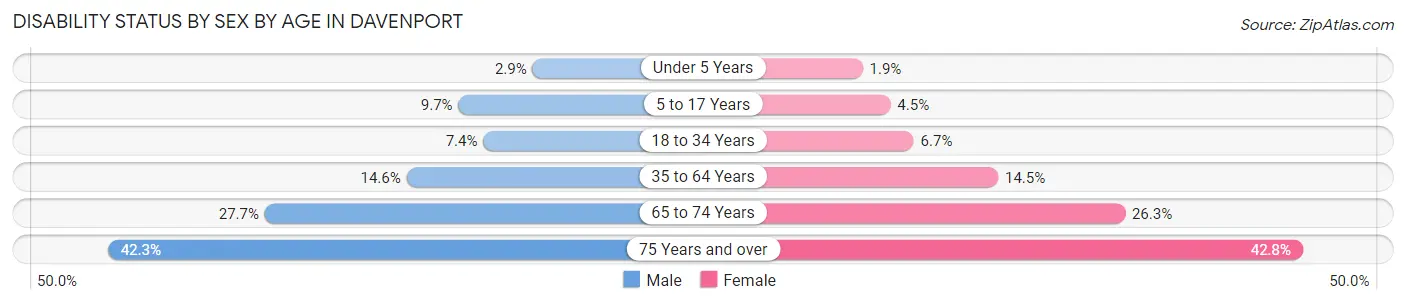
| Age Bracket | Male | Female |
| Under 5 Years | 90 (2.9%) | 62 (1.9%) |
| 5 to 17 Years | 765 (9.7%) | 335 (4.5%) |
| 18 to 34 Years | 935 (7.4%) | 847 (6.7%) |
| 35 to 64 Years | 2,742 (14.5%) | 2,695 (14.5%) |
| 65 to 74 Years | 1,297 (27.7%) | 1,318 (26.3%) |
| 75 Years and over | 1,021 (42.3%) | 1,563 (42.8%) |
Disability Class by Sex by Age in Davenport
Disability Class: Hearing Difficulty
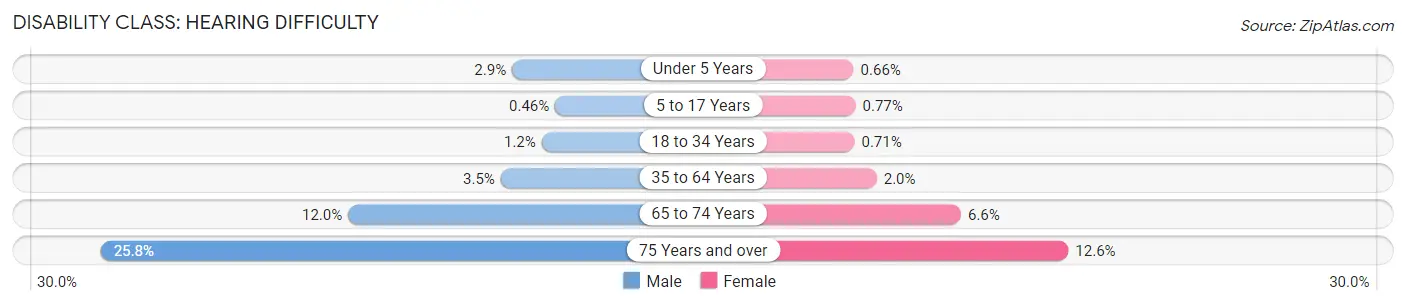
| Age Bracket | Male | Female |
| Under 5 Years | 90 (2.9%) | 21 (0.7%) |
| 5 to 17 Years | 36 (0.5%) | 57 (0.8%) |
| 18 to 34 Years | 152 (1.2%) | 90 (0.7%) |
| 35 to 64 Years | 657 (3.5%) | 363 (1.9%) |
| 65 to 74 Years | 561 (12.0%) | 333 (6.6%) |
| 75 Years and over | 622 (25.8%) | 461 (12.6%) |
Disability Class: Vision Difficulty
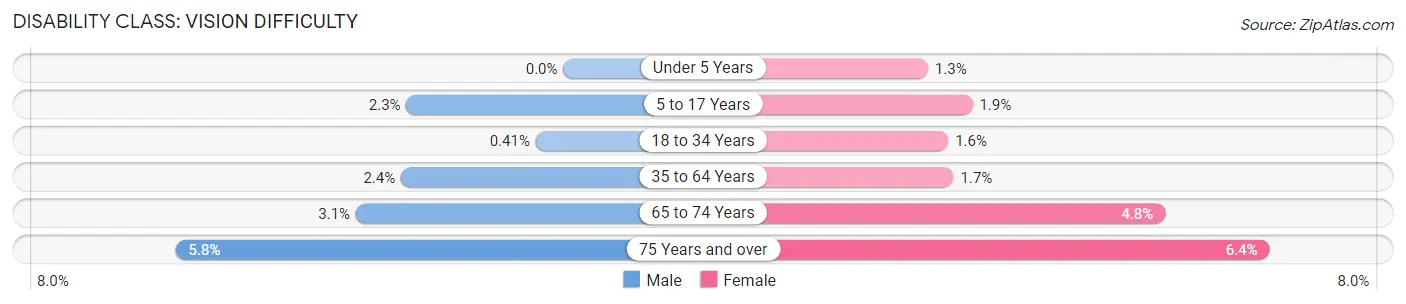
| Age Bracket | Male | Female |
| Under 5 Years | 0 (0.0%) | 41 (1.3%) |
| 5 to 17 Years | 183 (2.3%) | 144 (1.9%) |
| 18 to 34 Years | 52 (0.4%) | 200 (1.6%) |
| 35 to 64 Years | 454 (2.4%) | 308 (1.7%) |
| 65 to 74 Years | 144 (3.1%) | 241 (4.8%) |
| 75 Years and over | 139 (5.8%) | 232 (6.4%) |
Disability Class: Cognitive Difficulty
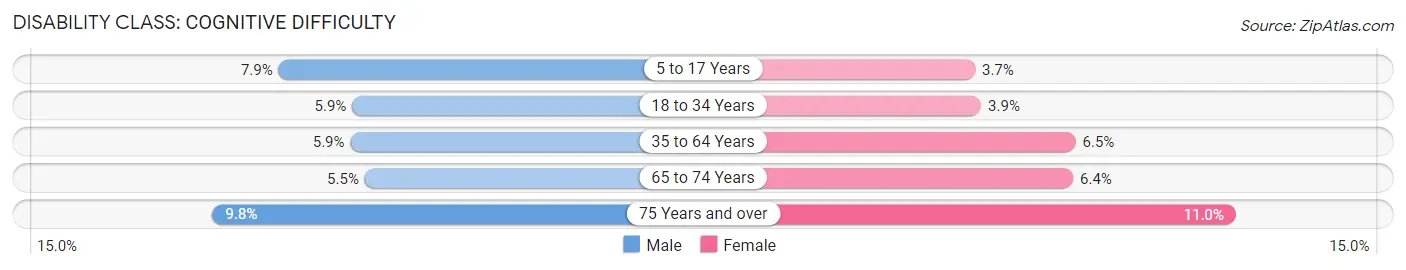
| Age Bracket | Male | Female |
| 5 to 17 Years | 623 (7.9%) | 275 (3.7%) |
| 18 to 34 Years | 739 (5.9%) | 493 (3.9%) |
| 35 to 64 Years | 1,117 (5.9%) | 1,209 (6.5%) |
| 65 to 74 Years | 259 (5.5%) | 323 (6.4%) |
| 75 Years and over | 236 (9.8%) | 401 (11.0%) |
Disability Class: Ambulatory Difficulty
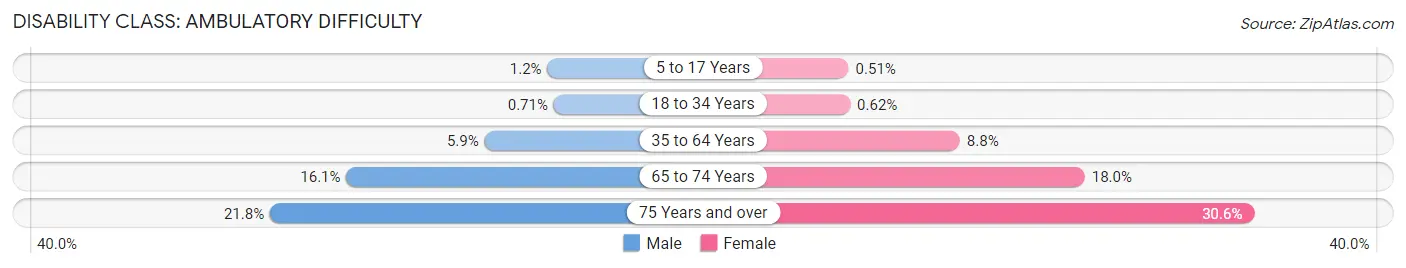
| Age Bracket | Male | Female |
| 5 to 17 Years | 93 (1.2%) | 38 (0.5%) |
| 18 to 34 Years | 89 (0.7%) | 79 (0.6%) |
| 35 to 64 Years | 1,103 (5.9%) | 1,630 (8.8%) |
| 65 to 74 Years | 754 (16.1%) | 905 (18.0%) |
| 75 Years and over | 526 (21.8%) | 1,119 (30.6%) |
Disability Class: Self-Care Difficulty
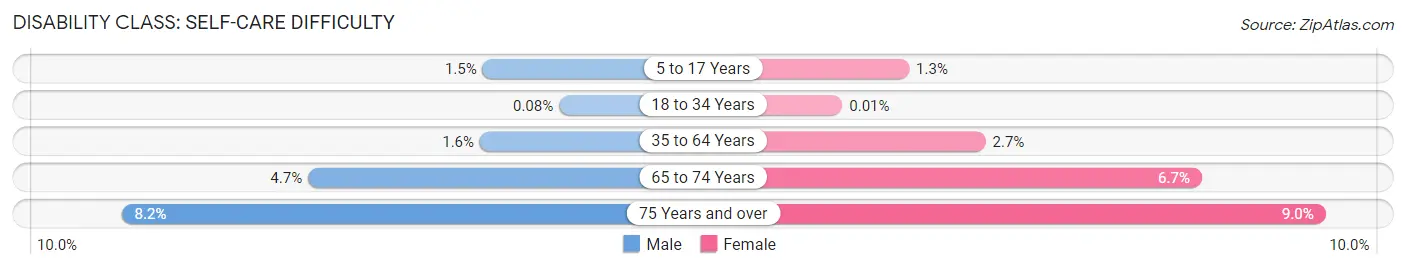
| Age Bracket | Male | Female |
| 5 to 17 Years | 118 (1.5%) | 93 (1.3%) |
| 18 to 34 Years | 10 (0.1%) | 1 (0.0%) |
| 35 to 64 Years | 292 (1.5%) | 497 (2.7%) |
| 65 to 74 Years | 222 (4.7%) | 335 (6.7%) |
| 75 Years and over | 198 (8.2%) | 328 (9.0%) |
Technology Access in Davenport
Computing Device Access in Davenport
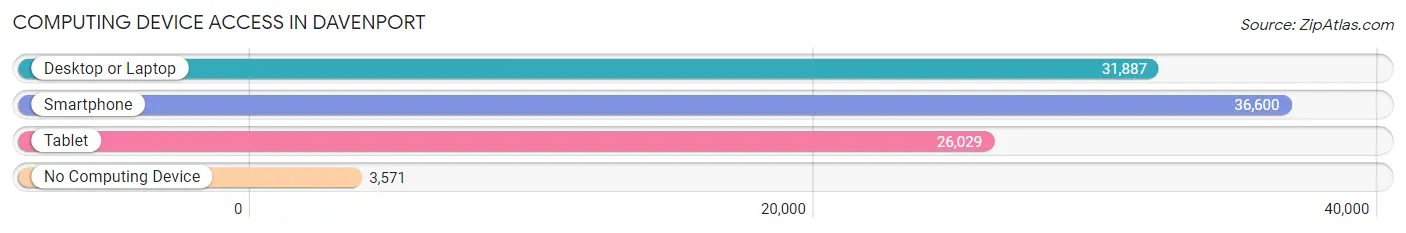
| Device Type | # Households | % Households |
| Desktop or Laptop | 31,887 | 74.7% |
| Smartphone | 36,600 | 85.8% |
| Tablet | 26,029 | 61.0% |
| No Computing Device | 3,571 | 8.4% |
| Total | 42,667 | 100.0% |
Internet Access in Davenport
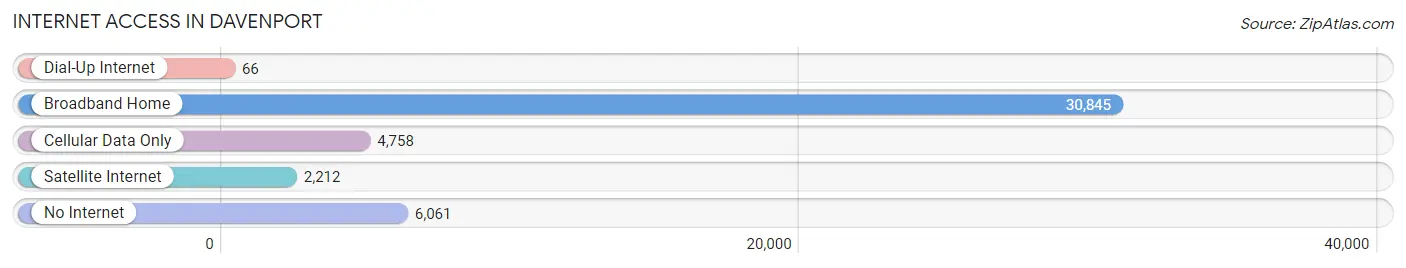
| Internet Type | # Households | % Households |
| Dial-Up Internet | 66 | 0.2% |
| Broadband Home | 30,845 | 72.3% |
| Cellular Data Only | 4,758 | 11.2% |
| Satellite Internet | 2,212 | 5.2% |
| No Internet | 6,061 | 14.2% |
| Total | 42,667 | 100.0% |
Davenport Summary
Davenport, Iowa is a city located in Scott County, Iowa, United States. It is the county seat of Scott County and the largest city in the Quad Cities metropolitan area, which includes the cities of Davenport, Bettendorf, Rock Island, and Moline, Illinois. The population of Davenport was 99,685 in the 2010 census, making it the third-largest city in the state of Iowa.
History
The area that is now Davenport was first settled in 1832 by Antoine LeClaire and his wife, Marguerite. LeClaire had been appointed as the US government's interpreter for the Sauk and Fox tribes in the area. He built a log cabin on the banks of the Mississippi River and named the area "Davenport" after his friend, Colonel George Davenport, a former US Army officer and fur trader.
The city was incorporated in 1839 and quickly grew to become a major port on the Mississippi River. By the late 19th century, Davenport had become a major industrial center, with a variety of factories and businesses. The city was also home to a number of cultural institutions, including the Davenport Public Library, the Figge Art Museum, and the Putnam Museum of History and Natural Science.
Geography
Davenport is located in the heart of the Midwest, on the banks of the Mississippi River. The city is situated on the Iowa-Illinois border, with the Mississippi River forming the western boundary. The city covers an area of 58.2 square miles, with a population density of 1,717 people per square mile.
The city is divided into four distinct neighborhoods: Downtown, East End, West End, and South End. Downtown Davenport is the city's commercial and cultural center, with a variety of shops, restaurants, and entertainment venues. The East End is home to the city's industrial district, while the West End is a residential area. The South End is a mix of residential and commercial areas.
Economy
Davenport's economy is largely based on manufacturing, with a variety of industries located in the city. The city is home to a number of major employers, including Deere & Company, Alcoa, and Kraft Foods. The city is also home to a number of smaller businesses, including a variety of restaurants, retail stores, and service providers.
The city's economy is also supported by tourism, with a variety of attractions, including the Mississippi Riverfront, the Figge Art Museum, and the Putnam Museum of History and Natural Science.
Demographics
As of the 2010 census, the population of Davenport was 99,685. The racial makeup of the city was 79.2% White, 13.3% African American, 0.5% Native American, 2.2% Asian, 0.1% Pacific Islander, 2.3% from other races, and 2.4% from two or more races. Hispanic or Latino of any race were 5.3% of the population.
The median income for a household in the city was $41,945, and the median income for a family was $51,919. The per capita income for the city was $22,945. About 13.2% of families and 17.2% of the population were below the poverty line, including 25.2% of those under age 18 and 8.2% of those age 65 or over.
Common Questions
What is Per Capita Income in Davenport?
Per Capita income in Davenport is $34,702.
What is the Median Family Income in Davenport?
Median Family Income in Davenport is $79,367.
What is the Median Household income in Davenport?
Median Household Income in Davenport is $59,890.
What is Income or Wage Gap in Davenport?
Income or Wage Gap in Davenport is 28.8%.
Women in Davenport earn 71.2 cents for every dollar earned by a man.
What is Family Income Deficit in Davenport?
Family Income Deficit in Davenport is $11,857.
Families that are below poverty line in Davenport earn $11,857 less on average than the poverty threshold level.
What is Inequality or Gini Index in Davenport?
Inequality or Gini Index in Davenport is 0.45.
What is the Total Population of Davenport?
Total Population of Davenport is 101,448.
What is the Total Male Population of Davenport?
Total Male Population of Davenport is 50,222.
What is the Total Female Population of Davenport?
Total Female Population of Davenport is 51,226.
What is the Ratio of Males per 100 Females in Davenport?
There are 98.04 Males per 100 Females in Davenport.
What is the Ratio of Females per 100 Males in Davenport?
There are 102.00 Females per 100 Males in Davenport.
What is the Median Population Age in Davenport?
Median Population Age in Davenport is 37.4 Years.
What is the Average Family Size in Davenport
Average Family Size in Davenport is 3.0 People.
What is the Average Household Size in Davenport
Average Household Size in Davenport is 2.3 People.
How Large is the Labor Force in Davenport?
There are 53,634 People in the Labor Forcein in Davenport.
What is the Percentage of People in the Labor Force in Davenport?
65.3% of People are in the Labor Force in Davenport.
What is the Unemployment Rate in Davenport?
Unemployment Rate in Davenport is 5.0%.