Schleswig, IA Map & Demographics
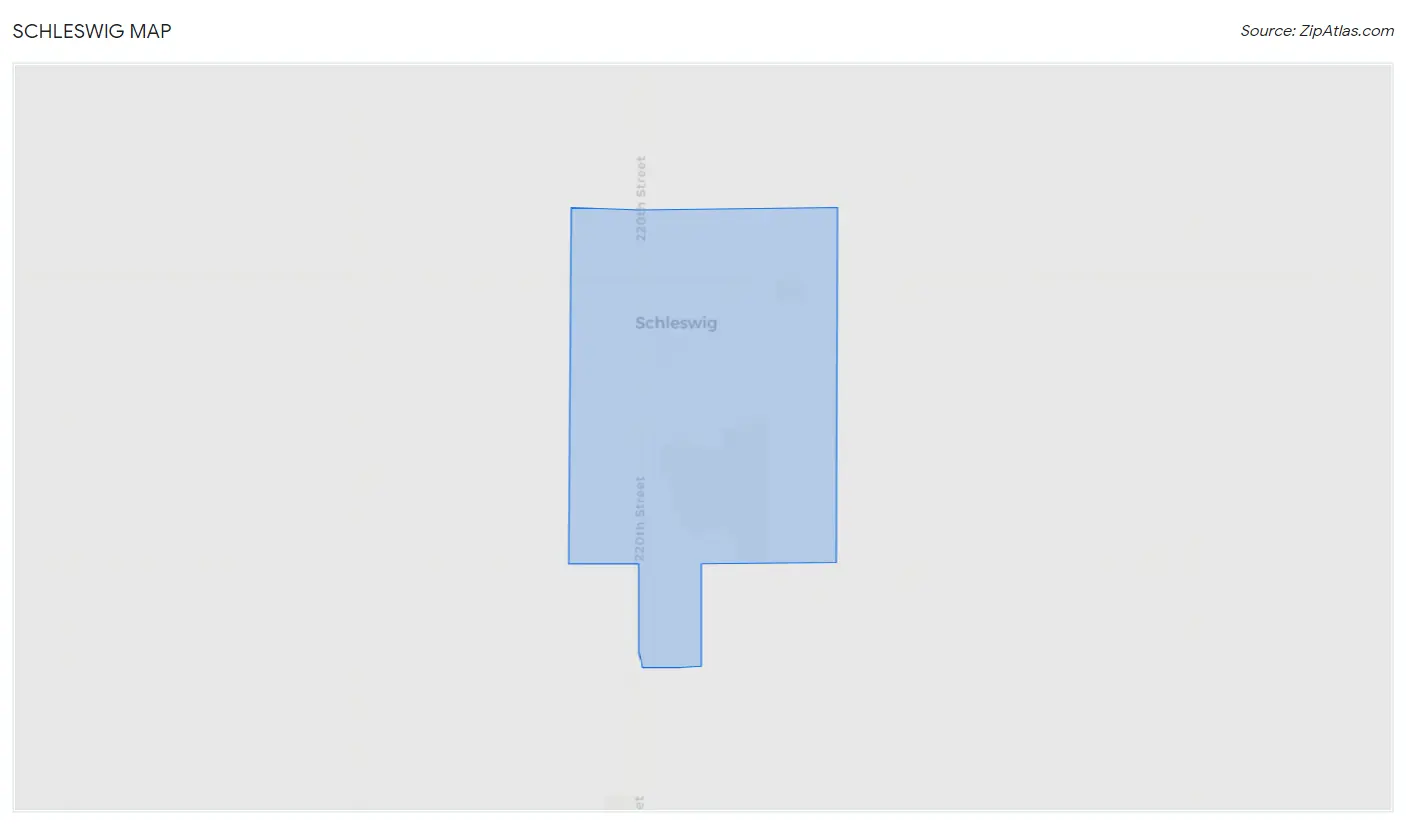
Schleswig Map
Schleswig Overview
$33,607
PER CAPITA INCOME
$69,457
AVG FAMILY INCOME
$68,567
AVG HOUSEHOLD INCOME
4.9%
WAGE / INCOME GAP [ % ]
95.1¢/ $1
WAGE / INCOME GAP [ $ ]
0.43
INEQUALITY / GINI INDEX
933
TOTAL POPULATION
476
MALE POPULATION
457
FEMALE POPULATION
104.16
MALES / 100 FEMALES
96.01
FEMALES / 100 MALES
36.1
MEDIAN AGE
2.8
AVG FAMILY SIZE
2.4
AVG HOUSEHOLD SIZE
507
LABOR FORCE [ PEOPLE ]
68.6%
PERCENT IN LABOR FORCE
4.5%
UNEMPLOYMENT RATE
Schleswig Zip Codes
Schleswig Area Codes
Income in Schleswig
Income Overview in Schleswig
Per Capita Income in Schleswig is $33,607, while median incomes of families and households are $69,457 and $68,567 respectively.
| Characteristic | Number | Measure |
| Per Capita Income | 933 | $33,607 |
| Median Family Income | 266 | $69,457 |
| Mean Family Income | 266 | $84,932 |
| Median Household Income | 397 | $68,567 |
| Mean Household Income | 397 | $76,831 |
| Income Deficit | 266 | $0 |
| Wage / Income Gap (%) | 933 | 4.86% |
| Wage / Income Gap ($) | 933 | 95.14¢ per $1 |
| Gini / Inequality Index | 933 | 0.43 |
Earnings by Sex in Schleswig
Average Earnings in Schleswig are $44,563, $45,000 for men and $42,813 for women, a difference of 4.9%.
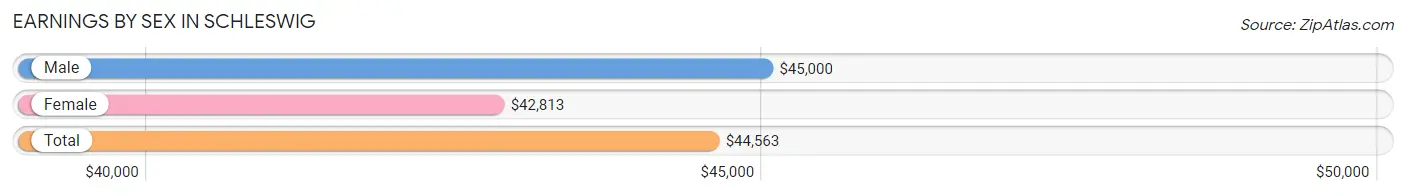
| Sex | Number | Average Earnings |
| Male | 266 (52.0%) | $45,000 |
| Female | 245 (47.9%) | $42,813 |
| Total | 511 (100.0%) | $44,563 |
Earnings by Sex by Income Bracket in Schleswig
The most common earnings brackets in Schleswig are $5,000 to $7,499 for men (35 | 13.2%) and $65,000 to $74,999 for women (37 | 15.1%).
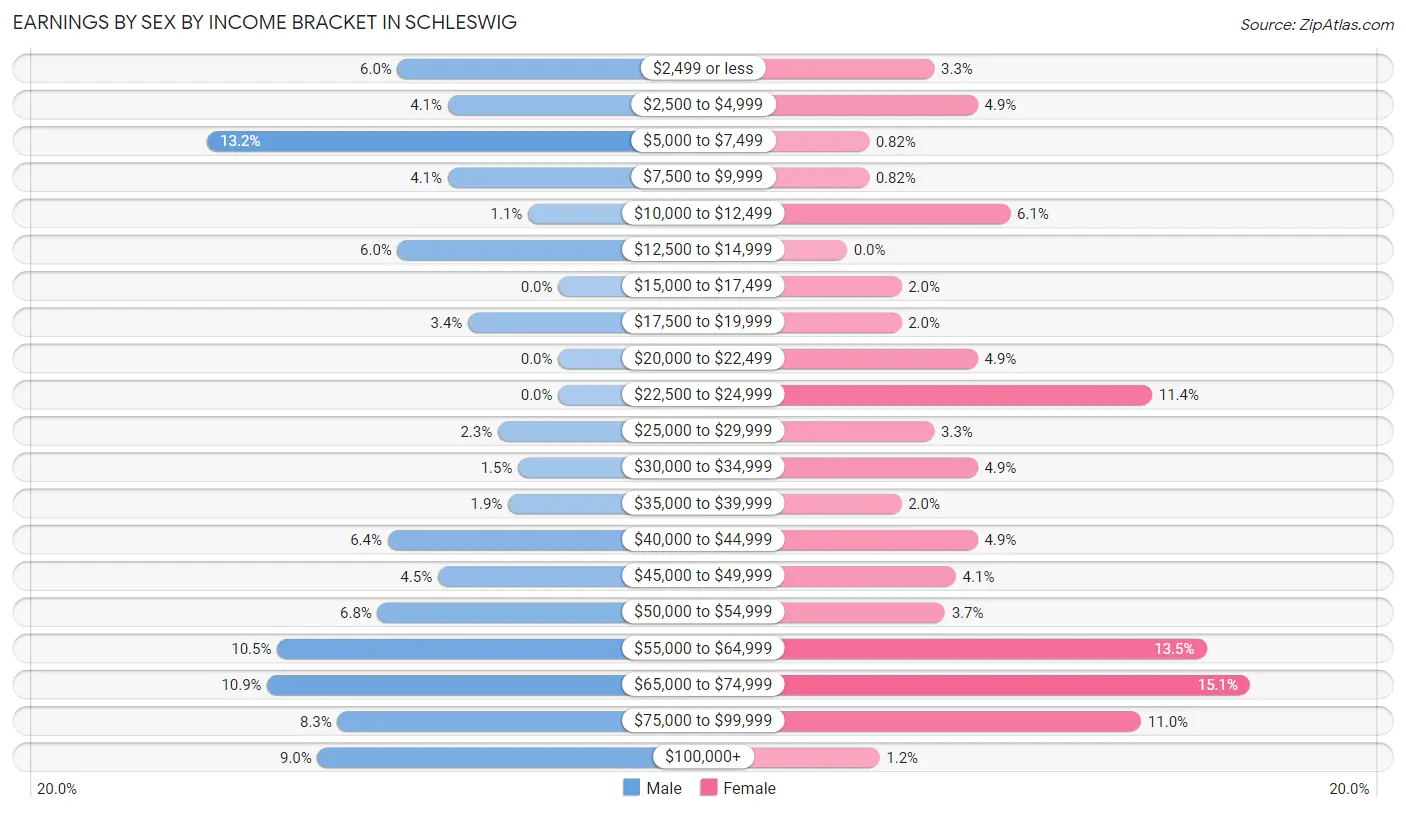
| Income | Male | Female |
| $2,499 or less | 16 (6.0%) | 8 (3.3%) |
| $2,500 to $4,999 | 11 (4.1%) | 12 (4.9%) |
| $5,000 to $7,499 | 35 (13.2%) | 2 (0.8%) |
| $7,500 to $9,999 | 11 (4.1%) | 2 (0.8%) |
| $10,000 to $12,499 | 3 (1.1%) | 15 (6.1%) |
| $12,500 to $14,999 | 16 (6.0%) | 0 (0.0%) |
| $15,000 to $17,499 | 0 (0.0%) | 5 (2.0%) |
| $17,500 to $19,999 | 9 (3.4%) | 5 (2.0%) |
| $20,000 to $22,499 | 0 (0.0%) | 12 (4.9%) |
| $22,500 to $24,999 | 0 (0.0%) | 28 (11.4%) |
| $25,000 to $29,999 | 6 (2.3%) | 8 (3.3%) |
| $30,000 to $34,999 | 4 (1.5%) | 12 (4.9%) |
| $35,000 to $39,999 | 5 (1.9%) | 5 (2.0%) |
| $40,000 to $44,999 | 17 (6.4%) | 12 (4.9%) |
| $45,000 to $49,999 | 12 (4.5%) | 10 (4.1%) |
| $50,000 to $54,999 | 18 (6.8%) | 9 (3.7%) |
| $55,000 to $64,999 | 28 (10.5%) | 33 (13.5%) |
| $65,000 to $74,999 | 29 (10.9%) | 37 (15.1%) |
| $75,000 to $99,999 | 22 (8.3%) | 27 (11.0%) |
| $100,000+ | 24 (9.0%) | 3 (1.2%) |
| Total | 266 (100.0%) | 245 (100.0%) |
Earnings by Sex by Educational Attainment in Schleswig
Average earnings in Schleswig are $50,417 for men and $50,208 for women, a difference of 0.4%. Men with an educational attainment of less than high school enjoy the highest average annual earnings of $68,098, while those with high school diploma education earn the least with $43,942. Women with an educational attainment of graduate degree earn the most with the average annual earnings of $69,766, while those with high school diploma education have the smallest earnings of $23,750.
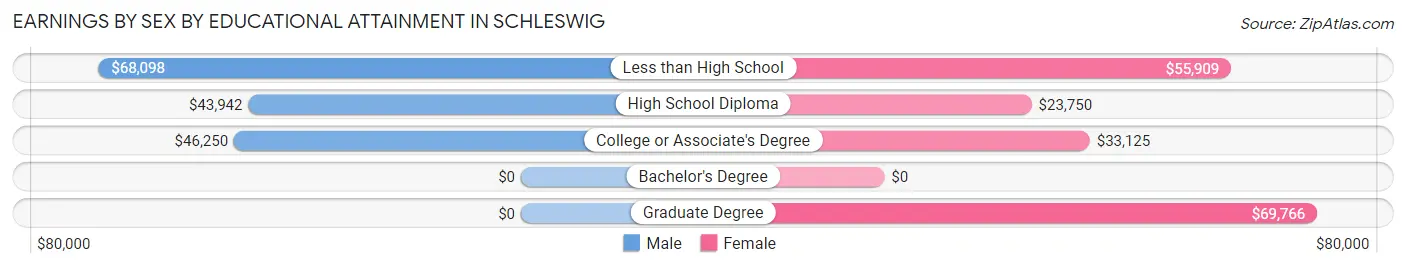
| Educational Attainment | Male Income | Female Income |
| Less than High School | $68,098 | $55,909 |
| High School Diploma | $43,942 | $23,750 |
| College or Associate's Degree | $46,250 | $33,125 |
| Bachelor's Degree | - | - |
| Graduate Degree | - | - |
| Total | $50,417 | $50,208 |
Family Income in Schleswig
Family Income Brackets in Schleswig
According to the Schleswig family income data, there are 64 families falling into the $50,000 to $74,999 income range, which is the most common income bracket and makes up 24.1% of all families.
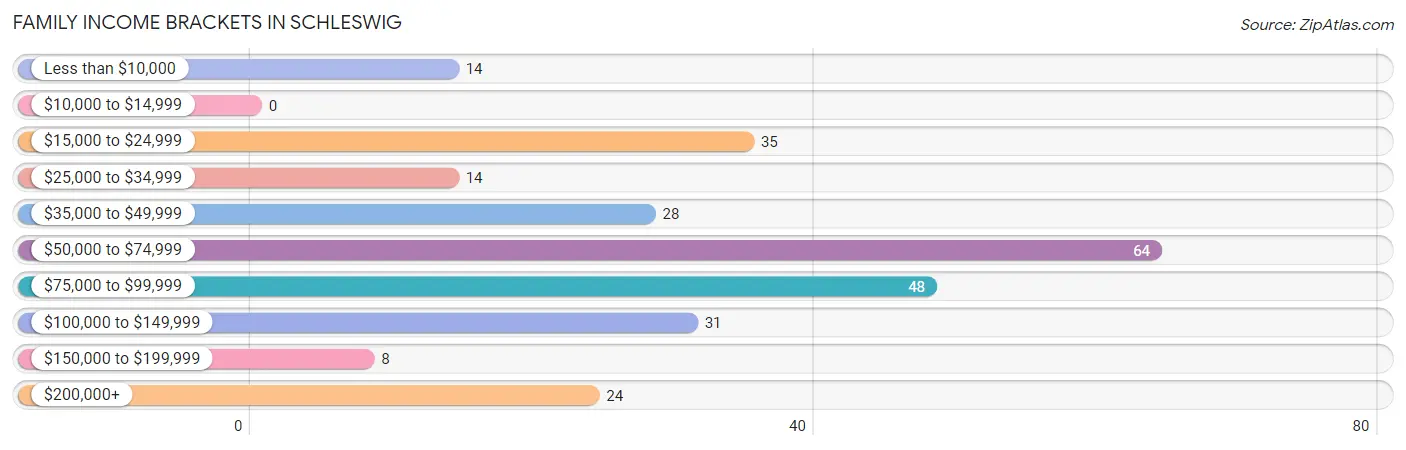
| Income Bracket | # Families | % Families |
| Less than $10,000 | 14 | 5.3% |
| $10,000 to $14,999 | 0 | 0.0% |
| $15,000 to $24,999 | 35 | 13.2% |
| $25,000 to $34,999 | 14 | 5.3% |
| $35,000 to $49,999 | 28 | 10.5% |
| $50,000 to $74,999 | 64 | 24.1% |
| $75,000 to $99,999 | 48 | 18.0% |
| $100,000 to $149,999 | 31 | 11.7% |
| $150,000 to $199,999 | 8 | 3.0% |
| $200,000+ | 24 | 9.0% |
Family Income by Famaliy Size in Schleswig
4-person families (61 | 22.9%) account for the highest median family income in Schleswig with $99,792 per family, while 2-person families (127 | 47.7%) have the highest median income of $29,125 per family member.
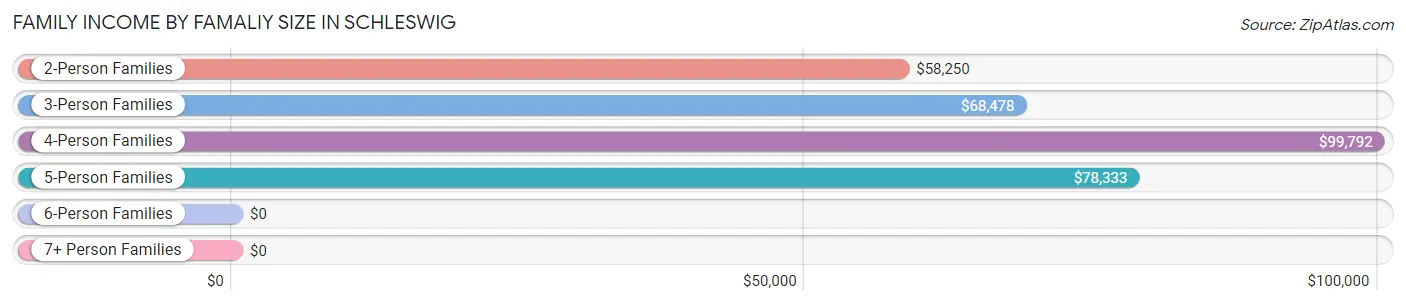
| Income Bracket | # Families | Median Income |
| 2-Person Families | 127 (47.7%) | $58,250 |
| 3-Person Families | 58 (21.8%) | $68,478 |
| 4-Person Families | 61 (22.9%) | $99,792 |
| 5-Person Families | 20 (7.5%) | $78,333 |
| 6-Person Families | 0 (0.0%) | $0 |
| 7+ Person Families | 0 (0.0%) | $0 |
| Total | 266 (100.0%) | $69,457 |
Family Income by Number of Earners in Schleswig
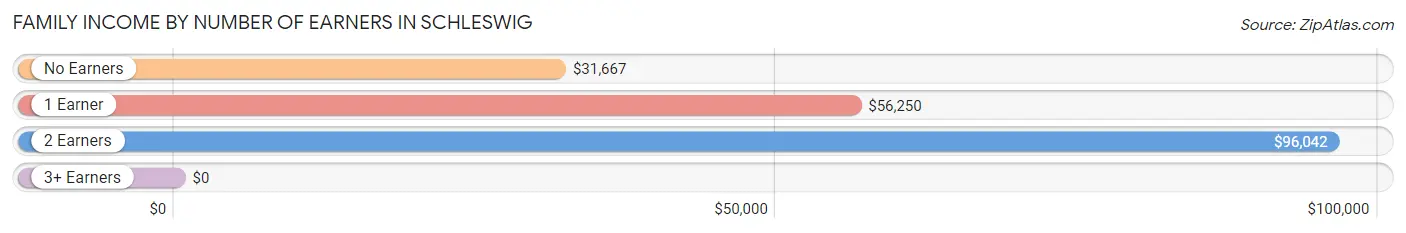
| Number of Earners | # Families | Median Income |
| No Earners | 48 (18.0%) | $31,667 |
| 1 Earner | 83 (31.2%) | $56,250 |
| 2 Earners | 97 (36.5%) | $96,042 |
| 3+ Earners | 38 (14.3%) | $0 |
| Total | 266 (100.0%) | $69,457 |
Household Income in Schleswig
Household Income Brackets in Schleswig
With 89 households falling in the category, the $50,000 to $74,999 income range is the most frequent in Schleswig, accounting for 22.4% of all households. In contrast, only 9 households (2.3%) fall into the $150,000 to $199,999 income bracket, making it the least populous group.
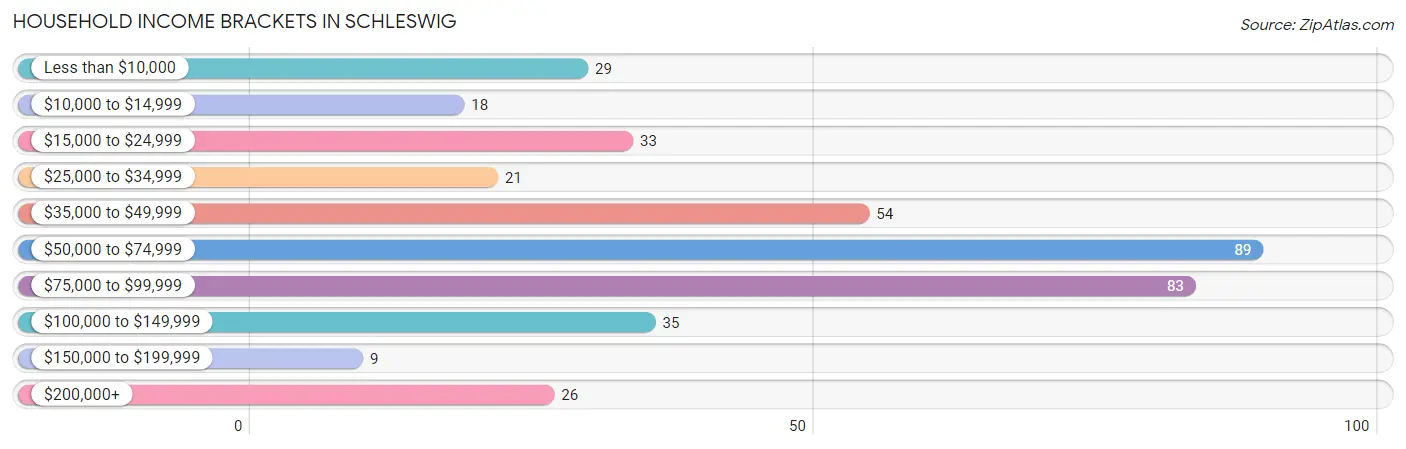
| Income Bracket | # Households | % Households |
| Less than $10,000 | 29 | 7.3% |
| $10,000 to $14,999 | 18 | 4.5% |
| $15,000 to $24,999 | 33 | 8.3% |
| $25,000 to $34,999 | 21 | 5.3% |
| $35,000 to $49,999 | 54 | 13.6% |
| $50,000 to $74,999 | 89 | 22.4% |
| $75,000 to $99,999 | 83 | 20.9% |
| $100,000 to $149,999 | 35 | 8.8% |
| $150,000 to $199,999 | 9 | 2.3% |
| $200,000+ | 26 | 6.5% |
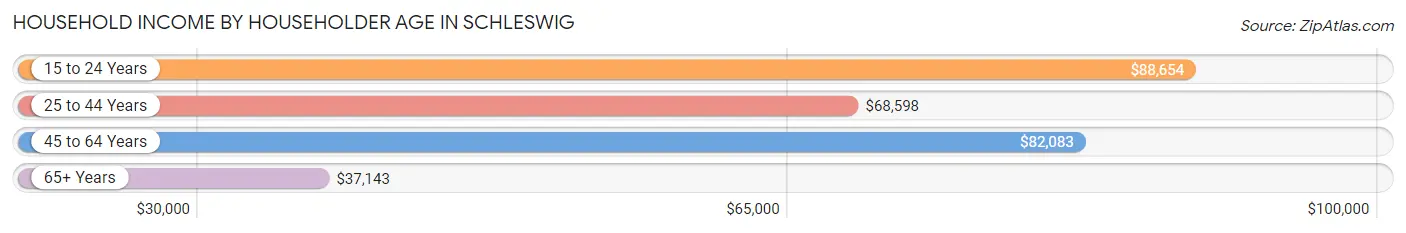
Household Income by Householder Age in Schleswig
The median household income in Schleswig is $68,567, with the highest median household income of $88,654 found in the 15 to 24 years age bracket for the primary householder. A total of 18 households (4.5%) fall into this category. Meanwhile, the 65+ years age bracket for the primary householder has the lowest median household income of $37,143, with 94 households (23.7%) in this group.
| Income Bracket | # Households | Median Income |
| 15 to 24 Years | 18 (4.5%) | $88,654 |
| 25 to 44 Years | 140 (35.3%) | $68,598 |
| 45 to 64 Years | 145 (36.5%) | $82,083 |
| 65+ Years | 94 (23.7%) | $37,143 |
| Total | 397 (100.0%) | $68,567 |
Poverty in Schleswig
Income Below Poverty by Sex and Age in Schleswig
With 13.5% poverty level for males and 14.7% for females among the residents of Schleswig, 6 to 11 year old males and 5 year old females are the most vulnerable to poverty, with 7 males (46.7%) and 1 females (100.0%) in their respective age groups living below the poverty level.
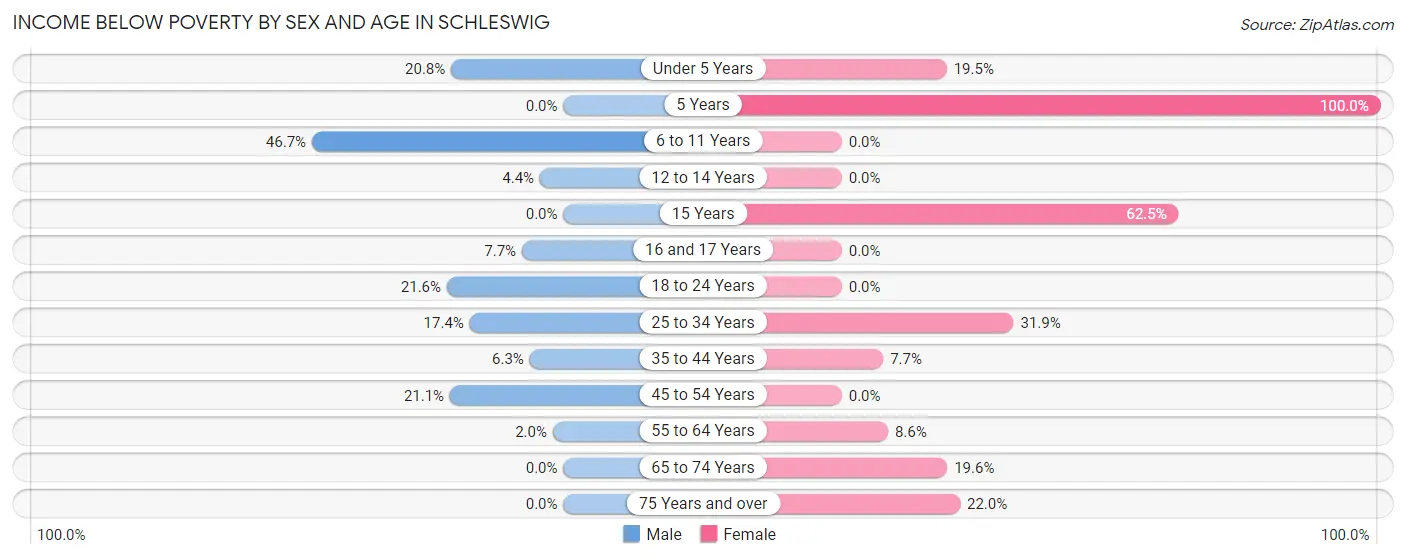
| Age Bracket | Male | Female |
| Under 5 Years | 10 (20.8%) | 15 (19.5%) |
| 5 Years | 0 (0.0%) | 1 (100.0%) |
| 6 to 11 Years | 7 (46.7%) | 0 (0.0%) |
| 12 to 14 Years | 1 (4.3%) | 0 (0.0%) |
| 15 Years | 0 (0.0%) | 5 (62.5%) |
| 16 and 17 Years | 1 (7.7%) | 0 (0.0%) |
| 18 to 24 Years | 16 (21.6%) | 0 (0.0%) |
| 25 to 34 Years | 8 (17.4%) | 22 (31.9%) |
| 35 to 44 Years | 4 (6.2%) | 3 (7.7%) |
| 45 to 54 Years | 16 (21.0%) | 0 (0.0%) |
| 55 to 64 Years | 1 (2.0%) | 3 (8.6%) |
| 65 to 74 Years | 0 (0.0%) | 9 (19.6%) |
| 75 Years and over | 0 (0.0%) | 9 (22.0%) |
| Total | 64 (13.5%) | 67 (14.7%) |
Income Above Poverty by Sex and Age in Schleswig
According to the poverty statistics in Schleswig, males aged 5 years and females aged 6 to 11 years are the age groups that are most secure financially, with 100.0% of males and 100.0% of females in these age groups living above the poverty line.
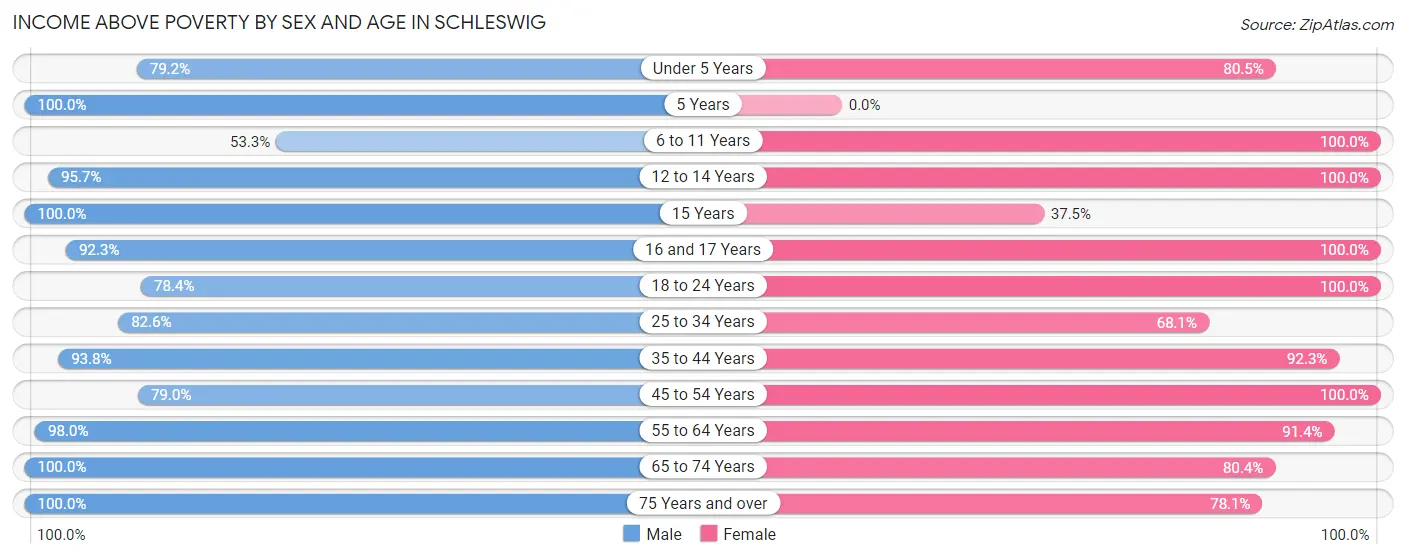
| Age Bracket | Male | Female |
| Under 5 Years | 38 (79.2%) | 62 (80.5%) |
| 5 Years | 3 (100.0%) | 0 (0.0%) |
| 6 to 11 Years | 8 (53.3%) | 15 (100.0%) |
| 12 to 14 Years | 22 (95.7%) | 2 (100.0%) |
| 15 Years | 2 (100.0%) | 3 (37.5%) |
| 16 and 17 Years | 12 (92.3%) | 13 (100.0%) |
| 18 to 24 Years | 58 (78.4%) | 35 (100.0%) |
| 25 to 34 Years | 38 (82.6%) | 47 (68.1%) |
| 35 to 44 Years | 60 (93.8%) | 36 (92.3%) |
| 45 to 54 Years | 60 (78.9%) | 76 (100.0%) |
| 55 to 64 Years | 50 (98.0%) | 32 (91.4%) |
| 65 to 74 Years | 29 (100.0%) | 37 (80.4%) |
| 75 Years and over | 32 (100.0%) | 32 (78.0%) |
| Total | 412 (86.6%) | 390 (85.3%) |
Income Below Poverty Among Married-Couple Families in Schleswig
The poverty statistics for married-couple families in Schleswig show that 5.0% or 9 of the total 181 families live below the poverty line. Families with 3 or 4 children have the highest poverty rate of 11.8%, comprising of 2 families. On the other hand, families with no children have the lowest poverty rate of 0.9%, which includes 1 families.
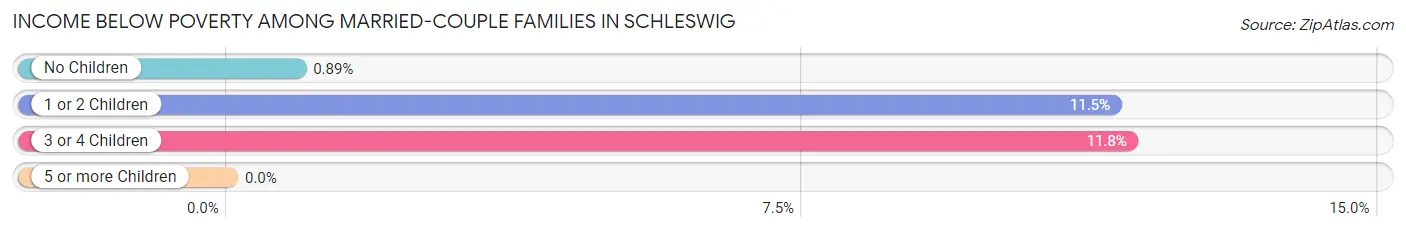
| Children | Above Poverty | Below Poverty |
| No Children | 111 (99.1%) | 1 (0.9%) |
| 1 or 2 Children | 46 (88.5%) | 6 (11.5%) |
| 3 or 4 Children | 15 (88.2%) | 2 (11.8%) |
| 5 or more Children | 0 (0.0%) | 0 (0.0%) |
| Total | 172 (95.0%) | 9 (5.0%) |
Income Below Poverty Among Single-Parent Households in Schleswig
According to the poverty data in Schleswig, 6.5% or 3 single-father households and 25.6% or 10 single-mother households are living below the poverty line. Among single-father households, those with 3 or 4 children have the highest poverty rate, with 3 households (100.0%) experiencing poverty. Likewise, among single-mother households, those with 3 or 4 children have the highest poverty rate, with 10 households (90.9%) falling below the poverty line.
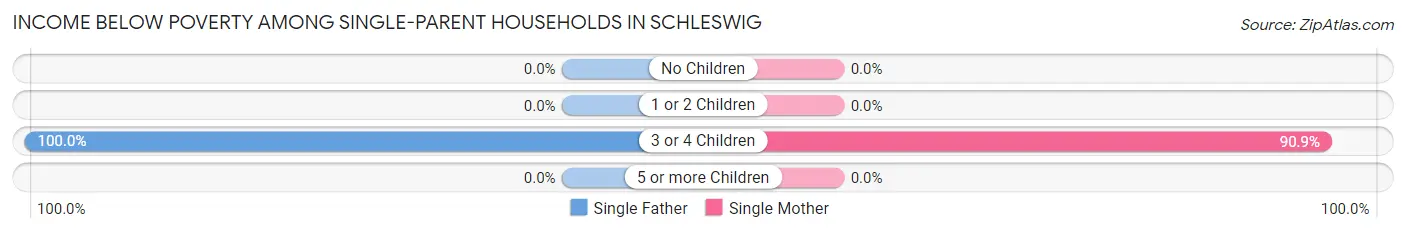
| Children | Single Father | Single Mother |
| No Children | 0 (0.0%) | 0 (0.0%) |
| 1 or 2 Children | 0 (0.0%) | 0 (0.0%) |
| 3 or 4 Children | 3 (100.0%) | 10 (90.9%) |
| 5 or more Children | 0 (0.0%) | 0 (0.0%) |
| Total | 3 (6.5%) | 10 (25.6%) |
Income Below Poverty Among Married-Couple vs Single-Parent Households in Schleswig
The poverty data for Schleswig shows that 9 of the married-couple family households (5.0%) and 13 of the single-parent households (15.3%) are living below the poverty level. Within the married-couple family households, those with 3 or 4 children have the highest poverty rate, with 2 households (11.8%) falling below the poverty line. Among the single-parent households, those with 3 or 4 children have the highest poverty rate, with 13 household (92.9%) living below poverty.
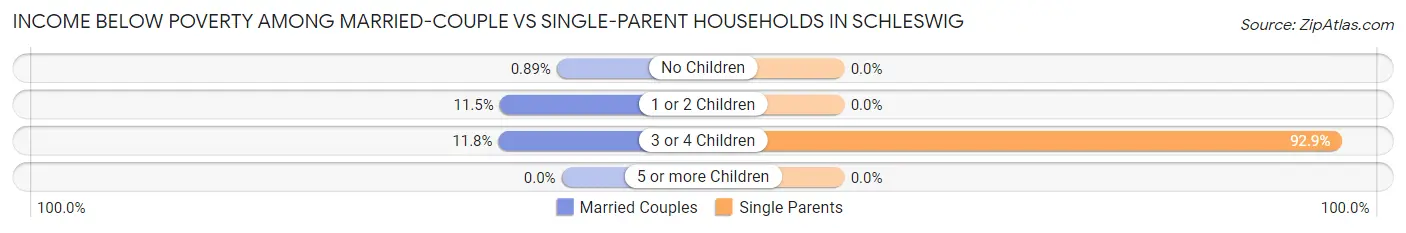
| Children | Married-Couple Families | Single-Parent Households |
| No Children | 1 (0.9%) | 0 (0.0%) |
| 1 or 2 Children | 6 (11.5%) | 0 (0.0%) |
| 3 or 4 Children | 2 (11.8%) | 13 (92.9%) |
| 5 or more Children | 0 (0.0%) | 0 (0.0%) |
| Total | 9 (5.0%) | 13 (15.3%) |
Race in Schleswig
The most populous races in Schleswig are White / Caucasian (684 | 73.3%), Hispanic or Latino (173 | 18.5%), and Two or more Races (149 | 16.0%).
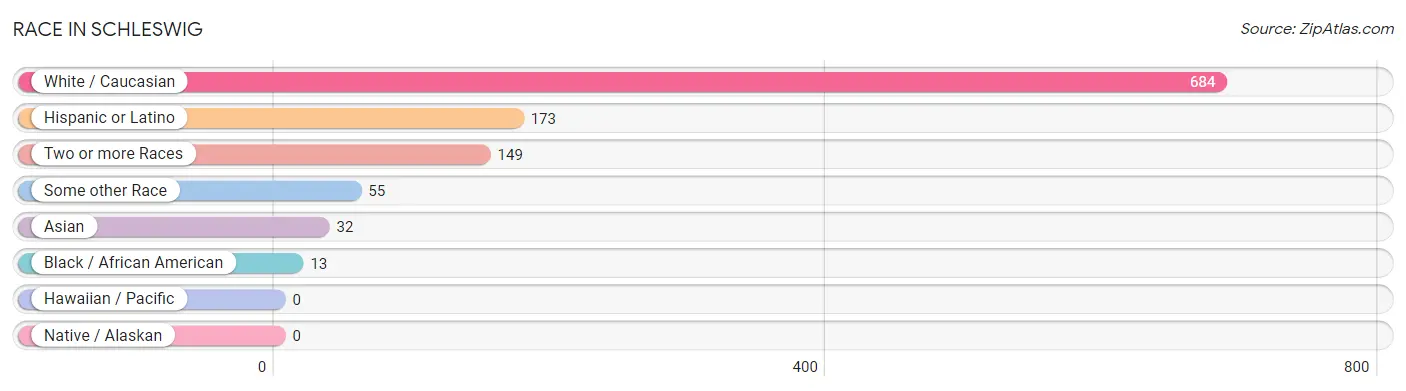
| Race | # Population | % Population |
| Asian | 32 | 3.4% |
| Black / African American | 13 | 1.4% |
| Hawaiian / Pacific | 0 | 0.0% |
| Hispanic or Latino | 173 | 18.5% |
| Native / Alaskan | 0 | 0.0% |
| White / Caucasian | 684 | 73.3% |
| Two or more Races | 149 | 16.0% |
| Some other Race | 55 | 5.9% |
| Total | 933 | 100.0% |
Ancestry in Schleswig
The most populous ancestries reported in Schleswig are German (401 | 43.0%), Mexican (97 | 10.4%), Irish (73 | 7.8%), American (45 | 4.8%), and English (39 | 4.2%), together accounting for 70.2% of all Schleswig residents.
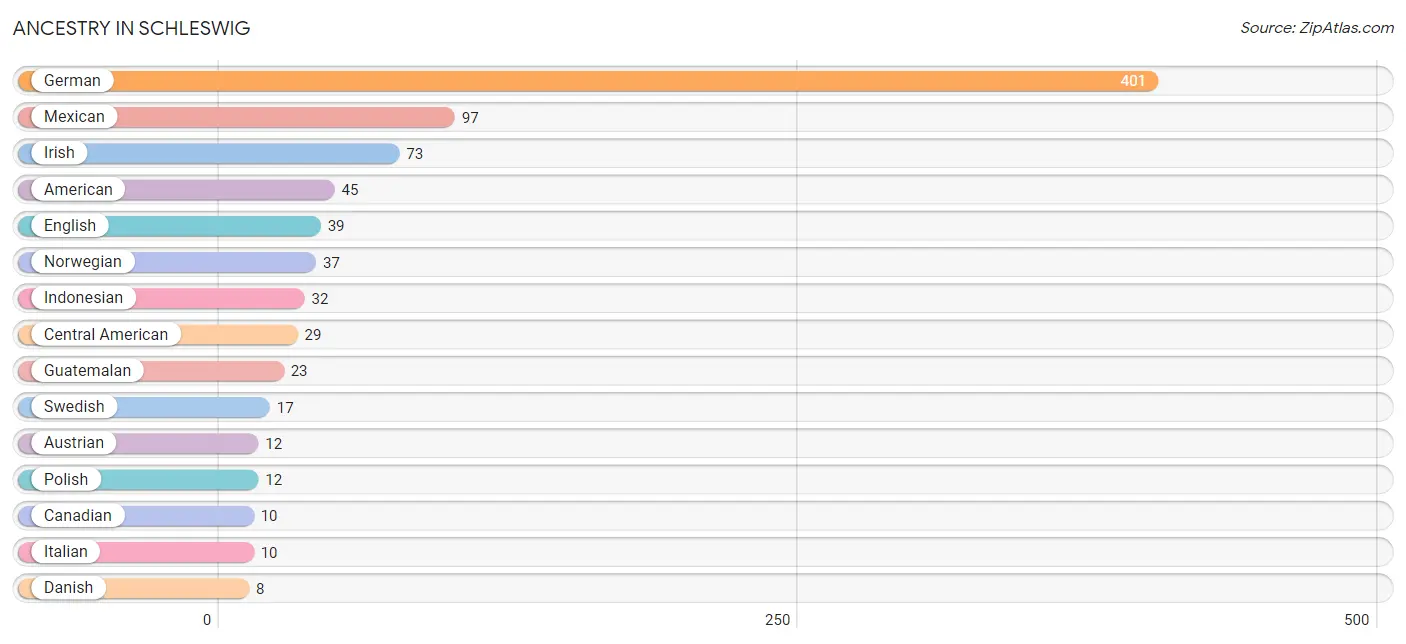
| Ancestry | # Population | % Population |
| American | 45 | 4.8% |
| Austrian | 12 | 1.3% |
| Bhutanese | 2 | 0.2% |
| Canadian | 10 | 1.1% |
| Central American | 29 | 3.1% |
| Czech | 2 | 0.2% |
| Danish | 8 | 0.9% |
| Dutch | 5 | 0.5% |
| English | 39 | 4.2% |
| European | 5 | 0.5% |
| French | 2 | 0.2% |
| French Canadian | 4 | 0.4% |
| German | 401 | 43.0% |
| Guatemalan | 23 | 2.5% |
| Indonesian | 32 | 3.4% |
| Iranian | 3 | 0.3% |
| Irish | 73 | 7.8% |
| Italian | 10 | 1.1% |
| Mexican | 97 | 10.4% |
| Native Hawaiian | 3 | 0.3% |
| Norwegian | 37 | 4.0% |
| Polish | 12 | 1.3% |
| Salvadoran | 6 | 0.6% |
| Scottish | 3 | 0.3% |
| Swedish | 17 | 1.8% |
| Ukrainian | 2 | 0.2% |
| Welsh | 5 | 0.5% | View All 27 Rows |
Immigrants in Schleswig
The most numerous immigrant groups reported in Schleswig came from Central America (54 | 5.8%), Latin America (54 | 5.8%), Mexico (54 | 5.8%), Asia (6 | 0.6%), and South Eastern Asia (6 | 0.6%), together accounting for 18.6% of all Schleswig residents.
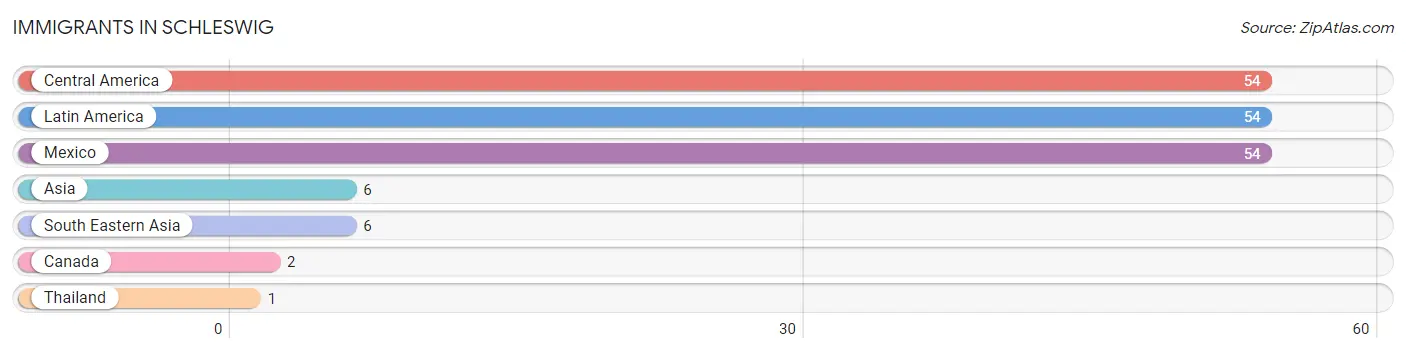
| Immigration Origin | # Population | % Population |
| Asia | 6 | 0.6% |
| Canada | 2 | 0.2% |
| Central America | 54 | 5.8% |
| Latin America | 54 | 5.8% |
| Mexico | 54 | 5.8% |
| South Eastern Asia | 6 | 0.6% |
| Thailand | 1 | 0.1% | View All 7 Rows |
Sex and Age in Schleswig
Sex and Age in Schleswig
The most populous age groups in Schleswig are 15 to 19 Years (49 | 10.3%) for men and Under 5 Years (77 | 16.9%) for women.
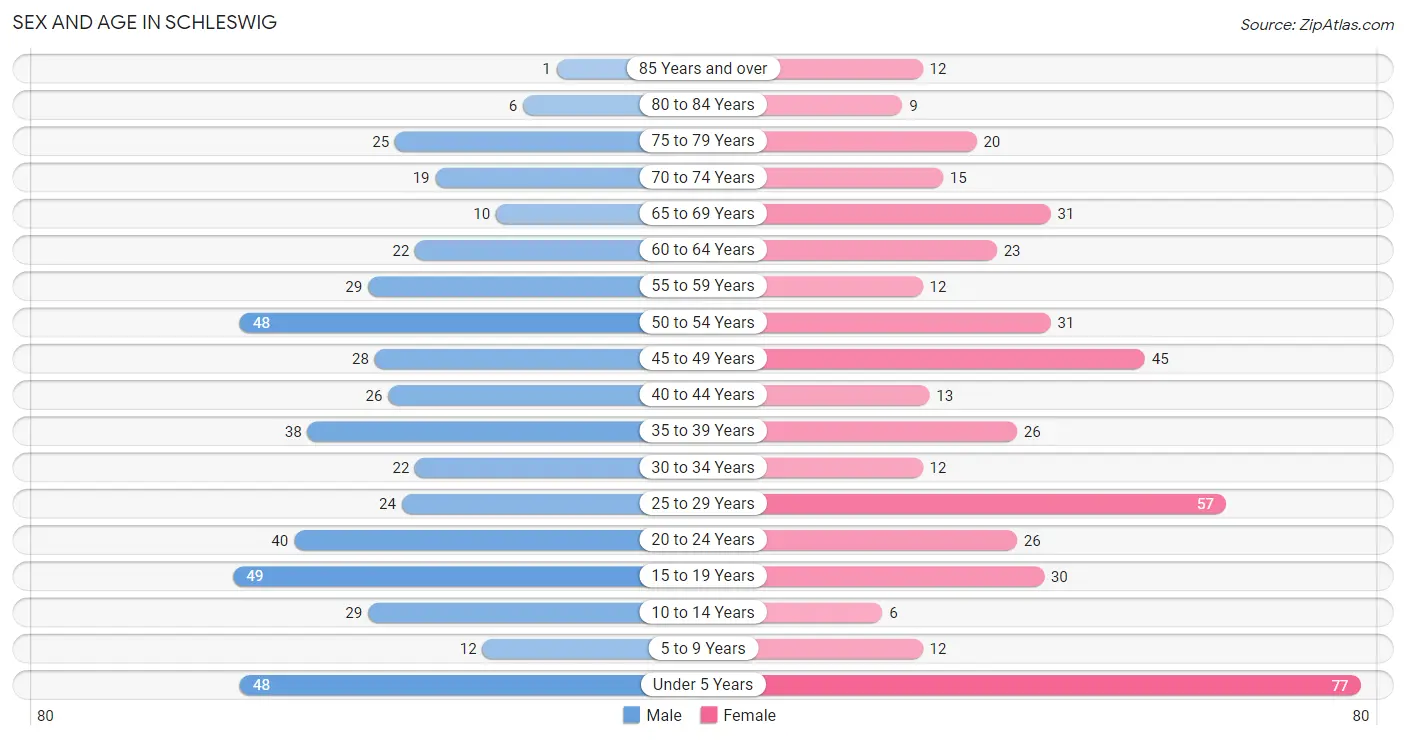
| Age Bracket | Male | Female |
| Under 5 Years | 48 (10.1%) | 77 (16.9%) |
| 5 to 9 Years | 12 (2.5%) | 12 (2.6%) |
| 10 to 14 Years | 29 (6.1%) | 6 (1.3%) |
| 15 to 19 Years | 49 (10.3%) | 30 (6.6%) |
| 20 to 24 Years | 40 (8.4%) | 26 (5.7%) |
| 25 to 29 Years | 24 (5.0%) | 57 (12.5%) |
| 30 to 34 Years | 22 (4.6%) | 12 (2.6%) |
| 35 to 39 Years | 38 (8.0%) | 26 (5.7%) |
| 40 to 44 Years | 26 (5.5%) | 13 (2.8%) |
| 45 to 49 Years | 28 (5.9%) | 45 (9.9%) |
| 50 to 54 Years | 48 (10.1%) | 31 (6.8%) |
| 55 to 59 Years | 29 (6.1%) | 12 (2.6%) |
| 60 to 64 Years | 22 (4.6%) | 23 (5.0%) |
| 65 to 69 Years | 10 (2.1%) | 31 (6.8%) |
| 70 to 74 Years | 19 (4.0%) | 15 (3.3%) |
| 75 to 79 Years | 25 (5.2%) | 20 (4.4%) |
| 80 to 84 Years | 6 (1.3%) | 9 (2.0%) |
| 85 Years and over | 1 (0.2%) | 12 (2.6%) |
| Total | 476 (100.0%) | 457 (100.0%) |
Families and Households in Schleswig
Median Family Size in Schleswig
The median family size in Schleswig is 2.83 persons per family, with married-couple families (181 | 68.0%) accounting for the largest median family size of 3.01 persons per family. On the other hand, single female/mother families (39 | 14.7%) represent the smallest median family size with 2.23 persons per family.
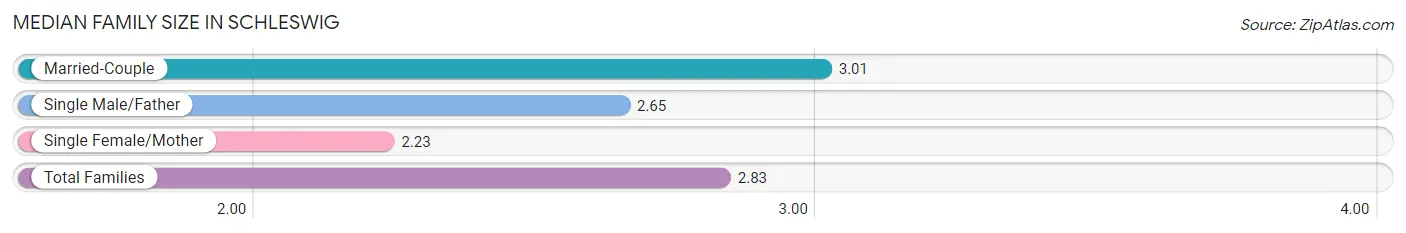
| Family Type | # Families | Family Size |
| Married-Couple | 181 (68.0%) | 3.01 |
| Single Male/Father | 46 (17.3%) | 2.65 |
| Single Female/Mother | 39 (14.7%) | 2.23 |
| Total Families | 266 (100.0%) | 2.83 |
Median Household Size in Schleswig
The median household size in Schleswig is 2.35 persons per household, with married-couple households (181 | 45.6%) accounting for the largest median household size of 3.03 persons per household. non-family households (131 | 33.0%) represent the smallest median household size with 1.15 persons per household.
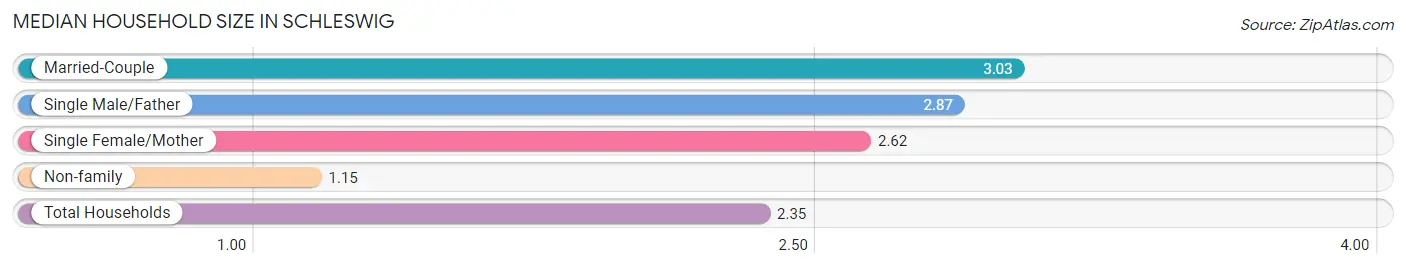
| Household Type | # Households | Household Size |
| Married-Couple | 181 (45.6%) | 3.03 |
| Single Male/Father | 46 (11.6%) | 2.87 |
| Single Female/Mother | 39 (9.8%) | 2.62 |
| Non-family | 131 (33.0%) | 1.15 |
| Total Households | 397 (100.0%) | 2.35 |
Household Size by Marriage Status in Schleswig
Out of a total of 397 households in Schleswig, 266 (67.0%) are family households, while 131 (33.0%) are nonfamily households. The most numerous type of family households are 2-person households, comprising 110, and the most common type of nonfamily households are 1-person households, comprising 115.
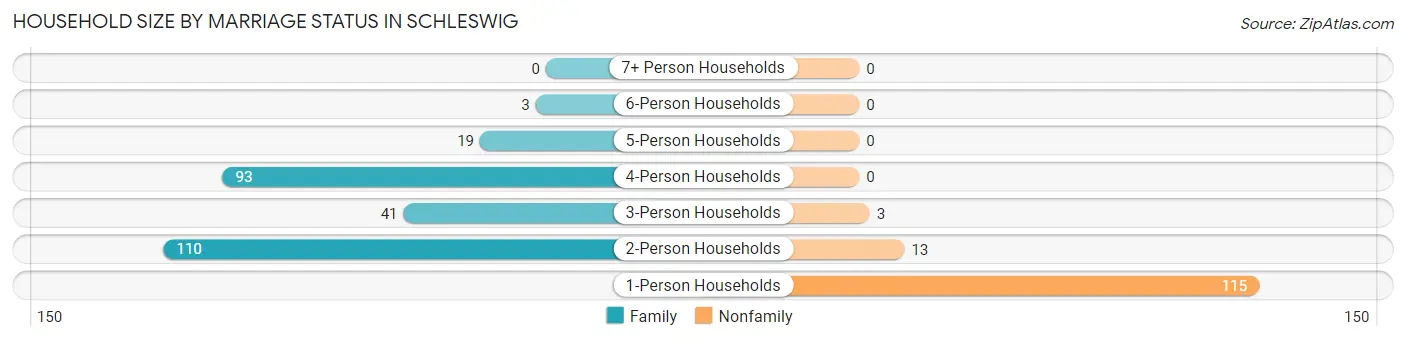
| Household Size | Family Households | Nonfamily Households |
| 1-Person Households | - | 115 (29.0%) |
| 2-Person Households | 110 (27.7%) | 13 (3.3%) |
| 3-Person Households | 41 (10.3%) | 3 (0.8%) |
| 4-Person Households | 93 (23.4%) | 0 (0.0%) |
| 5-Person Households | 19 (4.8%) | 0 (0.0%) |
| 6-Person Households | 3 (0.8%) | 0 (0.0%) |
| 7+ Person Households | 0 (0.0%) | 0 (0.0%) |
| Total | 266 (67.0%) | 131 (33.0%) |
Female Fertility in Schleswig
Fertility by Age in Schleswig
Average fertility rate in Schleswig is 102.0 births per 1,000 women. Women in the age bracket of 20 to 34 years have the highest fertility rate with 189.0 births per 1,000 women. Women in the age bracket of 20 to 34 years acount for 81.8% of all women with births.
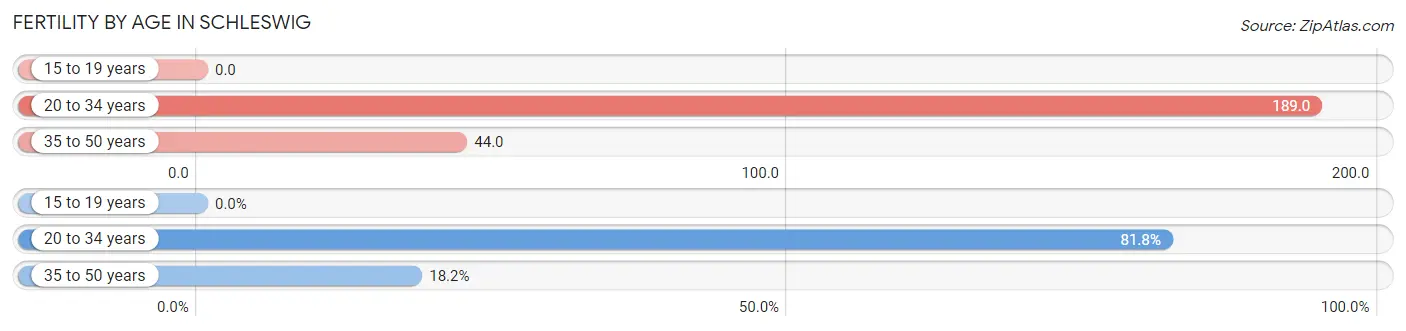
| Age Bracket | Women with Births | Births / 1,000 Women |
| 15 to 19 years | 0 (0.0%) | 0.0 |
| 20 to 34 years | 18 (81.8%) | 189.0 |
| 35 to 50 years | 4 (18.2%) | 44.0 |
| Total | 22 (100.0%) | 102.0 |
Fertility by Age by Marriage Status in Schleswig
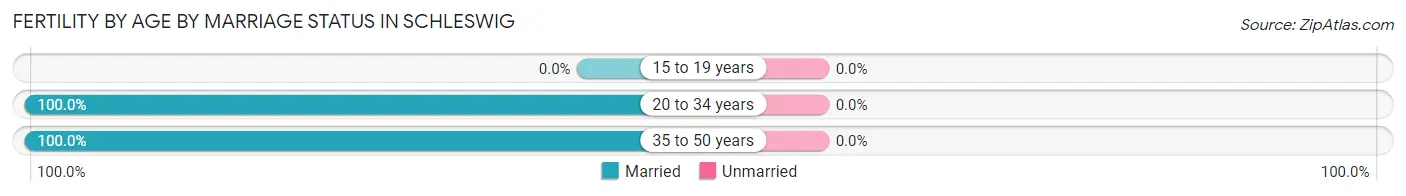
| Age Bracket | Married | Unmarried |
| 15 to 19 years | 0 (0.0%) | 0 (0.0%) |
| 20 to 34 years | 18 (100.0%) | 0 (0.0%) |
| 35 to 50 years | 4 (100.0%) | 0 (0.0%) |
| Total | 22 (100.0%) | 0 (0.0%) |
Fertility by Education in Schleswig
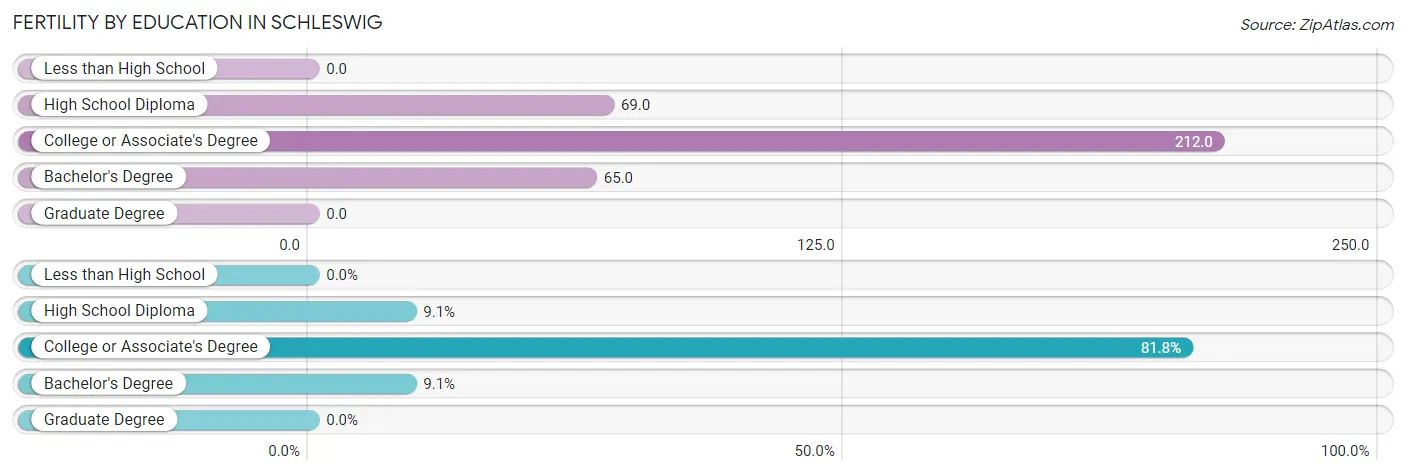
| Educational Attainment | Women with Births | Births / 1,000 Women |
| Less than High School | 0 (0.0%) | 0.0 |
| High School Diploma | 2 (9.1%) | 69.0 |
| College or Associate's Degree | 18 (81.8%) | 212.0 |
| Bachelor's Degree | 2 (9.1%) | 65.0 |
| Graduate Degree | 0 (0.0%) | 0.0 |
| Total | 22 (100.0%) | 102.0 |
Fertility by Education by Marriage Status in Schleswig
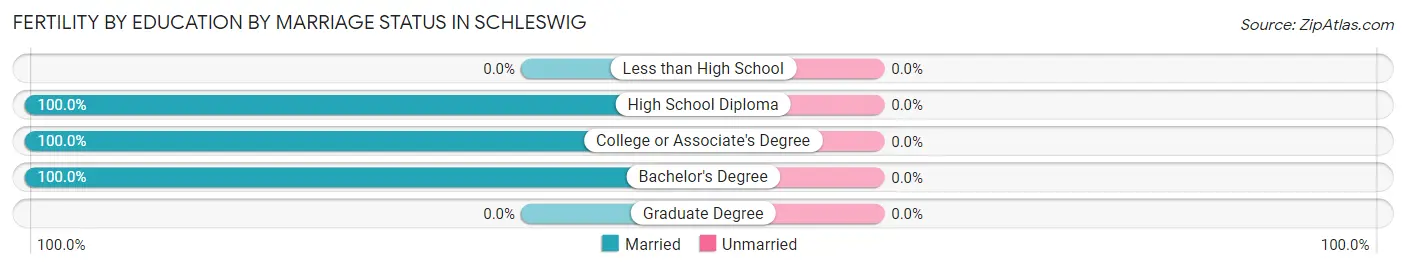
| Educational Attainment | Married | Unmarried |
| Less than High School | 0 (0.0%) | 0 (0.0%) |
| High School Diploma | 2 (100.0%) | 0 (0.0%) |
| College or Associate's Degree | 18 (100.0%) | 0 (0.0%) |
| Bachelor's Degree | 2 (100.0%) | 0 (0.0%) |
| Graduate Degree | 0 (0.0%) | 0 (0.0%) |
| Total | 22 (100.0%) | 0 (0.0%) |
Employment Characteristics in Schleswig
Employment by Class of Employer in Schleswig
Among the 475 employed individuals in Schleswig, private company employees (324 | 68.2%), not-for-profit organizations (56 | 11.8%), and self-employed (not incorporated) (33 | 7.0%) make up the most common classes of employment.
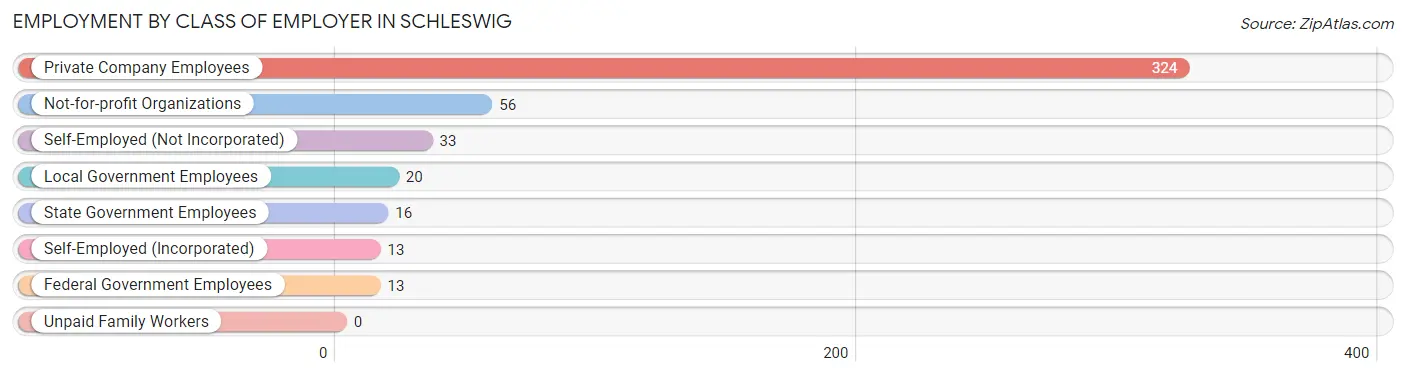
| Employer Class | # Employees | % Employees |
| Private Company Employees | 324 | 68.2% |
| Self-Employed (Incorporated) | 13 | 2.7% |
| Self-Employed (Not Incorporated) | 33 | 7.0% |
| Not-for-profit Organizations | 56 | 11.8% |
| Local Government Employees | 20 | 4.2% |
| State Government Employees | 16 | 3.4% |
| Federal Government Employees | 13 | 2.7% |
| Unpaid Family Workers | 0 | 0.0% |
| Total | 475 | 100.0% |
Employment Status by Age in Schleswig
According to the labor force statistics for Schleswig, out of the total population over 16 years of age (739), 68.6% or 507 individuals are in the labor force, with 4.5% or 23 of them unemployed. The age group with the highest labor force participation rate is 55 to 59 years, with 100.0% or 41 individuals in the labor force. Within the labor force, the 20 to 24 years age range has the highest percentage of unemployed individuals, with 23.8% or 15 of them being unemployed.
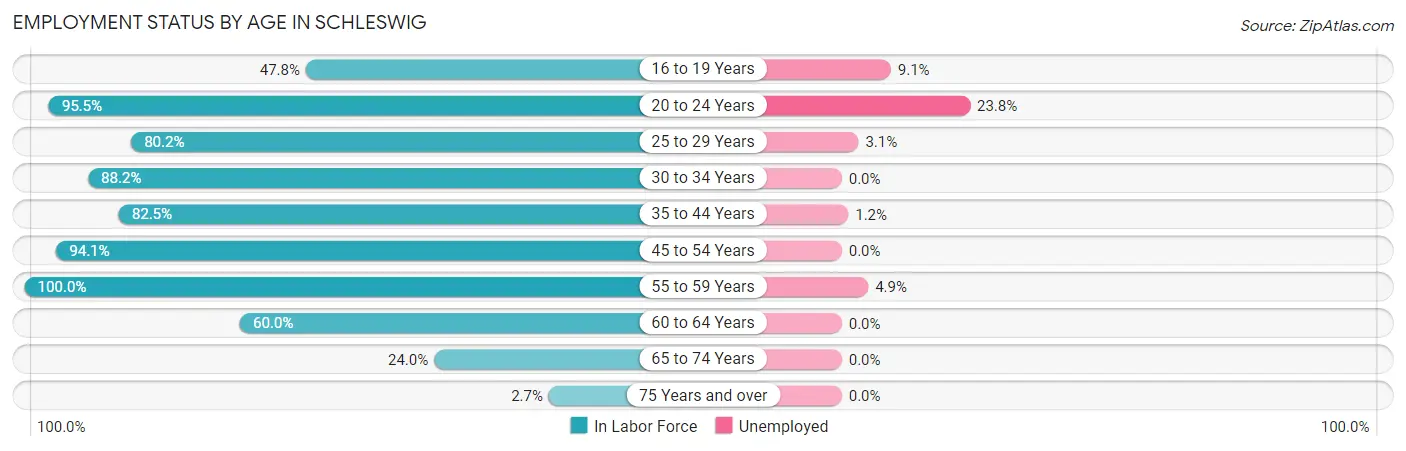
| Age Bracket | In Labor Force | Unemployed |
| 16 to 19 Years | 33 (47.8%) | 3 (9.1%) |
| 20 to 24 Years | 63 (95.5%) | 15 (23.8%) |
| 25 to 29 Years | 65 (80.2%) | 2 (3.1%) |
| 30 to 34 Years | 30 (88.2%) | 0 (0.0%) |
| 35 to 44 Years | 85 (82.5%) | 1 (1.2%) |
| 45 to 54 Years | 143 (94.1%) | 0 (0.0%) |
| 55 to 59 Years | 41 (100.0%) | 2 (4.9%) |
| 60 to 64 Years | 27 (60.0%) | 0 (0.0%) |
| 65 to 74 Years | 18 (24.0%) | 0 (0.0%) |
| 75 Years and over | 2 (2.7%) | 0 (0.0%) |
| Total | 507 (68.6%) | 23 (4.5%) |
Employment Status by Educational Attainment in Schleswig
According to labor force statistics for Schleswig, 85.7% of individuals (391) out of the total population between 25 and 64 years of age (456) are in the labor force, with 1.3% or 5 of them being unemployed. The group with the highest labor force participation rate are those with the educational attainment of bachelor's degree or higher, with 100.0% or 91 individuals in the labor force. Within the labor force, individuals with college / associate degree education have the highest percentage of unemployment, with 2.3% or 3 of them being unemployed.
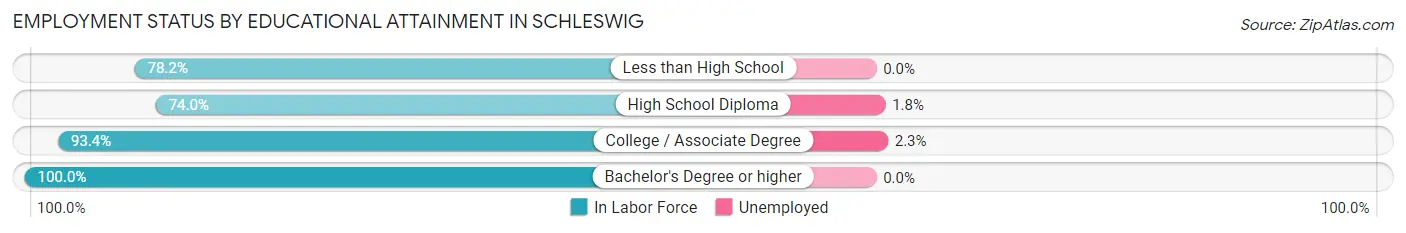
| Educational Attainment | In Labor Force | Unemployed |
| Less than High School | 61 (78.2%) | 0 (0.0%) |
| High School Diploma | 111 (74.0%) | 3 (1.8%) |
| College / Associate Degree | 128 (93.4%) | 3 (2.3%) |
| Bachelor's Degree or higher | 91 (100.0%) | 0 (0.0%) |
| Total | 391 (85.7%) | 6 (1.3%) |
Employment Occupations by Sex in Schleswig
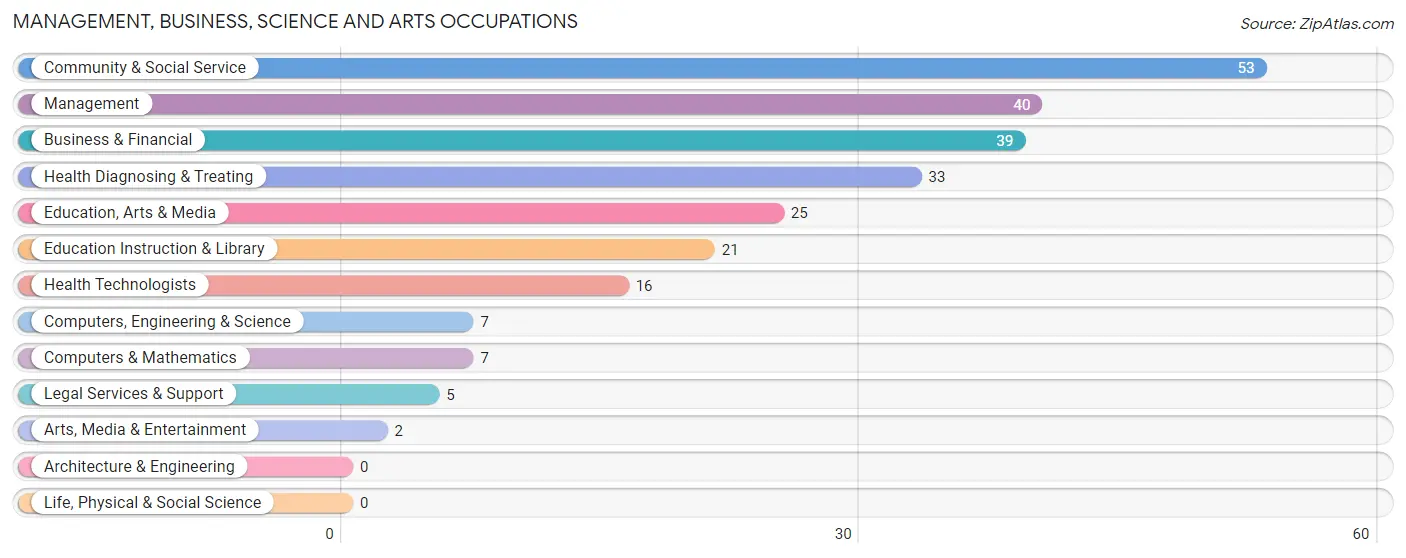
Management, Business, Science and Arts Occupations
The most common Management, Business, Science and Arts occupations in Schleswig are Community & Social Service (53 | 11.0%), Management (40 | 8.3%), Business & Financial (39 | 8.1%), Health Diagnosing & Treating (33 | 6.8%), and Education, Arts & Media (25 | 5.2%).
Management, Business, Science and Arts Occupations by Sex
Within the Management, Business, Science and Arts occupations in Schleswig, the most male-oriented occupations are Computers, Engineering & Science (85.7%), Computers & Mathematics (85.7%), and Management (72.5%), while the most female-oriented occupations are Education, Arts & Media (100.0%), Arts, Media & Entertainment (100.0%), and Health Technologists (100.0%).
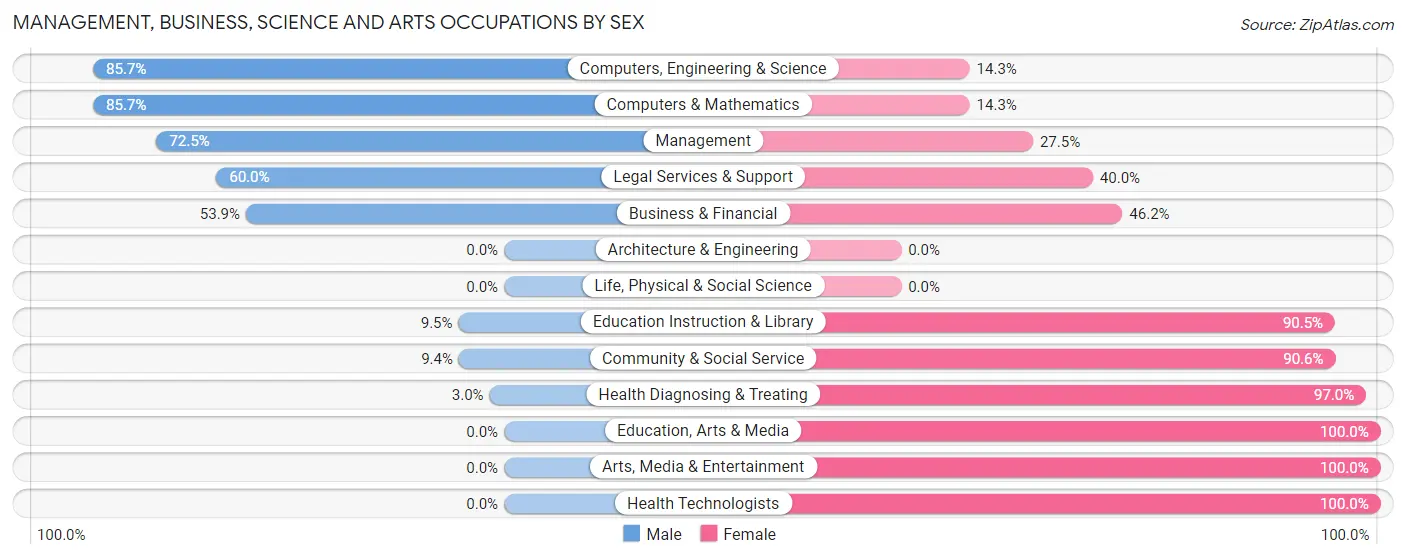
| Occupation | Male | Female |
| Management | 29 (72.5%) | 11 (27.5%) |
| Business & Financial | 21 (53.8%) | 18 (46.2%) |
| Computers, Engineering & Science | 6 (85.7%) | 1 (14.3%) |
| Computers & Mathematics | 6 (85.7%) | 1 (14.3%) |
| Architecture & Engineering | 0 (0.0%) | 0 (0.0%) |
| Life, Physical & Social Science | 0 (0.0%) | 0 (0.0%) |
| Community & Social Service | 5 (9.4%) | 48 (90.6%) |
| Education, Arts & Media | 0 (0.0%) | 25 (100.0%) |
| Legal Services & Support | 3 (60.0%) | 2 (40.0%) |
| Education Instruction & Library | 2 (9.5%) | 19 (90.5%) |
| Arts, Media & Entertainment | 0 (0.0%) | 2 (100.0%) |
| Health Diagnosing & Treating | 1 (3.0%) | 32 (97.0%) |
| Health Technologists | 0 (0.0%) | 16 (100.0%) |
| Total (Category) | 62 (36.0%) | 110 (63.9%) |
| Total (Overall) | 248 (51.2%) | 236 (48.8%) |
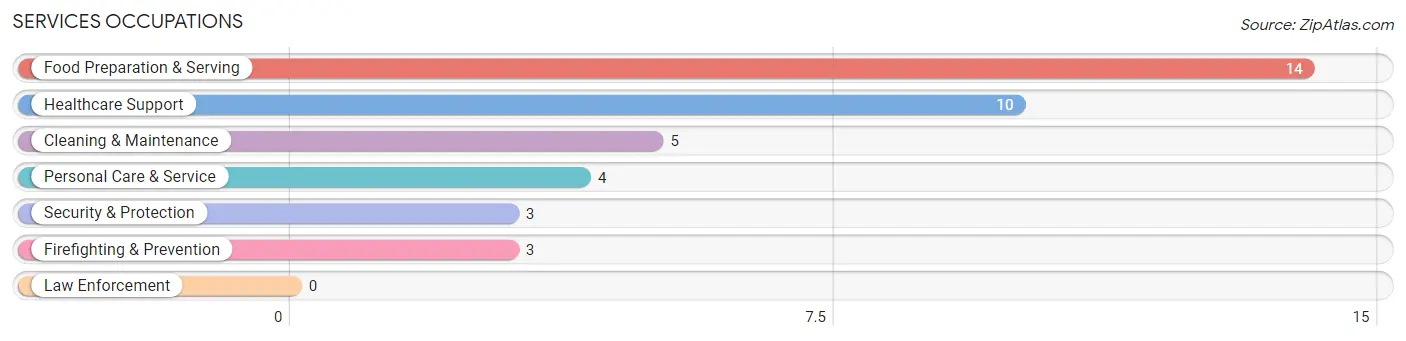
Services Occupations
The most common Services occupations in Schleswig are Food Preparation & Serving (14 | 2.9%), Healthcare Support (10 | 2.1%), Cleaning & Maintenance (5 | 1.0%), Personal Care & Service (4 | 0.8%), and Security & Protection (3 | 0.6%).
Services Occupations by Sex
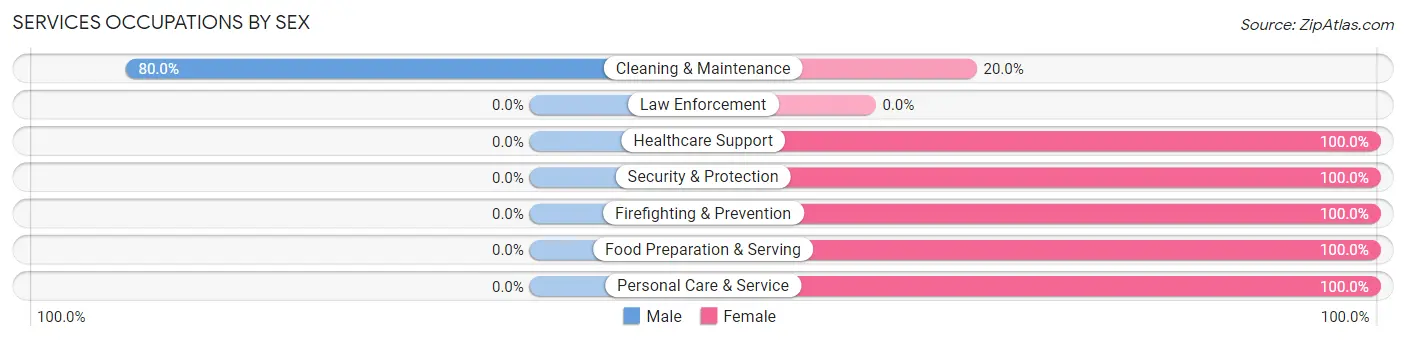
| Occupation | Male | Female |
| Healthcare Support | 0 (0.0%) | 10 (100.0%) |
| Security & Protection | 0 (0.0%) | 3 (100.0%) |
| Firefighting & Prevention | 0 (0.0%) | 3 (100.0%) |
| Law Enforcement | 0 (0.0%) | 0 (0.0%) |
| Food Preparation & Serving | 0 (0.0%) | 14 (100.0%) |
| Cleaning & Maintenance | 4 (80.0%) | 1 (20.0%) |
| Personal Care & Service | 0 (0.0%) | 4 (100.0%) |
| Total (Category) | 4 (11.1%) | 32 (88.9%) |
| Total (Overall) | 248 (51.2%) | 236 (48.8%) |
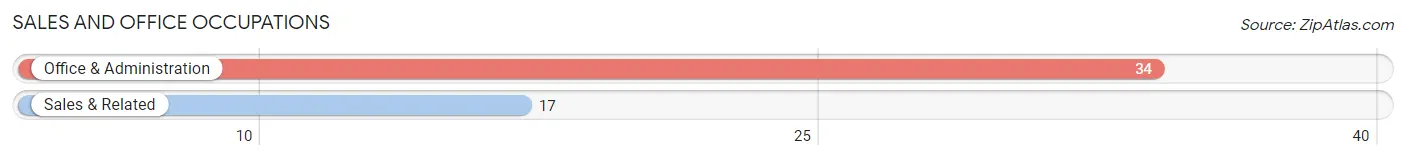
Sales and Office Occupations
The most common Sales and Office occupations in Schleswig are Office & Administration (34 | 7.0%), and Sales & Related (17 | 3.5%).
Sales and Office Occupations by Sex
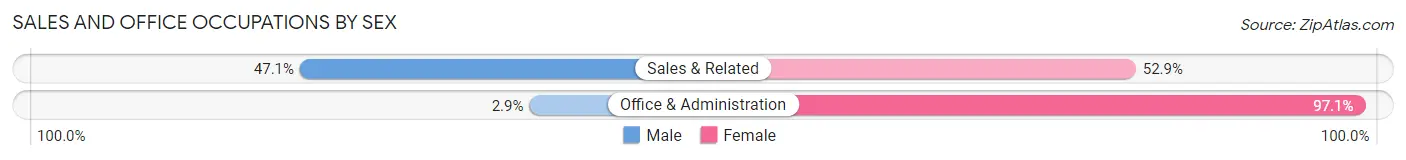
| Occupation | Male | Female |
| Sales & Related | 8 (47.1%) | 9 (52.9%) |
| Office & Administration | 1 (2.9%) | 33 (97.1%) |
| Total (Category) | 9 (17.6%) | 42 (82.4%) |
| Total (Overall) | 248 (51.2%) | 236 (48.8%) |
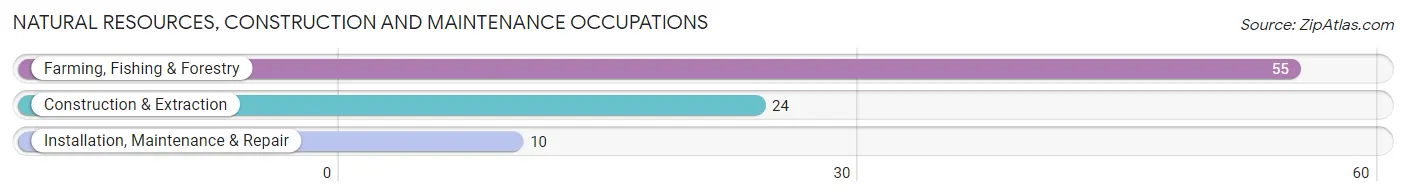
Natural Resources, Construction and Maintenance Occupations
The most common Natural Resources, Construction and Maintenance occupations in Schleswig are Farming, Fishing & Forestry (55 | 11.4%), Construction & Extraction (24 | 5.0%), and Installation, Maintenance & Repair (10 | 2.1%).
Natural Resources, Construction and Maintenance Occupations by Sex
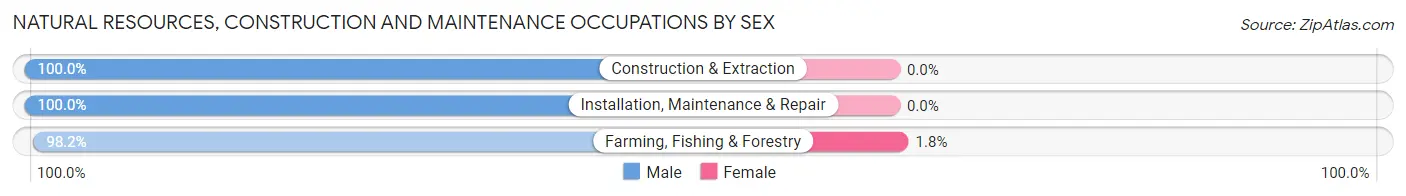
| Occupation | Male | Female |
| Farming, Fishing & Forestry | 54 (98.2%) | 1 (1.8%) |
| Construction & Extraction | 24 (100.0%) | 0 (0.0%) |
| Installation, Maintenance & Repair | 10 (100.0%) | 0 (0.0%) |
| Total (Category) | 88 (98.9%) | 1 (1.1%) |
| Total (Overall) | 248 (51.2%) | 236 (48.8%) |
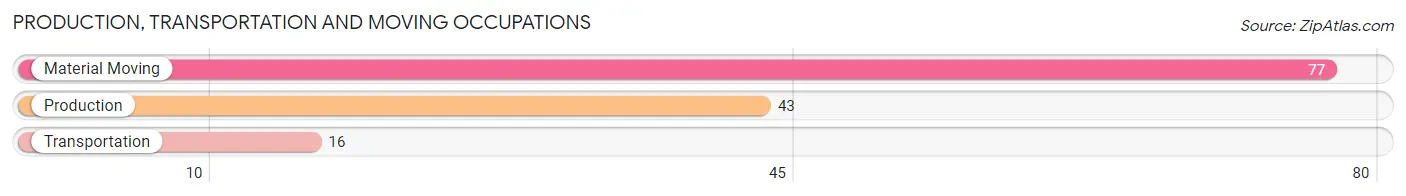
Production, Transportation and Moving Occupations
The most common Production, Transportation and Moving occupations in Schleswig are Material Moving (77 | 15.9%), Production (43 | 8.9%), and Transportation (16 | 3.3%).
Production, Transportation and Moving Occupations by Sex
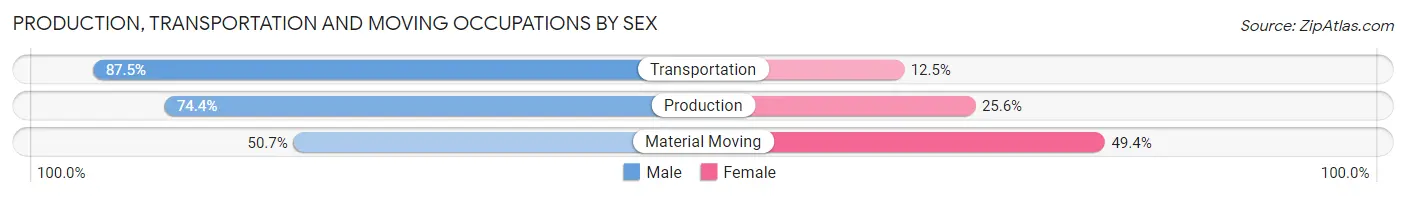
| Occupation | Male | Female |
| Production | 32 (74.4%) | 11 (25.6%) |
| Transportation | 14 (87.5%) | 2 (12.5%) |
| Material Moving | 39 (50.6%) | 38 (49.3%) |
| Total (Category) | 85 (62.5%) | 51 (37.5%) |
| Total (Overall) | 248 (51.2%) | 236 (48.8%) |
Employment Industries by Sex in Schleswig
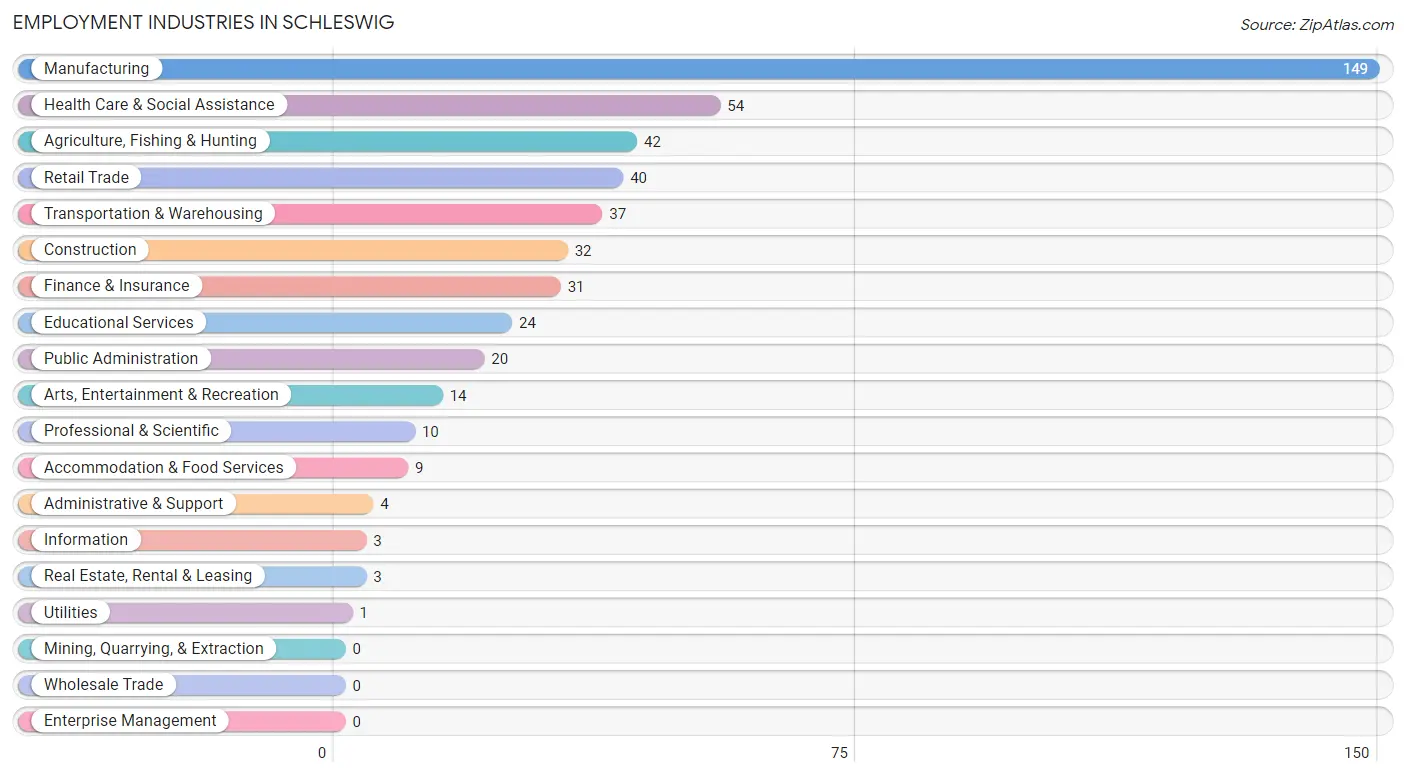
Employment Industries in Schleswig
The major employment industries in Schleswig include Manufacturing (149 | 30.8%), Health Care & Social Assistance (54 | 11.2%), Agriculture, Fishing & Hunting (42 | 8.7%), Retail Trade (40 | 8.3%), and Transportation & Warehousing (37 | 7.6%).
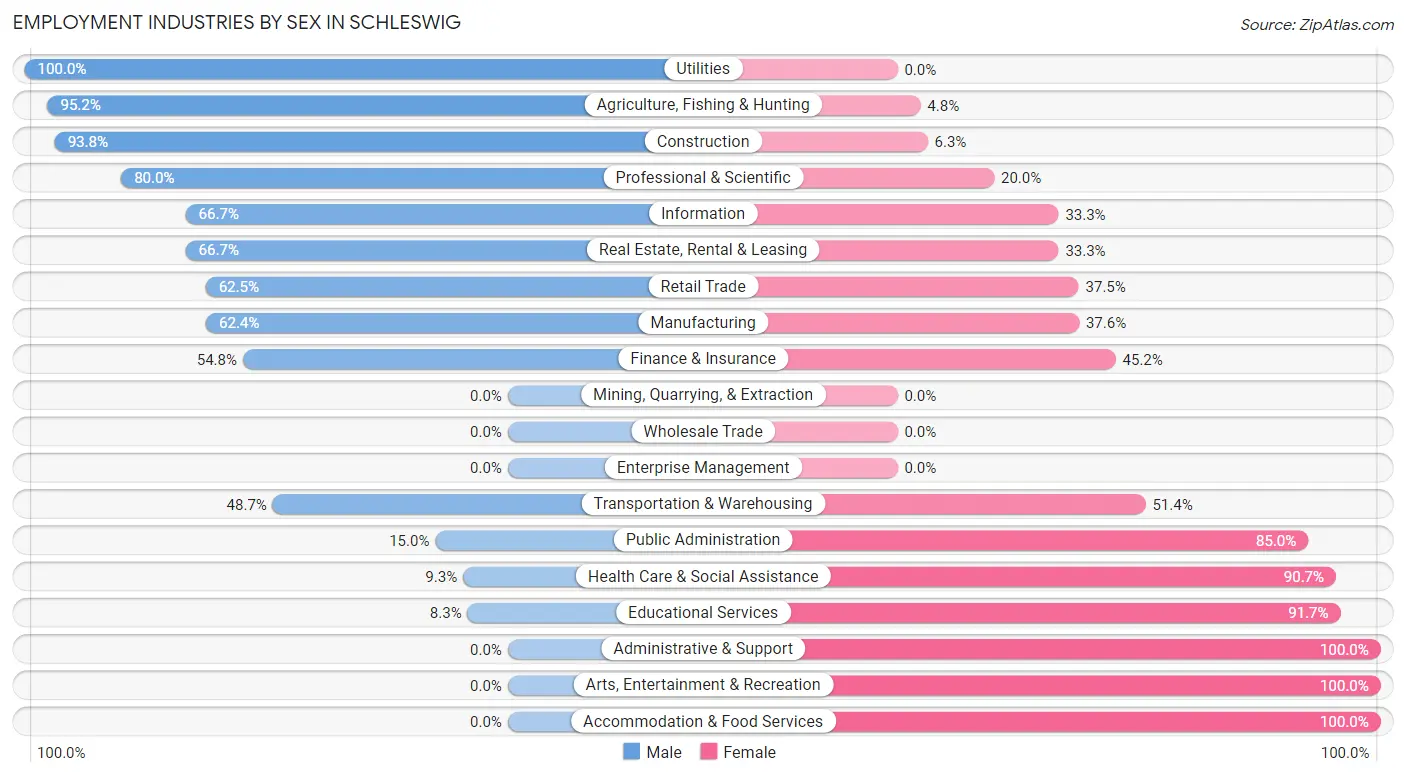
Employment Industries by Sex in Schleswig
The Schleswig industries that see more men than women are Utilities (100.0%), Agriculture, Fishing & Hunting (95.2%), and Construction (93.8%), whereas the industries that tend to have a higher number of women are Administrative & Support (100.0%), Arts, Entertainment & Recreation (100.0%), and Accommodation & Food Services (100.0%).
| Industry | Male | Female |
| Agriculture, Fishing & Hunting | 40 (95.2%) | 2 (4.8%) |
| Mining, Quarrying, & Extraction | 0 (0.0%) | 0 (0.0%) |
| Construction | 30 (93.8%) | 2 (6.2%) |
| Manufacturing | 93 (62.4%) | 56 (37.6%) |
| Wholesale Trade | 0 (0.0%) | 0 (0.0%) |
| Retail Trade | 25 (62.5%) | 15 (37.5%) |
| Transportation & Warehousing | 18 (48.6%) | 19 (51.3%) |
| Utilities | 1 (100.0%) | 0 (0.0%) |
| Information | 2 (66.7%) | 1 (33.3%) |
| Finance & Insurance | 17 (54.8%) | 14 (45.2%) |
| Real Estate, Rental & Leasing | 2 (66.7%) | 1 (33.3%) |
| Professional & Scientific | 8 (80.0%) | 2 (20.0%) |
| Enterprise Management | 0 (0.0%) | 0 (0.0%) |
| Administrative & Support | 0 (0.0%) | 4 (100.0%) |
| Educational Services | 2 (8.3%) | 22 (91.7%) |
| Health Care & Social Assistance | 5 (9.3%) | 49 (90.7%) |
| Arts, Entertainment & Recreation | 0 (0.0%) | 14 (100.0%) |
| Accommodation & Food Services | 0 (0.0%) | 9 (100.0%) |
| Public Administration | 3 (15.0%) | 17 (85.0%) |
| Total | 248 (51.2%) | 236 (48.8%) |
Education in Schleswig
School Enrollment in Schleswig
The most common levels of schooling among the 171 students in Schleswig are college / undergraduate (50 | 29.2%), high school (37 | 21.6%), and middle school (33 | 19.3%).
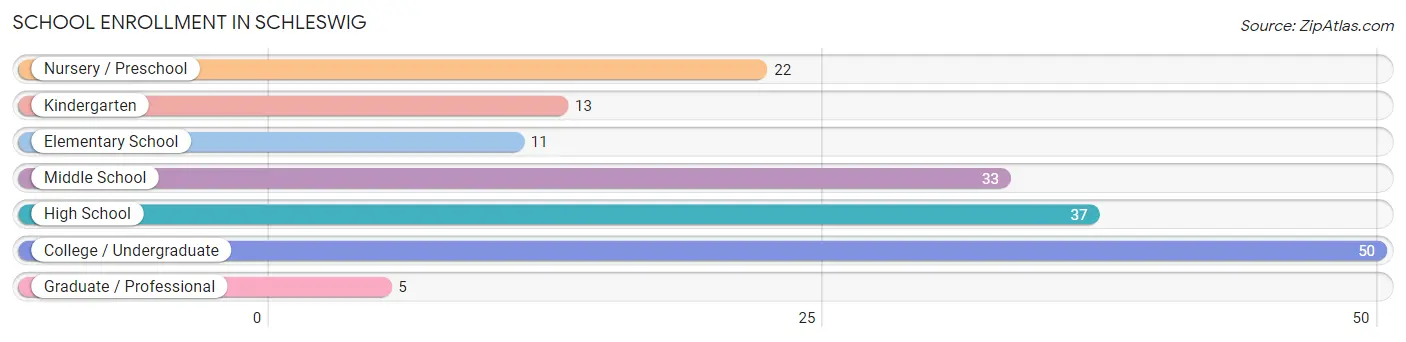
| School Level | # Students | % Students |
| Nursery / Preschool | 22 | 12.9% |
| Kindergarten | 13 | 7.6% |
| Elementary School | 11 | 6.4% |
| Middle School | 33 | 19.3% |
| High School | 37 | 21.6% |
| College / Undergraduate | 50 | 29.2% |
| Graduate / Professional | 5 | 2.9% |
| Total | 171 | 100.0% |
School Enrollment by Age by Funding Source in Schleswig
Out of a total of 171 students who are enrolled in schools in Schleswig, 12 (7.0%) attend a private institution, while the remaining 159 (93.0%) are enrolled in public schools. The age group of 35 years and over has the highest likelihood of being enrolled in private schools, with 4 (100.0% in the age bracket) enrolled. Conversely, the age group of 3 to 4 year olds has the lowest likelihood of being enrolled in a private school, with 21 (100.0% in the age bracket) attending a public institution.
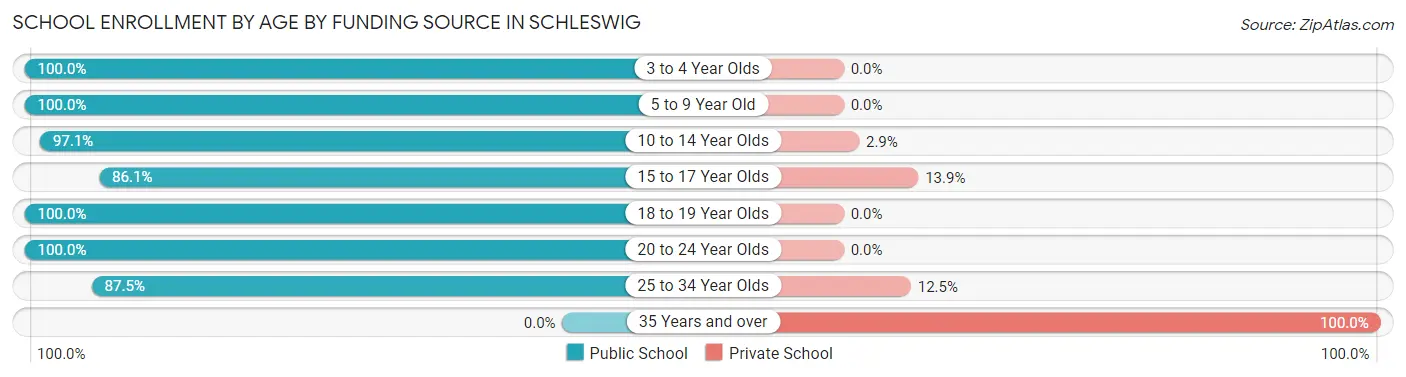
| Age Bracket | Public School | Private School |
| 3 to 4 Year Olds | 21 (100.0%) | 0 (0.0%) |
| 5 to 9 Year Old | 23 (100.0%) | 0 (0.0%) |
| 10 to 14 Year Olds | 34 (97.1%) | 1 (2.9%) |
| 15 to 17 Year Olds | 31 (86.1%) | 5 (13.9%) |
| 18 to 19 Year Olds | 17 (100.0%) | 0 (0.0%) |
| 20 to 24 Year Olds | 19 (100.0%) | 0 (0.0%) |
| 25 to 34 Year Olds | 14 (87.5%) | 2 (12.5%) |
| 35 Years and over | 0 (0.0%) | 4 (100.0%) |
| Total | 159 (93.0%) | 12 (7.0%) |
Educational Attainment by Field of Study in Schleswig
Business (26 | 20.6%), education (25 | 19.8%), psychology (24 | 19.1%), bio, nature & agricultural (14 | 11.1%), and science & technology (14 | 11.1%) are the most common fields of study among 126 individuals in Schleswig who have obtained a bachelor's degree or higher.
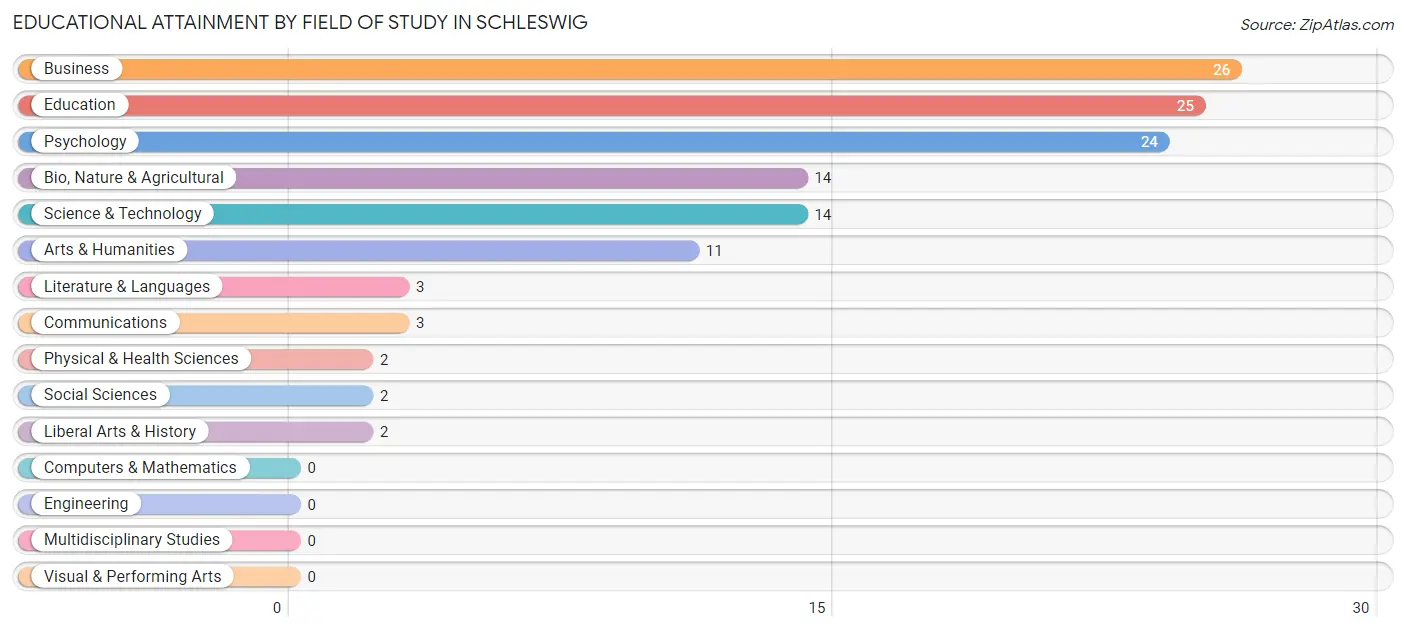
| Field of Study | # Graduates | % Graduates |
| Computers & Mathematics | 0 | 0.0% |
| Bio, Nature & Agricultural | 14 | 11.1% |
| Physical & Health Sciences | 2 | 1.6% |
| Psychology | 24 | 19.1% |
| Social Sciences | 2 | 1.6% |
| Engineering | 0 | 0.0% |
| Multidisciplinary Studies | 0 | 0.0% |
| Science & Technology | 14 | 11.1% |
| Business | 26 | 20.6% |
| Education | 25 | 19.8% |
| Literature & Languages | 3 | 2.4% |
| Liberal Arts & History | 2 | 1.6% |
| Visual & Performing Arts | 0 | 0.0% |
| Communications | 3 | 2.4% |
| Arts & Humanities | 11 | 8.7% |
| Total | 126 | 100.0% |
Transportation & Commute in Schleswig
Vehicle Availability by Sex in Schleswig
The most prevalent vehicle ownership categories in Schleswig are males with 2 vehicles (93, accounting for 38.4%) and females with 2 vehicles (71, making up 39.9%).
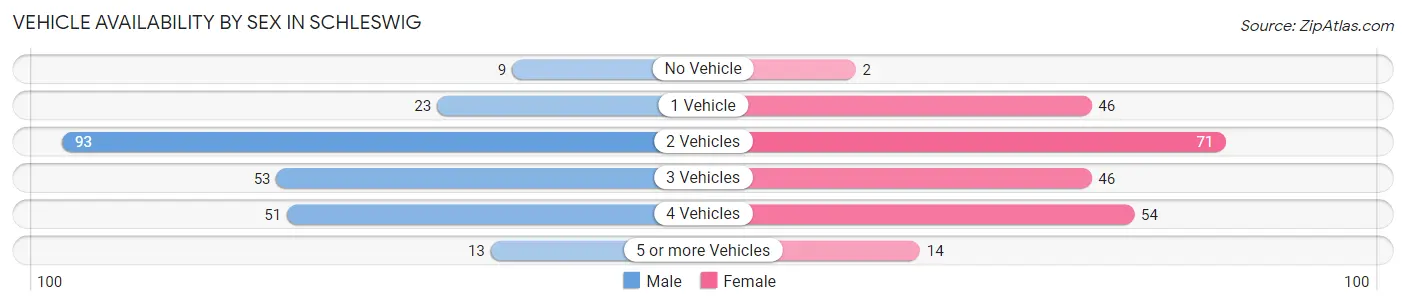
| Vehicles Available | Male | Female |
| No Vehicle | 9 (3.7%) | 2 (0.9%) |
| 1 Vehicle | 23 (9.5%) | 46 (19.7%) |
| 2 Vehicles | 93 (38.4%) | 71 (30.5%) |
| 3 Vehicles | 53 (21.9%) | 46 (19.7%) |
| 4 Vehicles | 51 (21.1%) | 54 (23.2%) |
| 5 or more Vehicles | 13 (5.4%) | 14 (6.0%) |
| Total | 242 (100.0%) | 233 (100.0%) |
Commute Time in Schleswig
The most frequently occuring commute durations in Schleswig are 15 to 19 minutes (89 commuters, 19.4%), 20 to 24 minutes (88 commuters, 19.2%), and 5 to 9 minutes (67 commuters, 14.6%).
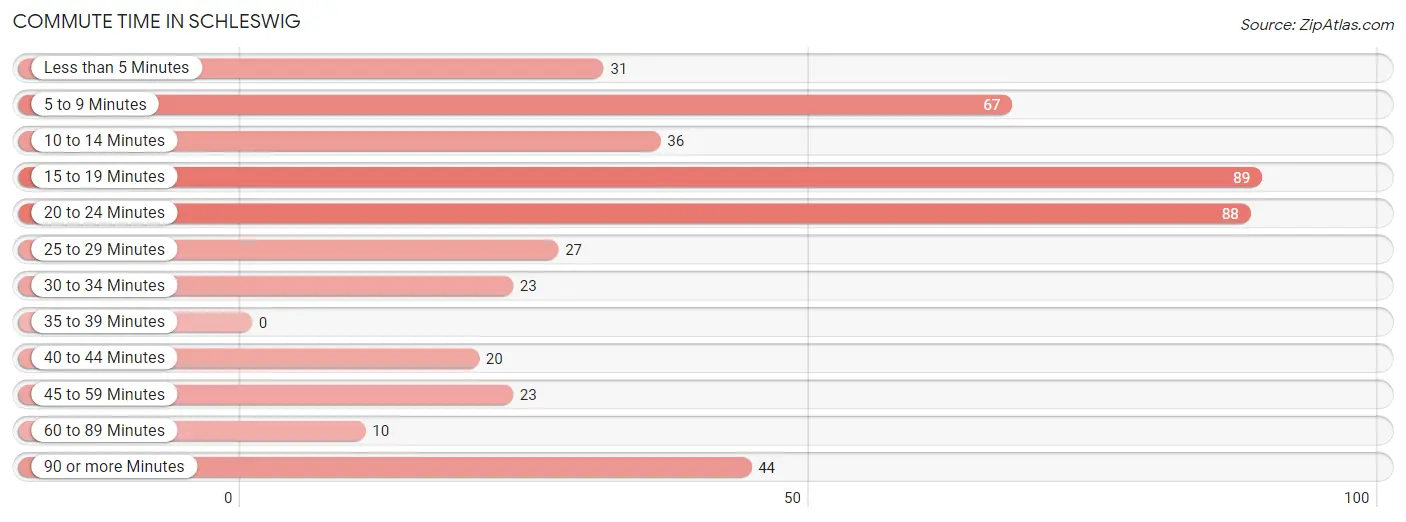
| Commute Time | # Commuters | % Commuters |
| Less than 5 Minutes | 31 | 6.8% |
| 5 to 9 Minutes | 67 | 14.6% |
| 10 to 14 Minutes | 36 | 7.9% |
| 15 to 19 Minutes | 89 | 19.4% |
| 20 to 24 Minutes | 88 | 19.2% |
| 25 to 29 Minutes | 27 | 5.9% |
| 30 to 34 Minutes | 23 | 5.0% |
| 35 to 39 Minutes | 0 | 0.0% |
| 40 to 44 Minutes | 20 | 4.4% |
| 45 to 59 Minutes | 23 | 5.0% |
| 60 to 89 Minutes | 10 | 2.2% |
| 90 or more Minutes | 44 | 9.6% |
Commute Time by Sex in Schleswig
The most common commute times in Schleswig are 5 to 9 minutes (59 commuters, 24.6%) for males and 15 to 19 minutes (57 commuters, 26.2%) for females.
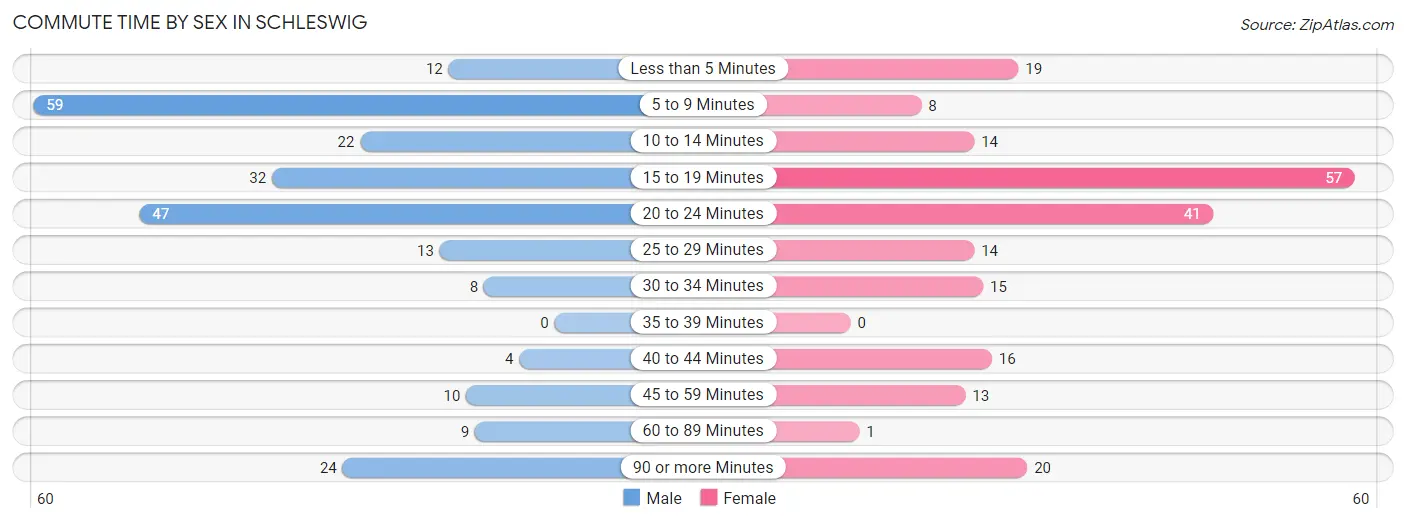
| Commute Time | Male | Female |
| Less than 5 Minutes | 12 (5.0%) | 19 (8.7%) |
| 5 to 9 Minutes | 59 (24.6%) | 8 (3.7%) |
| 10 to 14 Minutes | 22 (9.2%) | 14 (6.4%) |
| 15 to 19 Minutes | 32 (13.3%) | 57 (26.2%) |
| 20 to 24 Minutes | 47 (19.6%) | 41 (18.8%) |
| 25 to 29 Minutes | 13 (5.4%) | 14 (6.4%) |
| 30 to 34 Minutes | 8 (3.3%) | 15 (6.9%) |
| 35 to 39 Minutes | 0 (0.0%) | 0 (0.0%) |
| 40 to 44 Minutes | 4 (1.7%) | 16 (7.3%) |
| 45 to 59 Minutes | 10 (4.2%) | 13 (6.0%) |
| 60 to 89 Minutes | 9 (3.7%) | 1 (0.5%) |
| 90 or more Minutes | 24 (10.0%) | 20 (9.2%) |
Time of Departure to Work by Sex in Schleswig
The most frequent times of departure to work in Schleswig are 5:00 AM to 5:29 AM (41, 17.1%) for males and 7:30 AM to 7:59 AM (50, 22.9%) for females.
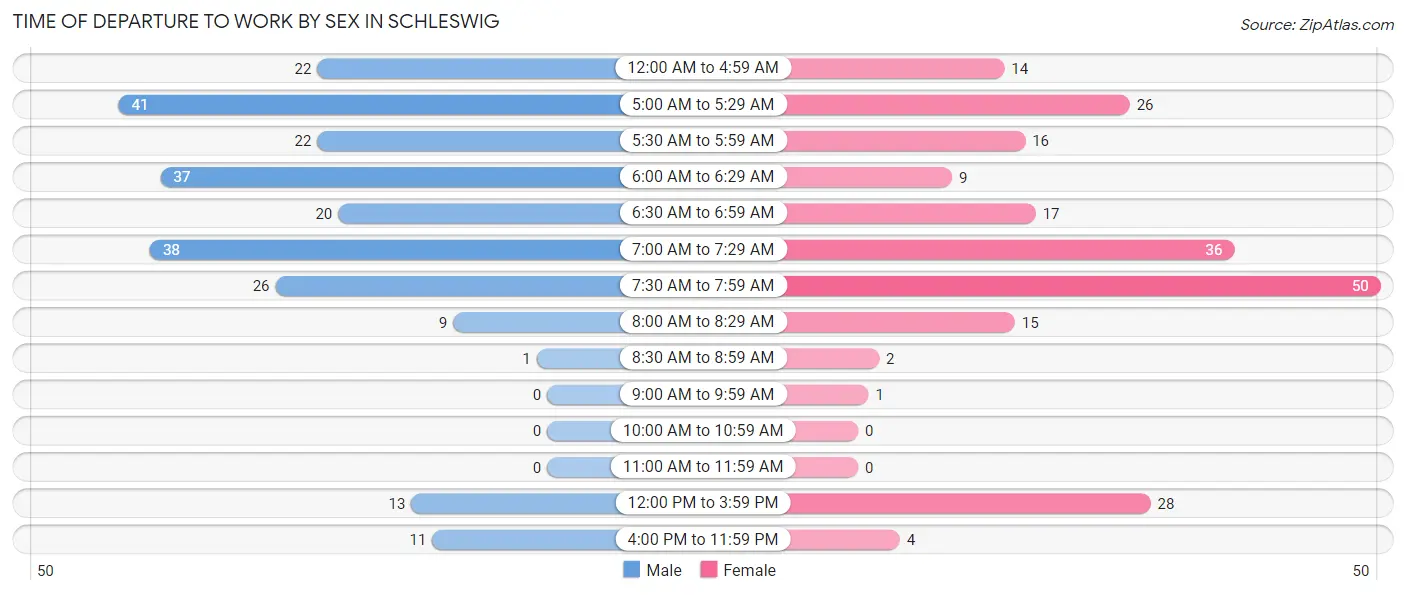
| Time of Departure | Male | Female |
| 12:00 AM to 4:59 AM | 22 (9.2%) | 14 (6.4%) |
| 5:00 AM to 5:29 AM | 41 (17.1%) | 26 (11.9%) |
| 5:30 AM to 5:59 AM | 22 (9.2%) | 16 (7.3%) |
| 6:00 AM to 6:29 AM | 37 (15.4%) | 9 (4.1%) |
| 6:30 AM to 6:59 AM | 20 (8.3%) | 17 (7.8%) |
| 7:00 AM to 7:29 AM | 38 (15.8%) | 36 (16.5%) |
| 7:30 AM to 7:59 AM | 26 (10.8%) | 50 (22.9%) |
| 8:00 AM to 8:29 AM | 9 (3.7%) | 15 (6.9%) |
| 8:30 AM to 8:59 AM | 1 (0.4%) | 2 (0.9%) |
| 9:00 AM to 9:59 AM | 0 (0.0%) | 1 (0.5%) |
| 10:00 AM to 10:59 AM | 0 (0.0%) | 0 (0.0%) |
| 11:00 AM to 11:59 AM | 0 (0.0%) | 0 (0.0%) |
| 12:00 PM to 3:59 PM | 13 (5.4%) | 28 (12.8%) |
| 4:00 PM to 11:59 PM | 11 (4.6%) | 4 (1.8%) |
| Total | 240 (100.0%) | 218 (100.0%) |
Housing Occupancy in Schleswig
Occupancy by Ownership in Schleswig
Of the total 397 dwellings in Schleswig, owner-occupied units account for 299 (75.3%), while renter-occupied units make up 98 (24.7%).
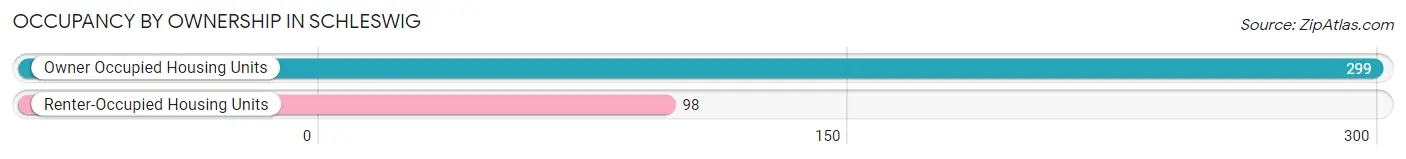
| Occupancy | # Housing Units | % Housing Units |
| Owner Occupied Housing Units | 299 | 75.3% |
| Renter-Occupied Housing Units | 98 | 24.7% |
| Total Occupied Housing Units | 397 | 100.0% |
Occupancy by Household Size in Schleswig
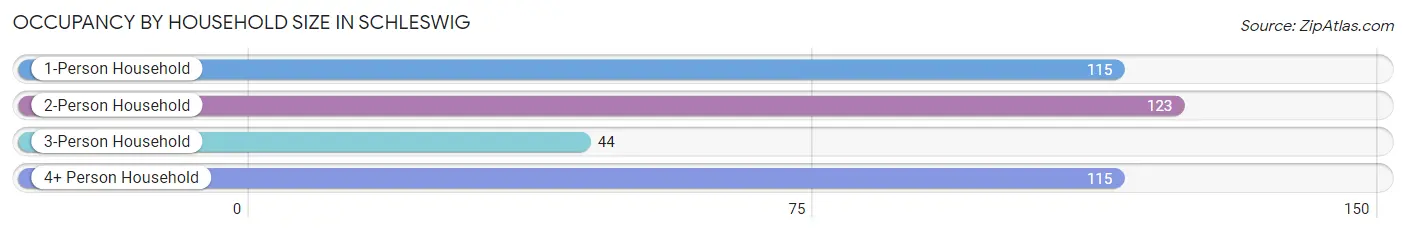
| Household Size | # Housing Units | % Housing Units |
| 1-Person Household | 115 | 29.0% |
| 2-Person Household | 123 | 31.0% |
| 3-Person Household | 44 | 11.1% |
| 4+ Person Household | 115 | 29.0% |
| Total Housing Units | 397 | 100.0% |
Occupancy by Ownership by Household Size in Schleswig
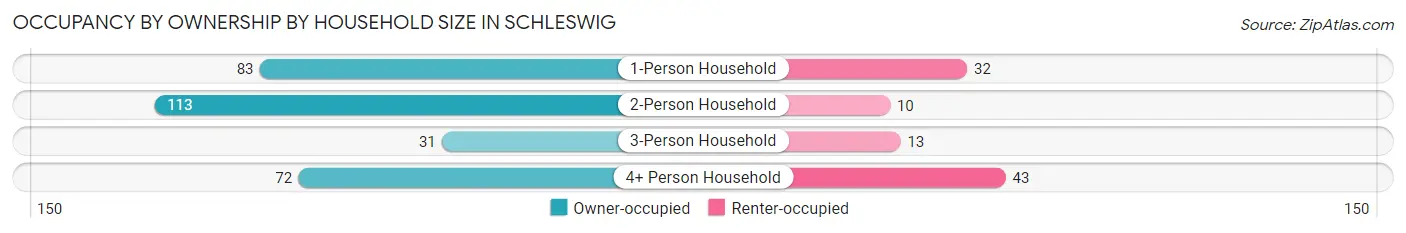
| Household Size | Owner-occupied | Renter-occupied |
| 1-Person Household | 83 (72.2%) | 32 (27.8%) |
| 2-Person Household | 113 (91.9%) | 10 (8.1%) |
| 3-Person Household | 31 (70.5%) | 13 (29.5%) |
| 4+ Person Household | 72 (62.6%) | 43 (37.4%) |
| Total Housing Units | 299 (75.3%) | 98 (24.7%) |
Occupancy by Educational Attainment in Schleswig
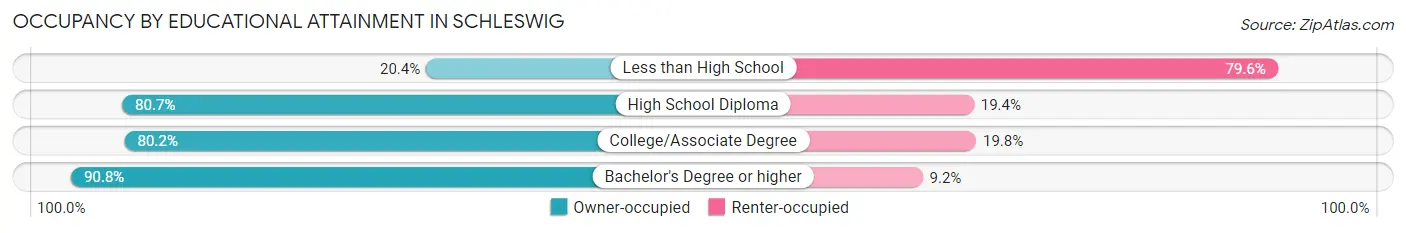
| Household Size | Owner-occupied | Renter-occupied |
| Less than High School | 10 (20.4%) | 39 (79.6%) |
| High School Diploma | 125 (80.6%) | 30 (19.4%) |
| College/Associate Degree | 85 (80.2%) | 21 (19.8%) |
| Bachelor's Degree or higher | 79 (90.8%) | 8 (9.2%) |
Occupancy by Age of Householder in Schleswig
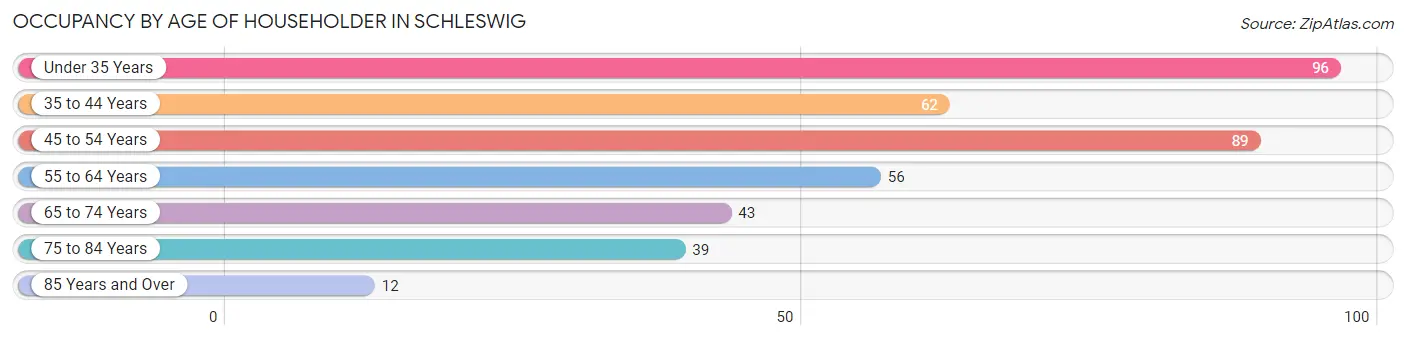
| Age Bracket | # Households | % Households |
| Under 35 Years | 96 | 24.2% |
| 35 to 44 Years | 62 | 15.6% |
| 45 to 54 Years | 89 | 22.4% |
| 55 to 64 Years | 56 | 14.1% |
| 65 to 74 Years | 43 | 10.8% |
| 75 to 84 Years | 39 | 9.8% |
| 85 Years and Over | 12 | 3.0% |
| Total | 397 | 100.0% |
Housing Finances in Schleswig
Median Income by Occupancy in Schleswig
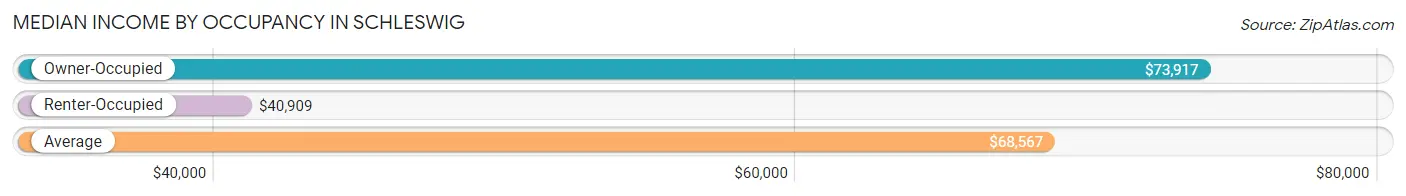
| Occupancy Type | # Households | Median Income |
| Owner-Occupied | 299 (75.3%) | $73,917 |
| Renter-Occupied | 98 (24.7%) | $40,909 |
| Average | 397 (100.0%) | $68,567 |
Occupancy by Householder Income Bracket in Schleswig
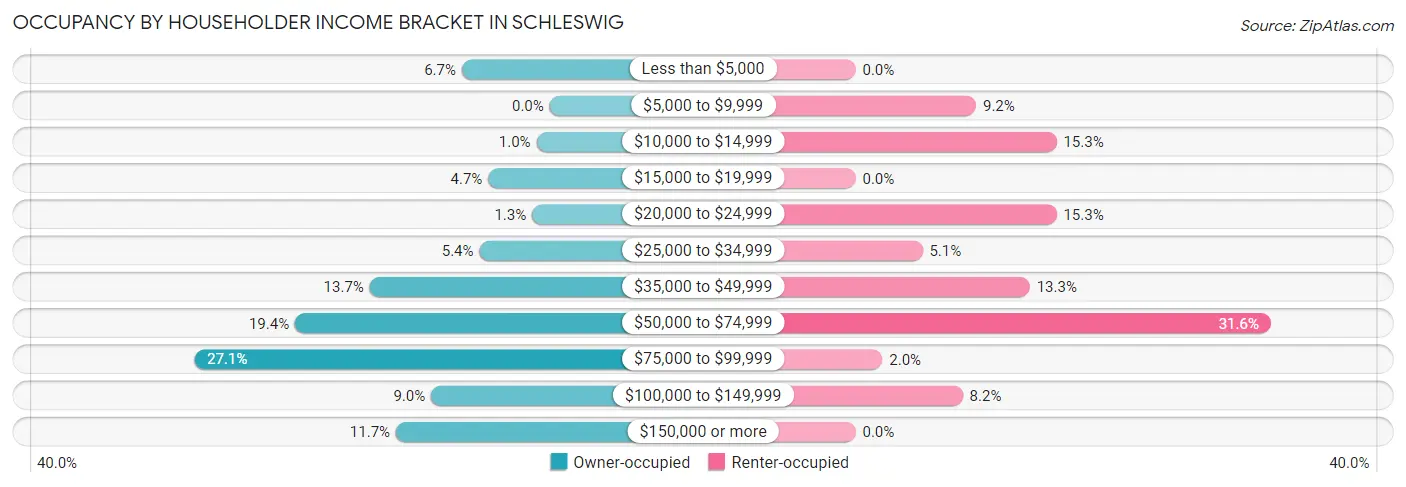
| Income Bracket | Owner-occupied | Renter-occupied |
| Less than $5,000 | 20 (6.7%) | 0 (0.0%) |
| $5,000 to $9,999 | 0 (0.0%) | 9 (9.2%) |
| $10,000 to $14,999 | 3 (1.0%) | 15 (15.3%) |
| $15,000 to $19,999 | 14 (4.7%) | 0 (0.0%) |
| $20,000 to $24,999 | 4 (1.3%) | 15 (15.3%) |
| $25,000 to $34,999 | 16 (5.3%) | 5 (5.1%) |
| $35,000 to $49,999 | 41 (13.7%) | 13 (13.3%) |
| $50,000 to $74,999 | 58 (19.4%) | 31 (31.6%) |
| $75,000 to $99,999 | 81 (27.1%) | 2 (2.0%) |
| $100,000 to $149,999 | 27 (9.0%) | 8 (8.2%) |
| $150,000 or more | 35 (11.7%) | 0 (0.0%) |
| Total | 299 (100.0%) | 98 (100.0%) |
Monthly Housing Cost Tiers in Schleswig
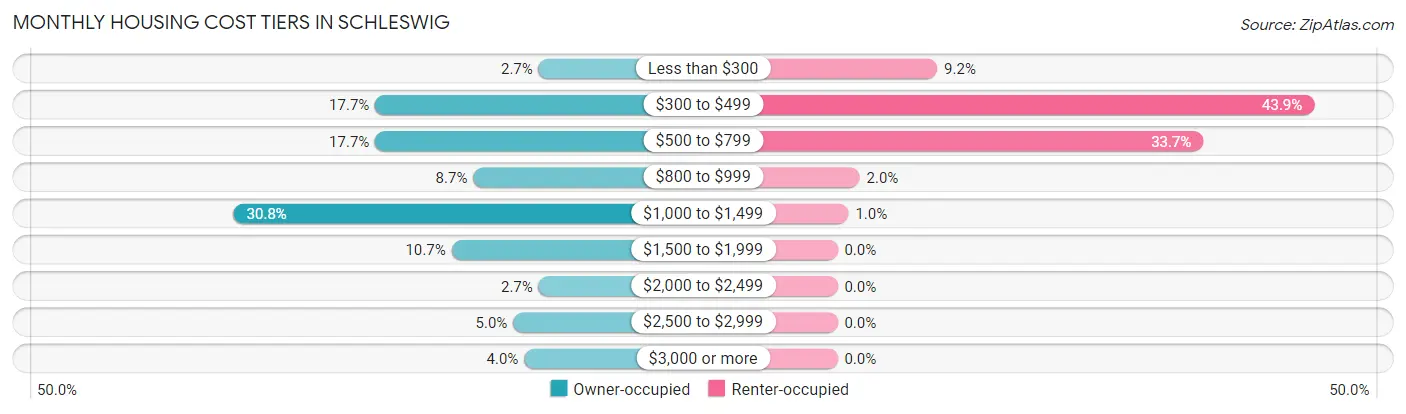
| Monthly Cost | Owner-occupied | Renter-occupied |
| Less than $300 | 8 (2.7%) | 9 (9.2%) |
| $300 to $499 | 53 (17.7%) | 43 (43.9%) |
| $500 to $799 | 53 (17.7%) | 33 (33.7%) |
| $800 to $999 | 26 (8.7%) | 2 (2.0%) |
| $1,000 to $1,499 | 92 (30.8%) | 1 (1.0%) |
| $1,500 to $1,999 | 32 (10.7%) | 0 (0.0%) |
| $2,000 to $2,499 | 8 (2.7%) | 0 (0.0%) |
| $2,500 to $2,999 | 15 (5.0%) | 0 (0.0%) |
| $3,000 or more | 12 (4.0%) | 0 (0.0%) |
| Total | 299 (100.0%) | 98 (100.0%) |
Physical Housing Characteristics in Schleswig
Housing Structures in Schleswig

| Structure Type | # Housing Units | % Housing Units |
| Single Unit, Detached | 360 | 90.7% |
| Single Unit, Attached | 2 | 0.5% |
| 2 Unit Apartments | 0 | 0.0% |
| 3 or 4 Unit Apartments | 0 | 0.0% |
| 5 to 9 Unit Apartments | 20 | 5.0% |
| 10 or more Apartments | 14 | 3.5% |
| Mobile Home / Other | 1 | 0.3% |
| Total | 397 | 100.0% |
Housing Structures by Occupancy in Schleswig
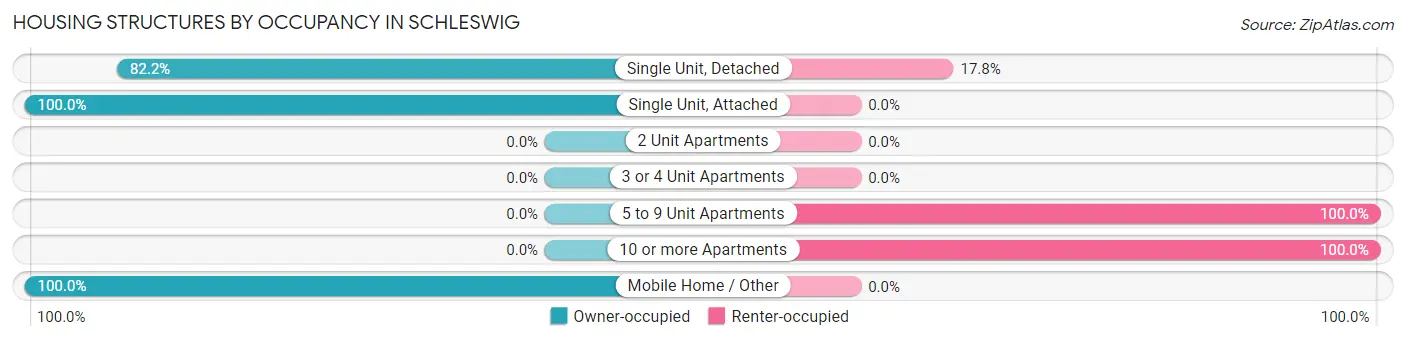
| Structure Type | Owner-occupied | Renter-occupied |
| Single Unit, Detached | 296 (82.2%) | 64 (17.8%) |
| Single Unit, Attached | 2 (100.0%) | 0 (0.0%) |
| 2 Unit Apartments | 0 (0.0%) | 0 (0.0%) |
| 3 or 4 Unit Apartments | 0 (0.0%) | 0 (0.0%) |
| 5 to 9 Unit Apartments | 0 (0.0%) | 20 (100.0%) |
| 10 or more Apartments | 0 (0.0%) | 14 (100.0%) |
| Mobile Home / Other | 1 (100.0%) | 0 (0.0%) |
| Total | 299 (75.3%) | 98 (24.7%) |
Housing Structures by Number of Rooms in Schleswig
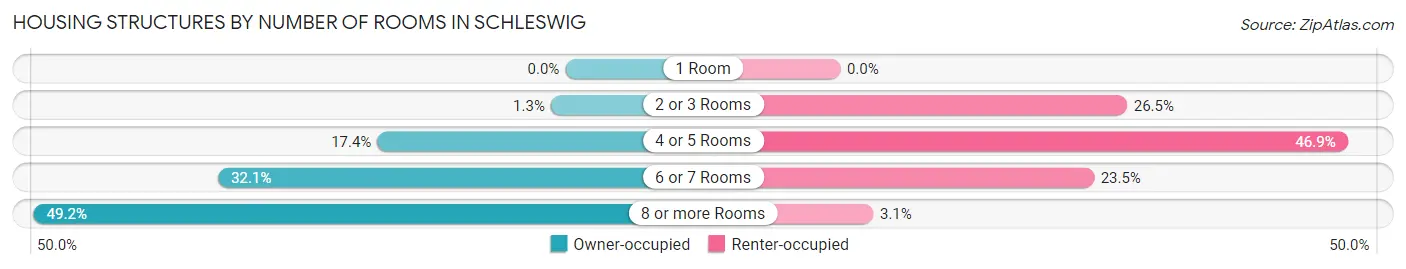
| Number of Rooms | Owner-occupied | Renter-occupied |
| 1 Room | 0 (0.0%) | 0 (0.0%) |
| 2 or 3 Rooms | 4 (1.3%) | 26 (26.5%) |
| 4 or 5 Rooms | 52 (17.4%) | 46 (46.9%) |
| 6 or 7 Rooms | 96 (32.1%) | 23 (23.5%) |
| 8 or more Rooms | 147 (49.2%) | 3 (3.1%) |
| Total | 299 (100.0%) | 98 (100.0%) |
Housing Structure by Heating Type in Schleswig
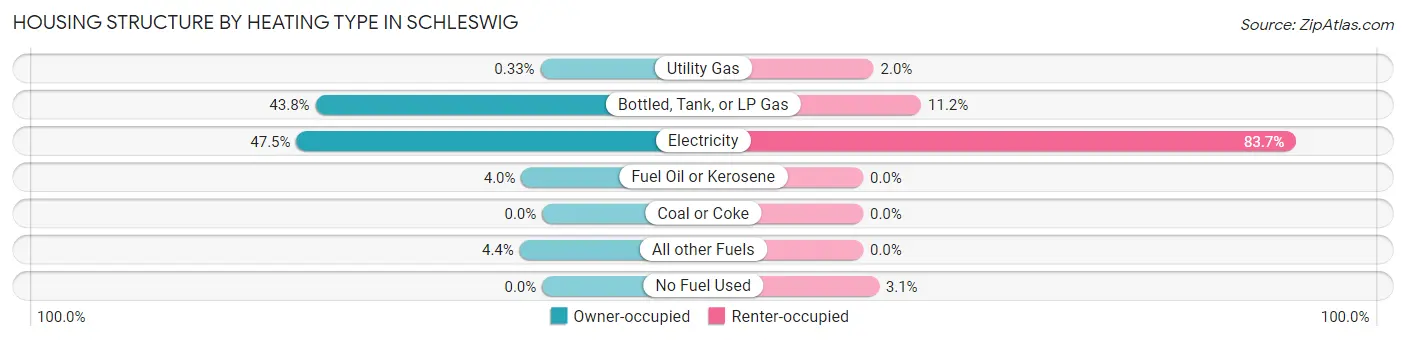
| Heating Type | Owner-occupied | Renter-occupied |
| Utility Gas | 1 (0.3%) | 2 (2.0%) |
| Bottled, Tank, or LP Gas | 131 (43.8%) | 11 (11.2%) |
| Electricity | 142 (47.5%) | 82 (83.7%) |
| Fuel Oil or Kerosene | 12 (4.0%) | 0 (0.0%) |
| Coal or Coke | 0 (0.0%) | 0 (0.0%) |
| All other Fuels | 13 (4.3%) | 0 (0.0%) |
| No Fuel Used | 0 (0.0%) | 3 (3.1%) |
| Total | 299 (100.0%) | 98 (100.0%) |
Household Vehicle Usage in Schleswig
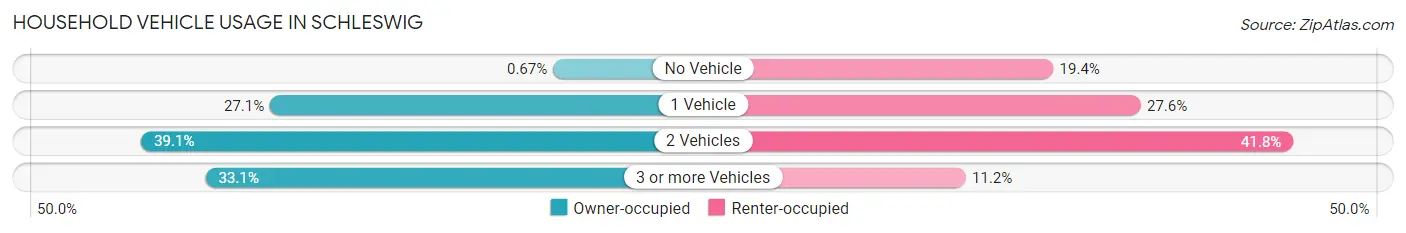
| Vehicles per Household | Owner-occupied | Renter-occupied |
| No Vehicle | 2 (0.7%) | 19 (19.4%) |
| 1 Vehicle | 81 (27.1%) | 27 (27.6%) |
| 2 Vehicles | 117 (39.1%) | 41 (41.8%) |
| 3 or more Vehicles | 99 (33.1%) | 11 (11.2%) |
| Total | 299 (100.0%) | 98 (100.0%) |
Real Estate & Mortgages in Schleswig
Real Estate and Mortgage Overview in Schleswig
| Characteristic | Without Mortgage | With Mortgage |
| Housing Units | 92 | 207 |
| Median Property Value | $100,000 | $118,800 |
| Median Household Income | $48,750 | $25 |
| Monthly Housing Costs | $448 | $12 |
| Real Estate Taxes | $1,421 | $0 |
Property Value by Mortgage Status in Schleswig
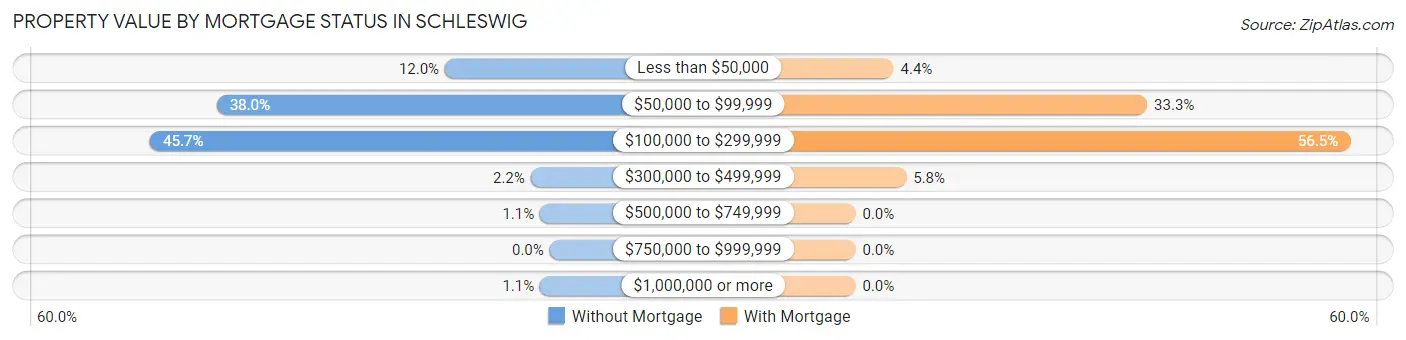
| Property Value | Without Mortgage | With Mortgage |
| Less than $50,000 | 11 (12.0%) | 9 (4.3%) |
| $50,000 to $99,999 | 35 (38.0%) | 69 (33.3%) |
| $100,000 to $299,999 | 42 (45.7%) | 117 (56.5%) |
| $300,000 to $499,999 | 2 (2.2%) | 12 (5.8%) |
| $500,000 to $749,999 | 1 (1.1%) | 0 (0.0%) |
| $750,000 to $999,999 | 0 (0.0%) | 0 (0.0%) |
| $1,000,000 or more | 1 (1.1%) | 0 (0.0%) |
| Total | 92 (100.0%) | 207 (100.0%) |
Household Income by Mortgage Status in Schleswig
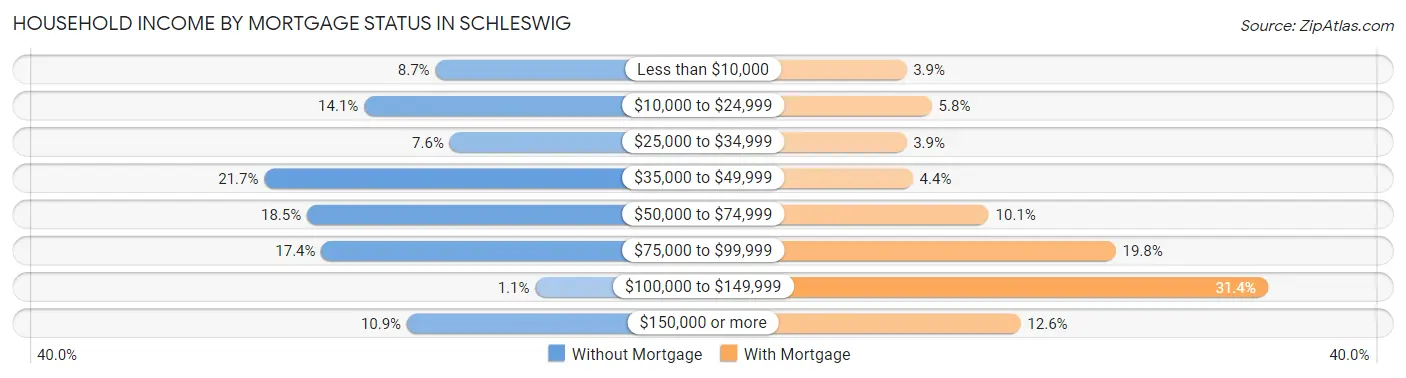
| Household Income | Without Mortgage | With Mortgage |
| Less than $10,000 | 8 (8.7%) | 8 (3.9%) |
| $10,000 to $24,999 | 13 (14.1%) | 12 (5.8%) |
| $25,000 to $34,999 | 7 (7.6%) | 8 (3.9%) |
| $35,000 to $49,999 | 20 (21.7%) | 9 (4.3%) |
| $50,000 to $74,999 | 17 (18.5%) | 21 (10.1%) |
| $75,000 to $99,999 | 16 (17.4%) | 41 (19.8%) |
| $100,000 to $149,999 | 1 (1.1%) | 65 (31.4%) |
| $150,000 or more | 10 (10.9%) | 26 (12.6%) |
| Total | 92 (100.0%) | 207 (100.0%) |
Property Value to Household Income Ratio in Schleswig
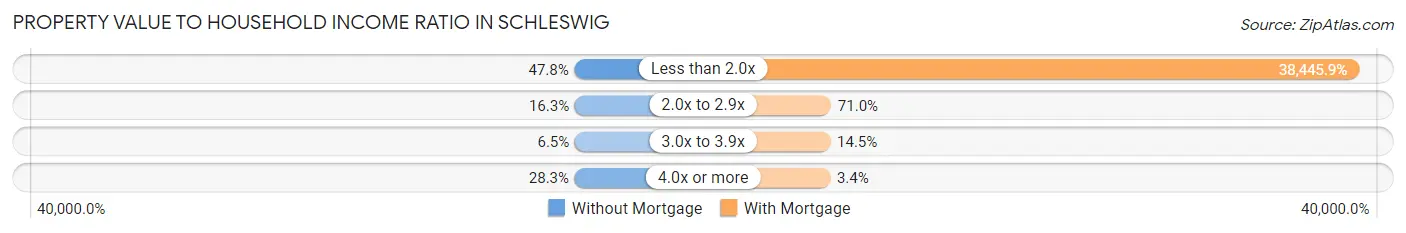
| Value-to-Income Ratio | Without Mortgage | With Mortgage |
| Less than 2.0x | 44 (47.8%) | 79,583 (38,445.9%) |
| 2.0x to 2.9x | 15 (16.3%) | 147 (71.0%) |
| 3.0x to 3.9x | 6 (6.5%) | 30 (14.5%) |
| 4.0x or more | 26 (28.3%) | 7 (3.4%) |
| Total | 92 (100.0%) | 207 (100.0%) |
Real Estate Taxes by Mortgage Status in Schleswig
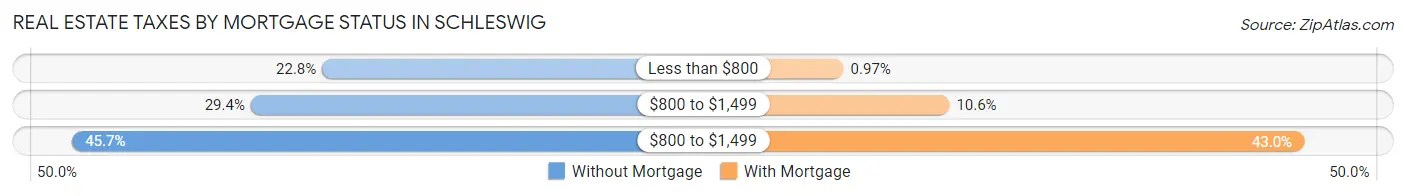
| Property Taxes | Without Mortgage | With Mortgage |
| Less than $800 | 21 (22.8%) | 2 (1.0%) |
| $800 to $1,499 | 27 (29.3%) | 22 (10.6%) |
| $800 to $1,499 | 42 (45.7%) | 89 (43.0%) |
| Total | 92 (100.0%) | 207 (100.0%) |
Health & Disability in Schleswig
Health Insurance Coverage by Age in Schleswig
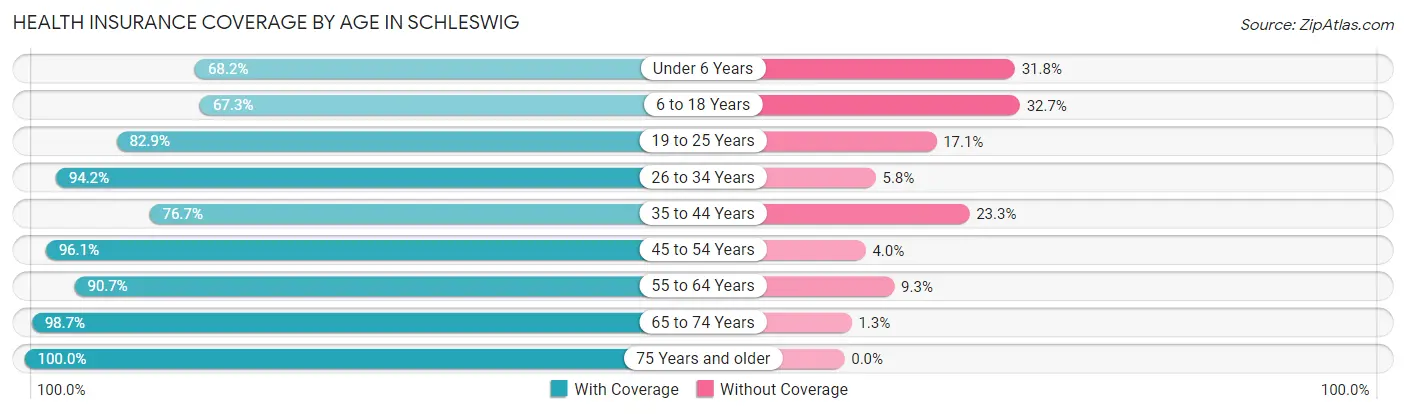
| Age Bracket | With Coverage | Without Coverage |
| Under 6 Years | 88 (68.2%) | 41 (31.8%) |
| 6 to 18 Years | 72 (67.3%) | 35 (32.7%) |
| 19 to 25 Years | 87 (82.9%) | 18 (17.1%) |
| 26 to 34 Years | 97 (94.2%) | 6 (5.8%) |
| 35 to 44 Years | 79 (76.7%) | 24 (23.3%) |
| 45 to 54 Years | 146 (96.1%) | 6 (4.0%) |
| 55 to 64 Years | 78 (90.7%) | 8 (9.3%) |
| 65 to 74 Years | 74 (98.7%) | 1 (1.3%) |
| 75 Years and older | 73 (100.0%) | 0 (0.0%) |
| Total | 794 (85.1%) | 139 (14.9%) |
Health Insurance Coverage by Citizenship Status in Schleswig
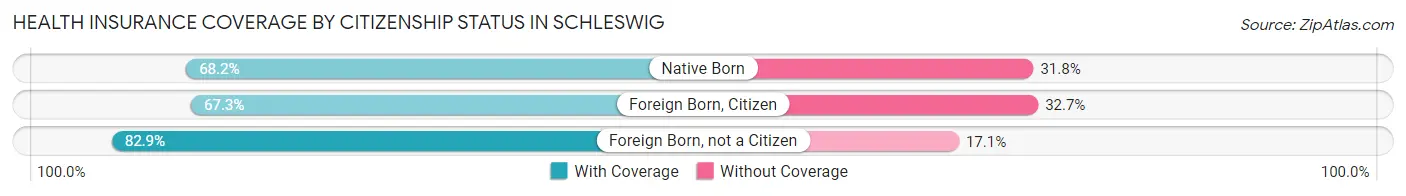
| Citizenship Status | With Coverage | Without Coverage |
| Native Born | 88 (68.2%) | 41 (31.8%) |
| Foreign Born, Citizen | 72 (67.3%) | 35 (32.7%) |
| Foreign Born, not a Citizen | 87 (82.9%) | 18 (17.1%) |
Health Insurance Coverage by Household Income in Schleswig
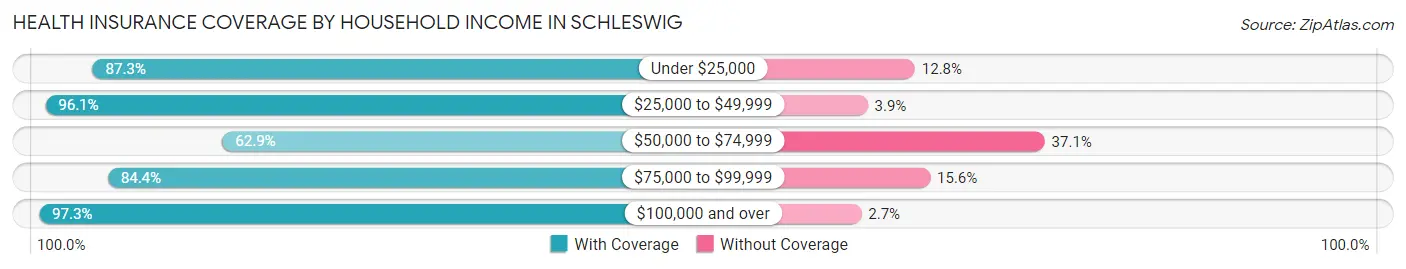
| Household Income | With Coverage | Without Coverage |
| Under $25,000 | 130 (87.3%) | 19 (12.8%) |
| $25,000 to $49,999 | 148 (96.1%) | 6 (3.9%) |
| $50,000 to $74,999 | 129 (62.9%) | 76 (37.1%) |
| $75,000 to $99,999 | 173 (84.4%) | 32 (15.6%) |
| $100,000 and over | 214 (97.3%) | 6 (2.7%) |
Public vs Private Health Insurance Coverage by Age in Schleswig
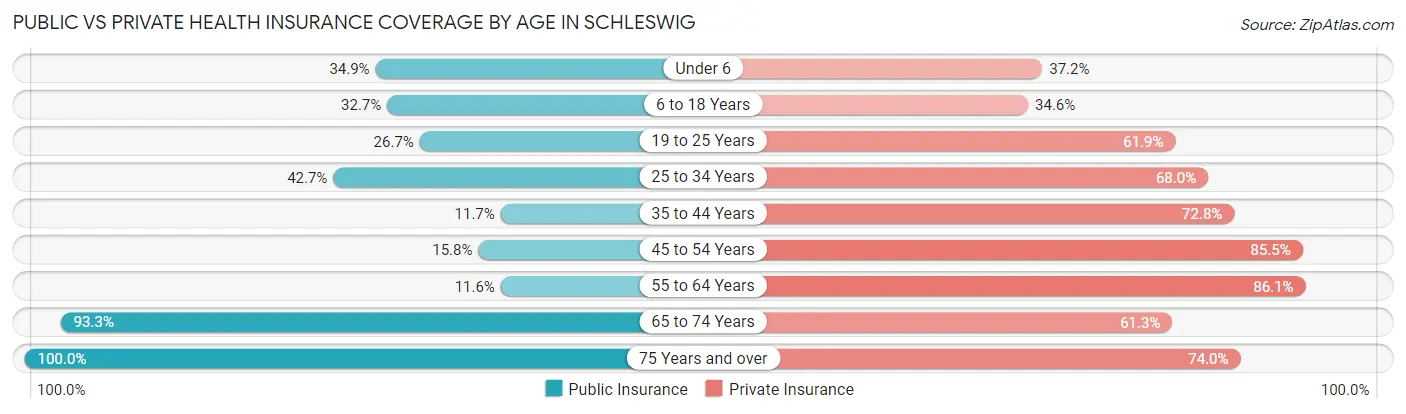
| Age Bracket | Public Insurance | Private Insurance |
| Under 6 | 45 (34.9%) | 48 (37.2%) |
| 6 to 18 Years | 35 (32.7%) | 37 (34.6%) |
| 19 to 25 Years | 28 (26.7%) | 65 (61.9%) |
| 25 to 34 Years | 44 (42.7%) | 70 (68.0%) |
| 35 to 44 Years | 12 (11.7%) | 75 (72.8%) |
| 45 to 54 Years | 24 (15.8%) | 130 (85.5%) |
| 55 to 64 Years | 10 (11.6%) | 74 (86.1%) |
| 65 to 74 Years | 70 (93.3%) | 46 (61.3%) |
| 75 Years and over | 73 (100.0%) | 54 (74.0%) |
| Total | 341 (36.5%) | 599 (64.2%) |
Disability Status by Sex by Age in Schleswig
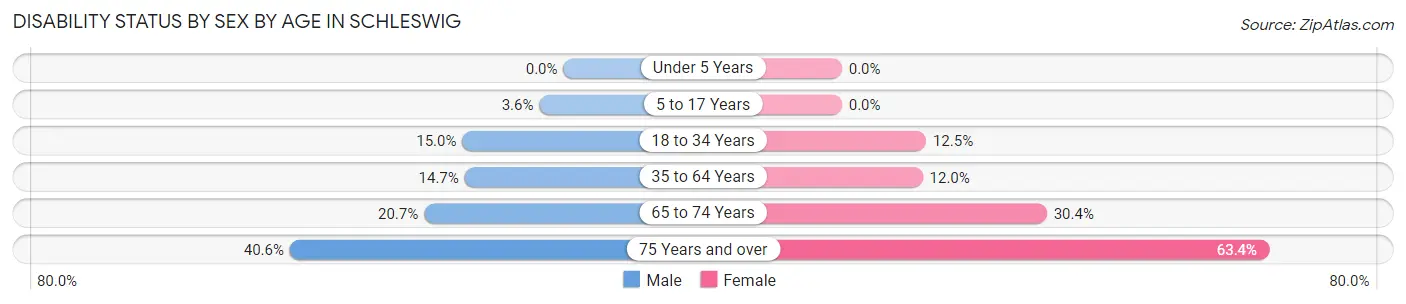
| Age Bracket | Male | Female |
| Under 5 Years | 0 (0.0%) | 0 (0.0%) |
| 5 to 17 Years | 2 (3.6%) | 0 (0.0%) |
| 18 to 34 Years | 18 (15.0%) | 13 (12.5%) |
| 35 to 64 Years | 28 (14.7%) | 18 (12.0%) |
| 65 to 74 Years | 6 (20.7%) | 14 (30.4%) |
| 75 Years and over | 13 (40.6%) | 26 (63.4%) |
Disability Class by Sex by Age in Schleswig
Disability Class: Hearing Difficulty
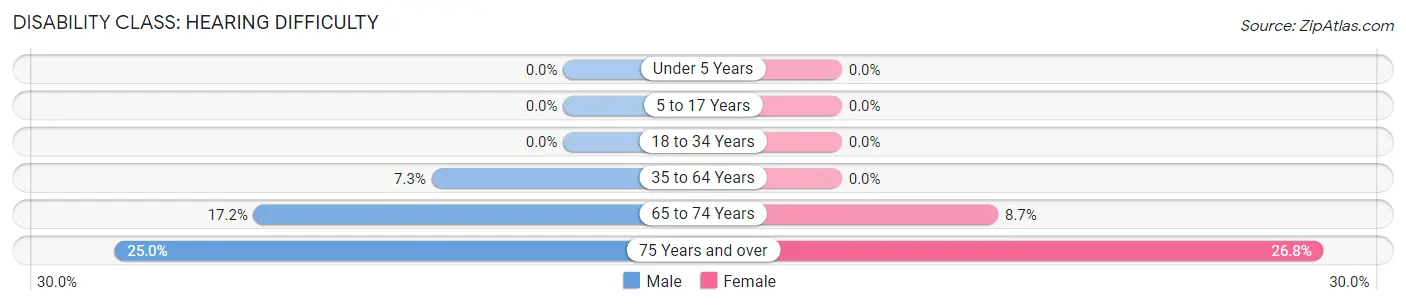
| Age Bracket | Male | Female |
| Under 5 Years | 0 (0.0%) | 0 (0.0%) |
| 5 to 17 Years | 0 (0.0%) | 0 (0.0%) |
| 18 to 34 Years | 0 (0.0%) | 0 (0.0%) |
| 35 to 64 Years | 14 (7.3%) | 0 (0.0%) |
| 65 to 74 Years | 5 (17.2%) | 4 (8.7%) |
| 75 Years and over | 8 (25.0%) | 11 (26.8%) |
Disability Class: Vision Difficulty
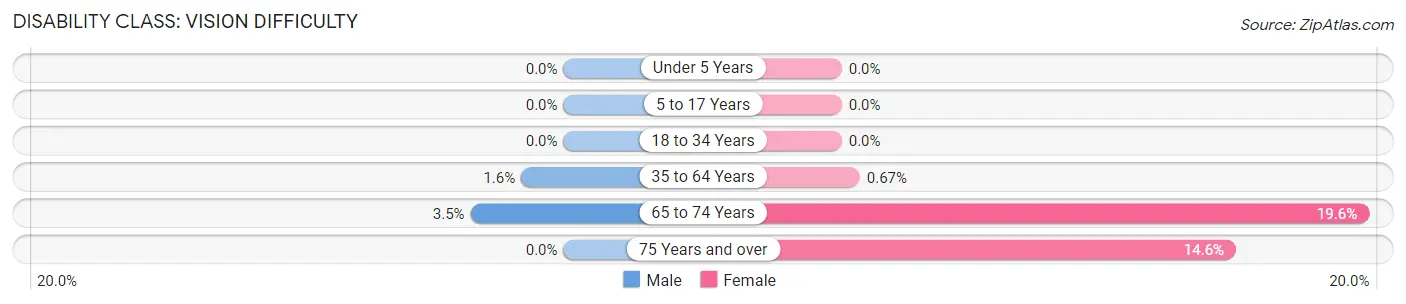
| Age Bracket | Male | Female |
| Under 5 Years | 0 (0.0%) | 0 (0.0%) |
| 5 to 17 Years | 0 (0.0%) | 0 (0.0%) |
| 18 to 34 Years | 0 (0.0%) | 0 (0.0%) |
| 35 to 64 Years | 3 (1.6%) | 1 (0.7%) |
| 65 to 74 Years | 1 (3.5%) | 9 (19.6%) |
| 75 Years and over | 0 (0.0%) | 6 (14.6%) |
Disability Class: Cognitive Difficulty
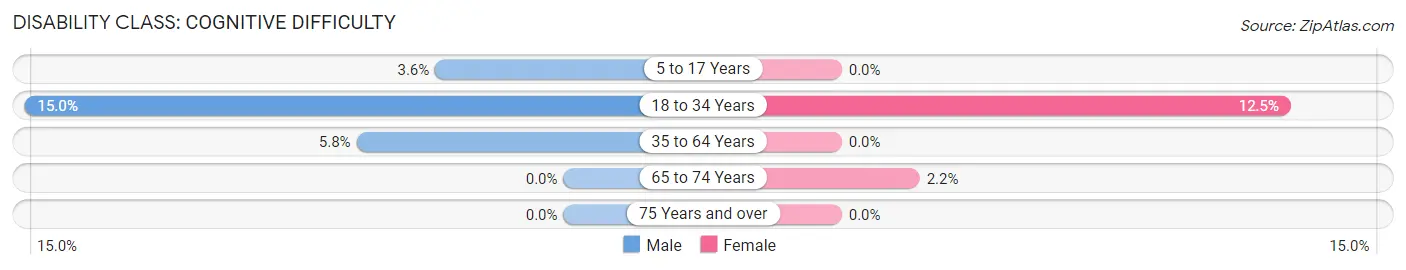
| Age Bracket | Male | Female |
| 5 to 17 Years | 2 (3.6%) | 0 (0.0%) |
| 18 to 34 Years | 18 (15.0%) | 13 (12.5%) |
| 35 to 64 Years | 11 (5.8%) | 0 (0.0%) |
| 65 to 74 Years | 0 (0.0%) | 1 (2.2%) |
| 75 Years and over | 0 (0.0%) | 0 (0.0%) |
Disability Class: Ambulatory Difficulty
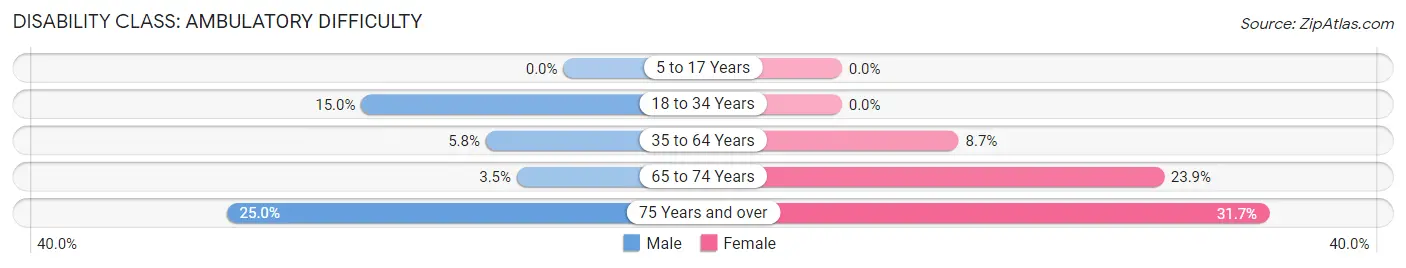
| Age Bracket | Male | Female |
| 5 to 17 Years | 0 (0.0%) | 0 (0.0%) |
| 18 to 34 Years | 18 (15.0%) | 0 (0.0%) |
| 35 to 64 Years | 11 (5.8%) | 13 (8.7%) |
| 65 to 74 Years | 1 (3.5%) | 11 (23.9%) |
| 75 Years and over | 8 (25.0%) | 13 (31.7%) |
Disability Class: Self-Care Difficulty
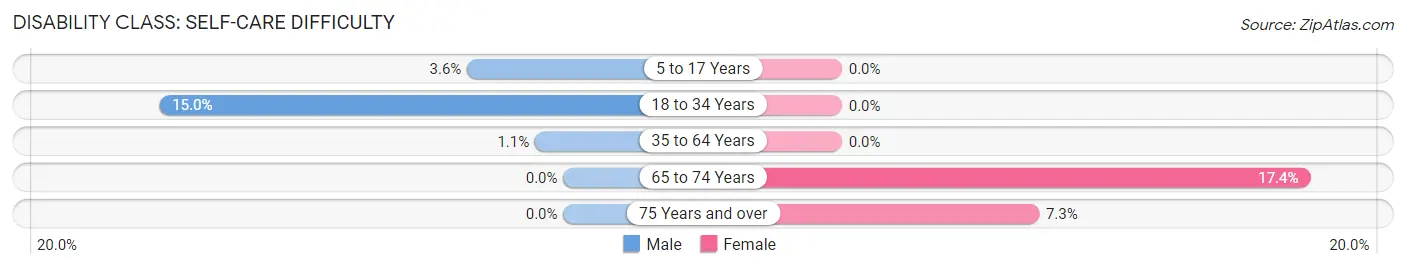
| Age Bracket | Male | Female |
| 5 to 17 Years | 2 (3.6%) | 0 (0.0%) |
| 18 to 34 Years | 18 (15.0%) | 0 (0.0%) |
| 35 to 64 Years | 2 (1.1%) | 0 (0.0%) |
| 65 to 74 Years | 0 (0.0%) | 8 (17.4%) |
| 75 Years and over | 0 (0.0%) | 3 (7.3%) |
Technology Access in Schleswig
Computing Device Access in Schleswig
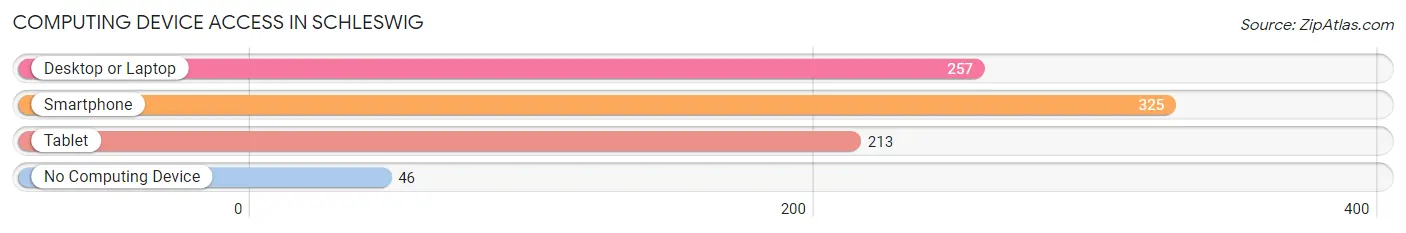
| Device Type | # Households | % Households |
| Desktop or Laptop | 257 | 64.7% |
| Smartphone | 325 | 81.9% |
| Tablet | 213 | 53.6% |
| No Computing Device | 46 | 11.6% |
| Total | 397 | 100.0% |
Internet Access in Schleswig
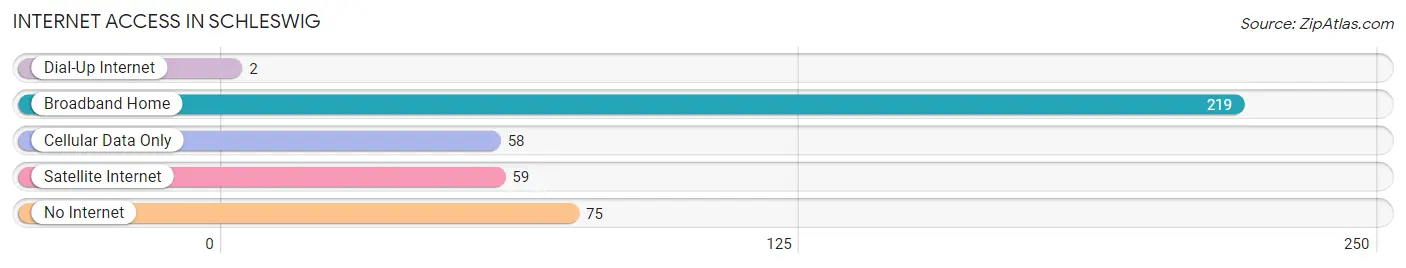
| Internet Type | # Households | % Households |
| Dial-Up Internet | 2 | 0.5% |
| Broadband Home | 219 | 55.2% |
| Cellular Data Only | 58 | 14.6% |
| Satellite Internet | 59 | 14.9% |
| No Internet | 75 | 18.9% |
| Total | 397 | 100.0% |
Schleswig Summary
Schleswig, Iowa is a small town located in Crawford County in the northwest corner of the state. It is situated on the banks of the Boyer River, and is home to a population of just over 1,000 people. The town was founded in 1856 by German immigrants, and has since become a popular destination for tourists and outdoor enthusiasts.
Geography
Schleswig is located in the Loess Hills region of Iowa, which is characterized by rolling hills and deep ravines. The town is situated on the banks of the Boyer River, which is a tributary of the Missouri River. The town is surrounded by farmland, and is located approximately 30 miles from the larger city of Sioux City.
The climate in Schleswig is typical of the Midwest, with hot summers and cold winters. The average temperature in the summer is around 75 degrees Fahrenheit, while the average temperature in the winter is around 25 degrees Fahrenheit. The town receives an average of 36 inches of precipitation each year, with most of it falling in the spring and summer months.
Economy
The economy of Schleswig is largely based on agriculture and tourism. The town is home to several farms, which produce a variety of crops including corn, soybeans, and hay. The town is also home to several small businesses, including a grocery store, a hardware store, and a few restaurants.
Tourism is an important part of the economy in Schleswig. The town is home to several parks and recreational areas, including the Schleswig State Park, which offers camping, fishing, and hiking opportunities. The town is also home to several festivals and events throughout the year, including the Schleswig Germanfest, which celebrates the town's German heritage.
Demographics
As of the 2010 census, the population of Schleswig was 1,039. The racial makeup of the town was 97.3% White, 0.7% African American, 0.3% Native American, 0.2% Asian, and 1.5% from other races. The median household income in Schleswig was $45,000, and the median age was 43.
Conclusion
Schleswig, Iowa is a small town located in Crawford County in the northwest corner of the state. It is situated on the banks of the Boyer River, and is home to a population of just over 1,000 people. The town was founded in 1856 by German immigrants, and has since become a popular destination for tourists and outdoor enthusiasts. The economy of Schleswig is largely based on agriculture and tourism, and the town is home to several parks and recreational areas. The population of Schleswig is predominantly white, with a median household income of $45,000 and a median age of 43.
Common Questions
What is Per Capita Income in Schleswig?
Per Capita income in Schleswig is $33,607.
What is the Median Family Income in Schleswig?
Median Family Income in Schleswig is $69,457.
What is the Median Household income in Schleswig?
Median Household Income in Schleswig is $68,567.
What is Income or Wage Gap in Schleswig?
Income or Wage Gap in Schleswig is 4.9%.
Women in Schleswig earn 95.1 cents for every dollar earned by a man.
What is Inequality or Gini Index in Schleswig?
Inequality or Gini Index in Schleswig is 0.43.
What is the Total Population of Schleswig?
Total Population of Schleswig is 933.
What is the Total Male Population of Schleswig?
Total Male Population of Schleswig is 476.
What is the Total Female Population of Schleswig?
Total Female Population of Schleswig is 457.
What is the Ratio of Males per 100 Females in Schleswig?
There are 104.16 Males per 100 Females in Schleswig.
What is the Ratio of Females per 100 Males in Schleswig?
There are 96.01 Females per 100 Males in Schleswig.
What is the Median Population Age in Schleswig?
Median Population Age in Schleswig is 36.1 Years.
What is the Average Family Size in Schleswig
Average Family Size in Schleswig is 2.8 People.
What is the Average Household Size in Schleswig
Average Household Size in Schleswig is 2.4 People.
How Large is the Labor Force in Schleswig?
There are 507 People in the Labor Forcein in Schleswig.
What is the Percentage of People in the Labor Force in Schleswig?
68.6% of People are in the Labor Force in Schleswig.
What is the Unemployment Rate in Schleswig?
Unemployment Rate in Schleswig is 4.5%.