Creston, IA Map & Demographics
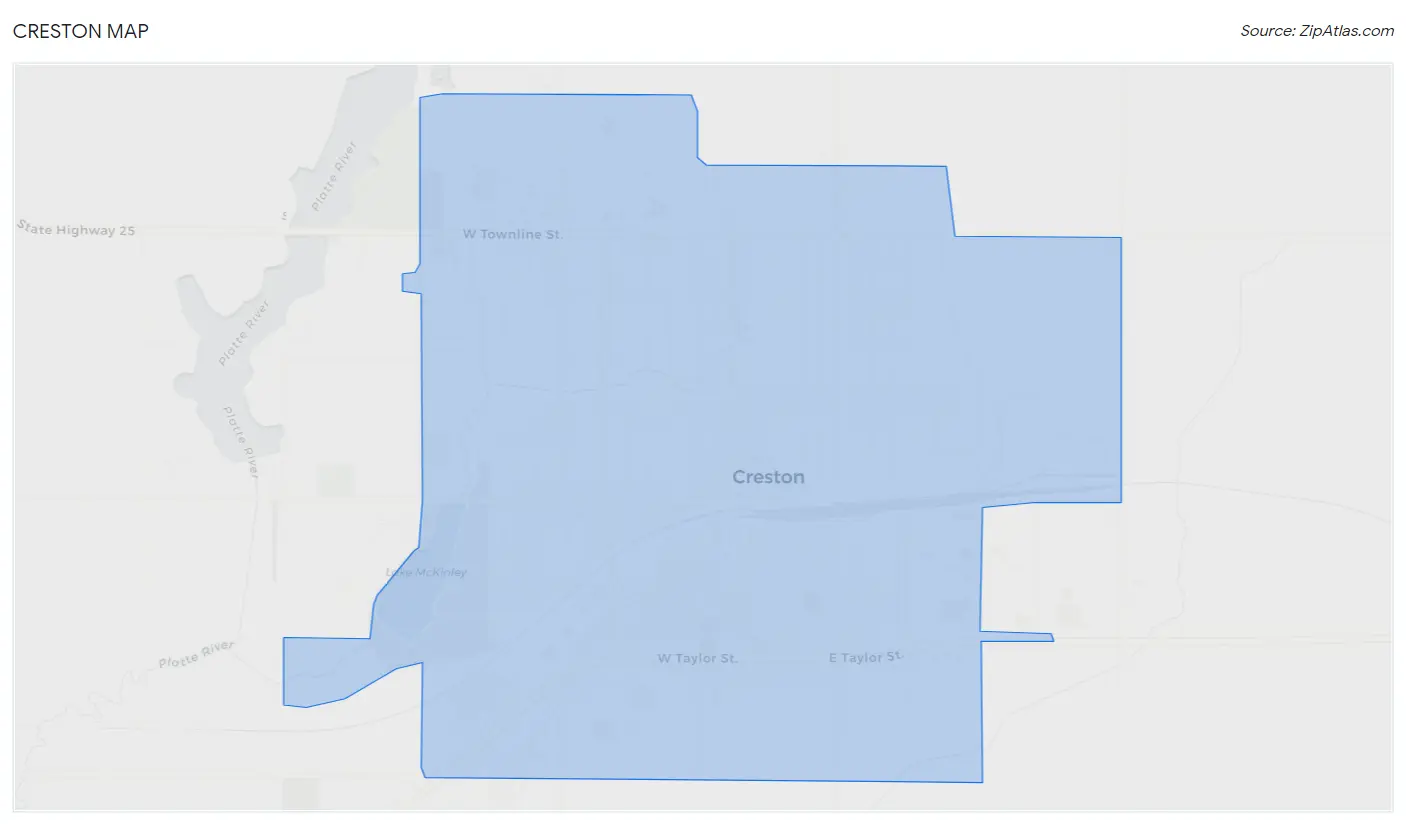
Creston Map
Creston Overview
$29,192
PER CAPITA INCOME
$72,373
AVG FAMILY INCOME
$51,366
AVG HOUSEHOLD INCOME
51.4%
WAGE / INCOME GAP [ % ]
48.6¢/ $1
WAGE / INCOME GAP [ $ ]
$11,411
FAMILY INCOME DEFICIT
0.43
INEQUALITY / GINI INDEX
7,519
TOTAL POPULATION
3,513
MALE POPULATION
4,006
FEMALE POPULATION
87.69
MALES / 100 FEMALES
114.03
FEMALES / 100 MALES
38.7
MEDIAN AGE
3.0
AVG FAMILY SIZE
2.2
AVG HOUSEHOLD SIZE
3,654
LABOR FORCE [ PEOPLE ]
59.7%
PERCENT IN LABOR FORCE
4.5%
UNEMPLOYMENT RATE
Creston Zip Codes
Creston Area Codes
Income in Creston
Income Overview in Creston
Per Capita Income in Creston is $29,192, while median incomes of families and households are $72,373 and $51,366 respectively.
| Characteristic | Number | Measure |
| Per Capita Income | 7,519 | $29,192 |
| Median Family Income | 1,776 | $72,373 |
| Mean Family Income | 1,776 | $79,086 |
| Median Household Income | 3,247 | $51,366 |
| Mean Household Income | 3,247 | $65,191 |
| Income Deficit | 1,776 | $11,411 |
| Wage / Income Gap (%) | 7,519 | 51.40% |
| Wage / Income Gap ($) | 7,519 | 48.60¢ per $1 |
| Gini / Inequality Index | 7,519 | 0.43 |
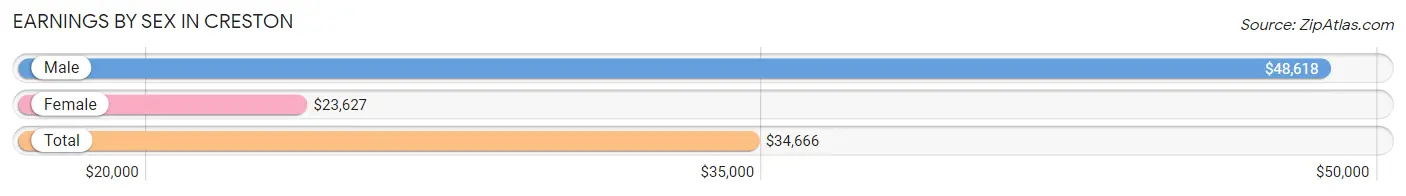
Earnings by Sex in Creston
Average Earnings in Creston are $34,666, $48,618 for men and $23,627 for women, a difference of 51.4%.
| Sex | Number | Average Earnings |
| Male | 1,944 (48.9%) | $48,618 |
| Female | 2,027 (51.0%) | $23,627 |
| Total | 3,971 (100.0%) | $34,666 |
Earnings by Sex by Income Bracket in Creston
The most common earnings brackets in Creston are $55,000 to $64,999 for men (320 | 16.5%) and $2,499 or less for women (238 | 11.7%).
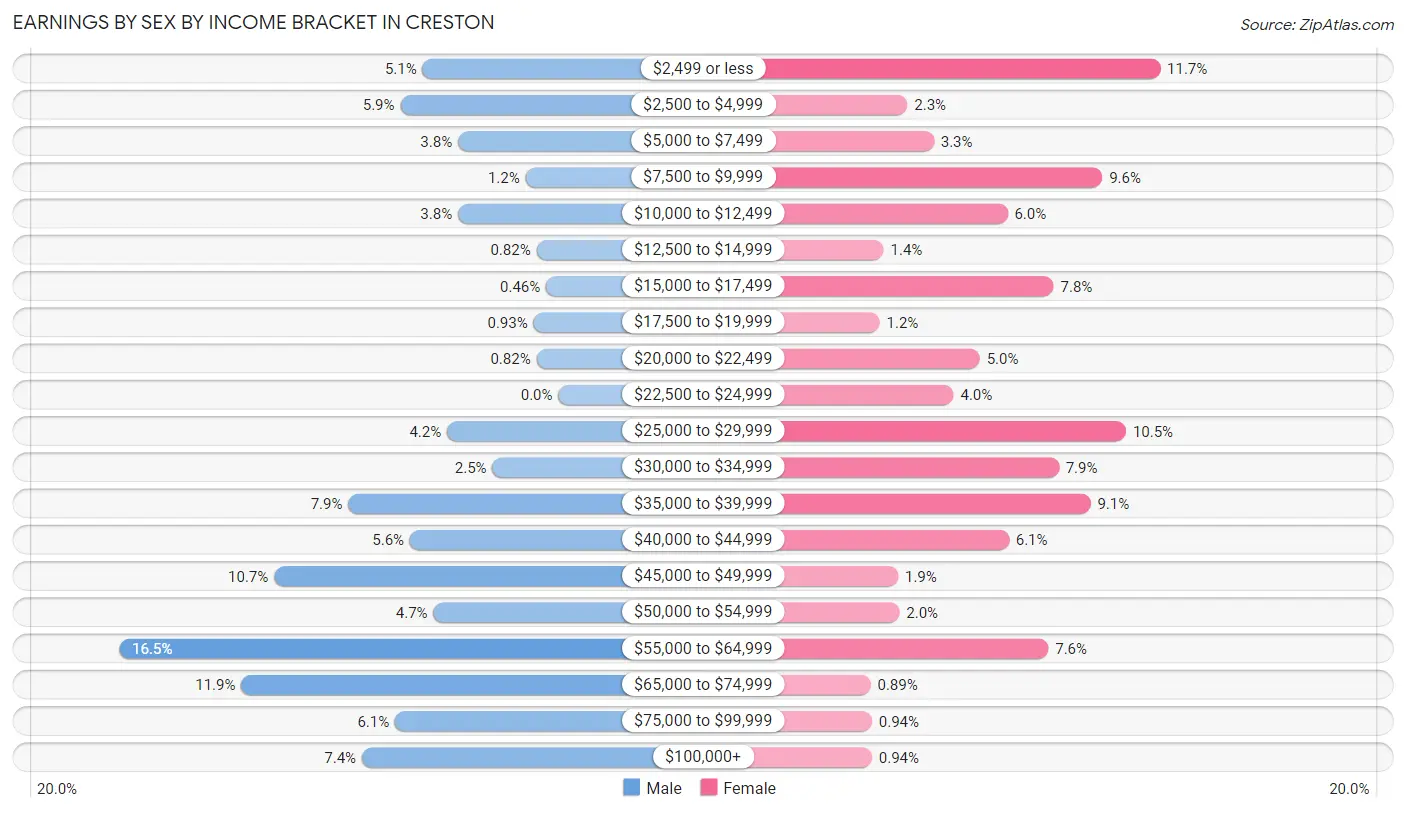
| Income | Male | Female |
| $2,499 or less | 99 (5.1%) | 238 (11.7%) |
| $2,500 to $4,999 | 115 (5.9%) | 46 (2.3%) |
| $5,000 to $7,499 | 73 (3.8%) | 66 (3.3%) |
| $7,500 to $9,999 | 24 (1.2%) | 194 (9.6%) |
| $10,000 to $12,499 | 73 (3.8%) | 122 (6.0%) |
| $12,500 to $14,999 | 16 (0.8%) | 28 (1.4%) |
| $15,000 to $17,499 | 9 (0.5%) | 157 (7.7%) |
| $17,500 to $19,999 | 18 (0.9%) | 25 (1.2%) |
| $20,000 to $22,499 | 16 (0.8%) | 101 (5.0%) |
| $22,500 to $24,999 | 0 (0.0%) | 81 (4.0%) |
| $25,000 to $29,999 | 81 (4.2%) | 212 (10.5%) |
| $30,000 to $34,999 | 48 (2.5%) | 161 (7.9%) |
| $35,000 to $39,999 | 153 (7.9%) | 185 (9.1%) |
| $40,000 to $44,999 | 108 (5.6%) | 123 (6.1%) |
| $45,000 to $49,999 | 207 (10.6%) | 39 (1.9%) |
| $50,000 to $54,999 | 91 (4.7%) | 40 (2.0%) |
| $55,000 to $64,999 | 320 (16.5%) | 153 (7.5%) |
| $65,000 to $74,999 | 231 (11.9%) | 18 (0.9%) |
| $75,000 to $99,999 | 119 (6.1%) | 19 (0.9%) |
| $100,000+ | 143 (7.4%) | 19 (0.9%) |
| Total | 1,944 (100.0%) | 2,027 (100.0%) |
Earnings by Sex by Educational Attainment in Creston
Average earnings in Creston are $52,899 for men and $27,500 for women, a difference of 48.0%. Men with an educational attainment of bachelor's degree enjoy the highest average annual earnings of $58,635, while those with less than high school education earn the least with $35,054. Women with an educational attainment of bachelor's degree earn the most with the average annual earnings of $54,432, while those with college or associate's degree education have the smallest earnings of $22,730.
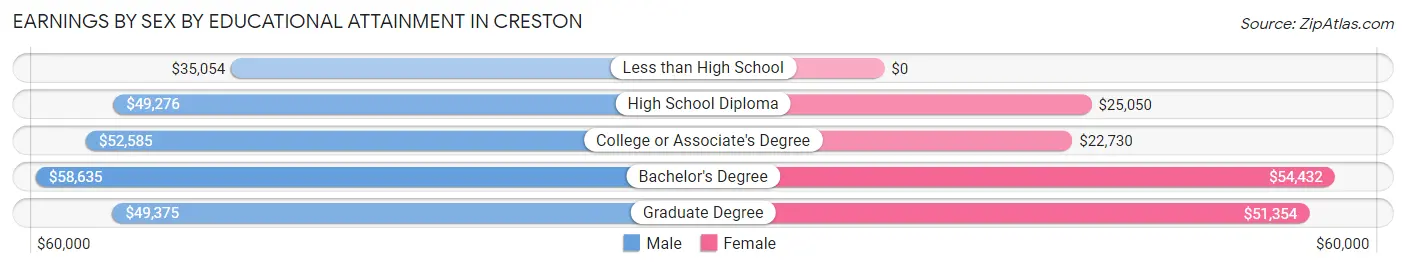
| Educational Attainment | Male Income | Female Income |
| Less than High School | $35,054 | $0 |
| High School Diploma | $49,276 | $25,050 |
| College or Associate's Degree | $52,585 | $22,730 |
| Bachelor's Degree | $58,635 | $54,432 |
| Graduate Degree | $49,375 | $51,354 |
| Total | $52,899 | $27,500 |
Family Income in Creston
Family Income Brackets in Creston
According to the Creston family income data, there are 451 families falling into the $75,000 to $99,999 income range, which is the most common income bracket and makes up 25.4% of all families. Conversely, the $10,000 to $14,999 income bracket is the least frequent group with only 39 families (2.2%) belonging to this category.
| Income Bracket | # Families | % Families |
| Less than $10,000 | 94 | 5.3% |
| $10,000 to $14,999 | 39 | 2.2% |
| $15,000 to $24,999 | 76 | 4.3% |
| $25,000 to $34,999 | 240 | 13.5% |
| $35,000 to $49,999 | 186 | 10.5% |
| $50,000 to $74,999 | 279 | 15.7% |
| $75,000 to $99,999 | 451 | 25.4% |
| $100,000 to $149,999 | 238 | 13.4% |
| $150,000 to $199,999 | 121 | 6.8% |
| $200,000+ | 50 | 2.8% |
Family Income by Famaliy Size in Creston
4-person families (211 | 11.9%) account for the highest median family income in Creston with $109,097 per family, while 2-person families (939 | 52.9%) have the highest median income of $30,625 per family member.
| Income Bracket | # Families | Median Income |
| 2-Person Families | 939 (52.9%) | $61,250 |
| 3-Person Families | 430 (24.2%) | $49,901 |
| 4-Person Families | 211 (11.9%) | $109,097 |
| 5-Person Families | 132 (7.4%) | $86,356 |
| 6-Person Families | 64 (3.6%) | $92,778 |
| 7+ Person Families | 0 (0.0%) | $0 |
| Total | 1,776 (100.0%) | $72,373 |
Family Income by Number of Earners in Creston
The median family income in Creston is $72,373, with families comprising 3+ earners (87) having the highest median family income of $126,420, while families with no earners (289) have the lowest median family income of $38,875, accounting for 4.9% and 16.3% of families, respectively.
| Number of Earners | # Families | Median Income |
| No Earners | 289 (16.3%) | $38,875 |
| 1 Earner | 632 (35.6%) | $48,571 |
| 2 Earners | 768 (43.2%) | $86,531 |
| 3+ Earners | 87 (4.9%) | $126,420 |
| Total | 1,776 (100.0%) | $72,373 |
Household Income in Creston
Household Income Brackets in Creston
With 614 households falling in the category, the $75,000 to $99,999 income range is the most frequent in Creston, accounting for 18.9% of all households. In contrast, only 75 households (2.3%) fall into the $200,000+ income bracket, making it the least populous group.
| Income Bracket | # Households | % Households |
| Less than $10,000 | 188 | 5.8% |
| $10,000 to $14,999 | 127 | 3.9% |
| $15,000 to $24,999 | 409 | 12.6% |
| $25,000 to $34,999 | 403 | 12.4% |
| $35,000 to $49,999 | 468 | 14.4% |
| $50,000 to $74,999 | 545 | 16.8% |
| $75,000 to $99,999 | 614 | 18.9% |
| $100,000 to $149,999 | 299 | 9.2% |
| $150,000 to $199,999 | 120 | 3.7% |
| $200,000+ | 75 | 2.3% |
Household Income by Householder Age in Creston
The median household income in Creston is $51,366, with the highest median household income of $74,741 found in the 25 to 44 years age bracket for the primary householder. A total of 874 households (26.9%) fall into this category. Meanwhile, the 65+ years age bracket for the primary householder has the lowest median household income of $42,174, with 1,084 households (33.4%) in this group.
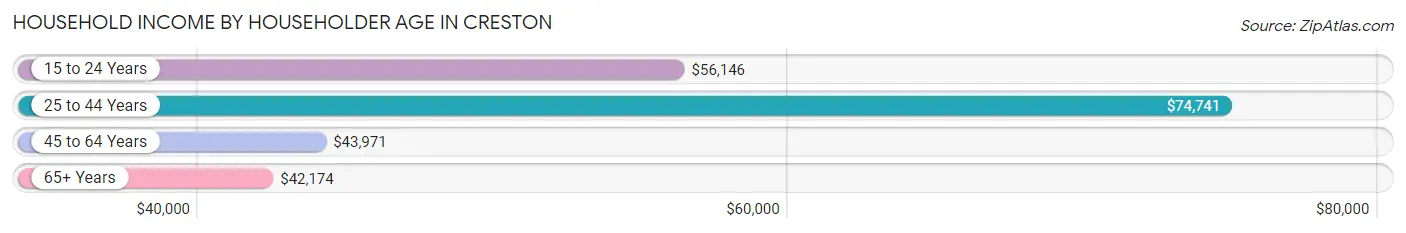
| Income Bracket | # Households | Median Income |
| 15 to 24 Years | 227 (7.0%) | $56,146 |
| 25 to 44 Years | 874 (26.9%) | $74,741 |
| 45 to 64 Years | 1,062 (32.7%) | $43,971 |
| 65+ Years | 1,084 (33.4%) | $42,174 |
| Total | 3,247 (100.0%) | $51,366 |
Poverty in Creston
Income Below Poverty by Sex and Age in Creston
With 7.6% poverty level for males and 19.3% for females among the residents of Creston, 35 to 44 year old males and 16 and 17 year old females are the most vulnerable to poverty, with 77 males (18.8%) and 92 females (48.9%) in their respective age groups living below the poverty level.
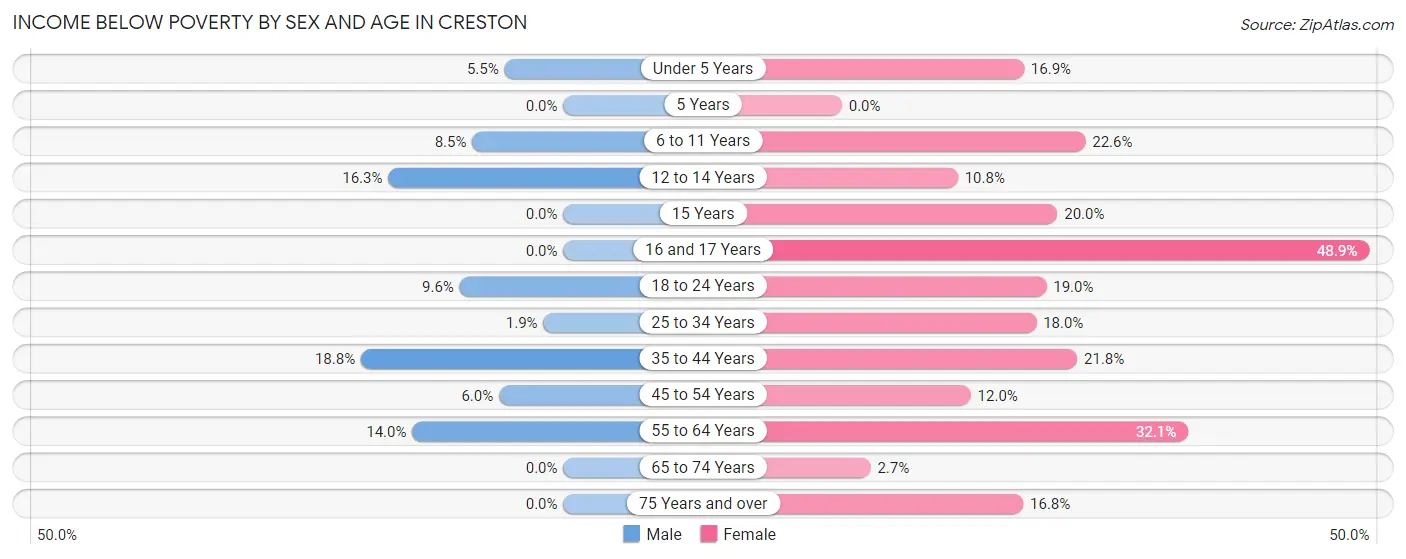
| Age Bracket | Male | Female |
| Under 5 Years | 10 (5.5%) | 48 (16.9%) |
| 5 Years | 0 (0.0%) | 0 (0.0%) |
| 6 to 11 Years | 24 (8.5%) | 40 (22.6%) |
| 12 to 14 Years | 26 (16.3%) | 17 (10.8%) |
| 15 Years | 0 (0.0%) | 7 (20.0%) |
| 16 and 17 Years | 0 (0.0%) | 92 (48.9%) |
| 18 to 24 Years | 35 (9.6%) | 71 (19.0%) |
| 25 to 34 Years | 8 (1.8%) | 70 (18.0%) |
| 35 to 44 Years | 77 (18.8%) | 114 (21.8%) |
| 45 to 54 Years | 23 (6.0%) | 53 (12.0%) |
| 55 to 64 Years | 52 (14.0%) | 152 (32.1%) |
| 65 to 74 Years | 0 (0.0%) | 11 (2.7%) |
| 75 Years and over | 0 (0.0%) | 68 (16.8%) |
| Total | 255 (7.6%) | 743 (19.3%) |
Income Above Poverty by Sex and Age in Creston
According to the poverty statistics in Creston, males aged 5 years and females aged 65 to 74 years are the age groups that are most secure financially, with 100.0% of males and 97.3% of females in these age groups living above the poverty line.
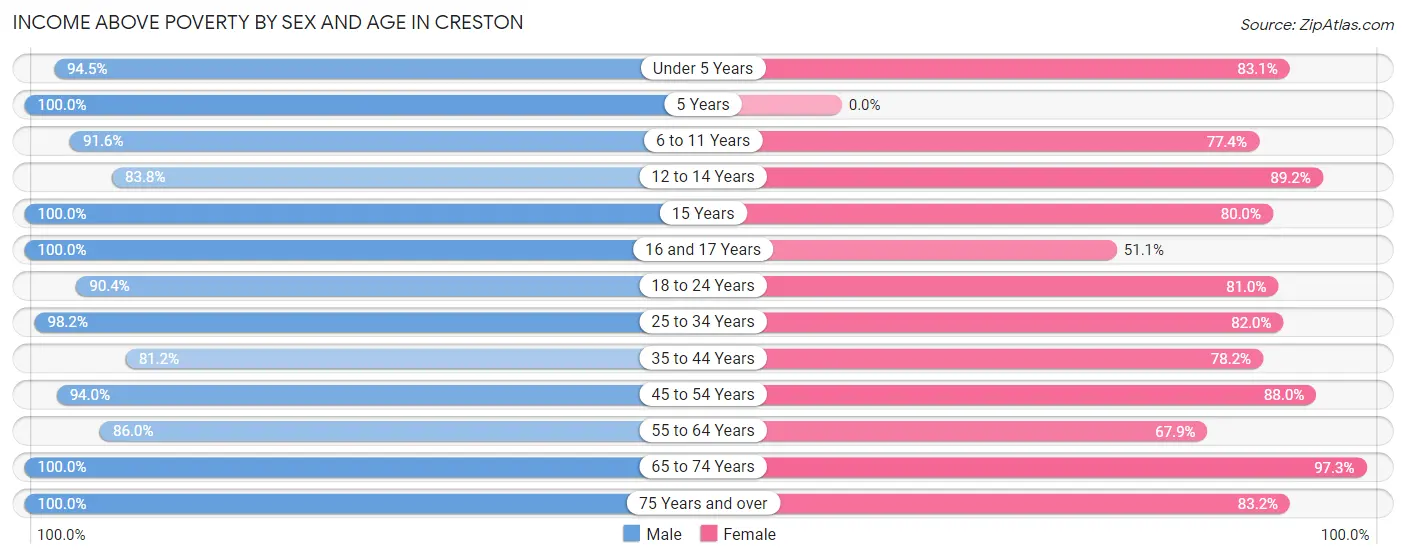
| Age Bracket | Male | Female |
| Under 5 Years | 173 (94.5%) | 236 (83.1%) |
| 5 Years | 16 (100.0%) | 0 (0.0%) |
| 6 to 11 Years | 260 (91.5%) | 137 (77.4%) |
| 12 to 14 Years | 134 (83.8%) | 141 (89.2%) |
| 15 Years | 46 (100.0%) | 28 (80.0%) |
| 16 and 17 Years | 90 (100.0%) | 96 (51.1%) |
| 18 to 24 Years | 329 (90.4%) | 303 (81.0%) |
| 25 to 34 Years | 424 (98.2%) | 318 (82.0%) |
| 35 to 44 Years | 333 (81.2%) | 408 (78.2%) |
| 45 to 54 Years | 362 (94.0%) | 390 (88.0%) |
| 55 to 64 Years | 319 (86.0%) | 321 (67.9%) |
| 65 to 74 Years | 422 (100.0%) | 403 (97.3%) |
| 75 Years and over | 207 (100.0%) | 336 (83.2%) |
| Total | 3,115 (92.4%) | 3,117 (80.7%) |
Income Below Poverty Among Married-Couple Families in Creston
The poverty statistics for married-couple families in Creston show that 3.8% or 48 of the total 1,261 families live below the poverty line. Families with no children have the highest poverty rate of 4.2%, comprising of 32 families. On the other hand, families with 3 or 4 children have the lowest poverty rate of 0.0%, which includes 0 families.
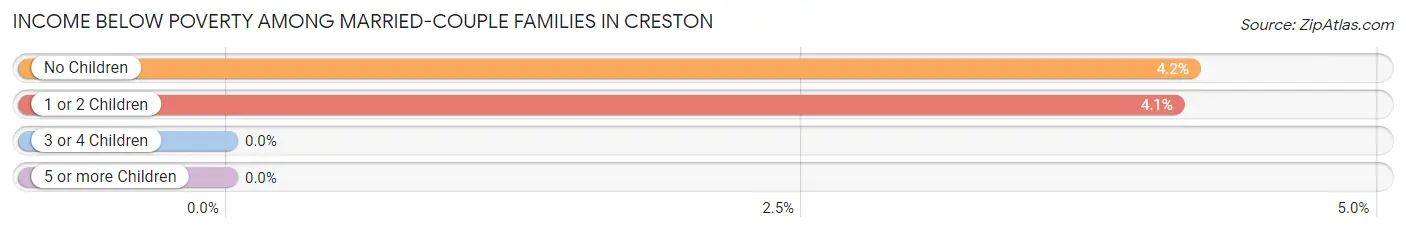
| Children | Above Poverty | Below Poverty |
| No Children | 731 (95.8%) | 32 (4.2%) |
| 1 or 2 Children | 372 (95.9%) | 16 (4.1%) |
| 3 or 4 Children | 110 (100.0%) | 0 (0.0%) |
| 5 or more Children | 0 (0.0%) | 0 (0.0%) |
| Total | 1,213 (96.2%) | 48 (3.8%) |
Income Below Poverty Among Single-Parent Households in Creston
| Children | Single Father | Single Mother |
| No Children | 0 (0.0%) | 18 (14.1%) |
| 1 or 2 Children | 0 (0.0%) | 119 (49.6%) |
| 3 or 4 Children | 0 (0.0%) | 0 (0.0%) |
| 5 or more Children | 0 (0.0%) | 0 (0.0%) |
| Total | 0 (0.0%) | 137 (31.4%) |
Income Below Poverty Among Married-Couple vs Single-Parent Households in Creston
The poverty data for Creston shows that 48 of the married-couple family households (3.8%) and 137 of the single-parent households (26.6%) are living below the poverty level. Within the married-couple family households, those with no children have the highest poverty rate, with 32 households (4.2%) falling below the poverty line. Among the single-parent households, those with 1 or 2 children have the highest poverty rate, with 119 household (43.9%) living below poverty.
| Children | Married-Couple Families | Single-Parent Households |
| No Children | 32 (4.2%) | 18 (10.3%) |
| 1 or 2 Children | 16 (4.1%) | 119 (43.9%) |
| 3 or 4 Children | 0 (0.0%) | 0 (0.0%) |
| 5 or more Children | 0 (0.0%) | 0 (0.0%) |
| Total | 48 (3.8%) | 137 (26.6%) |
Race in Creston
The most populous races in Creston are White / Caucasian (7,180 | 95.5%), Two or more Races (229 | 3.0%), and Hispanic or Latino (114 | 1.5%).
| Race | # Population | % Population |
| Asian | 76 | 1.0% |
| Black / African American | 25 | 0.3% |
| Hawaiian / Pacific | 0 | 0.0% |
| Hispanic or Latino | 114 | 1.5% |
| Native / Alaskan | 0 | 0.0% |
| White / Caucasian | 7,180 | 95.5% |
| Two or more Races | 229 | 3.0% |
| Some other Race | 9 | 0.1% |
| Total | 7,519 | 100.0% |
Ancestry in Creston
The most populous ancestries reported in Creston are German (1,698 | 22.6%), English (1,331 | 17.7%), Irish (1,130 | 15.0%), Swedish (445 | 5.9%), and American (416 | 5.5%), together accounting for 66.8% of all Creston residents.
| Ancestry | # Population | % Population |
| American | 416 | 5.5% |
| Belgian | 10 | 0.1% |
| Bhutanese | 73 | 1.0% |
| British | 94 | 1.3% |
| Burmese | 3 | 0.0% |
| Cherokee | 57 | 0.8% |
| Choctaw | 3 | 0.0% |
| Czech | 118 | 1.6% |
| Danish | 70 | 0.9% |
| Dutch | 235 | 3.1% |
| Eastern European | 46 | 0.6% |
| English | 1,331 | 17.7% |
| European | 52 | 0.7% |
| Finnish | 16 | 0.2% |
| French | 97 | 1.3% |
| French Canadian | 6 | 0.1% |
| German | 1,698 | 22.6% |
| Hungarian | 86 | 1.1% |
| Irish | 1,130 | 15.0% |
| Italian | 65 | 0.9% |
| Korean | 43 | 0.6% |
| Mexican | 65 | 0.9% |
| Northern European | 8 | 0.1% |
| Norwegian | 185 | 2.5% |
| Polish | 214 | 2.9% |
| Puerto Rican | 49 | 0.6% |
| Russian | 14 | 0.2% |
| Scandinavian | 52 | 0.7% |
| Scotch-Irish | 116 | 1.5% |
| Scottish | 260 | 3.5% |
| Sioux | 5 | 0.1% |
| Swedish | 445 | 5.9% |
| Thai | 14 | 0.2% |
| Ukrainian | 8 | 0.1% |
| Welsh | 128 | 1.7% | View All 35 Rows |
Immigrants in Creston
The most numerous immigrant groups reported in Creston came from Asia (76 | 1.0%), Eastern Asia (76 | 1.0%), Japan (73 | 1.0%), Colombia (9 | 0.1%), and Latin America (9 | 0.1%), together accounting for 3.2% of all Creston residents.
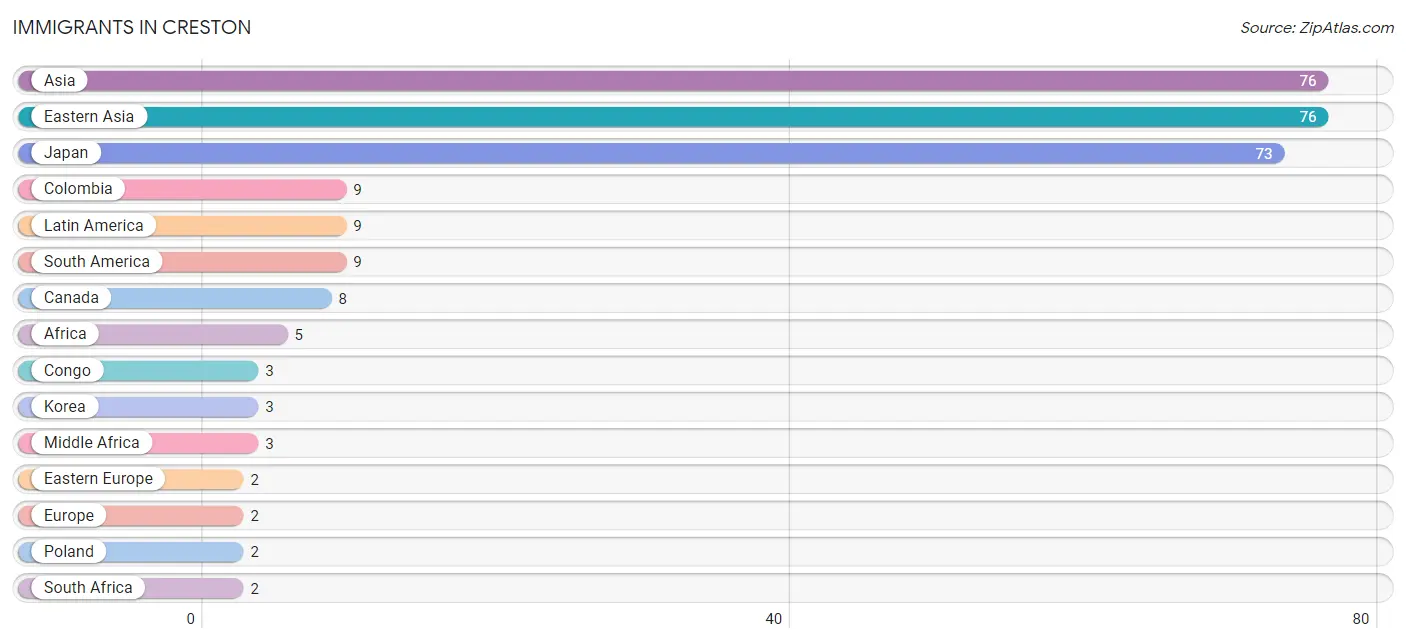
| Immigration Origin | # Population | % Population |
| Africa | 5 | 0.1% |
| Asia | 76 | 1.0% |
| Canada | 8 | 0.1% |
| Colombia | 9 | 0.1% |
| Congo | 3 | 0.0% |
| Eastern Asia | 76 | 1.0% |
| Eastern Europe | 2 | 0.0% |
| Europe | 2 | 0.0% |
| Japan | 73 | 1.0% |
| Korea | 3 | 0.0% |
| Latin America | 9 | 0.1% |
| Middle Africa | 3 | 0.0% |
| Poland | 2 | 0.0% |
| South Africa | 2 | 0.0% |
| South America | 9 | 0.1% | View All 15 Rows |
Sex and Age in Creston
Sex and Age in Creston
The most populous age groups in Creston are 35 to 39 Years (298 | 8.5%) for men and 15 to 19 Years (372 | 9.3%) for women.
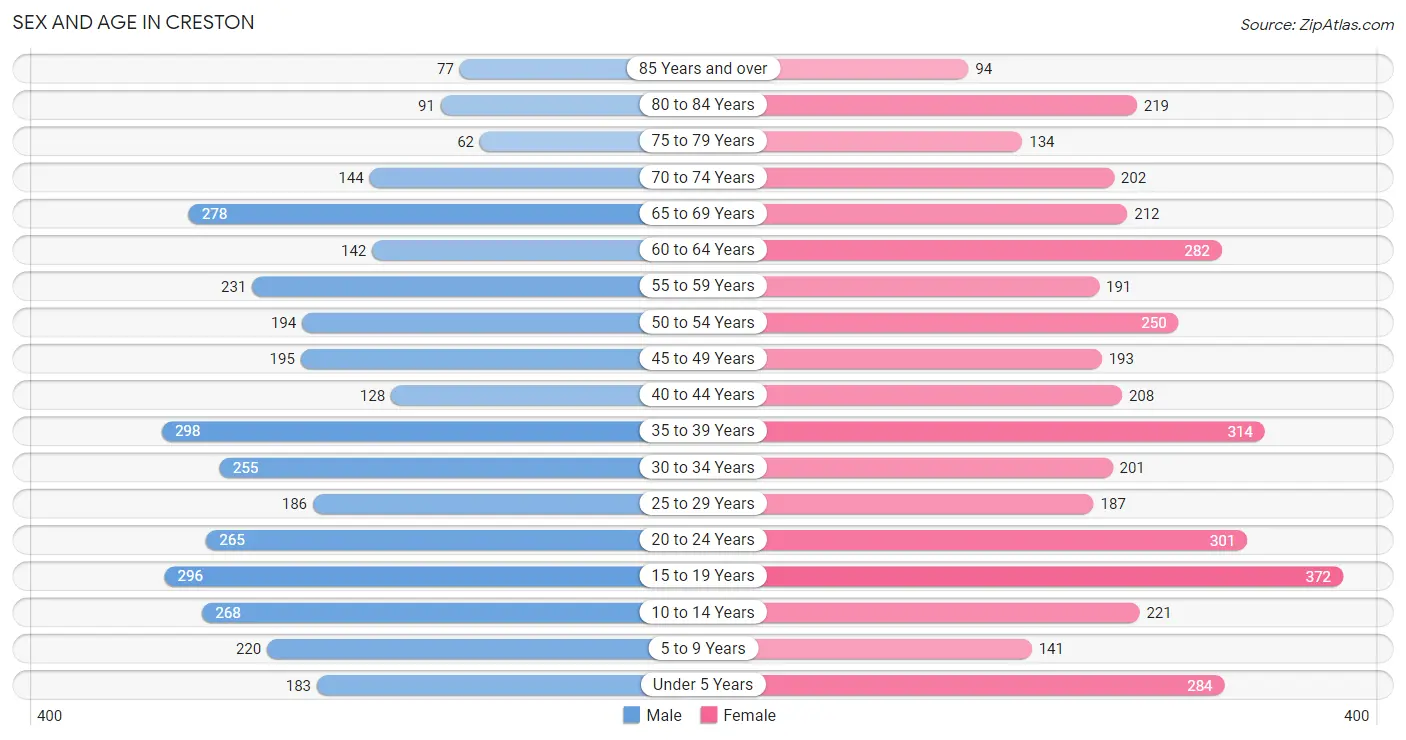
| Age Bracket | Male | Female |
| Under 5 Years | 183 (5.2%) | 284 (7.1%) |
| 5 to 9 Years | 220 (6.3%) | 141 (3.5%) |
| 10 to 14 Years | 268 (7.6%) | 221 (5.5%) |
| 15 to 19 Years | 296 (8.4%) | 372 (9.3%) |
| 20 to 24 Years | 265 (7.5%) | 301 (7.5%) |
| 25 to 29 Years | 186 (5.3%) | 187 (4.7%) |
| 30 to 34 Years | 255 (7.3%) | 201 (5.0%) |
| 35 to 39 Years | 298 (8.5%) | 314 (7.8%) |
| 40 to 44 Years | 128 (3.6%) | 208 (5.2%) |
| 45 to 49 Years | 195 (5.6%) | 193 (4.8%) |
| 50 to 54 Years | 194 (5.5%) | 250 (6.2%) |
| 55 to 59 Years | 231 (6.6%) | 191 (4.8%) |
| 60 to 64 Years | 142 (4.0%) | 282 (7.0%) |
| 65 to 69 Years | 278 (7.9%) | 212 (5.3%) |
| 70 to 74 Years | 144 (4.1%) | 202 (5.0%) |
| 75 to 79 Years | 62 (1.8%) | 134 (3.3%) |
| 80 to 84 Years | 91 (2.6%) | 219 (5.5%) |
| 85 Years and over | 77 (2.2%) | 94 (2.4%) |
| Total | 3,513 (100.0%) | 4,006 (100.0%) |
Families and Households in Creston
Median Family Size in Creston
The median family size in Creston is 2.96 persons per family, with single male/father families (78 | 4.4%) accounting for the largest median family size of 3.32 persons per family. On the other hand, married-couple families (1,261 | 71.0%) represent the smallest median family size with 2.93 persons per family.
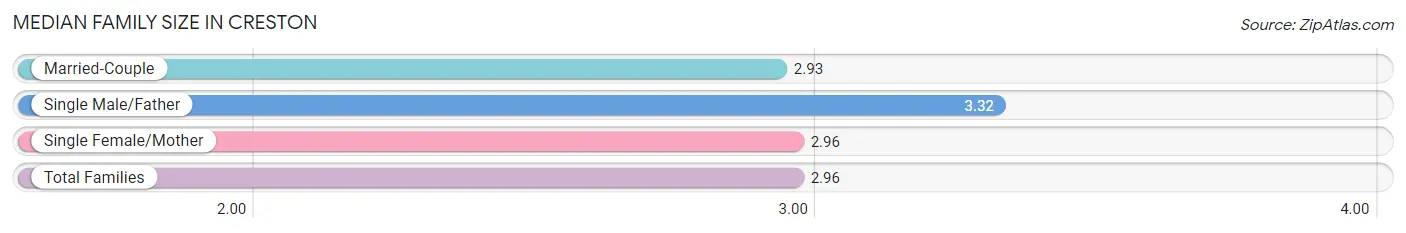
| Family Type | # Families | Family Size |
| Married-Couple | 1,261 (71.0%) | 2.93 |
| Single Male/Father | 78 (4.4%) | 3.32 |
| Single Female/Mother | 437 (24.6%) | 2.96 |
| Total Families | 1,776 (100.0%) | 2.96 |
Median Household Size in Creston
The median household size in Creston is 2.24 persons per household, with single male/father households (78 | 2.4%) accounting for the largest median household size of 3.91 persons per household. non-family households (1,471 | 45.3%) represent the smallest median household size with 1.23 persons per household.
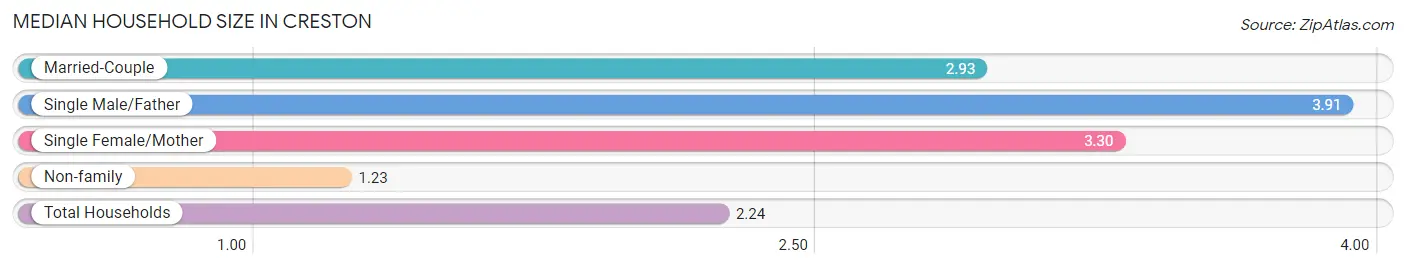
| Household Type | # Households | Household Size |
| Married-Couple | 1,261 (38.8%) | 2.93 |
| Single Male/Father | 78 (2.4%) | 3.91 |
| Single Female/Mother | 437 (13.5%) | 3.30 |
| Non-family | 1,471 (45.3%) | 1.23 |
| Total Households | 3,247 (100.0%) | 2.24 |
Household Size by Marriage Status in Creston
Out of a total of 3,247 households in Creston, 1,776 (54.7%) are family households, while 1,471 (45.3%) are nonfamily households. The most numerous type of family households are 2-person households, comprising 900, and the most common type of nonfamily households are 1-person households, comprising 1,279.
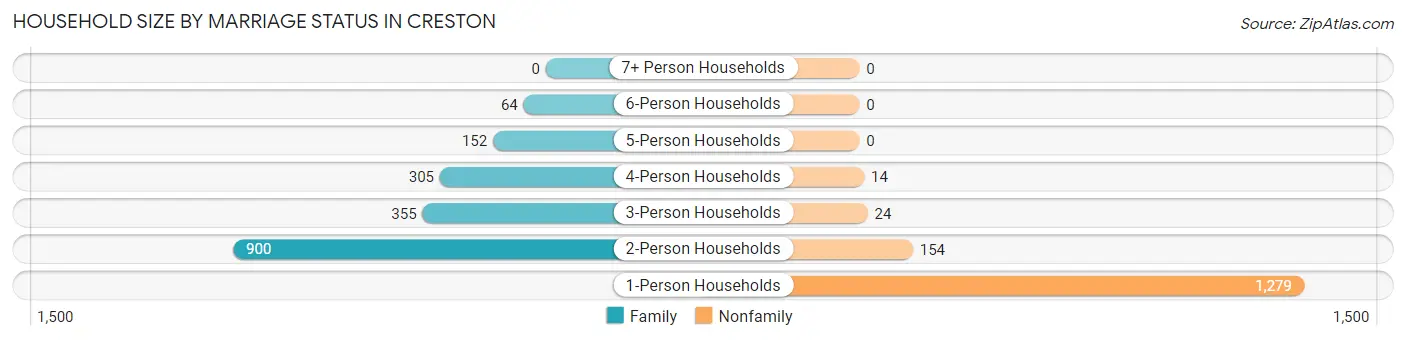
| Household Size | Family Households | Nonfamily Households |
| 1-Person Households | - | 1,279 (39.4%) |
| 2-Person Households | 900 (27.7%) | 154 (4.7%) |
| 3-Person Households | 355 (10.9%) | 24 (0.7%) |
| 4-Person Households | 305 (9.4%) | 14 (0.4%) |
| 5-Person Households | 152 (4.7%) | 0 (0.0%) |
| 6-Person Households | 64 (2.0%) | 0 (0.0%) |
| 7+ Person Households | 0 (0.0%) | 0 (0.0%) |
| Total | 1,776 (54.7%) | 1,471 (45.3%) |
Female Fertility in Creston
Fertility by Age in Creston
Average fertility rate in Creston is 17.0 births per 1,000 women. Women in the age bracket of 20 to 34 years have the highest fertility rate with 26.0 births per 1,000 women. Women in the age bracket of 20 to 34 years acount for 58.1% of all women with births.
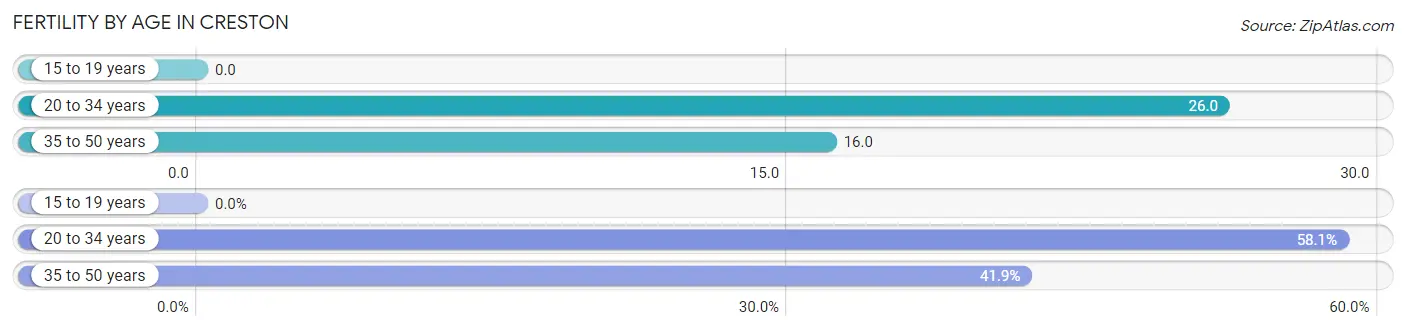
| Age Bracket | Women with Births | Births / 1,000 Women |
| 15 to 19 years | 0 (0.0%) | 0.0 |
| 20 to 34 years | 18 (58.1%) | 26.0 |
| 35 to 50 years | 13 (41.9%) | 16.0 |
| Total | 31 (100.0%) | 17.0 |
Fertility by Age by Marriage Status in Creston
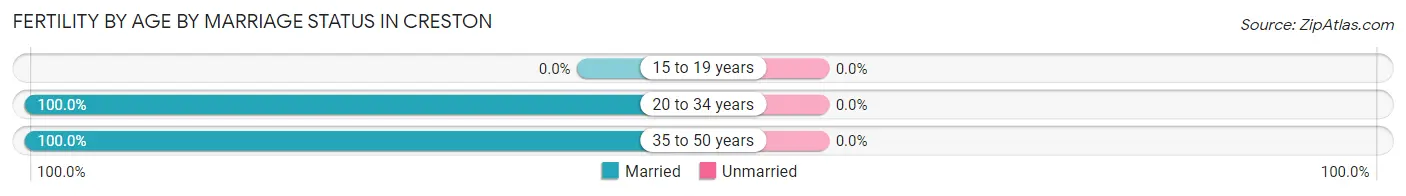
| Age Bracket | Married | Unmarried |
| 15 to 19 years | 0 (0.0%) | 0 (0.0%) |
| 20 to 34 years | 18 (100.0%) | 0 (0.0%) |
| 35 to 50 years | 13 (100.0%) | 0 (0.0%) |
| Total | 31 (100.0%) | 0 (0.0%) |
Fertility by Education in Creston
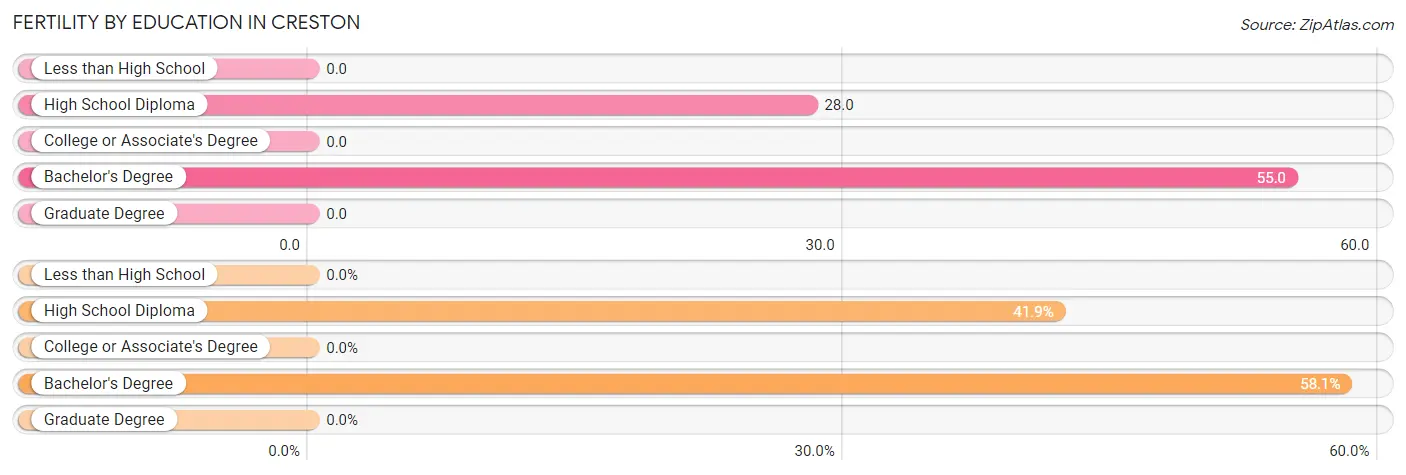
| Educational Attainment | Women with Births | Births / 1,000 Women |
| Less than High School | 0 (0.0%) | 0.0 |
| High School Diploma | 13 (41.9%) | 28.0 |
| College or Associate's Degree | 0 (0.0%) | 0.0 |
| Bachelor's Degree | 18 (58.1%) | 55.0 |
| Graduate Degree | 0 (0.0%) | 0.0 |
| Total | 31 (100.0%) | 17.0 |
Fertility by Education by Marriage Status in Creston
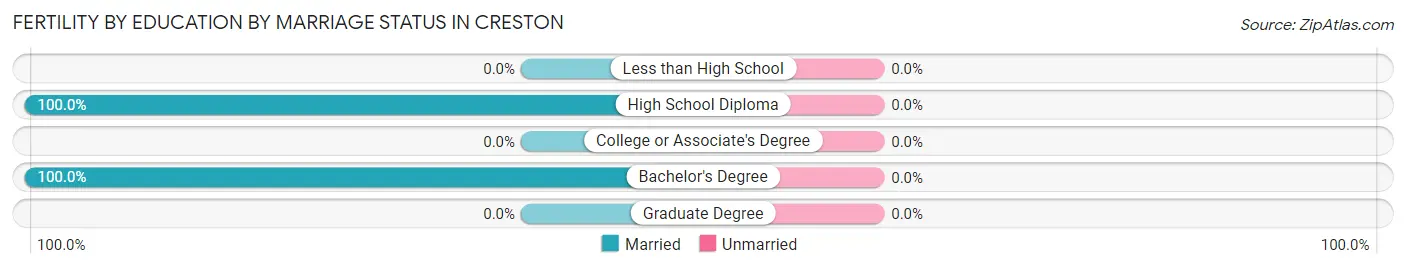
| Educational Attainment | Married | Unmarried |
| Less than High School | 0 (0.0%) | 0 (0.0%) |
| High School Diploma | 13 (100.0%) | 0 (0.0%) |
| College or Associate's Degree | 0 (0.0%) | 0 (0.0%) |
| Bachelor's Degree | 18 (100.0%) | 0 (0.0%) |
| Graduate Degree | 0 (0.0%) | 0 (0.0%) |
| Total | 31 (100.0%) | 0 (0.0%) |
Employment Characteristics in Creston
Employment by Class of Employer in Creston
Among the 3,395 employed individuals in Creston, private company employees (2,268 | 66.8%), self-employed (not incorporated) (287 | 8.5%), and not-for-profit organizations (272 | 8.0%) make up the most common classes of employment.
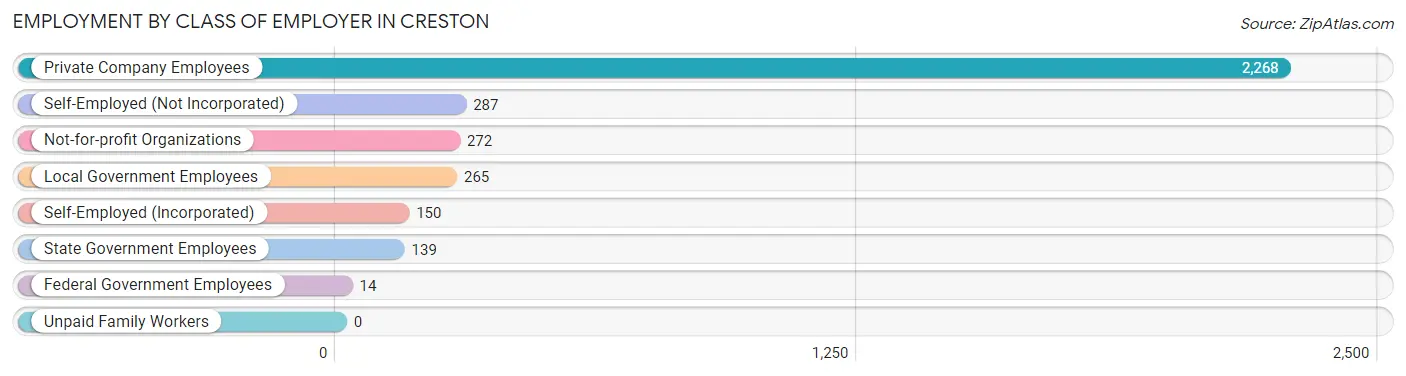
| Employer Class | # Employees | % Employees |
| Private Company Employees | 2,268 | 66.8% |
| Self-Employed (Incorporated) | 150 | 4.4% |
| Self-Employed (Not Incorporated) | 287 | 8.5% |
| Not-for-profit Organizations | 272 | 8.0% |
| Local Government Employees | 265 | 7.8% |
| State Government Employees | 139 | 4.1% |
| Federal Government Employees | 14 | 0.4% |
| Unpaid Family Workers | 0 | 0.0% |
| Total | 3,395 | 100.0% |
Employment Status by Age in Creston
According to the labor force statistics for Creston, out of the total population over 16 years of age (6,121), 59.7% or 3,654 individuals are in the labor force, with 4.5% or 164 of them unemployed. The age group with the highest labor force participation rate is 35 to 44 years, with 85.0% or 806 individuals in the labor force. Within the labor force, the 35 to 44 years age range has the highest percentage of unemployed individuals, with 13.8% or 111 of them being unemployed.
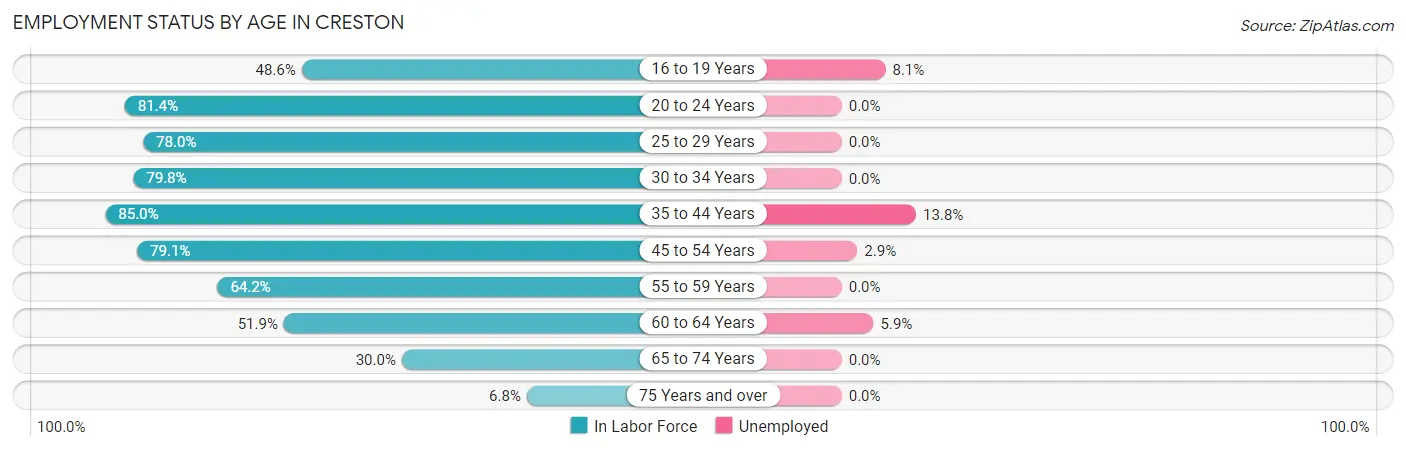
| Age Bracket | In Labor Force | Unemployed |
| 16 to 19 Years | 285 (48.6%) | 23 (8.1%) |
| 20 to 24 Years | 461 (81.4%) | 0 (0.0%) |
| 25 to 29 Years | 291 (78.0%) | 0 (0.0%) |
| 30 to 34 Years | 364 (79.8%) | 0 (0.0%) |
| 35 to 44 Years | 806 (85.0%) | 111 (13.8%) |
| 45 to 54 Years | 658 (79.1%) | 19 (2.9%) |
| 55 to 59 Years | 271 (64.2%) | 0 (0.0%) |
| 60 to 64 Years | 220 (51.9%) | 13 (5.9%) |
| 65 to 74 Years | 251 (30.0%) | 0 (0.0%) |
| 75 Years and over | 46 (6.8%) | 0 (0.0%) |
| Total | 3,654 (59.7%) | 164 (4.5%) |
Employment Status by Educational Attainment in Creston
According to labor force statistics for Creston, 75.5% of individuals (2,609) out of the total population between 25 and 64 years of age (3,455) are in the labor force, with 5.5% or 143 of them being unemployed. The group with the highest labor force participation rate are those with the educational attainment of college / associate degree, with 82.3% or 992 individuals in the labor force. Within the labor force, individuals with college / associate degree education have the highest percentage of unemployment, with 8.6% or 85 of them being unemployed.
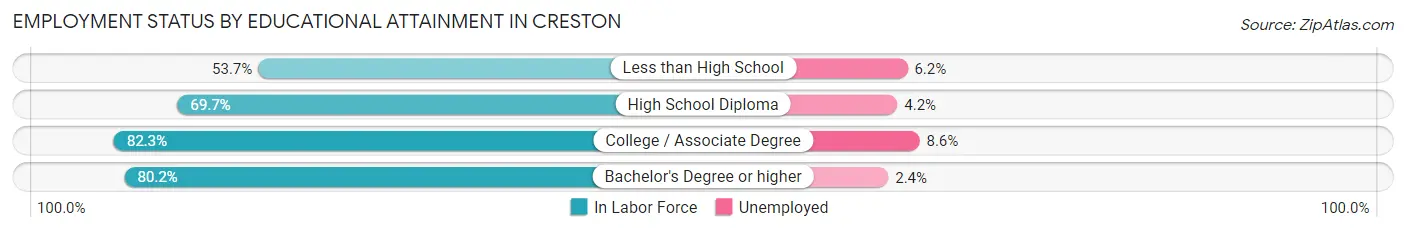
| Educational Attainment | In Labor Force | Unemployed |
| Less than High School | 145 (53.7%) | 17 (6.2%) |
| High School Diploma | 760 (69.7%) | 46 (4.2%) |
| College / Associate Degree | 992 (82.3%) | 104 (8.6%) |
| Bachelor's Degree or higher | 713 (80.2%) | 21 (2.4%) |
| Total | 2,609 (75.5%) | 190 (5.5%) |
Employment Occupations by Sex in Creston
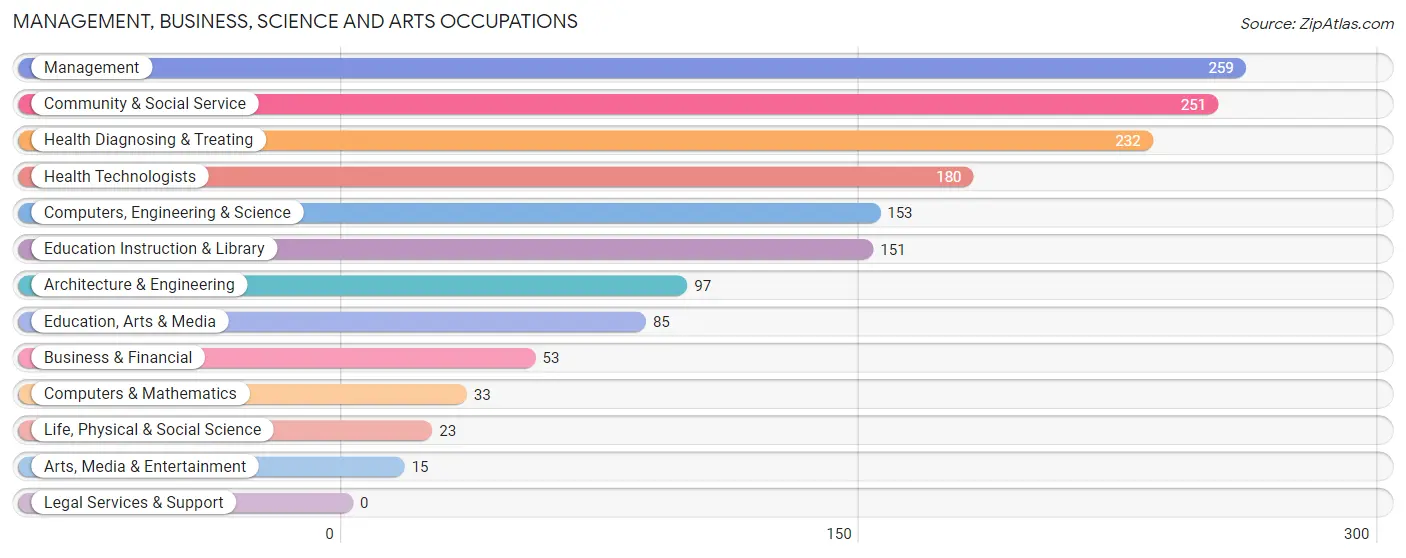
Management, Business, Science and Arts Occupations
The most common Management, Business, Science and Arts occupations in Creston are Management (259 | 7.4%), Community & Social Service (251 | 7.2%), Health Diagnosing & Treating (232 | 6.7%), Health Technologists (180 | 5.2%), and Computers, Engineering & Science (153 | 4.4%).
Management, Business, Science and Arts Occupations by Sex
Within the Management, Business, Science and Arts occupations in Creston, the most male-oriented occupations are Architecture & Engineering (88.7%), Computers & Mathematics (87.9%), and Computers, Engineering & Science (83.7%), while the most female-oriented occupations are Arts, Media & Entertainment (100.0%), Business & Financial (84.9%), and Health Diagnosing & Treating (83.2%).
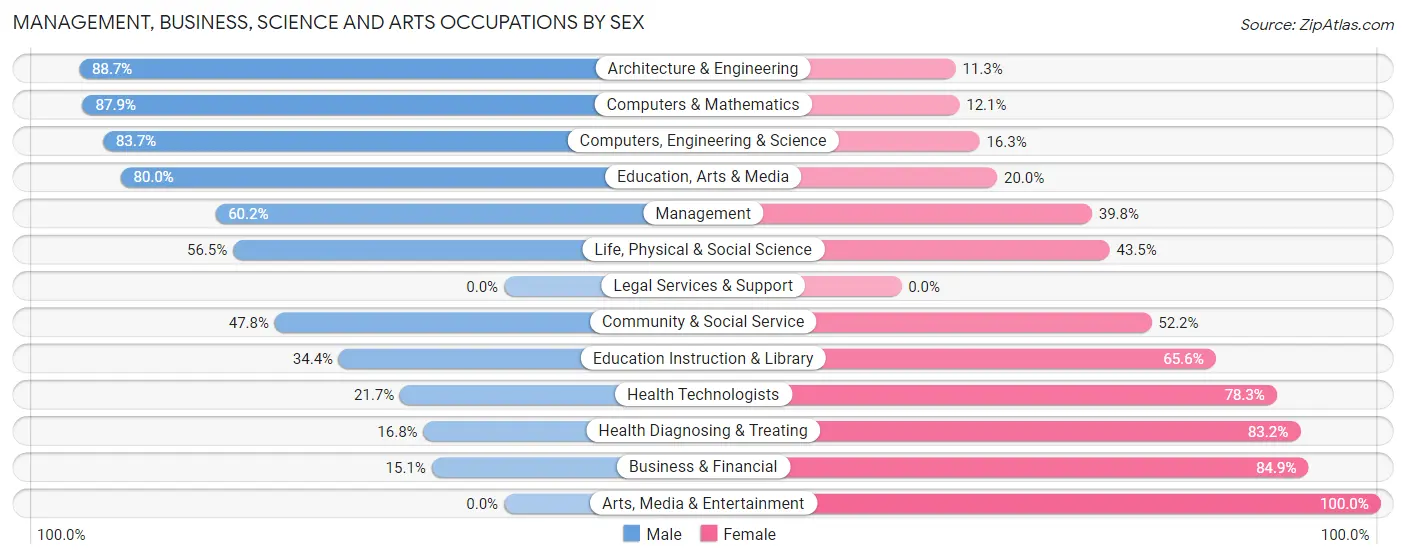
| Occupation | Male | Female |
| Management | 156 (60.2%) | 103 (39.8%) |
| Business & Financial | 8 (15.1%) | 45 (84.9%) |
| Computers, Engineering & Science | 128 (83.7%) | 25 (16.3%) |
| Computers & Mathematics | 29 (87.9%) | 4 (12.1%) |
| Architecture & Engineering | 86 (88.7%) | 11 (11.3%) |
| Life, Physical & Social Science | 13 (56.5%) | 10 (43.5%) |
| Community & Social Service | 120 (47.8%) | 131 (52.2%) |
| Education, Arts & Media | 68 (80.0%) | 17 (20.0%) |
| Legal Services & Support | 0 (0.0%) | 0 (0.0%) |
| Education Instruction & Library | 52 (34.4%) | 99 (65.6%) |
| Arts, Media & Entertainment | 0 (0.0%) | 15 (100.0%) |
| Health Diagnosing & Treating | 39 (16.8%) | 193 (83.2%) |
| Health Technologists | 39 (21.7%) | 141 (78.3%) |
| Total (Category) | 451 (47.6%) | 497 (52.4%) |
| Total (Overall) | 1,752 (50.2%) | 1,735 (49.8%) |
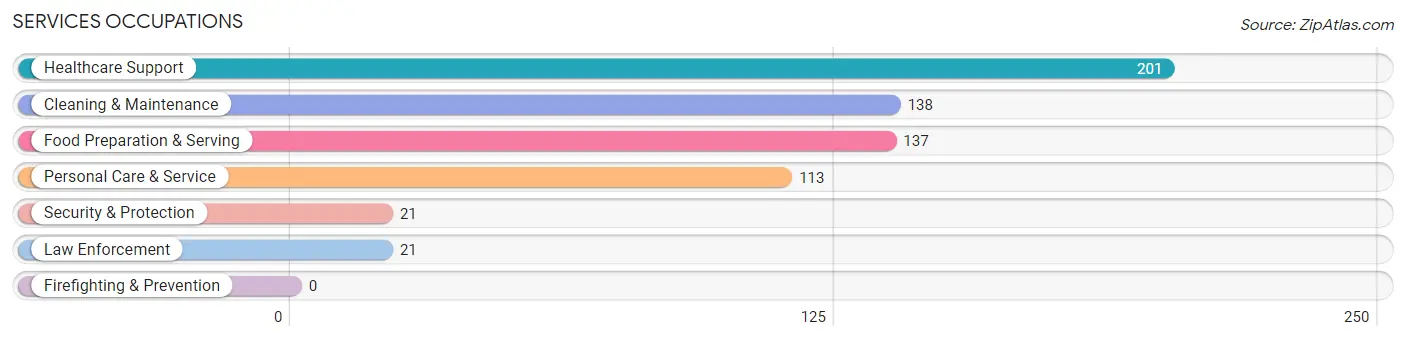
Services Occupations
The most common Services occupations in Creston are Healthcare Support (201 | 5.8%), Cleaning & Maintenance (138 | 4.0%), Food Preparation & Serving (137 | 3.9%), Personal Care & Service (113 | 3.2%), and Security & Protection (21 | 0.6%).
Services Occupations by Sex
Within the Services occupations in Creston, the most male-oriented occupations are Security & Protection (100.0%), Law Enforcement (100.0%), and Food Preparation & Serving (48.2%), while the most female-oriented occupations are Personal Care & Service (100.0%), Healthcare Support (96.0%), and Cleaning & Maintenance (63.8%).
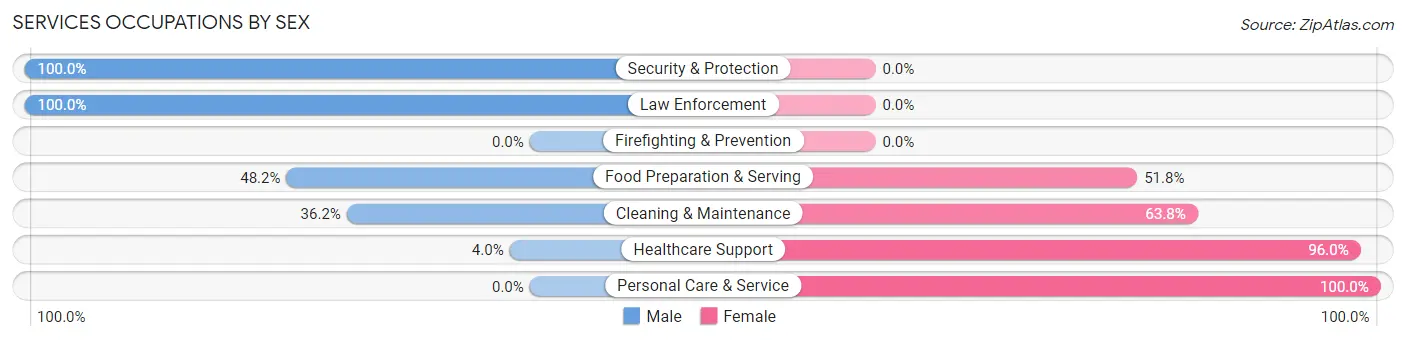
| Occupation | Male | Female |
| Healthcare Support | 8 (4.0%) | 193 (96.0%) |
| Security & Protection | 21 (100.0%) | 0 (0.0%) |
| Firefighting & Prevention | 0 (0.0%) | 0 (0.0%) |
| Law Enforcement | 21 (100.0%) | 0 (0.0%) |
| Food Preparation & Serving | 66 (48.2%) | 71 (51.8%) |
| Cleaning & Maintenance | 50 (36.2%) | 88 (63.8%) |
| Personal Care & Service | 0 (0.0%) | 113 (100.0%) |
| Total (Category) | 145 (23.8%) | 465 (76.2%) |
| Total (Overall) | 1,752 (50.2%) | 1,735 (49.8%) |
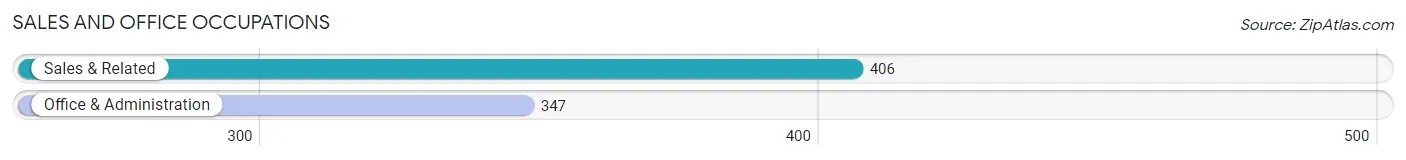
Sales and Office Occupations
The most common Sales and Office occupations in Creston are Sales & Related (406 | 11.6%), and Office & Administration (347 | 10.0%).
Sales and Office Occupations by Sex
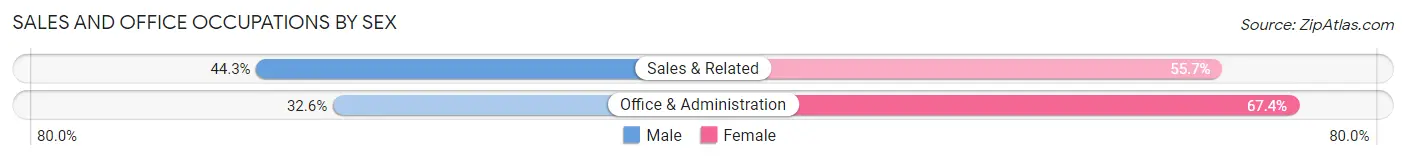
| Occupation | Male | Female |
| Sales & Related | 180 (44.3%) | 226 (55.7%) |
| Office & Administration | 113 (32.6%) | 234 (67.4%) |
| Total (Category) | 293 (38.9%) | 460 (61.1%) |
| Total (Overall) | 1,752 (50.2%) | 1,735 (49.8%) |
Natural Resources, Construction and Maintenance Occupations
The most common Natural Resources, Construction and Maintenance occupations in Creston are Installation, Maintenance & Repair (159 | 4.6%), Construction & Extraction (132 | 3.8%), and Farming, Fishing & Forestry (23 | 0.7%).
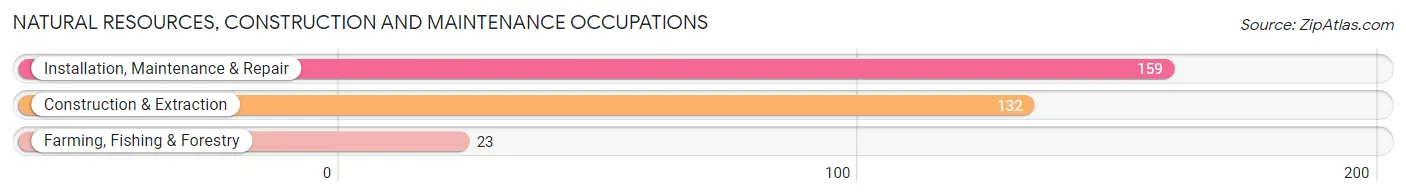
Natural Resources, Construction and Maintenance Occupations by Sex
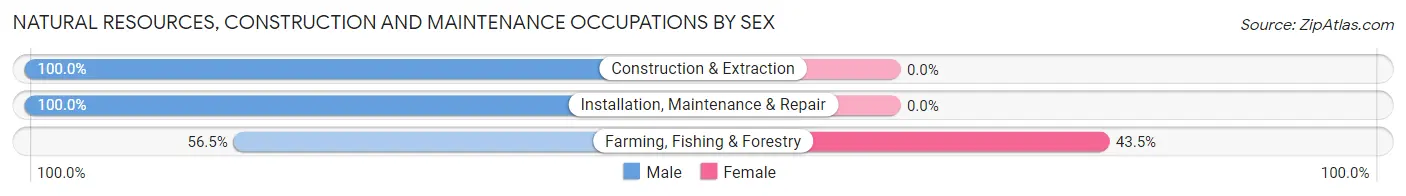
| Occupation | Male | Female |
| Farming, Fishing & Forestry | 13 (56.5%) | 10 (43.5%) |
| Construction & Extraction | 132 (100.0%) | 0 (0.0%) |
| Installation, Maintenance & Repair | 159 (100.0%) | 0 (0.0%) |
| Total (Category) | 304 (96.8%) | 10 (3.2%) |
| Total (Overall) | 1,752 (50.2%) | 1,735 (49.8%) |
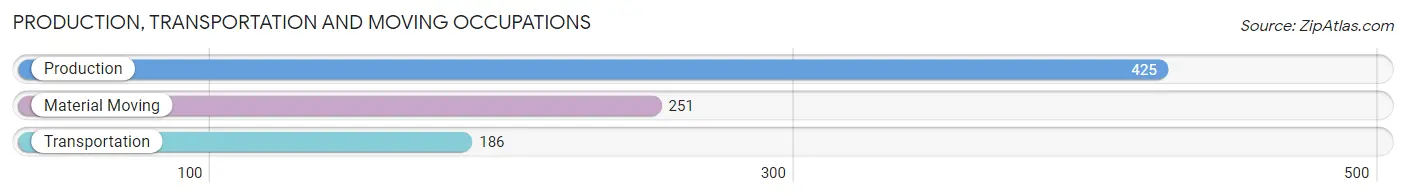
Production, Transportation and Moving Occupations
The most common Production, Transportation and Moving occupations in Creston are Production (425 | 12.2%), Material Moving (251 | 7.2%), and Transportation (186 | 5.3%).
Production, Transportation and Moving Occupations by Sex
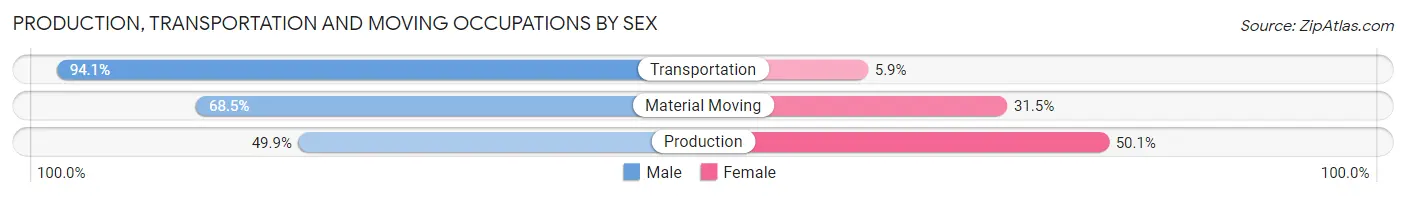
| Occupation | Male | Female |
| Production | 212 (49.9%) | 213 (50.1%) |
| Transportation | 175 (94.1%) | 11 (5.9%) |
| Material Moving | 172 (68.5%) | 79 (31.5%) |
| Total (Category) | 559 (64.8%) | 303 (35.1%) |
| Total (Overall) | 1,752 (50.2%) | 1,735 (49.8%) |
Employment Industries by Sex in Creston
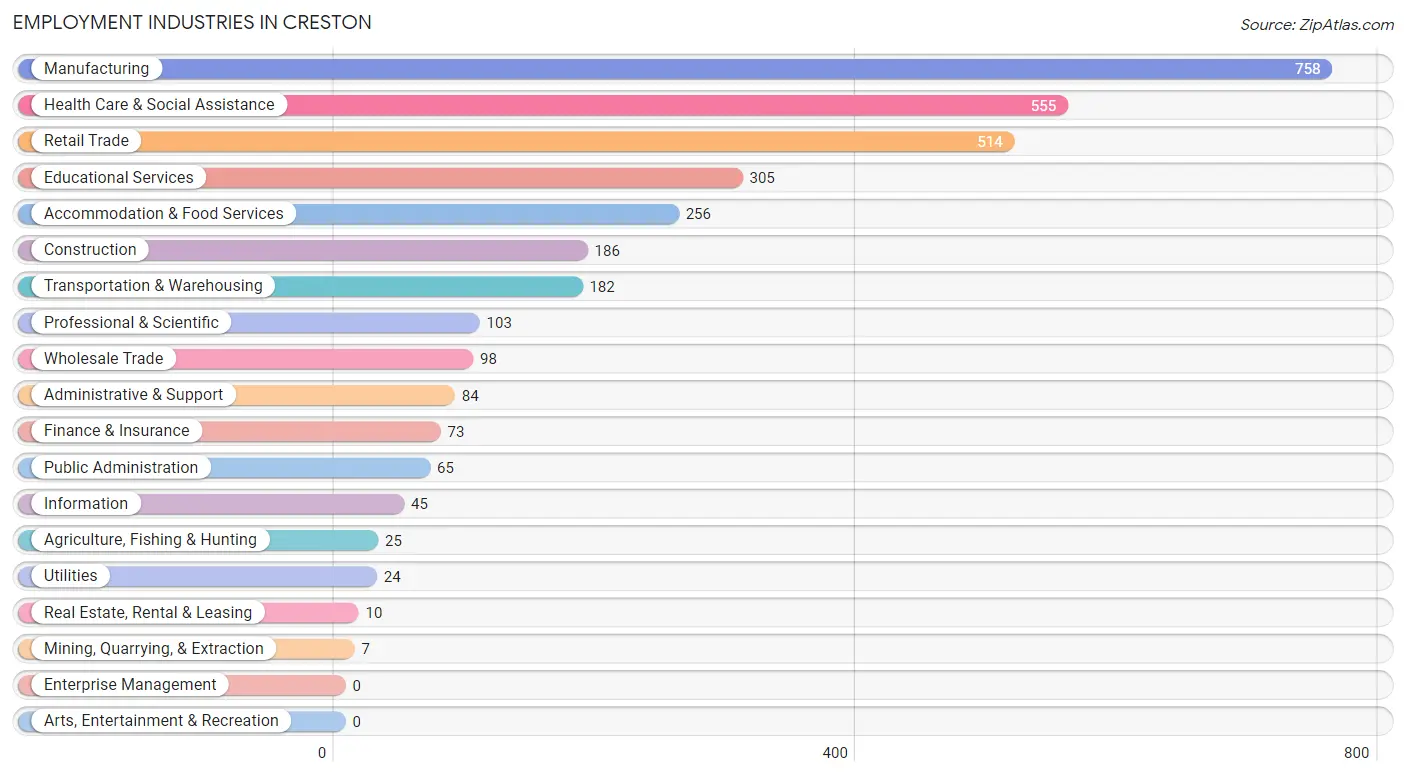
Employment Industries in Creston
The major employment industries in Creston include Manufacturing (758 | 21.7%), Health Care & Social Assistance (555 | 15.9%), Retail Trade (514 | 14.7%), Educational Services (305 | 8.7%), and Accommodation & Food Services (256 | 7.3%).
Employment Industries by Sex in Creston
The Creston industries that see more men than women are Wholesale Trade (100.0%), Administrative & Support (100.0%), and Construction (96.8%), whereas the industries that tend to have a higher number of women are Mining, Quarrying, & Extraction (100.0%), Real Estate, Rental & Leasing (100.0%), and Health Care & Social Assistance (85.1%).
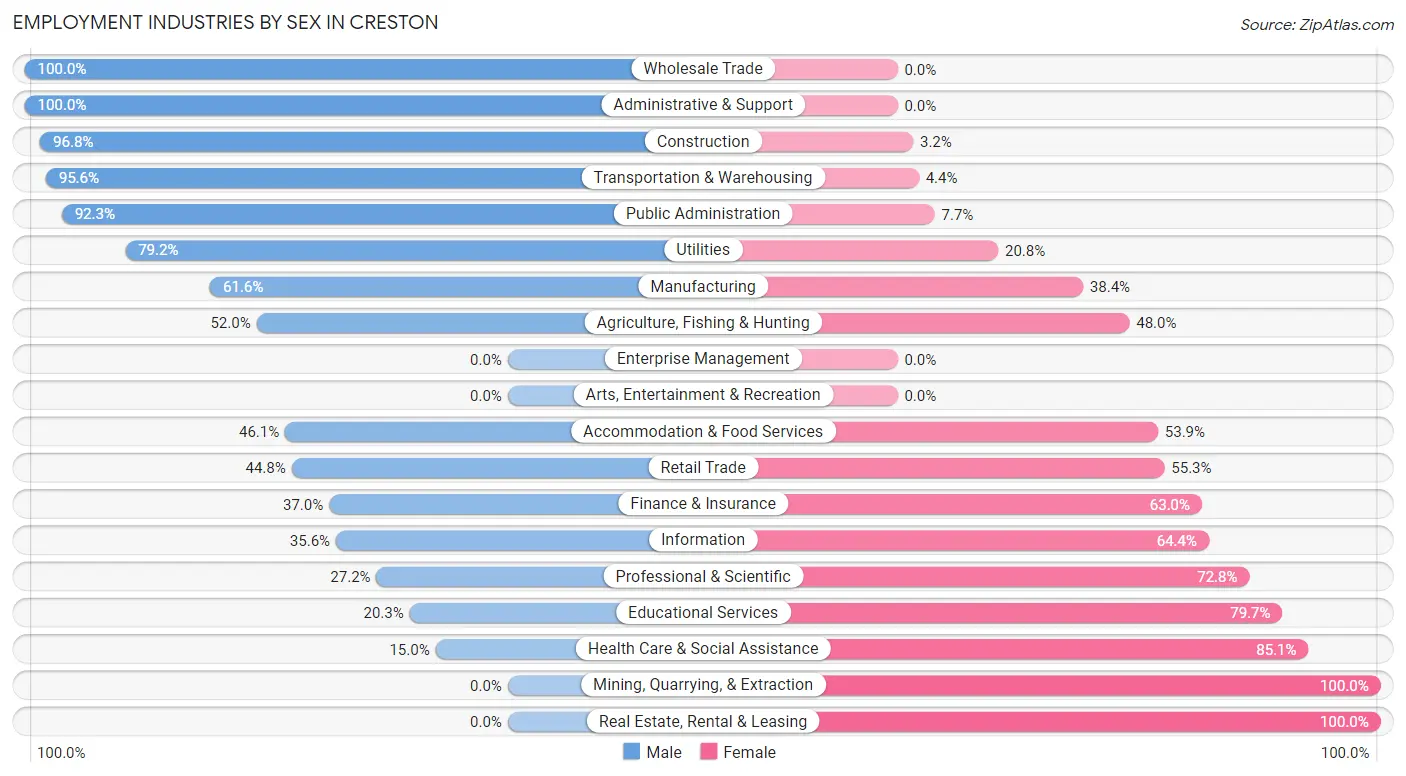
| Industry | Male | Female |
| Agriculture, Fishing & Hunting | 13 (52.0%) | 12 (48.0%) |
| Mining, Quarrying, & Extraction | 0 (0.0%) | 7 (100.0%) |
| Construction | 180 (96.8%) | 6 (3.2%) |
| Manufacturing | 467 (61.6%) | 291 (38.4%) |
| Wholesale Trade | 98 (100.0%) | 0 (0.0%) |
| Retail Trade | 230 (44.8%) | 284 (55.2%) |
| Transportation & Warehousing | 174 (95.6%) | 8 (4.4%) |
| Utilities | 19 (79.2%) | 5 (20.8%) |
| Information | 16 (35.6%) | 29 (64.4%) |
| Finance & Insurance | 27 (37.0%) | 46 (63.0%) |
| Real Estate, Rental & Leasing | 0 (0.0%) | 10 (100.0%) |
| Professional & Scientific | 28 (27.2%) | 75 (72.8%) |
| Enterprise Management | 0 (0.0%) | 0 (0.0%) |
| Administrative & Support | 84 (100.0%) | 0 (0.0%) |
| Educational Services | 62 (20.3%) | 243 (79.7%) |
| Health Care & Social Assistance | 83 (14.9%) | 472 (85.1%) |
| Arts, Entertainment & Recreation | 0 (0.0%) | 0 (0.0%) |
| Accommodation & Food Services | 118 (46.1%) | 138 (53.9%) |
| Public Administration | 60 (92.3%) | 5 (7.7%) |
| Total | 1,752 (50.2%) | 1,735 (49.8%) |
Education in Creston
School Enrollment in Creston
The most common levels of schooling among the 1,840 students in Creston are college / undergraduate (458 | 24.9%), middle school (442 | 24.0%), and high school (419 | 22.8%).
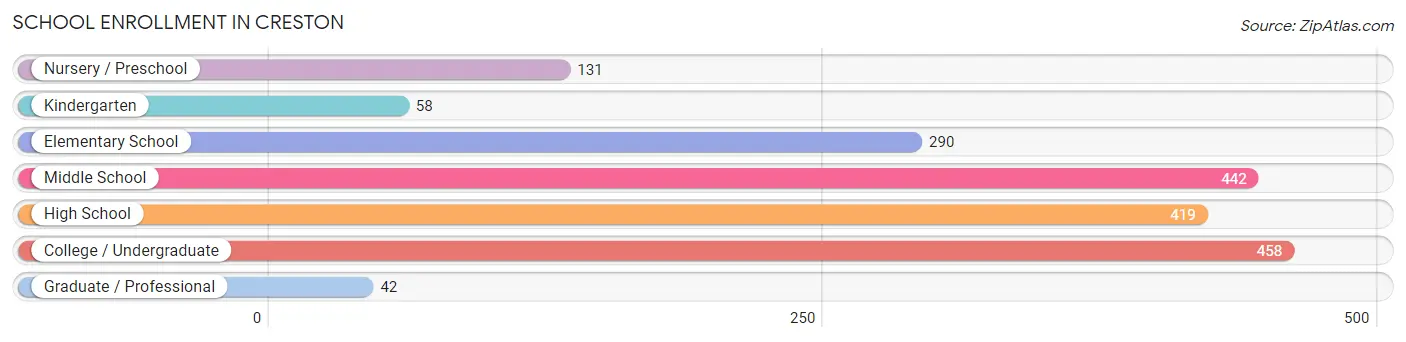
| School Level | # Students | % Students |
| Nursery / Preschool | 131 | 7.1% |
| Kindergarten | 58 | 3.2% |
| Elementary School | 290 | 15.8% |
| Middle School | 442 | 24.0% |
| High School | 419 | 22.8% |
| College / Undergraduate | 458 | 24.9% |
| Graduate / Professional | 42 | 2.3% |
| Total | 1,840 | 100.0% |
School Enrollment by Age by Funding Source in Creston
Out of a total of 1,840 students who are enrolled in schools in Creston, 217 (11.8%) attend a private institution, while the remaining 1,623 (88.2%) are enrolled in public schools. The age group of 3 to 4 year olds has the highest likelihood of being enrolled in private schools, with 44 (33.6% in the age bracket) enrolled. Conversely, the age group of 15 to 17 year olds has the lowest likelihood of being enrolled in a private school, with 345 (100.0% in the age bracket) attending a public institution.
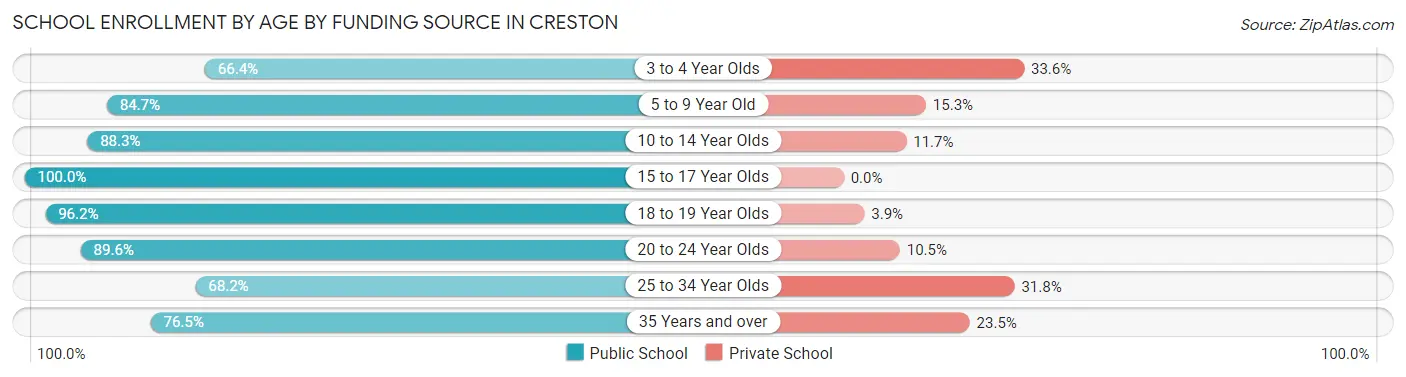
| Age Bracket | Public School | Private School |
| 3 to 4 Year Olds | 87 (66.4%) | 44 (33.6%) |
| 5 to 9 Year Old | 282 (84.7%) | 51 (15.3%) |
| 10 to 14 Year Olds | 424 (88.3%) | 56 (11.7%) |
| 15 to 17 Year Olds | 345 (100.0%) | 0 (0.0%) |
| 18 to 19 Year Olds | 200 (96.2%) | 8 (3.8%) |
| 20 to 24 Year Olds | 180 (89.5%) | 21 (10.4%) |
| 25 to 34 Year Olds | 30 (68.2%) | 14 (31.8%) |
| 35 Years and over | 75 (76.5%) | 23 (23.5%) |
| Total | 1,623 (88.2%) | 217 (11.8%) |
Educational Attainment by Field of Study in Creston
Education (389 | 28.6%), business (232 | 17.0%), science & technology (153 | 11.2%), bio, nature & agricultural (121 | 8.9%), and arts & humanities (94 | 6.9%) are the most common fields of study among 1,362 individuals in Creston who have obtained a bachelor's degree or higher.
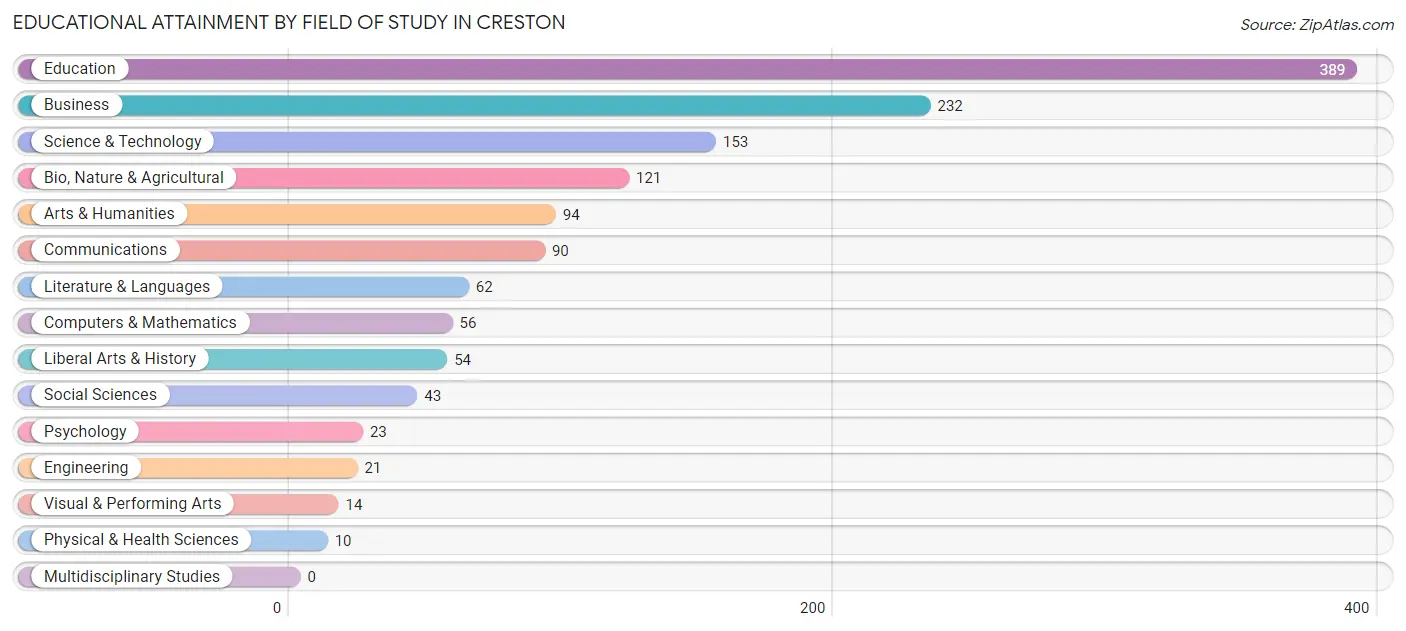
| Field of Study | # Graduates | % Graduates |
| Computers & Mathematics | 56 | 4.1% |
| Bio, Nature & Agricultural | 121 | 8.9% |
| Physical & Health Sciences | 10 | 0.7% |
| Psychology | 23 | 1.7% |
| Social Sciences | 43 | 3.2% |
| Engineering | 21 | 1.5% |
| Multidisciplinary Studies | 0 | 0.0% |
| Science & Technology | 153 | 11.2% |
| Business | 232 | 17.0% |
| Education | 389 | 28.6% |
| Literature & Languages | 62 | 4.5% |
| Liberal Arts & History | 54 | 4.0% |
| Visual & Performing Arts | 14 | 1.0% |
| Communications | 90 | 6.6% |
| Arts & Humanities | 94 | 6.9% |
| Total | 1,362 | 100.0% |
Transportation & Commute in Creston
Vehicle Availability by Sex in Creston
The most prevalent vehicle ownership categories in Creston are males with 2 vehicles (671, accounting for 39.1%) and females with 2 vehicles (515, making up 41.8%).
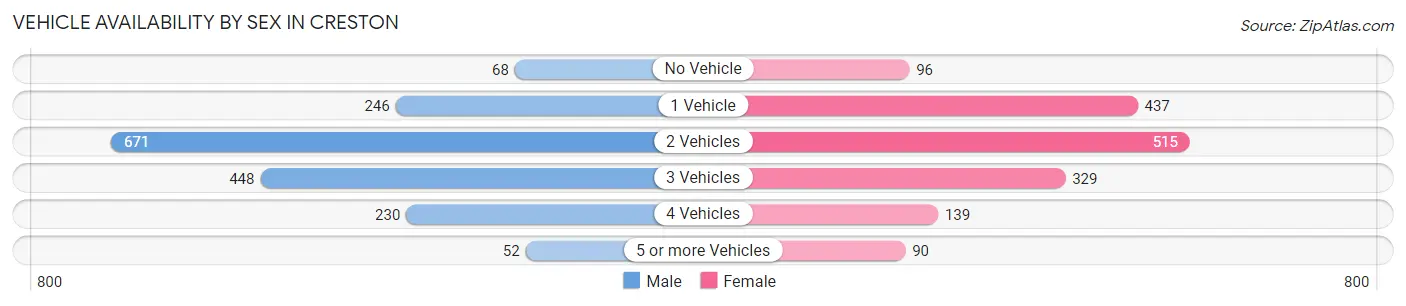
| Vehicles Available | Male | Female |
| No Vehicle | 68 (4.0%) | 96 (6.0%) |
| 1 Vehicle | 246 (14.3%) | 437 (27.2%) |
| 2 Vehicles | 671 (39.1%) | 515 (32.1%) |
| 3 Vehicles | 448 (26.1%) | 329 (20.5%) |
| 4 Vehicles | 230 (13.4%) | 139 (8.7%) |
| 5 or more Vehicles | 52 (3.0%) | 90 (5.6%) |
| Total | 1,715 (100.0%) | 1,606 (100.0%) |
Commute Time in Creston
The most frequently occuring commute durations in Creston are 5 to 9 minutes (1,302 commuters, 39.6%), 10 to 14 minutes (672 commuters, 20.4%), and less than 5 minutes (629 commuters, 19.1%).
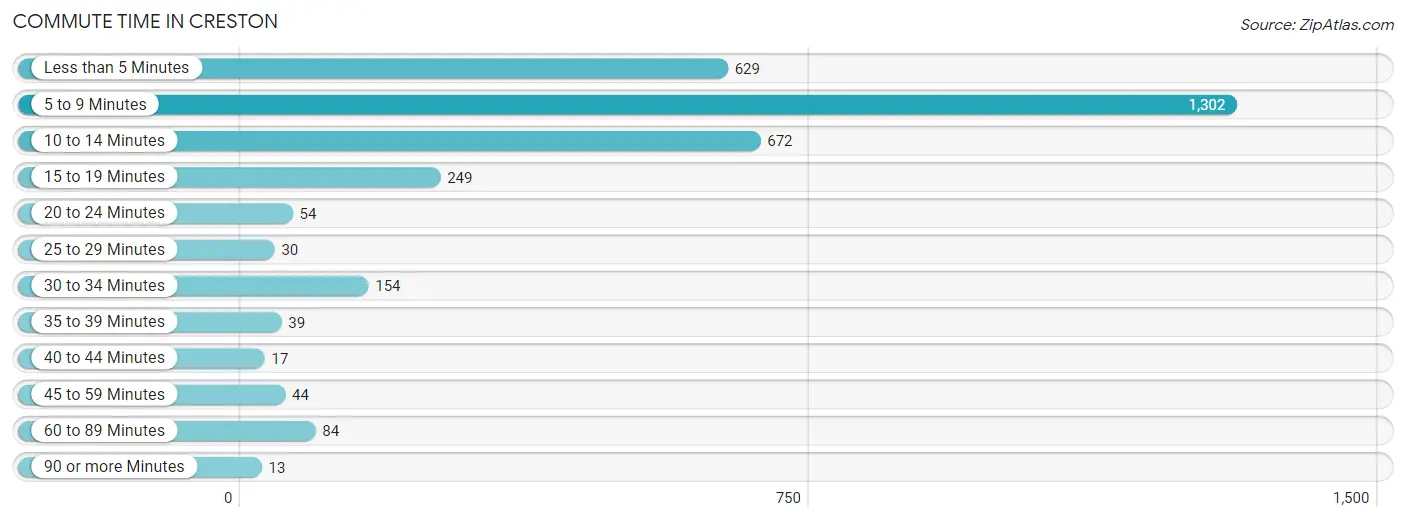
| Commute Time | # Commuters | % Commuters |
| Less than 5 Minutes | 629 | 19.1% |
| 5 to 9 Minutes | 1,302 | 39.6% |
| 10 to 14 Minutes | 672 | 20.4% |
| 15 to 19 Minutes | 249 | 7.6% |
| 20 to 24 Minutes | 54 | 1.6% |
| 25 to 29 Minutes | 30 | 0.9% |
| 30 to 34 Minutes | 154 | 4.7% |
| 35 to 39 Minutes | 39 | 1.2% |
| 40 to 44 Minutes | 17 | 0.5% |
| 45 to 59 Minutes | 44 | 1.3% |
| 60 to 89 Minutes | 84 | 2.6% |
| 90 or more Minutes | 13 | 0.4% |
Commute Time by Sex in Creston
The most common commute times in Creston are 5 to 9 minutes (599 commuters, 34.9%) for males and 5 to 9 minutes (703 commuters, 44.8%) for females.
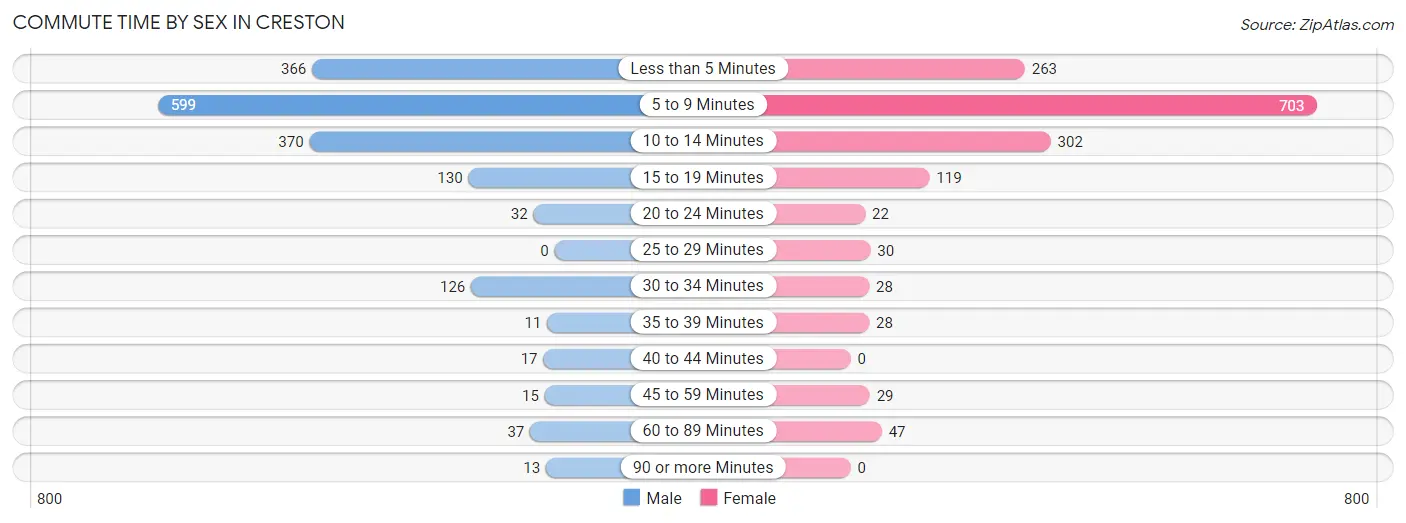
| Commute Time | Male | Female |
| Less than 5 Minutes | 366 (21.3%) | 263 (16.7%) |
| 5 to 9 Minutes | 599 (34.9%) | 703 (44.8%) |
| 10 to 14 Minutes | 370 (21.6%) | 302 (19.2%) |
| 15 to 19 Minutes | 130 (7.6%) | 119 (7.6%) |
| 20 to 24 Minutes | 32 (1.9%) | 22 (1.4%) |
| 25 to 29 Minutes | 0 (0.0%) | 30 (1.9%) |
| 30 to 34 Minutes | 126 (7.3%) | 28 (1.8%) |
| 35 to 39 Minutes | 11 (0.6%) | 28 (1.8%) |
| 40 to 44 Minutes | 17 (1.0%) | 0 (0.0%) |
| 45 to 59 Minutes | 15 (0.9%) | 29 (1.8%) |
| 60 to 89 Minutes | 37 (2.2%) | 47 (3.0%) |
| 90 or more Minutes | 13 (0.8%) | 0 (0.0%) |
Time of Departure to Work by Sex in Creston
The most frequent times of departure to work in Creston are 7:30 AM to 7:59 AM (317, 18.5%) for males and 7:30 AM to 7:59 AM (361, 23.0%) for females.
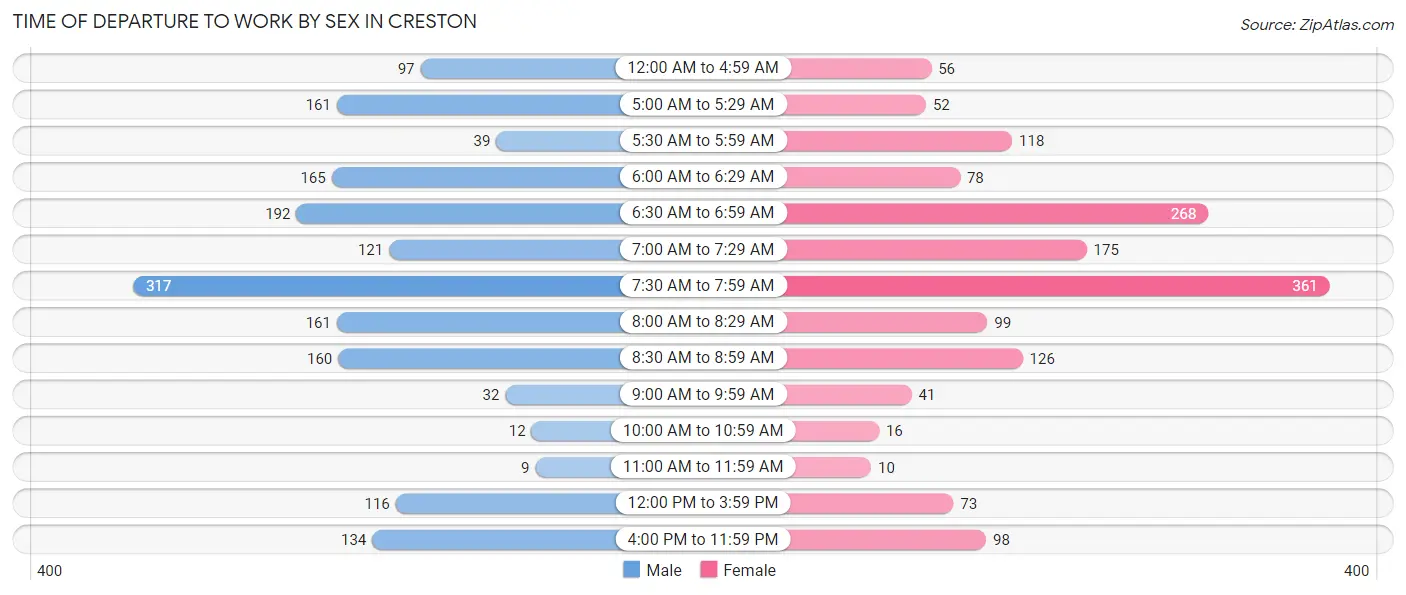
| Time of Departure | Male | Female |
| 12:00 AM to 4:59 AM | 97 (5.7%) | 56 (3.6%) |
| 5:00 AM to 5:29 AM | 161 (9.4%) | 52 (3.3%) |
| 5:30 AM to 5:59 AM | 39 (2.3%) | 118 (7.5%) |
| 6:00 AM to 6:29 AM | 165 (9.6%) | 78 (5.0%) |
| 6:30 AM to 6:59 AM | 192 (11.2%) | 268 (17.1%) |
| 7:00 AM to 7:29 AM | 121 (7.0%) | 175 (11.1%) |
| 7:30 AM to 7:59 AM | 317 (18.5%) | 361 (23.0%) |
| 8:00 AM to 8:29 AM | 161 (9.4%) | 99 (6.3%) |
| 8:30 AM to 8:59 AM | 160 (9.3%) | 126 (8.0%) |
| 9:00 AM to 9:59 AM | 32 (1.9%) | 41 (2.6%) |
| 10:00 AM to 10:59 AM | 12 (0.7%) | 16 (1.0%) |
| 11:00 AM to 11:59 AM | 9 (0.5%) | 10 (0.6%) |
| 12:00 PM to 3:59 PM | 116 (6.8%) | 73 (4.6%) |
| 4:00 PM to 11:59 PM | 134 (7.8%) | 98 (6.2%) |
| Total | 1,716 (100.0%) | 1,571 (100.0%) |
Housing Occupancy in Creston
Occupancy by Ownership in Creston
Of the total 3,247 dwellings in Creston, owner-occupied units account for 2,239 (69.0%), while renter-occupied units make up 1,008 (31.0%).
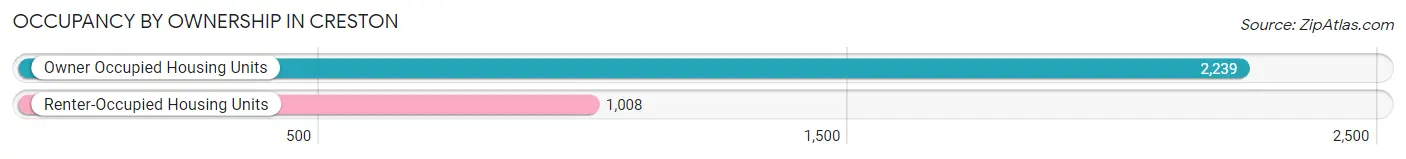
| Occupancy | # Housing Units | % Housing Units |
| Owner Occupied Housing Units | 2,239 | 69.0% |
| Renter-Occupied Housing Units | 1,008 | 31.0% |
| Total Occupied Housing Units | 3,247 | 100.0% |
Occupancy by Household Size in Creston
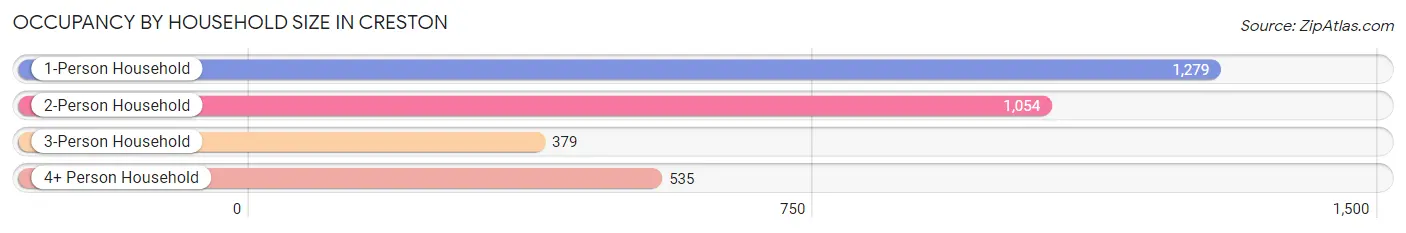
| Household Size | # Housing Units | % Housing Units |
| 1-Person Household | 1,279 | 39.4% |
| 2-Person Household | 1,054 | 32.5% |
| 3-Person Household | 379 | 11.7% |
| 4+ Person Household | 535 | 16.5% |
| Total Housing Units | 3,247 | 100.0% |
Occupancy by Ownership by Household Size in Creston
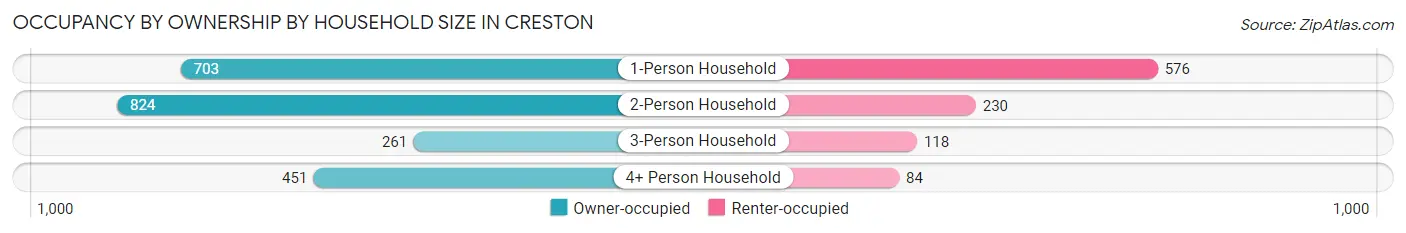
| Household Size | Owner-occupied | Renter-occupied |
| 1-Person Household | 703 (55.0%) | 576 (45.0%) |
| 2-Person Household | 824 (78.2%) | 230 (21.8%) |
| 3-Person Household | 261 (68.9%) | 118 (31.1%) |
| 4+ Person Household | 451 (84.3%) | 84 (15.7%) |
| Total Housing Units | 2,239 (69.0%) | 1,008 (31.0%) |
Occupancy by Educational Attainment in Creston
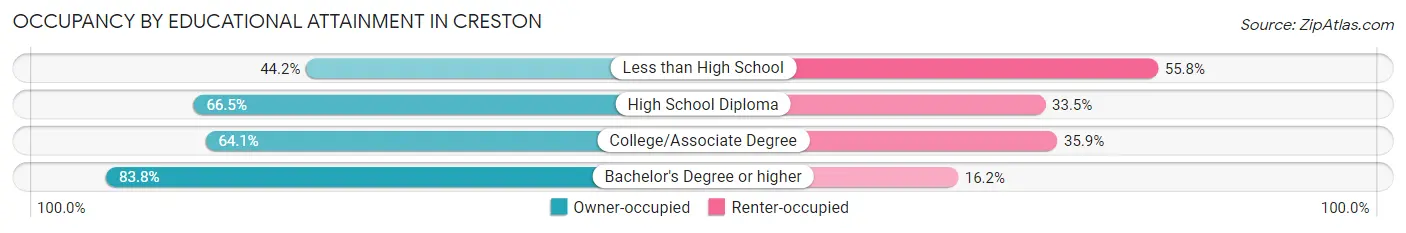
| Household Size | Owner-occupied | Renter-occupied |
| Less than High School | 87 (44.2%) | 110 (55.8%) |
| High School Diploma | 717 (66.5%) | 361 (33.5%) |
| College/Associate Degree | 710 (64.1%) | 397 (35.9%) |
| Bachelor's Degree or higher | 725 (83.8%) | 140 (16.2%) |
Occupancy by Age of Householder in Creston
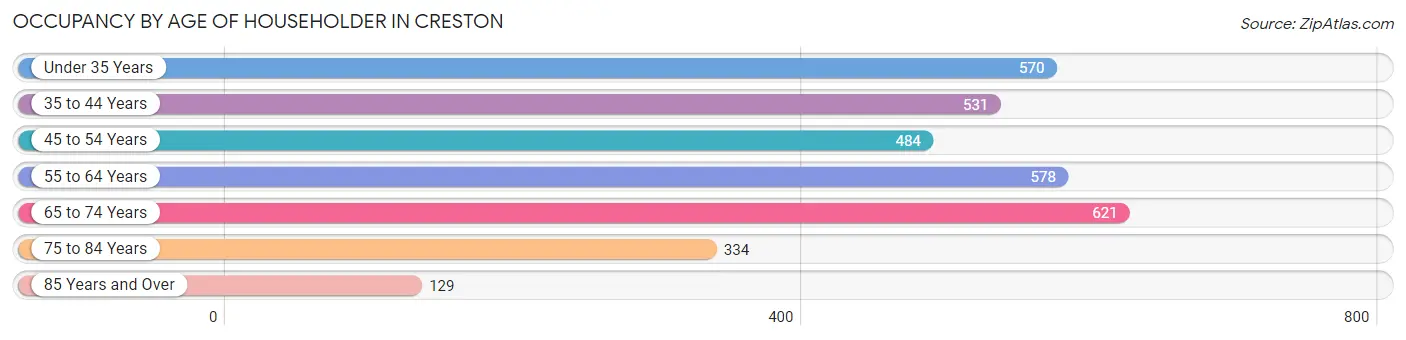
| Age Bracket | # Households | % Households |
| Under 35 Years | 570 | 17.5% |
| 35 to 44 Years | 531 | 16.4% |
| 45 to 54 Years | 484 | 14.9% |
| 55 to 64 Years | 578 | 17.8% |
| 65 to 74 Years | 621 | 19.1% |
| 75 to 84 Years | 334 | 10.3% |
| 85 Years and Over | 129 | 4.0% |
| Total | 3,247 | 100.0% |
Housing Finances in Creston
Median Income by Occupancy in Creston
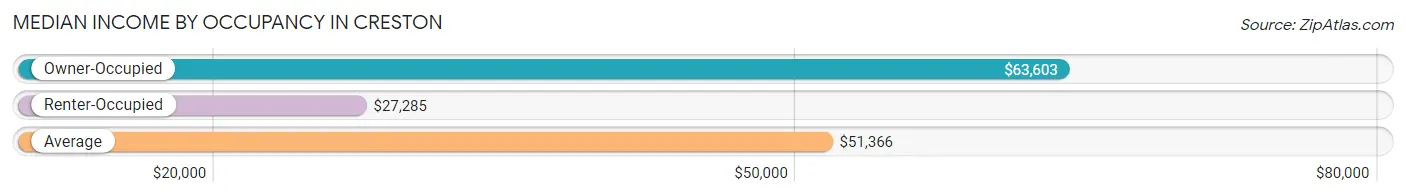
| Occupancy Type | # Households | Median Income |
| Owner-Occupied | 2,239 (69.0%) | $63,603 |
| Renter-Occupied | 1,008 (31.0%) | $27,285 |
| Average | 3,247 (100.0%) | $51,366 |
Occupancy by Householder Income Bracket in Creston
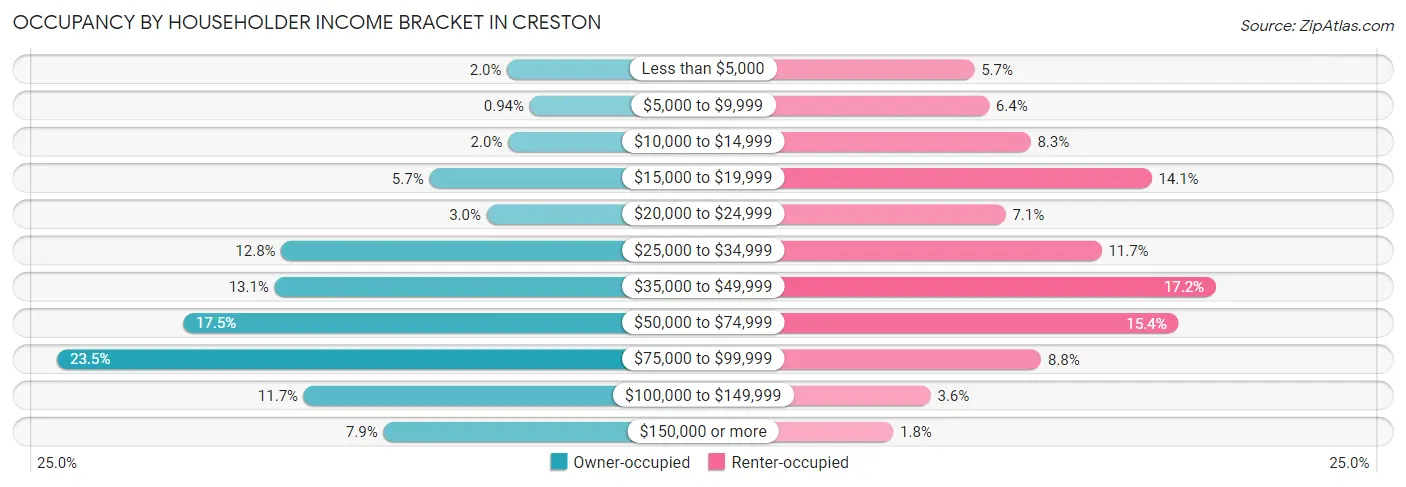
| Income Bracket | Owner-occupied | Renter-occupied |
| Less than $5,000 | 45 (2.0%) | 57 (5.7%) |
| $5,000 to $9,999 | 21 (0.9%) | 64 (6.4%) |
| $10,000 to $14,999 | 44 (2.0%) | 84 (8.3%) |
| $15,000 to $19,999 | 128 (5.7%) | 142 (14.1%) |
| $20,000 to $24,999 | 67 (3.0%) | 72 (7.1%) |
| $25,000 to $34,999 | 286 (12.8%) | 118 (11.7%) |
| $35,000 to $49,999 | 293 (13.1%) | 173 (17.2%) |
| $50,000 to $74,999 | 391 (17.5%) | 155 (15.4%) |
| $75,000 to $99,999 | 525 (23.4%) | 89 (8.8%) |
| $100,000 to $149,999 | 262 (11.7%) | 36 (3.6%) |
| $150,000 or more | 177 (7.9%) | 18 (1.8%) |
| Total | 2,239 (100.0%) | 1,008 (100.0%) |
Monthly Housing Cost Tiers in Creston
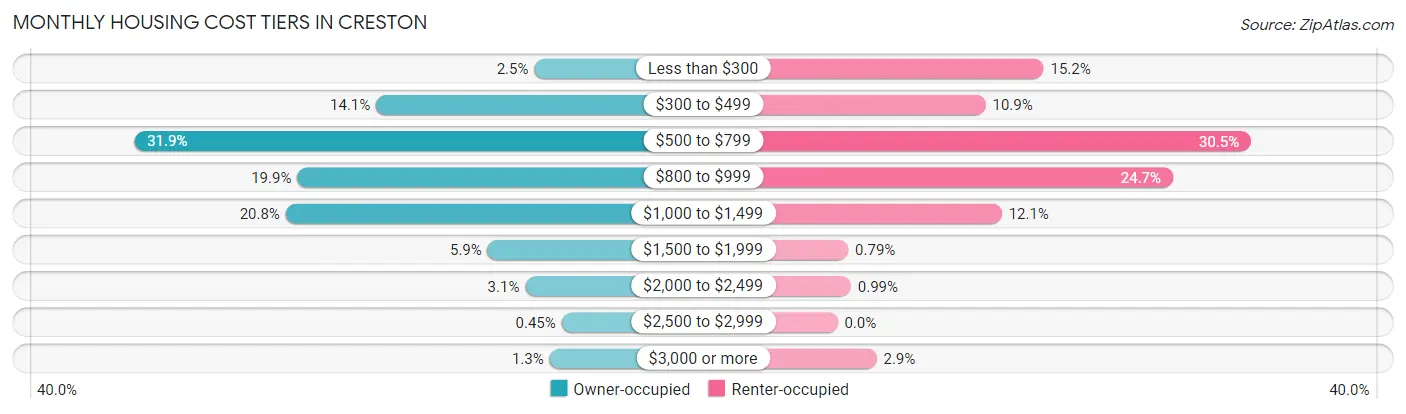
| Monthly Cost | Owner-occupied | Renter-occupied |
| Less than $300 | 55 (2.5%) | 153 (15.2%) |
| $300 to $499 | 316 (14.1%) | 110 (10.9%) |
| $500 to $799 | 715 (31.9%) | 307 (30.5%) |
| $800 to $999 | 446 (19.9%) | 249 (24.7%) |
| $1,000 to $1,499 | 465 (20.8%) | 122 (12.1%) |
| $1,500 to $1,999 | 132 (5.9%) | 8 (0.8%) |
| $2,000 to $2,499 | 70 (3.1%) | 10 (1.0%) |
| $2,500 to $2,999 | 10 (0.4%) | 0 (0.0%) |
| $3,000 or more | 30 (1.3%) | 29 (2.9%) |
| Total | 2,239 (100.0%) | 1,008 (100.0%) |
Physical Housing Characteristics in Creston
Housing Structures in Creston
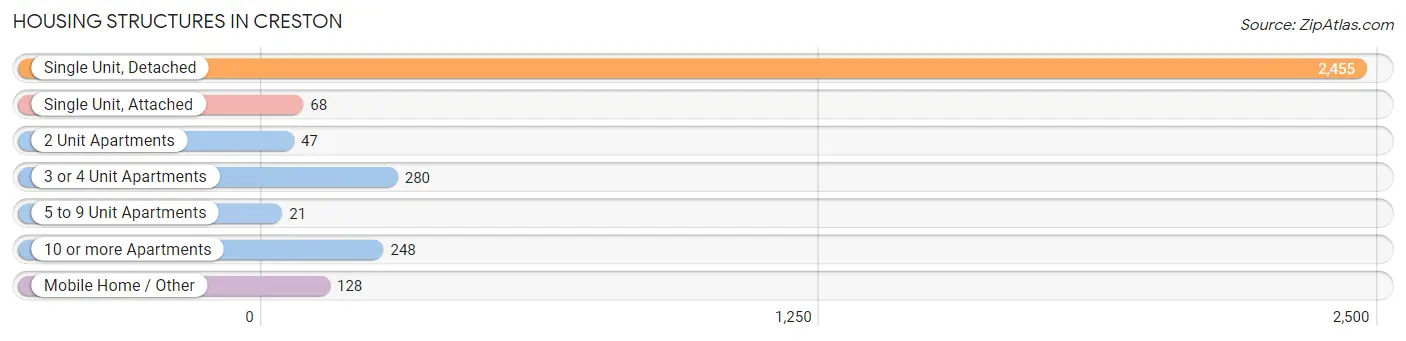
| Structure Type | # Housing Units | % Housing Units |
| Single Unit, Detached | 2,455 | 75.6% |
| Single Unit, Attached | 68 | 2.1% |
| 2 Unit Apartments | 47 | 1.5% |
| 3 or 4 Unit Apartments | 280 | 8.6% |
| 5 to 9 Unit Apartments | 21 | 0.6% |
| 10 or more Apartments | 248 | 7.6% |
| Mobile Home / Other | 128 | 3.9% |
| Total | 3,247 | 100.0% |
Housing Structures by Occupancy in Creston
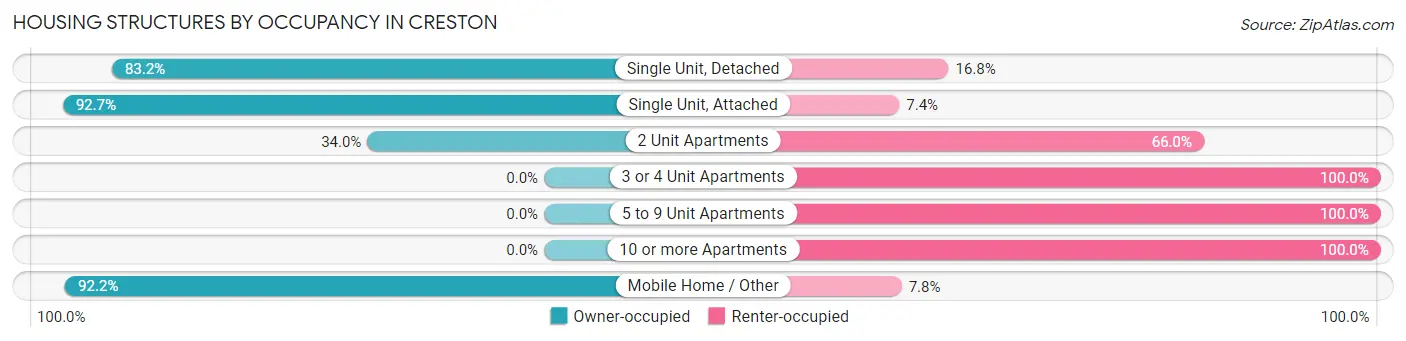
| Structure Type | Owner-occupied | Renter-occupied |
| Single Unit, Detached | 2,042 (83.2%) | 413 (16.8%) |
| Single Unit, Attached | 63 (92.6%) | 5 (7.3%) |
| 2 Unit Apartments | 16 (34.0%) | 31 (66.0%) |
| 3 or 4 Unit Apartments | 0 (0.0%) | 280 (100.0%) |
| 5 to 9 Unit Apartments | 0 (0.0%) | 21 (100.0%) |
| 10 or more Apartments | 0 (0.0%) | 248 (100.0%) |
| Mobile Home / Other | 118 (92.2%) | 10 (7.8%) |
| Total | 2,239 (69.0%) | 1,008 (31.0%) |
Housing Structures by Number of Rooms in Creston
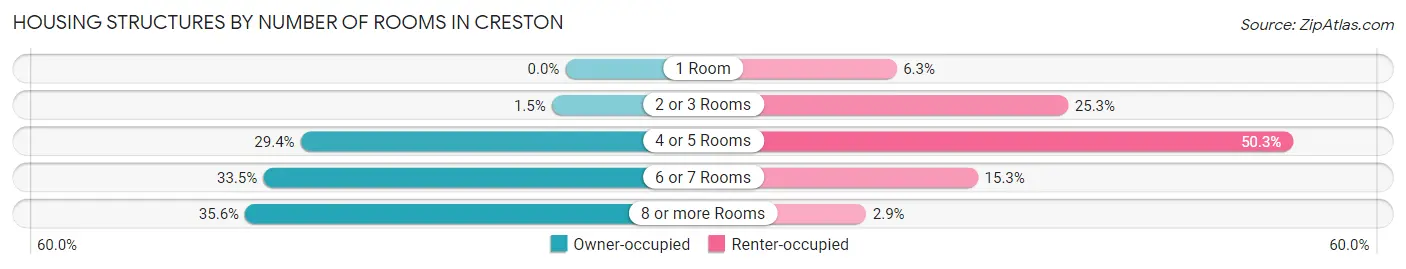
| Number of Rooms | Owner-occupied | Renter-occupied |
| 1 Room | 0 (0.0%) | 63 (6.2%) |
| 2 or 3 Rooms | 34 (1.5%) | 255 (25.3%) |
| 4 or 5 Rooms | 658 (29.4%) | 507 (50.3%) |
| 6 or 7 Rooms | 751 (33.5%) | 154 (15.3%) |
| 8 or more Rooms | 796 (35.5%) | 29 (2.9%) |
| Total | 2,239 (100.0%) | 1,008 (100.0%) |
Housing Structure by Heating Type in Creston
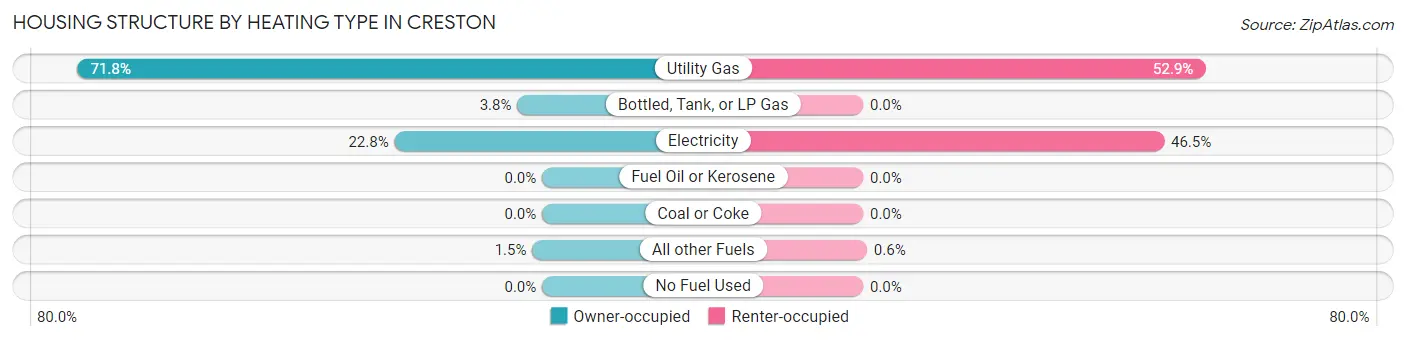
| Heating Type | Owner-occupied | Renter-occupied |
| Utility Gas | 1,608 (71.8%) | 533 (52.9%) |
| Bottled, Tank, or LP Gas | 86 (3.8%) | 0 (0.0%) |
| Electricity | 511 (22.8%) | 469 (46.5%) |
| Fuel Oil or Kerosene | 0 (0.0%) | 0 (0.0%) |
| Coal or Coke | 0 (0.0%) | 0 (0.0%) |
| All other Fuels | 34 (1.5%) | 6 (0.6%) |
| No Fuel Used | 0 (0.0%) | 0 (0.0%) |
| Total | 2,239 (100.0%) | 1,008 (100.0%) |
Household Vehicle Usage in Creston
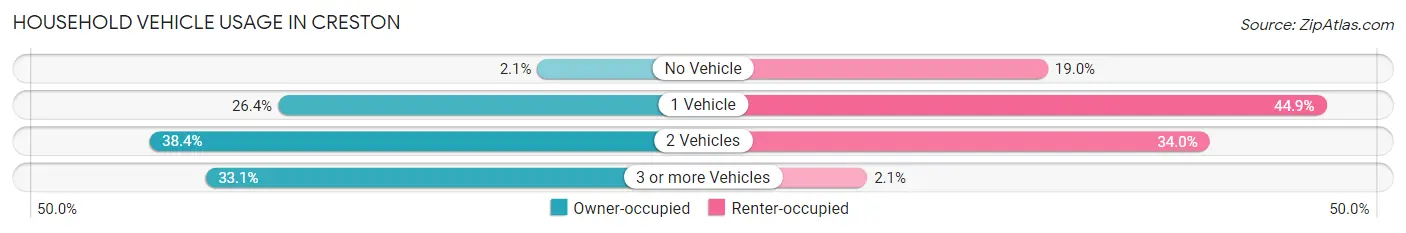
| Vehicles per Household | Owner-occupied | Renter-occupied |
| No Vehicle | 48 (2.1%) | 191 (19.0%) |
| 1 Vehicle | 590 (26.4%) | 453 (44.9%) |
| 2 Vehicles | 859 (38.4%) | 343 (34.0%) |
| 3 or more Vehicles | 742 (33.1%) | 21 (2.1%) |
| Total | 2,239 (100.0%) | 1,008 (100.0%) |
Real Estate & Mortgages in Creston
Real Estate and Mortgage Overview in Creston
| Characteristic | Without Mortgage | With Mortgage |
| Housing Units | 1,038 | 1,201 |
| Median Property Value | $125,600 | $103,900 |
| Median Household Income | $57,891 | $103 |
| Monthly Housing Costs | $556 | $30 |
| Real Estate Taxes | $2,007 | $24 |
Property Value by Mortgage Status in Creston
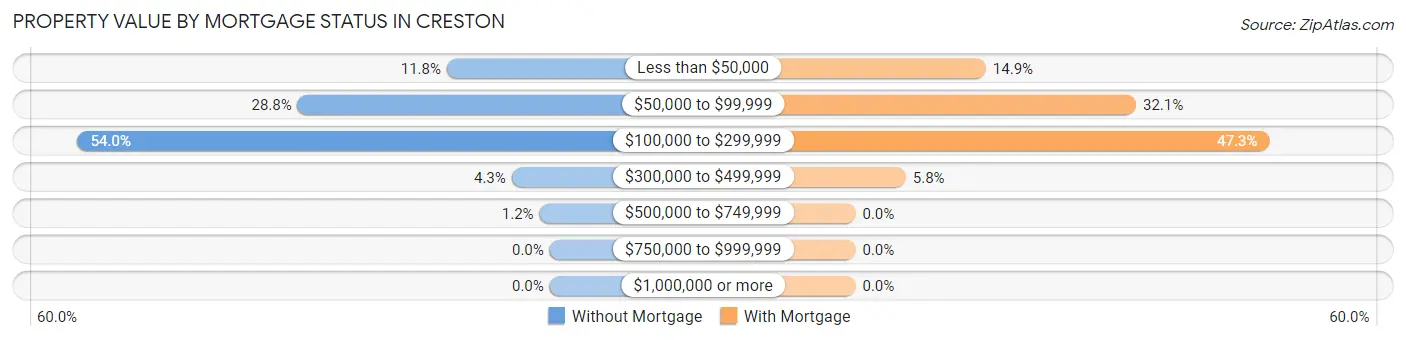
| Property Value | Without Mortgage | With Mortgage |
| Less than $50,000 | 122 (11.7%) | 179 (14.9%) |
| $50,000 to $99,999 | 299 (28.8%) | 385 (32.1%) |
| $100,000 to $299,999 | 560 (53.9%) | 568 (47.3%) |
| $300,000 to $499,999 | 45 (4.3%) | 69 (5.8%) |
| $500,000 to $749,999 | 12 (1.2%) | 0 (0.0%) |
| $750,000 to $999,999 | 0 (0.0%) | 0 (0.0%) |
| $1,000,000 or more | 0 (0.0%) | 0 (0.0%) |
| Total | 1,038 (100.0%) | 1,201 (100.0%) |
Household Income by Mortgage Status in Creston
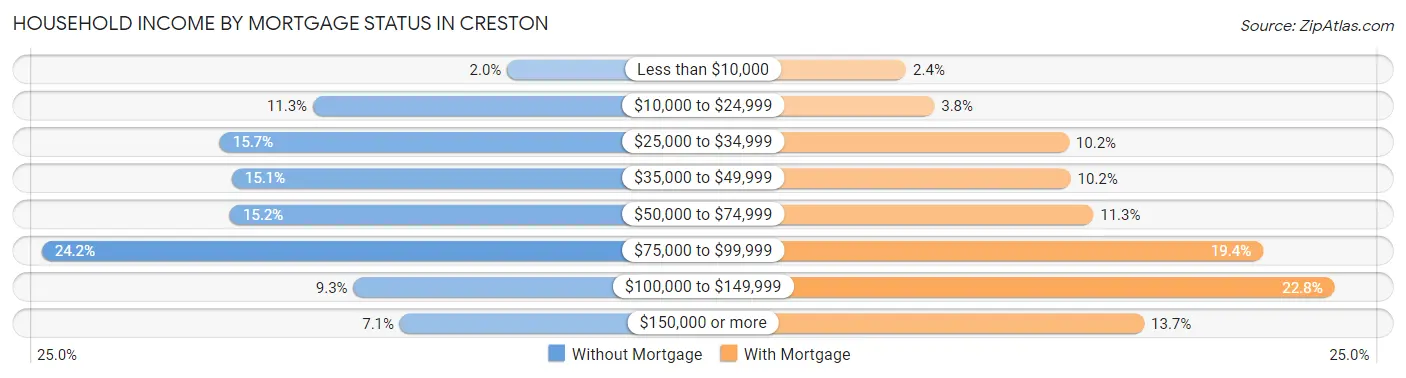
| Household Income | Without Mortgage | With Mortgage |
| Less than $10,000 | 21 (2.0%) | 29 (2.4%) |
| $10,000 to $24,999 | 117 (11.3%) | 45 (3.7%) |
| $25,000 to $34,999 | 163 (15.7%) | 122 (10.2%) |
| $35,000 to $49,999 | 157 (15.1%) | 123 (10.2%) |
| $50,000 to $74,999 | 158 (15.2%) | 136 (11.3%) |
| $75,000 to $99,999 | 251 (24.2%) | 233 (19.4%) |
| $100,000 to $149,999 | 97 (9.3%) | 274 (22.8%) |
| $150,000 or more | 74 (7.1%) | 165 (13.7%) |
| Total | 1,038 (100.0%) | 1,201 (100.0%) |
Property Value to Household Income Ratio in Creston
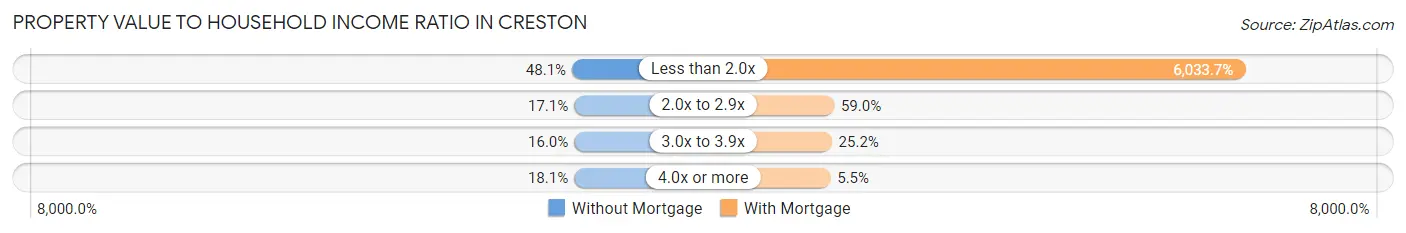
| Value-to-Income Ratio | Without Mortgage | With Mortgage |
| Less than 2.0x | 499 (48.1%) | 72,465 (6,033.7%) |
| 2.0x to 2.9x | 177 (17.1%) | 709 (59.0%) |
| 3.0x to 3.9x | 166 (16.0%) | 302 (25.2%) |
| 4.0x or more | 188 (18.1%) | 66 (5.5%) |
| Total | 1,038 (100.0%) | 1,201 (100.0%) |
Real Estate Taxes by Mortgage Status in Creston
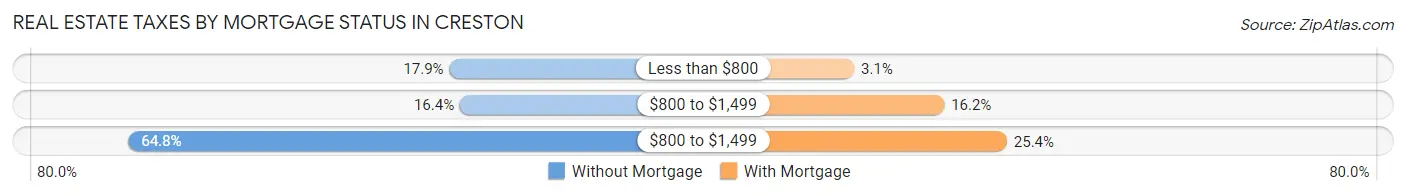
| Property Taxes | Without Mortgage | With Mortgage |
| Less than $800 | 186 (17.9%) | 37 (3.1%) |
| $800 to $1,499 | 170 (16.4%) | 195 (16.2%) |
| $800 to $1,499 | 673 (64.8%) | 305 (25.4%) |
| Total | 1,038 (100.0%) | 1,201 (100.0%) |
Health & Disability in Creston
Health Insurance Coverage by Age in Creston
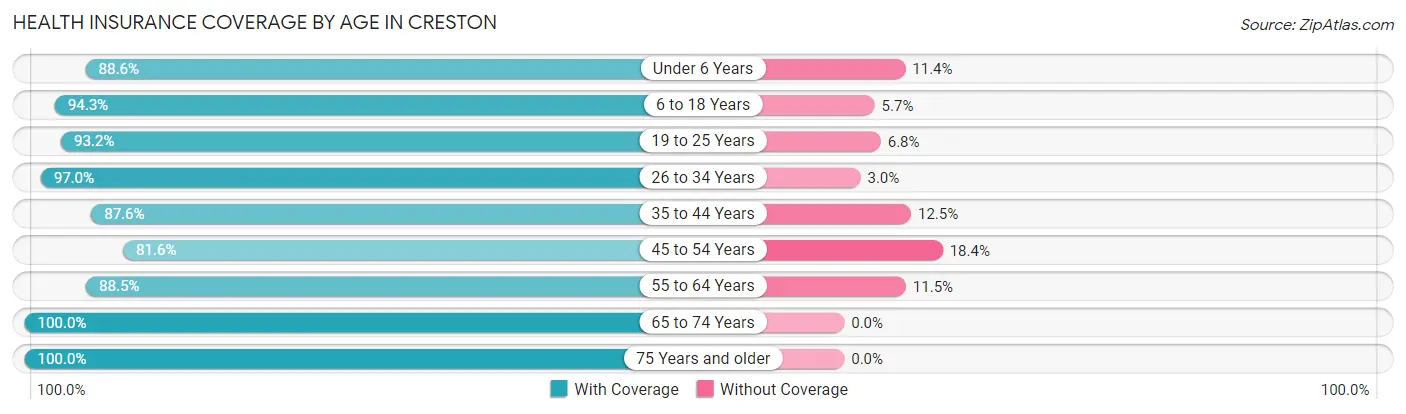
| Age Bracket | With Coverage | Without Coverage |
| Under 6 Years | 428 (88.6%) | 55 (11.4%) |
| 6 to 18 Years | 1,250 (94.3%) | 75 (5.7%) |
| 19 to 25 Years | 780 (93.2%) | 57 (6.8%) |
| 26 to 34 Years | 703 (97.0%) | 22 (3.0%) |
| 35 to 44 Years | 816 (87.5%) | 116 (12.4%) |
| 45 to 54 Years | 676 (81.6%) | 152 (18.4%) |
| 55 to 64 Years | 747 (88.5%) | 97 (11.5%) |
| 65 to 74 Years | 836 (100.0%) | 0 (0.0%) |
| 75 Years and older | 611 (100.0%) | 0 (0.0%) |
| Total | 6,847 (92.3%) | 574 (7.7%) |
Health Insurance Coverage by Citizenship Status in Creston
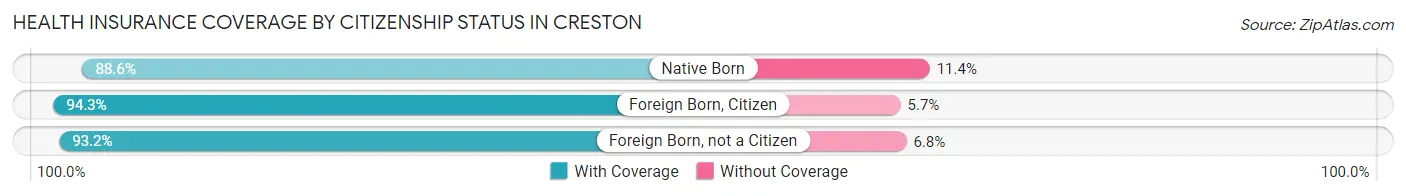
| Citizenship Status | With Coverage | Without Coverage |
| Native Born | 428 (88.6%) | 55 (11.4%) |
| Foreign Born, Citizen | 1,250 (94.3%) | 75 (5.7%) |
| Foreign Born, not a Citizen | 780 (93.2%) | 57 (6.8%) |
Health Insurance Coverage by Household Income in Creston
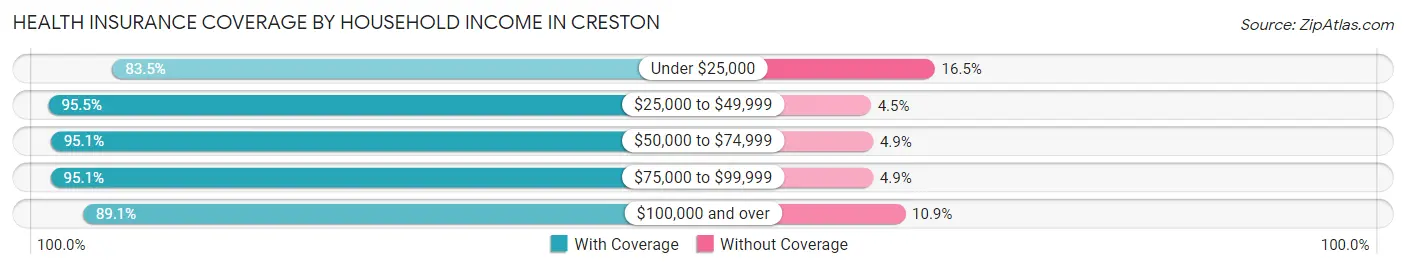
| Household Income | With Coverage | Without Coverage |
| Under $25,000 | 888 (83.5%) | 175 (16.5%) |
| $25,000 to $49,999 | 1,514 (95.5%) | 71 (4.5%) |
| $50,000 to $74,999 | 912 (95.1%) | 47 (4.9%) |
| $75,000 to $99,999 | 1,943 (95.1%) | 100 (4.9%) |
| $100,000 and over | 1,435 (89.1%) | 176 (10.9%) |
Public vs Private Health Insurance Coverage by Age in Creston
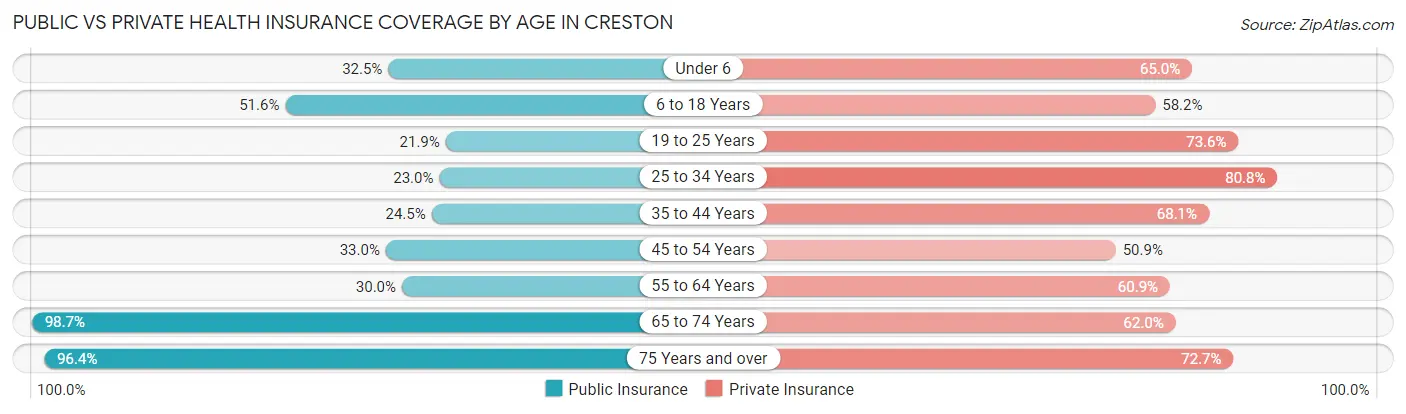
| Age Bracket | Public Insurance | Private Insurance |
| Under 6 | 157 (32.5%) | 314 (65.0%) |
| 6 to 18 Years | 684 (51.6%) | 771 (58.2%) |
| 19 to 25 Years | 183 (21.9%) | 616 (73.6%) |
| 25 to 34 Years | 167 (23.0%) | 586 (80.8%) |
| 35 to 44 Years | 228 (24.5%) | 635 (68.1%) |
| 45 to 54 Years | 273 (33.0%) | 421 (50.8%) |
| 55 to 64 Years | 253 (30.0%) | 514 (60.9%) |
| 65 to 74 Years | 825 (98.7%) | 518 (62.0%) |
| 75 Years and over | 589 (96.4%) | 444 (72.7%) |
| Total | 3,359 (45.3%) | 4,819 (64.9%) |
Disability Status by Sex by Age in Creston
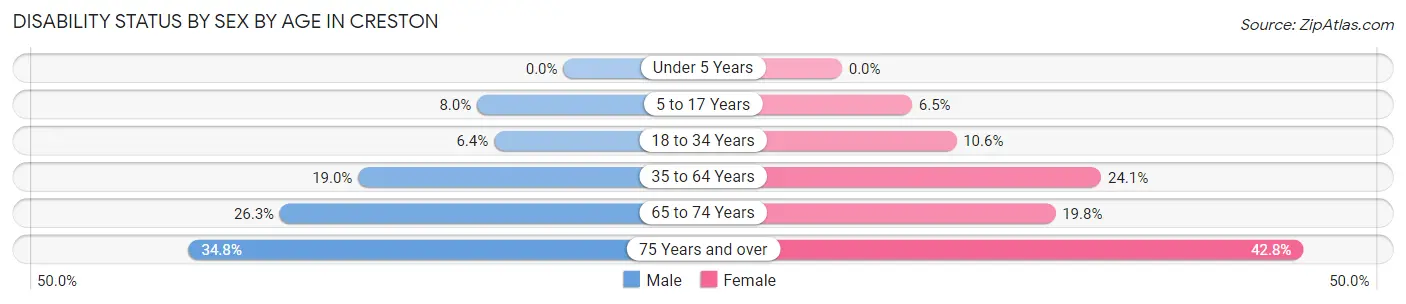
| Age Bracket | Male | Female |
| Under 5 Years | 0 (0.0%) | 0 (0.0%) |
| 5 to 17 Years | 50 (8.0%) | 38 (6.5%) |
| 18 to 34 Years | 55 (6.4%) | 89 (10.6%) |
| 35 to 64 Years | 222 (19.0%) | 346 (24.1%) |
| 65 to 74 Years | 111 (26.3%) | 82 (19.8%) |
| 75 Years and over | 72 (34.8%) | 173 (42.8%) |
Disability Class by Sex by Age in Creston
Disability Class: Hearing Difficulty
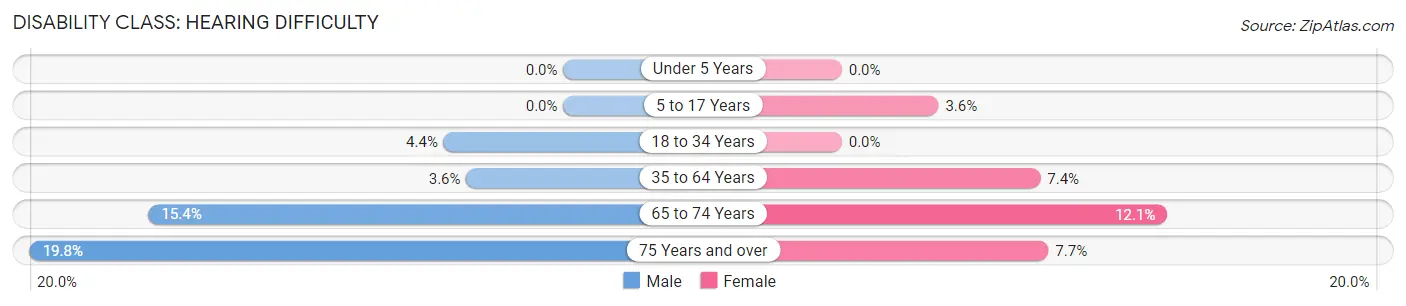
| Age Bracket | Male | Female |
| Under 5 Years | 0 (0.0%) | 0 (0.0%) |
| 5 to 17 Years | 0 (0.0%) | 21 (3.6%) |
| 18 to 34 Years | 38 (4.4%) | 0 (0.0%) |
| 35 to 64 Years | 42 (3.6%) | 106 (7.4%) |
| 65 to 74 Years | 65 (15.4%) | 50 (12.1%) |
| 75 Years and over | 41 (19.8%) | 31 (7.7%) |
Disability Class: Vision Difficulty
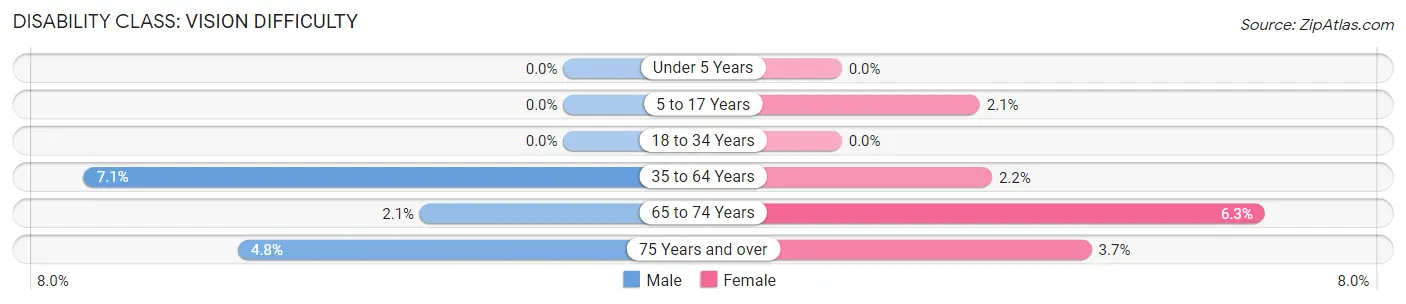
| Age Bracket | Male | Female |
| Under 5 Years | 0 (0.0%) | 0 (0.0%) |
| 5 to 17 Years | 0 (0.0%) | 12 (2.1%) |
| 18 to 34 Years | 0 (0.0%) | 0 (0.0%) |
| 35 to 64 Years | 83 (7.1%) | 32 (2.2%) |
| 65 to 74 Years | 9 (2.1%) | 26 (6.3%) |
| 75 Years and over | 10 (4.8%) | 15 (3.7%) |
Disability Class: Cognitive Difficulty
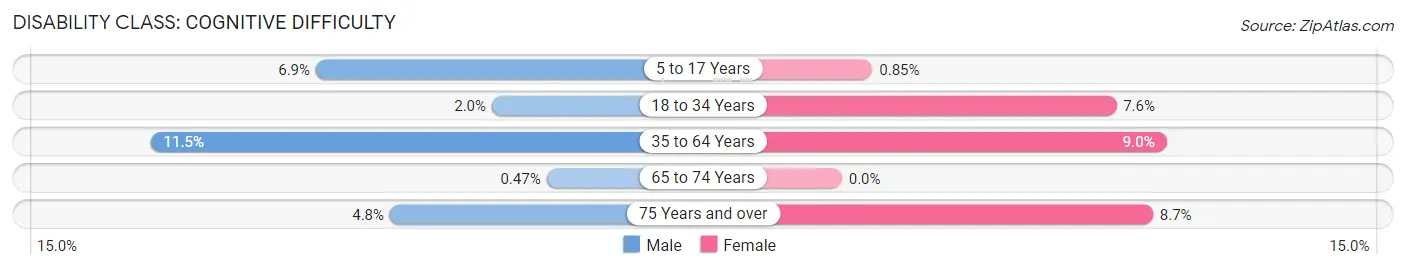
| Age Bracket | Male | Female |
| 5 to 17 Years | 43 (6.9%) | 5 (0.9%) |
| 18 to 34 Years | 17 (2.0%) | 64 (7.6%) |
| 35 to 64 Years | 134 (11.5%) | 130 (9.0%) |
| 65 to 74 Years | 2 (0.5%) | 0 (0.0%) |
| 75 Years and over | 10 (4.8%) | 35 (8.7%) |
Disability Class: Ambulatory Difficulty
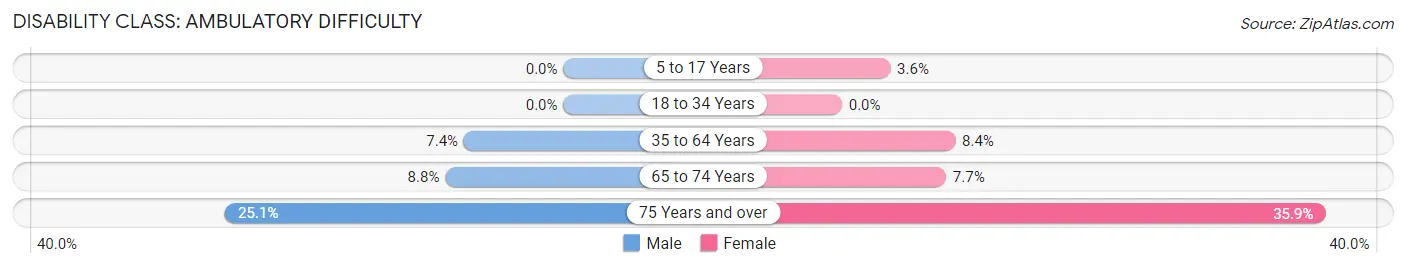
| Age Bracket | Male | Female |
| 5 to 17 Years | 0 (0.0%) | 21 (3.6%) |
| 18 to 34 Years | 0 (0.0%) | 0 (0.0%) |
| 35 to 64 Years | 86 (7.4%) | 121 (8.4%) |
| 65 to 74 Years | 37 (8.8%) | 32 (7.7%) |
| 75 Years and over | 52 (25.1%) | 145 (35.9%) |
Disability Class: Self-Care Difficulty
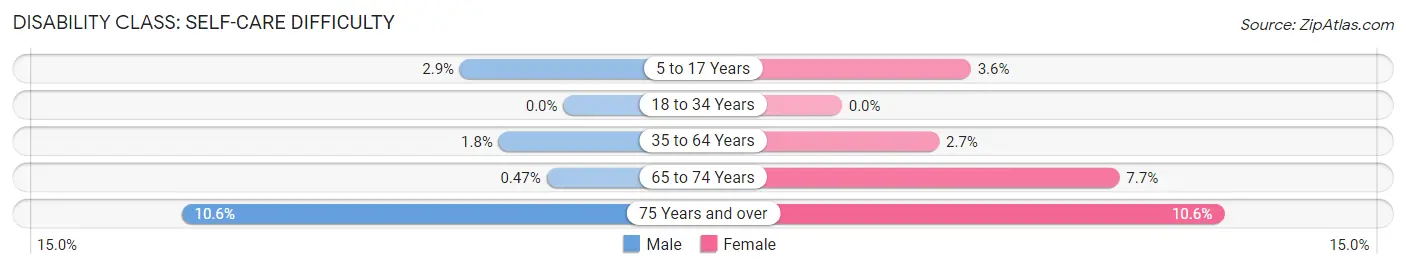
| Age Bracket | Male | Female |
| 5 to 17 Years | 18 (2.9%) | 21 (3.6%) |
| 18 to 34 Years | 0 (0.0%) | 0 (0.0%) |
| 35 to 64 Years | 21 (1.8%) | 39 (2.7%) |
| 65 to 74 Years | 2 (0.5%) | 32 (7.7%) |
| 75 Years and over | 22 (10.6%) | 43 (10.6%) |
Technology Access in Creston
Computing Device Access in Creston
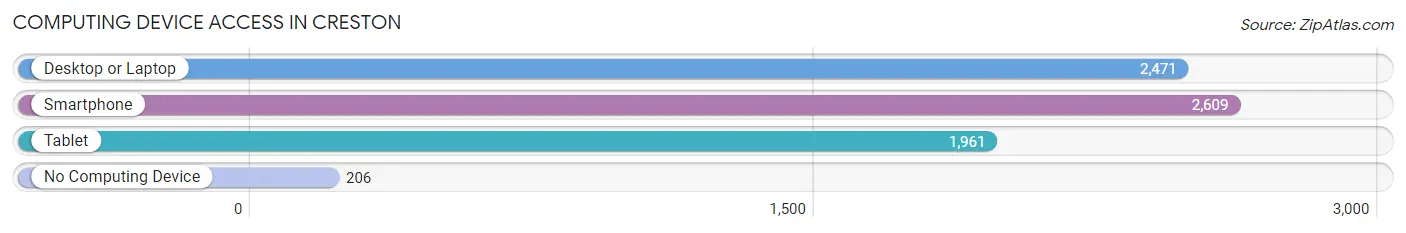
| Device Type | # Households | % Households |
| Desktop or Laptop | 2,471 | 76.1% |
| Smartphone | 2,609 | 80.3% |
| Tablet | 1,961 | 60.4% |
| No Computing Device | 206 | 6.3% |
| Total | 3,247 | 100.0% |
Internet Access in Creston
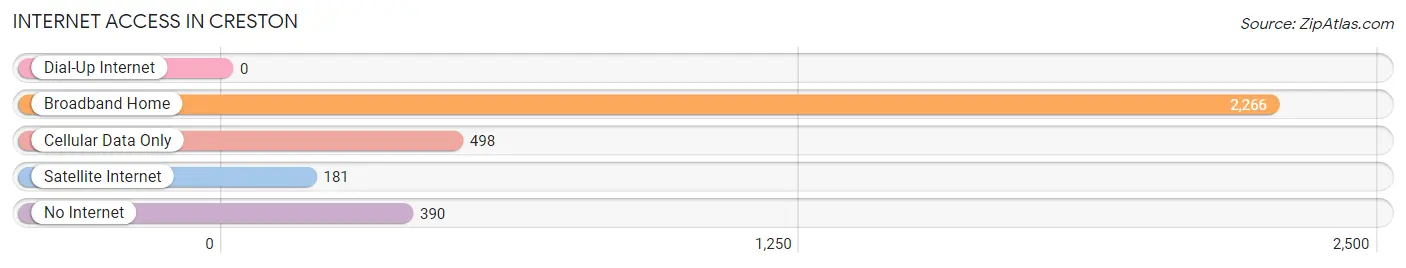
| Internet Type | # Households | % Households |
| Dial-Up Internet | 0 | 0.0% |
| Broadband Home | 2,266 | 69.8% |
| Cellular Data Only | 498 | 15.3% |
| Satellite Internet | 181 | 5.6% |
| No Internet | 390 | 12.0% |
| Total | 3,247 | 100.0% |
Creston Summary
Creston, Iowa is a small city located in Union County, Iowa, United States. It is the county seat of Union County and is located in the southwestern part of the state. The population of Creston was 7,834 at the 2010 census.
History
Creston was founded in 1868 by the Union Pacific Railroad. The city was named after the nearby town of Creston, Nebraska. The first settlers in the area were mostly from the Midwest, including Ohio, Indiana, and Illinois. The first post office was established in 1869.
In 1871, the first school was built in Creston. The first newspaper, the Creston Herald, was established in 1872. The first bank was established in 1873.
In 1875, the first railroad line was built in Creston. This line connected Creston to the rest of the state and the rest of the country.
In 1876, the first telephone line was established in Creston. This line connected Creston to the rest of the state and the rest of the country.
In 1877, the first electric light was installed in Creston. This was the first electric light in the state of Iowa.
In 1878 the first fire department was established in Creston
In 1879 the first hospital was established in Creston
In 1881 the first public library was established in Creston
In 1883 the first newspaper the Creston Times was established in Creston
In 1884 the first high school was established in Creston
In 1885 the first telephone exchange was established in Creston
In 1886 the first waterworks was established in Creston
In 1887 the first electric streetcar line was established in Creston
In 1888 the first public park was established in Creston
In 1889 the first public swimming pool was established in Creston
In 1890 the first public library building was constructed in Creston
In 1891 the first public hospital was established in Creston
In 1892 the first public library building was completed in Creston
In 1893 the first public park was completed in Creston
In 1894 the first public swimming pool was completed in Creston
In 1895 the first public library building was dedicated in Creston
In 1896 the first public hospital was dedicated in Creston
In 1897 the first public park was dedicated in Creston
In 1898 the first public swimming pool was dedicated in Creston
In 1899 the first public library building was expanded in Creston
Geography
Creston is located at the intersection of U.S. Route 34 and Iowa Highway 25 in southwestern Iowa. The city is situated on the banks of the East Nishnabotna River. The city is located approximately 50 miles east of Des Moines and approximately 100 miles west of Davenport.
The city has a total area of 5.3 square miles, all of which is land. The city has a humid continental climate, with hot, humid summers and cold, snowy winters.
Economy
Creston’s economy is largely based on agriculture and manufacturing. The city is home to several large employers, including the Creston Livestock Auction, the Creston Packing Company, and the Creston Manufacturing Company.
The city is also home to several small businesses, including restaurants, retail stores, and service providers.
Demographics
As of the 2010 census, the population of Creston was 7,834. The racial makeup of the city was 95.2% White, 0.7% African American, 0.3% Native American, 0.7% Asian, 0.1% Pacific Islander, 1.7% from other races, and 1.2% from two or more races. Hispanic or Latino of any race were 3.3% of the population.
The median income for a household in the city was $37,917, and the median income for a family was $45,917. The per capita income for the city was $19,917. About 11.2% of families and 14.2% of the population were below the poverty line, including 19.2% of those under age 18 and 8.2% of those age 65 or over.
Common Questions
What is Per Capita Income in Creston?
Per Capita income in Creston is $29,192.
What is the Median Family Income in Creston?
Median Family Income in Creston is $72,373.
What is the Median Household income in Creston?
Median Household Income in Creston is $51,366.
What is Income or Wage Gap in Creston?
Income or Wage Gap in Creston is 51.4%.
Women in Creston earn 48.6 cents for every dollar earned by a man.
What is Family Income Deficit in Creston?
Family Income Deficit in Creston is $11,411.
Families that are below poverty line in Creston earn $11,411 less on average than the poverty threshold level.
What is Inequality or Gini Index in Creston?
Inequality or Gini Index in Creston is 0.43.
What is the Total Population of Creston?
Total Population of Creston is 7,519.
What is the Total Male Population of Creston?
Total Male Population of Creston is 3,513.
What is the Total Female Population of Creston?
Total Female Population of Creston is 4,006.
What is the Ratio of Males per 100 Females in Creston?
There are 87.69 Males per 100 Females in Creston.
What is the Ratio of Females per 100 Males in Creston?
There are 114.03 Females per 100 Males in Creston.
What is the Median Population Age in Creston?
Median Population Age in Creston is 38.7 Years.
What is the Average Family Size in Creston
Average Family Size in Creston is 3.0 People.
What is the Average Household Size in Creston
Average Household Size in Creston is 2.2 People.
How Large is the Labor Force in Creston?
There are 3,654 People in the Labor Forcein in Creston.
What is the Percentage of People in the Labor Force in Creston?
59.7% of People are in the Labor Force in Creston.
What is the Unemployment Rate in Creston?
Unemployment Rate in Creston is 4.5%.