Buffalo, IA Map & Demographics
Buffalo Map
Buffalo Overview
$34,368
PER CAPITA INCOME
$75,625
AVG FAMILY INCOME
$74,667
AVG HOUSEHOLD INCOME
52.4%
WAGE / INCOME GAP [ % ]
47.6¢/ $1
WAGE / INCOME GAP [ $ ]
0.33
INEQUALITY / GINI INDEX
995
TOTAL POPULATION
547
MALE POPULATION
448
FEMALE POPULATION
122.10
MALES / 100 FEMALES
81.90
FEMALES / 100 MALES
40.4
MEDIAN AGE
3.2
AVG FAMILY SIZE
2.2
AVG HOUSEHOLD SIZE
525
LABOR FORCE [ PEOPLE ]
66.3%
PERCENT IN LABOR FORCE
0.6%
UNEMPLOYMENT RATE
Buffalo Zip Codes
Buffalo Area Codes
Income in Buffalo
Income Overview in Buffalo
Per Capita Income in Buffalo is $34,368, while median incomes of families and households are $75,625 and $74,667 respectively.
| Characteristic | Number | Measure |
| Per Capita Income | 995 | $34,368 |
| Median Family Income | 232 | $75,625 |
| Mean Family Income | 232 | $83,139 |
| Median Household Income | 442 | $74,667 |
| Mean Household Income | 442 | $75,407 |
| Income Deficit | 232 | $0 |
| Wage / Income Gap (%) | 995 | 52.37% |
| Wage / Income Gap ($) | 995 | 47.63¢ per $1 |
| Gini / Inequality Index | 995 | 0.33 |
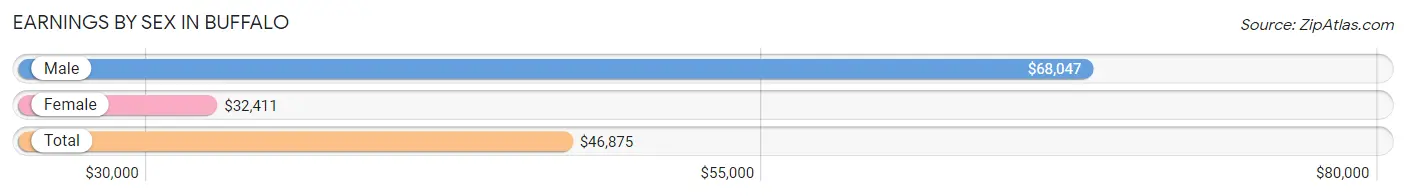
Earnings by Sex in Buffalo
Average Earnings in Buffalo are $46,875, $68,047 for men and $32,411 for women, a difference of 52.4%.
| Sex | Number | Average Earnings |
| Male | 327 (60.6%) | $68,047 |
| Female | 213 (39.4%) | $32,411 |
| Total | 540 (100.0%) | $46,875 |
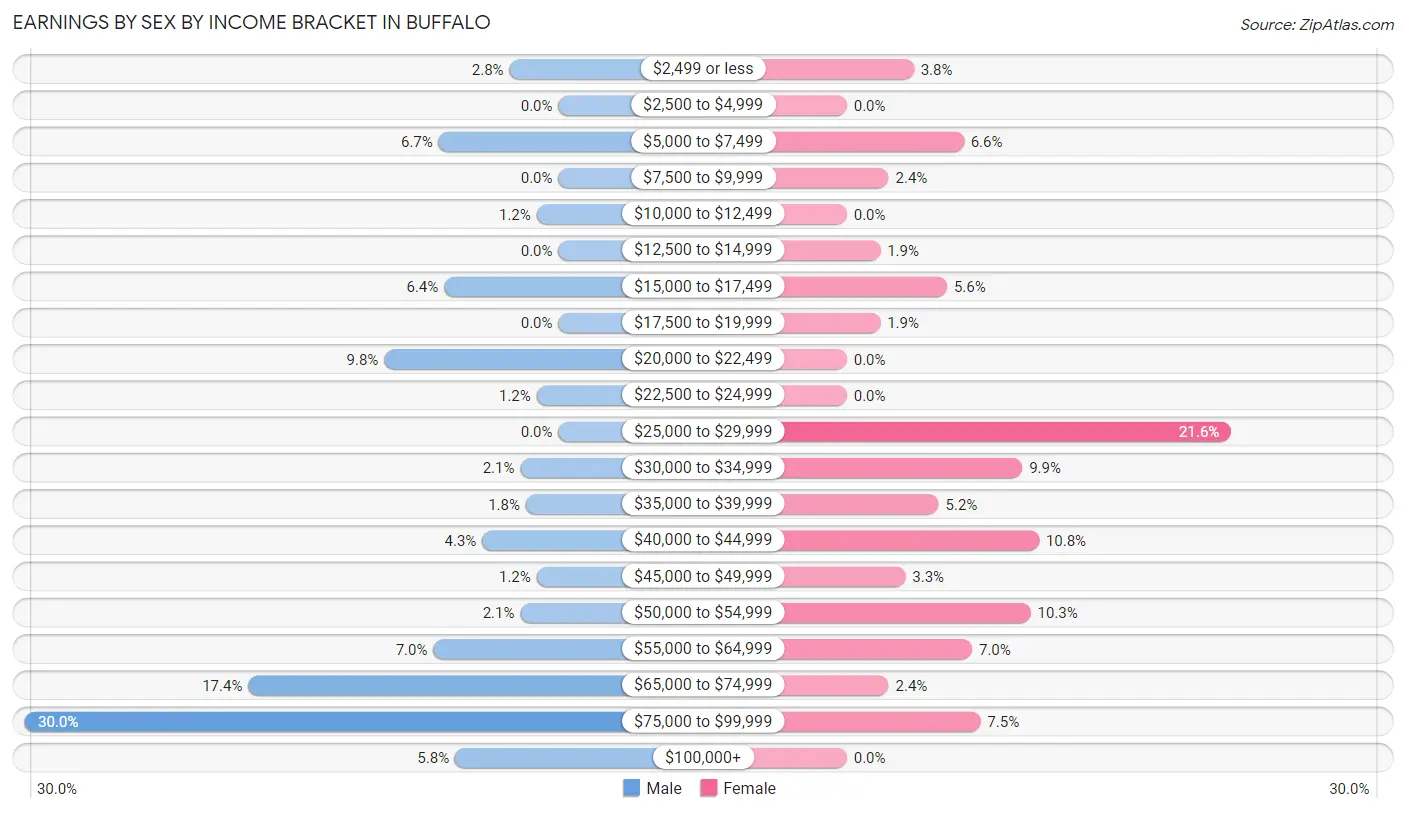
Earnings by Sex by Income Bracket in Buffalo
The most common earnings brackets in Buffalo are $75,000 to $99,999 for men (98 | 30.0%) and $25,000 to $29,999 for women (46 | 21.6%).
| Income | Male | Female |
| $2,499 or less | 9 (2.8%) | 8 (3.8%) |
| $2,500 to $4,999 | 0 (0.0%) | 0 (0.0%) |
| $5,000 to $7,499 | 22 (6.7%) | 14 (6.6%) |
| $7,500 to $9,999 | 0 (0.0%) | 5 (2.4%) |
| $10,000 to $12,499 | 4 (1.2%) | 0 (0.0%) |
| $12,500 to $14,999 | 0 (0.0%) | 4 (1.9%) |
| $15,000 to $17,499 | 21 (6.4%) | 12 (5.6%) |
| $17,500 to $19,999 | 0 (0.0%) | 4 (1.9%) |
| $20,000 to $22,499 | 32 (9.8%) | 0 (0.0%) |
| $22,500 to $24,999 | 4 (1.2%) | 0 (0.0%) |
| $25,000 to $29,999 | 0 (0.0%) | 46 (21.6%) |
| $30,000 to $34,999 | 7 (2.1%) | 21 (9.9%) |
| $35,000 to $39,999 | 6 (1.8%) | 11 (5.2%) |
| $40,000 to $44,999 | 14 (4.3%) | 23 (10.8%) |
| $45,000 to $49,999 | 4 (1.2%) | 7 (3.3%) |
| $50,000 to $54,999 | 7 (2.1%) | 22 (10.3%) |
| $55,000 to $64,999 | 23 (7.0%) | 15 (7.0%) |
| $65,000 to $74,999 | 57 (17.4%) | 5 (2.4%) |
| $75,000 to $99,999 | 98 (30.0%) | 16 (7.5%) |
| $100,000+ | 19 (5.8%) | 0 (0.0%) |
| Total | 327 (100.0%) | 213 (100.0%) |
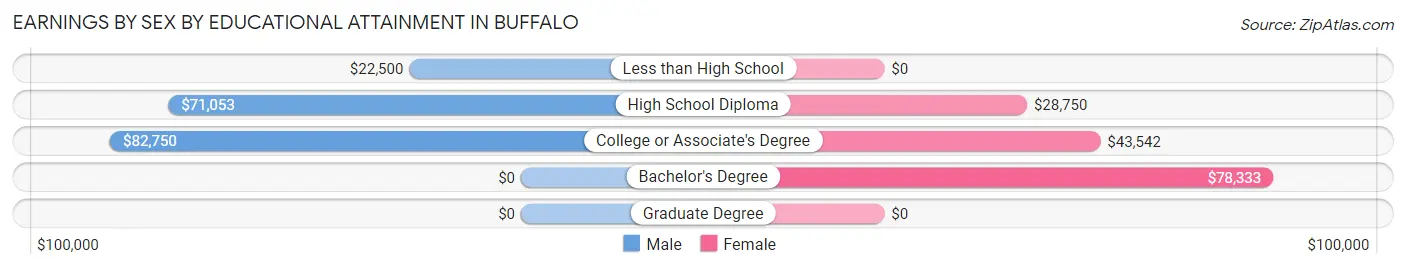
Earnings by Sex by Educational Attainment in Buffalo
Average earnings in Buffalo are $71,776 for men and $39,886 for women, a difference of 44.4%. Men with an educational attainment of college or associate's degree enjoy the highest average annual earnings of $82,750, while those with less than high school education earn the least with $22,500. Women with an educational attainment of bachelor's degree earn the most with the average annual earnings of $78,333, while those with high school diploma education have the smallest earnings of $28,750.
| Educational Attainment | Male Income | Female Income |
| Less than High School | $22,500 | $0 |
| High School Diploma | $71,053 | $28,750 |
| College or Associate's Degree | $82,750 | $43,542 |
| Bachelor's Degree | - | - |
| Graduate Degree | - | - |
| Total | $71,776 | $39,886 |
Family Income in Buffalo
Family Income Brackets in Buffalo
According to the Buffalo family income data, there are 48 families falling into the $75,000 to $99,999 income range, which is the most common income bracket and makes up 20.7% of all families.
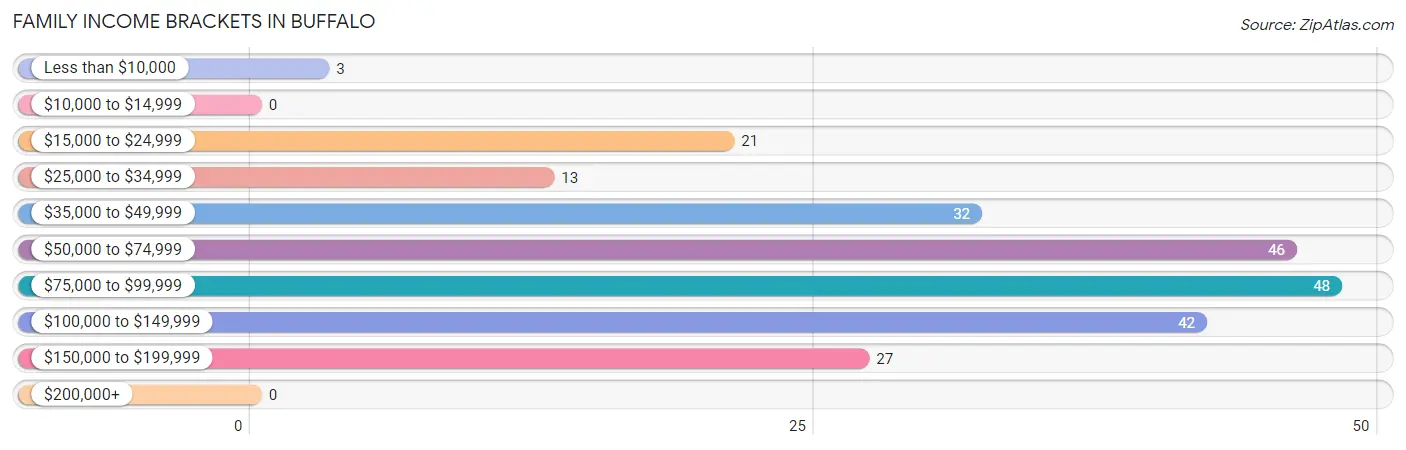
| Income Bracket | # Families | % Families |
| Less than $10,000 | 3 | 1.3% |
| $10,000 to $14,999 | 0 | 0.0% |
| $15,000 to $24,999 | 21 | 9.1% |
| $25,000 to $34,999 | 13 | 5.6% |
| $35,000 to $49,999 | 32 | 13.8% |
| $50,000 to $74,999 | 46 | 19.8% |
| $75,000 to $99,999 | 48 | 20.7% |
| $100,000 to $149,999 | 42 | 18.1% |
| $150,000 to $199,999 | 27 | 11.6% |
| $200,000+ | 0 | 0.0% |
Family Income by Famaliy Size in Buffalo
3-person families (59 | 25.4%) account for the highest median family income in Buffalo with $72,344 per family, while 2-person families (114 | 49.1%) have the highest median income of $34,861 per family member.
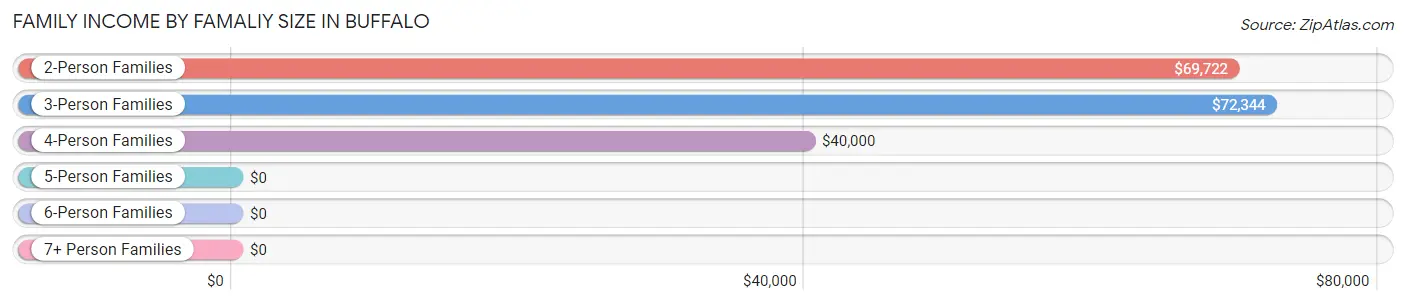
| Income Bracket | # Families | Median Income |
| 2-Person Families | 114 (49.1%) | $69,722 |
| 3-Person Families | 59 (25.4%) | $72,344 |
| 4-Person Families | 32 (13.8%) | $40,000 |
| 5-Person Families | 15 (6.5%) | $0 |
| 6-Person Families | 1 (0.4%) | $0 |
| 7+ Person Families | 11 (4.7%) | $0 |
| Total | 232 (100.0%) | $75,625 |
Family Income by Number of Earners in Buffalo
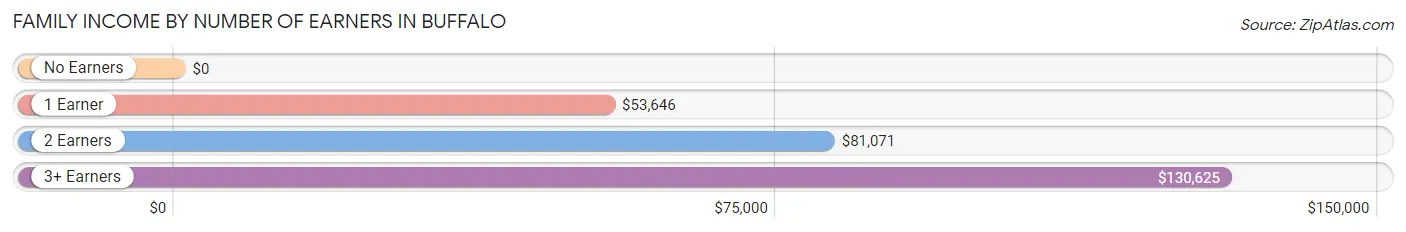
| Number of Earners | # Families | Median Income |
| No Earners | 23 (9.9%) | $0 |
| 1 Earner | 107 (46.1%) | $53,646 |
| 2 Earners | 68 (29.3%) | $81,071 |
| 3+ Earners | 34 (14.7%) | $130,625 |
| Total | 232 (100.0%) | $75,625 |
Household Income in Buffalo
Household Income Brackets in Buffalo
With 132 households falling in the category, the $75,000 to $99,999 income range is the most frequent in Buffalo, accounting for 29.9% of all households.
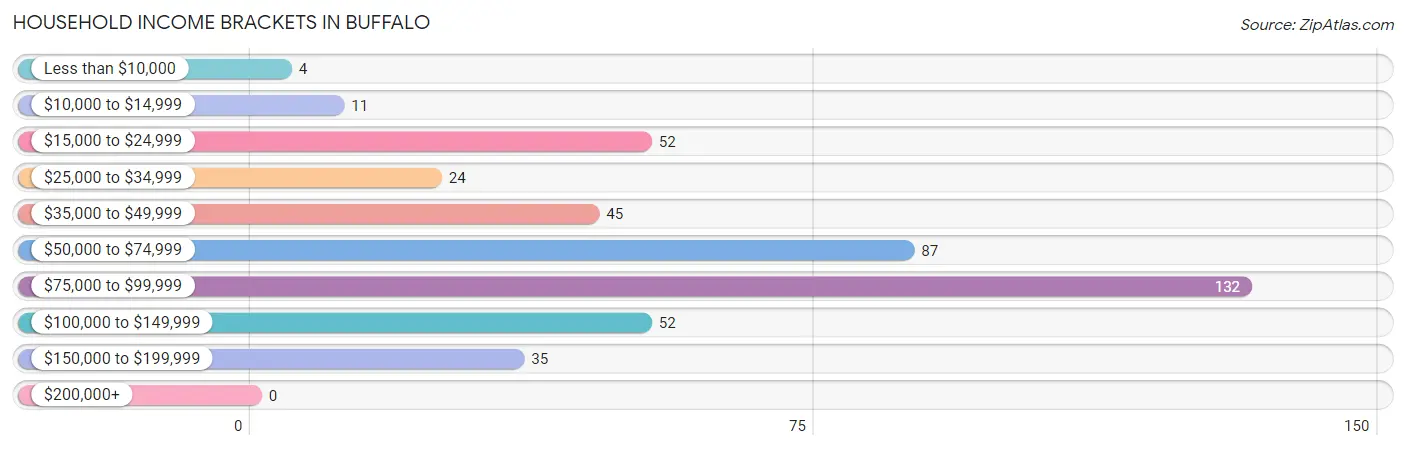
| Income Bracket | # Households | % Households |
| Less than $10,000 | 4 | 0.9% |
| $10,000 to $14,999 | 11 | 2.5% |
| $15,000 to $24,999 | 52 | 11.8% |
| $25,000 to $34,999 | 24 | 5.4% |
| $35,000 to $49,999 | 45 | 10.2% |
| $50,000 to $74,999 | 87 | 19.7% |
| $75,000 to $99,999 | 132 | 29.9% |
| $100,000 to $149,999 | 52 | 11.8% |
| $150,000 to $199,999 | 35 | 7.9% |
| $200,000+ | 0 | 0.0% |
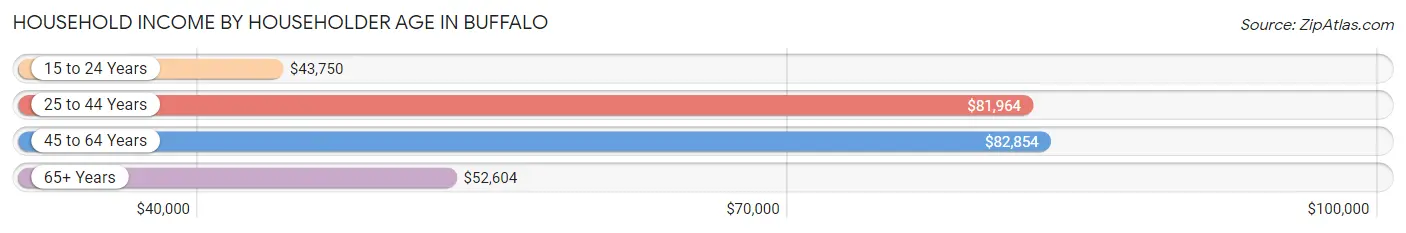
Household Income by Householder Age in Buffalo
The median household income in Buffalo is $74,667, with the highest median household income of $82,854 found in the 45 to 64 years age bracket for the primary householder. A total of 183 households (41.4%) fall into this category. Meanwhile, the 15 to 24 years age bracket for the primary householder has the lowest median household income of $43,750, with 15 households (3.4%) in this group.
| Income Bracket | # Households | Median Income |
| 15 to 24 Years | 15 (3.4%) | $43,750 |
| 25 to 44 Years | 121 (27.4%) | $81,964 |
| 45 to 64 Years | 183 (41.4%) | $82,854 |
| 65+ Years | 123 (27.8%) | $52,604 |
| Total | 442 (100.0%) | $74,667 |
Poverty in Buffalo
Income Below Poverty by Sex and Age in Buffalo
With 7.7% poverty level for males and 9.4% for females among the residents of Buffalo, under 5 year old males and 5 year old females are the most vulnerable to poverty, with 6 males (54.5%) and 3 females (100.0%) in their respective age groups living below the poverty level.
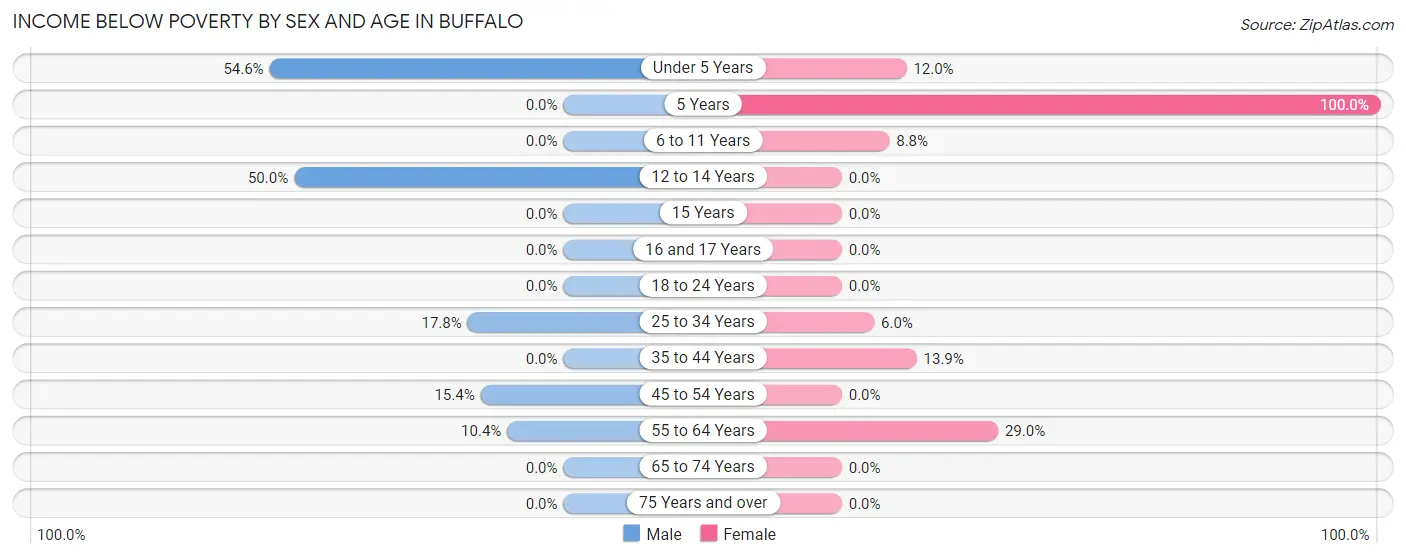
| Age Bracket | Male | Female |
| Under 5 Years | 6 (54.5%) | 3 (12.0%) |
| 5 Years | 0 (0.0%) | 3 (100.0%) |
| 6 to 11 Years | 0 (0.0%) | 3 (8.8%) |
| 12 to 14 Years | 10 (50.0%) | 0 (0.0%) |
| 15 Years | 0 (0.0%) | 0 (0.0%) |
| 16 and 17 Years | 0 (0.0%) | 0 (0.0%) |
| 18 to 24 Years | 0 (0.0%) | 0 (0.0%) |
| 25 to 34 Years | 8 (17.8%) | 3 (6.0%) |
| 35 to 44 Years | 0 (0.0%) | 10 (13.9%) |
| 45 to 54 Years | 6 (15.4%) | 0 (0.0%) |
| 55 to 64 Years | 12 (10.4%) | 20 (29.0%) |
| 65 to 74 Years | 0 (0.0%) | 0 (0.0%) |
| 75 Years and over | 0 (0.0%) | 0 (0.0%) |
| Total | 42 (7.7%) | 42 (9.4%) |
Income Above Poverty by Sex and Age in Buffalo
According to the poverty statistics in Buffalo, males aged 5 years and females aged 12 to 14 years are the age groups that are most secure financially, with 100.0% of males and 100.0% of females in these age groups living above the poverty line.
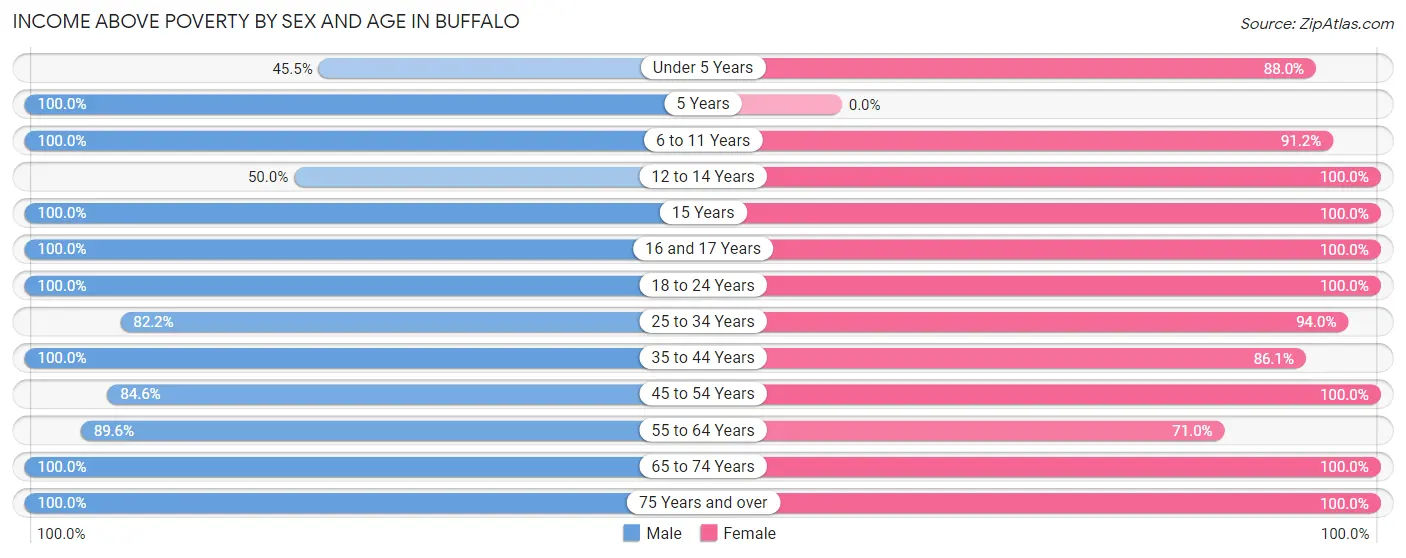
| Age Bracket | Male | Female |
| Under 5 Years | 5 (45.5%) | 22 (88.0%) |
| 5 Years | 12 (100.0%) | 0 (0.0%) |
| 6 to 11 Years | 57 (100.0%) | 31 (91.2%) |
| 12 to 14 Years | 10 (50.0%) | 22 (100.0%) |
| 15 Years | 8 (100.0%) | 11 (100.0%) |
| 16 and 17 Years | 37 (100.0%) | 13 (100.0%) |
| 18 to 24 Years | 30 (100.0%) | 28 (100.0%) |
| 25 to 34 Years | 37 (82.2%) | 47 (94.0%) |
| 35 to 44 Years | 62 (100.0%) | 62 (86.1%) |
| 45 to 54 Years | 33 (84.6%) | 49 (100.0%) |
| 55 to 64 Years | 103 (89.6%) | 49 (71.0%) |
| 65 to 74 Years | 79 (100.0%) | 45 (100.0%) |
| 75 Years and over | 32 (100.0%) | 27 (100.0%) |
| Total | 505 (92.3%) | 406 (90.6%) |
Income Below Poverty Among Married-Couple Families in Buffalo
The poverty statistics for married-couple families in Buffalo show that 9.9% or 14 of the total 142 families live below the poverty line. Families with 1 or 2 children have the highest poverty rate of 20.0%, comprising of 13 families. On the other hand, families with 3 or 4 children have the lowest poverty rate of 0.0%, which includes 0 families.
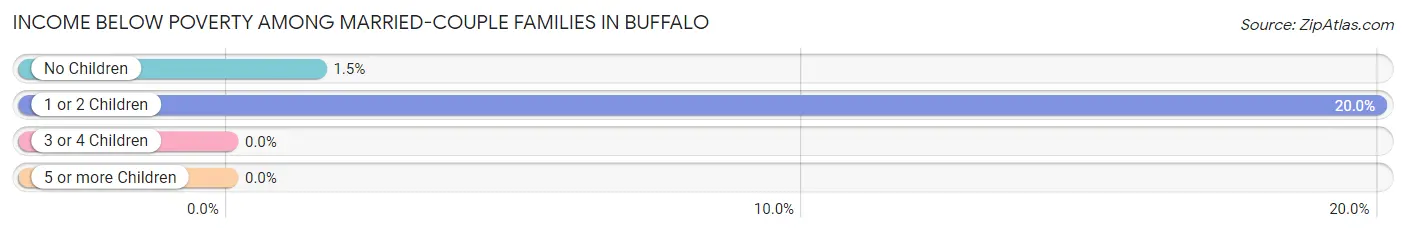
| Children | Above Poverty | Below Poverty |
| No Children | 64 (98.5%) | 1 (1.5%) |
| 1 or 2 Children | 52 (80.0%) | 13 (20.0%) |
| 3 or 4 Children | 3 (100.0%) | 0 (0.0%) |
| 5 or more Children | 9 (100.0%) | 0 (0.0%) |
| Total | 128 (90.1%) | 14 (9.9%) |
Income Below Poverty Among Single-Parent Households in Buffalo
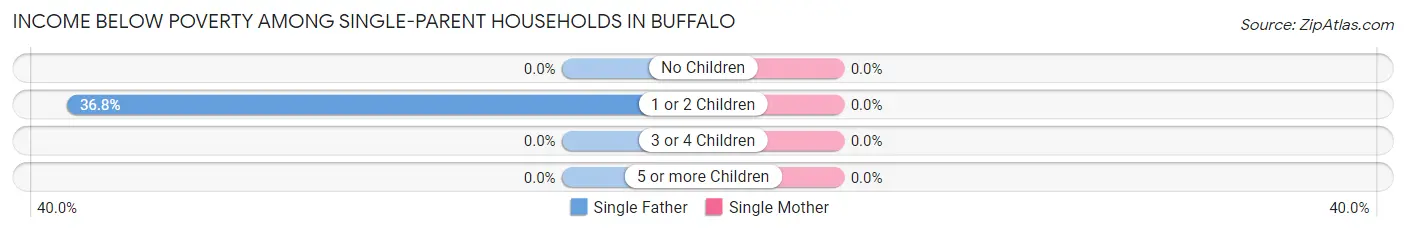
| Children | Single Father | Single Mother |
| No Children | 0 (0.0%) | 0 (0.0%) |
| 1 or 2 Children | 7 (36.8%) | 0 (0.0%) |
| 3 or 4 Children | 0 (0.0%) | 0 (0.0%) |
| 5 or more Children | 0 (0.0%) | 0 (0.0%) |
| Total | 7 (29.2%) | 0 (0.0%) |
Income Below Poverty Among Married-Couple vs Single-Parent Households in Buffalo
The poverty data for Buffalo shows that 14 of the married-couple family households (9.9%) and 7 of the single-parent households (7.8%) are living below the poverty level. Within the married-couple family households, those with 1 or 2 children have the highest poverty rate, with 13 households (20.0%) falling below the poverty line. Among the single-parent households, those with 1 or 2 children have the highest poverty rate, with 7 household (12.1%) living below poverty.
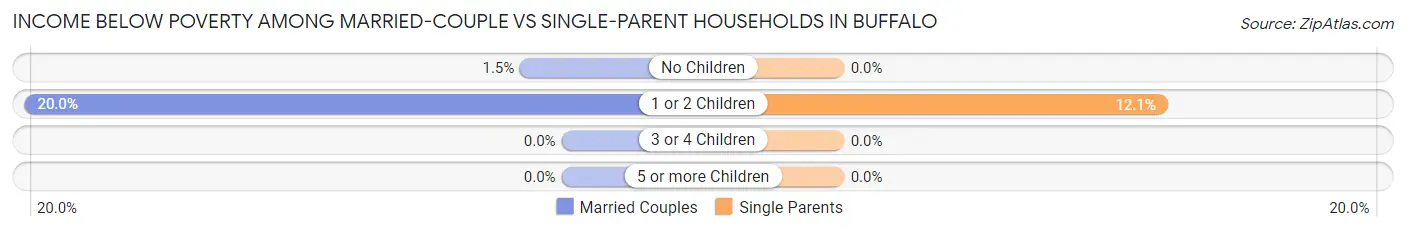
| Children | Married-Couple Families | Single-Parent Households |
| No Children | 1 (1.5%) | 0 (0.0%) |
| 1 or 2 Children | 13 (20.0%) | 7 (12.1%) |
| 3 or 4 Children | 0 (0.0%) | 0 (0.0%) |
| 5 or more Children | 0 (0.0%) | 0 (0.0%) |
| Total | 14 (9.9%) | 7 (7.8%) |
Race in Buffalo
The most populous races in Buffalo are White / Caucasian (886 | 89.0%), Some other Race (90 | 9.0%), and Hispanic or Latino (41 | 4.1%).
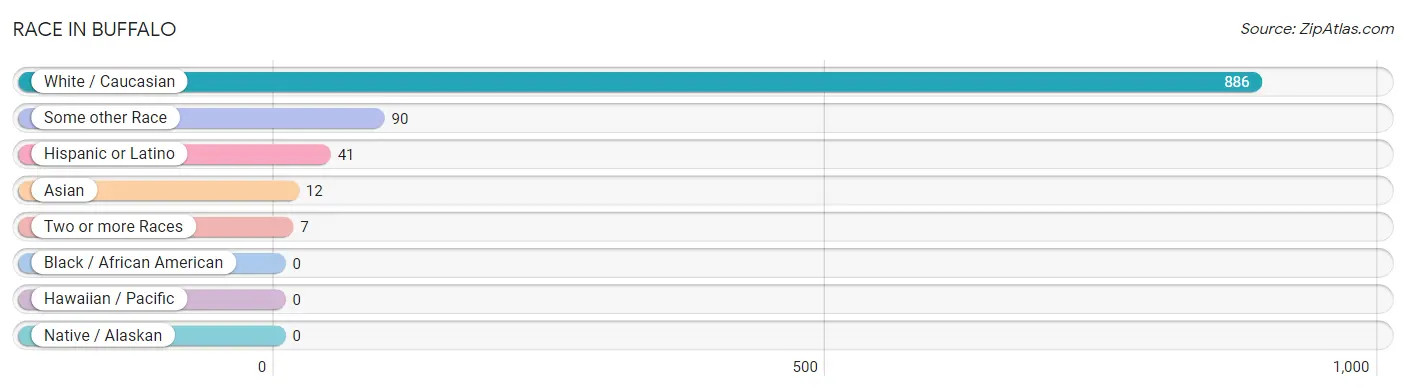
| Race | # Population | % Population |
| Asian | 12 | 1.2% |
| Black / African American | 0 | 0.0% |
| Hawaiian / Pacific | 0 | 0.0% |
| Hispanic or Latino | 41 | 4.1% |
| Native / Alaskan | 0 | 0.0% |
| White / Caucasian | 886 | 89.0% |
| Two or more Races | 7 | 0.7% |
| Some other Race | 90 | 9.0% |
| Total | 995 | 100.0% |
Ancestry in Buffalo
The most populous ancestries reported in Buffalo are German (303 | 30.4%), Irish (137 | 13.8%), Mexican (39 | 3.9%), American (31 | 3.1%), and English (30 | 3.0%), together accounting for 54.3% of all Buffalo residents.
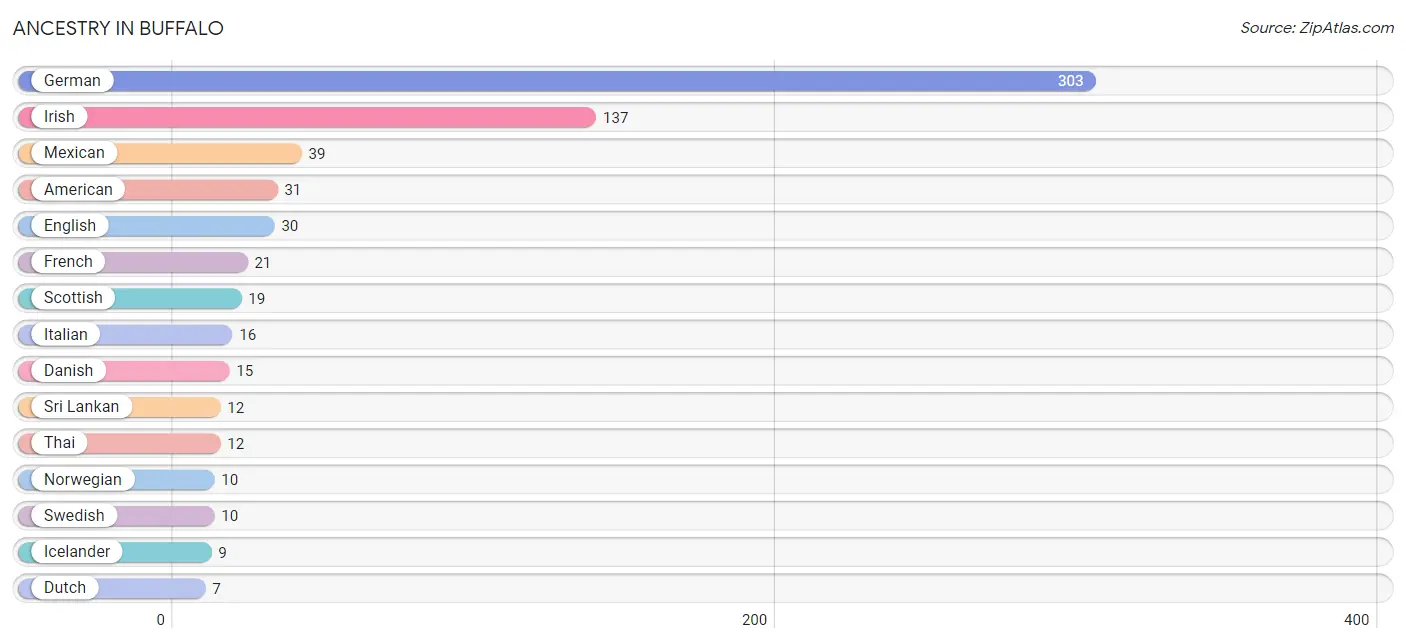
| Ancestry | # Population | % Population |
| American | 31 | 3.1% |
| Central American | 2 | 0.2% |
| Danish | 15 | 1.5% |
| Dutch | 7 | 0.7% |
| English | 30 | 3.0% |
| European | 6 | 0.6% |
| French | 21 | 2.1% |
| German | 303 | 30.4% |
| Guatemalan | 2 | 0.2% |
| Icelander | 9 | 0.9% |
| Irish | 137 | 13.8% |
| Italian | 16 | 1.6% |
| Kiowa | 3 | 0.3% |
| Mexican | 39 | 3.9% |
| Norwegian | 10 | 1.0% |
| Polish | 3 | 0.3% |
| Russian | 4 | 0.4% |
| Scandinavian | 5 | 0.5% |
| Scottish | 19 | 1.9% |
| Sri Lankan | 12 | 1.2% |
| Swedish | 10 | 1.0% |
| Thai | 12 | 1.2% | View All 22 Rows |
Immigrants in Buffalo
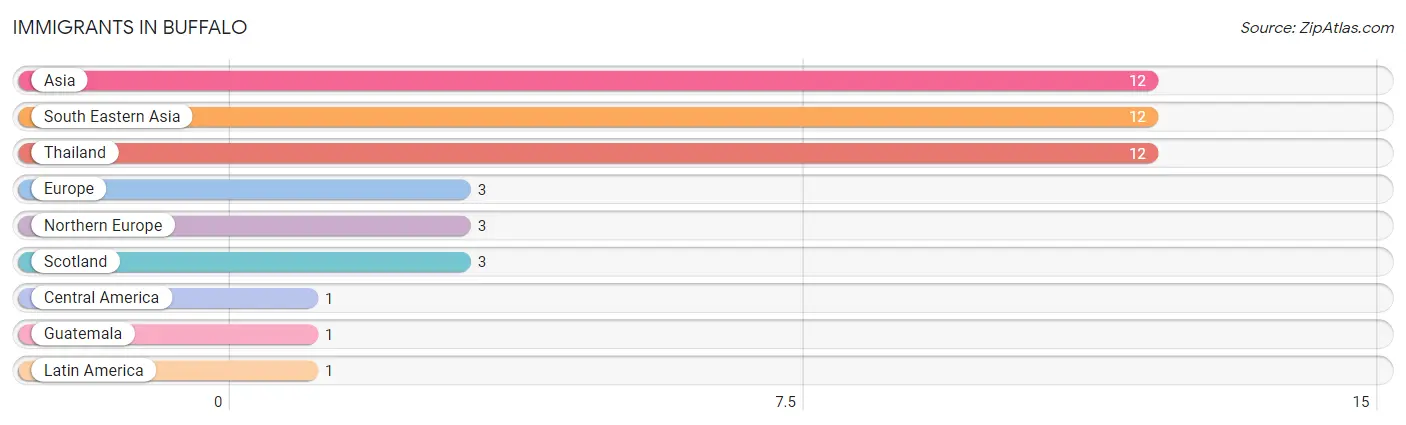
The most numerous immigrant groups reported in Buffalo came from Asia (12 | 1.2%), South Eastern Asia (12 | 1.2%), Thailand (12 | 1.2%), Europe (3 | 0.3%), and Northern Europe (3 | 0.3%), together accounting for 4.2% of all Buffalo residents.
| Immigration Origin | # Population | % Population |
| Asia | 12 | 1.2% |
| Central America | 1 | 0.1% |
| Europe | 3 | 0.3% |
| Guatemala | 1 | 0.1% |
| Latin America | 1 | 0.1% |
| Northern Europe | 3 | 0.3% |
| Scotland | 3 | 0.3% |
| South Eastern Asia | 12 | 1.2% |
| Thailand | 12 | 1.2% | View All 9 Rows |
Sex and Age in Buffalo
Sex and Age in Buffalo
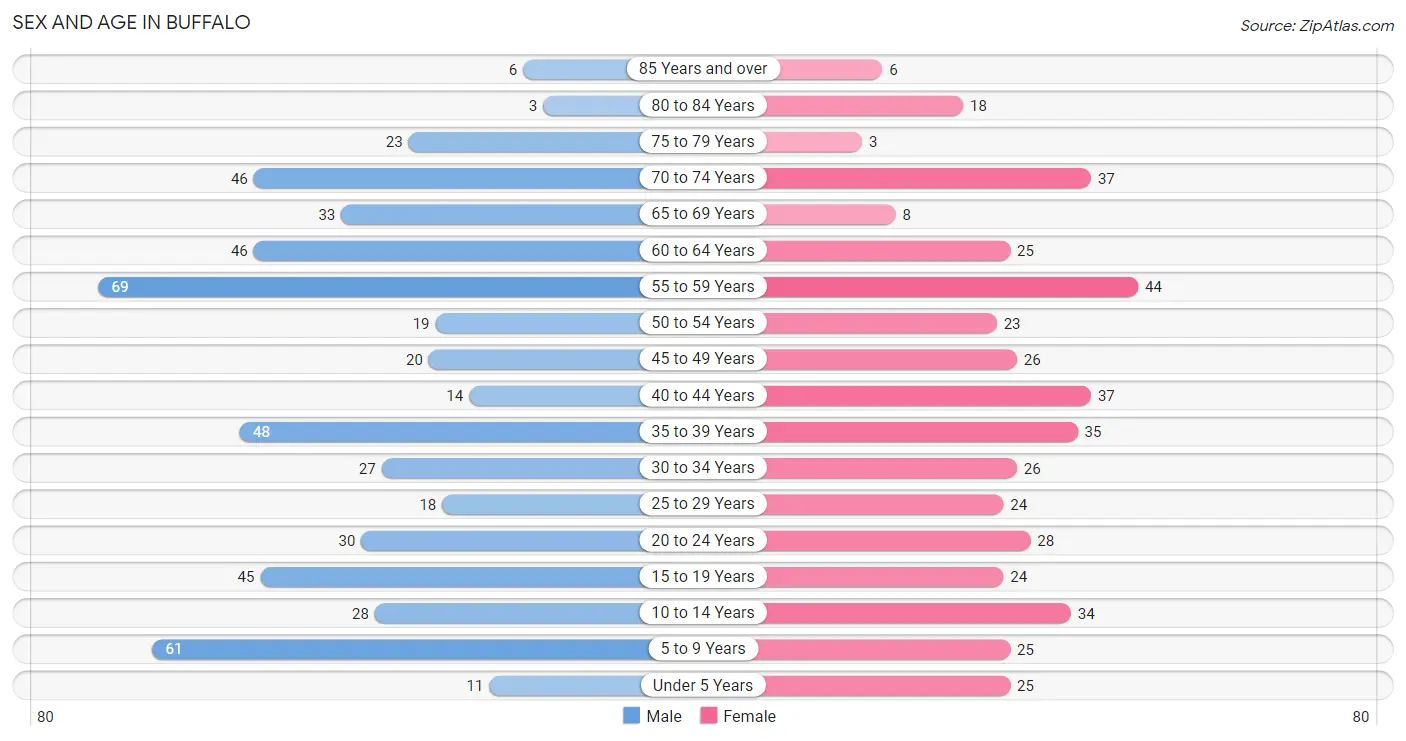
The most populous age groups in Buffalo are 55 to 59 Years (69 | 12.6%) for men and 55 to 59 Years (44 | 9.8%) for women.
| Age Bracket | Male | Female |
| Under 5 Years | 11 (2.0%) | 25 (5.6%) |
| 5 to 9 Years | 61 (11.2%) | 25 (5.6%) |
| 10 to 14 Years | 28 (5.1%) | 34 (7.6%) |
| 15 to 19 Years | 45 (8.2%) | 24 (5.4%) |
| 20 to 24 Years | 30 (5.5%) | 28 (6.2%) |
| 25 to 29 Years | 18 (3.3%) | 24 (5.4%) |
| 30 to 34 Years | 27 (4.9%) | 26 (5.8%) |
| 35 to 39 Years | 48 (8.8%) | 35 (7.8%) |
| 40 to 44 Years | 14 (2.6%) | 37 (8.3%) |
| 45 to 49 Years | 20 (3.7%) | 26 (5.8%) |
| 50 to 54 Years | 19 (3.5%) | 23 (5.1%) |
| 55 to 59 Years | 69 (12.6%) | 44 (9.8%) |
| 60 to 64 Years | 46 (8.4%) | 25 (5.6%) |
| 65 to 69 Years | 33 (6.0%) | 8 (1.8%) |
| 70 to 74 Years | 46 (8.4%) | 37 (8.3%) |
| 75 to 79 Years | 23 (4.2%) | 3 (0.7%) |
| 80 to 84 Years | 3 (0.5%) | 18 (4.0%) |
| 85 Years and over | 6 (1.1%) | 6 (1.3%) |
| Total | 547 (100.0%) | 448 (100.0%) |
Families and Households in Buffalo
Median Family Size in Buffalo
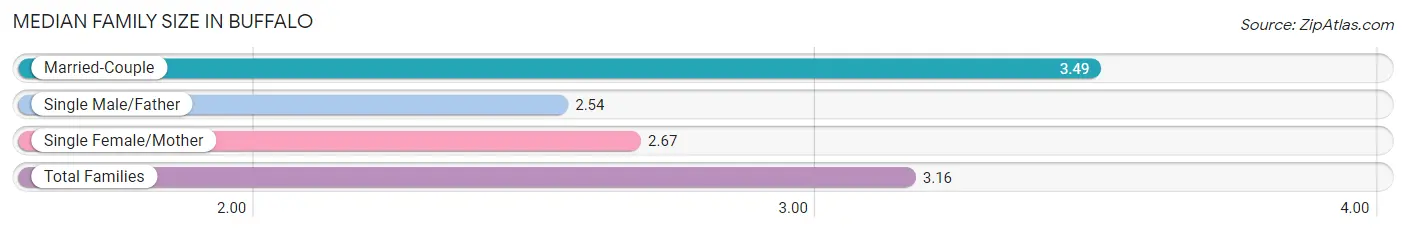
The median family size in Buffalo is 3.16 persons per family, with married-couple families (142 | 61.2%) accounting for the largest median family size of 3.49 persons per family. On the other hand, single male/father families (24 | 10.3%) represent the smallest median family size with 2.54 persons per family.
| Family Type | # Families | Family Size |
| Married-Couple | 142 (61.2%) | 3.49 |
| Single Male/Father | 24 (10.3%) | 2.54 |
| Single Female/Mother | 66 (28.4%) | 2.67 |
| Total Families | 232 (100.0%) | 3.16 |
Median Household Size in Buffalo
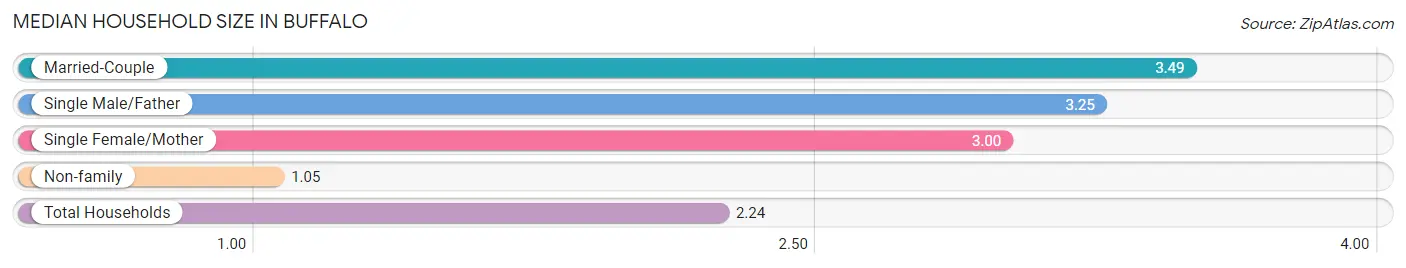
The median household size in Buffalo is 2.24 persons per household, with married-couple households (142 | 32.1%) accounting for the largest median household size of 3.49 persons per household. non-family households (210 | 47.5%) represent the smallest median household size with 1.05 persons per household.
| Household Type | # Households | Household Size |
| Married-Couple | 142 (32.1%) | 3.49 |
| Single Male/Father | 24 (5.4%) | 3.25 |
| Single Female/Mother | 66 (14.9%) | 3.00 |
| Non-family | 210 (47.5%) | 1.05 |
| Total Households | 442 (100.0%) | 2.24 |
Household Size by Marriage Status in Buffalo
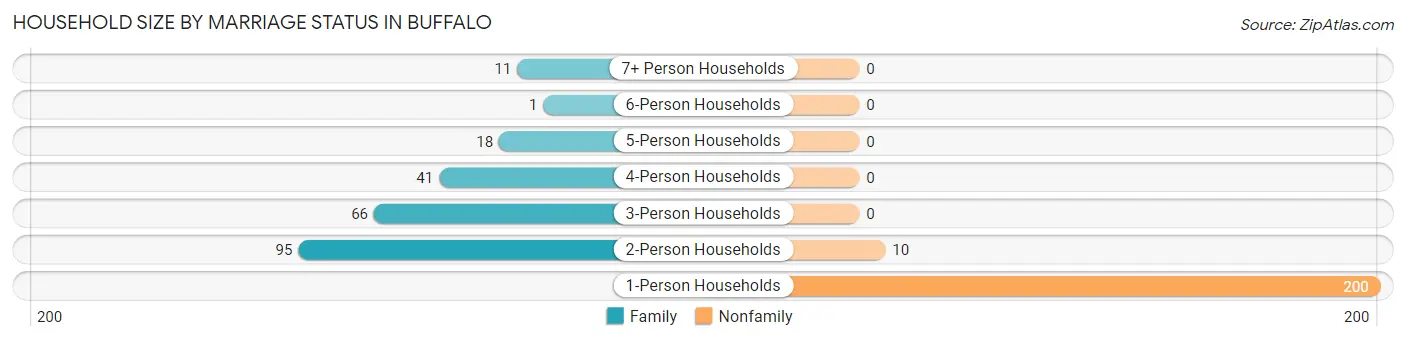
Out of a total of 442 households in Buffalo, 232 (52.5%) are family households, while 210 (47.5%) are nonfamily households. The most numerous type of family households are 2-person households, comprising 95, and the most common type of nonfamily households are 1-person households, comprising 200.
| Household Size | Family Households | Nonfamily Households |
| 1-Person Households | - | 200 (45.3%) |
| 2-Person Households | 95 (21.5%) | 10 (2.3%) |
| 3-Person Households | 66 (14.9%) | 0 (0.0%) |
| 4-Person Households | 41 (9.3%) | 0 (0.0%) |
| 5-Person Households | 18 (4.1%) | 0 (0.0%) |
| 6-Person Households | 1 (0.2%) | 0 (0.0%) |
| 7+ Person Households | 11 (2.5%) | 0 (0.0%) |
| Total | 232 (52.5%) | 210 (47.5%) |
Female Fertility in Buffalo
Fertility by Age in Buffalo
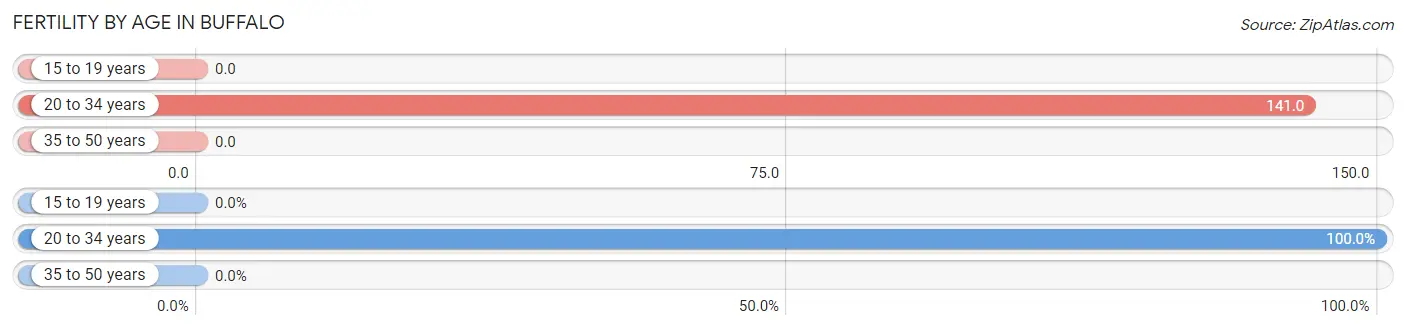
Average fertility rate in Buffalo is 55.0 births per 1,000 women. Women in the age bracket of 20 to 34 years have the highest fertility rate with 141.0 births per 1,000 women. Women in the age bracket of 20 to 34 years acount for 100.0% of all women with births.
| Age Bracket | Women with Births | Births / 1,000 Women |
| 15 to 19 years | 0 (0.0%) | 0.0 |
| 20 to 34 years | 11 (100.0%) | 141.0 |
| 35 to 50 years | 0 (0.0%) | 0.0 |
| Total | 11 (100.0%) | 55.0 |
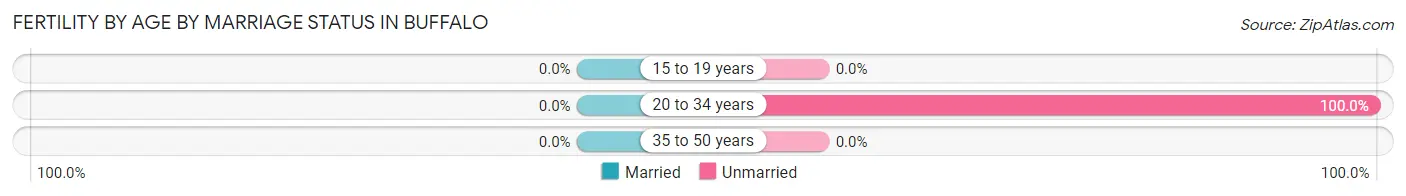
Fertility by Age by Marriage Status in Buffalo
| Age Bracket | Married | Unmarried |
| 15 to 19 years | 0 (0.0%) | 0 (0.0%) |
| 20 to 34 years | 0 (0.0%) | 11 (100.0%) |
| 35 to 50 years | 0 (0.0%) | 0 (0.0%) |
| Total | 0 (0.0%) | 11 (100.0%) |
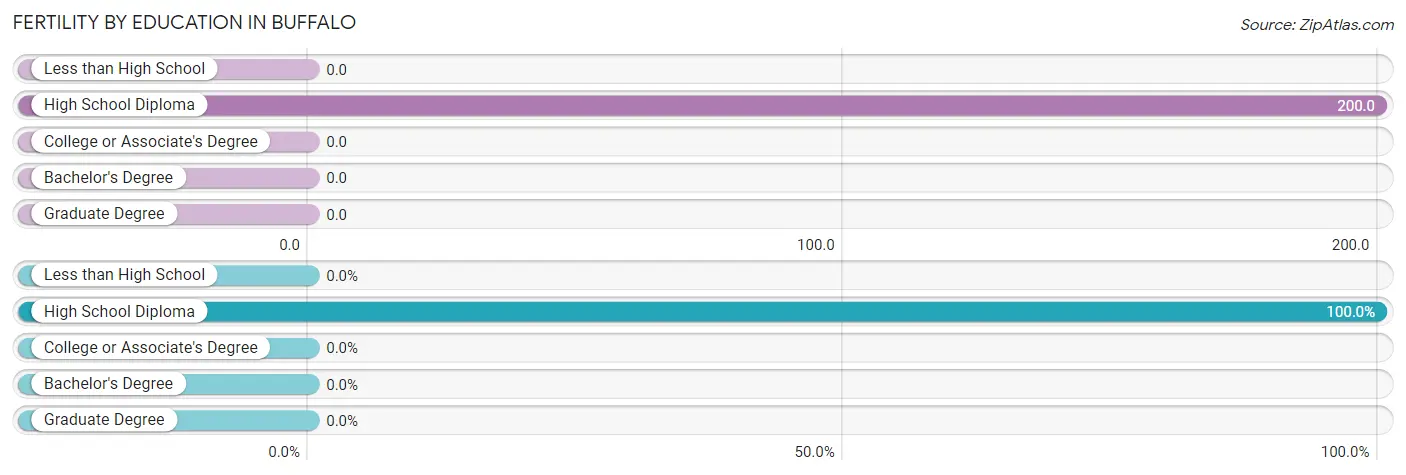
Fertility by Education in Buffalo
| Educational Attainment | Women with Births | Births / 1,000 Women |
| Less than High School | 0 (0.0%) | 0.0 |
| High School Diploma | 11 (100.0%) | 200.0 |
| College or Associate's Degree | 0 (0.0%) | 0.0 |
| Bachelor's Degree | 0 (0.0%) | 0.0 |
| Graduate Degree | 0 (0.0%) | 0.0 |
| Total | 11 (100.0%) | 55.0 |
Fertility by Education by Marriage Status in Buffalo
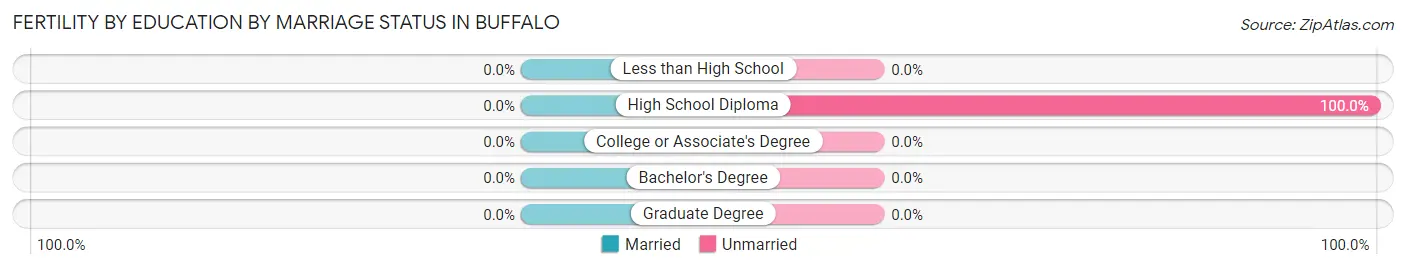
| Educational Attainment | Married | Unmarried |
| Less than High School | 0 (0.0%) | 0 (0.0%) |
| High School Diploma | 0 (0.0%) | 11 (100.0%) |
| College or Associate's Degree | 0 (0.0%) | 0 (0.0%) |
| Bachelor's Degree | 0 (0.0%) | 0 (0.0%) |
| Graduate Degree | 0 (0.0%) | 0 (0.0%) |
| Total | 0 (0.0%) | 11 (100.0%) |
Employment Characteristics in Buffalo
Employment by Class of Employer in Buffalo
Among the 514 employed individuals in Buffalo, private company employees (424 | 82.5%), local government employees (32 | 6.2%), and not-for-profit organizations (23 | 4.5%) make up the most common classes of employment.
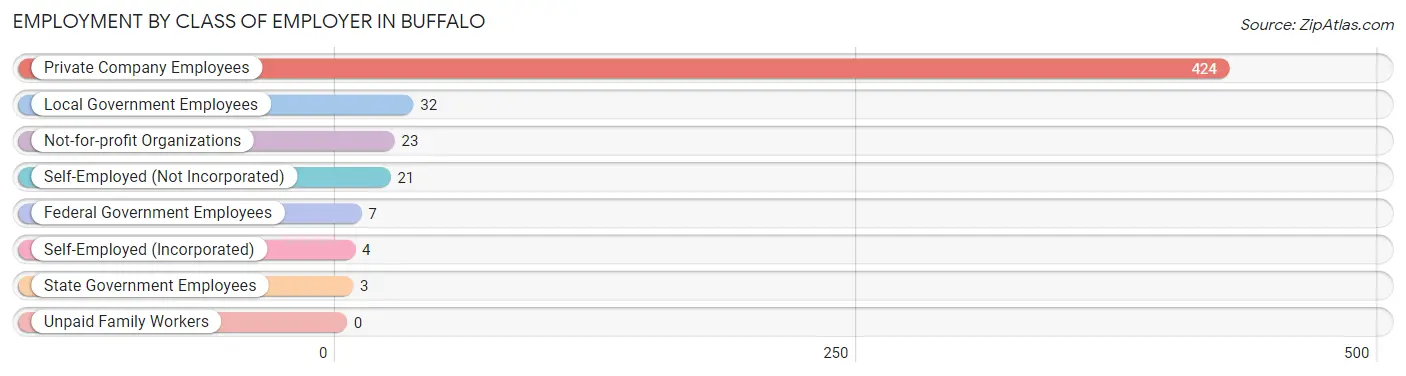
| Employer Class | # Employees | % Employees |
| Private Company Employees | 424 | 82.5% |
| Self-Employed (Incorporated) | 4 | 0.8% |
| Self-Employed (Not Incorporated) | 21 | 4.1% |
| Not-for-profit Organizations | 23 | 4.5% |
| Local Government Employees | 32 | 6.2% |
| State Government Employees | 3 | 0.6% |
| Federal Government Employees | 7 | 1.4% |
| Unpaid Family Workers | 0 | 0.0% |
| Total | 514 | 100.0% |
Employment Status by Age in Buffalo
According to the labor force statistics for Buffalo, out of the total population over 16 years of age (792), 66.3% or 525 individuals are in the labor force, with 0.6% or 3 of them unemployed. The age group with the highest labor force participation rate is 25 to 29 years, with 100.0% or 42 individuals in the labor force. Within the labor force, the 16 to 19 years age range has the highest percentage of unemployed individuals, with 13.0% or 3 of them being unemployed.
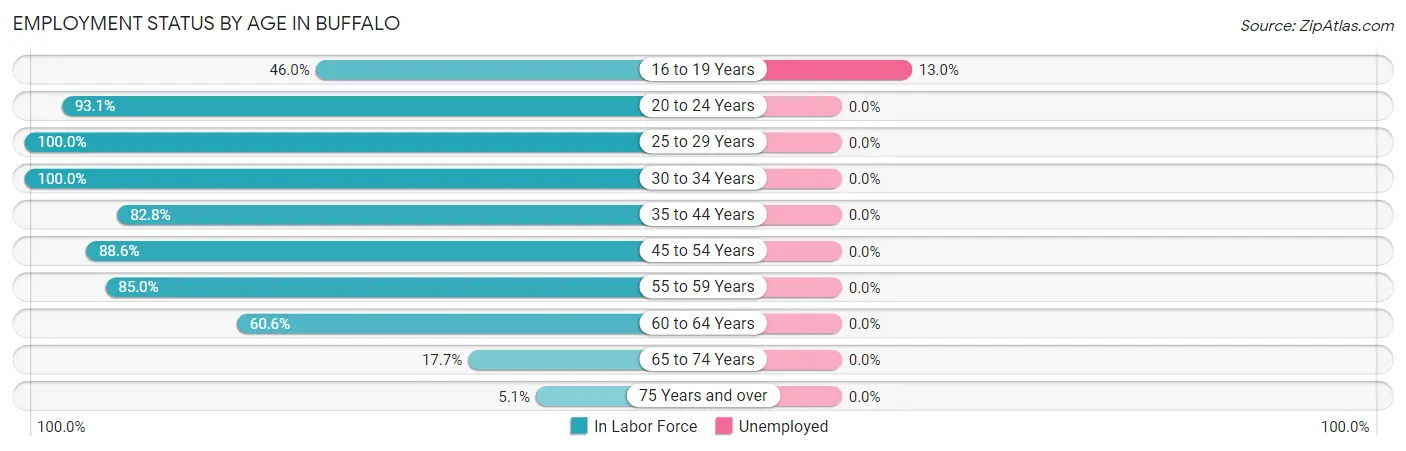
| Age Bracket | In Labor Force | Unemployed |
| 16 to 19 Years | 23 (46.0%) | 3 (13.0%) |
| 20 to 24 Years | 54 (93.1%) | 0 (0.0%) |
| 25 to 29 Years | 42 (100.0%) | 0 (0.0%) |
| 30 to 34 Years | 53 (100.0%) | 0 (0.0%) |
| 35 to 44 Years | 111 (82.8%) | 0 (0.0%) |
| 45 to 54 Years | 78 (88.6%) | 0 (0.0%) |
| 55 to 59 Years | 96 (85.0%) | 0 (0.0%) |
| 60 to 64 Years | 43 (60.6%) | 0 (0.0%) |
| 65 to 74 Years | 22 (17.7%) | 0 (0.0%) |
| 75 Years and over | 3 (5.1%) | 0 (0.0%) |
| Total | 525 (66.3%) | 3 (0.6%) |
Employment Status by Educational Attainment in Buffalo
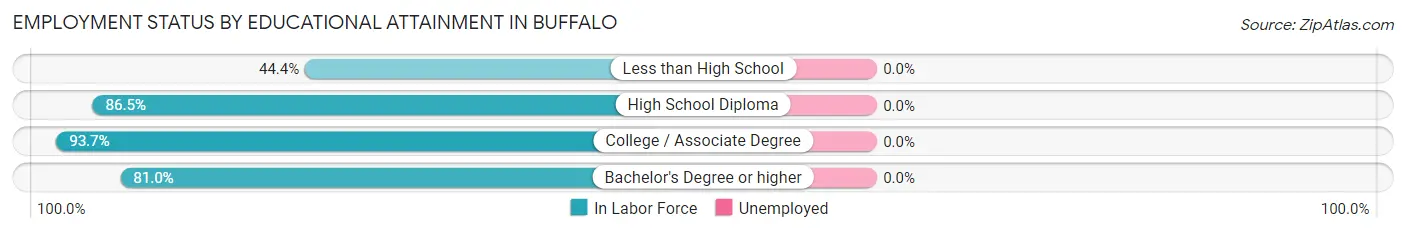
| Educational Attainment | In Labor Force | Unemployed |
| Less than High School | 24 (44.4%) | 0 (0.0%) |
| High School Diploma | 141 (86.5%) | 0 (0.0%) |
| College / Associate Degree | 207 (93.7%) | 0 (0.0%) |
| Bachelor's Degree or higher | 51 (81.0%) | 0 (0.0%) |
| Total | 423 (84.4%) | 0 (0.0%) |
Employment Occupations by Sex in Buffalo
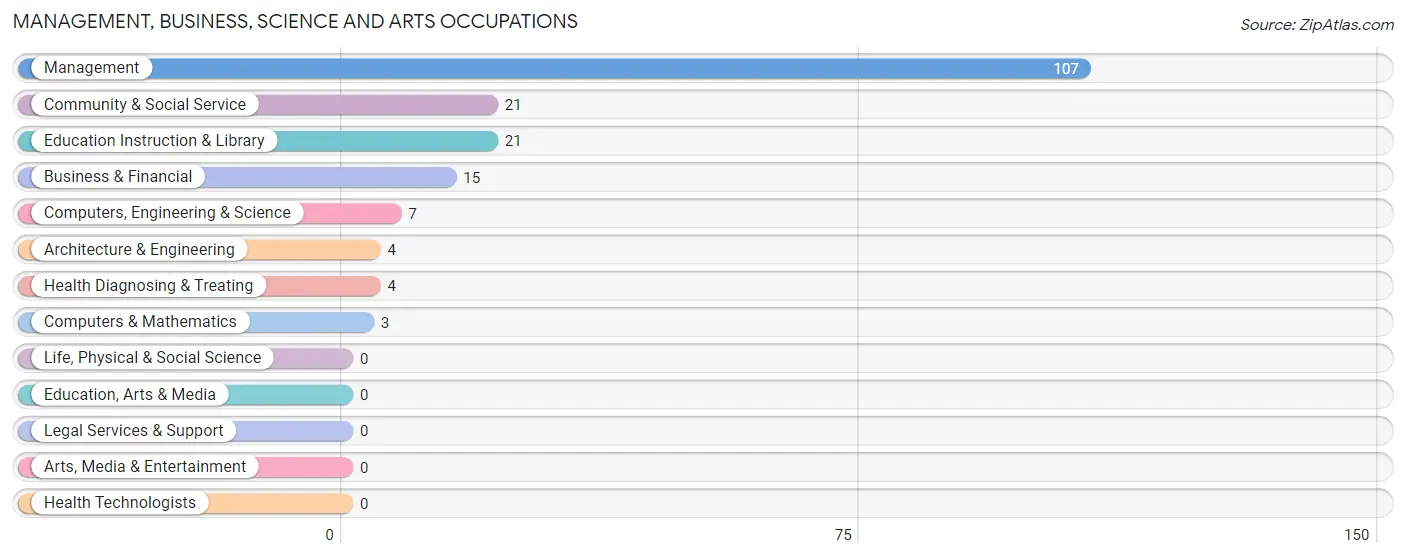
Management, Business, Science and Arts Occupations
The most common Management, Business, Science and Arts occupations in Buffalo are Management (107 | 20.5%), Community & Social Service (21 | 4.0%), Education Instruction & Library (21 | 4.0%), Business & Financial (15 | 2.9%), and Computers, Engineering & Science (7 | 1.3%).
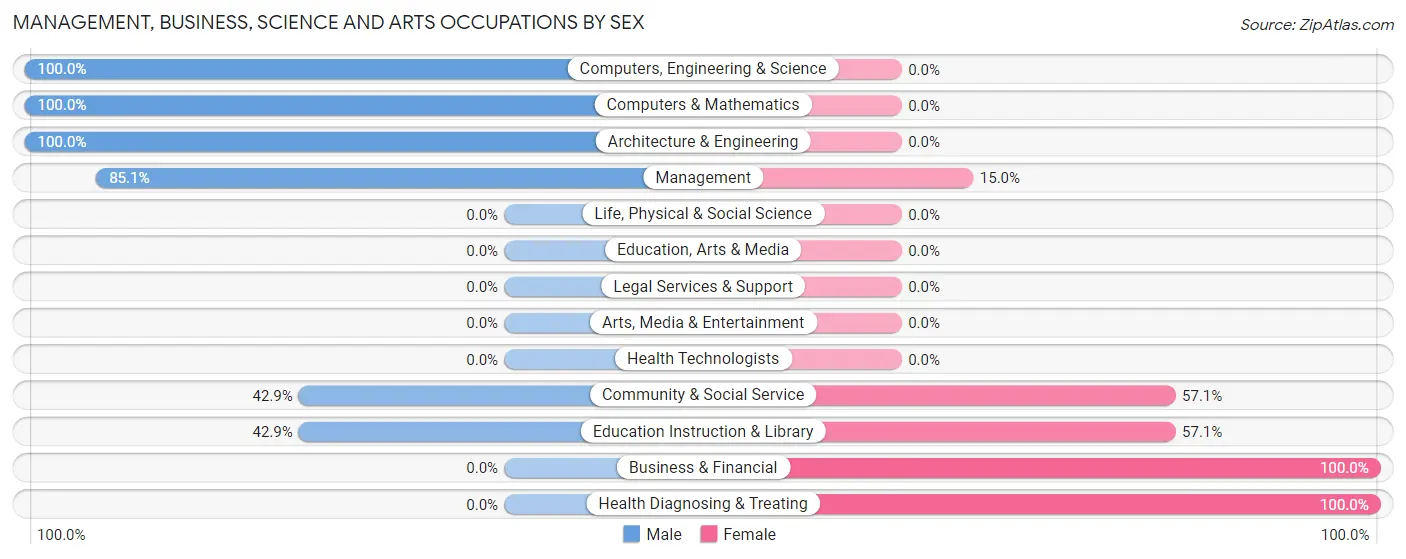
Management, Business, Science and Arts Occupations by Sex
Within the Management, Business, Science and Arts occupations in Buffalo, the most male-oriented occupations are Computers, Engineering & Science (100.0%), Computers & Mathematics (100.0%), and Architecture & Engineering (100.0%), while the most female-oriented occupations are Business & Financial (100.0%), Health Diagnosing & Treating (100.0%), and Community & Social Service (57.1%).
| Occupation | Male | Female |
| Management | 91 (85.1%) | 16 (14.9%) |
| Business & Financial | 0 (0.0%) | 15 (100.0%) |
| Computers, Engineering & Science | 7 (100.0%) | 0 (0.0%) |
| Computers & Mathematics | 3 (100.0%) | 0 (0.0%) |
| Architecture & Engineering | 4 (100.0%) | 0 (0.0%) |
| Life, Physical & Social Science | 0 (0.0%) | 0 (0.0%) |
| Community & Social Service | 9 (42.9%) | 12 (57.1%) |
| Education, Arts & Media | 0 (0.0%) | 0 (0.0%) |
| Legal Services & Support | 0 (0.0%) | 0 (0.0%) |
| Education Instruction & Library | 9 (42.9%) | 12 (57.1%) |
| Arts, Media & Entertainment | 0 (0.0%) | 0 (0.0%) |
| Health Diagnosing & Treating | 0 (0.0%) | 4 (100.0%) |
| Health Technologists | 0 (0.0%) | 0 (0.0%) |
| Total (Category) | 107 (69.5%) | 47 (30.5%) |
| Total (Overall) | 315 (60.3%) | 207 (39.7%) |
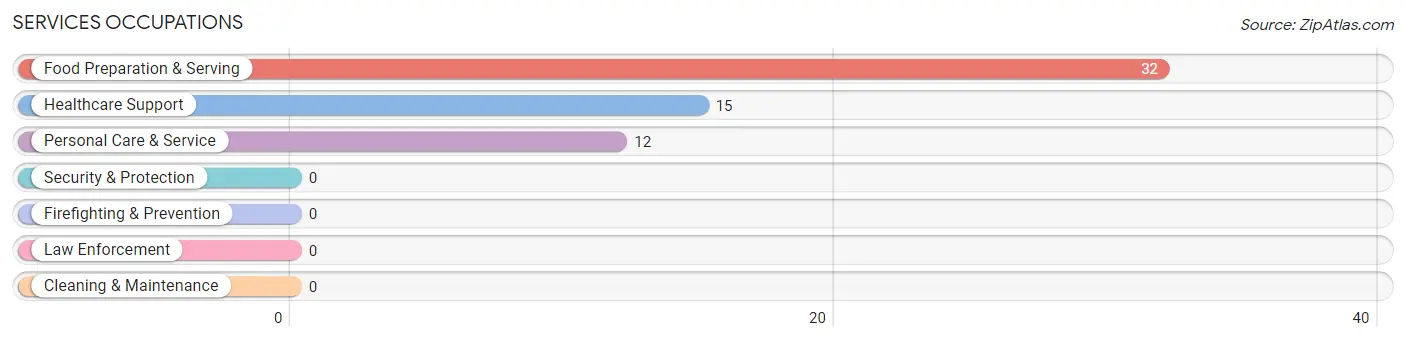
Services Occupations
The most common Services occupations in Buffalo are Food Preparation & Serving (32 | 6.1%), Healthcare Support (15 | 2.9%), and Personal Care & Service (12 | 2.3%).
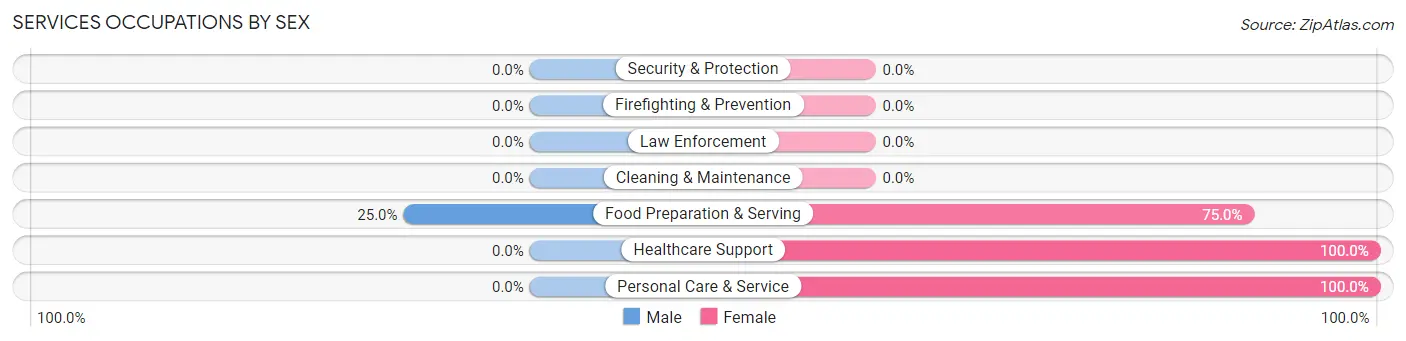
Services Occupations by Sex
| Occupation | Male | Female |
| Healthcare Support | 0 (0.0%) | 15 (100.0%) |
| Security & Protection | 0 (0.0%) | 0 (0.0%) |
| Firefighting & Prevention | 0 (0.0%) | 0 (0.0%) |
| Law Enforcement | 0 (0.0%) | 0 (0.0%) |
| Food Preparation & Serving | 8 (25.0%) | 24 (75.0%) |
| Cleaning & Maintenance | 0 (0.0%) | 0 (0.0%) |
| Personal Care & Service | 0 (0.0%) | 12 (100.0%) |
| Total (Category) | 8 (13.6%) | 51 (86.4%) |
| Total (Overall) | 315 (60.3%) | 207 (39.7%) |
Sales and Office Occupations
The most common Sales and Office occupations in Buffalo are Office & Administration (85 | 16.3%), and Sales & Related (53 | 10.2%).

Sales and Office Occupations by Sex
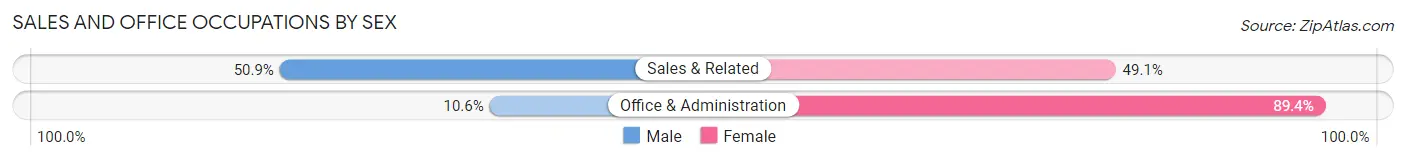
| Occupation | Male | Female |
| Sales & Related | 27 (50.9%) | 26 (49.1%) |
| Office & Administration | 9 (10.6%) | 76 (89.4%) |
| Total (Category) | 36 (26.1%) | 102 (73.9%) |
| Total (Overall) | 315 (60.3%) | 207 (39.7%) |
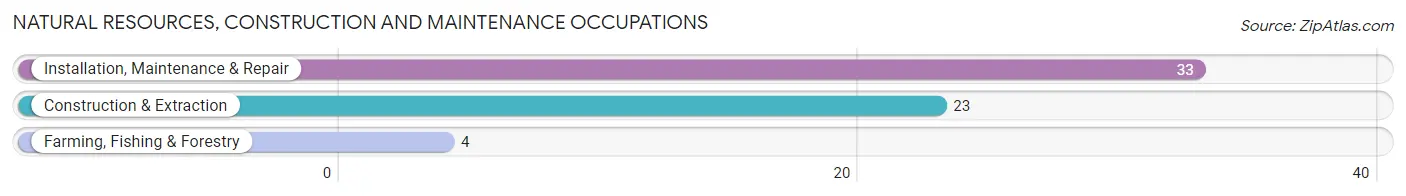
Natural Resources, Construction and Maintenance Occupations
The most common Natural Resources, Construction and Maintenance occupations in Buffalo are Installation, Maintenance & Repair (33 | 6.3%), Construction & Extraction (23 | 4.4%), and Farming, Fishing & Forestry (4 | 0.8%).
Natural Resources, Construction and Maintenance Occupations by Sex
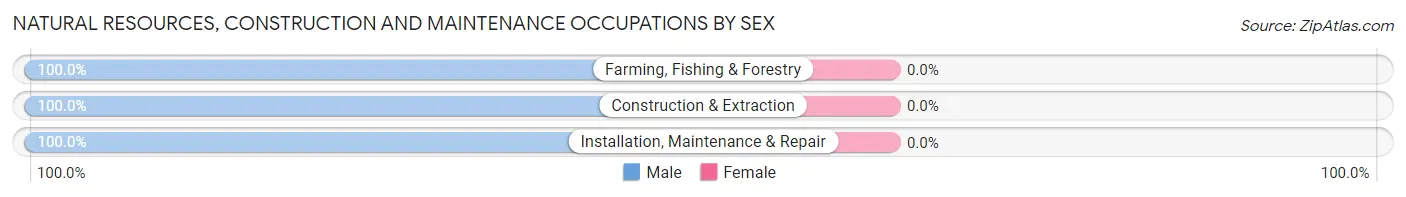
| Occupation | Male | Female |
| Farming, Fishing & Forestry | 4 (100.0%) | 0 (0.0%) |
| Construction & Extraction | 23 (100.0%) | 0 (0.0%) |
| Installation, Maintenance & Repair | 33 (100.0%) | 0 (0.0%) |
| Total (Category) | 60 (100.0%) | 0 (0.0%) |
| Total (Overall) | 315 (60.3%) | 207 (39.7%) |
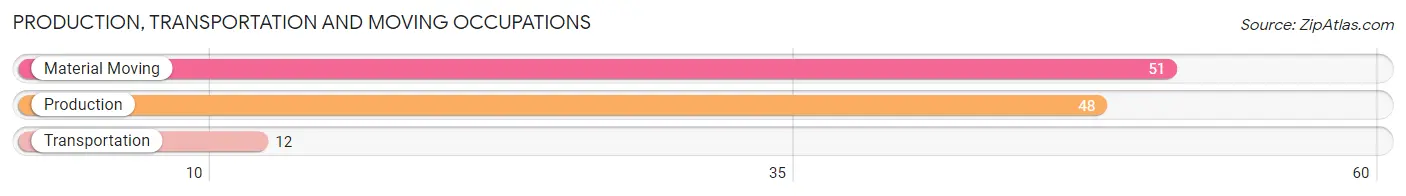
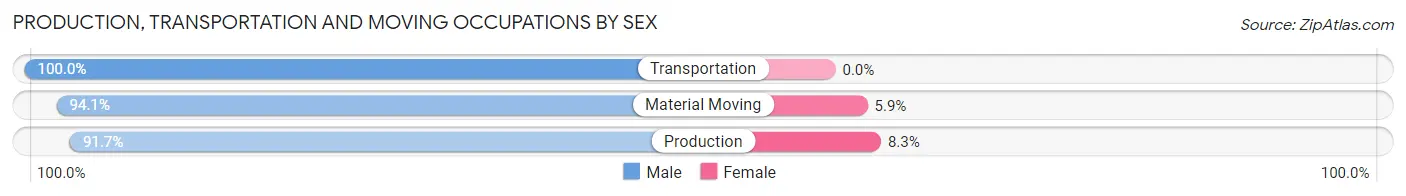
Production, Transportation and Moving Occupations
The most common Production, Transportation and Moving occupations in Buffalo are Material Moving (51 | 9.8%), Production (48 | 9.2%), and Transportation (12 | 2.3%).
Production, Transportation and Moving Occupations by Sex
| Occupation | Male | Female |
| Production | 44 (91.7%) | 4 (8.3%) |
| Transportation | 12 (100.0%) | 0 (0.0%) |
| Material Moving | 48 (94.1%) | 3 (5.9%) |
| Total (Category) | 104 (93.7%) | 7 (6.3%) |
| Total (Overall) | 315 (60.3%) | 207 (39.7%) |
Employment Industries by Sex in Buffalo
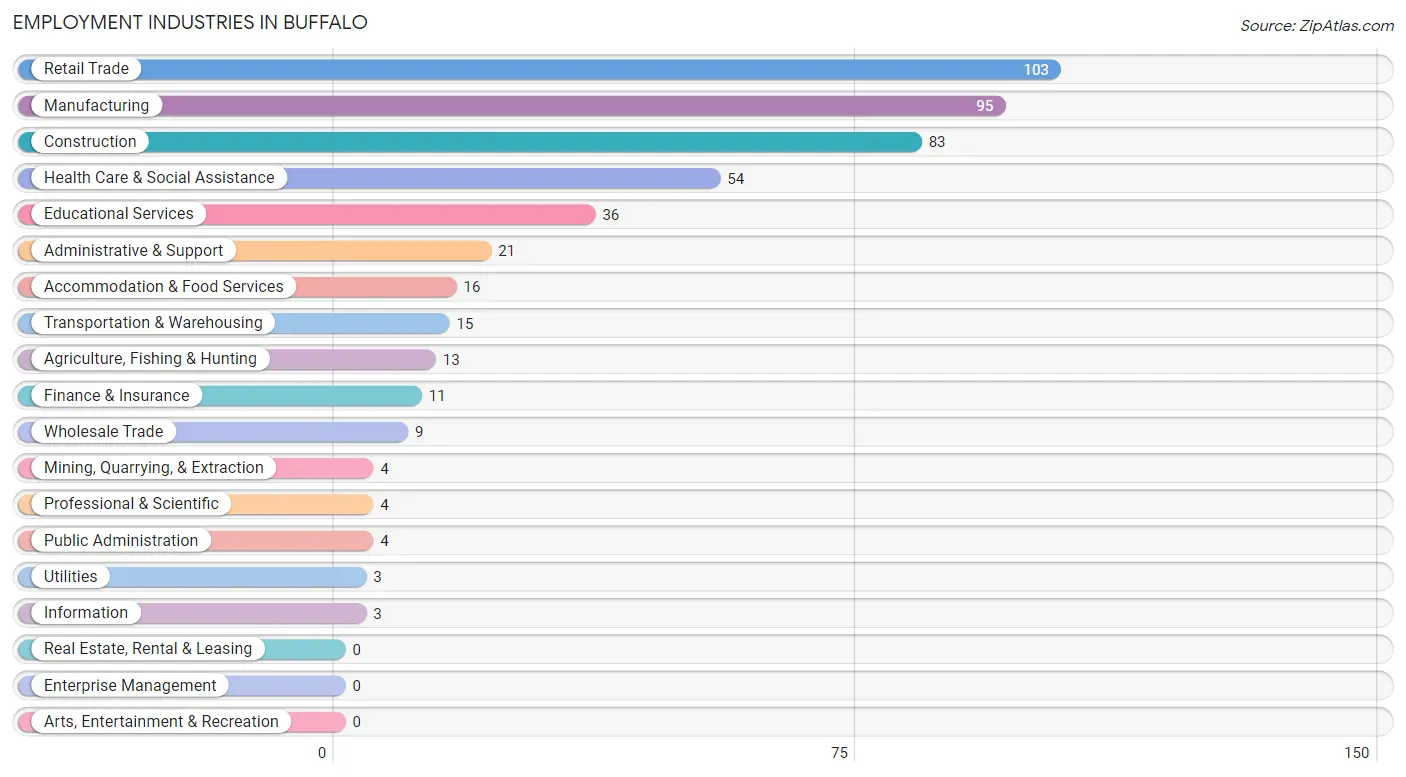
Employment Industries in Buffalo
The major employment industries in Buffalo include Retail Trade (103 | 19.7%), Manufacturing (95 | 18.2%), Construction (83 | 15.9%), Health Care & Social Assistance (54 | 10.3%), and Educational Services (36 | 6.9%).
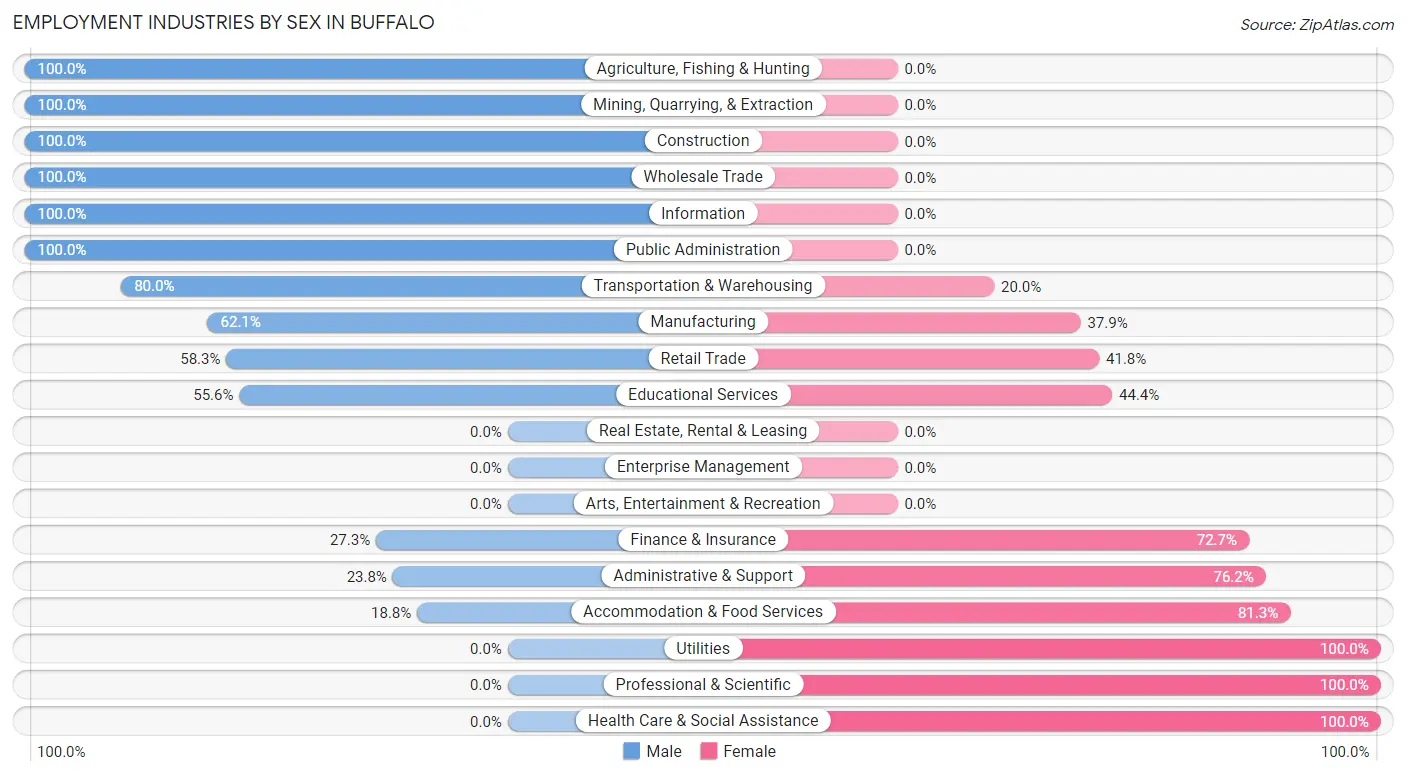
Employment Industries by Sex in Buffalo
The Buffalo industries that see more men than women are Agriculture, Fishing & Hunting (100.0%), Mining, Quarrying, & Extraction (100.0%), and Construction (100.0%), whereas the industries that tend to have a higher number of women are Utilities (100.0%), Professional & Scientific (100.0%), and Health Care & Social Assistance (100.0%).
| Industry | Male | Female |
| Agriculture, Fishing & Hunting | 13 (100.0%) | 0 (0.0%) |
| Mining, Quarrying, & Extraction | 4 (100.0%) | 0 (0.0%) |
| Construction | 83 (100.0%) | 0 (0.0%) |
| Manufacturing | 59 (62.1%) | 36 (37.9%) |
| Wholesale Trade | 9 (100.0%) | 0 (0.0%) |
| Retail Trade | 60 (58.3%) | 43 (41.7%) |
| Transportation & Warehousing | 12 (80.0%) | 3 (20.0%) |
| Utilities | 0 (0.0%) | 3 (100.0%) |
| Information | 3 (100.0%) | 0 (0.0%) |
| Finance & Insurance | 3 (27.3%) | 8 (72.7%) |
| Real Estate, Rental & Leasing | 0 (0.0%) | 0 (0.0%) |
| Professional & Scientific | 0 (0.0%) | 4 (100.0%) |
| Enterprise Management | 0 (0.0%) | 0 (0.0%) |
| Administrative & Support | 5 (23.8%) | 16 (76.2%) |
| Educational Services | 20 (55.6%) | 16 (44.4%) |
| Health Care & Social Assistance | 0 (0.0%) | 54 (100.0%) |
| Arts, Entertainment & Recreation | 0 (0.0%) | 0 (0.0%) |
| Accommodation & Food Services | 3 (18.8%) | 13 (81.2%) |
| Public Administration | 4 (100.0%) | 0 (0.0%) |
| Total | 315 (60.3%) | 207 (39.7%) |
Education in Buffalo
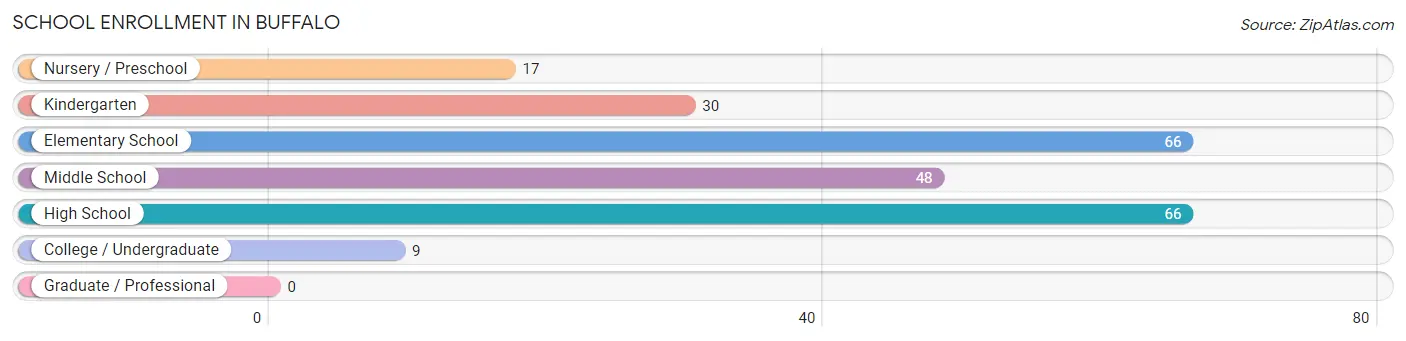
School Enrollment in Buffalo
The most common levels of schooling among the 236 students in Buffalo are elementary school (66 | 28.0%), high school (66 | 28.0%), and middle school (48 | 20.3%).
| School Level | # Students | % Students |
| Nursery / Preschool | 17 | 7.2% |
| Kindergarten | 30 | 12.7% |
| Elementary School | 66 | 28.0% |
| Middle School | 48 | 20.3% |
| High School | 66 | 28.0% |
| College / Undergraduate | 9 | 3.8% |
| Graduate / Professional | 0 | 0.0% |
| Total | 236 | 100.0% |
School Enrollment by Age by Funding Source in Buffalo
Out of a total of 236 students who are enrolled in schools in Buffalo, 16 (6.8%) attend a private institution, while the remaining 220 (93.2%) are enrolled in public schools. The age group of 20 to 24 year olds has the highest likelihood of being enrolled in private schools, with 5 (100.0% in the age bracket) enrolled. Conversely, the age group of 15 to 17 year olds has the lowest likelihood of being enrolled in a private school, with 66 (100.0% in the age bracket) attending a public institution.
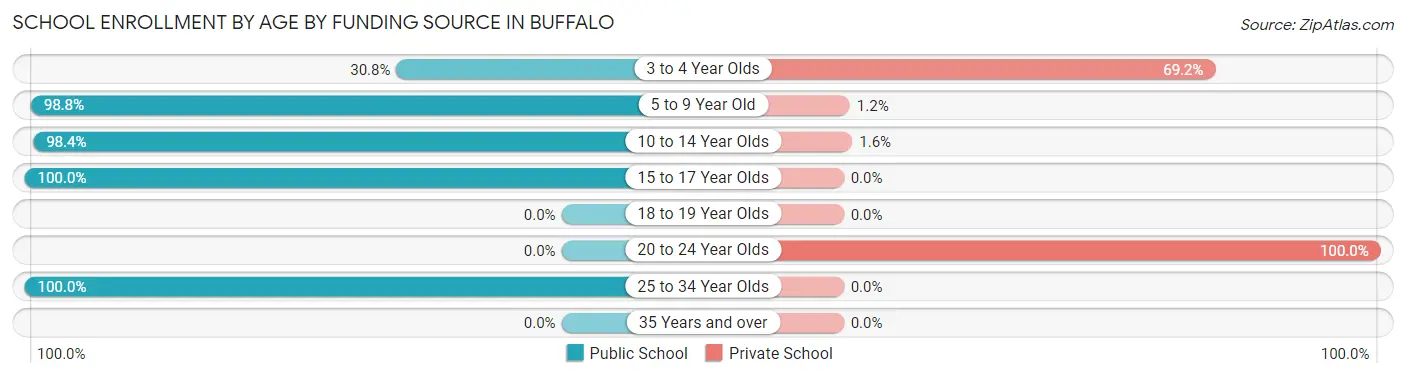
| Age Bracket | Public School | Private School |
| 3 to 4 Year Olds | 4 (30.8%) | 9 (69.2%) |
| 5 to 9 Year Old | 85 (98.8%) | 1 (1.2%) |
| 10 to 14 Year Olds | 61 (98.4%) | 1 (1.6%) |
| 15 to 17 Year Olds | 66 (100.0%) | 0 (0.0%) |
| 18 to 19 Year Olds | 0 (0.0%) | 0 (0.0%) |
| 20 to 24 Year Olds | 0 (0.0%) | 5 (100.0%) |
| 25 to 34 Year Olds | 4 (100.0%) | 0 (0.0%) |
| 35 Years and over | 0 (0.0%) | 0 (0.0%) |
| Total | 220 (93.2%) | 16 (6.8%) |
Educational Attainment by Field of Study in Buffalo
Science & technology (21 | 26.9%), business (21 | 26.9%), education (11 | 14.1%), visual & performing arts (11 | 14.1%), and bio, nature & agricultural (6 | 7.7%) are the most common fields of study among 78 individuals in Buffalo who have obtained a bachelor's degree or higher.
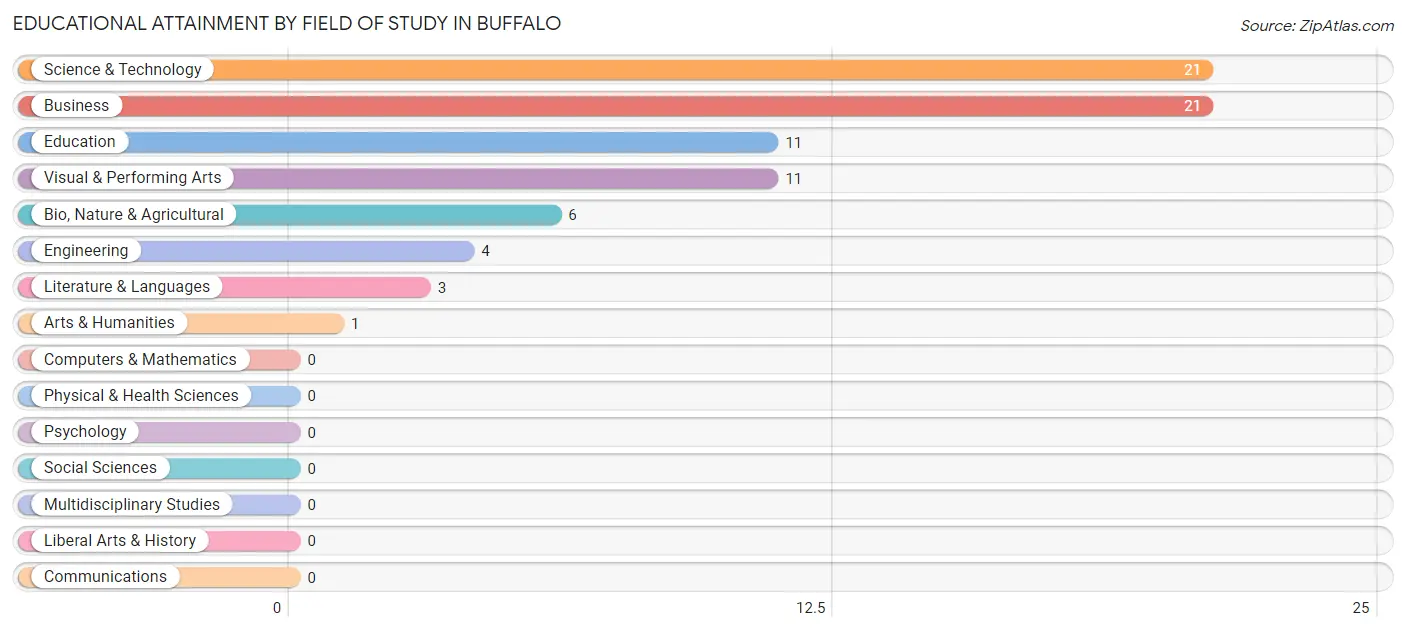
| Field of Study | # Graduates | % Graduates |
| Computers & Mathematics | 0 | 0.0% |
| Bio, Nature & Agricultural | 6 | 7.7% |
| Physical & Health Sciences | 0 | 0.0% |
| Psychology | 0 | 0.0% |
| Social Sciences | 0 | 0.0% |
| Engineering | 4 | 5.1% |
| Multidisciplinary Studies | 0 | 0.0% |
| Science & Technology | 21 | 26.9% |
| Business | 21 | 26.9% |
| Education | 11 | 14.1% |
| Literature & Languages | 3 | 3.8% |
| Liberal Arts & History | 0 | 0.0% |
| Visual & Performing Arts | 11 | 14.1% |
| Communications | 0 | 0.0% |
| Arts & Humanities | 1 | 1.3% |
| Total | 78 | 100.0% |
Transportation & Commute in Buffalo
Vehicle Availability by Sex in Buffalo
The most prevalent vehicle ownership categories in Buffalo are males with 2 vehicles (139, accounting for 45.3%) and females with 2 vehicles (55, making up 67.1%).
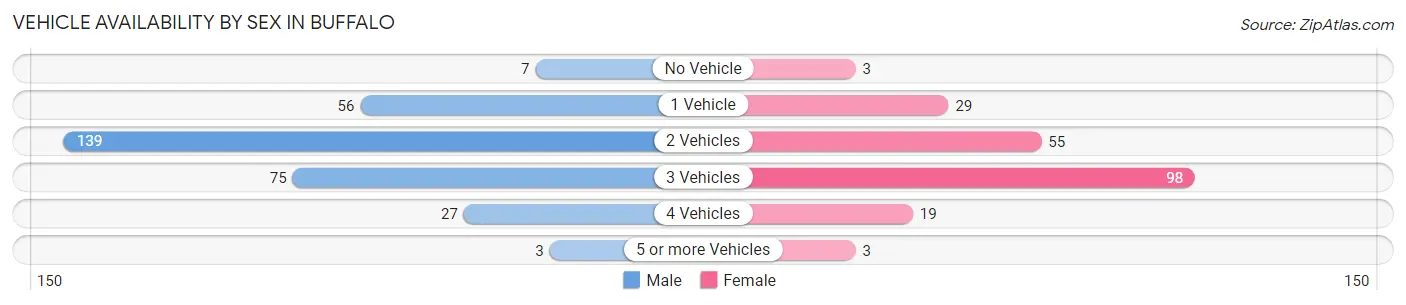
| Vehicles Available | Male | Female |
| No Vehicle | 7 (2.3%) | 3 (1.5%) |
| 1 Vehicle | 56 (18.2%) | 29 (14.0%) |
| 2 Vehicles | 139 (45.3%) | 55 (26.6%) |
| 3 Vehicles | 75 (24.4%) | 98 (47.3%) |
| 4 Vehicles | 27 (8.8%) | 19 (9.2%) |
| 5 or more Vehicles | 3 (1.0%) | 3 (1.5%) |
| Total | 307 (100.0%) | 207 (100.0%) |
Commute Time in Buffalo
The most frequently occuring commute durations in Buffalo are 25 to 29 minutes (121 commuters, 25.3%), 20 to 24 minutes (78 commuters, 16.3%), and 10 to 14 minutes (70 commuters, 14.6%).
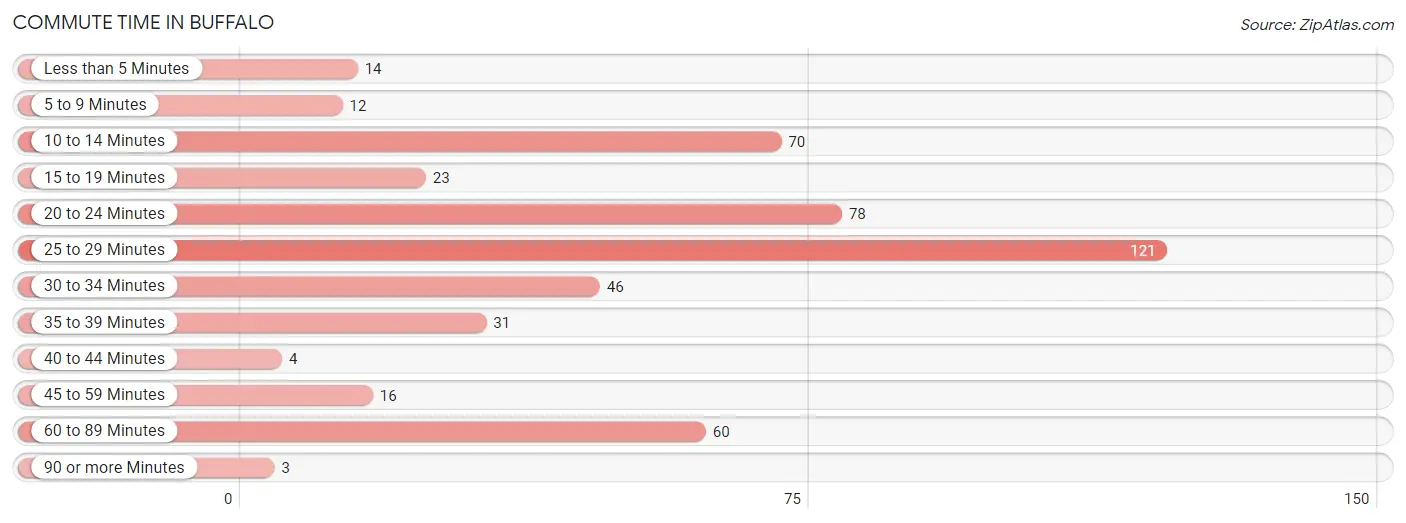
| Commute Time | # Commuters | % Commuters |
| Less than 5 Minutes | 14 | 2.9% |
| 5 to 9 Minutes | 12 | 2.5% |
| 10 to 14 Minutes | 70 | 14.6% |
| 15 to 19 Minutes | 23 | 4.8% |
| 20 to 24 Minutes | 78 | 16.3% |
| 25 to 29 Minutes | 121 | 25.3% |
| 30 to 34 Minutes | 46 | 9.6% |
| 35 to 39 Minutes | 31 | 6.5% |
| 40 to 44 Minutes | 4 | 0.8% |
| 45 to 59 Minutes | 16 | 3.4% |
| 60 to 89 Minutes | 60 | 12.6% |
| 90 or more Minutes | 3 | 0.6% |
Commute Time by Sex in Buffalo
The most common commute times in Buffalo are 25 to 29 minutes (70 commuters, 24.0%) for males and 25 to 29 minutes (51 commuters, 27.3%) for females.
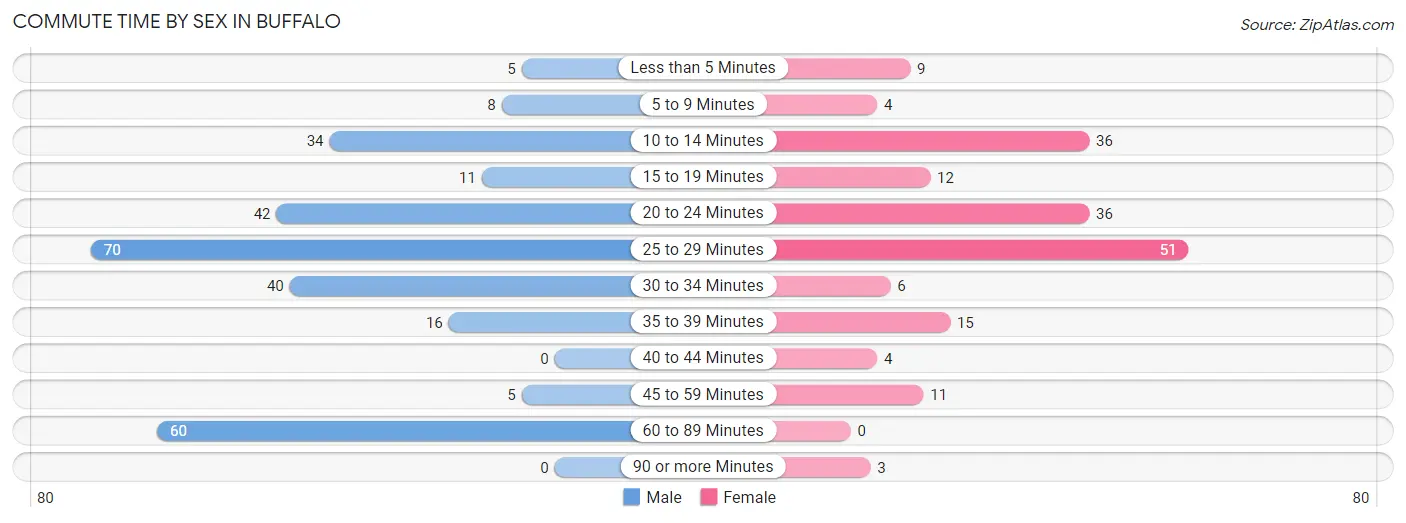
| Commute Time | Male | Female |
| Less than 5 Minutes | 5 (1.7%) | 9 (4.8%) |
| 5 to 9 Minutes | 8 (2.8%) | 4 (2.1%) |
| 10 to 14 Minutes | 34 (11.7%) | 36 (19.3%) |
| 15 to 19 Minutes | 11 (3.8%) | 12 (6.4%) |
| 20 to 24 Minutes | 42 (14.4%) | 36 (19.3%) |
| 25 to 29 Minutes | 70 (24.0%) | 51 (27.3%) |
| 30 to 34 Minutes | 40 (13.8%) | 6 (3.2%) |
| 35 to 39 Minutes | 16 (5.5%) | 15 (8.0%) |
| 40 to 44 Minutes | 0 (0.0%) | 4 (2.1%) |
| 45 to 59 Minutes | 5 (1.7%) | 11 (5.9%) |
| 60 to 89 Minutes | 60 (20.6%) | 0 (0.0%) |
| 90 or more Minutes | 0 (0.0%) | 3 (1.6%) |
Time of Departure to Work by Sex in Buffalo
The most frequent times of departure to work in Buffalo are 12:00 AM to 4:59 AM (65, 22.3%) for males and 7:30 AM to 7:59 AM (45, 24.1%) for females.
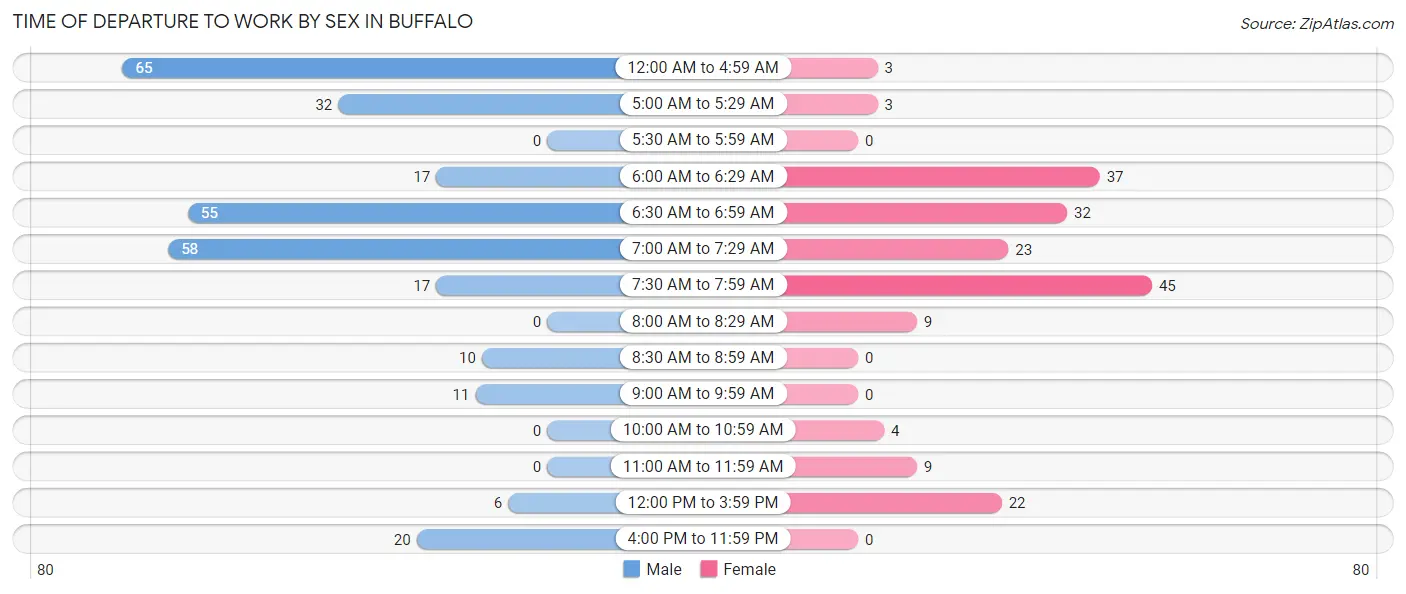
| Time of Departure | Male | Female |
| 12:00 AM to 4:59 AM | 65 (22.3%) | 3 (1.6%) |
| 5:00 AM to 5:29 AM | 32 (11.0%) | 3 (1.6%) |
| 5:30 AM to 5:59 AM | 0 (0.0%) | 0 (0.0%) |
| 6:00 AM to 6:29 AM | 17 (5.8%) | 37 (19.8%) |
| 6:30 AM to 6:59 AM | 55 (18.9%) | 32 (17.1%) |
| 7:00 AM to 7:29 AM | 58 (19.9%) | 23 (12.3%) |
| 7:30 AM to 7:59 AM | 17 (5.8%) | 45 (24.1%) |
| 8:00 AM to 8:29 AM | 0 (0.0%) | 9 (4.8%) |
| 8:30 AM to 8:59 AM | 10 (3.4%) | 0 (0.0%) |
| 9:00 AM to 9:59 AM | 11 (3.8%) | 0 (0.0%) |
| 10:00 AM to 10:59 AM | 0 (0.0%) | 4 (2.1%) |
| 11:00 AM to 11:59 AM | 0 (0.0%) | 9 (4.8%) |
| 12:00 PM to 3:59 PM | 6 (2.1%) | 22 (11.8%) |
| 4:00 PM to 11:59 PM | 20 (6.9%) | 0 (0.0%) |
| Total | 291 (100.0%) | 187 (100.0%) |
Housing Occupancy in Buffalo
Occupancy by Ownership in Buffalo
Of the total 442 dwellings in Buffalo, owner-occupied units account for 341 (77.1%), while renter-occupied units make up 101 (22.9%).
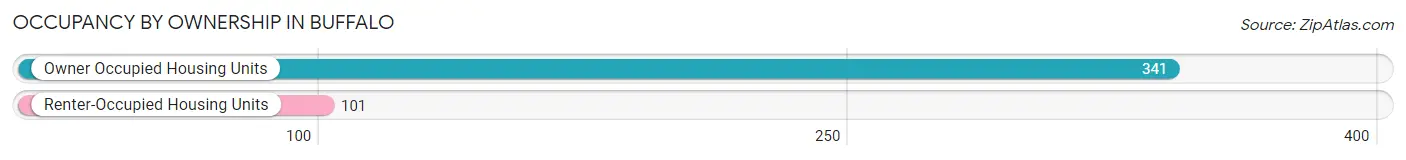
| Occupancy | # Housing Units | % Housing Units |
| Owner Occupied Housing Units | 341 | 77.1% |
| Renter-Occupied Housing Units | 101 | 22.9% |
| Total Occupied Housing Units | 442 | 100.0% |
Occupancy by Household Size in Buffalo
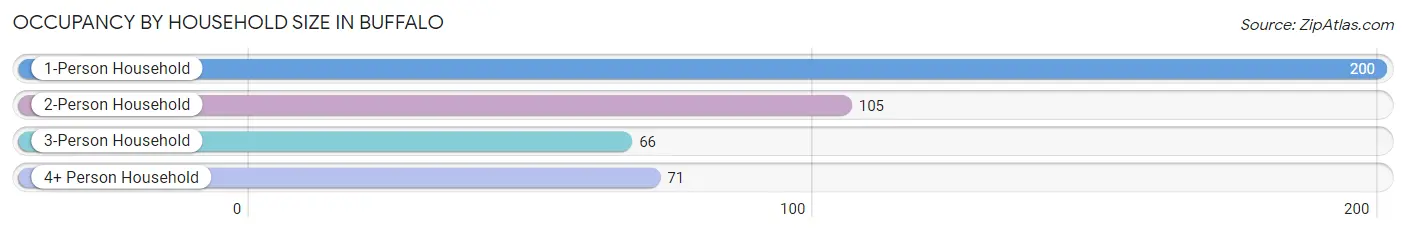
| Household Size | # Housing Units | % Housing Units |
| 1-Person Household | 200 | 45.3% |
| 2-Person Household | 105 | 23.8% |
| 3-Person Household | 66 | 14.9% |
| 4+ Person Household | 71 | 16.1% |
| Total Housing Units | 442 | 100.0% |
Occupancy by Ownership by Household Size in Buffalo
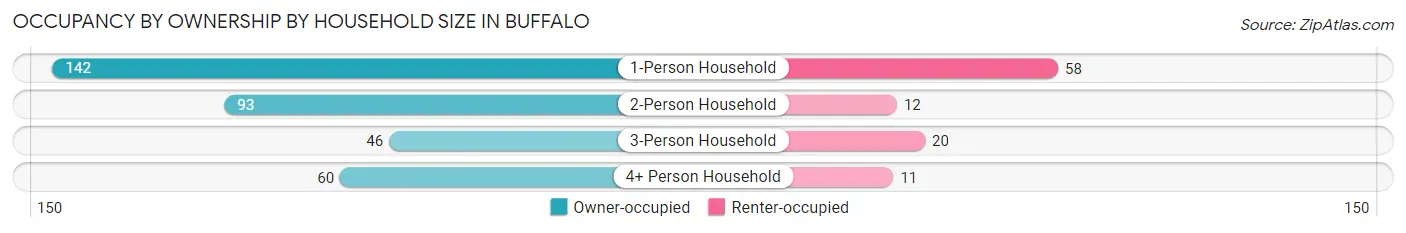
| Household Size | Owner-occupied | Renter-occupied |
| 1-Person Household | 142 (71.0%) | 58 (29.0%) |
| 2-Person Household | 93 (88.6%) | 12 (11.4%) |
| 3-Person Household | 46 (69.7%) | 20 (30.3%) |
| 4+ Person Household | 60 (84.5%) | 11 (15.5%) |
| Total Housing Units | 341 (77.1%) | 101 (22.9%) |
Occupancy by Educational Attainment in Buffalo
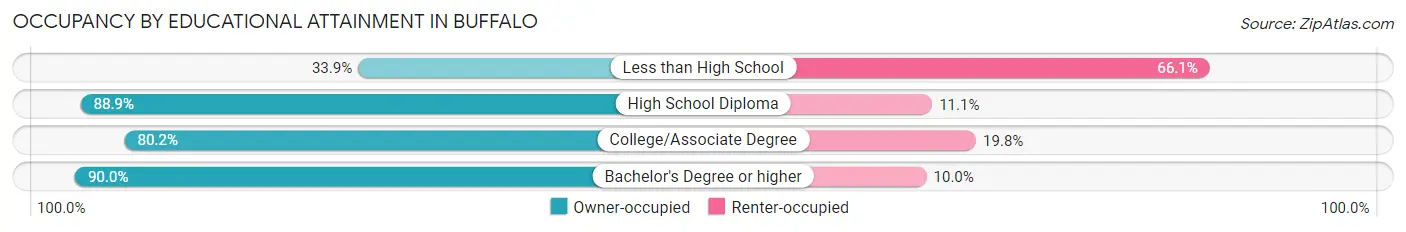
| Household Size | Owner-occupied | Renter-occupied |
| Less than High School | 20 (33.9%) | 39 (66.1%) |
| High School Diploma | 112 (88.9%) | 14 (11.1%) |
| College/Associate Degree | 182 (80.2%) | 45 (19.8%) |
| Bachelor's Degree or higher | 27 (90.0%) | 3 (10.0%) |
Occupancy by Age of Householder in Buffalo
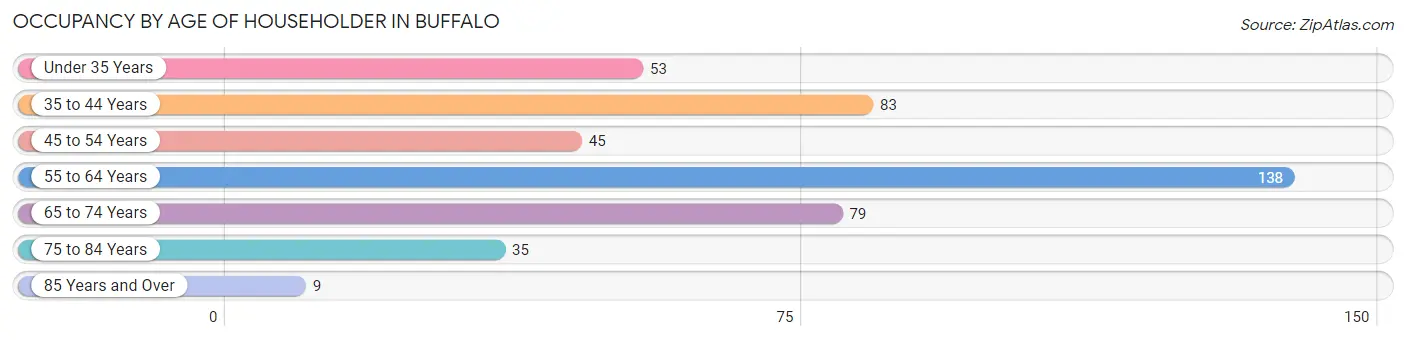
| Age Bracket | # Households | % Households |
| Under 35 Years | 53 | 12.0% |
| 35 to 44 Years | 83 | 18.8% |
| 45 to 54 Years | 45 | 10.2% |
| 55 to 64 Years | 138 | 31.2% |
| 65 to 74 Years | 79 | 17.9% |
| 75 to 84 Years | 35 | 7.9% |
| 85 Years and Over | 9 | 2.0% |
| Total | 442 | 100.0% |
Housing Finances in Buffalo
Median Income by Occupancy in Buffalo
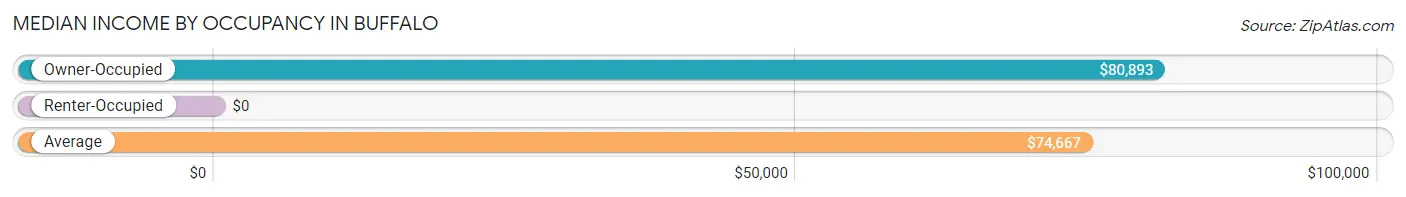
| Occupancy Type | # Households | Median Income |
| Owner-Occupied | 341 (77.1%) | $80,893 |
| Renter-Occupied | 101 (22.9%) | $0 |
| Average | 442 (100.0%) | $74,667 |
Occupancy by Householder Income Bracket in Buffalo
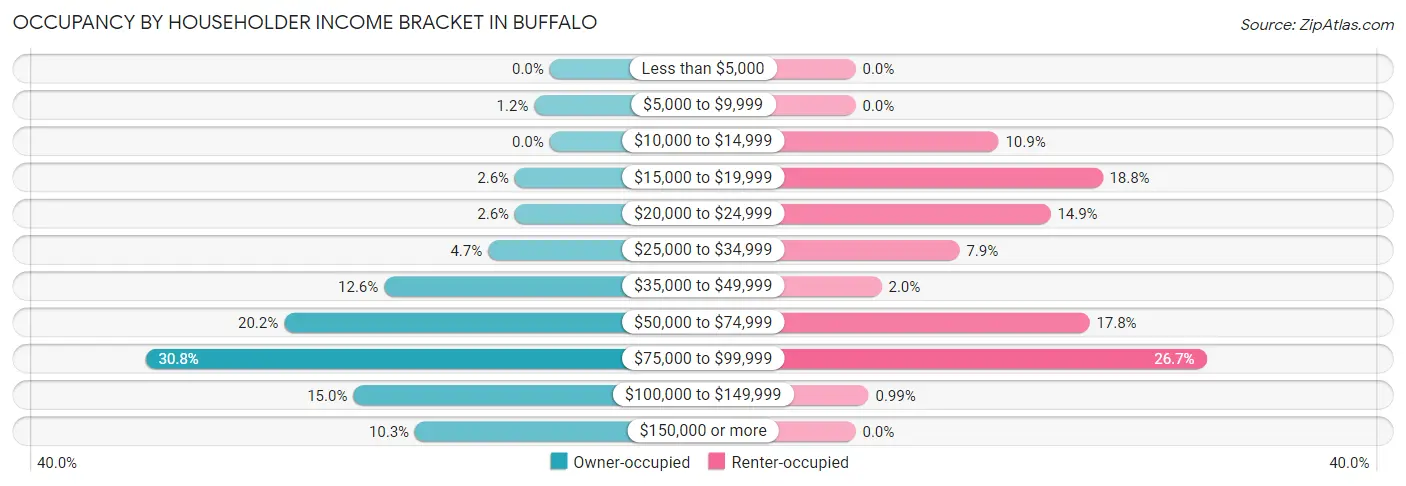
| Income Bracket | Owner-occupied | Renter-occupied |
| Less than $5,000 | 0 (0.0%) | 0 (0.0%) |
| $5,000 to $9,999 | 4 (1.2%) | 0 (0.0%) |
| $10,000 to $14,999 | 0 (0.0%) | 11 (10.9%) |
| $15,000 to $19,999 | 9 (2.6%) | 19 (18.8%) |
| $20,000 to $24,999 | 9 (2.6%) | 15 (14.8%) |
| $25,000 to $34,999 | 16 (4.7%) | 8 (7.9%) |
| $35,000 to $49,999 | 43 (12.6%) | 2 (2.0%) |
| $50,000 to $74,999 | 69 (20.2%) | 18 (17.8%) |
| $75,000 to $99,999 | 105 (30.8%) | 27 (26.7%) |
| $100,000 to $149,999 | 51 (15.0%) | 1 (1.0%) |
| $150,000 or more | 35 (10.3%) | 0 (0.0%) |
| Total | 341 (100.0%) | 101 (100.0%) |
Monthly Housing Cost Tiers in Buffalo
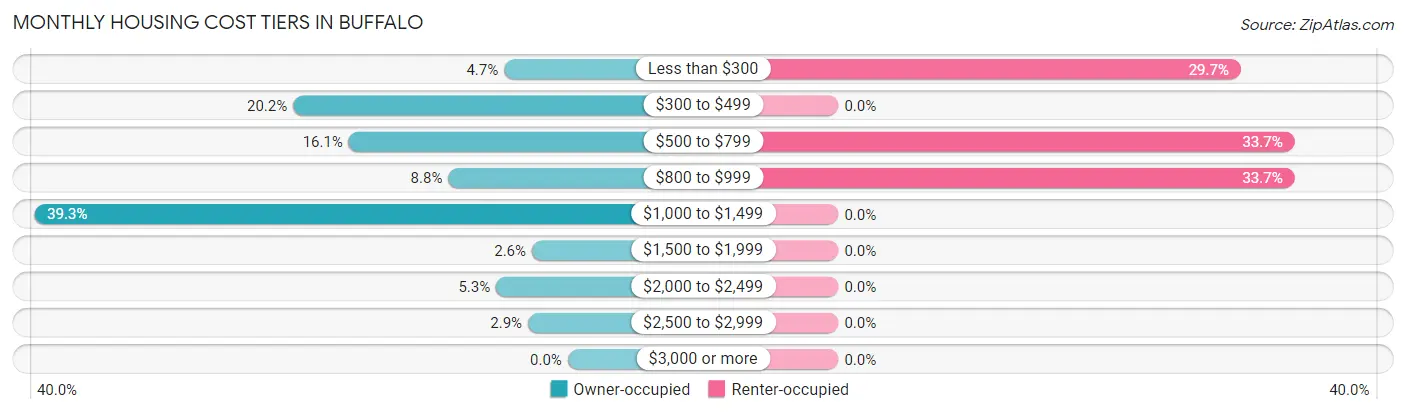
| Monthly Cost | Owner-occupied | Renter-occupied |
| Less than $300 | 16 (4.7%) | 30 (29.7%) |
| $300 to $499 | 69 (20.2%) | 0 (0.0%) |
| $500 to $799 | 55 (16.1%) | 34 (33.7%) |
| $800 to $999 | 30 (8.8%) | 34 (33.7%) |
| $1,000 to $1,499 | 134 (39.3%) | 0 (0.0%) |
| $1,500 to $1,999 | 9 (2.6%) | 0 (0.0%) |
| $2,000 to $2,499 | 18 (5.3%) | 0 (0.0%) |
| $2,500 to $2,999 | 10 (2.9%) | 0 (0.0%) |
| $3,000 or more | 0 (0.0%) | 0 (0.0%) |
| Total | 341 (100.0%) | 101 (100.0%) |
Physical Housing Characteristics in Buffalo
Housing Structures in Buffalo
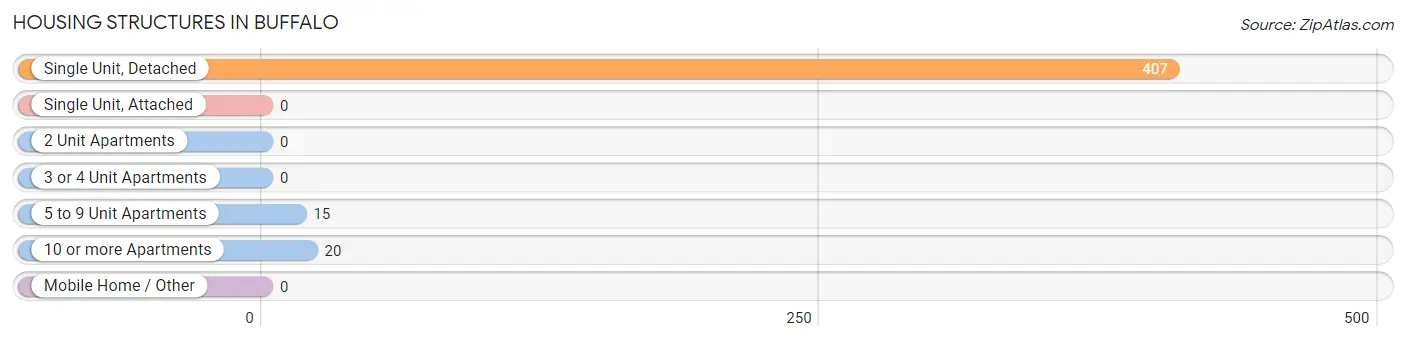
| Structure Type | # Housing Units | % Housing Units |
| Single Unit, Detached | 407 | 92.1% |
| Single Unit, Attached | 0 | 0.0% |
| 2 Unit Apartments | 0 | 0.0% |
| 3 or 4 Unit Apartments | 0 | 0.0% |
| 5 to 9 Unit Apartments | 15 | 3.4% |
| 10 or more Apartments | 20 | 4.5% |
| Mobile Home / Other | 0 | 0.0% |
| Total | 442 | 100.0% |
Housing Structures by Occupancy in Buffalo
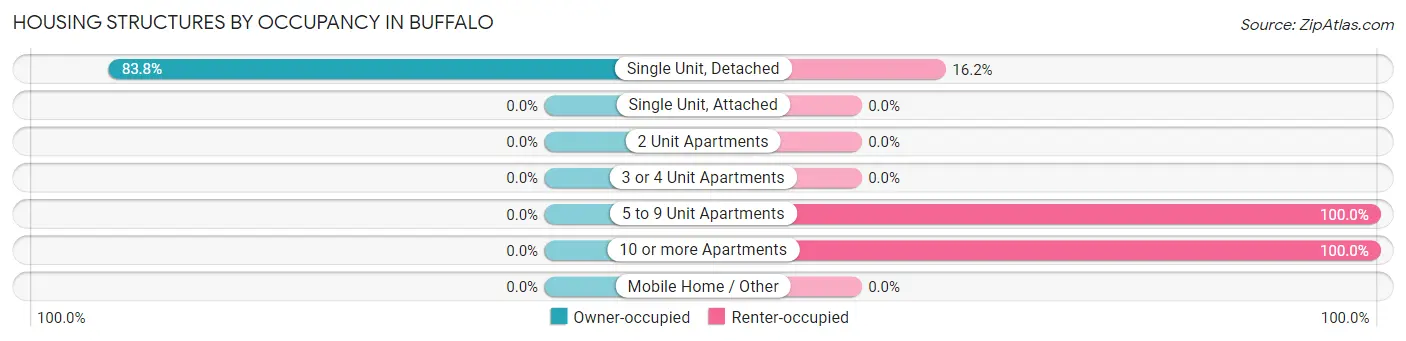
| Structure Type | Owner-occupied | Renter-occupied |
| Single Unit, Detached | 341 (83.8%) | 66 (16.2%) |
| Single Unit, Attached | 0 (0.0%) | 0 (0.0%) |
| 2 Unit Apartments | 0 (0.0%) | 0 (0.0%) |
| 3 or 4 Unit Apartments | 0 (0.0%) | 0 (0.0%) |
| 5 to 9 Unit Apartments | 0 (0.0%) | 15 (100.0%) |
| 10 or more Apartments | 0 (0.0%) | 20 (100.0%) |
| Mobile Home / Other | 0 (0.0%) | 0 (0.0%) |
| Total | 341 (77.1%) | 101 (22.9%) |
Housing Structures by Number of Rooms in Buffalo
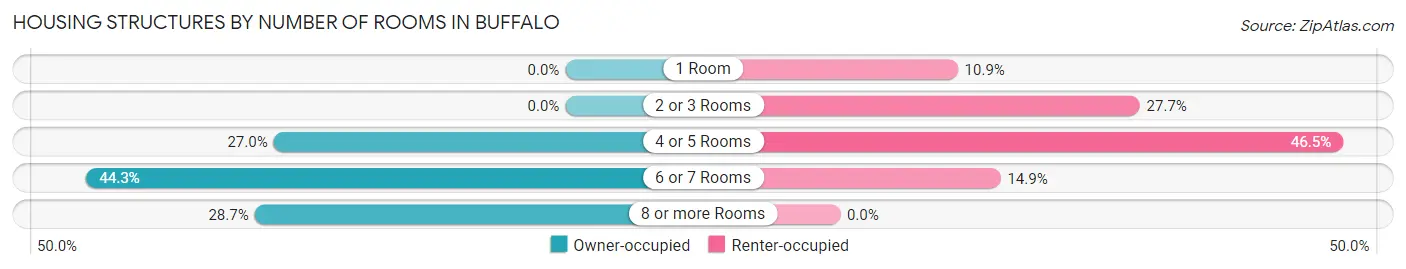
| Number of Rooms | Owner-occupied | Renter-occupied |
| 1 Room | 0 (0.0%) | 11 (10.9%) |
| 2 or 3 Rooms | 0 (0.0%) | 28 (27.7%) |
| 4 or 5 Rooms | 92 (27.0%) | 47 (46.5%) |
| 6 or 7 Rooms | 151 (44.3%) | 15 (14.8%) |
| 8 or more Rooms | 98 (28.7%) | 0 (0.0%) |
| Total | 341 (100.0%) | 101 (100.0%) |
Housing Structure by Heating Type in Buffalo
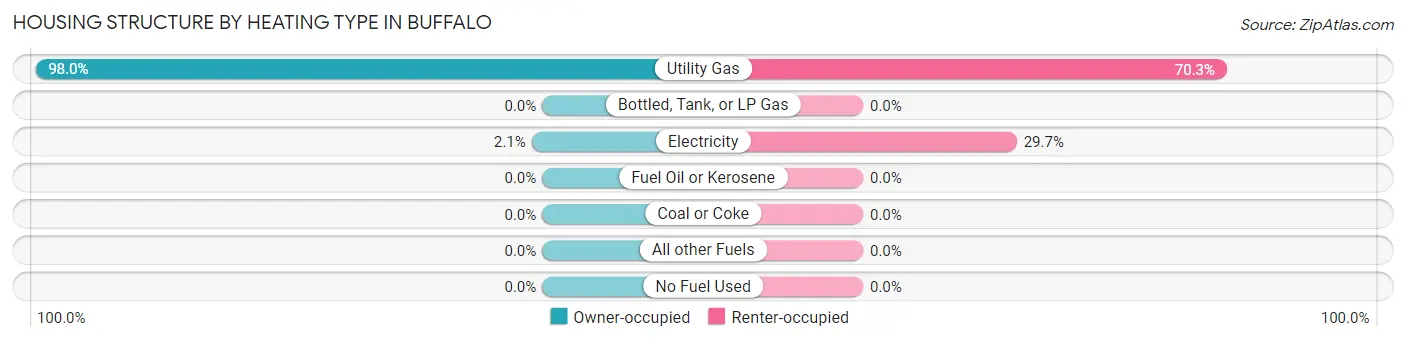
| Heating Type | Owner-occupied | Renter-occupied |
| Utility Gas | 334 (98.0%) | 71 (70.3%) |
| Bottled, Tank, or LP Gas | 0 (0.0%) | 0 (0.0%) |
| Electricity | 7 (2.1%) | 30 (29.7%) |
| Fuel Oil or Kerosene | 0 (0.0%) | 0 (0.0%) |
| Coal or Coke | 0 (0.0%) | 0 (0.0%) |
| All other Fuels | 0 (0.0%) | 0 (0.0%) |
| No Fuel Used | 0 (0.0%) | 0 (0.0%) |
| Total | 341 (100.0%) | 101 (100.0%) |
Household Vehicle Usage in Buffalo
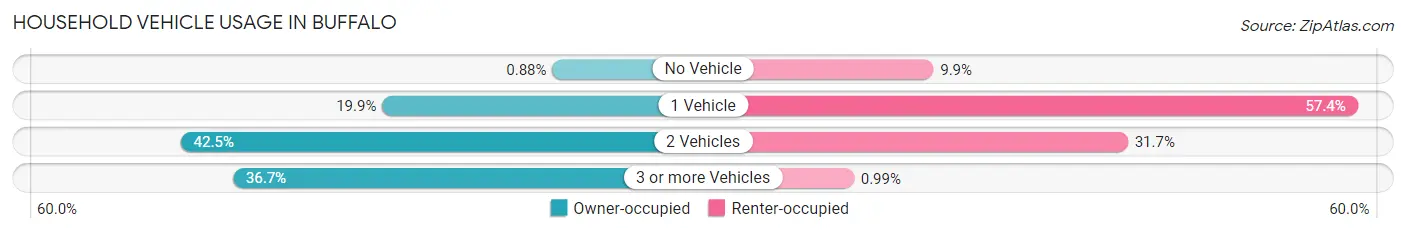
| Vehicles per Household | Owner-occupied | Renter-occupied |
| No Vehicle | 3 (0.9%) | 10 (9.9%) |
| 1 Vehicle | 68 (19.9%) | 58 (57.4%) |
| 2 Vehicles | 145 (42.5%) | 32 (31.7%) |
| 3 or more Vehicles | 125 (36.7%) | 1 (1.0%) |
| Total | 341 (100.0%) | 101 (100.0%) |
Real Estate & Mortgages in Buffalo
Real Estate and Mortgage Overview in Buffalo
| Characteristic | Without Mortgage | With Mortgage |
| Housing Units | 114 | 227 |
| Median Property Value | $122,500 | $132,700 |
| Median Household Income | $57,308 | $22 |
| Monthly Housing Costs | $432 | $0 |
| Real Estate Taxes | $1,700 | $0 |
Property Value by Mortgage Status in Buffalo
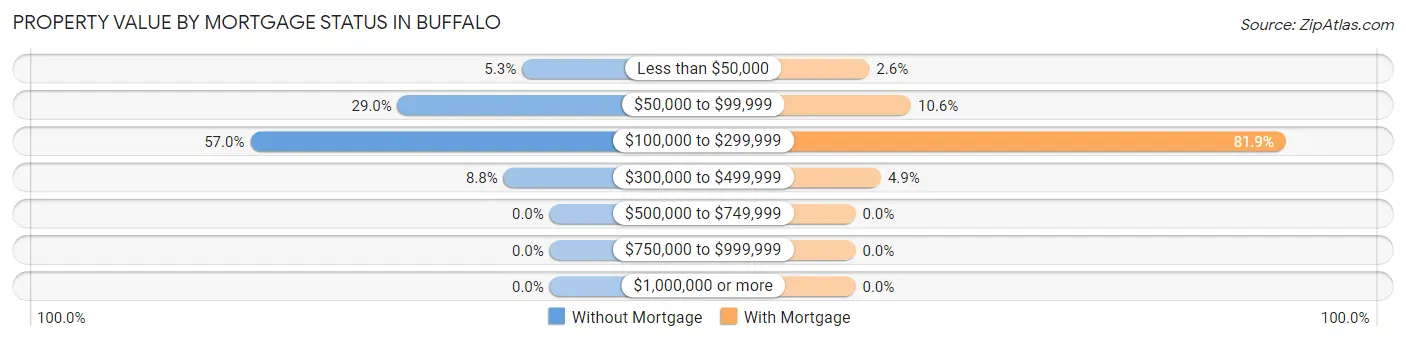
| Property Value | Without Mortgage | With Mortgage |
| Less than $50,000 | 6 (5.3%) | 6 (2.6%) |
| $50,000 to $99,999 | 33 (28.9%) | 24 (10.6%) |
| $100,000 to $299,999 | 65 (57.0%) | 186 (81.9%) |
| $300,000 to $499,999 | 10 (8.8%) | 11 (4.9%) |
| $500,000 to $749,999 | 0 (0.0%) | 0 (0.0%) |
| $750,000 to $999,999 | 0 (0.0%) | 0 (0.0%) |
| $1,000,000 or more | 0 (0.0%) | 0 (0.0%) |
| Total | 114 (100.0%) | 227 (100.0%) |
Household Income by Mortgage Status in Buffalo
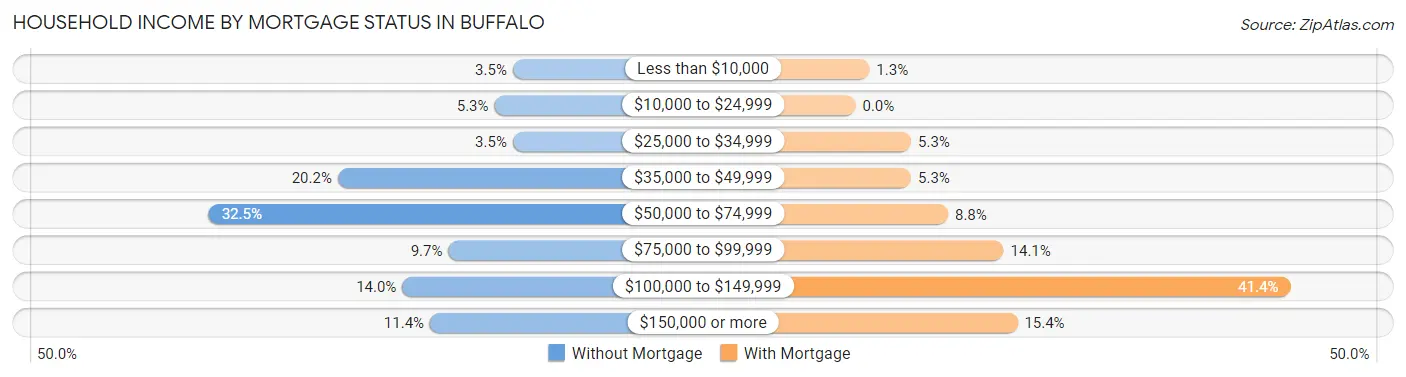
| Household Income | Without Mortgage | With Mortgage |
| Less than $10,000 | 4 (3.5%) | 3 (1.3%) |
| $10,000 to $24,999 | 6 (5.3%) | 0 (0.0%) |
| $25,000 to $34,999 | 4 (3.5%) | 12 (5.3%) |
| $35,000 to $49,999 | 23 (20.2%) | 12 (5.3%) |
| $50,000 to $74,999 | 37 (32.5%) | 20 (8.8%) |
| $75,000 to $99,999 | 11 (9.7%) | 32 (14.1%) |
| $100,000 to $149,999 | 16 (14.0%) | 94 (41.4%) |
| $150,000 or more | 13 (11.4%) | 35 (15.4%) |
| Total | 114 (100.0%) | 227 (100.0%) |
Property Value to Household Income Ratio in Buffalo
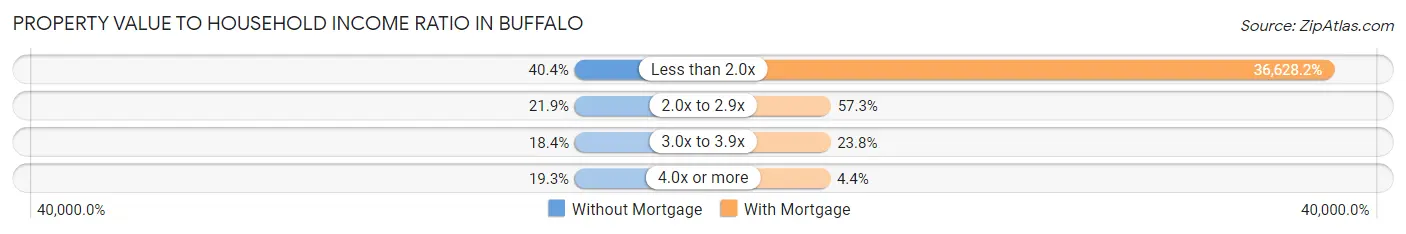
| Value-to-Income Ratio | Without Mortgage | With Mortgage |
| Less than 2.0x | 46 (40.4%) | 83,146 (36,628.2%) |
| 2.0x to 2.9x | 25 (21.9%) | 130 (57.3%) |
| 3.0x to 3.9x | 21 (18.4%) | 54 (23.8%) |
| 4.0x or more | 22 (19.3%) | 10 (4.4%) |
| Total | 114 (100.0%) | 227 (100.0%) |
Real Estate Taxes by Mortgage Status in Buffalo
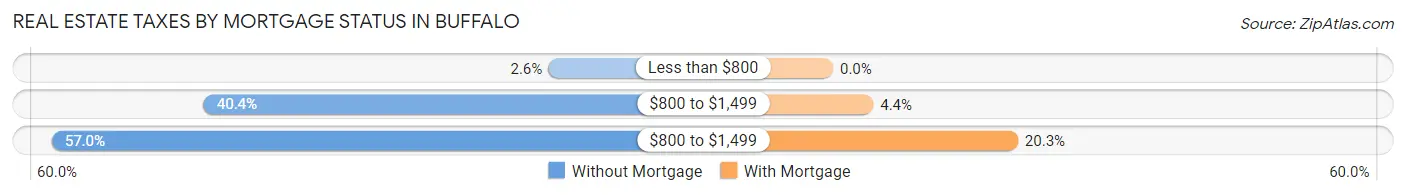
| Property Taxes | Without Mortgage | With Mortgage |
| Less than $800 | 3 (2.6%) | 0 (0.0%) |
| $800 to $1,499 | 46 (40.4%) | 10 (4.4%) |
| $800 to $1,499 | 65 (57.0%) | 46 (20.3%) |
| Total | 114 (100.0%) | 227 (100.0%) |
Health & Disability in Buffalo
Health Insurance Coverage by Age in Buffalo
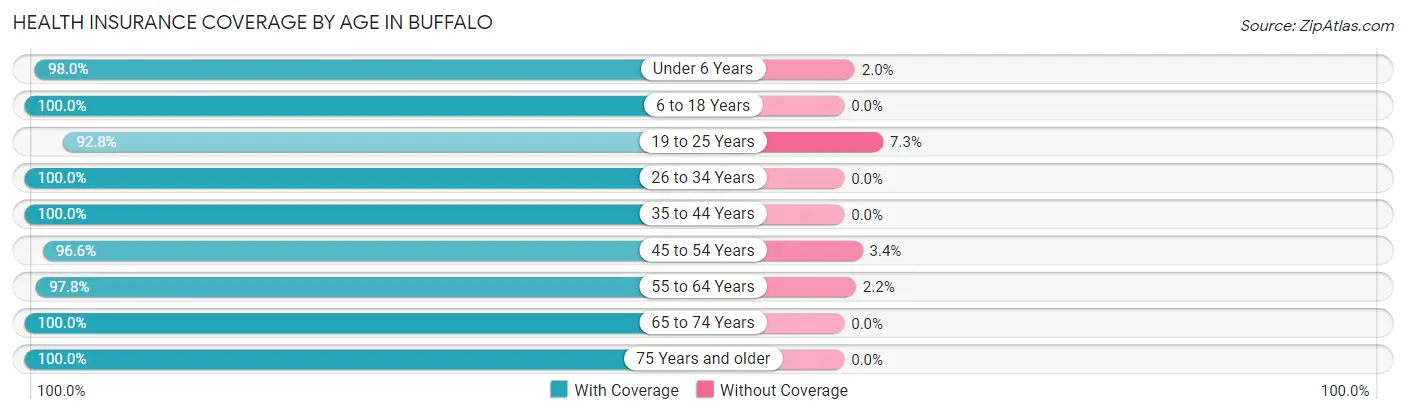
| Age Bracket | With Coverage | Without Coverage |
| Under 6 Years | 50 (98.0%) | 1 (2.0%) |
| 6 to 18 Years | 202 (100.0%) | 0 (0.0%) |
| 19 to 25 Years | 64 (92.7%) | 5 (7.2%) |
| 26 to 34 Years | 84 (100.0%) | 0 (0.0%) |
| 35 to 44 Years | 134 (100.0%) | 0 (0.0%) |
| 45 to 54 Years | 85 (96.6%) | 3 (3.4%) |
| 55 to 64 Years | 180 (97.8%) | 4 (2.2%) |
| 65 to 74 Years | 124 (100.0%) | 0 (0.0%) |
| 75 Years and older | 59 (100.0%) | 0 (0.0%) |
| Total | 982 (98.7%) | 13 (1.3%) |
Health Insurance Coverage by Citizenship Status in Buffalo
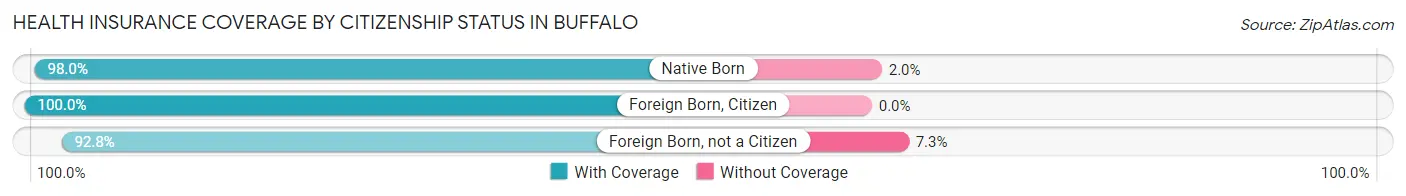
| Citizenship Status | With Coverage | Without Coverage |
| Native Born | 50 (98.0%) | 1 (2.0%) |
| Foreign Born, Citizen | 202 (100.0%) | 0 (0.0%) |
| Foreign Born, not a Citizen | 64 (92.7%) | 5 (7.2%) |
Health Insurance Coverage by Household Income in Buffalo
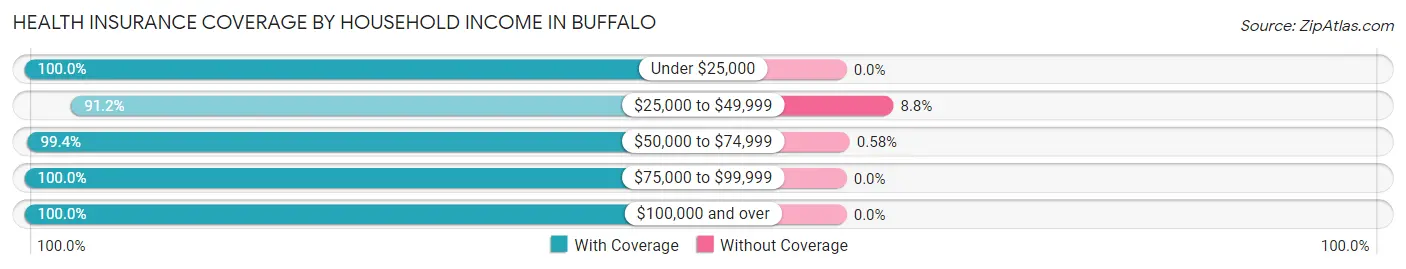
| Household Income | With Coverage | Without Coverage |
| Under $25,000 | 104 (100.0%) | 0 (0.0%) |
| $25,000 to $49,999 | 125 (91.2%) | 12 (8.8%) |
| $50,000 to $74,999 | 171 (99.4%) | 1 (0.6%) |
| $75,000 to $99,999 | 286 (100.0%) | 0 (0.0%) |
| $100,000 and over | 293 (100.0%) | 0 (0.0%) |
Public vs Private Health Insurance Coverage by Age in Buffalo
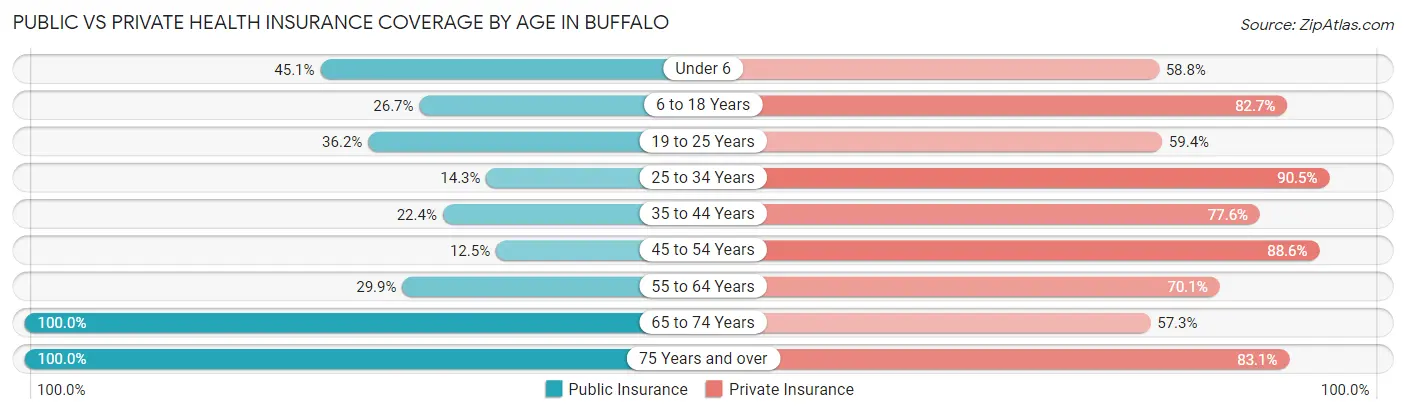
| Age Bracket | Public Insurance | Private Insurance |
| Under 6 | 23 (45.1%) | 30 (58.8%) |
| 6 to 18 Years | 54 (26.7%) | 167 (82.7%) |
| 19 to 25 Years | 25 (36.2%) | 41 (59.4%) |
| 25 to 34 Years | 12 (14.3%) | 76 (90.5%) |
| 35 to 44 Years | 30 (22.4%) | 104 (77.6%) |
| 45 to 54 Years | 11 (12.5%) | 78 (88.6%) |
| 55 to 64 Years | 55 (29.9%) | 129 (70.1%) |
| 65 to 74 Years | 124 (100.0%) | 71 (57.3%) |
| 75 Years and over | 59 (100.0%) | 49 (83.1%) |
| Total | 393 (39.5%) | 745 (74.9%) |
Disability Status by Sex by Age in Buffalo
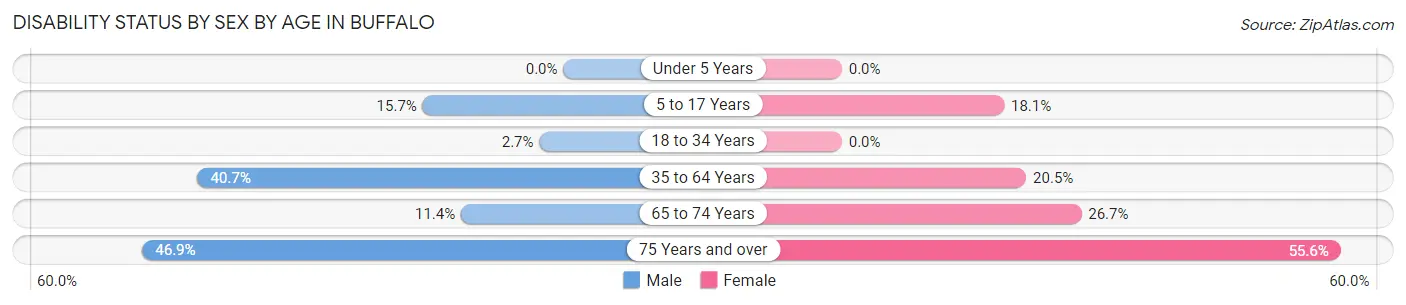
| Age Bracket | Male | Female |
| Under 5 Years | 0 (0.0%) | 0 (0.0%) |
| 5 to 17 Years | 21 (15.7%) | 15 (18.1%) |
| 18 to 34 Years | 2 (2.7%) | 0 (0.0%) |
| 35 to 64 Years | 88 (40.7%) | 39 (20.5%) |
| 65 to 74 Years | 9 (11.4%) | 12 (26.7%) |
| 75 Years and over | 15 (46.9%) | 15 (55.6%) |
Disability Class by Sex by Age in Buffalo
Disability Class: Hearing Difficulty
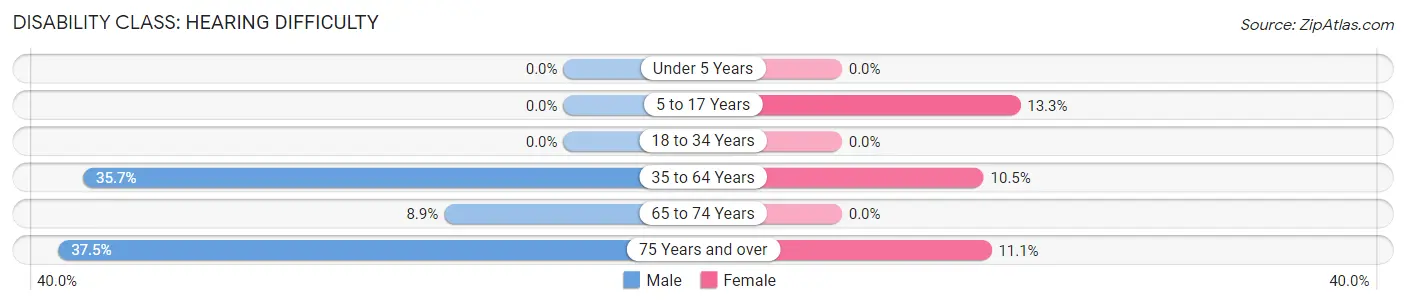
| Age Bracket | Male | Female |
| Under 5 Years | 0 (0.0%) | 0 (0.0%) |
| 5 to 17 Years | 0 (0.0%) | 11 (13.3%) |
| 18 to 34 Years | 0 (0.0%) | 0 (0.0%) |
| 35 to 64 Years | 77 (35.6%) | 20 (10.5%) |
| 65 to 74 Years | 7 (8.9%) | 0 (0.0%) |
| 75 Years and over | 12 (37.5%) | 3 (11.1%) |
Disability Class: Vision Difficulty
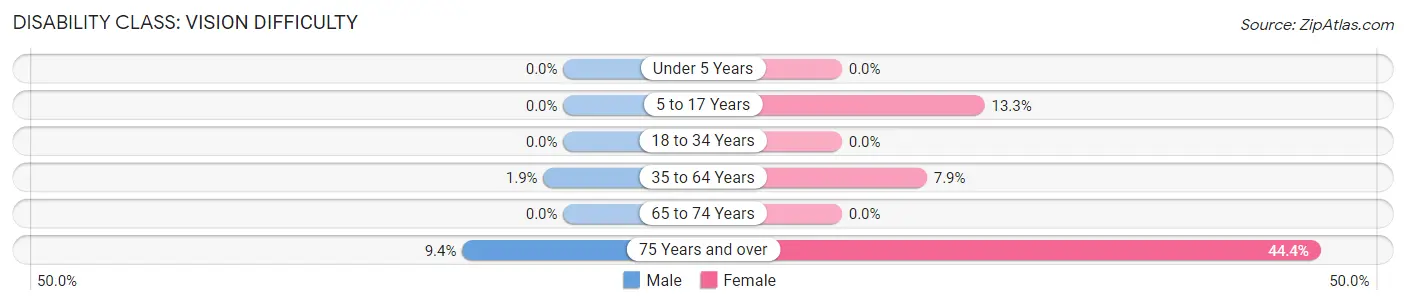
| Age Bracket | Male | Female |
| Under 5 Years | 0 (0.0%) | 0 (0.0%) |
| 5 to 17 Years | 0 (0.0%) | 11 (13.3%) |
| 18 to 34 Years | 0 (0.0%) | 0 (0.0%) |
| 35 to 64 Years | 4 (1.8%) | 15 (7.9%) |
| 65 to 74 Years | 0 (0.0%) | 0 (0.0%) |
| 75 Years and over | 3 (9.4%) | 12 (44.4%) |
Disability Class: Cognitive Difficulty
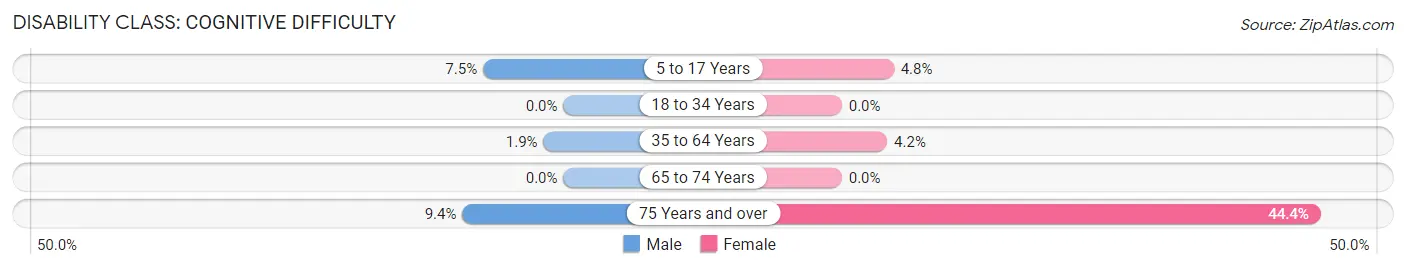
| Age Bracket | Male | Female |
| 5 to 17 Years | 10 (7.5%) | 4 (4.8%) |
| 18 to 34 Years | 0 (0.0%) | 0 (0.0%) |
| 35 to 64 Years | 4 (1.8%) | 8 (4.2%) |
| 65 to 74 Years | 0 (0.0%) | 0 (0.0%) |
| 75 Years and over | 3 (9.4%) | 12 (44.4%) |
Disability Class: Ambulatory Difficulty
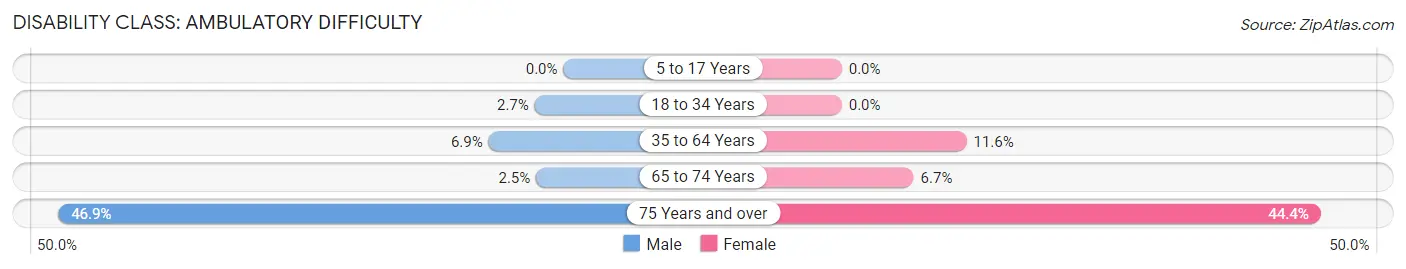
| Age Bracket | Male | Female |
| 5 to 17 Years | 0 (0.0%) | 0 (0.0%) |
| 18 to 34 Years | 2 (2.7%) | 0 (0.0%) |
| 35 to 64 Years | 15 (6.9%) | 22 (11.6%) |
| 65 to 74 Years | 2 (2.5%) | 3 (6.7%) |
| 75 Years and over | 15 (46.9%) | 12 (44.4%) |
Disability Class: Self-Care Difficulty
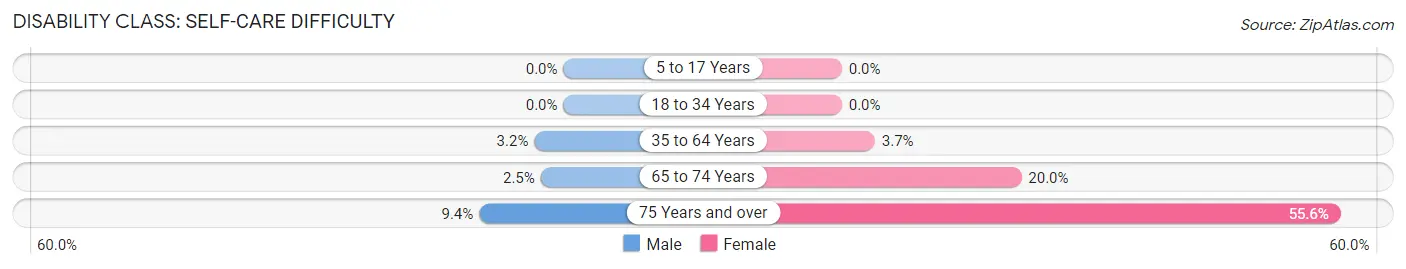
| Age Bracket | Male | Female |
| 5 to 17 Years | 0 (0.0%) | 0 (0.0%) |
| 18 to 34 Years | 0 (0.0%) | 0 (0.0%) |
| 35 to 64 Years | 7 (3.2%) | 7 (3.7%) |
| 65 to 74 Years | 2 (2.5%) | 9 (20.0%) |
| 75 Years and over | 3 (9.4%) | 15 (55.6%) |
Technology Access in Buffalo
Computing Device Access in Buffalo
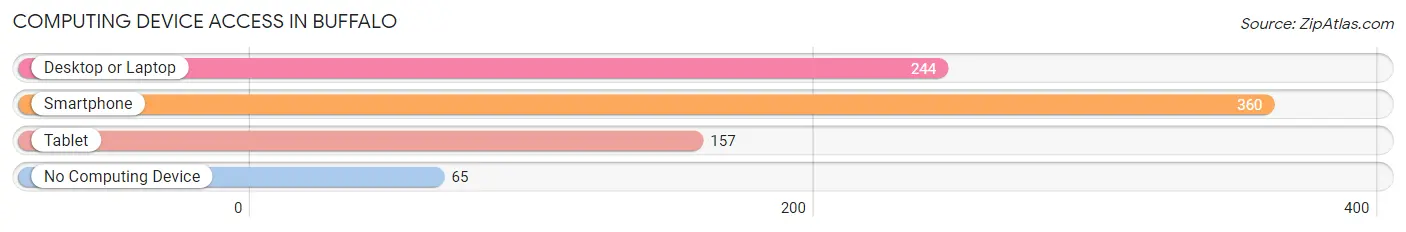
| Device Type | # Households | % Households |
| Desktop or Laptop | 244 | 55.2% |
| Smartphone | 360 | 81.5% |
| Tablet | 157 | 35.5% |
| No Computing Device | 65 | 14.7% |
| Total | 442 | 100.0% |
Internet Access in Buffalo
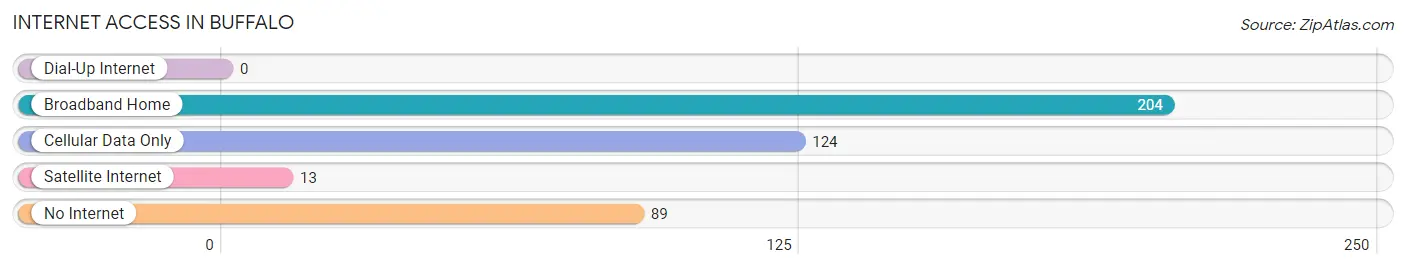
| Internet Type | # Households | % Households |
| Dial-Up Internet | 0 | 0.0% |
| Broadband Home | 204 | 46.2% |
| Cellular Data Only | 124 | 28.1% |
| Satellite Internet | 13 | 2.9% |
| No Internet | 89 | 20.1% |
| Total | 442 | 100.0% |
Buffalo Summary
Buffalo, Iowa is a small town located in the southeastern corner of the state, in the county of Scott. It is situated on the banks of the Mississippi River, and is part of the Quad Cities metropolitan area. The town has a population of just over 1,000 people, and is known for its rural charm and friendly atmosphere.
History
Buffalo, Iowa was founded in 1837 by a group of settlers from Buffalo, New York. The town was originally named Buffalo City, but the name was changed to Buffalo in 1845. The town was incorporated in 1851, and the first post office was established in 1853.
The town was an important stop on the Underground Railroad, and was home to several prominent abolitionists. In the late 19th century, the town was a major hub for the lumber industry, and was home to several sawmills.
Geography
Buffalo, Iowa is located in the southeastern corner of the state, in the county of Scott. It is situated on the banks of the Mississippi River, and is part of the Quad Cities metropolitan area. The town is located at the intersection of Interstate 80 and U.S. Route 61.
The town has a total area of 1.2 square miles, all of which is land. The town is located in a hilly region, and is surrounded by rolling hills and wooded areas. The town is located in a humid continental climate zone, and experiences hot, humid summers and cold, snowy winters.
Economy
The economy of Buffalo, Iowa is largely based on agriculture and tourism. The town is home to several farms, and is a popular destination for hunters and fishermen. The town is also home to several small businesses, including restaurants, shops, and a local winery.
The town is also home to several manufacturing companies, including a furniture factory and a plastics factory. The town is also home to a large trucking company, which employs many of the town's residents.
Demographics
As of the 2010 census, the population of Buffalo, Iowa was 1,072. The racial makeup of the town was 97.3% White, 0.7% African American, 0.2% Native American, 0.2% Asian, 0.2% from other races, and 1.6% from two or more races. Hispanic or Latino of any race were 1.2% of the population.
The median income for a household in the town was $41,250, and the median income for a family was $50,000. The per capita income for the town was $20,845. About 8.3% of families and 10.2% of the population were below the poverty line, including 14.3% of those under age 18 and 6.2% of those age 65 or over.
Buffalo, Iowa is a small town with a rich history and a friendly atmosphere. The town is home to several farms and businesses, and is a popular destination for hunters and fishermen. The town is also home to several manufacturing companies, and is a great place to live and work.
Common Questions
What is Per Capita Income in Buffalo?
Per Capita income in Buffalo is $34,368.
What is the Median Family Income in Buffalo?
Median Family Income in Buffalo is $75,625.
What is the Median Household income in Buffalo?
Median Household Income in Buffalo is $74,667.
What is Income or Wage Gap in Buffalo?
Income or Wage Gap in Buffalo is 52.4%.
Women in Buffalo earn 47.6 cents for every dollar earned by a man.
What is Inequality or Gini Index in Buffalo?
Inequality or Gini Index in Buffalo is 0.33.
What is the Total Population of Buffalo?
Total Population of Buffalo is 995.
What is the Total Male Population of Buffalo?
Total Male Population of Buffalo is 547.
What is the Total Female Population of Buffalo?
Total Female Population of Buffalo is 448.
What is the Ratio of Males per 100 Females in Buffalo?
There are 122.10 Males per 100 Females in Buffalo.
What is the Ratio of Females per 100 Males in Buffalo?
There are 81.90 Females per 100 Males in Buffalo.
What is the Median Population Age in Buffalo?
Median Population Age in Buffalo is 40.4 Years.
What is the Average Family Size in Buffalo
Average Family Size in Buffalo is 3.2 People.
What is the Average Household Size in Buffalo
Average Household Size in Buffalo is 2.2 People.
How Large is the Labor Force in Buffalo?
There are 525 People in the Labor Forcein in Buffalo.
What is the Percentage of People in the Labor Force in Buffalo?
66.3% of People are in the Labor Force in Buffalo.
What is the Unemployment Rate in Buffalo?
Unemployment Rate in Buffalo is 0.6%.