Lenkerville, PA Map & Demographics
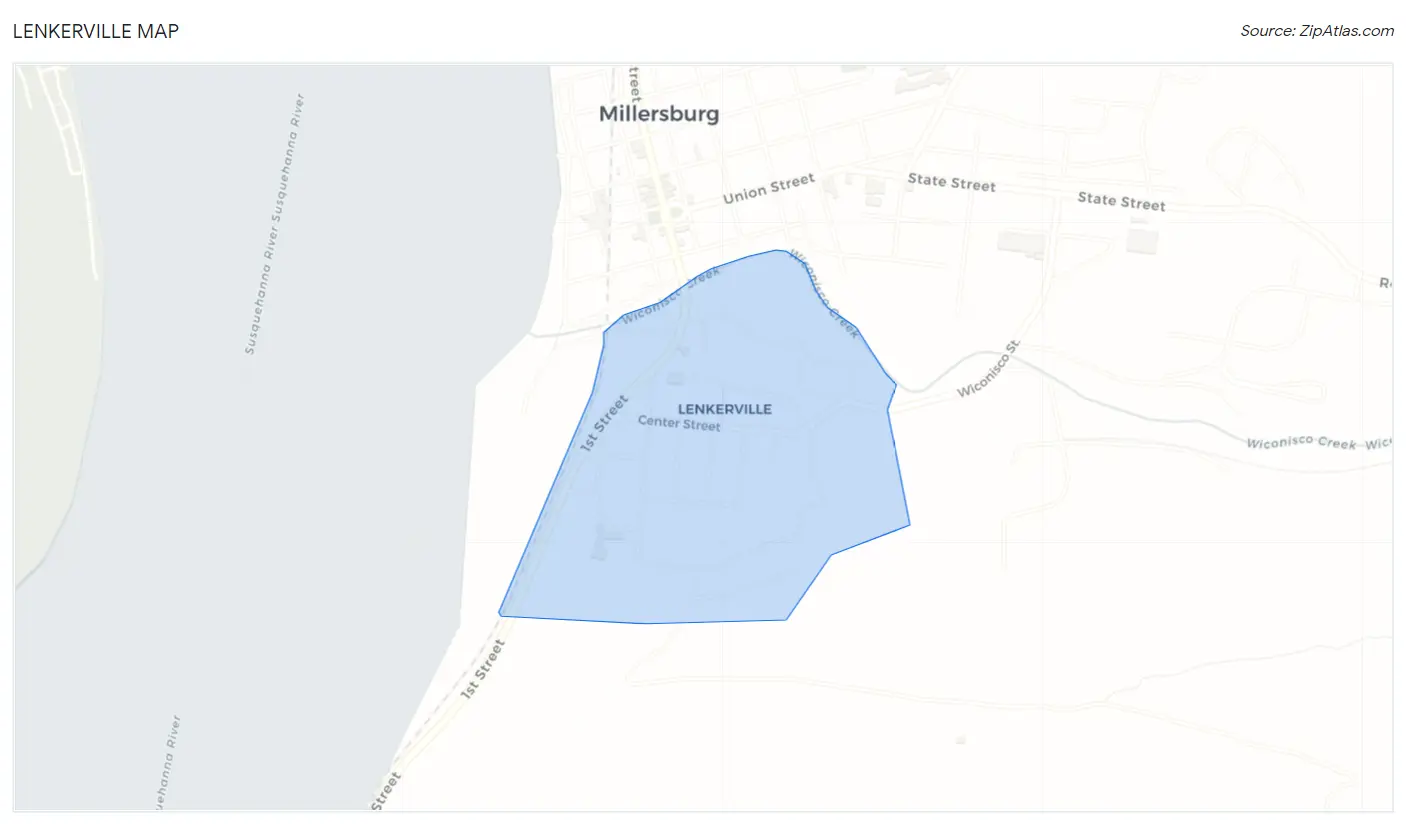
Lenkerville Map
Lenkerville Overview
$15,258
PER CAPITA INCOME
26.7%
WAGE / INCOME GAP [ % ]
73.3¢/ $1
WAGE / INCOME GAP [ $ ]
0.62
INEQUALITY / GINI INDEX
812
TOTAL POPULATION
452
MALE POPULATION
360
FEMALE POPULATION
125.56
MALES / 100 FEMALES
79.65
FEMALES / 100 MALES
35.7
MEDIAN AGE
2.2
AVG FAMILY SIZE
2.5
AVG HOUSEHOLD SIZE
161
LABOR FORCE [ PEOPLE ]
21.7%
PERCENT IN LABOR FORCE
Income in Lenkerville
Income Overview in Lenkerville
| Characteristic | Number | Measure |
| Per Capita Income | 812 | $15,258 |
| Median Family Income | 258 | $0 |
| Mean Family Income | 258 | $39,708 |
| Median Household Income | 328 | $0 |
| Mean Household Income | 328 | $37,096 |
| Income Deficit | 258 | $0 |
| Wage / Income Gap (%) | 812 | 26.68% |
| Wage / Income Gap ($) | 812 | 73.32¢ per $1 |
| Gini / Inequality Index | 812 | 0.62 |
Earnings by Sex in Lenkerville
Average Earnings in Lenkerville are $55,804, $63,077 for men and $46,250 for women, a difference of 26.7%.
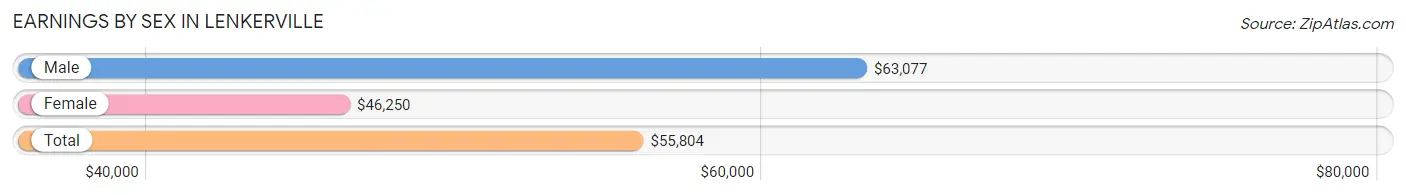
| Sex | Number | Average Earnings |
| Male | 90 (55.9%) | $63,077 |
| Female | 71 (44.1%) | $46,250 |
| Total | 161 (100.0%) | $55,804 |
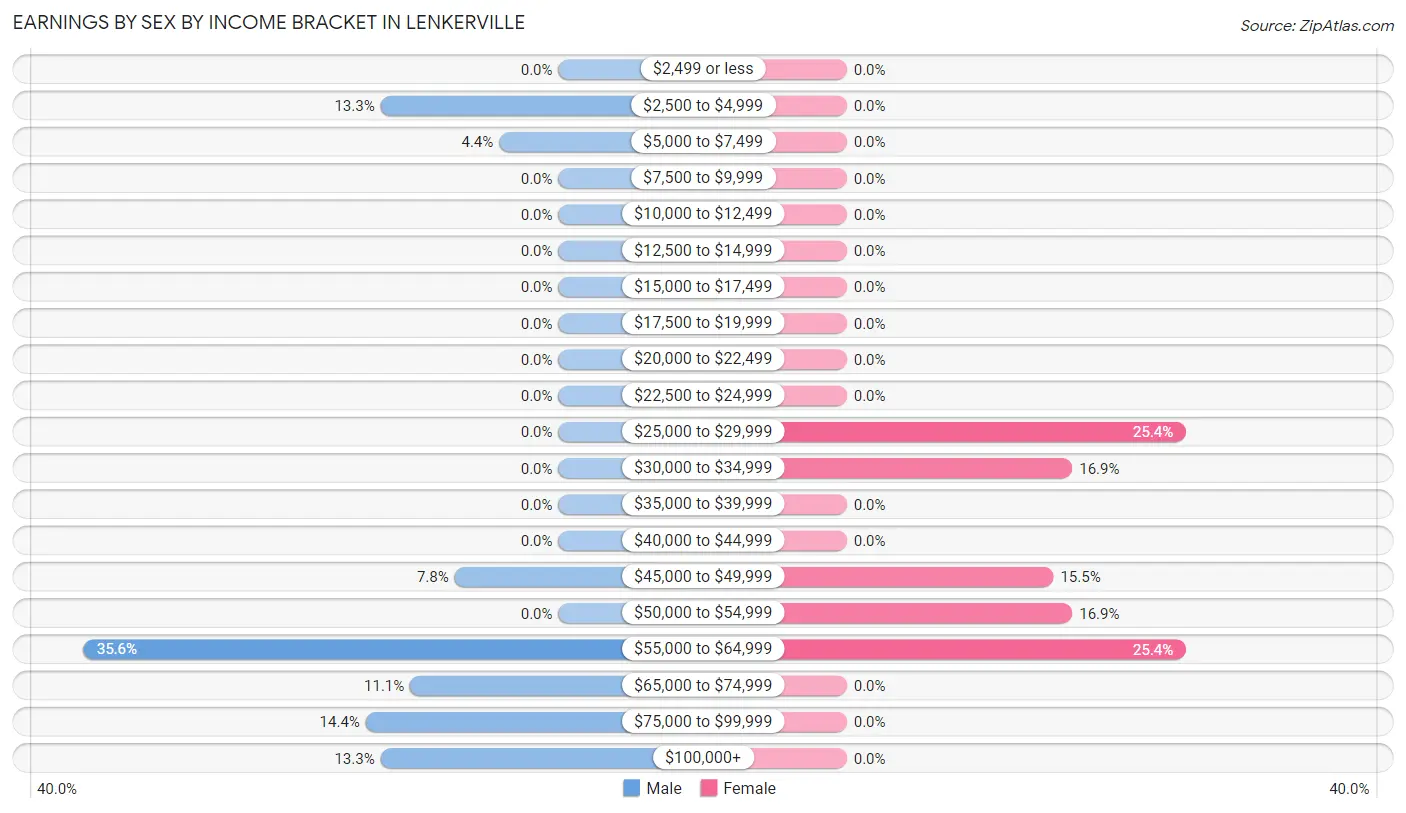
Earnings by Sex by Income Bracket in Lenkerville
The most common earnings brackets in Lenkerville are $55,000 to $64,999 for men (32 | 35.6%) and $25,000 to $29,999 for women (18 | 25.4%).
| Income | Male | Female |
| $2,499 or less | 0 (0.0%) | 0 (0.0%) |
| $2,500 to $4,999 | 12 (13.3%) | 0 (0.0%) |
| $5,000 to $7,499 | 4 (4.4%) | 0 (0.0%) |
| $7,500 to $9,999 | 0 (0.0%) | 0 (0.0%) |
| $10,000 to $12,499 | 0 (0.0%) | 0 (0.0%) |
| $12,500 to $14,999 | 0 (0.0%) | 0 (0.0%) |
| $15,000 to $17,499 | 0 (0.0%) | 0 (0.0%) |
| $17,500 to $19,999 | 0 (0.0%) | 0 (0.0%) |
| $20,000 to $22,499 | 0 (0.0%) | 0 (0.0%) |
| $22,500 to $24,999 | 0 (0.0%) | 0 (0.0%) |
| $25,000 to $29,999 | 0 (0.0%) | 18 (25.4%) |
| $30,000 to $34,999 | 0 (0.0%) | 12 (16.9%) |
| $35,000 to $39,999 | 0 (0.0%) | 0 (0.0%) |
| $40,000 to $44,999 | 0 (0.0%) | 0 (0.0%) |
| $45,000 to $49,999 | 7 (7.8%) | 11 (15.5%) |
| $50,000 to $54,999 | 0 (0.0%) | 12 (16.9%) |
| $55,000 to $64,999 | 32 (35.6%) | 18 (25.4%) |
| $65,000 to $74,999 | 10 (11.1%) | 0 (0.0%) |
| $75,000 to $99,999 | 13 (14.4%) | 0 (0.0%) |
| $100,000+ | 12 (13.3%) | 0 (0.0%) |
| Total | 90 (100.0%) | 71 (100.0%) |
Earnings by Sex by Educational Attainment in Lenkerville
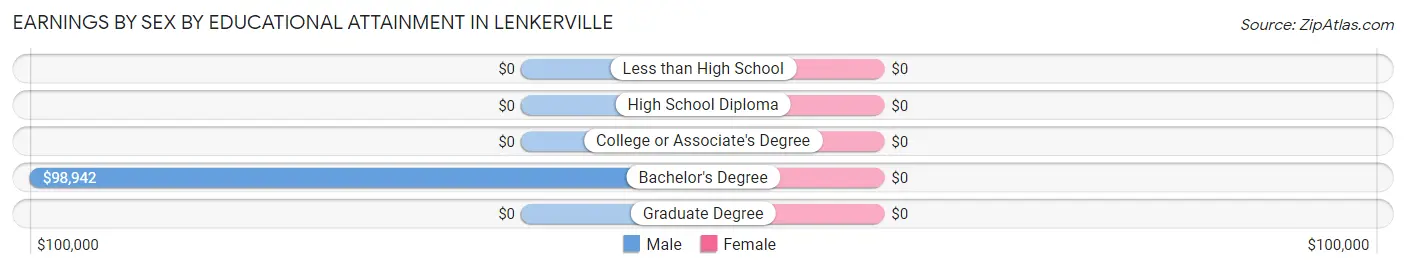
| Educational Attainment | Male Income | Female Income |
| Less than High School | - | - |
| High School Diploma | - | - |
| College or Associate's Degree | - | - |
| Bachelor's Degree | $98,942 | $0 |
| Graduate Degree | - | - |
| Total | $63,077 | $53,229 |
Family Income in Lenkerville
Family Income Brackets in Lenkerville
According to the Lenkerville family income data, there are 151 families falling into the less than $10,000 income range, which is the most common income bracket and makes up 58.5% of all families.
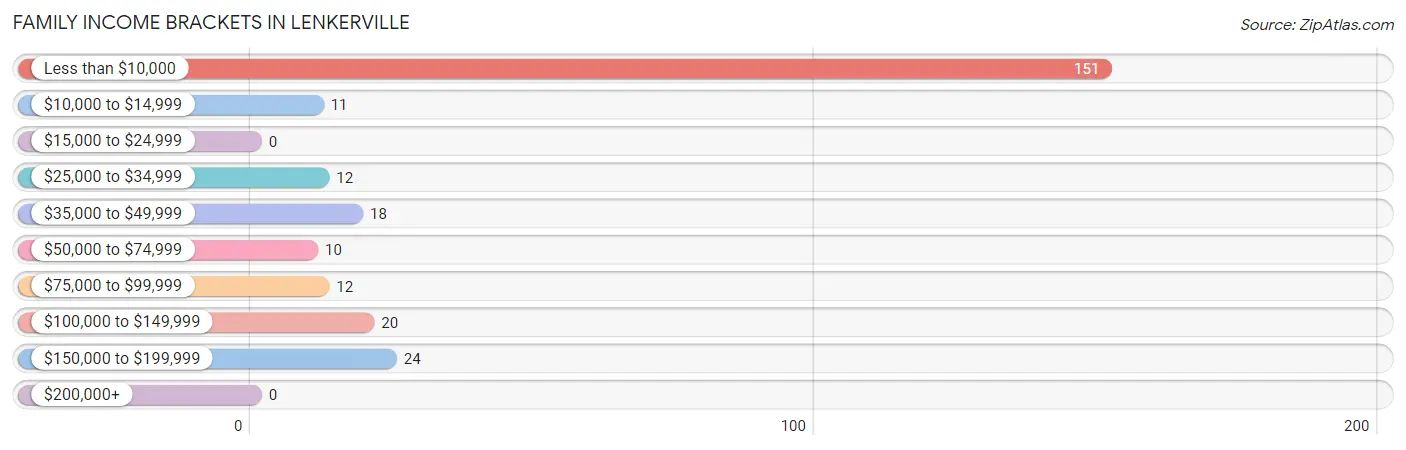
| Income Bracket | # Families | % Families |
| Less than $10,000 | 151 | 58.5% |
| $10,000 to $14,999 | 11 | 4.3% |
| $15,000 to $24,999 | 0 | 0.0% |
| $25,000 to $34,999 | 12 | 4.7% |
| $35,000 to $49,999 | 18 | 7.0% |
| $50,000 to $74,999 | 10 | 3.9% |
| $75,000 to $99,999 | 12 | 4.7% |
| $100,000 to $149,999 | 20 | 7.8% |
| $150,000 to $199,999 | 24 | 9.3% |
| $200,000+ | 0 | 0.0% |
Family Income by Famaliy Size in Lenkerville
| Income Bracket | # Families | Median Income |
| 2-Person Families | 223 (86.4%) | $0 |
| 3-Person Families | 24 (9.3%) | $0 |
| 4-Person Families | 11 (4.3%) | $0 |
| 5-Person Families | 0 (0.0%) | $0 |
| 6-Person Families | 0 (0.0%) | $0 |
| 7+ Person Families | 0 (0.0%) | $0 |
| Total | 258 (100.0%) | $0 |
Family Income by Number of Earners in Lenkerville
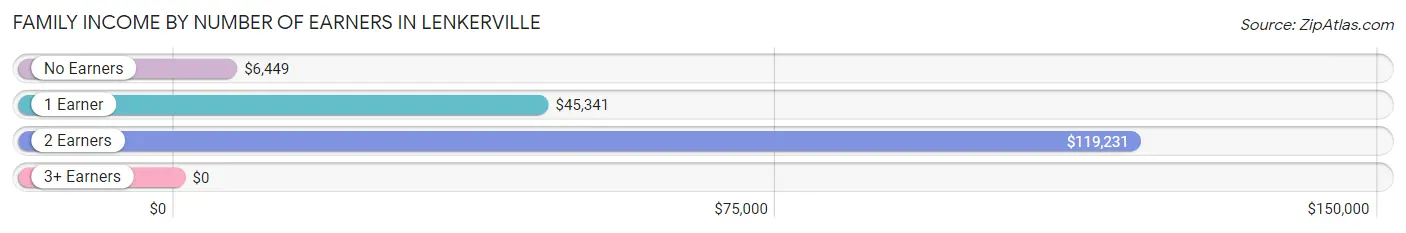
| Number of Earners | # Families | Median Income |
| No Earners | 175 (67.8%) | $6,449 |
| 1 Earner | 27 (10.5%) | $45,341 |
| 2 Earners | 56 (21.7%) | $119,231 |
| 3+ Earners | 0 (0.0%) | $0 |
| Total | 258 (100.0%) | $0 |
Household Income in Lenkerville
Household Income Brackets in Lenkerville
With 151 households falling in the category, the less than $10,000 income range is the most frequent in Lenkerville, accounting for 46.0% of all households.
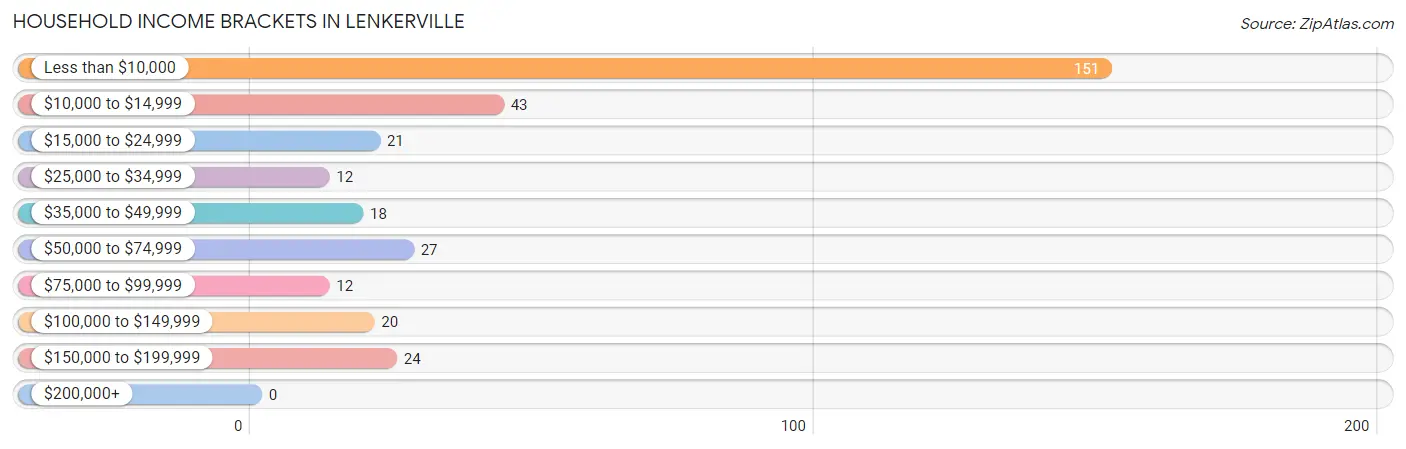
| Income Bracket | # Households | % Households |
| Less than $10,000 | 151 | 46.0% |
| $10,000 to $14,999 | 43 | 13.1% |
| $15,000 to $24,999 | 21 | 6.4% |
| $25,000 to $34,999 | 12 | 3.7% |
| $35,000 to $49,999 | 18 | 5.5% |
| $50,000 to $74,999 | 27 | 8.2% |
| $75,000 to $99,999 | 12 | 3.7% |
| $100,000 to $149,999 | 20 | 6.1% |
| $150,000 to $199,999 | 24 | 7.3% |
| $200,000+ | 0 | 0.0% |
Household Income by Householder Age in Lenkerville
| Income Bracket | # Households | Median Income |
| 15 to 24 Years | 0 (0.0%) | $0 |
| 25 to 44 Years | 211 (64.3%) | $0 |
| 45 to 64 Years | 56 (17.1%) | $0 |
| 65+ Years | 61 (18.6%) | $0 |
| Total | 328 (100.0%) | $0 |
Poverty in Lenkerville
Income Below Poverty by Sex and Age in Lenkerville
With 74.8% poverty level for males and 53.9% for females among the residents of Lenkerville, under 5 year old males and 35 to 44 year old females are the most vulnerable to poverty, with 14 males (100.0%) and 151 females (86.8%) in their respective age groups living below the poverty level.
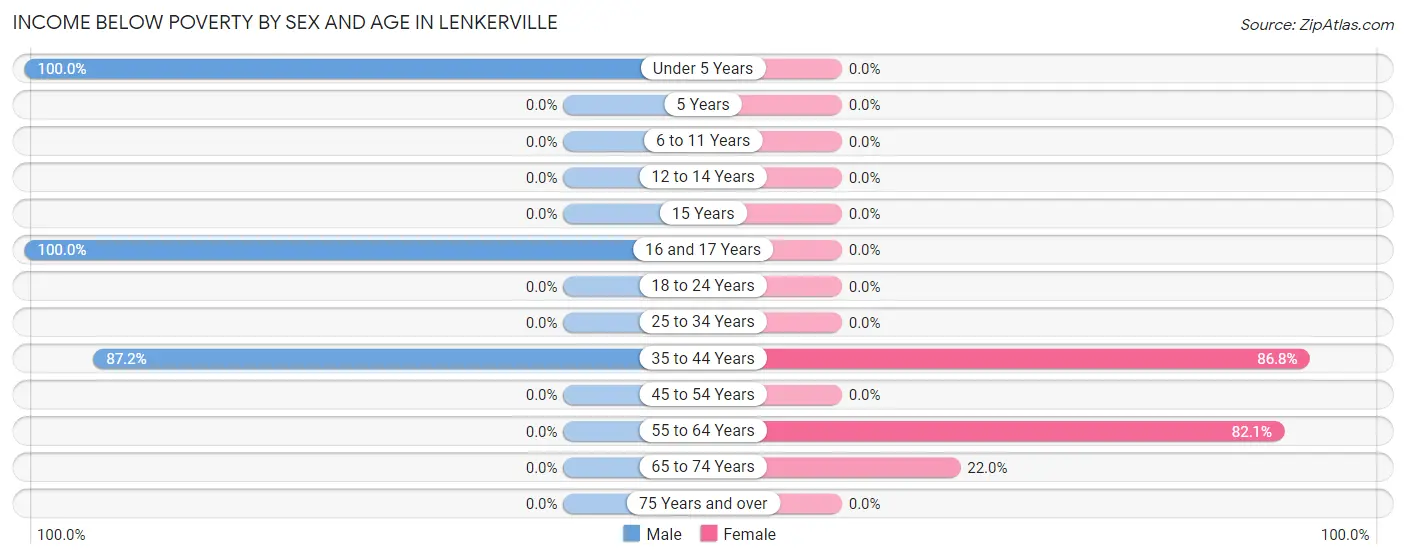
| Age Bracket | Male | Female |
| Under 5 Years | 14 (100.0%) | 0 (0.0%) |
| 5 Years | 0 (0.0%) | 0 (0.0%) |
| 6 to 11 Years | 0 (0.0%) | 0 (0.0%) |
| 12 to 14 Years | 0 (0.0%) | 0 (0.0%) |
| 15 Years | 0 (0.0%) | 0 (0.0%) |
| 16 and 17 Years | 153 (100.0%) | 0 (0.0%) |
| 18 to 24 Years | 0 (0.0%) | 0 (0.0%) |
| 25 to 34 Years | 0 (0.0%) | 0 (0.0%) |
| 35 to 44 Years | 171 (87.2%) | 151 (86.8%) |
| 45 to 54 Years | 0 (0.0%) | 0 (0.0%) |
| 55 to 64 Years | 0 (0.0%) | 32 (82.1%) |
| 65 to 74 Years | 0 (0.0%) | 11 (22.0%) |
| 75 Years and over | 0 (0.0%) | 0 (0.0%) |
| Total | 338 (74.8%) | 194 (53.9%) |
Income Above Poverty by Sex and Age in Lenkerville
According to the poverty statistics in Lenkerville, males aged 5 years and females aged under 5 years are the age groups that are most secure financially, with 100.0% of males and 100.0% of females in these age groups living above the poverty line.
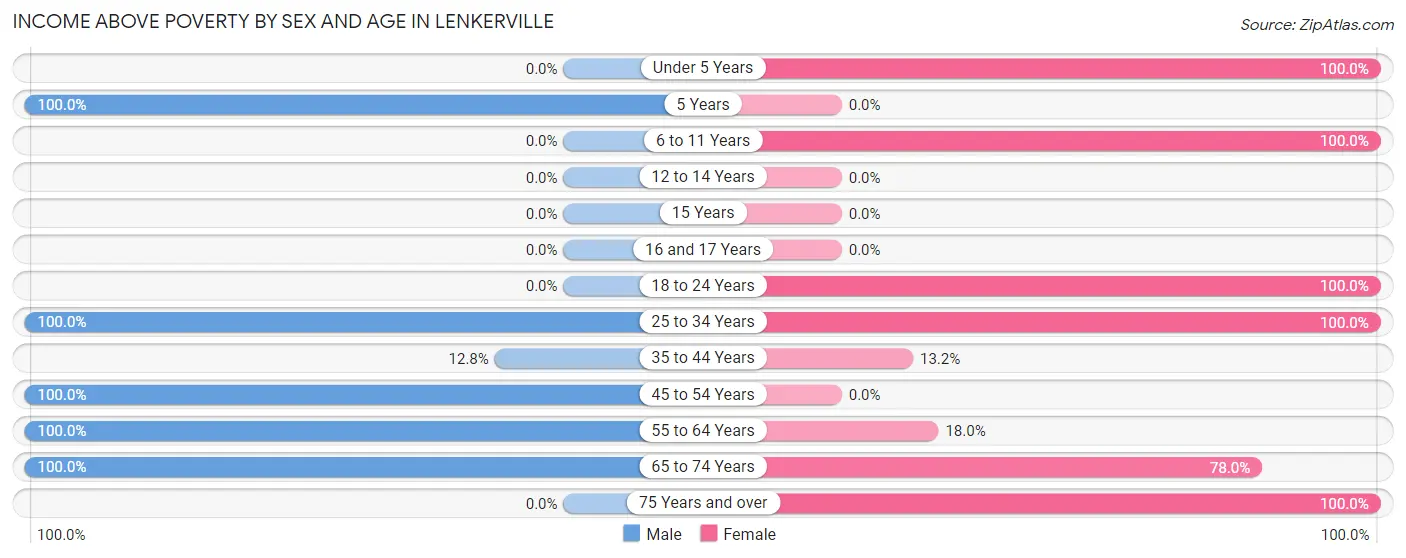
| Age Bracket | Male | Female |
| Under 5 Years | 0 (0.0%) | 23 (100.0%) |
| 5 Years | 11 (100.0%) | 0 (0.0%) |
| 6 to 11 Years | 0 (0.0%) | 21 (100.0%) |
| 12 to 14 Years | 0 (0.0%) | 0 (0.0%) |
| 15 Years | 0 (0.0%) | 0 (0.0%) |
| 16 and 17 Years | 0 (0.0%) | 0 (0.0%) |
| 18 to 24 Years | 0 (0.0%) | 18 (100.0%) |
| 25 to 34 Years | 25 (100.0%) | 23 (100.0%) |
| 35 to 44 Years | 25 (12.8%) | 23 (13.2%) |
| 45 to 54 Years | 10 (100.0%) | 0 (0.0%) |
| 55 to 64 Years | 19 (100.0%) | 7 (17.9%) |
| 65 to 74 Years | 24 (100.0%) | 39 (78.0%) |
| 75 Years and over | 0 (0.0%) | 12 (100.0%) |
| Total | 114 (25.2%) | 166 (46.1%) |
Income Below Poverty Among Married-Couple Families in Lenkerville
| Children | Above Poverty | Below Poverty |
| No Children | 49 (100.0%) | 0 (0.0%) |
| 1 or 2 Children | 24 (100.0%) | 0 (0.0%) |
| 3 or 4 Children | 0 (0.0%) | 0 (0.0%) |
| 5 or more Children | 0 (0.0%) | 0 (0.0%) |
| Total | 73 (100.0%) | 0 (0.0%) |
Income Below Poverty Among Single-Parent Households in Lenkerville
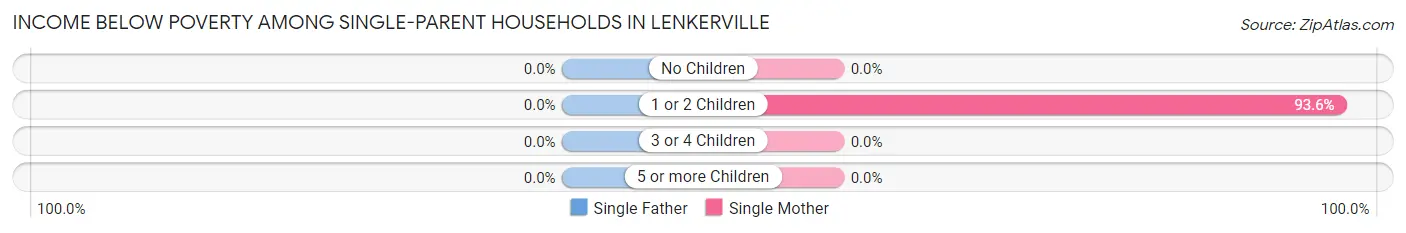
| Children | Single Father | Single Mother |
| No Children | 0 (0.0%) | 0 (0.0%) |
| 1 or 2 Children | 0 (0.0%) | 162 (93.6%) |
| 3 or 4 Children | 0 (0.0%) | 0 (0.0%) |
| 5 or more Children | 0 (0.0%) | 0 (0.0%) |
| Total | 0 (0.0%) | 162 (87.6%) |
Income Below Poverty Among Married-Couple vs Single-Parent Households in Lenkerville
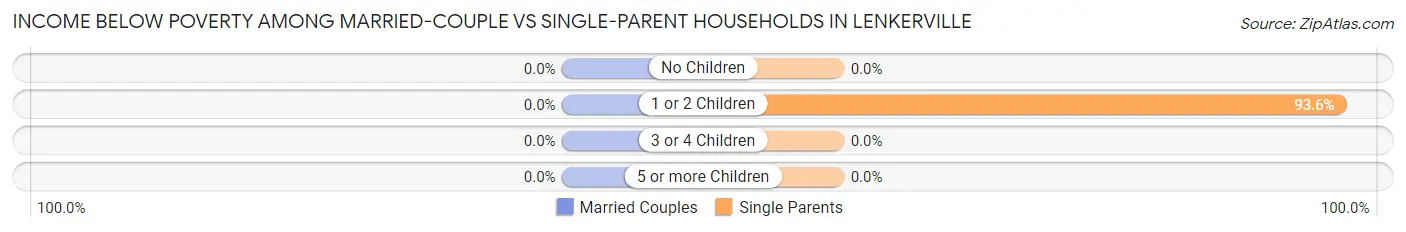
| Children | Married-Couple Families | Single-Parent Households |
| No Children | 0 (0.0%) | 0 (0.0%) |
| 1 or 2 Children | 0 (0.0%) | 162 (93.6%) |
| 3 or 4 Children | 0 (0.0%) | 0 (0.0%) |
| 5 or more Children | 0 (0.0%) | 0 (0.0%) |
| Total | 0 (0.0%) | 162 (87.6%) |
Race in Lenkerville
The most populous races in Lenkerville are White / Caucasian (787 | 96.9%), and Asian (25 | 3.1%).
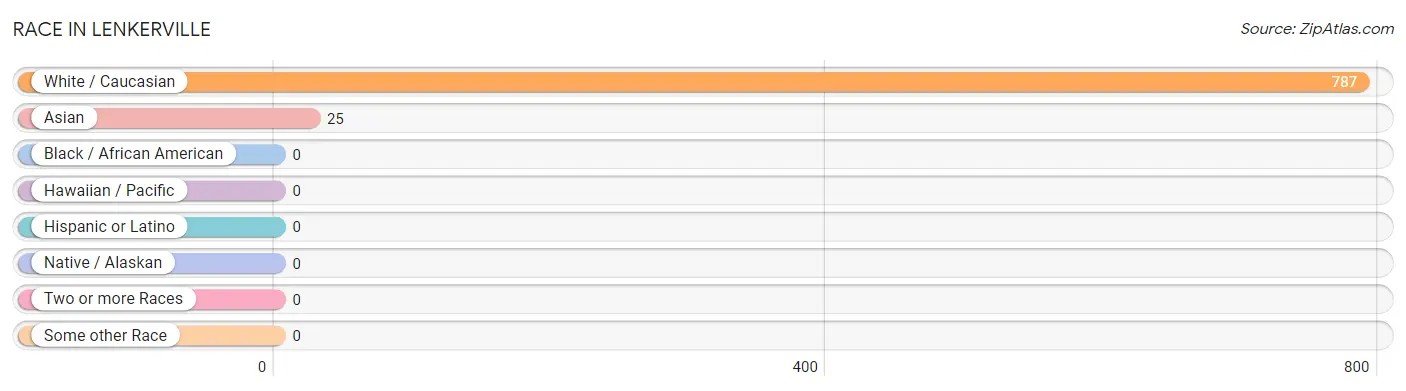
| Race | # Population | % Population |
| Asian | 25 | 3.1% |
| Black / African American | 0 | 0.0% |
| Hawaiian / Pacific | 0 | 0.0% |
| Hispanic or Latino | 0 | 0.0% |
| Native / Alaskan | 0 | 0.0% |
| White / Caucasian | 787 | 96.9% |
| Two or more Races | 0 | 0.0% |
| Some other Race | 0 | 0.0% |
| Total | 812 | 100.0% |
Ancestry in Lenkerville
The most populous ancestries reported in Lenkerville are American (489 | 60.2%), German (98 | 12.1%), English (51 | 6.3%), Italian (45 | 5.5%), and Irish (32 | 3.9%), together accounting for 88.0% of all Lenkerville residents.
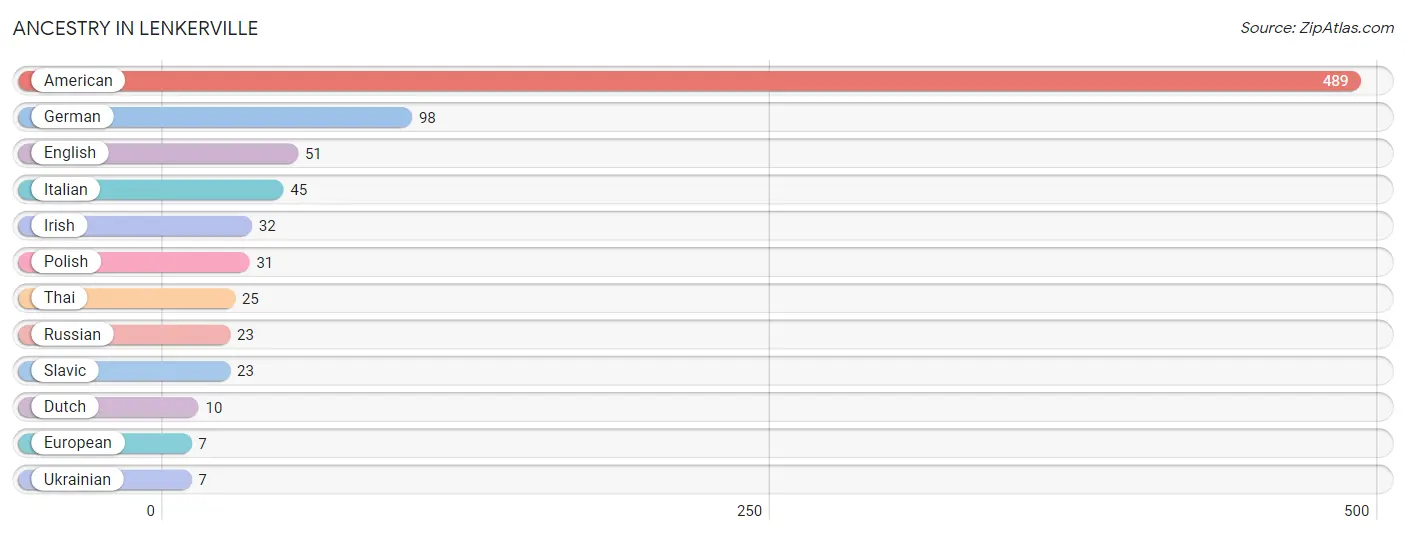
| Ancestry | # Population | % Population |
| American | 489 | 60.2% |
| Dutch | 10 | 1.2% |
| English | 51 | 6.3% |
| European | 7 | 0.9% |
| German | 98 | 12.1% |
| Irish | 32 | 3.9% |
| Italian | 45 | 5.5% |
| Polish | 31 | 3.8% |
| Russian | 23 | 2.8% |
| Slavic | 23 | 2.8% |
| Thai | 25 | 3.1% |
| Ukrainian | 7 | 0.9% | View All 12 Rows |
Immigrants in Lenkerville
The most numerous immigrant groups reported in Lenkerville came from Asia (11 | 1.3%), China (11 | 1.3%), Eastern Asia (11 | 1.3%), Hong Kong (11 | 1.3%), and Canada (7 | 0.9%), together accounting for 6.3% of all Lenkerville residents.
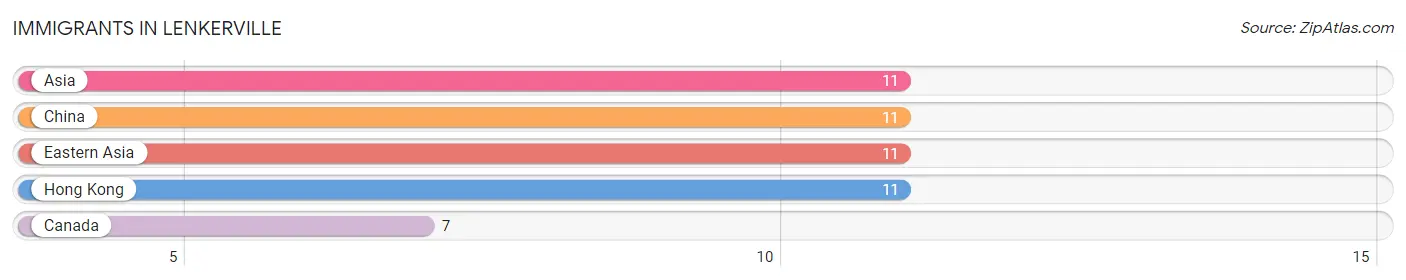
| Immigration Origin | # Population | % Population |
| Asia | 11 | 1.3% |
| Canada | 7 | 0.9% |
| China | 11 | 1.3% |
| Eastern Asia | 11 | 1.3% |
| Hong Kong | 11 | 1.3% | View All 5 Rows |
Sex and Age in Lenkerville
Sex and Age in Lenkerville
The most populous age groups in Lenkerville are 35 to 39 Years (196 | 43.4%) for men and 35 to 39 Years (174 | 48.3%) for women.
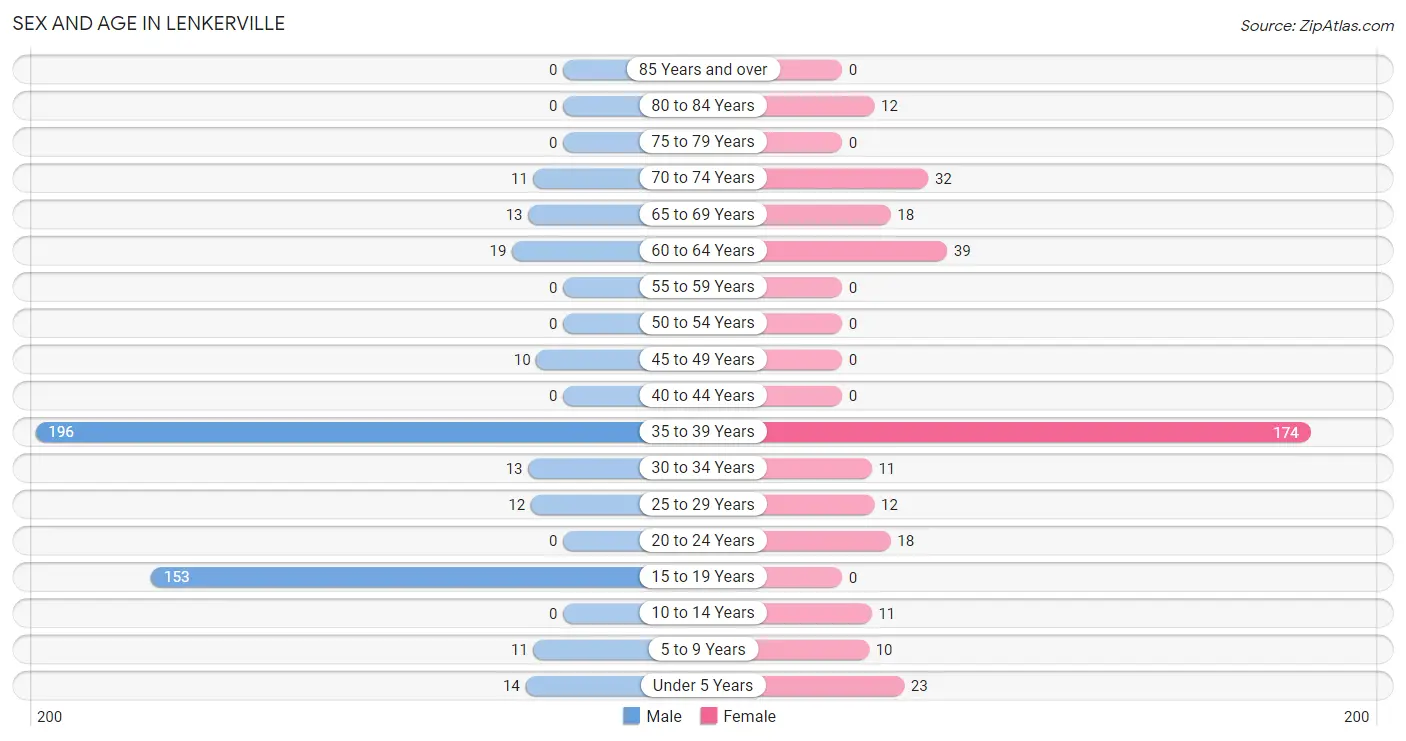
| Age Bracket | Male | Female |
| Under 5 Years | 14 (3.1%) | 23 (6.4%) |
| 5 to 9 Years | 11 (2.4%) | 10 (2.8%) |
| 10 to 14 Years | 0 (0.0%) | 11 (3.1%) |
| 15 to 19 Years | 153 (33.9%) | 0 (0.0%) |
| 20 to 24 Years | 0 (0.0%) | 18 (5.0%) |
| 25 to 29 Years | 12 (2.6%) | 12 (3.3%) |
| 30 to 34 Years | 13 (2.9%) | 11 (3.1%) |
| 35 to 39 Years | 196 (43.4%) | 174 (48.3%) |
| 40 to 44 Years | 0 (0.0%) | 0 (0.0%) |
| 45 to 49 Years | 10 (2.2%) | 0 (0.0%) |
| 50 to 54 Years | 0 (0.0%) | 0 (0.0%) |
| 55 to 59 Years | 0 (0.0%) | 0 (0.0%) |
| 60 to 64 Years | 19 (4.2%) | 39 (10.8%) |
| 65 to 69 Years | 13 (2.9%) | 18 (5.0%) |
| 70 to 74 Years | 11 (2.4%) | 32 (8.9%) |
| 75 to 79 Years | 0 (0.0%) | 0 (0.0%) |
| 80 to 84 Years | 0 (0.0%) | 12 (3.3%) |
| 85 Years and over | 0 (0.0%) | 0 (0.0%) |
| Total | 452 (100.0%) | 360 (100.0%) |
Families and Households in Lenkerville
Median Family Size in Lenkerville
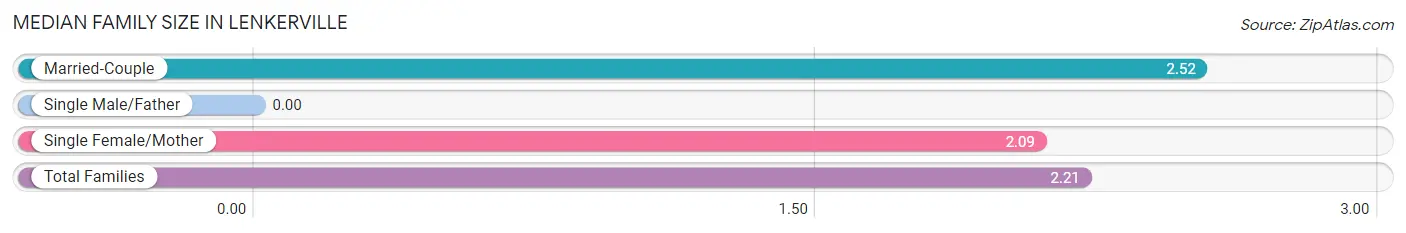
| Family Type | # Families | Family Size |
| Married-Couple | 73 (28.3%) | 2.52 |
| Single Male/Father | 0 (0.0%) | - |
| Single Female/Mother | 185 (71.7%) | 2.09 |
| Total Families | 258 (100.0%) | 2.21 |
Median Household Size in Lenkerville
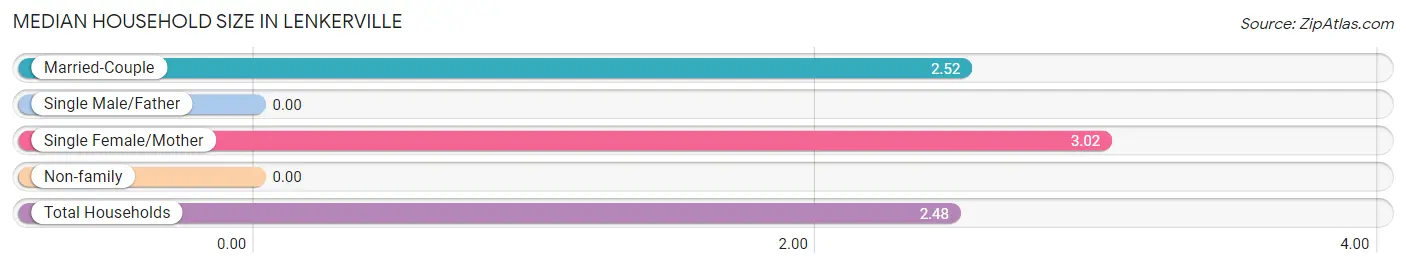
| Household Type | # Households | Household Size |
| Married-Couple | 73 (22.3%) | 2.52 |
| Single Male/Father | 0 (0.0%) | - |
| Single Female/Mother | 185 (56.4%) | 3.02 |
| Non-family | 70 (21.3%) | - |
| Total Households | 328 (100.0%) | 2.48 |
Household Size by Marriage Status in Lenkerville
Out of a total of 328 households in Lenkerville, 258 (78.7%) are family households, while 70 (21.3%) are nonfamily households. The most numerous type of family households are 3-person households, comprising 175, and the most common type of nonfamily households are 1-person households, comprising 70.
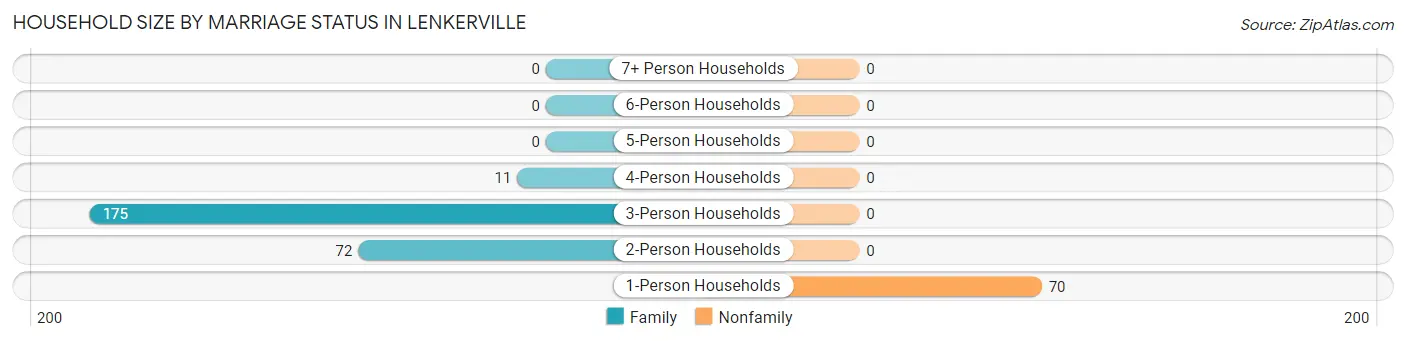
| Household Size | Family Households | Nonfamily Households |
| 1-Person Households | - | 70 (21.3%) |
| 2-Person Households | 72 (22.0%) | 0 (0.0%) |
| 3-Person Households | 175 (53.3%) | 0 (0.0%) |
| 4-Person Households | 11 (3.4%) | 0 (0.0%) |
| 5-Person Households | 0 (0.0%) | 0 (0.0%) |
| 6-Person Households | 0 (0.0%) | 0 (0.0%) |
| 7+ Person Households | 0 (0.0%) | 0 (0.0%) |
| Total | 258 (78.7%) | 70 (21.3%) |
Female Fertility in Lenkerville
Fertility by Age in Lenkerville
| Age Bracket | Women with Births | Births / 1,000 Women |
| 15 to 19 years | 0 (0.0%) | 0.0 |
| 20 to 34 years | 0 (0.0%) | 0.0 |
| 35 to 50 years | 0 (0.0%) | 0.0 |
| Total | 0 (0.0%) | 0.0 |
Fertility by Age by Marriage Status in Lenkerville
| Age Bracket | Married | Unmarried |
| 15 to 19 years | 0 (0.0%) | 0 (0.0%) |
| 20 to 34 years | 0 (0.0%) | 0 (0.0%) |
| 35 to 50 years | 0 (0.0%) | 0 (0.0%) |
| Total | 0 (0.0%) | 0 (0.0%) |
Fertility by Education in Lenkerville
| Educational Attainment | Women with Births | Births / 1,000 Women |
| Less than High School | 0 (0.0%) | 0.0 |
| High School Diploma | 0 (0.0%) | 0.0 |
| College or Associate's Degree | 0 (0.0%) | 0.0 |
| Bachelor's Degree | 0 (0.0%) | 0.0 |
| Graduate Degree | 0 (0.0%) | 0.0 |
| Total | 0 (0.0%) | 0.0 |
Fertility by Education by Marriage Status in Lenkerville
| Educational Attainment | Married | Unmarried |
| Less than High School | 0 (0.0%) | 0 (0.0%) |
| High School Diploma | 0 (0.0%) | 0 (0.0%) |
| College or Associate's Degree | 0 (0.0%) | 0 (0.0%) |
| Bachelor's Degree | 0 (0.0%) | 0 (0.0%) |
| Graduate Degree | 0 (0.0%) | 0 (0.0%) |
| Total | 0 (0.0%) | 0 (0.0%) |
Employment Characteristics in Lenkerville
Employment by Class of Employer in Lenkerville
Among the 161 employed individuals in Lenkerville, private company employees (91 | 56.5%), state government employees (36 | 22.4%), and not-for-profit organizations (22 | 13.7%) make up the most common classes of employment.
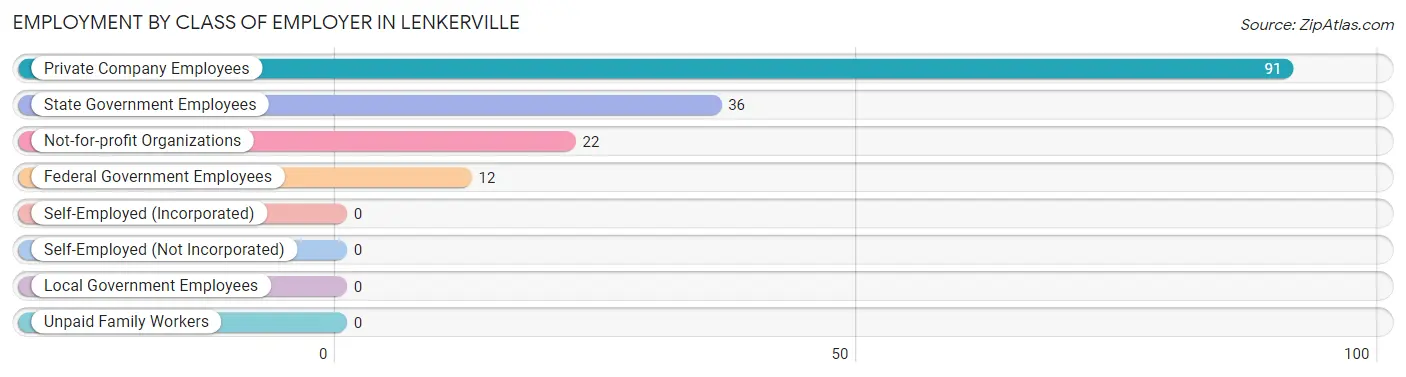
| Employer Class | # Employees | % Employees |
| Private Company Employees | 91 | 56.5% |
| Self-Employed (Incorporated) | 0 | 0.0% |
| Self-Employed (Not Incorporated) | 0 | 0.0% |
| Not-for-profit Organizations | 22 | 13.7% |
| Local Government Employees | 0 | 0.0% |
| State Government Employees | 36 | 22.4% |
| Federal Government Employees | 12 | 7.4% |
| Unpaid Family Workers | 0 | 0.0% |
| Total | 161 | 100.0% |
Employment Status by Age in Lenkerville
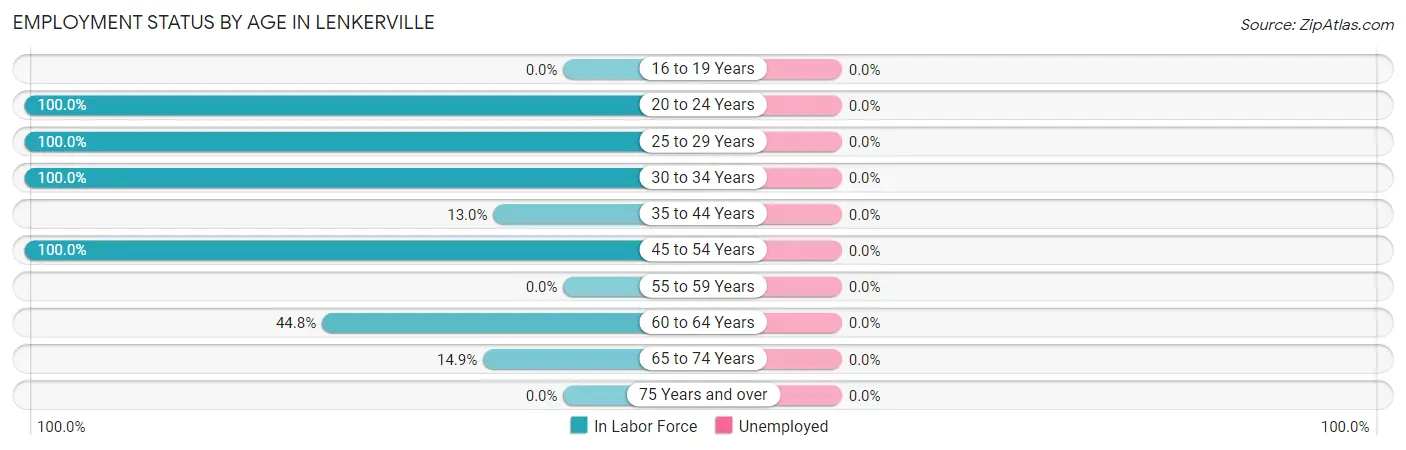
| Age Bracket | In Labor Force | Unemployed |
| 16 to 19 Years | 0 (0.0%) | 0 (0.0%) |
| 20 to 24 Years | 18 (100.0%) | 0 (0.0%) |
| 25 to 29 Years | 24 (100.0%) | 0 (0.0%) |
| 30 to 34 Years | 24 (100.0%) | 0 (0.0%) |
| 35 to 44 Years | 48 (13.0%) | 0 (0.0%) |
| 45 to 54 Years | 10 (100.0%) | 0 (0.0%) |
| 55 to 59 Years | 0 (0.0%) | 0 (0.0%) |
| 60 to 64 Years | 26 (44.8%) | 0 (0.0%) |
| 65 to 74 Years | 11 (14.9%) | 0 (0.0%) |
| 75 Years and over | 0 (0.0%) | 0 (0.0%) |
| Total | 161 (21.7%) | 0 (0.0%) |
Employment Status by Educational Attainment in Lenkerville
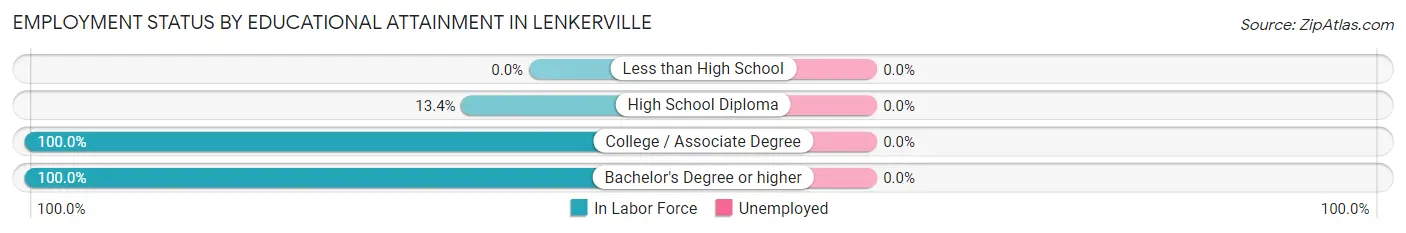
| Educational Attainment | In Labor Force | Unemployed |
| Less than High School | 0 (0.0%) | 0 (0.0%) |
| High School Diploma | 50 (13.4%) | 0 (0.0%) |
| College / Associate Degree | 36 (100.0%) | 0 (0.0%) |
| Bachelor's Degree or higher | 46 (100.0%) | 0 (0.0%) |
| Total | 132 (27.2%) | 0 (0.0%) |
Employment Occupations by Sex in Lenkerville
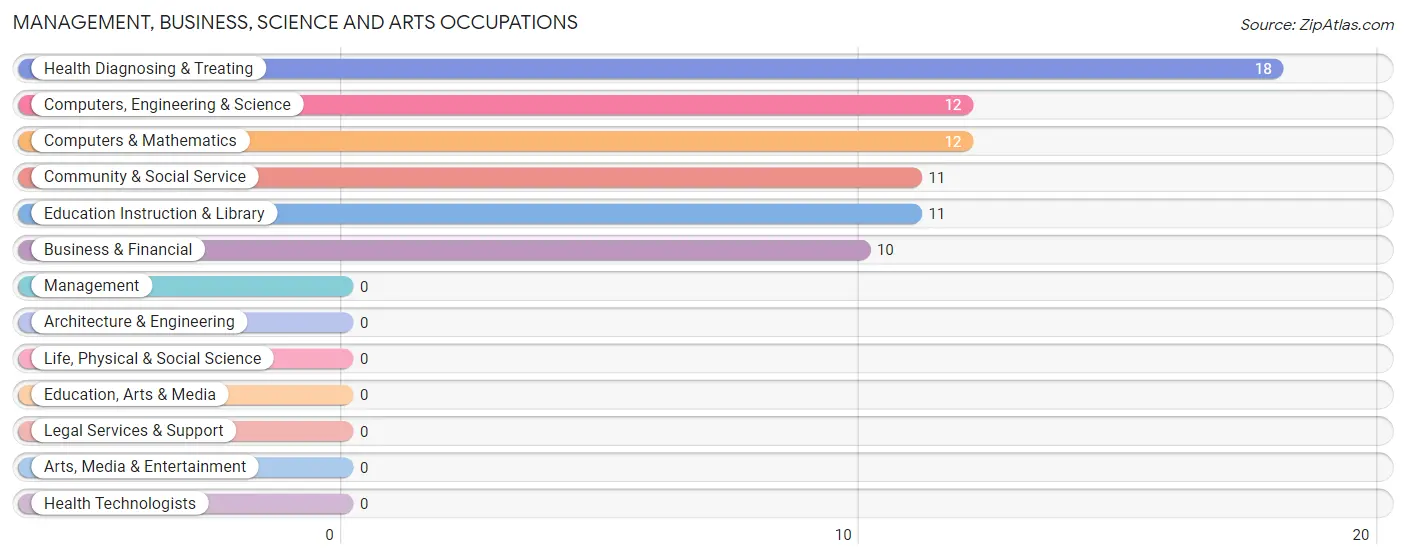
Management, Business, Science and Arts Occupations
The most common Management, Business, Science and Arts occupations in Lenkerville are Health Diagnosing & Treating (18 | 12.1%), Computers, Engineering & Science (12 | 8.1%), Computers & Mathematics (12 | 8.1%), Community & Social Service (11 | 7.4%), and Education Instruction & Library (11 | 7.4%).
Management, Business, Science and Arts Occupations by Sex
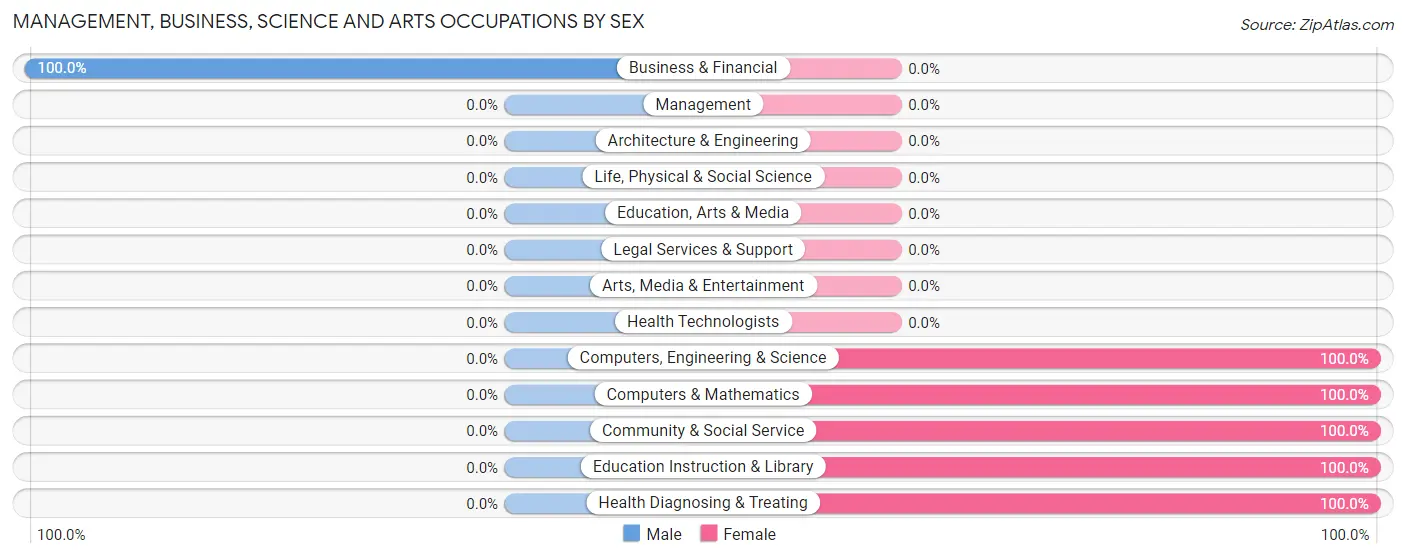
| Occupation | Male | Female |
| Management | 0 (0.0%) | 0 (0.0%) |
| Business & Financial | 10 (100.0%) | 0 (0.0%) |
| Computers, Engineering & Science | 0 (0.0%) | 12 (100.0%) |
| Computers & Mathematics | 0 (0.0%) | 12 (100.0%) |
| Architecture & Engineering | 0 (0.0%) | 0 (0.0%) |
| Life, Physical & Social Science | 0 (0.0%) | 0 (0.0%) |
| Community & Social Service | 0 (0.0%) | 11 (100.0%) |
| Education, Arts & Media | 0 (0.0%) | 0 (0.0%) |
| Legal Services & Support | 0 (0.0%) | 0 (0.0%) |
| Education Instruction & Library | 0 (0.0%) | 11 (100.0%) |
| Arts, Media & Entertainment | 0 (0.0%) | 0 (0.0%) |
| Health Diagnosing & Treating | 0 (0.0%) | 18 (100.0%) |
| Health Technologists | 0 (0.0%) | 0 (0.0%) |
| Total (Category) | 10 (19.6%) | 41 (80.4%) |
| Total (Overall) | 78 (52.3%) | 71 (47.6%) |
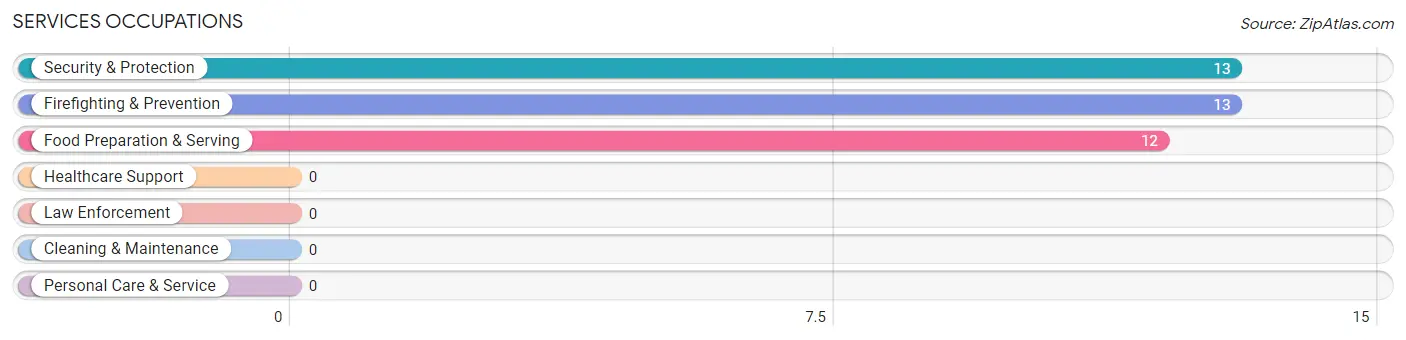
Services Occupations
The most common Services occupations in Lenkerville are Security & Protection (13 | 8.7%), Firefighting & Prevention (13 | 8.7%), and Food Preparation & Serving (12 | 8.1%).
Services Occupations by Sex
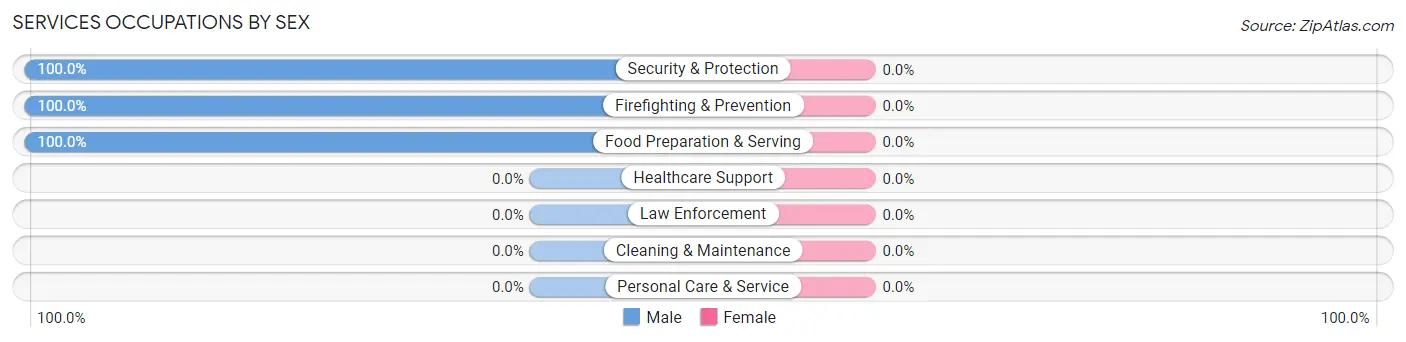
| Occupation | Male | Female |
| Healthcare Support | 0 (0.0%) | 0 (0.0%) |
| Security & Protection | 13 (100.0%) | 0 (0.0%) |
| Firefighting & Prevention | 13 (100.0%) | 0 (0.0%) |
| Law Enforcement | 0 (0.0%) | 0 (0.0%) |
| Food Preparation & Serving | 12 (100.0%) | 0 (0.0%) |
| Cleaning & Maintenance | 0 (0.0%) | 0 (0.0%) |
| Personal Care & Service | 0 (0.0%) | 0 (0.0%) |
| Total (Category) | 25 (100.0%) | 0 (0.0%) |
| Total (Overall) | 78 (52.3%) | 71 (47.6%) |
Sales and Office Occupations
The most common Sales and Office occupations in Lenkerville are , and Office & Administration (30 | 20.1%).
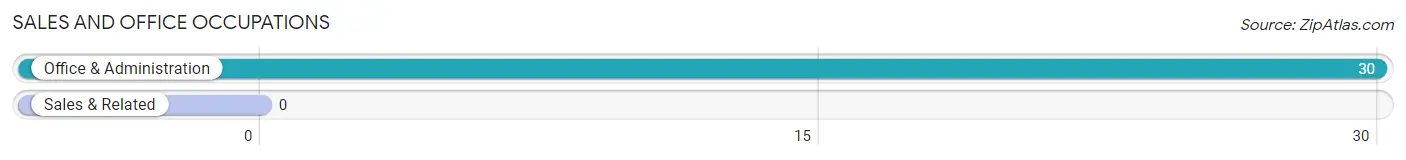
Sales and Office Occupations by Sex
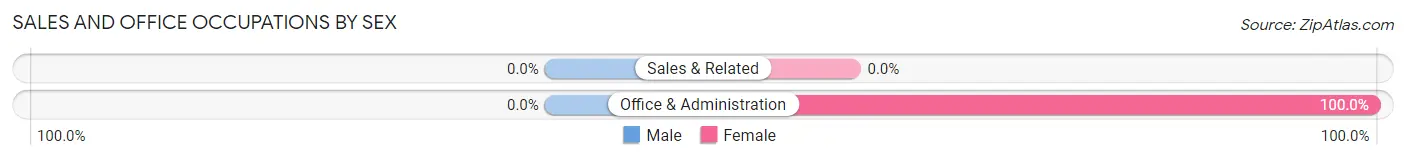
| Occupation | Male | Female |
| Sales & Related | 0 (0.0%) | 0 (0.0%) |
| Office & Administration | 0 (0.0%) | 30 (100.0%) |
| Total (Category) | 0 (0.0%) | 30 (100.0%) |
| Total (Overall) | 78 (52.3%) | 71 (47.6%) |
Natural Resources, Construction and Maintenance Occupations
The most common Natural Resources, Construction and Maintenance occupations in Lenkerville are , and Installation, Maintenance & Repair (7 | 4.7%).
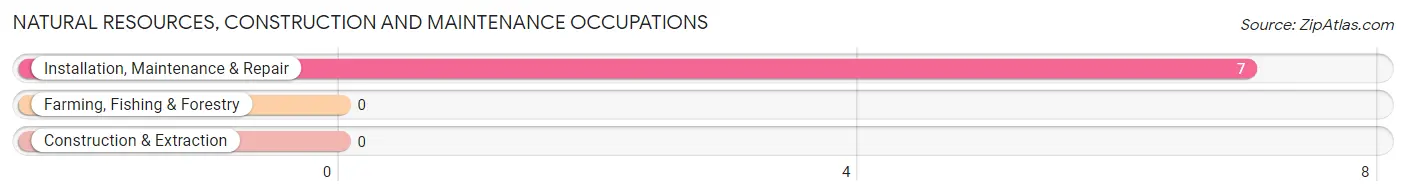
Natural Resources, Construction and Maintenance Occupations by Sex
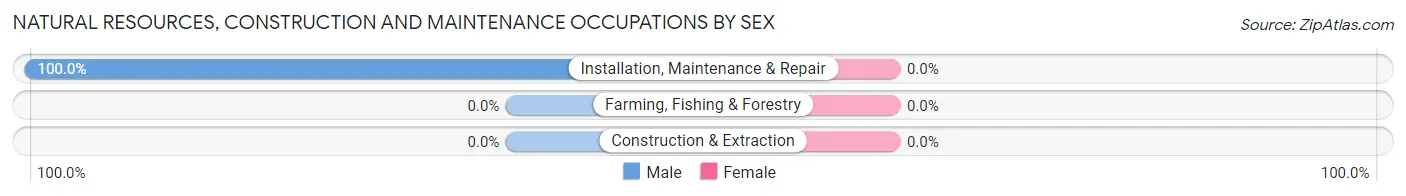
| Occupation | Male | Female |
| Farming, Fishing & Forestry | 0 (0.0%) | 0 (0.0%) |
| Construction & Extraction | 0 (0.0%) | 0 (0.0%) |
| Installation, Maintenance & Repair | 7 (100.0%) | 0 (0.0%) |
| Total (Category) | 7 (100.0%) | 0 (0.0%) |
| Total (Overall) | 78 (52.3%) | 71 (47.6%) |
Production, Transportation and Moving Occupations
The most common Production, Transportation and Moving occupations in Lenkerville are Production (25 | 16.8%), and Material Moving (11 | 7.4%).
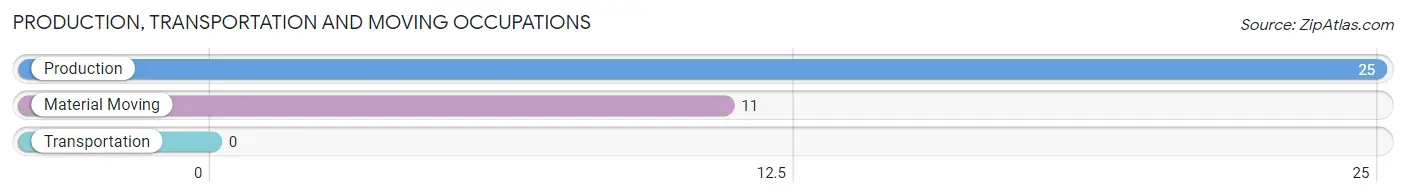
Production, Transportation and Moving Occupations by Sex
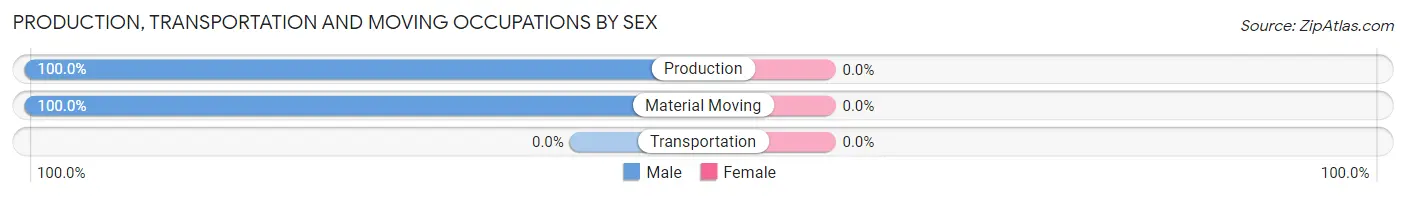
| Occupation | Male | Female |
| Production | 25 (100.0%) | 0 (0.0%) |
| Transportation | 0 (0.0%) | 0 (0.0%) |
| Material Moving | 11 (100.0%) | 0 (0.0%) |
| Total (Category) | 36 (100.0%) | 0 (0.0%) |
| Total (Overall) | 78 (52.3%) | 71 (47.6%) |
Employment Industries by Sex in Lenkerville
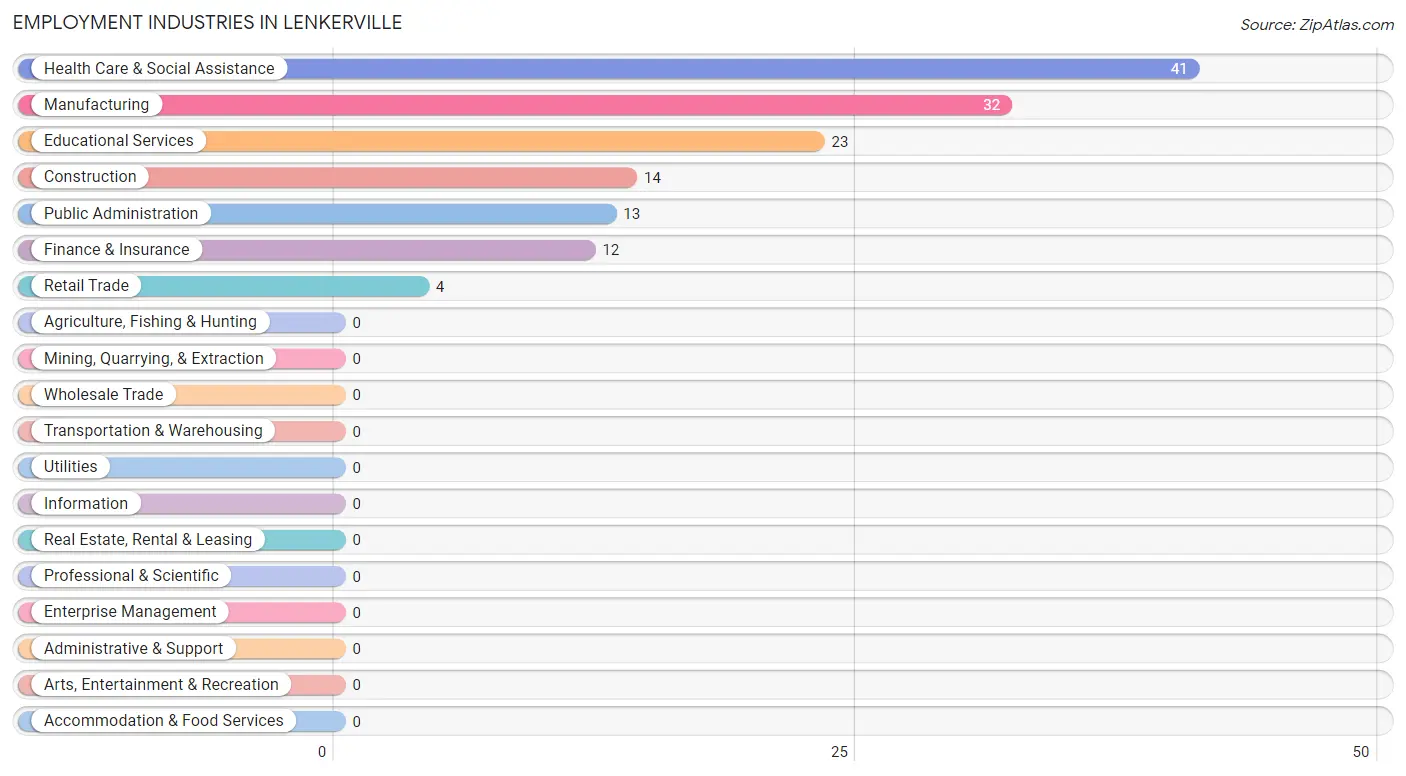
Employment Industries in Lenkerville
The major employment industries in Lenkerville include Health Care & Social Assistance (41 | 27.5%), Manufacturing (32 | 21.5%), Educational Services (23 | 15.4%), Construction (14 | 9.4%), and Public Administration (13 | 8.7%).
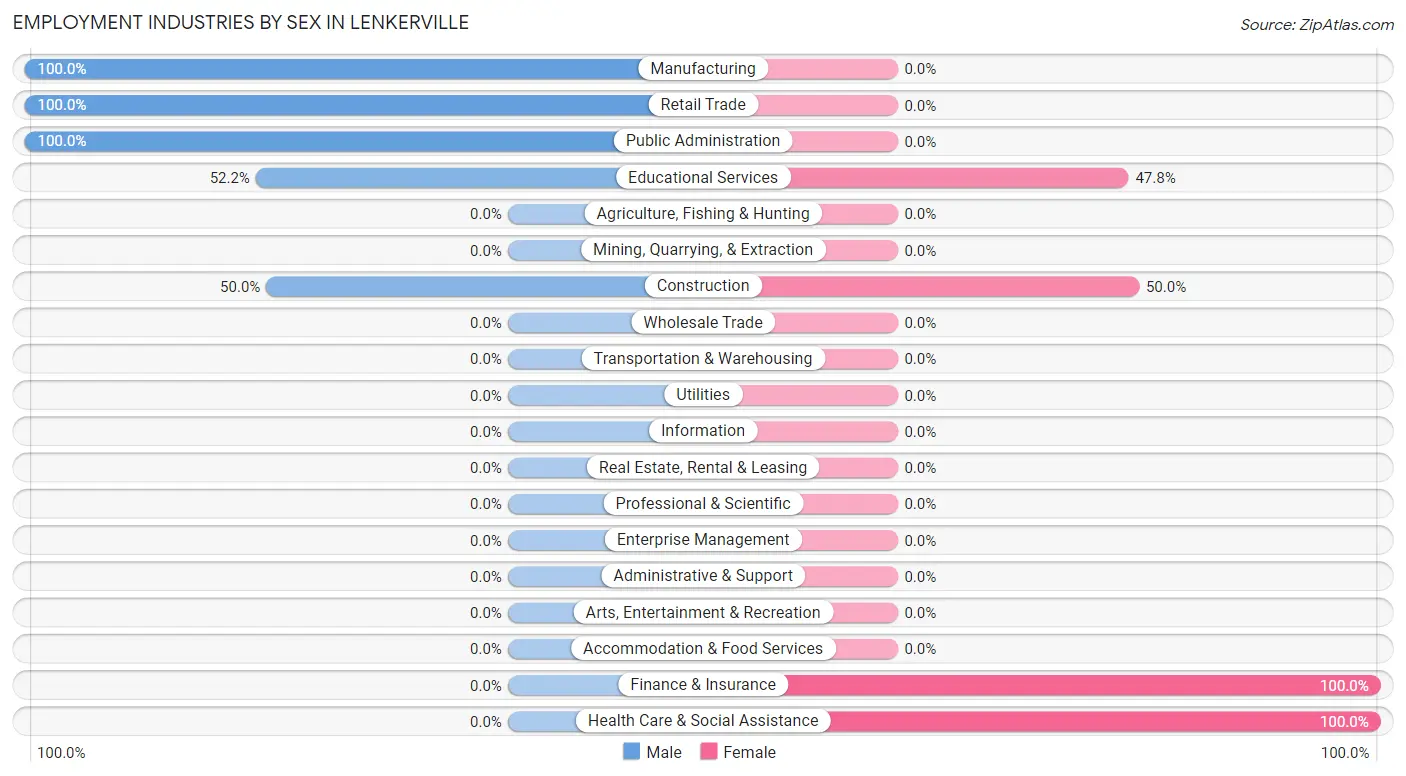
Employment Industries by Sex in Lenkerville
The Lenkerville industries that see more men than women are Manufacturing (100.0%), Retail Trade (100.0%), and Public Administration (100.0%), whereas the industries that tend to have a higher number of women are Finance & Insurance (100.0%), Health Care & Social Assistance (100.0%), and Construction (50.0%).
| Industry | Male | Female |
| Agriculture, Fishing & Hunting | 0 (0.0%) | 0 (0.0%) |
| Mining, Quarrying, & Extraction | 0 (0.0%) | 0 (0.0%) |
| Construction | 7 (50.0%) | 7 (50.0%) |
| Manufacturing | 32 (100.0%) | 0 (0.0%) |
| Wholesale Trade | 0 (0.0%) | 0 (0.0%) |
| Retail Trade | 4 (100.0%) | 0 (0.0%) |
| Transportation & Warehousing | 0 (0.0%) | 0 (0.0%) |
| Utilities | 0 (0.0%) | 0 (0.0%) |
| Information | 0 (0.0%) | 0 (0.0%) |
| Finance & Insurance | 0 (0.0%) | 12 (100.0%) |
| Real Estate, Rental & Leasing | 0 (0.0%) | 0 (0.0%) |
| Professional & Scientific | 0 (0.0%) | 0 (0.0%) |
| Enterprise Management | 0 (0.0%) | 0 (0.0%) |
| Administrative & Support | 0 (0.0%) | 0 (0.0%) |
| Educational Services | 12 (52.2%) | 11 (47.8%) |
| Health Care & Social Assistance | 0 (0.0%) | 41 (100.0%) |
| Arts, Entertainment & Recreation | 0 (0.0%) | 0 (0.0%) |
| Accommodation & Food Services | 0 (0.0%) | 0 (0.0%) |
| Public Administration | 13 (100.0%) | 0 (0.0%) |
| Total | 78 (52.3%) | 71 (47.6%) |
Education in Lenkerville
School Enrollment in Lenkerville
The most common levels of schooling among the 185 students in Lenkerville are high school (153 | 82.7%), kindergarten (11 | 5.9%), and middle school (11 | 5.9%).
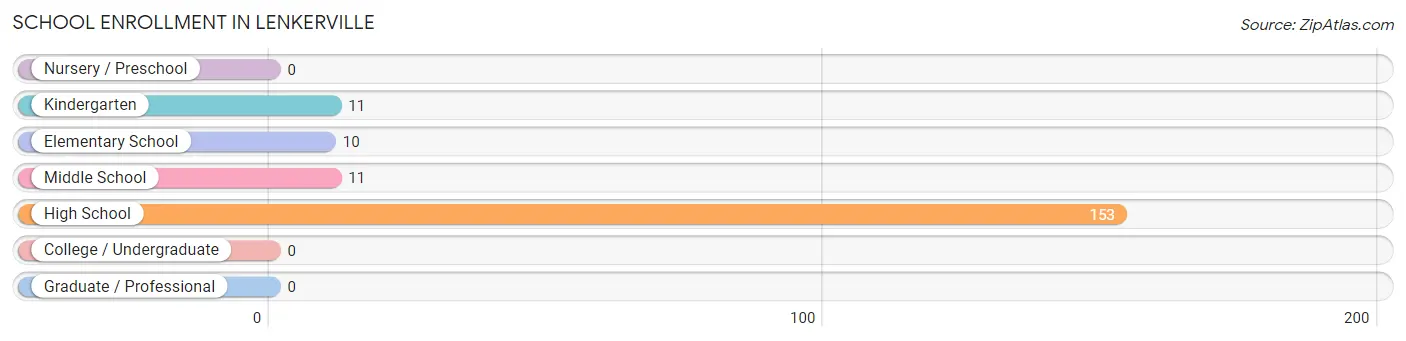
| School Level | # Students | % Students |
| Nursery / Preschool | 0 | 0.0% |
| Kindergarten | 11 | 5.9% |
| Elementary School | 10 | 5.4% |
| Middle School | 11 | 5.9% |
| High School | 153 | 82.7% |
| College / Undergraduate | 0 | 0.0% |
| Graduate / Professional | 0 | 0.0% |
| Total | 185 | 100.0% |
School Enrollment by Age by Funding Source in Lenkerville
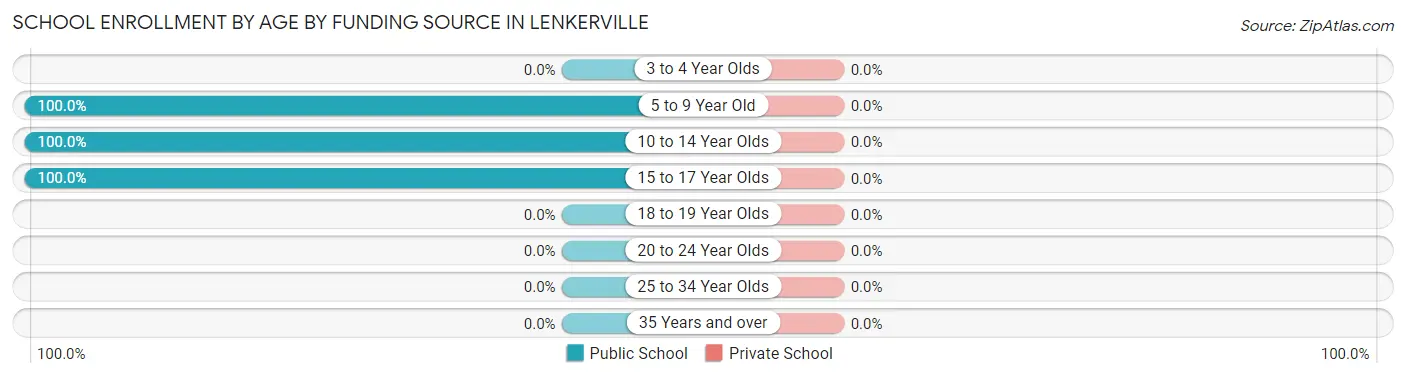
| Age Bracket | Public School | Private School |
| 3 to 4 Year Olds | 0 (0.0%) | 0 (0.0%) |
| 5 to 9 Year Old | 21 (100.0%) | 0 (0.0%) |
| 10 to 14 Year Olds | 11 (100.0%) | 0 (0.0%) |
| 15 to 17 Year Olds | 153 (100.0%) | 0 (0.0%) |
| 18 to 19 Year Olds | 0 (0.0%) | 0 (0.0%) |
| 20 to 24 Year Olds | 0 (0.0%) | 0 (0.0%) |
| 25 to 34 Year Olds | 0 (0.0%) | 0 (0.0%) |
| 35 Years and over | 0 (0.0%) | 0 (0.0%) |
| Total | 185 (100.0%) | 0 (0.0%) |
Educational Attainment by Field of Study in Lenkerville
Arts & humanities (13 | 28.3%), bio, nature & agricultural (12 | 26.1%), education (11 | 23.9%), and business (10 | 21.7%) are the most common fields of study among 46 individuals in Lenkerville who have obtained a bachelor's degree or higher.
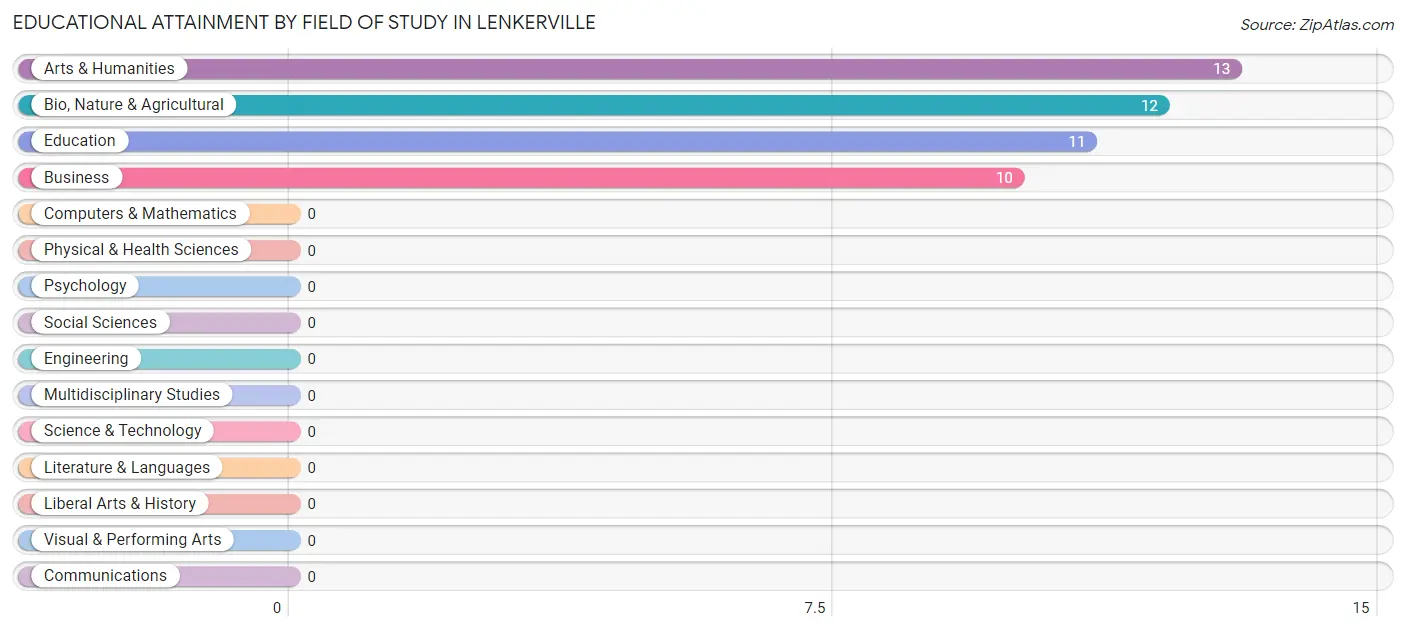
| Field of Study | # Graduates | % Graduates |
| Computers & Mathematics | 0 | 0.0% |
| Bio, Nature & Agricultural | 12 | 26.1% |
| Physical & Health Sciences | 0 | 0.0% |
| Psychology | 0 | 0.0% |
| Social Sciences | 0 | 0.0% |
| Engineering | 0 | 0.0% |
| Multidisciplinary Studies | 0 | 0.0% |
| Science & Technology | 0 | 0.0% |
| Business | 10 | 21.7% |
| Education | 11 | 23.9% |
| Literature & Languages | 0 | 0.0% |
| Liberal Arts & History | 0 | 0.0% |
| Visual & Performing Arts | 0 | 0.0% |
| Communications | 0 | 0.0% |
| Arts & Humanities | 13 | 28.3% |
| Total | 46 | 100.0% |
Transportation & Commute in Lenkerville
Vehicle Availability by Sex in Lenkerville
The most prevalent vehicle ownership categories in Lenkerville are males with 2 vehicles (51, accounting for 56.7%) and females with 2 vehicles (30, making up 71.8%).
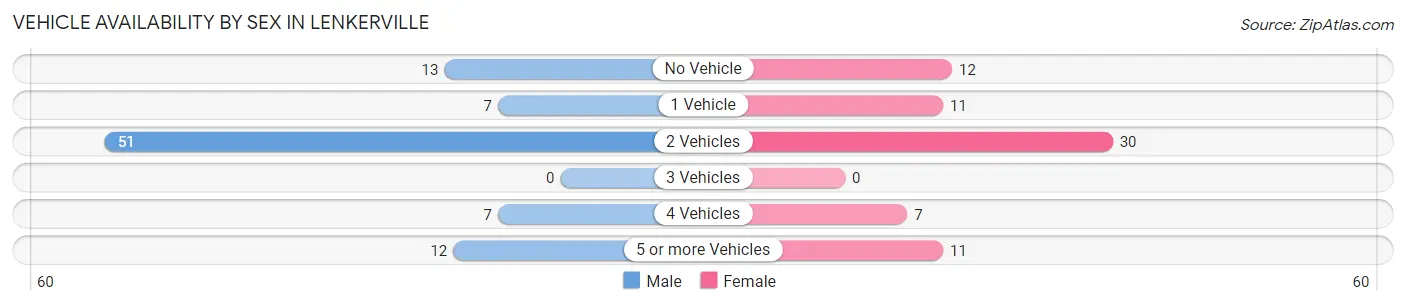
| Vehicles Available | Male | Female |
| No Vehicle | 13 (14.4%) | 12 (16.9%) |
| 1 Vehicle | 7 (7.8%) | 11 (15.5%) |
| 2 Vehicles | 51 (56.7%) | 30 (42.2%) |
| 3 Vehicles | 0 (0.0%) | 0 (0.0%) |
| 4 Vehicles | 7 (7.8%) | 7 (9.9%) |
| 5 or more Vehicles | 12 (13.3%) | 11 (15.5%) |
| Total | 90 (100.0%) | 71 (100.0%) |
Commute Time in Lenkerville
The most frequently occuring commute durations in Lenkerville are 45 to 59 minutes (74 commuters, 46.0%), 5 to 9 minutes (38 commuters, 23.6%), and 30 to 34 minutes (24 commuters, 14.9%).
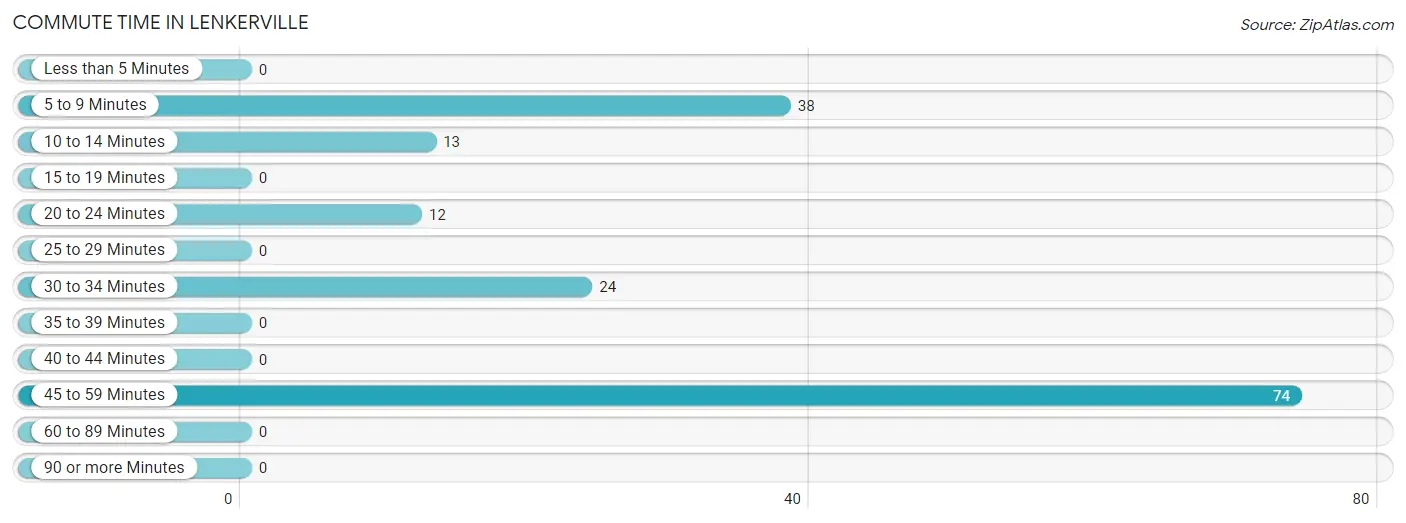
| Commute Time | # Commuters | % Commuters |
| Less than 5 Minutes | 0 | 0.0% |
| 5 to 9 Minutes | 38 | 23.6% |
| 10 to 14 Minutes | 13 | 8.1% |
| 15 to 19 Minutes | 0 | 0.0% |
| 20 to 24 Minutes | 12 | 7.4% |
| 25 to 29 Minutes | 0 | 0.0% |
| 30 to 34 Minutes | 24 | 14.9% |
| 35 to 39 Minutes | 0 | 0.0% |
| 40 to 44 Minutes | 0 | 0.0% |
| 45 to 59 Minutes | 74 | 46.0% |
| 60 to 89 Minutes | 0 | 0.0% |
| 90 or more Minutes | 0 | 0.0% |
Commute Time by Sex in Lenkerville
The most common commute times in Lenkerville are 45 to 59 minutes (44 commuters, 48.9%) for males and 5 to 9 minutes (34 commuters, 47.9%) for females.
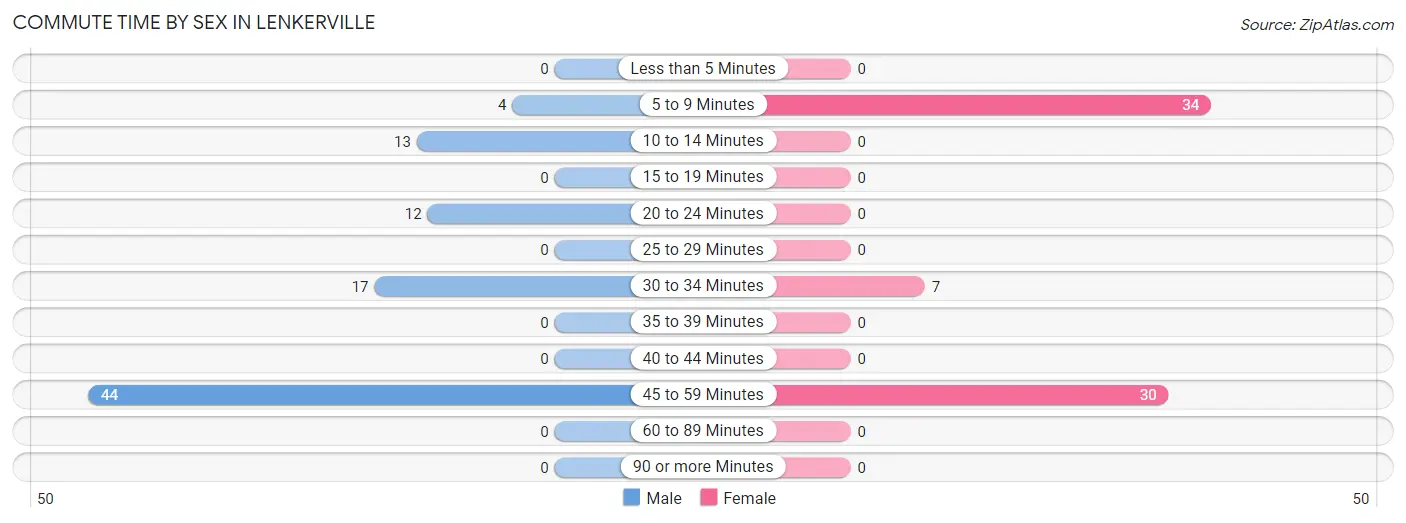
| Commute Time | Male | Female |
| Less than 5 Minutes | 0 (0.0%) | 0 (0.0%) |
| 5 to 9 Minutes | 4 (4.4%) | 34 (47.9%) |
| 10 to 14 Minutes | 13 (14.4%) | 0 (0.0%) |
| 15 to 19 Minutes | 0 (0.0%) | 0 (0.0%) |
| 20 to 24 Minutes | 12 (13.3%) | 0 (0.0%) |
| 25 to 29 Minutes | 0 (0.0%) | 0 (0.0%) |
| 30 to 34 Minutes | 17 (18.9%) | 7 (9.9%) |
| 35 to 39 Minutes | 0 (0.0%) | 0 (0.0%) |
| 40 to 44 Minutes | 0 (0.0%) | 0 (0.0%) |
| 45 to 59 Minutes | 44 (48.9%) | 30 (42.2%) |
| 60 to 89 Minutes | 0 (0.0%) | 0 (0.0%) |
| 90 or more Minutes | 0 (0.0%) | 0 (0.0%) |
Time of Departure to Work by Sex in Lenkerville
The most frequent times of departure to work in Lenkerville are 6:30 AM to 6:59 AM (27, 30.0%) for males and 6:30 AM to 6:59 AM (31, 43.7%) for females.
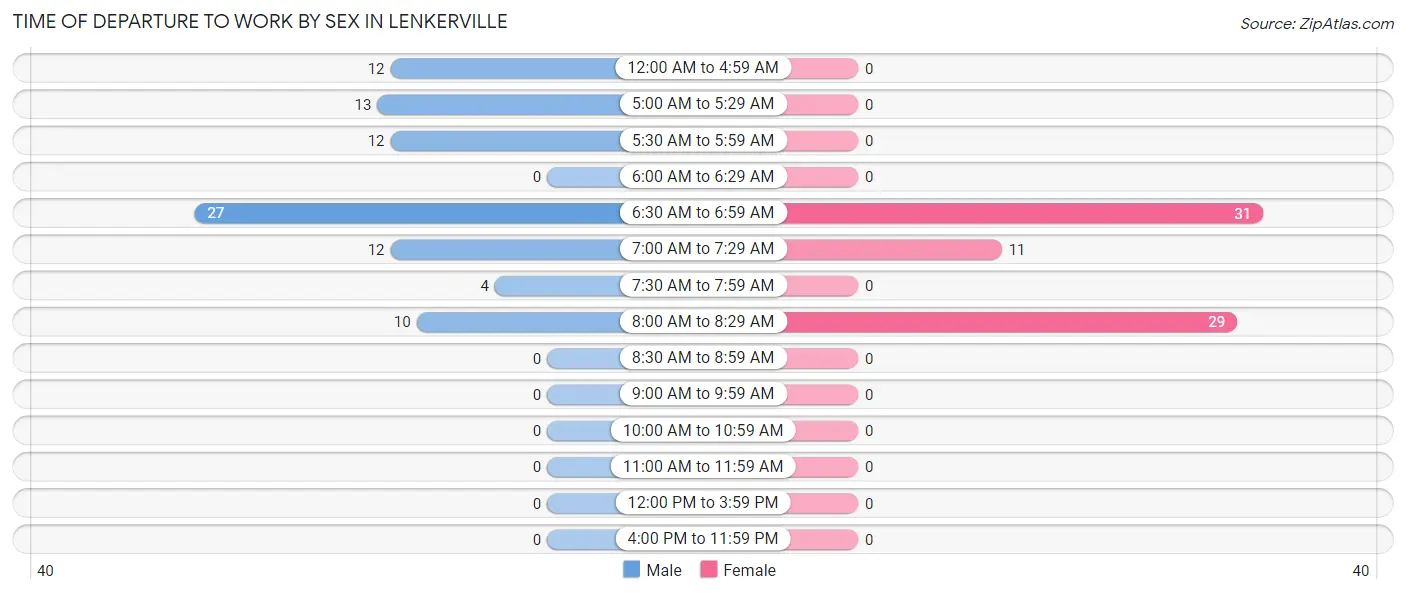
| Time of Departure | Male | Female |
| 12:00 AM to 4:59 AM | 12 (13.3%) | 0 (0.0%) |
| 5:00 AM to 5:29 AM | 13 (14.4%) | 0 (0.0%) |
| 5:30 AM to 5:59 AM | 12 (13.3%) | 0 (0.0%) |
| 6:00 AM to 6:29 AM | 0 (0.0%) | 0 (0.0%) |
| 6:30 AM to 6:59 AM | 27 (30.0%) | 31 (43.7%) |
| 7:00 AM to 7:29 AM | 12 (13.3%) | 11 (15.5%) |
| 7:30 AM to 7:59 AM | 4 (4.4%) | 0 (0.0%) |
| 8:00 AM to 8:29 AM | 10 (11.1%) | 29 (40.8%) |
| 8:30 AM to 8:59 AM | 0 (0.0%) | 0 (0.0%) |
| 9:00 AM to 9:59 AM | 0 (0.0%) | 0 (0.0%) |
| 10:00 AM to 10:59 AM | 0 (0.0%) | 0 (0.0%) |
| 11:00 AM to 11:59 AM | 0 (0.0%) | 0 (0.0%) |
| 12:00 PM to 3:59 PM | 0 (0.0%) | 0 (0.0%) |
| 4:00 PM to 11:59 PM | 0 (0.0%) | 0 (0.0%) |
| Total | 90 (100.0%) | 71 (100.0%) |
Housing Occupancy in Lenkerville
Occupancy by Ownership in Lenkerville
Of the total 328 dwellings in Lenkerville, owner-occupied units account for 275 (83.8%), while renter-occupied units make up 53 (16.2%).
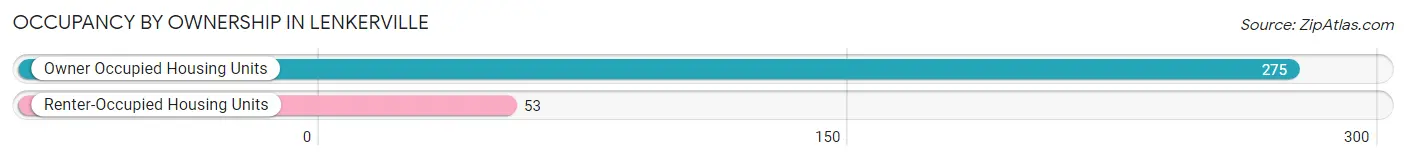
| Occupancy | # Housing Units | % Housing Units |
| Owner Occupied Housing Units | 275 | 83.8% |
| Renter-Occupied Housing Units | 53 | 16.2% |
| Total Occupied Housing Units | 328 | 100.0% |
Occupancy by Household Size in Lenkerville
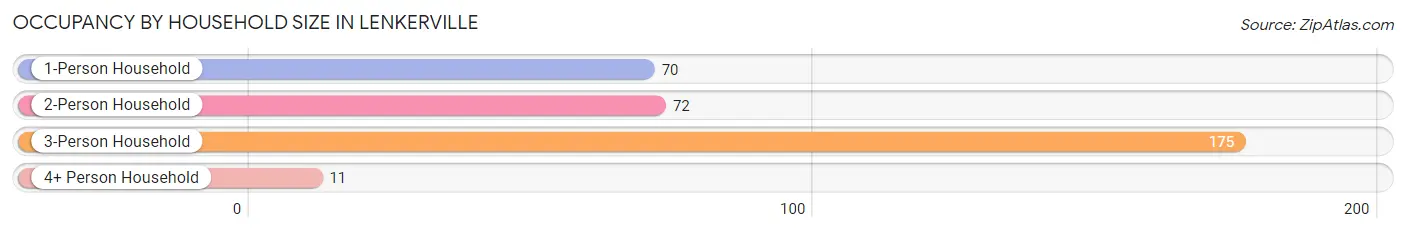
| Household Size | # Housing Units | % Housing Units |
| 1-Person Household | 70 | 21.3% |
| 2-Person Household | 72 | 22.0% |
| 3-Person Household | 175 | 53.3% |
| 4+ Person Household | 11 | 3.4% |
| Total Housing Units | 328 | 100.0% |
Occupancy by Ownership by Household Size in Lenkerville
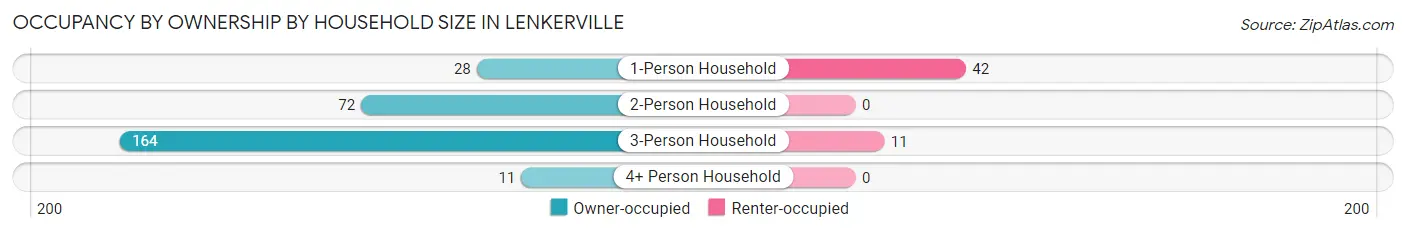
| Household Size | Owner-occupied | Renter-occupied |
| 1-Person Household | 28 (40.0%) | 42 (60.0%) |
| 2-Person Household | 72 (100.0%) | 0 (0.0%) |
| 3-Person Household | 164 (93.7%) | 11 (6.3%) |
| 4+ Person Household | 11 (100.0%) | 0 (0.0%) |
| Total Housing Units | 275 (83.8%) | 53 (16.2%) |
Occupancy by Educational Attainment in Lenkerville
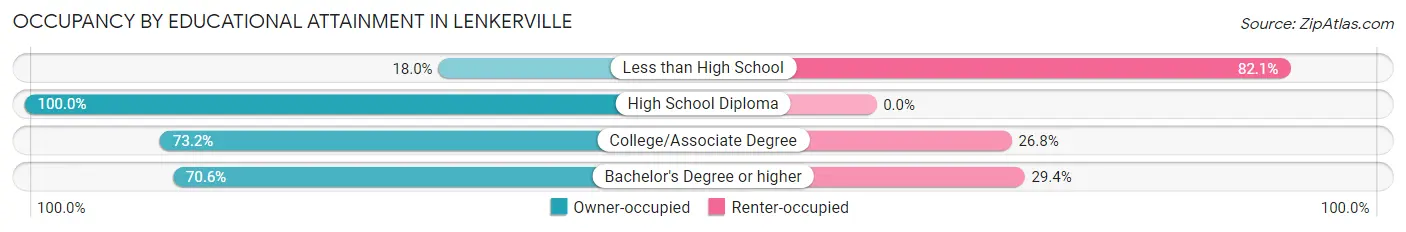
| Household Size | Owner-occupied | Renter-occupied |
| Less than High School | 7 (17.9%) | 32 (82.1%) |
| High School Diploma | 214 (100.0%) | 0 (0.0%) |
| College/Associate Degree | 30 (73.2%) | 11 (26.8%) |
| Bachelor's Degree or higher | 24 (70.6%) | 10 (29.4%) |
Occupancy by Age of Householder in Lenkerville
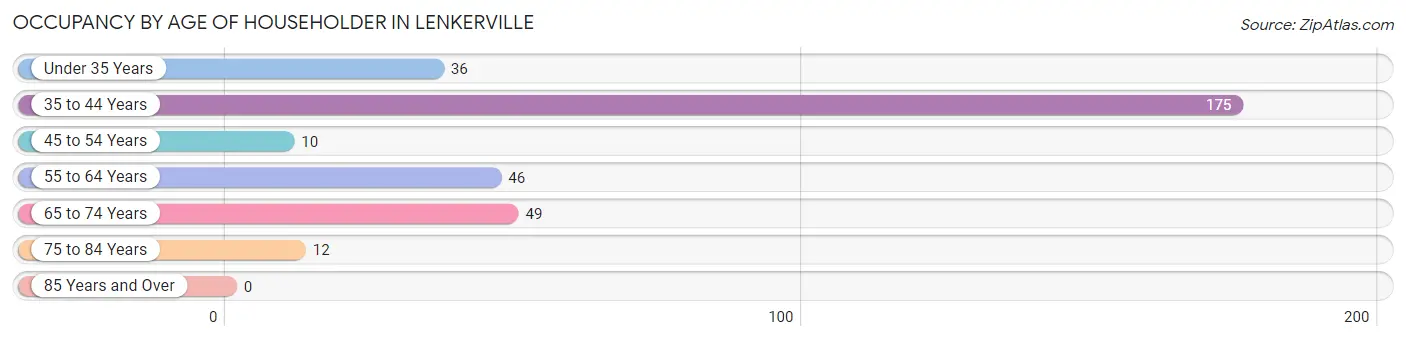
| Age Bracket | # Households | % Households |
| Under 35 Years | 36 | 11.0% |
| 35 to 44 Years | 175 | 53.3% |
| 45 to 54 Years | 10 | 3.0% |
| 55 to 64 Years | 46 | 14.0% |
| 65 to 74 Years | 49 | 14.9% |
| 75 to 84 Years | 12 | 3.7% |
| 85 Years and Over | 0 | 0.0% |
| Total | 328 | 100.0% |
Housing Finances in Lenkerville
Median Income by Occupancy in Lenkerville
| Occupancy Type | # Households | Median Income |
| Owner-Occupied | 275 (83.8%) | $0 |
| Renter-Occupied | 53 (16.2%) | $0 |
| Average | 328 (100.0%) | $0 |
Occupancy by Householder Income Bracket in Lenkerville
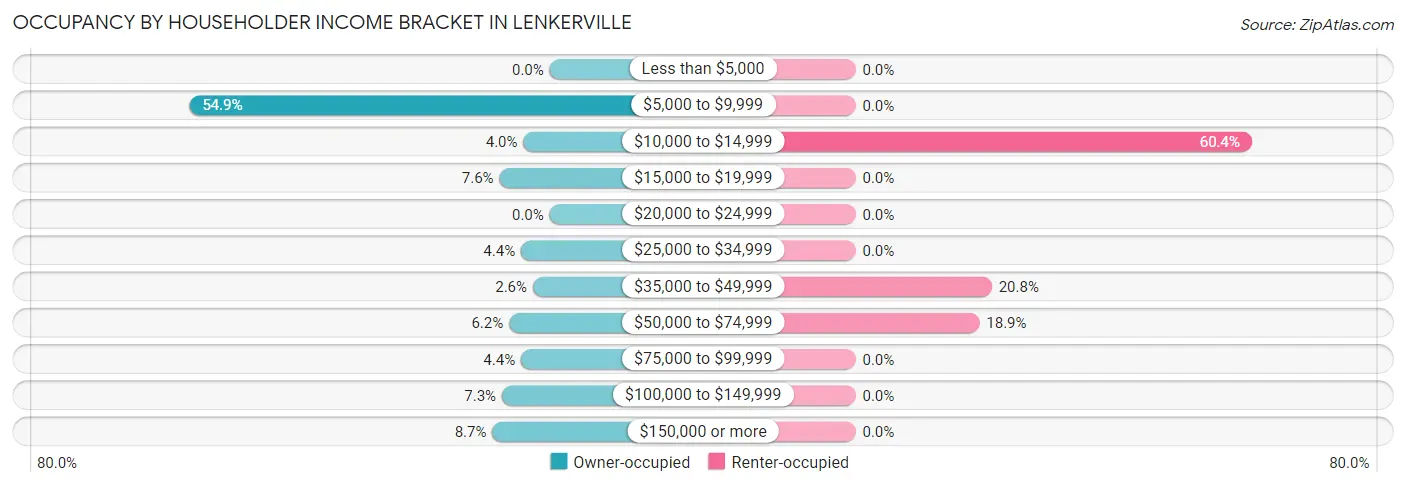
| Income Bracket | Owner-occupied | Renter-occupied |
| Less than $5,000 | 0 (0.0%) | 0 (0.0%) |
| $5,000 to $9,999 | 151 (54.9%) | 0 (0.0%) |
| $10,000 to $14,999 | 11 (4.0%) | 32 (60.4%) |
| $15,000 to $19,999 | 21 (7.6%) | 0 (0.0%) |
| $20,000 to $24,999 | 0 (0.0%) | 0 (0.0%) |
| $25,000 to $34,999 | 12 (4.4%) | 0 (0.0%) |
| $35,000 to $49,999 | 7 (2.5%) | 11 (20.7%) |
| $50,000 to $74,999 | 17 (6.2%) | 10 (18.9%) |
| $75,000 to $99,999 | 12 (4.4%) | 0 (0.0%) |
| $100,000 to $149,999 | 20 (7.3%) | 0 (0.0%) |
| $150,000 or more | 24 (8.7%) | 0 (0.0%) |
| Total | 275 (100.0%) | 53 (100.0%) |
Monthly Housing Cost Tiers in Lenkerville
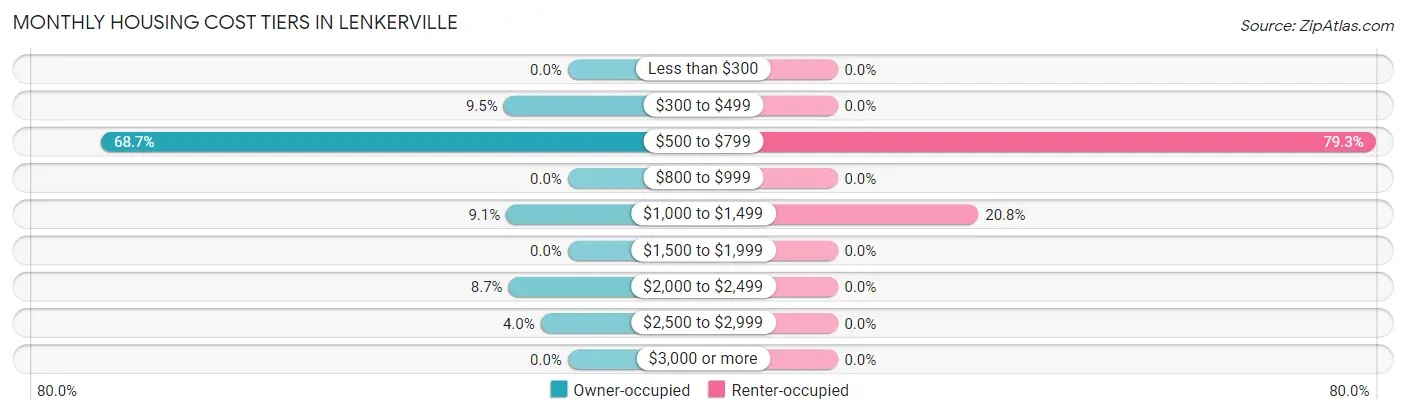
| Monthly Cost | Owner-occupied | Renter-occupied |
| Less than $300 | 0 (0.0%) | 0 (0.0%) |
| $300 to $499 | 26 (9.5%) | 0 (0.0%) |
| $500 to $799 | 189 (68.7%) | 42 (79.2%) |
| $800 to $999 | 0 (0.0%) | 0 (0.0%) |
| $1,000 to $1,499 | 25 (9.1%) | 11 (20.7%) |
| $1,500 to $1,999 | 0 (0.0%) | 0 (0.0%) |
| $2,000 to $2,499 | 24 (8.7%) | 0 (0.0%) |
| $2,500 to $2,999 | 11 (4.0%) | 0 (0.0%) |
| $3,000 or more | 0 (0.0%) | 0 (0.0%) |
| Total | 275 (100.0%) | 53 (100.0%) |
Physical Housing Characteristics in Lenkerville
Housing Structures in Lenkerville
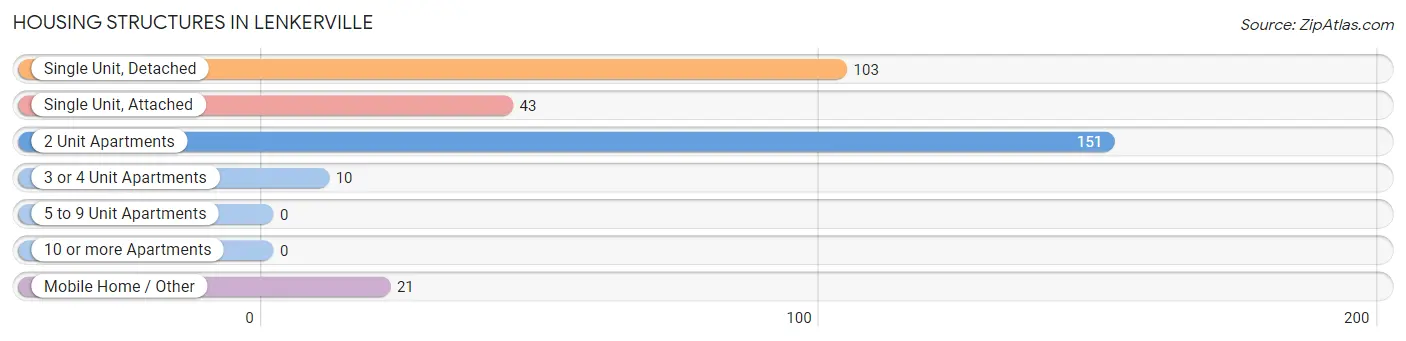
| Structure Type | # Housing Units | % Housing Units |
| Single Unit, Detached | 103 | 31.4% |
| Single Unit, Attached | 43 | 13.1% |
| 2 Unit Apartments | 151 | 46.0% |
| 3 or 4 Unit Apartments | 10 | 3.0% |
| 5 to 9 Unit Apartments | 0 | 0.0% |
| 10 or more Apartments | 0 | 0.0% |
| Mobile Home / Other | 21 | 6.4% |
| Total | 328 | 100.0% |
Housing Structures by Occupancy in Lenkerville
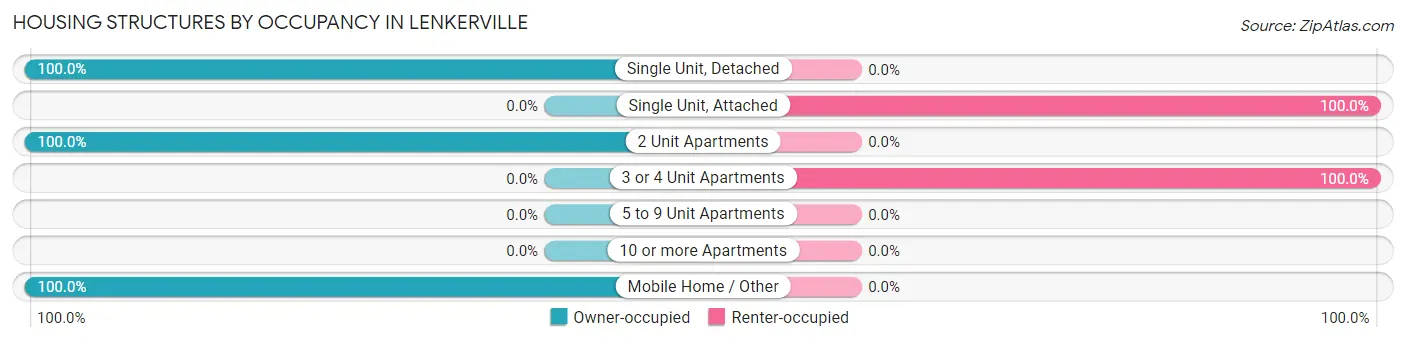
| Structure Type | Owner-occupied | Renter-occupied |
| Single Unit, Detached | 103 (100.0%) | 0 (0.0%) |
| Single Unit, Attached | 0 (0.0%) | 43 (100.0%) |
| 2 Unit Apartments | 151 (100.0%) | 0 (0.0%) |
| 3 or 4 Unit Apartments | 0 (0.0%) | 10 (100.0%) |
| 5 to 9 Unit Apartments | 0 (0.0%) | 0 (0.0%) |
| 10 or more Apartments | 0 (0.0%) | 0 (0.0%) |
| Mobile Home / Other | 21 (100.0%) | 0 (0.0%) |
| Total | 275 (83.8%) | 53 (16.2%) |
Housing Structures by Number of Rooms in Lenkerville
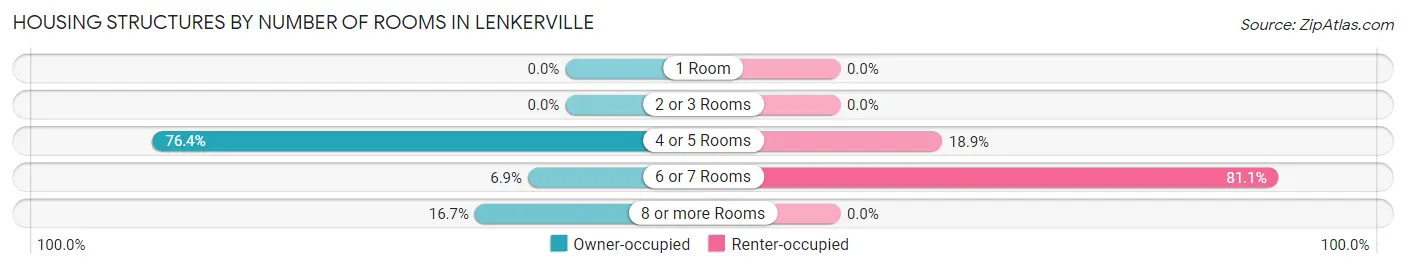
| Number of Rooms | Owner-occupied | Renter-occupied |
| 1 Room | 0 (0.0%) | 0 (0.0%) |
| 2 or 3 Rooms | 0 (0.0%) | 0 (0.0%) |
| 4 or 5 Rooms | 210 (76.4%) | 10 (18.9%) |
| 6 or 7 Rooms | 19 (6.9%) | 43 (81.1%) |
| 8 or more Rooms | 46 (16.7%) | 0 (0.0%) |
| Total | 275 (100.0%) | 53 (100.0%) |
Housing Structure by Heating Type in Lenkerville
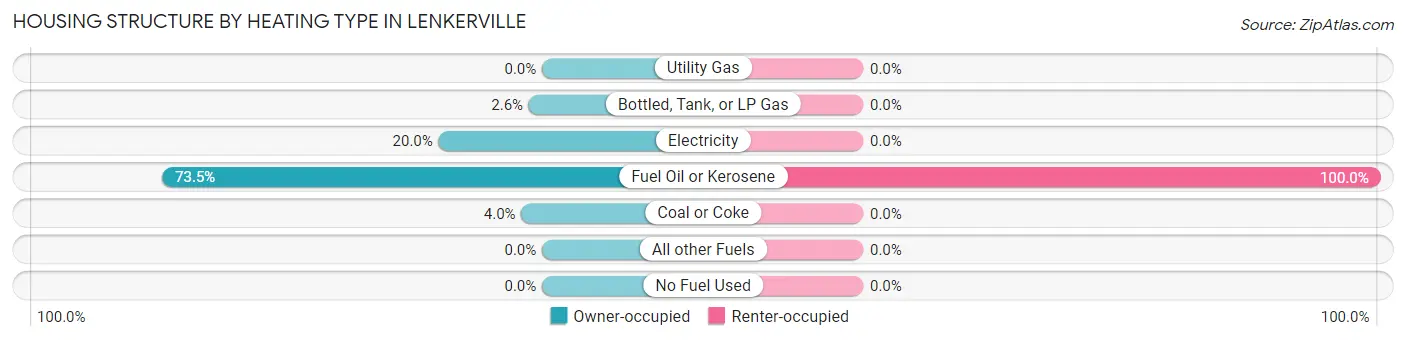
| Heating Type | Owner-occupied | Renter-occupied |
| Utility Gas | 0 (0.0%) | 0 (0.0%) |
| Bottled, Tank, or LP Gas | 7 (2.5%) | 0 (0.0%) |
| Electricity | 55 (20.0%) | 0 (0.0%) |
| Fuel Oil or Kerosene | 202 (73.5%) | 53 (100.0%) |
| Coal or Coke | 11 (4.0%) | 0 (0.0%) |
| All other Fuels | 0 (0.0%) | 0 (0.0%) |
| No Fuel Used | 0 (0.0%) | 0 (0.0%) |
| Total | 275 (100.0%) | 53 (100.0%) |
Household Vehicle Usage in Lenkerville
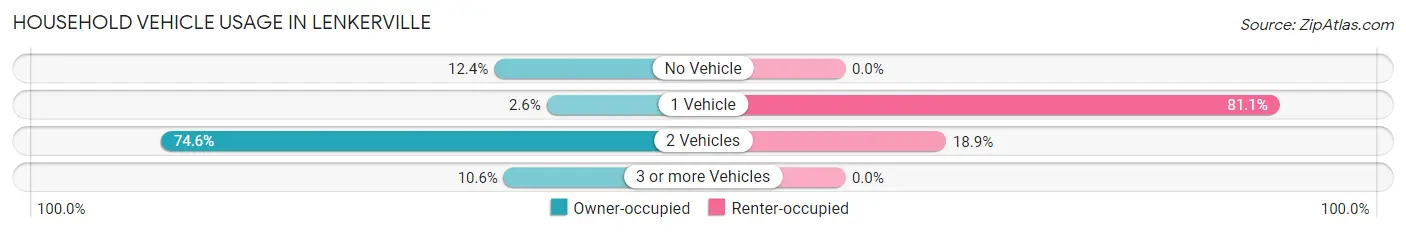
| Vehicles per Household | Owner-occupied | Renter-occupied |
| No Vehicle | 34 (12.4%) | 0 (0.0%) |
| 1 Vehicle | 7 (2.5%) | 43 (81.1%) |
| 2 Vehicles | 205 (74.6%) | 10 (18.9%) |
| 3 or more Vehicles | 29 (10.5%) | 0 (0.0%) |
| Total | 275 (100.0%) | 53 (100.0%) |
Real Estate & Mortgages in Lenkerville
Real Estate and Mortgage Overview in Lenkerville
| Characteristic | Without Mortgage | With Mortgage |
| Housing Units | 64 | 211 |
| Median Property Value | $134,700 | $0 |
| Median Household Income | $34,792 | $24 |
| Monthly Housing Costs | $529 | $0 |
| Real Estate Taxes | $1,400 | $0 |
Property Value by Mortgage Status in Lenkerville
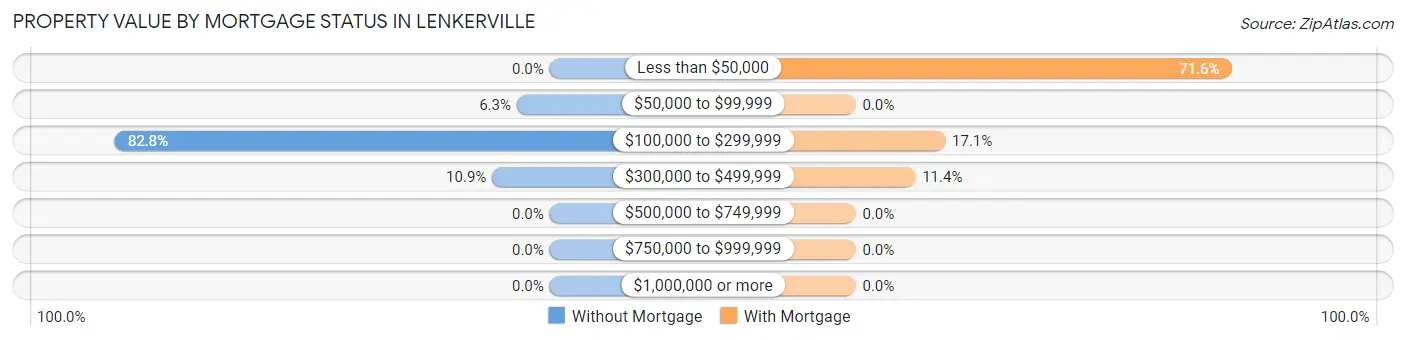
| Property Value | Without Mortgage | With Mortgage |
| Less than $50,000 | 0 (0.0%) | 151 (71.6%) |
| $50,000 to $99,999 | 4 (6.2%) | 0 (0.0%) |
| $100,000 to $299,999 | 53 (82.8%) | 36 (17.1%) |
| $300,000 to $499,999 | 7 (10.9%) | 24 (11.4%) |
| $500,000 to $749,999 | 0 (0.0%) | 0 (0.0%) |
| $750,000 to $999,999 | 0 (0.0%) | 0 (0.0%) |
| $1,000,000 or more | 0 (0.0%) | 0 (0.0%) |
| Total | 64 (100.0%) | 211 (100.0%) |
Household Income by Mortgage Status in Lenkerville
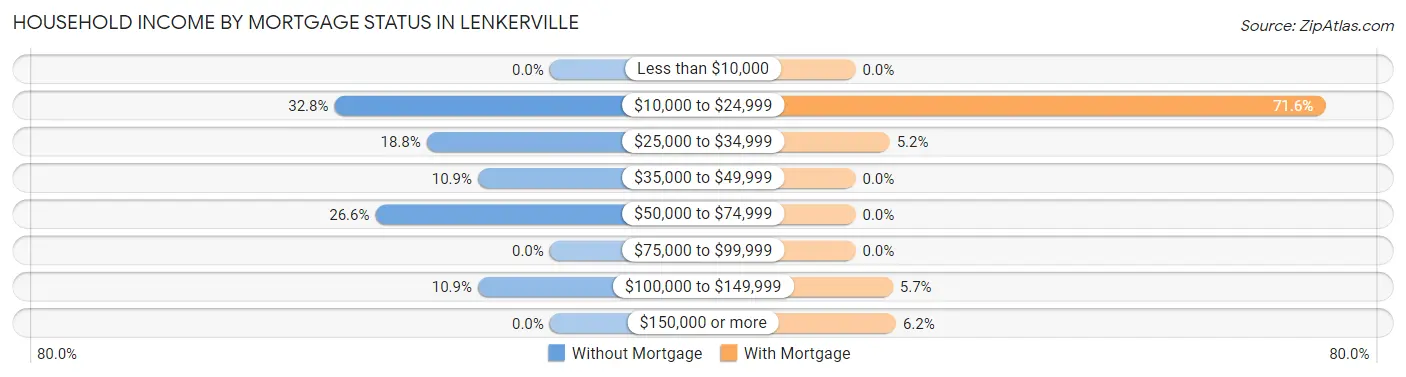
| Household Income | Without Mortgage | With Mortgage |
| Less than $10,000 | 0 (0.0%) | 0 (0.0%) |
| $10,000 to $24,999 | 21 (32.8%) | 151 (71.6%) |
| $25,000 to $34,999 | 12 (18.8%) | 11 (5.2%) |
| $35,000 to $49,999 | 7 (10.9%) | 0 (0.0%) |
| $50,000 to $74,999 | 17 (26.6%) | 0 (0.0%) |
| $75,000 to $99,999 | 0 (0.0%) | 0 (0.0%) |
| $100,000 to $149,999 | 7 (10.9%) | 12 (5.7%) |
| $150,000 or more | 0 (0.0%) | 13 (6.2%) |
| Total | 64 (100.0%) | 211 (100.0%) |
Property Value to Household Income Ratio in Lenkerville
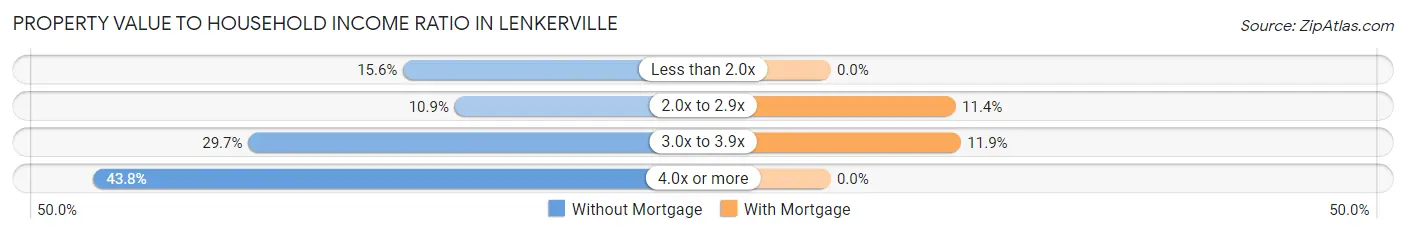
| Value-to-Income Ratio | Without Mortgage | With Mortgage |
| Less than 2.0x | 10 (15.6%) | 0 (0.0%) |
| 2.0x to 2.9x | 7 (10.9%) | 24 (11.4%) |
| 3.0x to 3.9x | 19 (29.7%) | 25 (11.8%) |
| 4.0x or more | 28 (43.8%) | 0 (0.0%) |
| Total | 64 (100.0%) | 211 (100.0%) |
Real Estate Taxes by Mortgage Status in Lenkerville
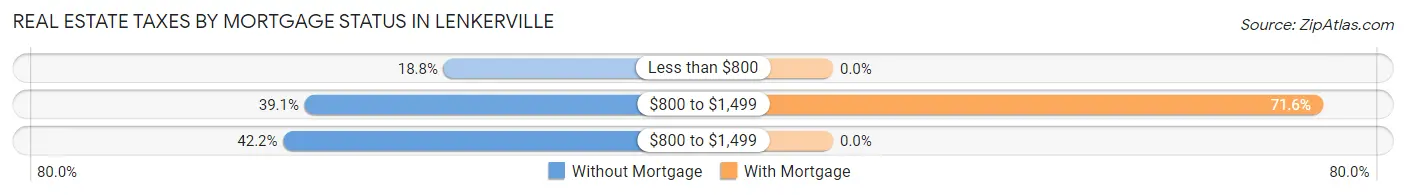
| Property Taxes | Without Mortgage | With Mortgage |
| Less than $800 | 12 (18.8%) | 0 (0.0%) |
| $800 to $1,499 | 25 (39.1%) | 151 (71.6%) |
| $800 to $1,499 | 27 (42.2%) | 0 (0.0%) |
| Total | 64 (100.0%) | 211 (100.0%) |
Health & Disability in Lenkerville
Health Insurance Coverage by Age in Lenkerville
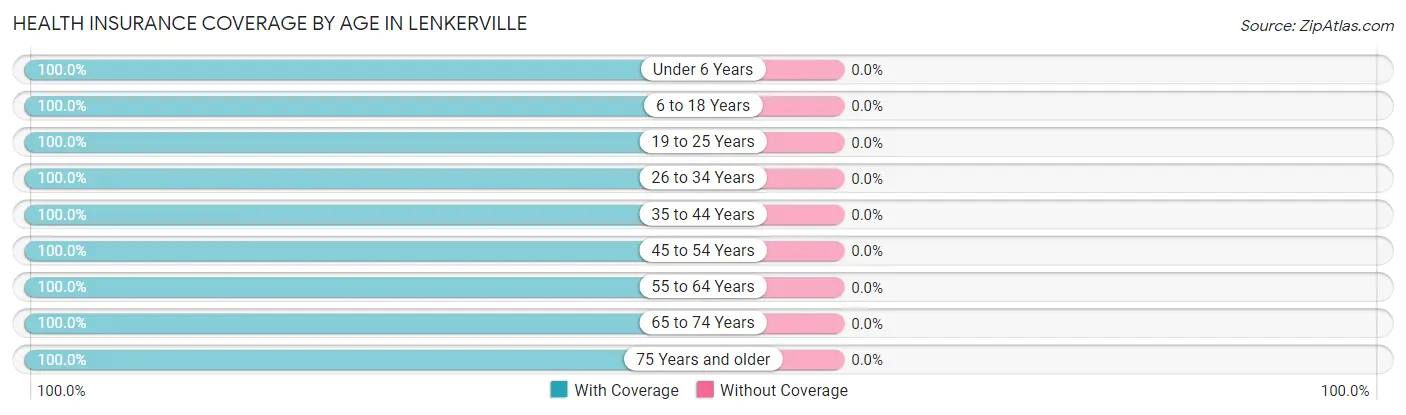
| Age Bracket | With Coverage | Without Coverage |
| Under 6 Years | 48 (100.0%) | 0 (0.0%) |
| 6 to 18 Years | 174 (100.0%) | 0 (0.0%) |
| 19 to 25 Years | 18 (100.0%) | 0 (0.0%) |
| 26 to 34 Years | 36 (100.0%) | 0 (0.0%) |
| 35 to 44 Years | 370 (100.0%) | 0 (0.0%) |
| 45 to 54 Years | 10 (100.0%) | 0 (0.0%) |
| 55 to 64 Years | 58 (100.0%) | 0 (0.0%) |
| 65 to 74 Years | 74 (100.0%) | 0 (0.0%) |
| 75 Years and older | 12 (100.0%) | 0 (0.0%) |
| Total | 800 (100.0%) | 0 (0.0%) |
Health Insurance Coverage by Citizenship Status in Lenkerville
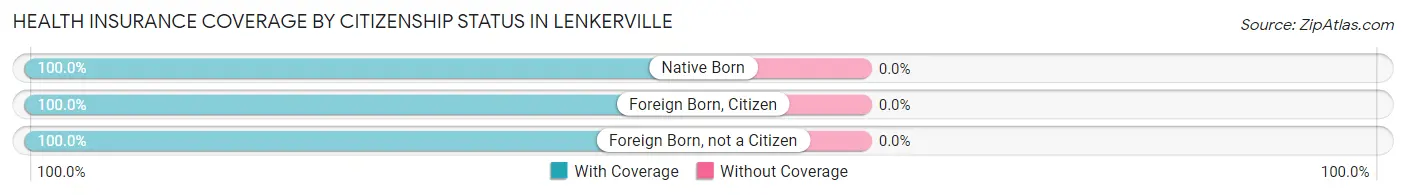
| Citizenship Status | With Coverage | Without Coverage |
| Native Born | 48 (100.0%) | 0 (0.0%) |
| Foreign Born, Citizen | 174 (100.0%) | 0 (0.0%) |
| Foreign Born, not a Citizen | 18 (100.0%) | 0 (0.0%) |
Health Insurance Coverage by Household Income in Lenkerville
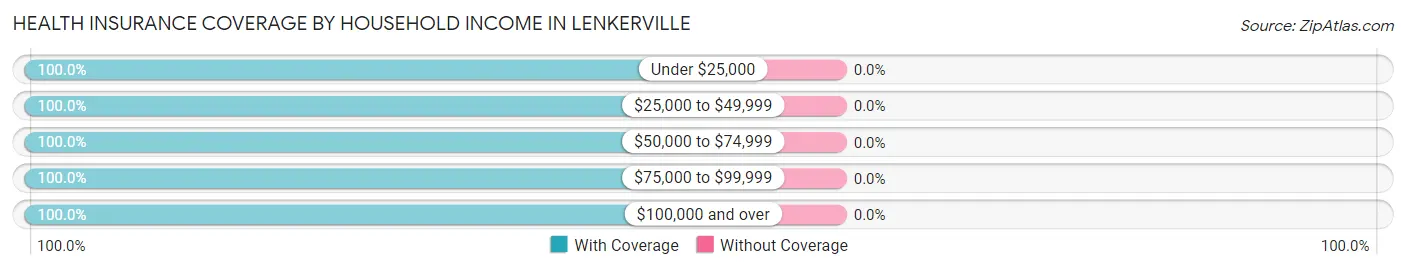
| Household Income | With Coverage | Without Coverage |
| Under $25,000 | 553 (100.0%) | 0 (0.0%) |
| $25,000 to $49,999 | 72 (100.0%) | 0 (0.0%) |
| $50,000 to $74,999 | 38 (100.0%) | 0 (0.0%) |
| $75,000 to $99,999 | 18 (100.0%) | 0 (0.0%) |
| $100,000 and over | 119 (100.0%) | 0 (0.0%) |
Public vs Private Health Insurance Coverage by Age in Lenkerville
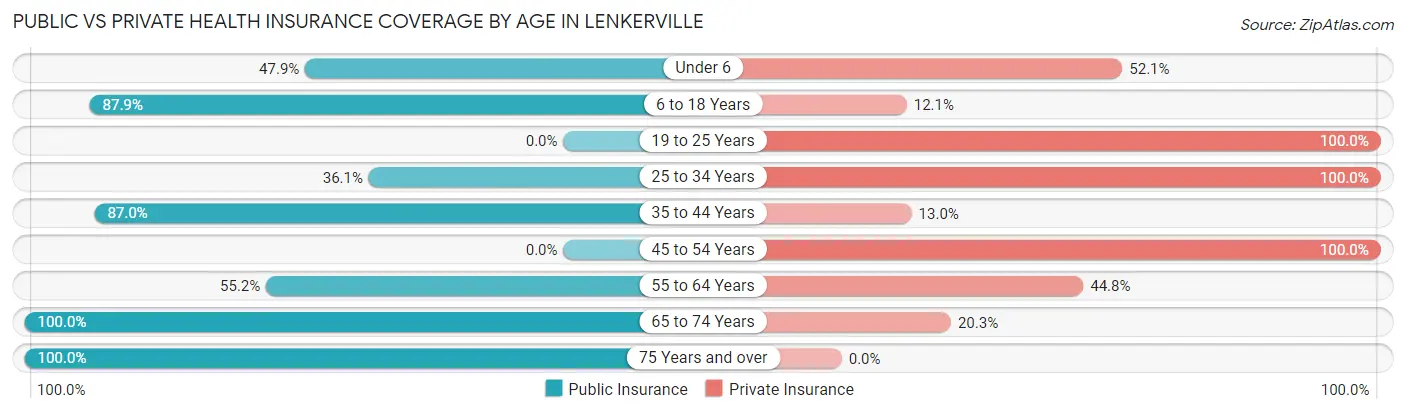
| Age Bracket | Public Insurance | Private Insurance |
| Under 6 | 23 (47.9%) | 25 (52.1%) |
| 6 to 18 Years | 153 (87.9%) | 21 (12.1%) |
| 19 to 25 Years | 0 (0.0%) | 18 (100.0%) |
| 25 to 34 Years | 13 (36.1%) | 36 (100.0%) |
| 35 to 44 Years | 322 (87.0%) | 48 (13.0%) |
| 45 to 54 Years | 0 (0.0%) | 10 (100.0%) |
| 55 to 64 Years | 32 (55.2%) | 26 (44.8%) |
| 65 to 74 Years | 74 (100.0%) | 15 (20.3%) |
| 75 Years and over | 12 (100.0%) | 0 (0.0%) |
| Total | 629 (78.6%) | 199 (24.9%) |
Disability Status by Sex by Age in Lenkerville
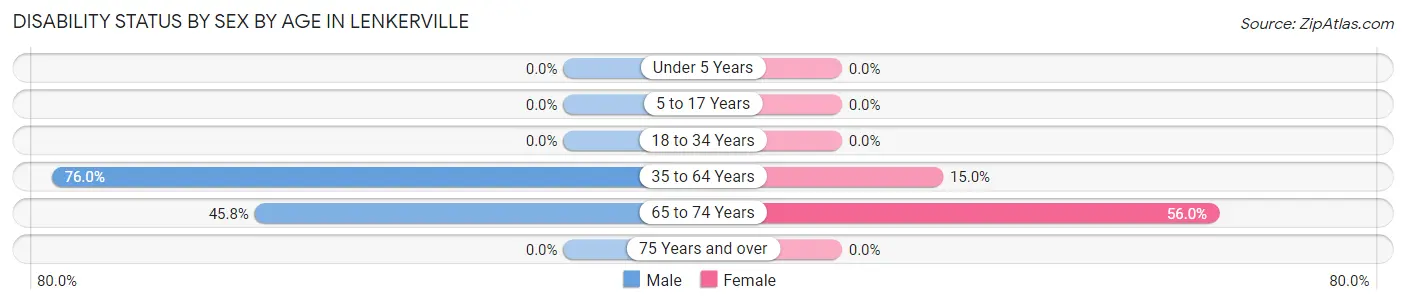
| Age Bracket | Male | Female |
| Under 5 Years | 0 (0.0%) | 0 (0.0%) |
| 5 to 17 Years | 0 (0.0%) | 0 (0.0%) |
| 18 to 34 Years | 0 (0.0%) | 0 (0.0%) |
| 35 to 64 Years | 171 (76.0%) | 32 (15.0%) |
| 65 to 74 Years | 11 (45.8%) | 28 (56.0%) |
| 75 Years and over | 0 (0.0%) | 0 (0.0%) |
Disability Class by Sex by Age in Lenkerville
Disability Class: Hearing Difficulty
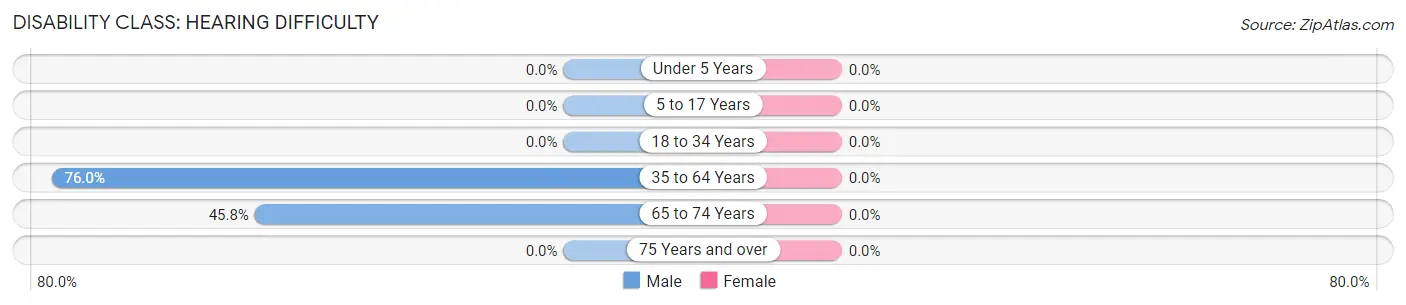
| Age Bracket | Male | Female |
| Under 5 Years | 0 (0.0%) | 0 (0.0%) |
| 5 to 17 Years | 0 (0.0%) | 0 (0.0%) |
| 18 to 34 Years | 0 (0.0%) | 0 (0.0%) |
| 35 to 64 Years | 171 (76.0%) | 0 (0.0%) |
| 65 to 74 Years | 11 (45.8%) | 0 (0.0%) |
| 75 Years and over | 0 (0.0%) | 0 (0.0%) |
Disability Class: Vision Difficulty
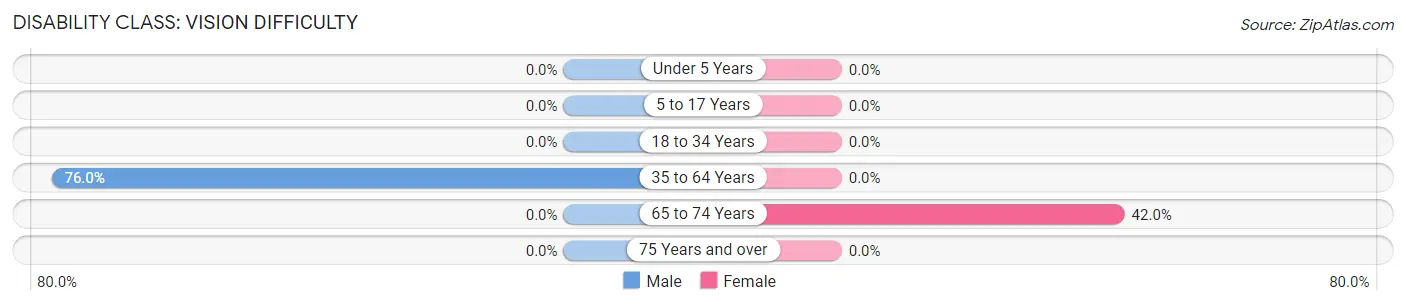
| Age Bracket | Male | Female |
| Under 5 Years | 0 (0.0%) | 0 (0.0%) |
| 5 to 17 Years | 0 (0.0%) | 0 (0.0%) |
| 18 to 34 Years | 0 (0.0%) | 0 (0.0%) |
| 35 to 64 Years | 171 (76.0%) | 0 (0.0%) |
| 65 to 74 Years | 0 (0.0%) | 21 (42.0%) |
| 75 Years and over | 0 (0.0%) | 0 (0.0%) |
Disability Class: Cognitive Difficulty
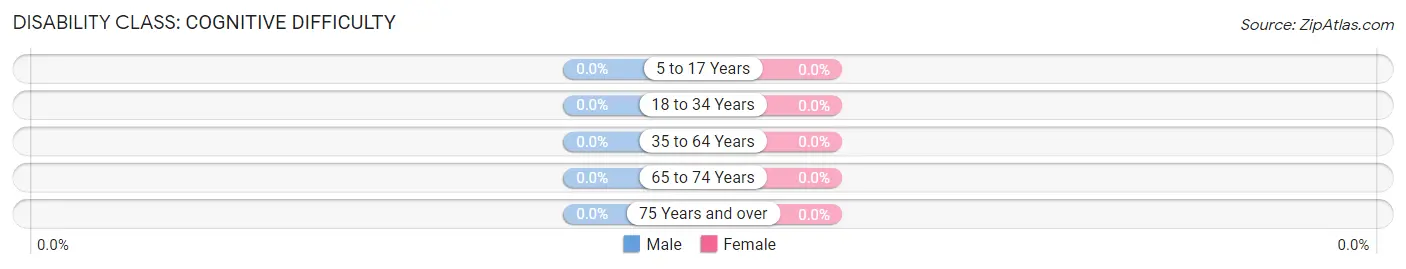
| Age Bracket | Male | Female |
| 5 to 17 Years | 0 (0.0%) | 0 (0.0%) |
| 18 to 34 Years | 0 (0.0%) | 0 (0.0%) |
| 35 to 64 Years | 0 (0.0%) | 0 (0.0%) |
| 65 to 74 Years | 0 (0.0%) | 0 (0.0%) |
| 75 Years and over | 0 (0.0%) | 0 (0.0%) |
Disability Class: Ambulatory Difficulty
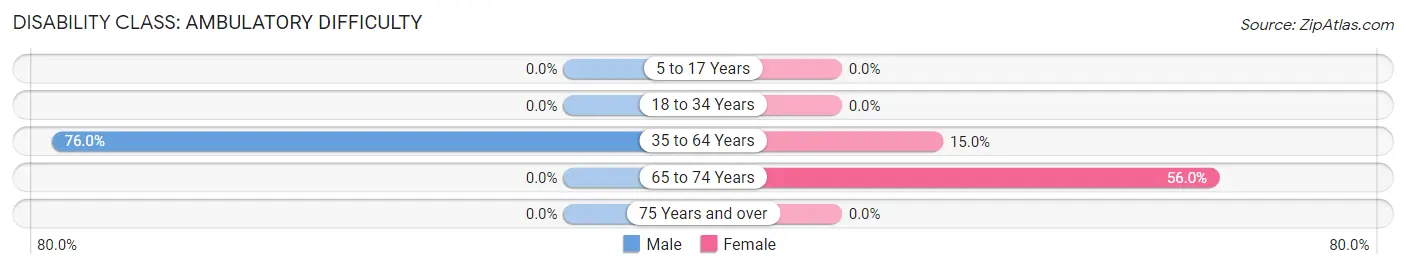
| Age Bracket | Male | Female |
| 5 to 17 Years | 0 (0.0%) | 0 (0.0%) |
| 18 to 34 Years | 0 (0.0%) | 0 (0.0%) |
| 35 to 64 Years | 171 (76.0%) | 32 (15.0%) |
| 65 to 74 Years | 0 (0.0%) | 28 (56.0%) |
| 75 Years and over | 0 (0.0%) | 0 (0.0%) |
Disability Class: Self-Care Difficulty
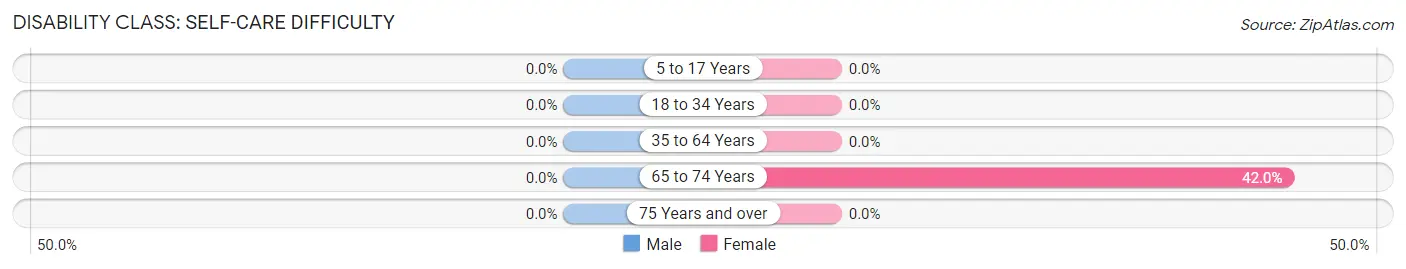
| Age Bracket | Male | Female |
| 5 to 17 Years | 0 (0.0%) | 0 (0.0%) |
| 18 to 34 Years | 0 (0.0%) | 0 (0.0%) |
| 35 to 64 Years | 0 (0.0%) | 0 (0.0%) |
| 65 to 74 Years | 0 (0.0%) | 21 (42.0%) |
| 75 Years and over | 0 (0.0%) | 0 (0.0%) |
Technology Access in Lenkerville
Computing Device Access in Lenkerville
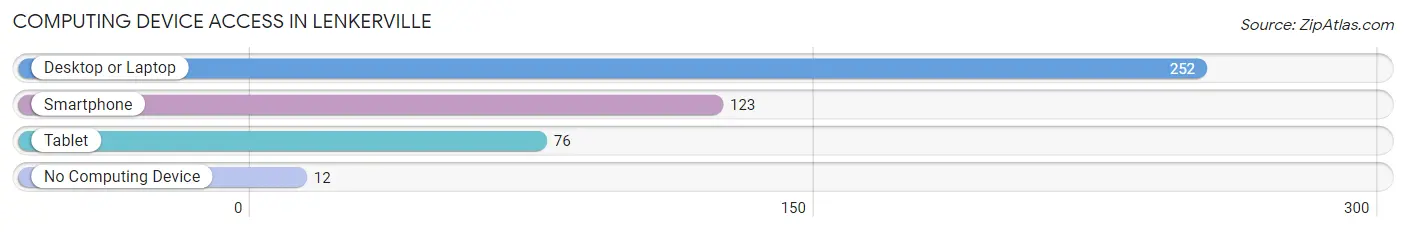
| Device Type | # Households | % Households |
| Desktop or Laptop | 252 | 76.8% |
| Smartphone | 123 | 37.5% |
| Tablet | 76 | 23.2% |
| No Computing Device | 12 | 3.7% |
| Total | 328 | 100.0% |
Internet Access in Lenkerville
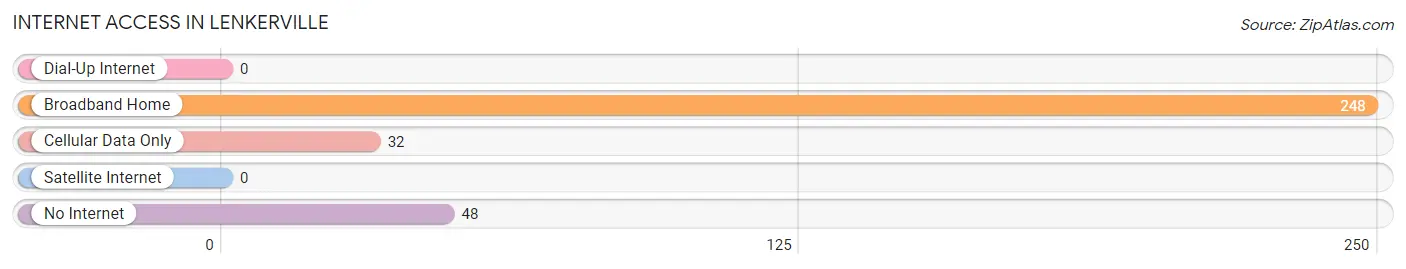
| Internet Type | # Households | % Households |
| Dial-Up Internet | 0 | 0.0% |
| Broadband Home | 248 | 75.6% |
| Cellular Data Only | 32 | 9.8% |
| Satellite Internet | 0 | 0.0% |
| No Internet | 48 | 14.6% |
| Total | 328 | 100.0% |
Lenkerville Summary
Lenkerville is a small borough located in York County, Pennsylvania. It is situated in the southeastern corner of the county, just north of the Susquehanna River. The borough was incorporated in 1891 and has a population of approximately 1,000 people.
History
Lenkerville was originally part of the larger borough of York, which was established in 1741. In 1891, the residents of the area decided to form their own borough and named it Lenkerville after the Lenker family, who were among the first settlers in the area. The Lenker family had a large farm in the area and the town was named in their honor.
The borough was primarily an agricultural community until the early 20th century, when the railroad came to town. This allowed for the development of industry and commerce in the area, and Lenkerville soon became a thriving small town.
Geography
Lenkerville is located in the southeastern corner of York County, just north of the Susquehanna River. The borough is bordered by the boroughs of York Haven to the north, Manchester to the east, and York to the south and west. The borough is situated on a hillside, with the Susquehanna River to the east and the Codorus Creek to the west.
The borough has a total area of 0.7 square miles, all of which is land. The terrain is mostly flat, with some rolling hills. The climate is humid continental, with hot summers and cold winters.
Economy
Lenkerville’s economy is primarily based on agriculture and light industry. The borough is home to several small businesses, including a grocery store, a hardware store, and a few restaurants. The borough also has a few small manufacturing plants, which produce a variety of products, including furniture, clothing, and electronics.
The borough is also home to a few small farms, which produce a variety of crops, including corn, soybeans, and hay. The borough also has a few small wineries, which produce a variety of wines.
Demographics
As of the 2010 census, the population of Lenkerville was 1,000 people. The racial makeup of the borough was 97.2% White, 0.7% African American, 0.2% Native American, 0.2% Asian, 0.2% from other races, and 1.7% from two or more races. Hispanic or Latino of any race were 0.7% of the population.
The median household income in Lenkerville was $41,250, and the median family income was $50,000. The per capita income for the borough was $20,000. About 8.3% of families and 10.2% of the population were below the poverty line, including 14.3% of those under age 18 and 6.7% of those age 65 or over.
Common Questions
What is Per Capita Income in Lenkerville?
Per Capita income in Lenkerville is $15,258.
What is Income or Wage Gap in Lenkerville?
Income or Wage Gap in Lenkerville is 26.7%.
Women in Lenkerville earn 73.3 cents for every dollar earned by a man.
What is Inequality or Gini Index in Lenkerville?
Inequality or Gini Index in Lenkerville is 0.62.
What is the Total Population of Lenkerville?
Total Population of Lenkerville is 812.
What is the Total Male Population of Lenkerville?
Total Male Population of Lenkerville is 452.
What is the Total Female Population of Lenkerville?
Total Female Population of Lenkerville is 360.
What is the Ratio of Males per 100 Females in Lenkerville?
There are 125.56 Males per 100 Females in Lenkerville.
What is the Ratio of Females per 100 Males in Lenkerville?
There are 79.65 Females per 100 Males in Lenkerville.
What is the Median Population Age in Lenkerville?
Median Population Age in Lenkerville is 35.7 Years.
What is the Average Family Size in Lenkerville
Average Family Size in Lenkerville is 2.2 People.
What is the Average Household Size in Lenkerville
Average Household Size in Lenkerville is 2.5 People.
How Large is the Labor Force in Lenkerville?
There are 161 People in the Labor Forcein in Lenkerville.
What is the Percentage of People in the Labor Force in Lenkerville?
21.7% of People are in the Labor Force in Lenkerville.