Starks, LA Map & Demographics
Starks Map
Starks Overview
$15,274
PER CAPITA INCOME
$2,499
AVG FAMILY INCOME
$14,858
AVG HOUSEHOLD INCOME
0.58
INEQUALITY / GINI INDEX
256
TOTAL POPULATION
115
MALE POPULATION
141
FEMALE POPULATION
81.56
MALES / 100 FEMALES
122.61
FEMALES / 100 MALES
54.2
MEDIAN AGE
3.0
AVG FAMILY SIZE
1.7
AVG HOUSEHOLD SIZE
35
LABOR FORCE [ PEOPLE ]
14.3%
PERCENT IN LABOR FORCE
Starks Zip Codes
Starks Area Codes
Income in Starks
Income Overview in Starks
Per Capita Income in Starks is $15,274, while median incomes of families and households are $2,499 and $14,858 respectively.
| Characteristic | Number | Measure |
| Per Capita Income | 256 | $15,274 |
| Median Family Income | 39 | $2,499 |
| Mean Family Income | 39 | $0 |
| Median Household Income | 151 | $14,858 |
| Mean Household Income | 151 | $25,741 |
| Income Deficit | 39 | $0 |
| Wage / Income Gap (%) | 256 | 0.00% |
| Wage / Income Gap ($) | 256 | 100.00¢ per $1 |
| Gini / Inequality Index | 256 | 0.58 |
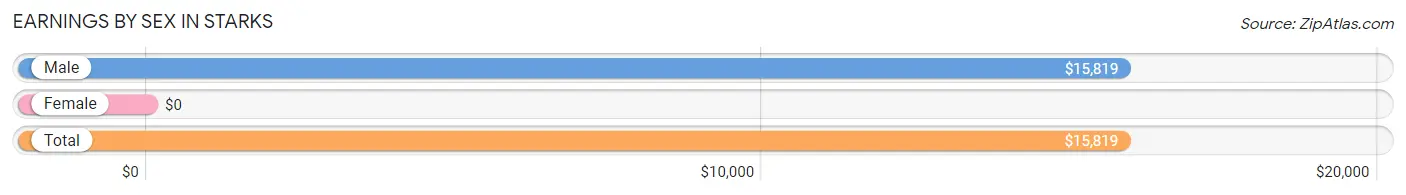
Earnings by Sex in Starks
| Sex | Number | Average Earnings |
| Male | 39 (100.0%) | $15,819 |
| Female | 0 (0.0%) | $0 |
| Total | 39 (100.0%) | $15,819 |
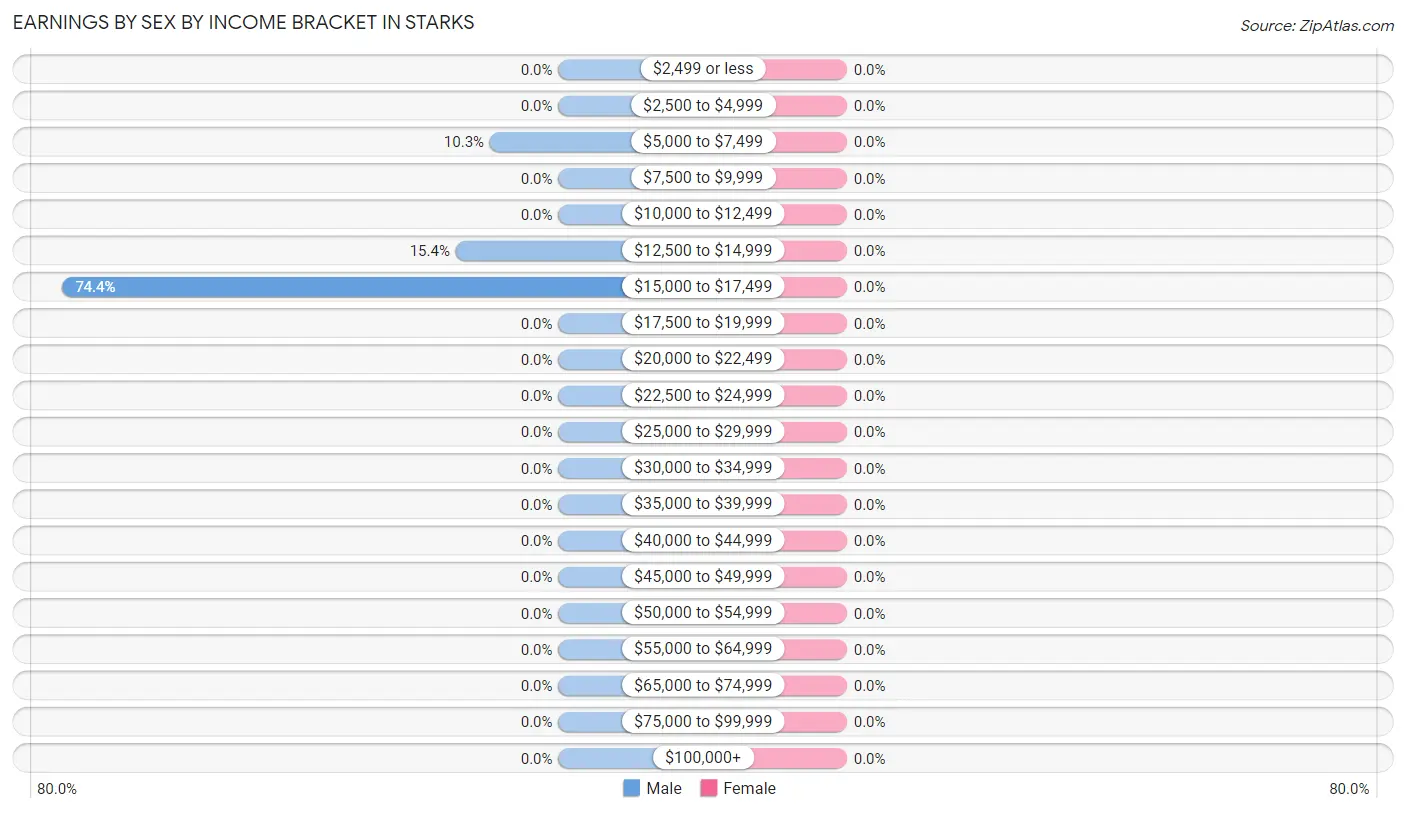
Earnings by Sex by Income Bracket in Starks
| Income | Male | Female |
| $2,499 or less | 0 (0.0%) | 0 (0.0%) |
| $2,500 to $4,999 | 0 (0.0%) | 0 (0.0%) |
| $5,000 to $7,499 | 4 (10.3%) | 0 (0.0%) |
| $7,500 to $9,999 | 0 (0.0%) | 0 (0.0%) |
| $10,000 to $12,499 | 0 (0.0%) | 0 (0.0%) |
| $12,500 to $14,999 | 6 (15.4%) | 0 (0.0%) |
| $15,000 to $17,499 | 29 (74.4%) | 0 (0.0%) |
| $17,500 to $19,999 | 0 (0.0%) | 0 (0.0%) |
| $20,000 to $22,499 | 0 (0.0%) | 0 (0.0%) |
| $22,500 to $24,999 | 0 (0.0%) | 0 (0.0%) |
| $25,000 to $29,999 | 0 (0.0%) | 0 (0.0%) |
| $30,000 to $34,999 | 0 (0.0%) | 0 (0.0%) |
| $35,000 to $39,999 | 0 (0.0%) | 0 (0.0%) |
| $40,000 to $44,999 | 0 (0.0%) | 0 (0.0%) |
| $45,000 to $49,999 | 0 (0.0%) | 0 (0.0%) |
| $50,000 to $54,999 | 0 (0.0%) | 0 (0.0%) |
| $55,000 to $64,999 | 0 (0.0%) | 0 (0.0%) |
| $65,000 to $74,999 | 0 (0.0%) | 0 (0.0%) |
| $75,000 to $99,999 | 0 (0.0%) | 0 (0.0%) |
| $100,000+ | 0 (0.0%) | 0 (0.0%) |
| Total | 39 (100.0%) | 0 (0.0%) |
Earnings by Sex by Educational Attainment in Starks
| Educational Attainment | Male Income | Female Income |
| Less than High School | - | - |
| High School Diploma | - | - |
| College or Associate's Degree | - | - |
| Bachelor's Degree | - | - |
| Graduate Degree | - | - |
| Total | - | - |
Family Income in Starks
Family Income Brackets in Starks
According to the Starks family income data, there are 22 families falling into the less than $10,000 income range, which is the most common income bracket and makes up 56.4% of all families.
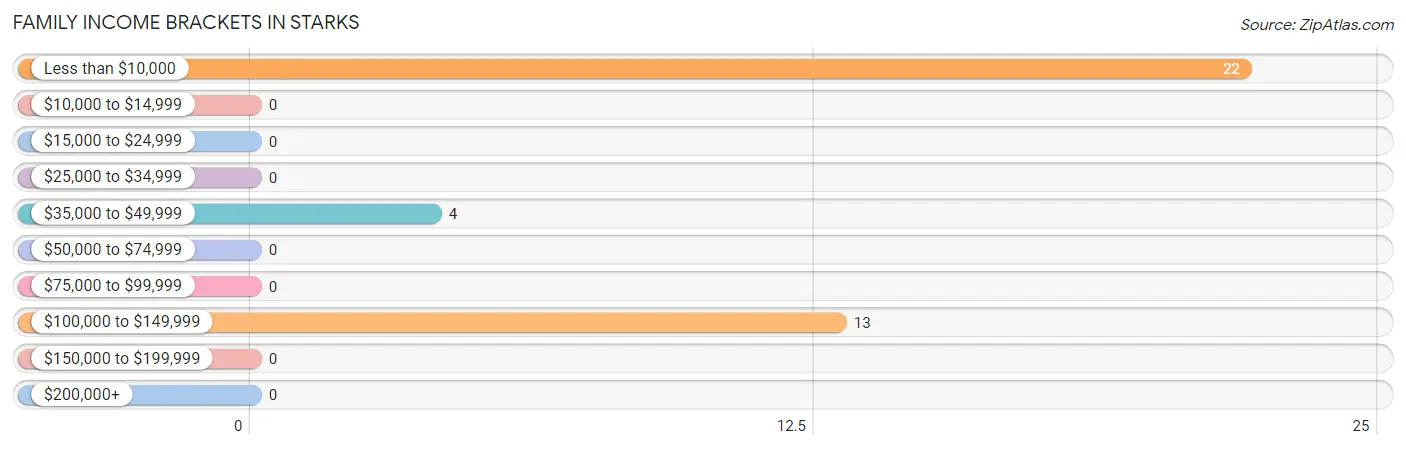
| Income Bracket | # Families | % Families |
| Less than $10,000 | 22 | 56.4% |
| $10,000 to $14,999 | 0 | 0.0% |
| $15,000 to $24,999 | 0 | 0.0% |
| $25,000 to $34,999 | 0 | 0.0% |
| $35,000 to $49,999 | 4 | 10.3% |
| $50,000 to $74,999 | 0 | 0.0% |
| $75,000 to $99,999 | 0 | 0.0% |
| $100,000 to $149,999 | 13 | 33.3% |
| $150,000 to $199,999 | 0 | 0.0% |
| $200,000+ | 0 | 0.0% |
Family Income by Famaliy Size in Starks
| Income Bracket | # Families | Median Income |
| 2-Person Families | 26 (66.7%) | $0 |
| 3-Person Families | 0 (0.0%) | $0 |
| 4-Person Families | 13 (33.3%) | $0 |
| 5-Person Families | 0 (0.0%) | $0 |
| 6-Person Families | 0 (0.0%) | $0 |
| 7+ Person Families | 0 (0.0%) | $0 |
| Total | 39 (100.0%) | $2,499 |
Family Income by Number of Earners in Starks
| Number of Earners | # Families | Median Income |
| No Earners | 35 (89.7%) | $0 |
| 1 Earner | 4 (10.3%) | $0 |
| 2 Earners | 0 (0.0%) | $0 |
| 3+ Earners | 0 (0.0%) | $0 |
| Total | 39 (100.0%) | $2,499 |
Household Income in Starks
Household Income Brackets in Starks
With 44 households falling in the category, the $10,000 to $14,999 income range is the most frequent in Starks, accounting for 29.1% of all households.
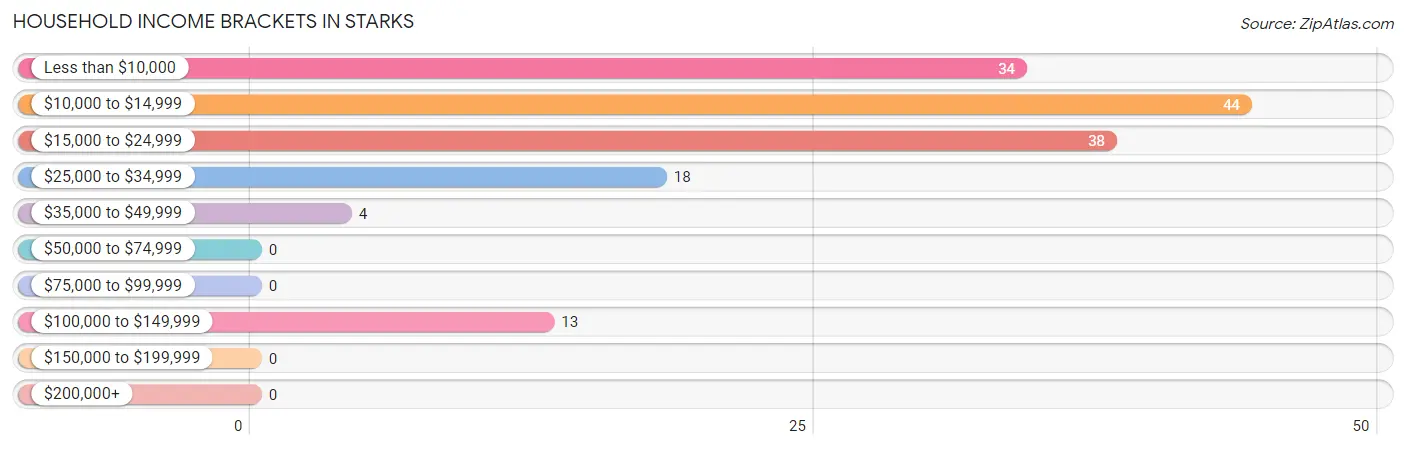
| Income Bracket | # Households | % Households |
| Less than $10,000 | 34 | 22.5% |
| $10,000 to $14,999 | 44 | 29.1% |
| $15,000 to $24,999 | 38 | 25.2% |
| $25,000 to $34,999 | 18 | 11.9% |
| $35,000 to $49,999 | 4 | 2.6% |
| $50,000 to $74,999 | 0 | 0.0% |
| $75,000 to $99,999 | 0 | 0.0% |
| $100,000 to $149,999 | 13 | 8.6% |
| $150,000 to $199,999 | 0 | 0.0% |
| $200,000+ | 0 | 0.0% |
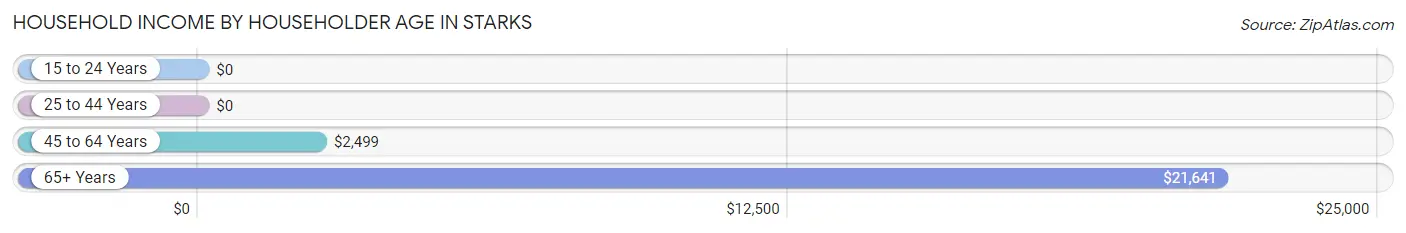
Household Income by Householder Age in Starks
The median household income in Starks is $14,858, with the highest median household income of $21,641 found in the 65+ years age bracket for the primary householder. A total of 81 households (53.6%) fall into this category.
| Income Bracket | # Households | Median Income |
| 15 to 24 Years | 0 (0.0%) | $0 |
| 25 to 44 Years | 28 (18.5%) | $0 |
| 45 to 64 Years | 42 (27.8%) | $2,499 |
| 65+ Years | 81 (53.6%) | $21,641 |
| Total | 151 (100.0%) | $14,858 |
Poverty in Starks
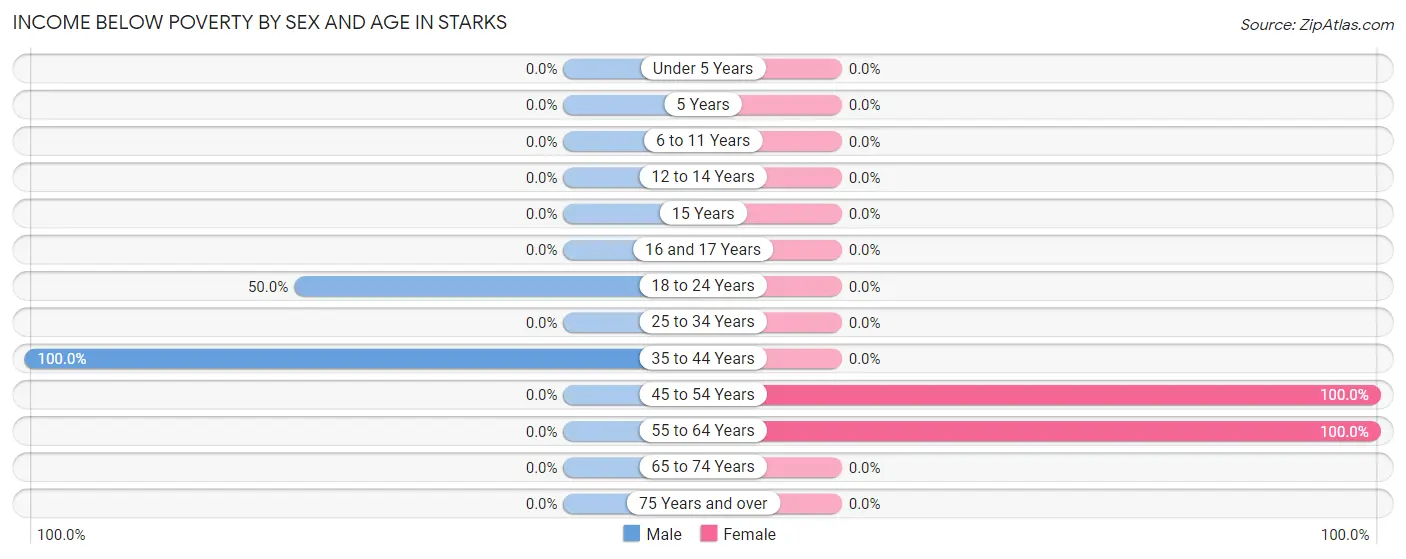
Income Below Poverty by Sex and Age in Starks
With 49.6% poverty level for males and 29.8% for females among the residents of Starks, 35 to 44 year old males and 45 to 54 year old females are the most vulnerable to poverty, with 28 males (100.0%) and 34 females (100.0%) in their respective age groups living below the poverty level.
| Age Bracket | Male | Female |
| Under 5 Years | 0 (0.0%) | 0 (0.0%) |
| 5 Years | 0 (0.0%) | 0 (0.0%) |
| 6 to 11 Years | 0 (0.0%) | 0 (0.0%) |
| 12 to 14 Years | 0 (0.0%) | 0 (0.0%) |
| 15 Years | 0 (0.0%) | 0 (0.0%) |
| 16 and 17 Years | 0 (0.0%) | 0 (0.0%) |
| 18 to 24 Years | 29 (50.0%) | 0 (0.0%) |
| 25 to 34 Years | 0 (0.0%) | 0 (0.0%) |
| 35 to 44 Years | 28 (100.0%) | 0 (0.0%) |
| 45 to 54 Years | 0 (0.0%) | 34 (100.0%) |
| 55 to 64 Years | 0 (0.0%) | 8 (100.0%) |
| 65 to 74 Years | 0 (0.0%) | 0 (0.0%) |
| 75 Years and over | 0 (0.0%) | 0 (0.0%) |
| Total | 57 (49.6%) | 42 (29.8%) |
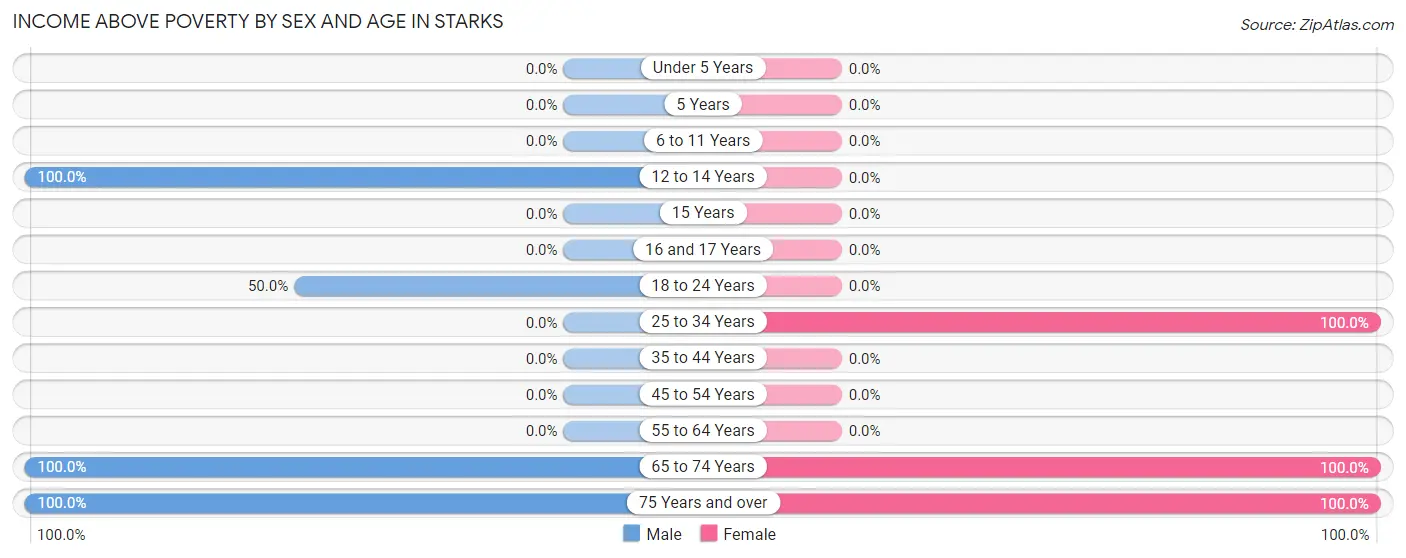
Income Above Poverty by Sex and Age in Starks
According to the poverty statistics in Starks, males aged 12 to 14 years and females aged 25 to 34 years are the age groups that are most secure financially, with 100.0% of males and 100.0% of females in these age groups living above the poverty line.
| Age Bracket | Male | Female |
| Under 5 Years | 0 (0.0%) | 0 (0.0%) |
| 5 Years | 0 (0.0%) | 0 (0.0%) |
| 6 to 11 Years | 0 (0.0%) | 0 (0.0%) |
| 12 to 14 Years | 12 (100.0%) | 0 (0.0%) |
| 15 Years | 0 (0.0%) | 0 (0.0%) |
| 16 and 17 Years | 0 (0.0%) | 0 (0.0%) |
| 18 to 24 Years | 29 (50.0%) | 0 (0.0%) |
| 25 to 34 Years | 0 (0.0%) | 20 (100.0%) |
| 35 to 44 Years | 0 (0.0%) | 0 (0.0%) |
| 45 to 54 Years | 0 (0.0%) | 0 (0.0%) |
| 55 to 64 Years | 0 (0.0%) | 0 (0.0%) |
| 65 to 74 Years | 4 (100.0%) | 22 (100.0%) |
| 75 Years and over | 13 (100.0%) | 57 (100.0%) |
| Total | 58 (50.4%) | 99 (70.2%) |
Income Below Poverty Among Married-Couple Families in Starks
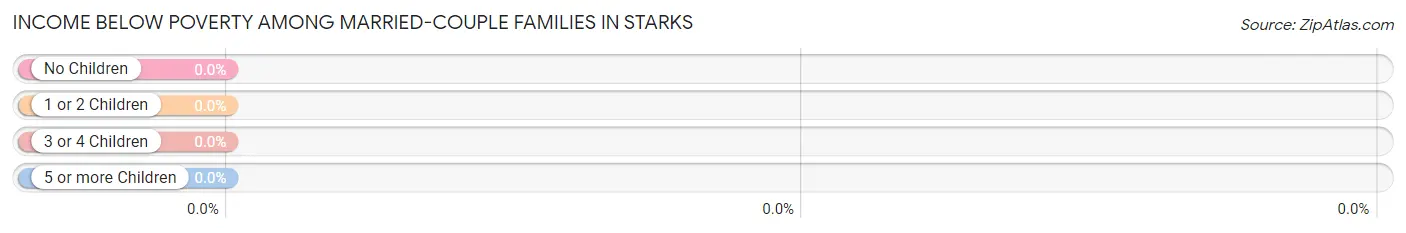
| Children | Above Poverty | Below Poverty |
| No Children | 4 (100.0%) | 0 (0.0%) |
| 1 or 2 Children | 13 (100.0%) | 0 (0.0%) |
| 3 or 4 Children | 0 (0.0%) | 0 (0.0%) |
| 5 or more Children | 0 (0.0%) | 0 (0.0%) |
| Total | 17 (100.0%) | 0 (0.0%) |
Income Below Poverty Among Single-Parent Households in Starks
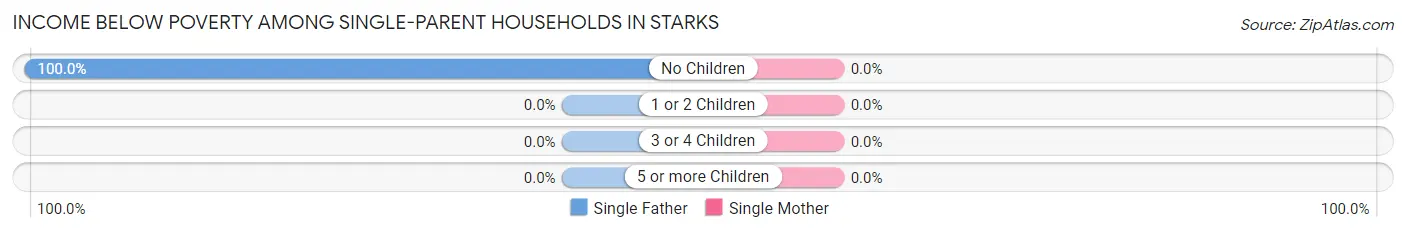
| Children | Single Father | Single Mother |
| No Children | 22 (100.0%) | 0 (0.0%) |
| 1 or 2 Children | 0 (0.0%) | 0 (0.0%) |
| 3 or 4 Children | 0 (0.0%) | 0 (0.0%) |
| 5 or more Children | 0 (0.0%) | 0 (0.0%) |
| Total | 22 (100.0%) | 0 (0.0%) |
Income Below Poverty Among Married-Couple vs Single-Parent Households in Starks
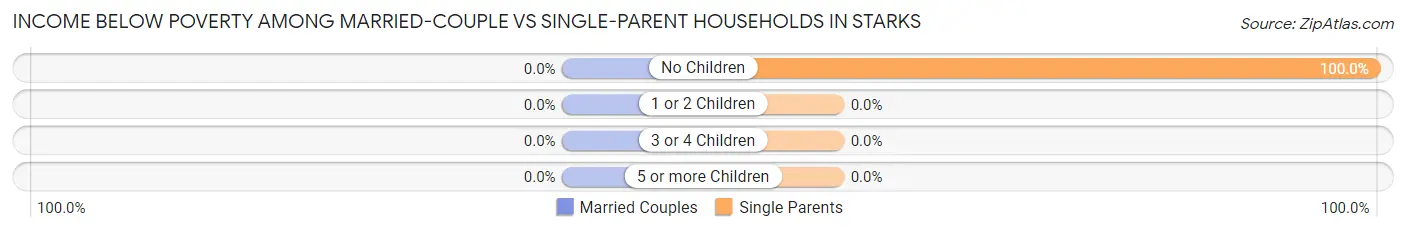
| Children | Married-Couple Families | Single-Parent Households |
| No Children | 0 (0.0%) | 22 (100.0%) |
| 1 or 2 Children | 0 (0.0%) | 0 (0.0%) |
| 3 or 4 Children | 0 (0.0%) | 0 (0.0%) |
| 5 or more Children | 0 (0.0%) | 0 (0.0%) |
| Total | 0 (0.0%) | 22 (100.0%) |
Race in Starks
The most populous races in Starks are White / Caucasian (238 | 93.0%), Asian (18 | 7.0%), and Hispanic or Latino (3 | 1.2%).
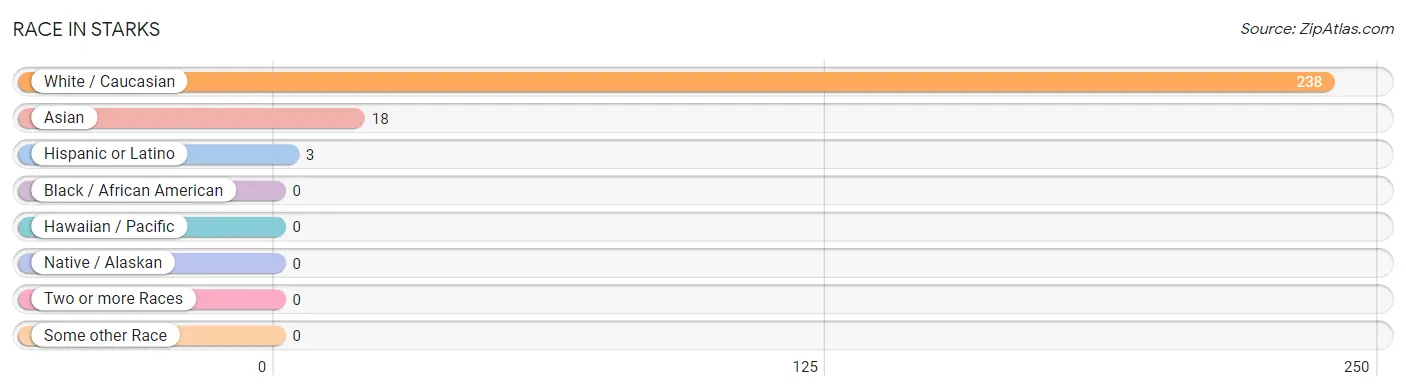
| Race | # Population | % Population |
| Asian | 18 | 7.0% |
| Black / African American | 0 | 0.0% |
| Hawaiian / Pacific | 0 | 0.0% |
| Hispanic or Latino | 3 | 1.2% |
| Native / Alaskan | 0 | 0.0% |
| White / Caucasian | 238 | 93.0% |
| Two or more Races | 0 | 0.0% |
| Some other Race | 0 | 0.0% |
| Total | 256 | 100.0% |
Ancestry in Starks
The most populous ancestries reported in Starks are French Canadian (65 | 25.4%), Indian (Asian) (18 | 7.0%), Dutch (16 | 6.2%), American (8 | 3.1%), and French (4 | 1.6%), together accounting for 43.4% of all Starks residents.
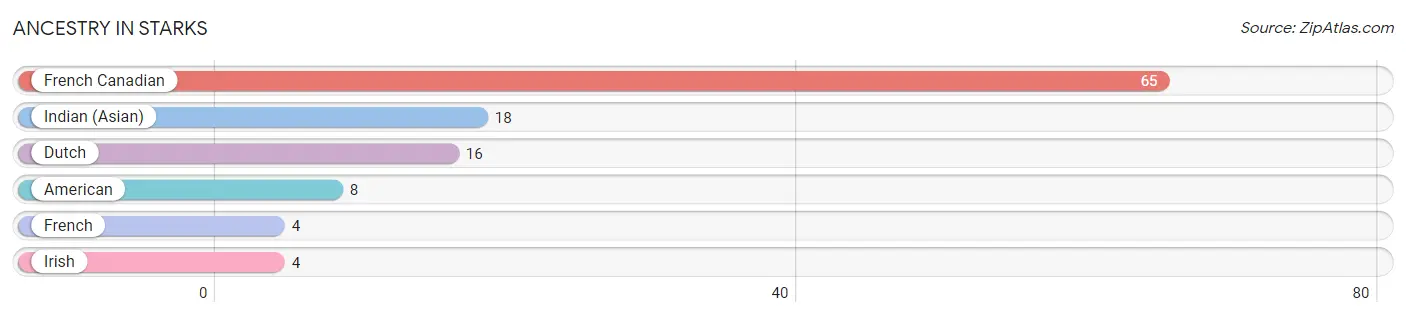
| Ancestry | # Population | % Population |
| American | 8 | 3.1% |
| Dutch | 16 | 6.2% |
| French | 4 | 1.6% |
| French Canadian | 65 | 25.4% |
| Indian (Asian) | 18 | 7.0% |
| Irish | 4 | 1.6% | View All 6 Rows |
Immigrants in Starks
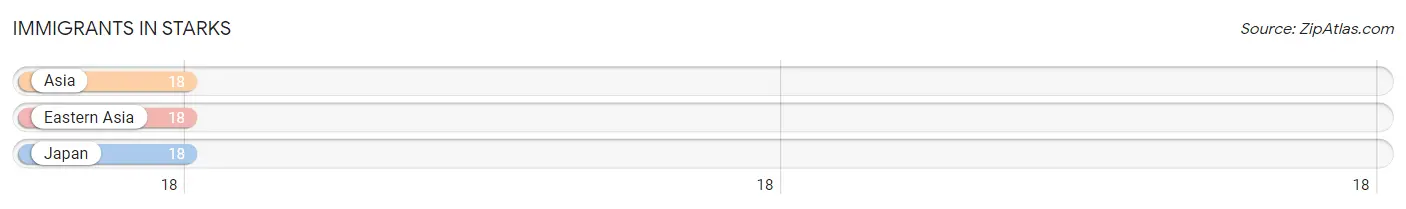
The most numerous immigrant groups reported in Starks came from Asia (18 | 7.0%), Eastern Asia (18 | 7.0%), and Japan (18 | 7.0%), together accounting for 21.1% of all Starks residents.
| Immigration Origin | # Population | % Population |
| Asia | 18 | 7.0% |
| Eastern Asia | 18 | 7.0% |
| Japan | 18 | 7.0% | View All 3 Rows |
Sex and Age in Starks
Sex and Age in Starks
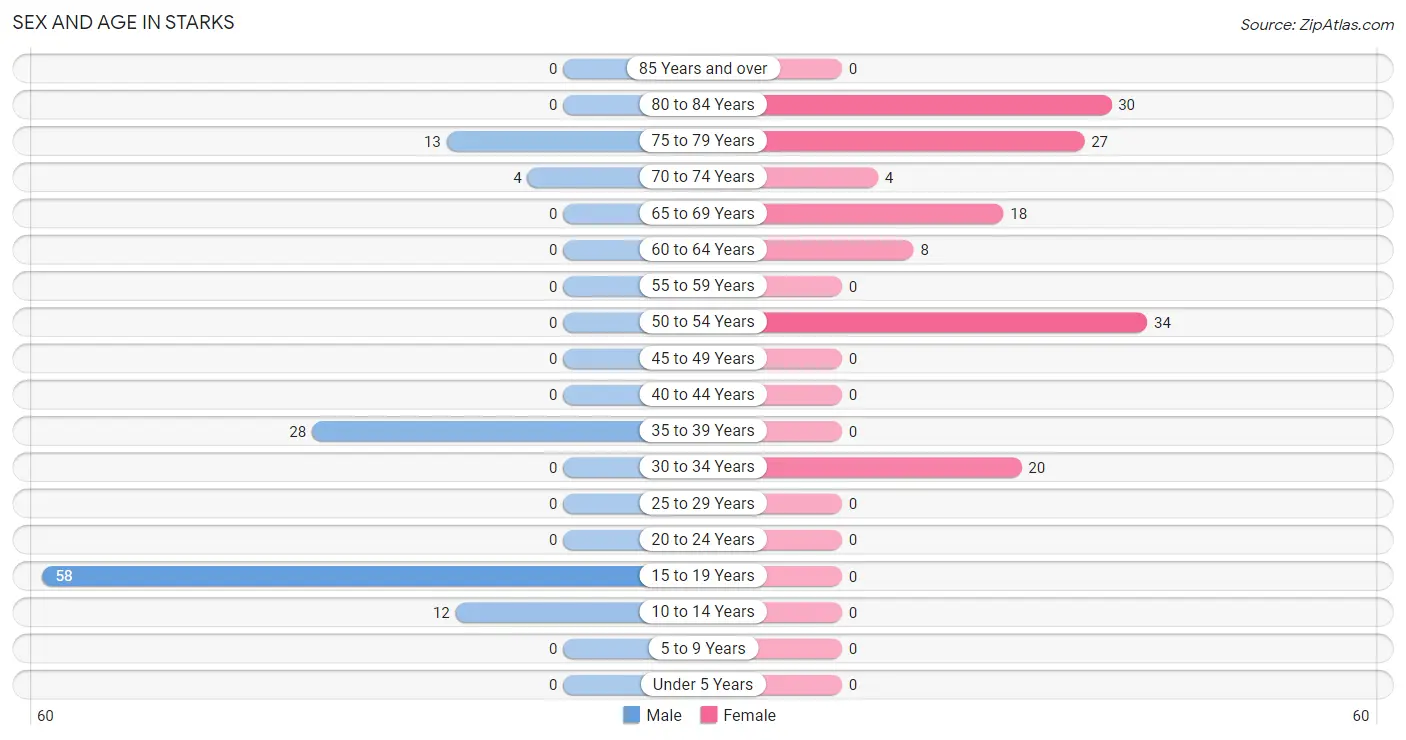
The most populous age groups in Starks are 15 to 19 Years (58 | 50.4%) for men and 50 to 54 Years (34 | 24.1%) for women.
| Age Bracket | Male | Female |
| Under 5 Years | 0 (0.0%) | 0 (0.0%) |
| 5 to 9 Years | 0 (0.0%) | 0 (0.0%) |
| 10 to 14 Years | 12 (10.4%) | 0 (0.0%) |
| 15 to 19 Years | 58 (50.4%) | 0 (0.0%) |
| 20 to 24 Years | 0 (0.0%) | 0 (0.0%) |
| 25 to 29 Years | 0 (0.0%) | 0 (0.0%) |
| 30 to 34 Years | 0 (0.0%) | 20 (14.2%) |
| 35 to 39 Years | 28 (24.3%) | 0 (0.0%) |
| 40 to 44 Years | 0 (0.0%) | 0 (0.0%) |
| 45 to 49 Years | 0 (0.0%) | 0 (0.0%) |
| 50 to 54 Years | 0 (0.0%) | 34 (24.1%) |
| 55 to 59 Years | 0 (0.0%) | 0 (0.0%) |
| 60 to 64 Years | 0 (0.0%) | 8 (5.7%) |
| 65 to 69 Years | 0 (0.0%) | 18 (12.8%) |
| 70 to 74 Years | 4 (3.5%) | 4 (2.8%) |
| 75 to 79 Years | 13 (11.3%) | 27 (19.2%) |
| 80 to 84 Years | 0 (0.0%) | 30 (21.3%) |
| 85 Years and over | 0 (0.0%) | 0 (0.0%) |
| Total | 115 (100.0%) | 141 (100.0%) |
Families and Households in Starks
Median Family Size in Starks
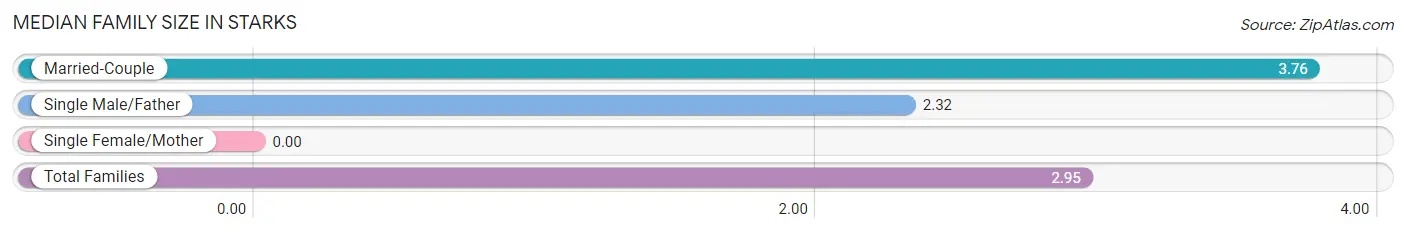
| Family Type | # Families | Family Size |
| Married-Couple | 17 (43.6%) | 3.76 |
| Single Male/Father | 22 (56.4%) | 2.32 |
| Single Female/Mother | 0 (0.0%) | - |
| Total Families | 39 (100.0%) | 2.95 |
Median Household Size in Starks
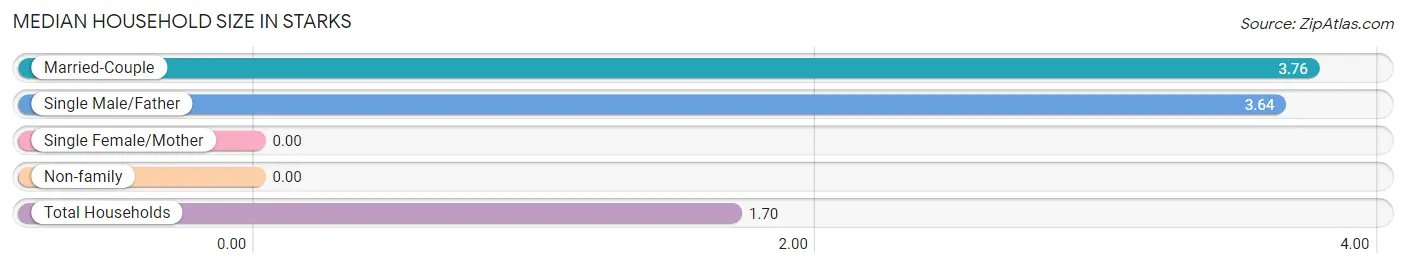
| Household Type | # Households | Household Size |
| Married-Couple | 17 (11.3%) | 3.76 |
| Single Male/Father | 22 (14.6%) | 3.64 |
| Single Female/Mother | 0 (0.0%) | - |
| Non-family | 112 (74.2%) | - |
| Total Households | 151 (100.0%) | 1.70 |
Household Size by Marriage Status in Starks
Out of a total of 151 households in Starks, 39 (25.8%) are family households, while 112 (74.2%) are nonfamily households. The most numerous type of family households are 3-person households, comprising 22, and the most common type of nonfamily households are 1-person households, comprising 112.
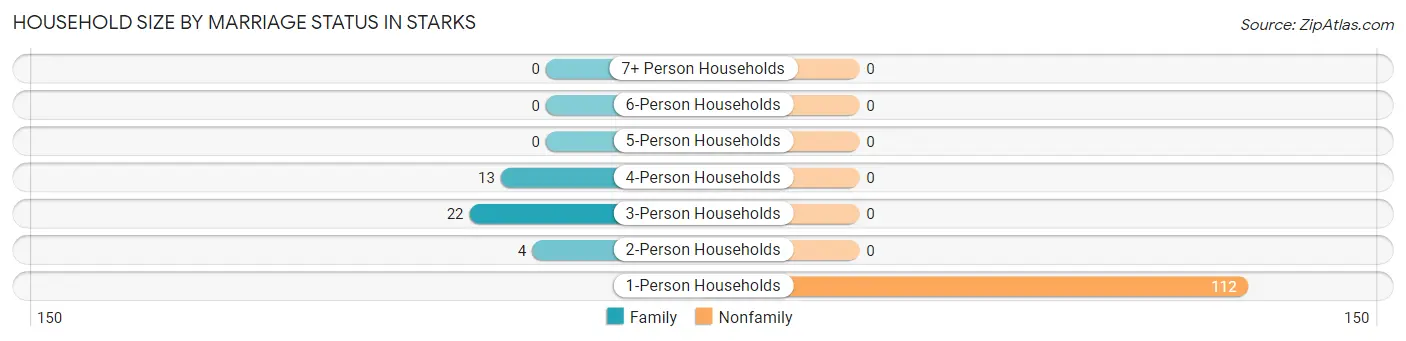
| Household Size | Family Households | Nonfamily Households |
| 1-Person Households | - | 112 (74.2%) |
| 2-Person Households | 4 (2.6%) | 0 (0.0%) |
| 3-Person Households | 22 (14.6%) | 0 (0.0%) |
| 4-Person Households | 13 (8.6%) | 0 (0.0%) |
| 5-Person Households | 0 (0.0%) | 0 (0.0%) |
| 6-Person Households | 0 (0.0%) | 0 (0.0%) |
| 7+ Person Households | 0 (0.0%) | 0 (0.0%) |
| Total | 39 (25.8%) | 112 (74.2%) |
Female Fertility in Starks
Fertility by Age in Starks
| Age Bracket | Women with Births | Births / 1,000 Women |
| 15 to 19 years | 0 (0.0%) | 0.0 |
| 20 to 34 years | 0 (0.0%) | 0.0 |
| 35 to 50 years | 0 (0.0%) | 0.0 |
| Total | 0 (0.0%) | 0.0 |
Fertility by Age by Marriage Status in Starks
| Age Bracket | Married | Unmarried |
| 15 to 19 years | 0 (0.0%) | 0 (0.0%) |
| 20 to 34 years | 0 (0.0%) | 0 (0.0%) |
| 35 to 50 years | 0 (0.0%) | 0 (0.0%) |
| Total | 0 (0.0%) | 0 (0.0%) |
Fertility by Education in Starks
| Educational Attainment | Women with Births | Births / 1,000 Women |
| Less than High School | 0 (0.0%) | 0.0 |
| High School Diploma | 0 (0.0%) | 0.0 |
| College or Associate's Degree | 0 (0.0%) | 0.0 |
| Bachelor's Degree | 0 (0.0%) | 0.0 |
| Graduate Degree | 0 (0.0%) | 0.0 |
| Total | 0 (0.0%) | 0.0 |
Fertility by Education by Marriage Status in Starks
| Educational Attainment | Married | Unmarried |
| Less than High School | 0 (0.0%) | 0 (0.0%) |
| High School Diploma | 0 (0.0%) | 0 (0.0%) |
| College or Associate's Degree | 0 (0.0%) | 0 (0.0%) |
| Bachelor's Degree | 0 (0.0%) | 0 (0.0%) |
| Graduate Degree | 0 (0.0%) | 0 (0.0%) |
| Total | 0 (0.0%) | 0 (0.0%) |
Employment Characteristics in Starks
Employment by Class of Employer in Starks
Among the 35 employed individuals in Starks, private company employees (29 | 82.9%), and self-employed (not incorporated) (6 | 17.1%) make up the most common classes of employment.
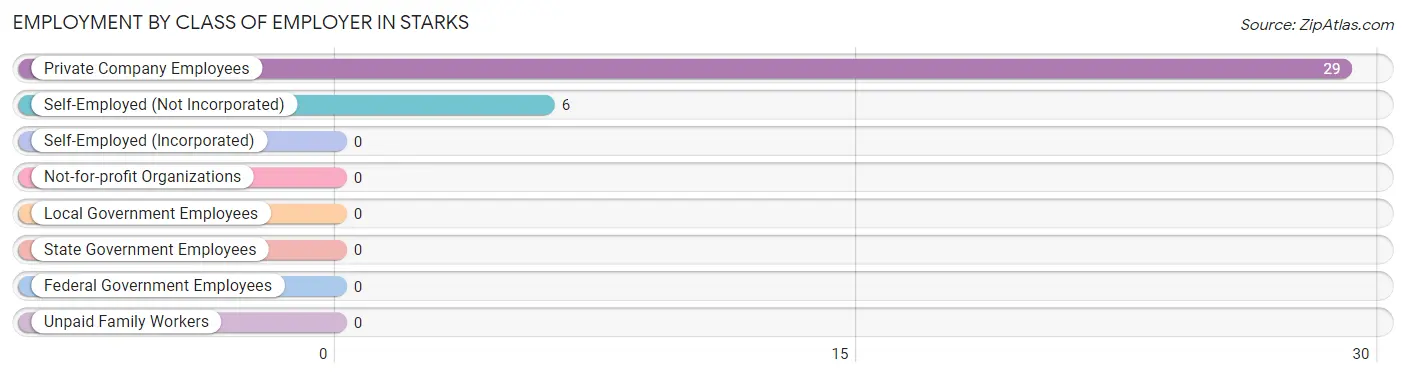
| Employer Class | # Employees | % Employees |
| Private Company Employees | 29 | 82.9% |
| Self-Employed (Incorporated) | 0 | 0.0% |
| Self-Employed (Not Incorporated) | 6 | 17.1% |
| Not-for-profit Organizations | 0 | 0.0% |
| Local Government Employees | 0 | 0.0% |
| State Government Employees | 0 | 0.0% |
| Federal Government Employees | 0 | 0.0% |
| Unpaid Family Workers | 0 | 0.0% |
| Total | 35 | 100.0% |
Employment Status by Age in Starks
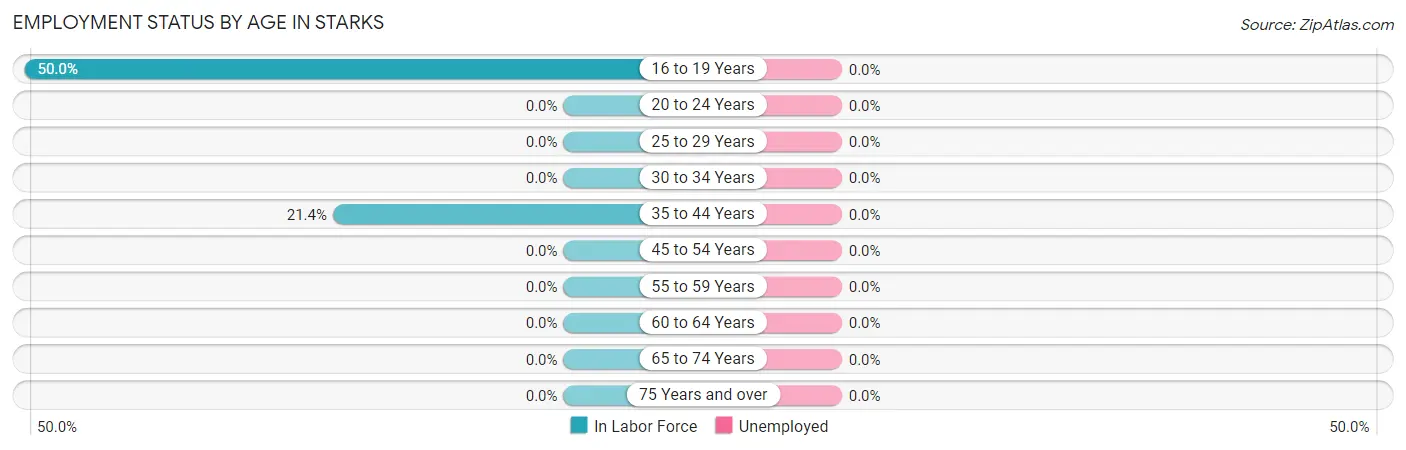
| Age Bracket | In Labor Force | Unemployed |
| 16 to 19 Years | 29 (50.0%) | 0 (0.0%) |
| 20 to 24 Years | 0 (0.0%) | 0 (0.0%) |
| 25 to 29 Years | 0 (0.0%) | 0 (0.0%) |
| 30 to 34 Years | 0 (0.0%) | 0 (0.0%) |
| 35 to 44 Years | 6 (21.4%) | 0 (0.0%) |
| 45 to 54 Years | 0 (0.0%) | 0 (0.0%) |
| 55 to 59 Years | 0 (0.0%) | 0 (0.0%) |
| 60 to 64 Years | 0 (0.0%) | 0 (0.0%) |
| 65 to 74 Years | 0 (0.0%) | 0 (0.0%) |
| 75 Years and over | 0 (0.0%) | 0 (0.0%) |
| Total | 35 (14.3%) | 0 (0.0%) |
Employment Status by Educational Attainment in Starks
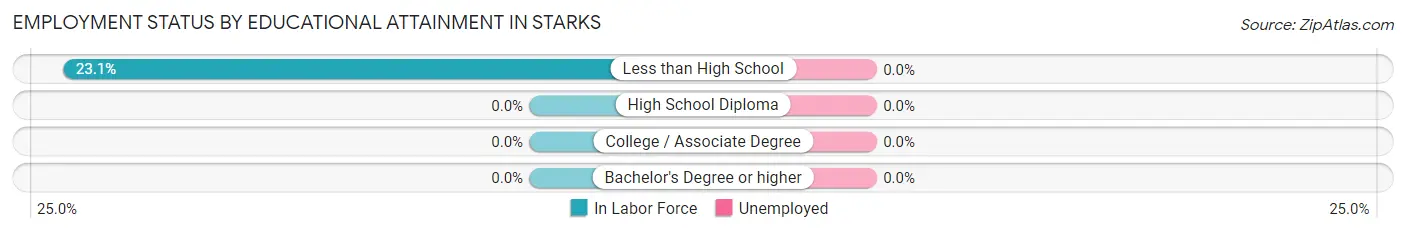
| Educational Attainment | In Labor Force | Unemployed |
| Less than High School | 6 (23.1%) | 0 (0.0%) |
| High School Diploma | 0 (0.0%) | 0 (0.0%) |
| College / Associate Degree | 0 (0.0%) | 0 (0.0%) |
| Bachelor's Degree or higher | 0 (0.0%) | 0 (0.0%) |
| Total | 6 (6.7%) | 0 (0.0%) |
Employment Occupations by Sex in Starks
Management, Business, Science and Arts Occupations
The most common Management, Business, Science and Arts occupations in Starks are , and Management (6 | 17.1%).
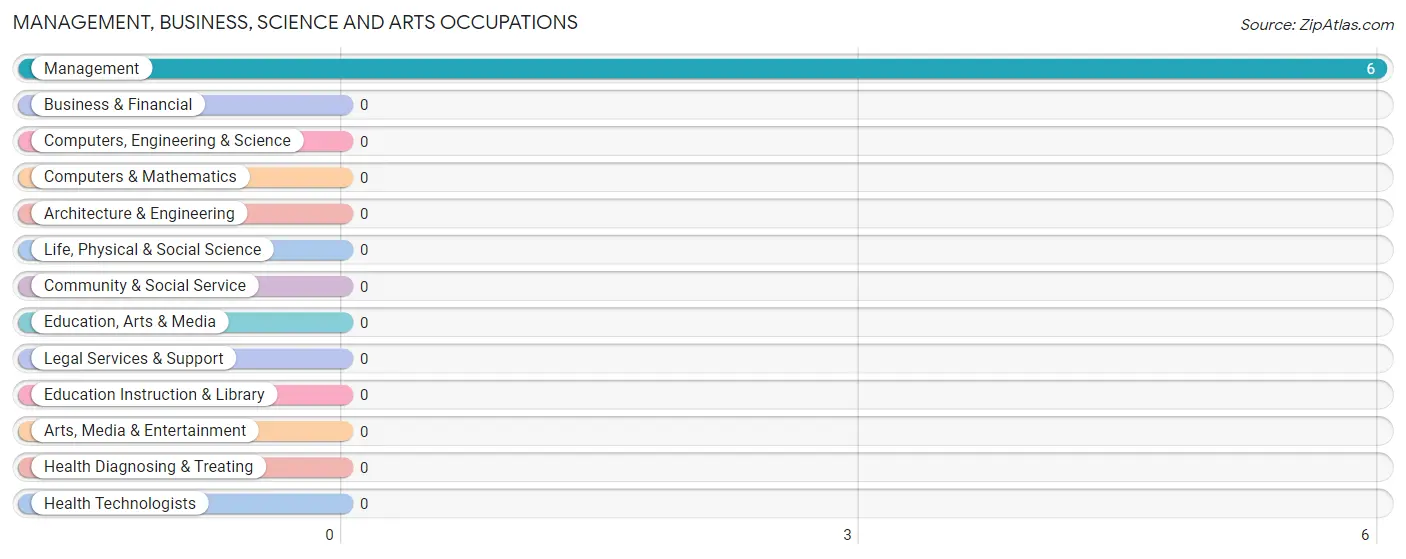
Management, Business, Science and Arts Occupations by Sex
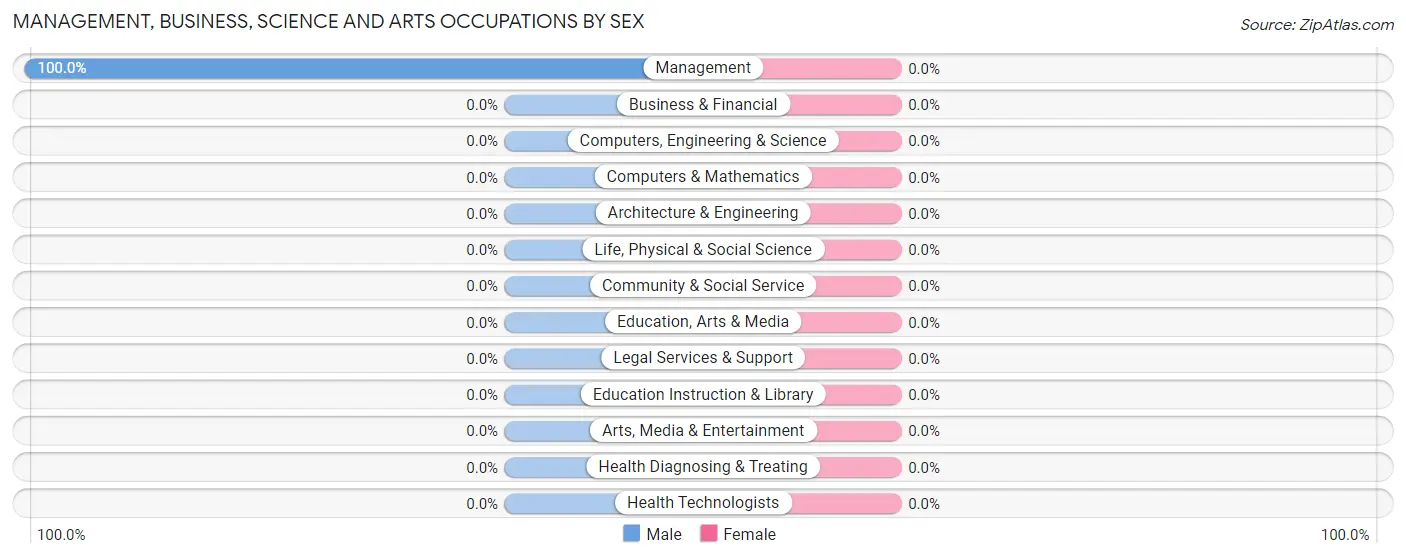
| Occupation | Male | Female |
| Management | 6 (100.0%) | 0 (0.0%) |
| Business & Financial | 0 (0.0%) | 0 (0.0%) |
| Computers, Engineering & Science | 0 (0.0%) | 0 (0.0%) |
| Computers & Mathematics | 0 (0.0%) | 0 (0.0%) |
| Architecture & Engineering | 0 (0.0%) | 0 (0.0%) |
| Life, Physical & Social Science | 0 (0.0%) | 0 (0.0%) |
| Community & Social Service | 0 (0.0%) | 0 (0.0%) |
| Education, Arts & Media | 0 (0.0%) | 0 (0.0%) |
| Legal Services & Support | 0 (0.0%) | 0 (0.0%) |
| Education Instruction & Library | 0 (0.0%) | 0 (0.0%) |
| Arts, Media & Entertainment | 0 (0.0%) | 0 (0.0%) |
| Health Diagnosing & Treating | 0 (0.0%) | 0 (0.0%) |
| Health Technologists | 0 (0.0%) | 0 (0.0%) |
| Total (Category) | 6 (100.0%) | 0 (0.0%) |
| Total (Overall) | 35 (100.0%) | 0 (0.0%) |
Services Occupations
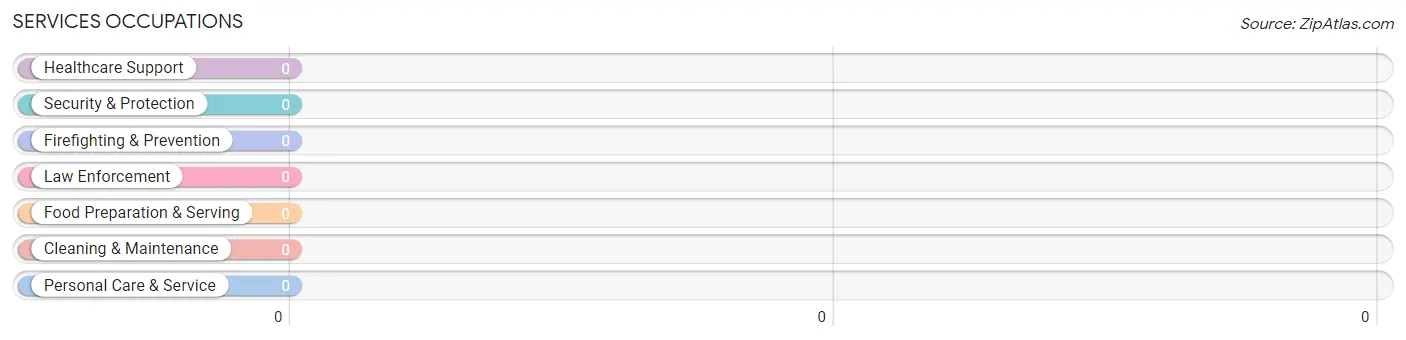
Services Occupations by Sex
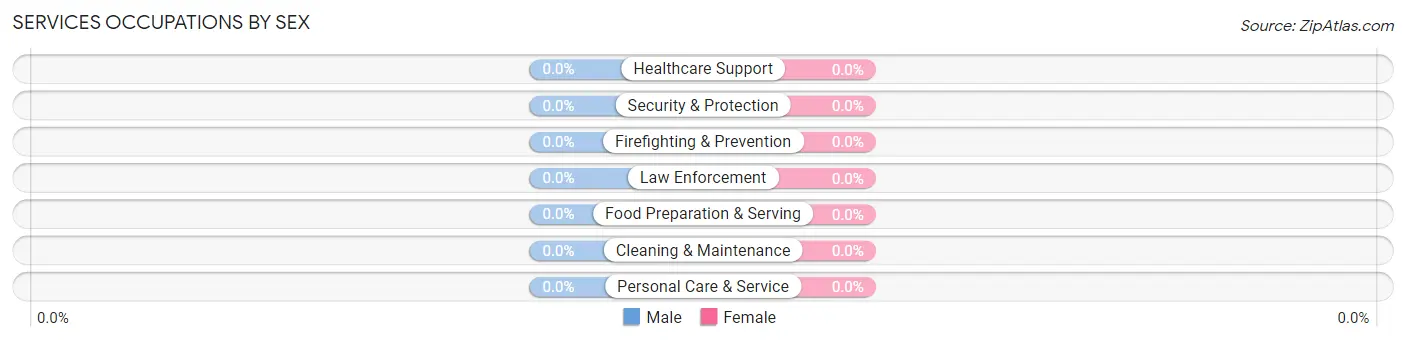
| Occupation | Male | Female |
| Healthcare Support | 0 (0.0%) | 0 (0.0%) |
| Security & Protection | 0 (0.0%) | 0 (0.0%) |
| Firefighting & Prevention | 0 (0.0%) | 0 (0.0%) |
| Law Enforcement | 0 (0.0%) | 0 (0.0%) |
| Food Preparation & Serving | 0 (0.0%) | 0 (0.0%) |
| Cleaning & Maintenance | 0 (0.0%) | 0 (0.0%) |
| Personal Care & Service | 0 (0.0%) | 0 (0.0%) |
| Total (Category) | 0 (0.0%) | 0 (0.0%) |
| Total (Overall) | 35 (100.0%) | 0 (0.0%) |
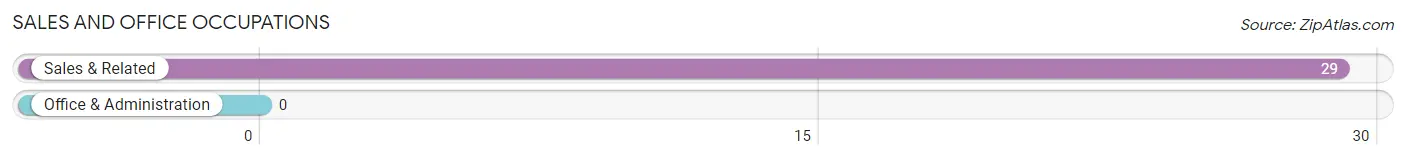
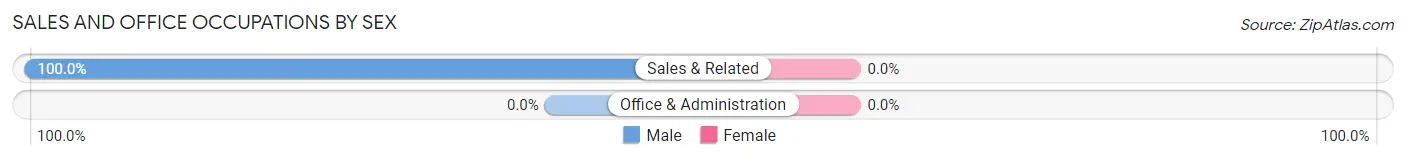
Sales and Office Occupations
The most common Sales and Office occupations in Starks are , and Sales & Related (29 | 82.9%).
Sales and Office Occupations by Sex
| Occupation | Male | Female |
| Sales & Related | 29 (100.0%) | 0 (0.0%) |
| Office & Administration | 0 (0.0%) | 0 (0.0%) |
| Total (Category) | 29 (100.0%) | 0 (0.0%) |
| Total (Overall) | 35 (100.0%) | 0 (0.0%) |
Natural Resources, Construction and Maintenance Occupations
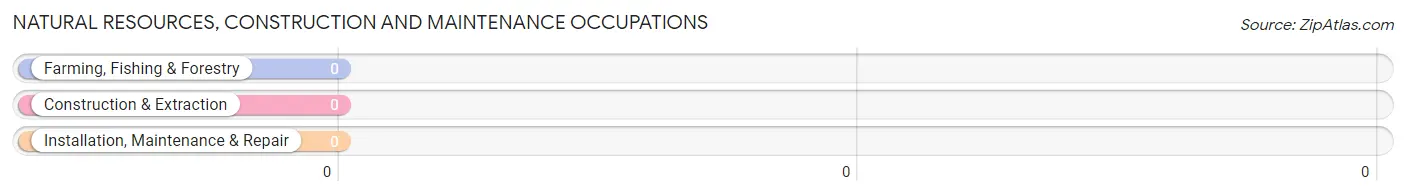
Natural Resources, Construction and Maintenance Occupations by Sex
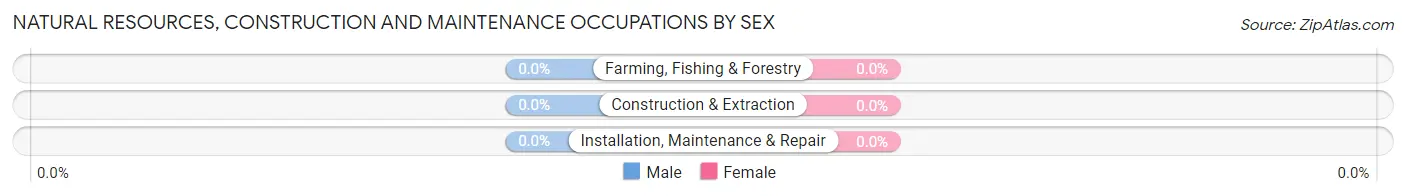
| Occupation | Male | Female |
| Farming, Fishing & Forestry | 0 (0.0%) | 0 (0.0%) |
| Construction & Extraction | 0 (0.0%) | 0 (0.0%) |
| Installation, Maintenance & Repair | 0 (0.0%) | 0 (0.0%) |
| Total (Category) | 0 (0.0%) | 0 (0.0%) |
| Total (Overall) | 35 (100.0%) | 0 (0.0%) |
Production, Transportation and Moving Occupations
Production, Transportation and Moving Occupations by Sex
| Occupation | Male | Female |
| Production | 0 (0.0%) | 0 (0.0%) |
| Transportation | 0 (0.0%) | 0 (0.0%) |
| Material Moving | 0 (0.0%) | 0 (0.0%) |
| Total (Category) | 0 (0.0%) | 0 (0.0%) |
| Total (Overall) | 35 (100.0%) | 0 (0.0%) |
Employment Industries by Sex in Starks
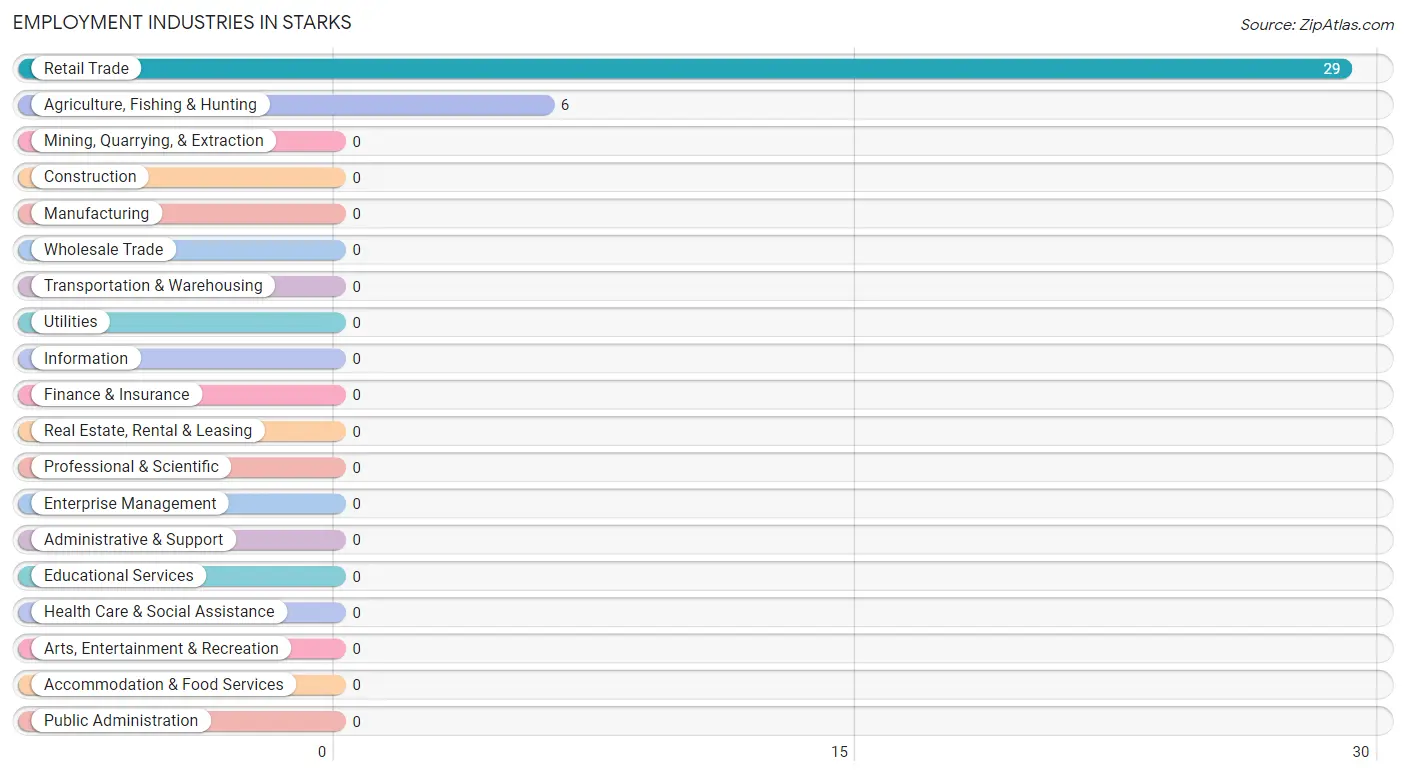
Employment Industries in Starks
The major employment industries in Starks include Retail Trade (29 | 82.9%), and Agriculture, Fishing & Hunting (6 | 17.1%).
Employment Industries by Sex in Starks
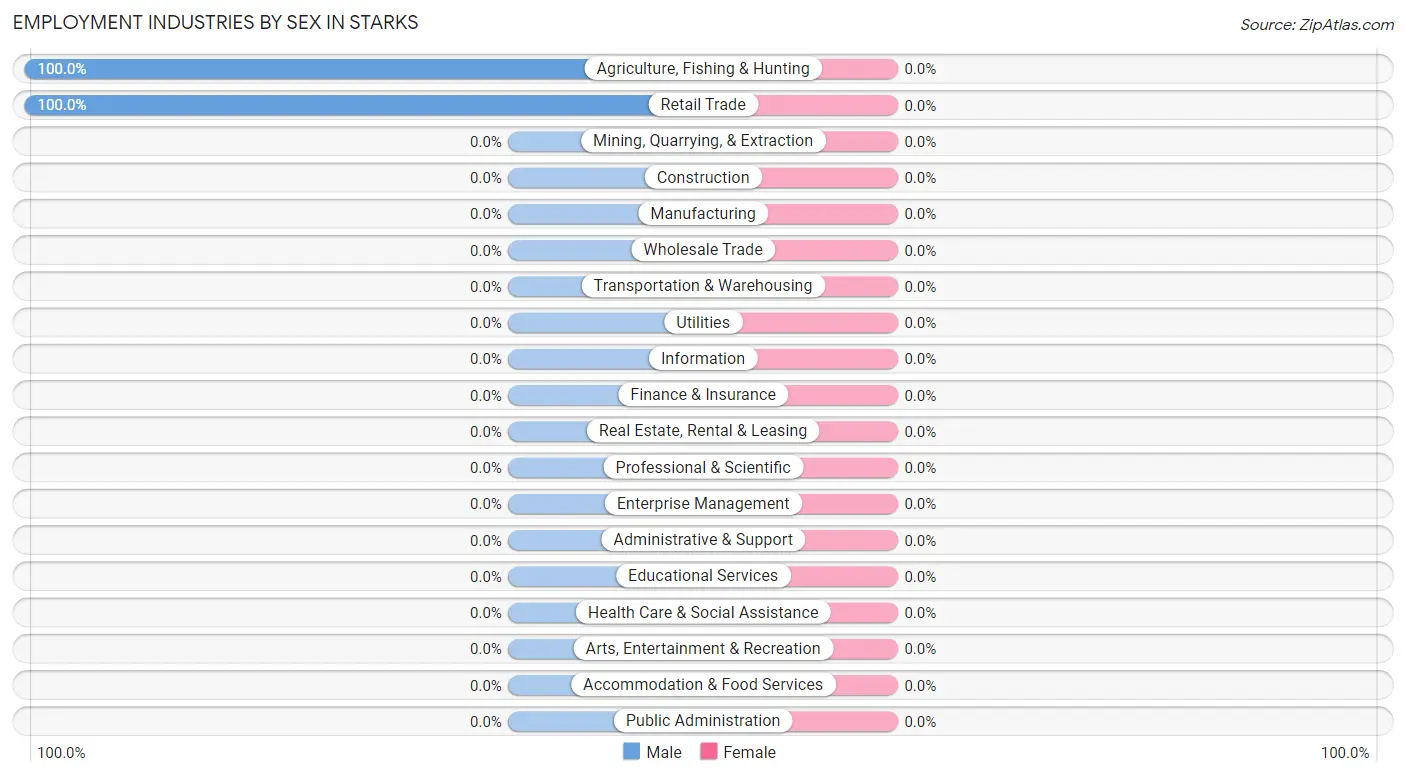
| Industry | Male | Female |
| Agriculture, Fishing & Hunting | 6 (100.0%) | 0 (0.0%) |
| Mining, Quarrying, & Extraction | 0 (0.0%) | 0 (0.0%) |
| Construction | 0 (0.0%) | 0 (0.0%) |
| Manufacturing | 0 (0.0%) | 0 (0.0%) |
| Wholesale Trade | 0 (0.0%) | 0 (0.0%) |
| Retail Trade | 29 (100.0%) | 0 (0.0%) |
| Transportation & Warehousing | 0 (0.0%) | 0 (0.0%) |
| Utilities | 0 (0.0%) | 0 (0.0%) |
| Information | 0 (0.0%) | 0 (0.0%) |
| Finance & Insurance | 0 (0.0%) | 0 (0.0%) |
| Real Estate, Rental & Leasing | 0 (0.0%) | 0 (0.0%) |
| Professional & Scientific | 0 (0.0%) | 0 (0.0%) |
| Enterprise Management | 0 (0.0%) | 0 (0.0%) |
| Administrative & Support | 0 (0.0%) | 0 (0.0%) |
| Educational Services | 0 (0.0%) | 0 (0.0%) |
| Health Care & Social Assistance | 0 (0.0%) | 0 (0.0%) |
| Arts, Entertainment & Recreation | 0 (0.0%) | 0 (0.0%) |
| Accommodation & Food Services | 0 (0.0%) | 0 (0.0%) |
| Public Administration | 0 (0.0%) | 0 (0.0%) |
| Total | 35 (100.0%) | 0 (0.0%) |
Education in Starks
School Enrollment in Starks
The most common levels of schooling among the 41 students in Starks are high school (29 | 70.7%), and middle school (12 | 29.3%).
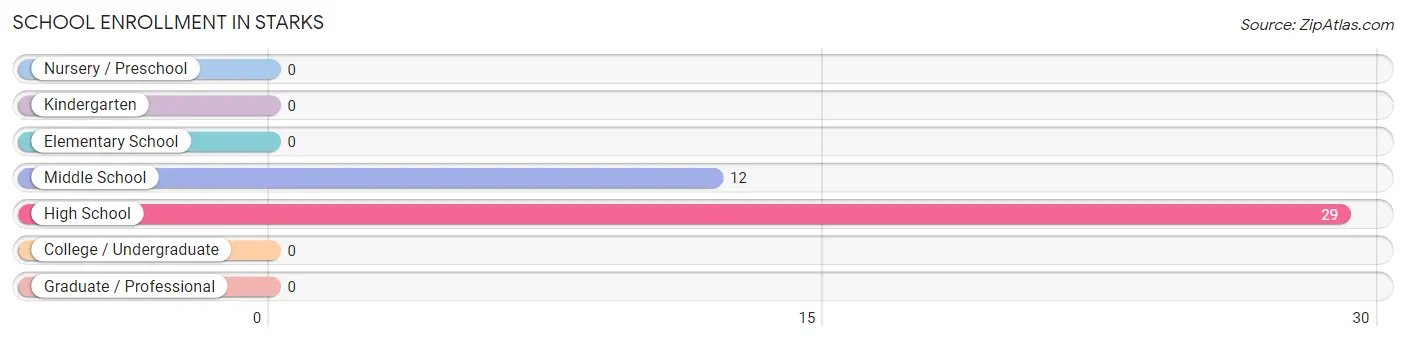
| School Level | # Students | % Students |
| Nursery / Preschool | 0 | 0.0% |
| Kindergarten | 0 | 0.0% |
| Elementary School | 0 | 0.0% |
| Middle School | 12 | 29.3% |
| High School | 29 | 70.7% |
| College / Undergraduate | 0 | 0.0% |
| Graduate / Professional | 0 | 0.0% |
| Total | 41 | 100.0% |
School Enrollment by Age by Funding Source in Starks
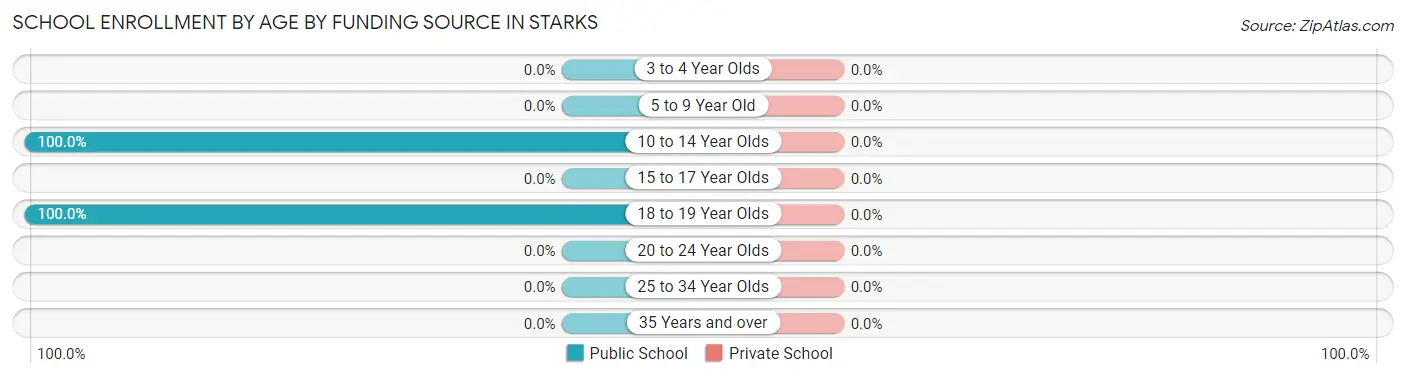
| Age Bracket | Public School | Private School |
| 3 to 4 Year Olds | 0 (0.0%) | 0 (0.0%) |
| 5 to 9 Year Old | 0 (0.0%) | 0 (0.0%) |
| 10 to 14 Year Olds | 12 (100.0%) | 0 (0.0%) |
| 15 to 17 Year Olds | 0 (0.0%) | 0 (0.0%) |
| 18 to 19 Year Olds | 29 (100.0%) | 0 (0.0%) |
| 20 to 24 Year Olds | 0 (0.0%) | 0 (0.0%) |
| 25 to 34 Year Olds | 0 (0.0%) | 0 (0.0%) |
| 35 Years and over | 0 (0.0%) | 0 (0.0%) |
| Total | 41 (100.0%) | 0 (0.0%) |
Educational Attainment by Field of Study in Starks
, and bio, nature & agricultural (18 | 100.0%) are the most common fields of study among 18 individuals in Starks who have obtained a bachelor's degree or higher.
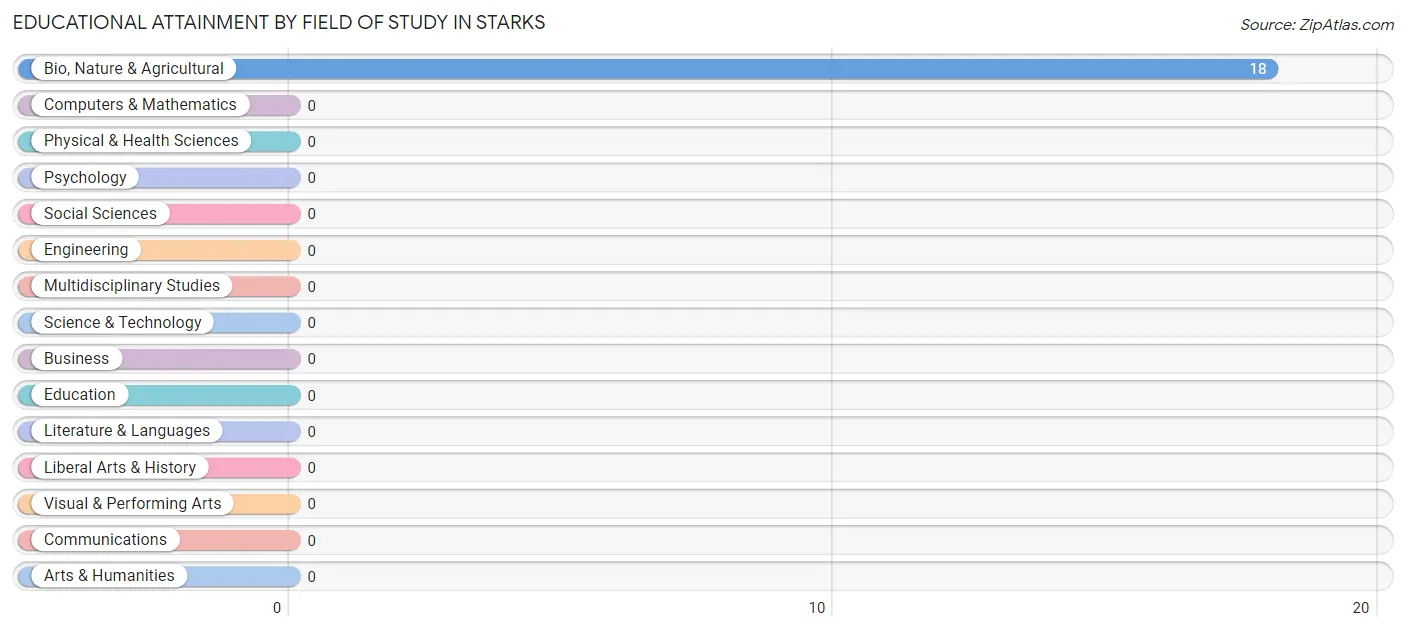
| Field of Study | # Graduates | % Graduates |
| Computers & Mathematics | 0 | 0.0% |
| Bio, Nature & Agricultural | 18 | 100.0% |
| Physical & Health Sciences | 0 | 0.0% |
| Psychology | 0 | 0.0% |
| Social Sciences | 0 | 0.0% |
| Engineering | 0 | 0.0% |
| Multidisciplinary Studies | 0 | 0.0% |
| Science & Technology | 0 | 0.0% |
| Business | 0 | 0.0% |
| Education | 0 | 0.0% |
| Literature & Languages | 0 | 0.0% |
| Liberal Arts & History | 0 | 0.0% |
| Visual & Performing Arts | 0 | 0.0% |
| Communications | 0 | 0.0% |
| Arts & Humanities | 0 | 0.0% |
| Total | 18 | 100.0% |
Transportation & Commute in Starks
Vehicle Availability by Sex in Starks
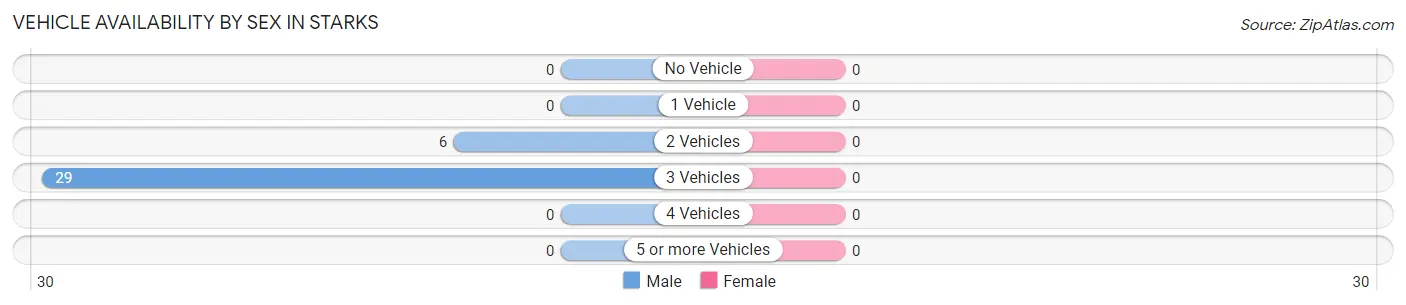
| Vehicles Available | Male | Female |
| No Vehicle | 0 (0.0%) | 0 (0.0%) |
| 1 Vehicle | 0 (0.0%) | 0 (0.0%) |
| 2 Vehicles | 6 (17.1%) | 0 (0.0%) |
| 3 Vehicles | 29 (82.9%) | 0 (0.0%) |
| 4 Vehicles | 0 (0.0%) | 0 (0.0%) |
| 5 or more Vehicles | 0 (0.0%) | 0 (0.0%) |
| Total | 35 (100.0%) | 0 (0.0%) |
Commute Time in Starks
The most frequently occuring commute durations in Starks are 20 to 24 minutes (29 commuters, 82.9%), 90 or more minutes (6 commuters, 17.1%), and less than 5 minutes (0 commuters, 0.0%).
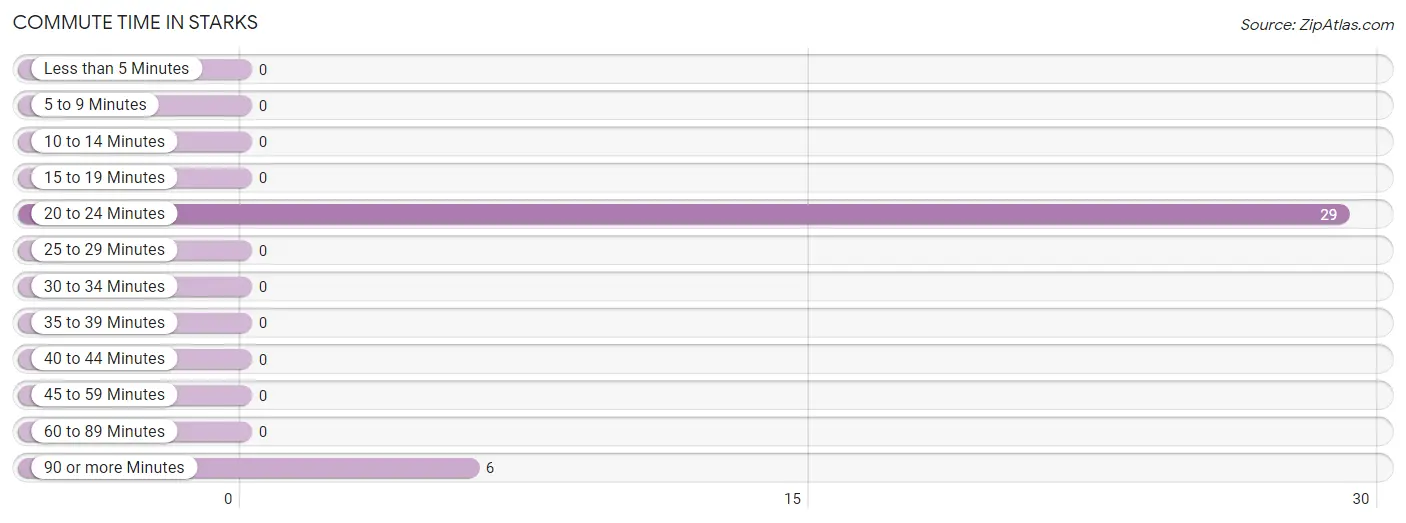
| Commute Time | # Commuters | % Commuters |
| Less than 5 Minutes | 0 | 0.0% |
| 5 to 9 Minutes | 0 | 0.0% |
| 10 to 14 Minutes | 0 | 0.0% |
| 15 to 19 Minutes | 0 | 0.0% |
| 20 to 24 Minutes | 29 | 82.9% |
| 25 to 29 Minutes | 0 | 0.0% |
| 30 to 34 Minutes | 0 | 0.0% |
| 35 to 39 Minutes | 0 | 0.0% |
| 40 to 44 Minutes | 0 | 0.0% |
| 45 to 59 Minutes | 0 | 0.0% |
| 60 to 89 Minutes | 0 | 0.0% |
| 90 or more Minutes | 6 | 17.1% |
Commute Time by Sex in Starks
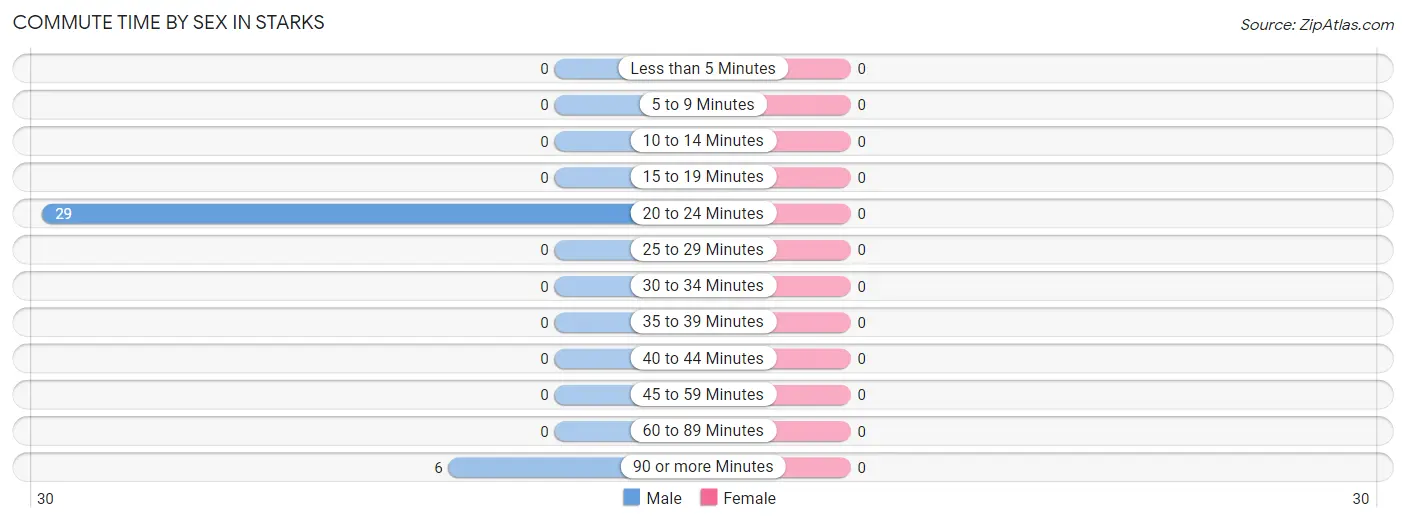
| Commute Time | Male | Female |
| Less than 5 Minutes | 0 (0.0%) | 0 (0.0%) |
| 5 to 9 Minutes | 0 (0.0%) | 0 (0.0%) |
| 10 to 14 Minutes | 0 (0.0%) | 0 (0.0%) |
| 15 to 19 Minutes | 0 (0.0%) | 0 (0.0%) |
| 20 to 24 Minutes | 29 (82.9%) | 0 (0.0%) |
| 25 to 29 Minutes | 0 (0.0%) | 0 (0.0%) |
| 30 to 34 Minutes | 0 (0.0%) | 0 (0.0%) |
| 35 to 39 Minutes | 0 (0.0%) | 0 (0.0%) |
| 40 to 44 Minutes | 0 (0.0%) | 0 (0.0%) |
| 45 to 59 Minutes | 0 (0.0%) | 0 (0.0%) |
| 60 to 89 Minutes | 0 (0.0%) | 0 (0.0%) |
| 90 or more Minutes | 6 (17.1%) | 0 (0.0%) |
Time of Departure to Work by Sex in Starks
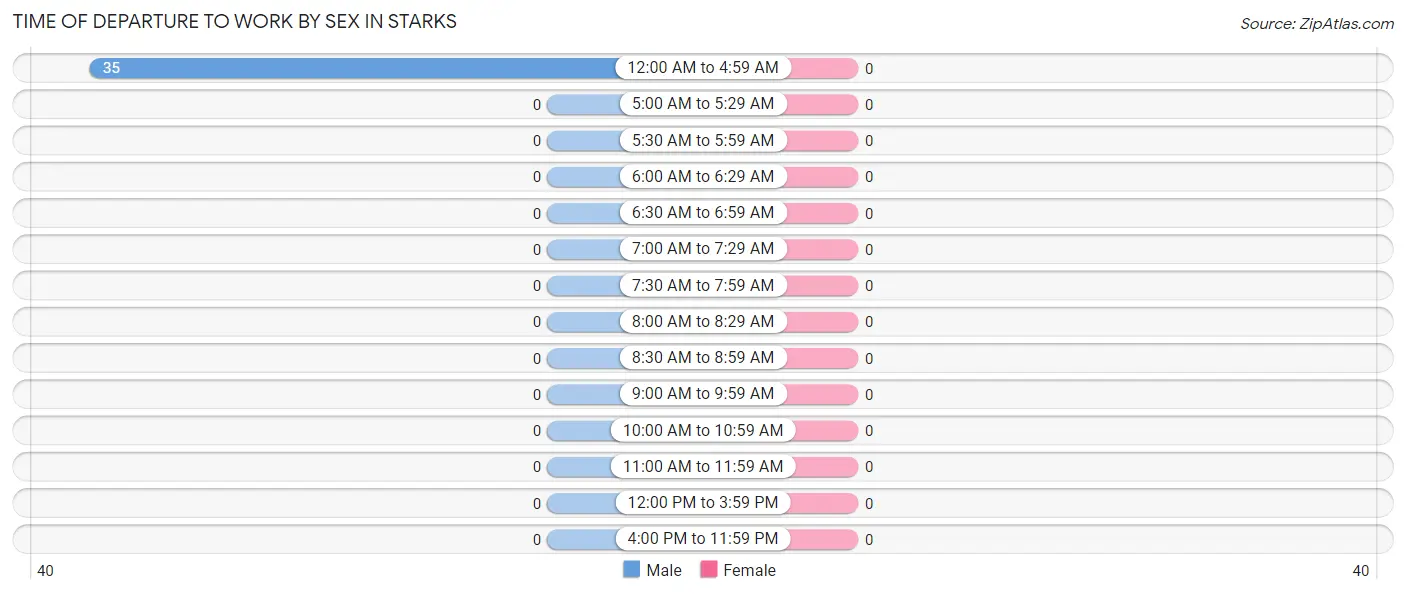
| Time of Departure | Male | Female |
| 12:00 AM to 4:59 AM | 35 (100.0%) | 0 (0.0%) |
| 5:00 AM to 5:29 AM | 0 (0.0%) | 0 (0.0%) |
| 5:30 AM to 5:59 AM | 0 (0.0%) | 0 (0.0%) |
| 6:00 AM to 6:29 AM | 0 (0.0%) | 0 (0.0%) |
| 6:30 AM to 6:59 AM | 0 (0.0%) | 0 (0.0%) |
| 7:00 AM to 7:29 AM | 0 (0.0%) | 0 (0.0%) |
| 7:30 AM to 7:59 AM | 0 (0.0%) | 0 (0.0%) |
| 8:00 AM to 8:29 AM | 0 (0.0%) | 0 (0.0%) |
| 8:30 AM to 8:59 AM | 0 (0.0%) | 0 (0.0%) |
| 9:00 AM to 9:59 AM | 0 (0.0%) | 0 (0.0%) |
| 10:00 AM to 10:59 AM | 0 (0.0%) | 0 (0.0%) |
| 11:00 AM to 11:59 AM | 0 (0.0%) | 0 (0.0%) |
| 12:00 PM to 3:59 PM | 0 (0.0%) | 0 (0.0%) |
| 4:00 PM to 11:59 PM | 0 (0.0%) | 0 (0.0%) |
| Total | 35 (100.0%) | 0 (0.0%) |
Housing Occupancy in Starks
Occupancy by Ownership in Starks
Of the total 151 dwellings in Starks, owner-occupied units account for 44 (29.1%), while renter-occupied units make up 107 (70.9%).
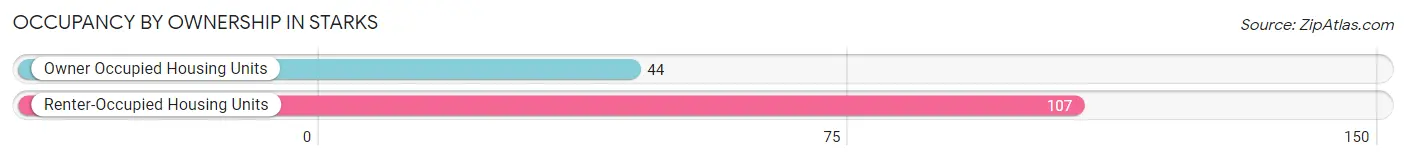
| Occupancy | # Housing Units | % Housing Units |
| Owner Occupied Housing Units | 44 | 29.1% |
| Renter-Occupied Housing Units | 107 | 70.9% |
| Total Occupied Housing Units | 151 | 100.0% |
Occupancy by Household Size in Starks
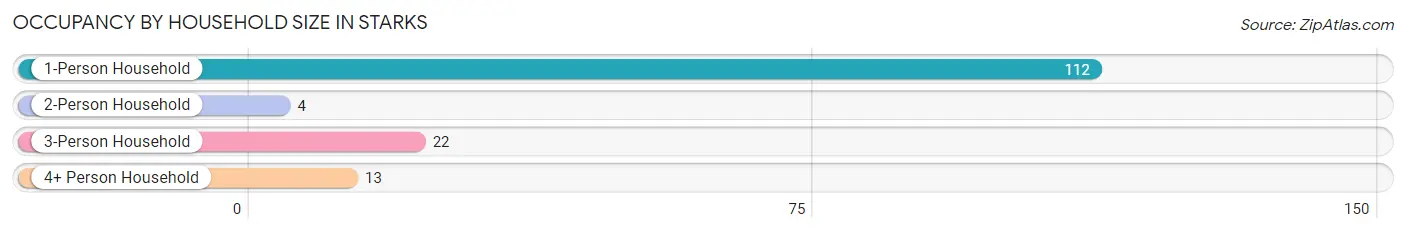
| Household Size | # Housing Units | % Housing Units |
| 1-Person Household | 112 | 74.2% |
| 2-Person Household | 4 | 2.6% |
| 3-Person Household | 22 | 14.6% |
| 4+ Person Household | 13 | 8.6% |
| Total Housing Units | 151 | 100.0% |
Occupancy by Ownership by Household Size in Starks
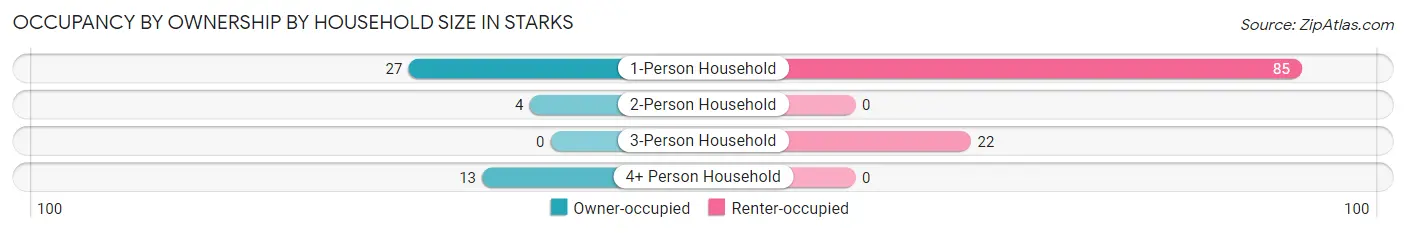
| Household Size | Owner-occupied | Renter-occupied |
| 1-Person Household | 27 (24.1%) | 85 (75.9%) |
| 2-Person Household | 4 (100.0%) | 0 (0.0%) |
| 3-Person Household | 0 (0.0%) | 22 (100.0%) |
| 4+ Person Household | 13 (100.0%) | 0 (0.0%) |
| Total Housing Units | 44 (29.1%) | 107 (70.9%) |
Occupancy by Educational Attainment in Starks
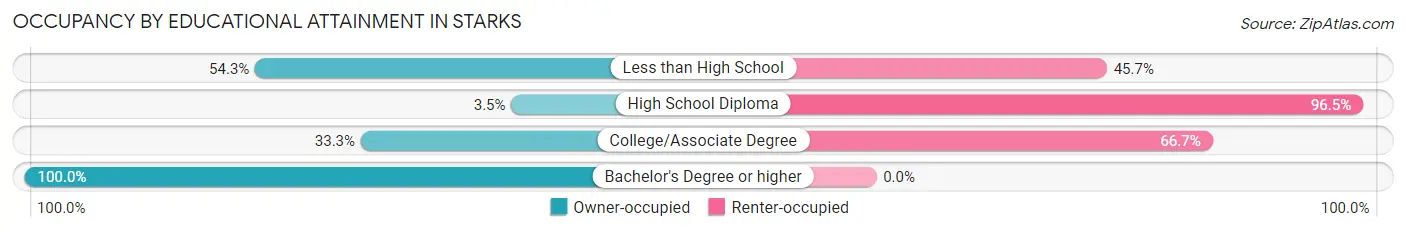
| Household Size | Owner-occupied | Renter-occupied |
| Less than High School | 19 (54.3%) | 16 (45.7%) |
| High School Diploma | 3 (3.5%) | 83 (96.5%) |
| College/Associate Degree | 4 (33.3%) | 8 (66.7%) |
| Bachelor's Degree or higher | 18 (100.0%) | 0 (0.0%) |
Occupancy by Age of Householder in Starks
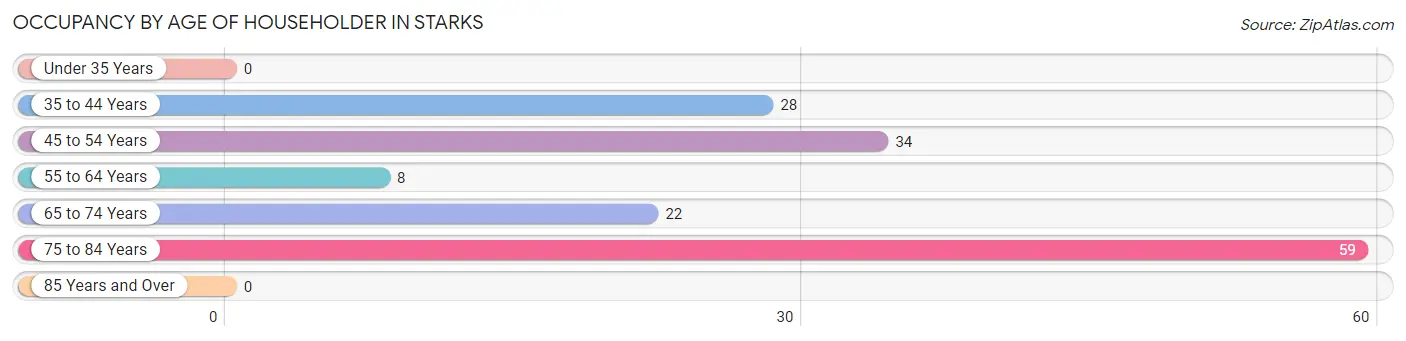
| Age Bracket | # Households | % Households |
| Under 35 Years | 0 | 0.0% |
| 35 to 44 Years | 28 | 18.5% |
| 45 to 54 Years | 34 | 22.5% |
| 55 to 64 Years | 8 | 5.3% |
| 65 to 74 Years | 22 | 14.6% |
| 75 to 84 Years | 59 | 39.1% |
| 85 Years and Over | 0 | 0.0% |
| Total | 151 | 100.0% |
Housing Finances in Starks
Median Income by Occupancy in Starks
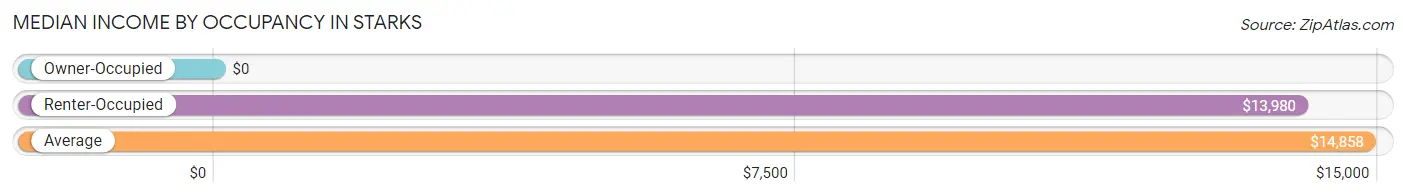
| Occupancy Type | # Households | Median Income |
| Owner-Occupied | 44 (29.1%) | $0 |
| Renter-Occupied | 107 (70.9%) | $13,980 |
| Average | 151 (100.0%) | $14,858 |
Occupancy by Householder Income Bracket in Starks
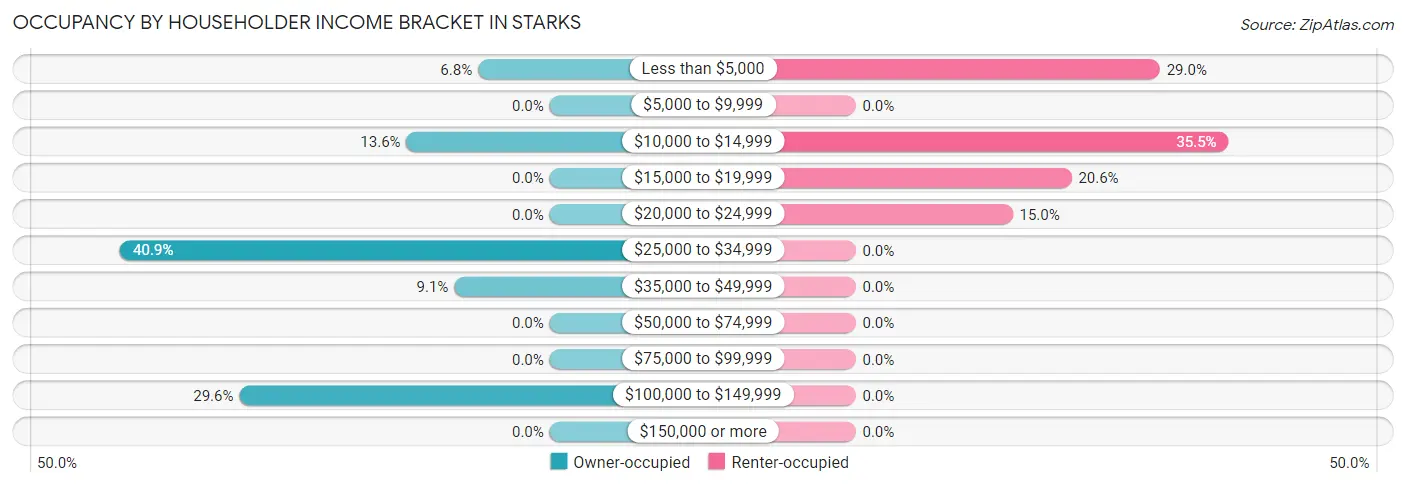
| Income Bracket | Owner-occupied | Renter-occupied |
| Less than $5,000 | 3 (6.8%) | 31 (29.0%) |
| $5,000 to $9,999 | 0 (0.0%) | 0 (0.0%) |
| $10,000 to $14,999 | 6 (13.6%) | 38 (35.5%) |
| $15,000 to $19,999 | 0 (0.0%) | 22 (20.6%) |
| $20,000 to $24,999 | 0 (0.0%) | 16 (14.9%) |
| $25,000 to $34,999 | 18 (40.9%) | 0 (0.0%) |
| $35,000 to $49,999 | 4 (9.1%) | 0 (0.0%) |
| $50,000 to $74,999 | 0 (0.0%) | 0 (0.0%) |
| $75,000 to $99,999 | 0 (0.0%) | 0 (0.0%) |
| $100,000 to $149,999 | 13 (29.5%) | 0 (0.0%) |
| $150,000 or more | 0 (0.0%) | 0 (0.0%) |
| Total | 44 (100.0%) | 107 (100.0%) |
Monthly Housing Cost Tiers in Starks
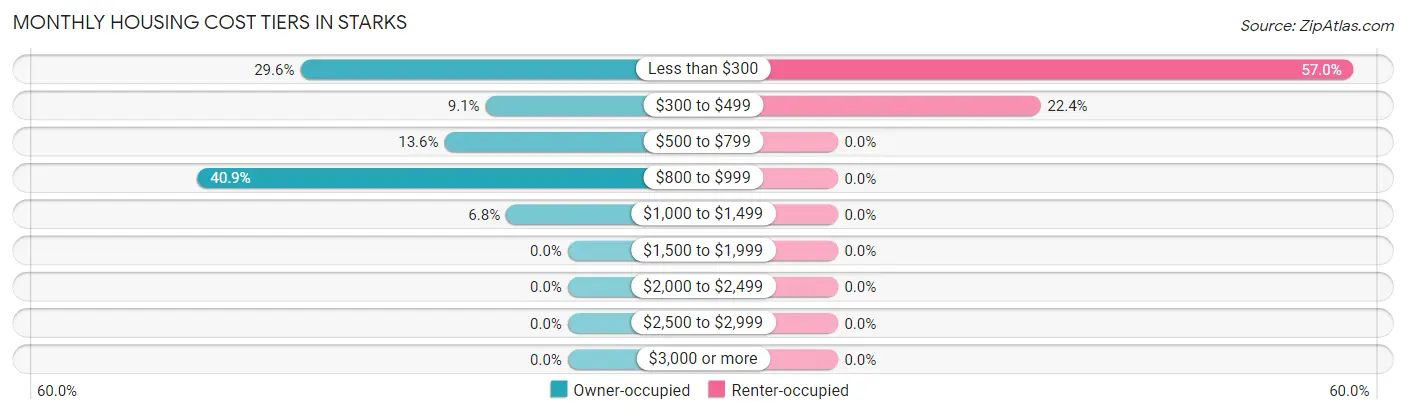
| Monthly Cost | Owner-occupied | Renter-occupied |
| Less than $300 | 13 (29.5%) | 61 (57.0%) |
| $300 to $499 | 4 (9.1%) | 24 (22.4%) |
| $500 to $799 | 6 (13.6%) | 0 (0.0%) |
| $800 to $999 | 18 (40.9%) | 0 (0.0%) |
| $1,000 to $1,499 | 3 (6.8%) | 0 (0.0%) |
| $1,500 to $1,999 | 0 (0.0%) | 0 (0.0%) |
| $2,000 to $2,499 | 0 (0.0%) | 0 (0.0%) |
| $2,500 to $2,999 | 0 (0.0%) | 0 (0.0%) |
| $3,000 or more | 0 (0.0%) | 0 (0.0%) |
| Total | 44 (100.0%) | 107 (100.0%) |
Physical Housing Characteristics in Starks
Housing Structures in Starks
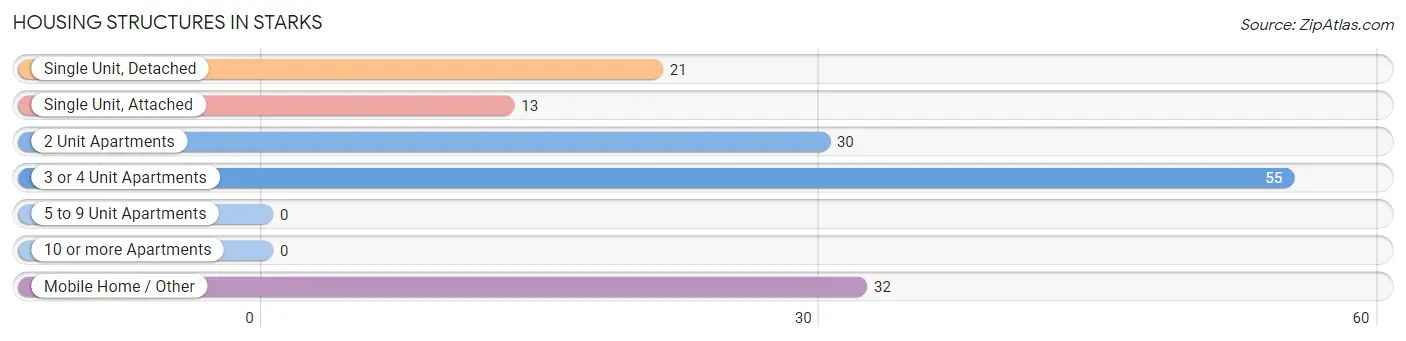
| Structure Type | # Housing Units | % Housing Units |
| Single Unit, Detached | 21 | 13.9% |
| Single Unit, Attached | 13 | 8.6% |
| 2 Unit Apartments | 30 | 19.9% |
| 3 or 4 Unit Apartments | 55 | 36.4% |
| 5 to 9 Unit Apartments | 0 | 0.0% |
| 10 or more Apartments | 0 | 0.0% |
| Mobile Home / Other | 32 | 21.2% |
| Total | 151 | 100.0% |
Housing Structures by Occupancy in Starks
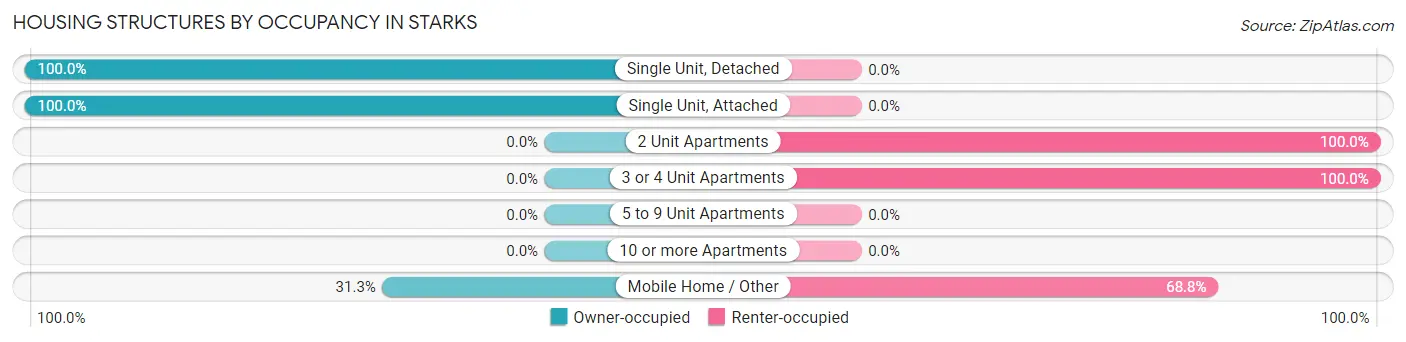
| Structure Type | Owner-occupied | Renter-occupied |
| Single Unit, Detached | 21 (100.0%) | 0 (0.0%) |
| Single Unit, Attached | 13 (100.0%) | 0 (0.0%) |
| 2 Unit Apartments | 0 (0.0%) | 30 (100.0%) |
| 3 or 4 Unit Apartments | 0 (0.0%) | 55 (100.0%) |
| 5 to 9 Unit Apartments | 0 (0.0%) | 0 (0.0%) |
| 10 or more Apartments | 0 (0.0%) | 0 (0.0%) |
| Mobile Home / Other | 10 (31.2%) | 22 (68.8%) |
| Total | 44 (29.1%) | 107 (70.9%) |
Housing Structures by Number of Rooms in Starks
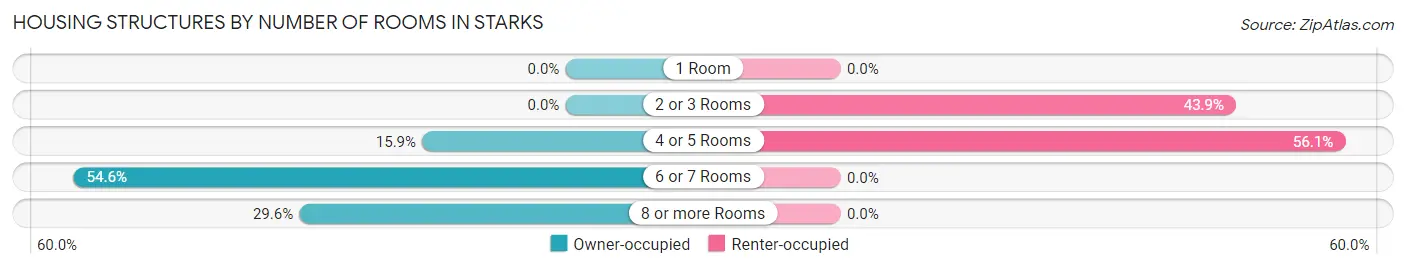
| Number of Rooms | Owner-occupied | Renter-occupied |
| 1 Room | 0 (0.0%) | 0 (0.0%) |
| 2 or 3 Rooms | 0 (0.0%) | 47 (43.9%) |
| 4 or 5 Rooms | 7 (15.9%) | 60 (56.1%) |
| 6 or 7 Rooms | 24 (54.5%) | 0 (0.0%) |
| 8 or more Rooms | 13 (29.5%) | 0 (0.0%) |
| Total | 44 (100.0%) | 107 (100.0%) |
Housing Structure by Heating Type in Starks
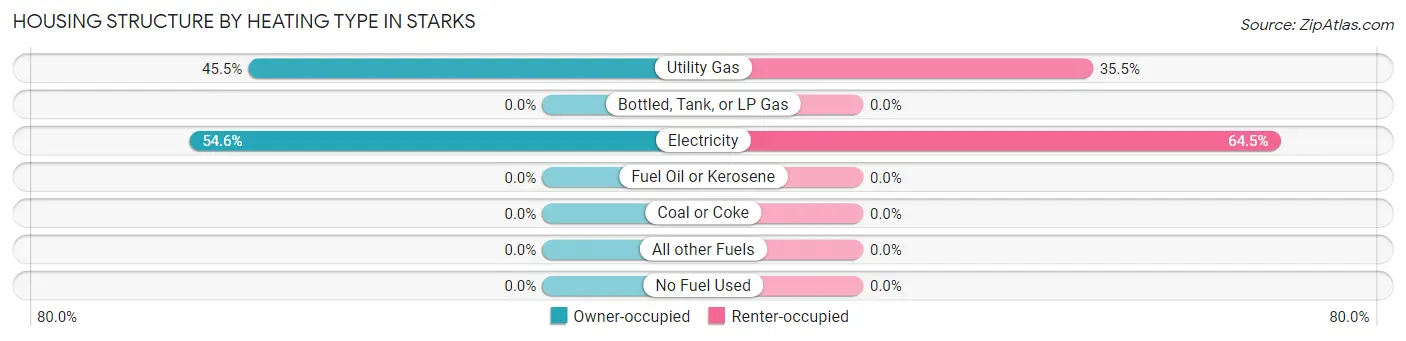
| Heating Type | Owner-occupied | Renter-occupied |
| Utility Gas | 20 (45.5%) | 38 (35.5%) |
| Bottled, Tank, or LP Gas | 0 (0.0%) | 0 (0.0%) |
| Electricity | 24 (54.5%) | 69 (64.5%) |
| Fuel Oil or Kerosene | 0 (0.0%) | 0 (0.0%) |
| Coal or Coke | 0 (0.0%) | 0 (0.0%) |
| All other Fuels | 0 (0.0%) | 0 (0.0%) |
| No Fuel Used | 0 (0.0%) | 0 (0.0%) |
| Total | 44 (100.0%) | 107 (100.0%) |
Household Vehicle Usage in Starks
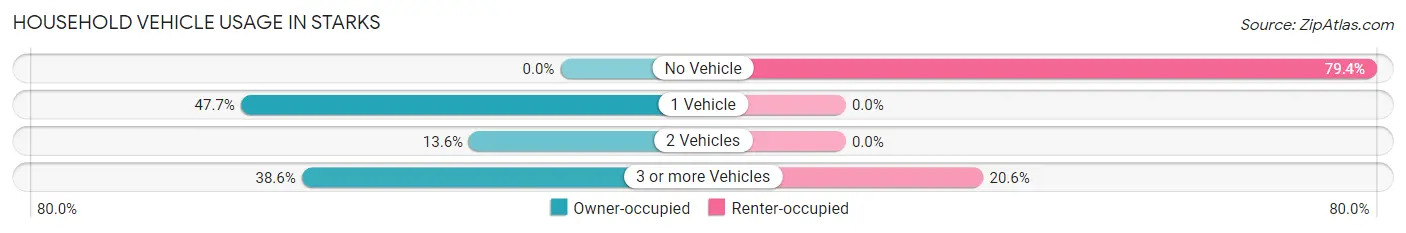
| Vehicles per Household | Owner-occupied | Renter-occupied |
| No Vehicle | 0 (0.0%) | 85 (79.4%) |
| 1 Vehicle | 21 (47.7%) | 0 (0.0%) |
| 2 Vehicles | 6 (13.6%) | 0 (0.0%) |
| 3 or more Vehicles | 17 (38.6%) | 22 (20.6%) |
| Total | 44 (100.0%) | 107 (100.0%) |
Real Estate & Mortgages in Starks
Real Estate and Mortgage Overview in Starks
| Characteristic | Without Mortgage | With Mortgage |
| Housing Units | 20 | 24 |
| Median Property Value | $136,500 | $0 |
| Median Household Income | - | - |
| Monthly Housing Costs | $288 | $0 |
| Real Estate Taxes | - | - |
Property Value by Mortgage Status in Starks
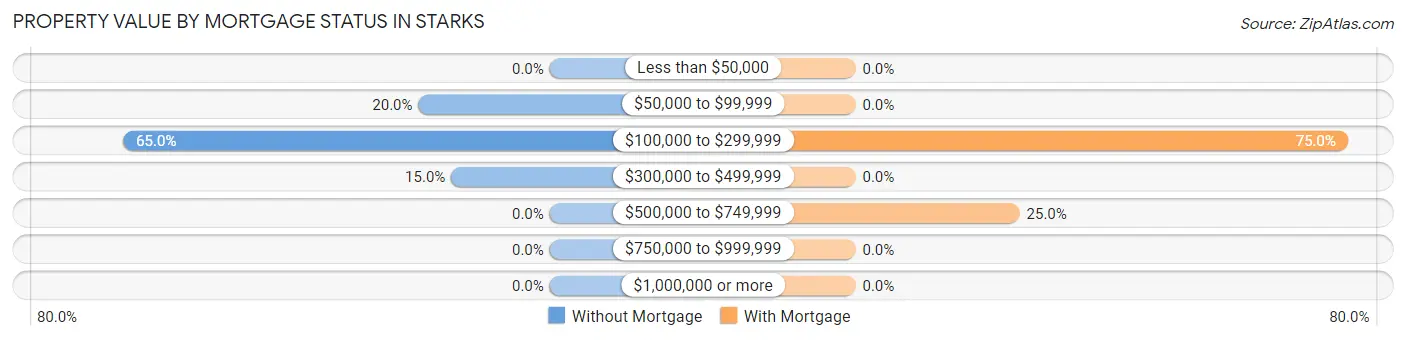
| Property Value | Without Mortgage | With Mortgage |
| Less than $50,000 | 0 (0.0%) | 0 (0.0%) |
| $50,000 to $99,999 | 4 (20.0%) | 0 (0.0%) |
| $100,000 to $299,999 | 13 (65.0%) | 18 (75.0%) |
| $300,000 to $499,999 | 3 (15.0%) | 0 (0.0%) |
| $500,000 to $749,999 | 0 (0.0%) | 6 (25.0%) |
| $750,000 to $999,999 | 0 (0.0%) | 0 (0.0%) |
| $1,000,000 or more | 0 (0.0%) | 0 (0.0%) |
| Total | 20 (100.0%) | 24 (100.0%) |
Household Income by Mortgage Status in Starks
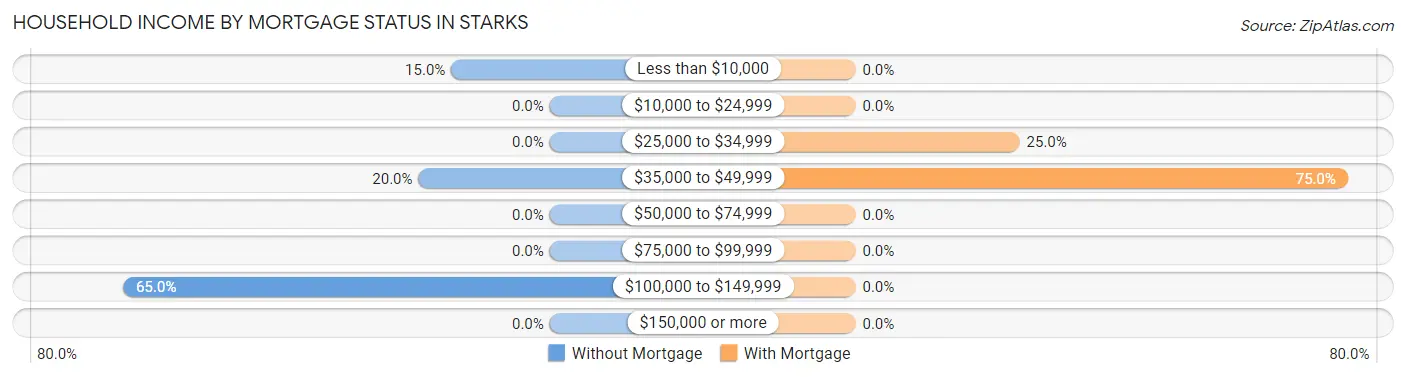
| Household Income | Without Mortgage | With Mortgage |
| Less than $10,000 | 3 (15.0%) | 0 (0.0%) |
| $10,000 to $24,999 | 0 (0.0%) | 0 (0.0%) |
| $25,000 to $34,999 | 0 (0.0%) | 6 (25.0%) |
| $35,000 to $49,999 | 4 (20.0%) | 18 (75.0%) |
| $50,000 to $74,999 | 0 (0.0%) | 0 (0.0%) |
| $75,000 to $99,999 | 0 (0.0%) | 0 (0.0%) |
| $100,000 to $149,999 | 13 (65.0%) | 0 (0.0%) |
| $150,000 or more | 0 (0.0%) | 0 (0.0%) |
| Total | 20 (100.0%) | 24 (100.0%) |
Property Value to Household Income Ratio in Starks
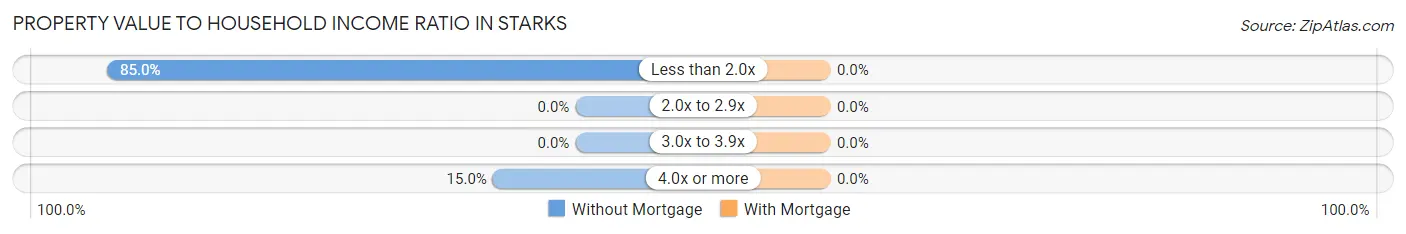
| Value-to-Income Ratio | Without Mortgage | With Mortgage |
| Less than 2.0x | 17 (85.0%) | 0 (0.0%) |
| 2.0x to 2.9x | 0 (0.0%) | 0 (0.0%) |
| 3.0x to 3.9x | 0 (0.0%) | 0 (0.0%) |
| 4.0x or more | 3 (15.0%) | 0 (0.0%) |
| Total | 20 (100.0%) | 24 (100.0%) |
Real Estate Taxes by Mortgage Status in Starks
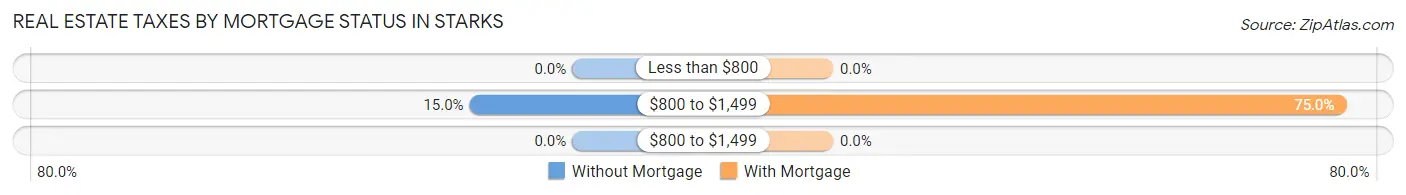
| Property Taxes | Without Mortgage | With Mortgage |
| Less than $800 | 0 (0.0%) | 0 (0.0%) |
| $800 to $1,499 | 3 (15.0%) | 18 (75.0%) |
| $800 to $1,499 | 0 (0.0%) | 0 (0.0%) |
| Total | 20 (100.0%) | 24 (100.0%) |
Health & Disability in Starks
Health Insurance Coverage by Age in Starks
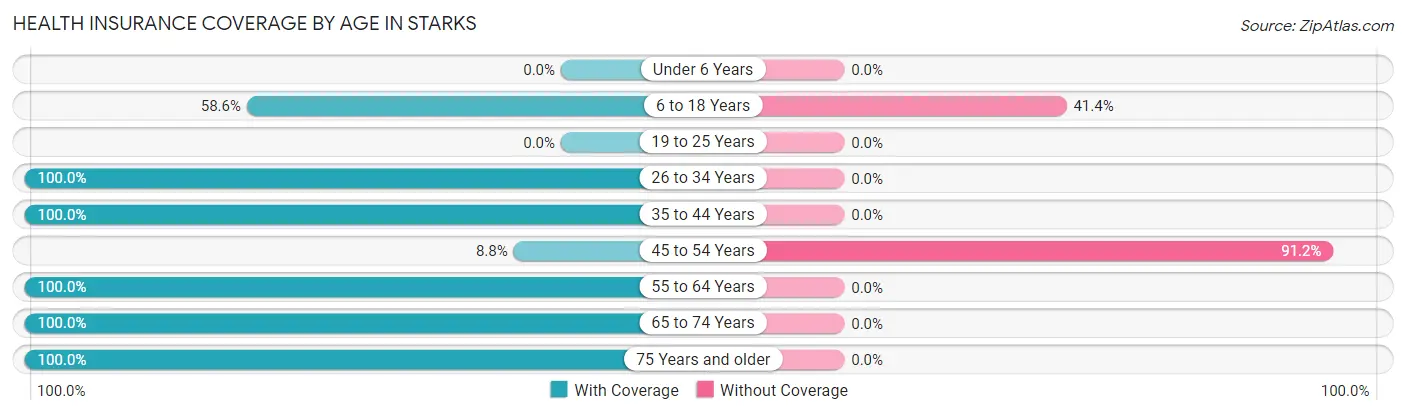
| Age Bracket | With Coverage | Without Coverage |
| Under 6 Years | 0 (0.0%) | 0 (0.0%) |
| 6 to 18 Years | 41 (58.6%) | 29 (41.4%) |
| 19 to 25 Years | 0 (0.0%) | 0 (0.0%) |
| 26 to 34 Years | 20 (100.0%) | 0 (0.0%) |
| 35 to 44 Years | 28 (100.0%) | 0 (0.0%) |
| 45 to 54 Years | 3 (8.8%) | 31 (91.2%) |
| 55 to 64 Years | 8 (100.0%) | 0 (0.0%) |
| 65 to 74 Years | 26 (100.0%) | 0 (0.0%) |
| 75 Years and older | 70 (100.0%) | 0 (0.0%) |
| Total | 196 (76.6%) | 60 (23.4%) |
Health Insurance Coverage by Citizenship Status in Starks
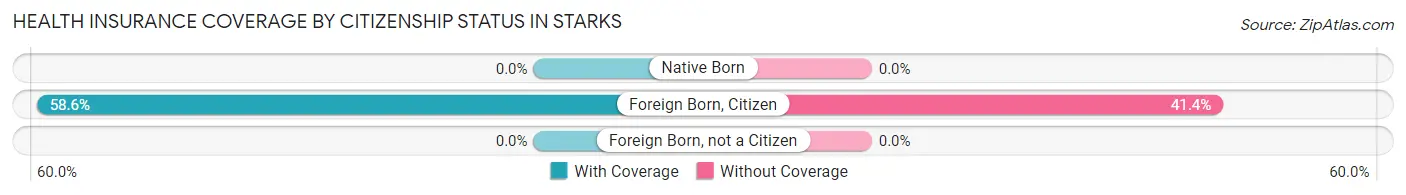
| Citizenship Status | With Coverage | Without Coverage |
| Native Born | 0 (0.0%) | 0 (0.0%) |
| Foreign Born, Citizen | 41 (58.6%) | 29 (41.4%) |
| Foreign Born, not a Citizen | 0 (0.0%) | 0 (0.0%) |
Health Insurance Coverage by Household Income in Starks
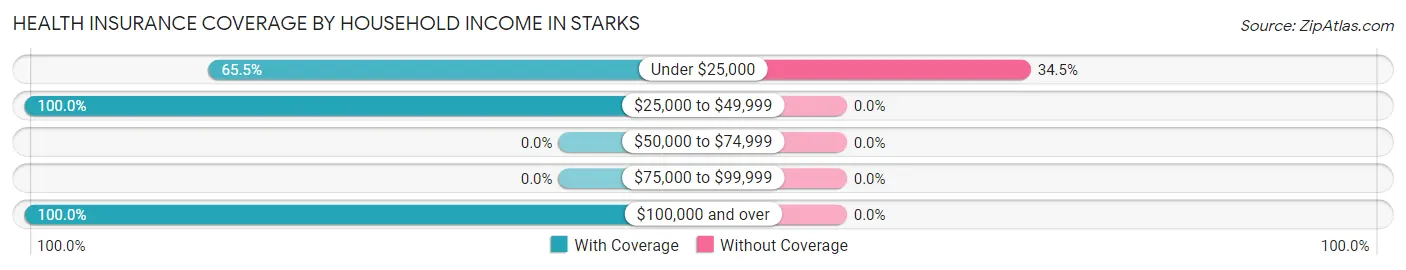
| Household Income | With Coverage | Without Coverage |
| Under $25,000 | 114 (65.5%) | 60 (34.5%) |
| $25,000 to $49,999 | 26 (100.0%) | 0 (0.0%) |
| $50,000 to $74,999 | 0 (0.0%) | 0 (0.0%) |
| $75,000 to $99,999 | 0 (0.0%) | 0 (0.0%) |
| $100,000 and over | 56 (100.0%) | 0 (0.0%) |
Public vs Private Health Insurance Coverage by Age in Starks
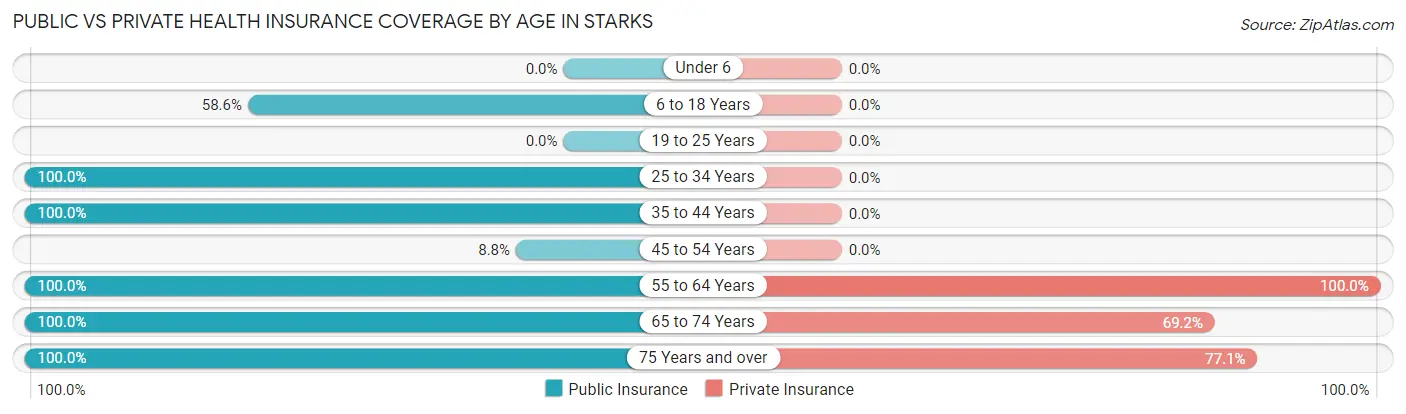
| Age Bracket | Public Insurance | Private Insurance |
| Under 6 | 0 (0.0%) | 0 (0.0%) |
| 6 to 18 Years | 41 (58.6%) | 0 (0.0%) |
| 19 to 25 Years | 0 (0.0%) | 0 (0.0%) |
| 25 to 34 Years | 20 (100.0%) | 0 (0.0%) |
| 35 to 44 Years | 28 (100.0%) | 0 (0.0%) |
| 45 to 54 Years | 3 (8.8%) | 0 (0.0%) |
| 55 to 64 Years | 8 (100.0%) | 8 (100.0%) |
| 65 to 74 Years | 26 (100.0%) | 18 (69.2%) |
| 75 Years and over | 70 (100.0%) | 54 (77.1%) |
| Total | 196 (76.6%) | 80 (31.2%) |
Disability Status by Sex by Age in Starks
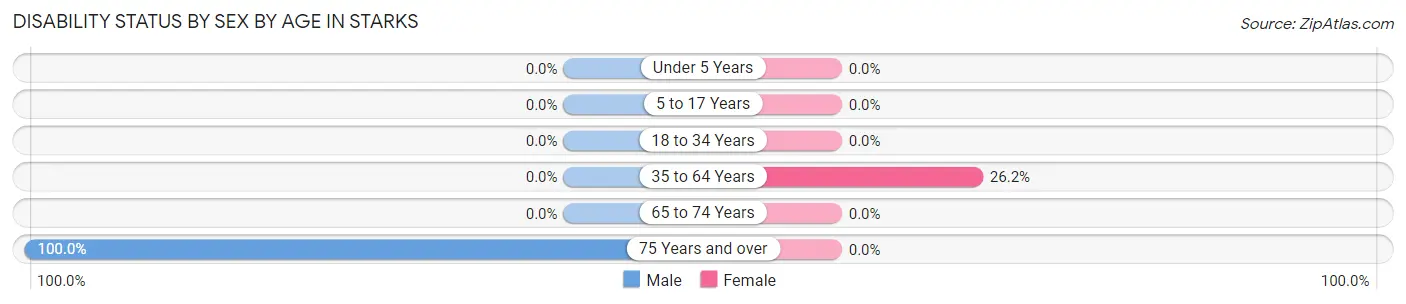
| Age Bracket | Male | Female |
| Under 5 Years | 0 (0.0%) | 0 (0.0%) |
| 5 to 17 Years | 0 (0.0%) | 0 (0.0%) |
| 18 to 34 Years | 0 (0.0%) | 0 (0.0%) |
| 35 to 64 Years | 0 (0.0%) | 11 (26.2%) |
| 65 to 74 Years | 0 (0.0%) | 0 (0.0%) |
| 75 Years and over | 13 (100.0%) | 0 (0.0%) |
Disability Class by Sex by Age in Starks
Disability Class: Hearing Difficulty
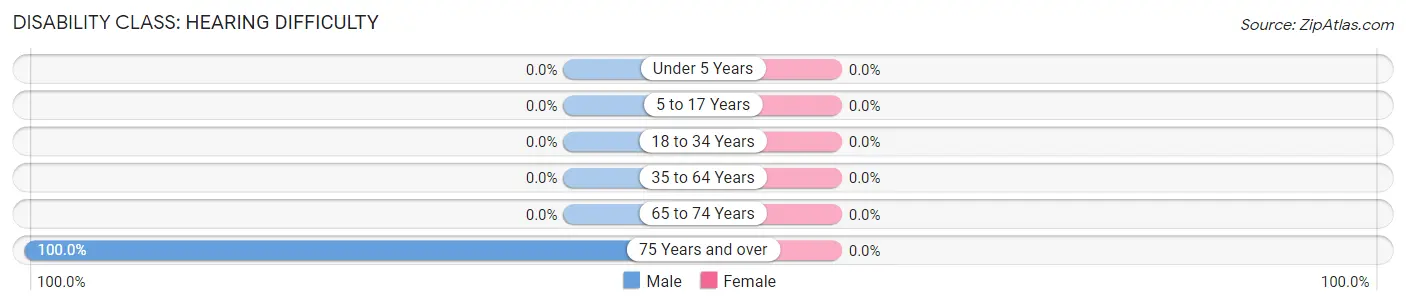
| Age Bracket | Male | Female |
| Under 5 Years | 0 (0.0%) | 0 (0.0%) |
| 5 to 17 Years | 0 (0.0%) | 0 (0.0%) |
| 18 to 34 Years | 0 (0.0%) | 0 (0.0%) |
| 35 to 64 Years | 0 (0.0%) | 0 (0.0%) |
| 65 to 74 Years | 0 (0.0%) | 0 (0.0%) |
| 75 Years and over | 13 (100.0%) | 0 (0.0%) |
Disability Class: Vision Difficulty
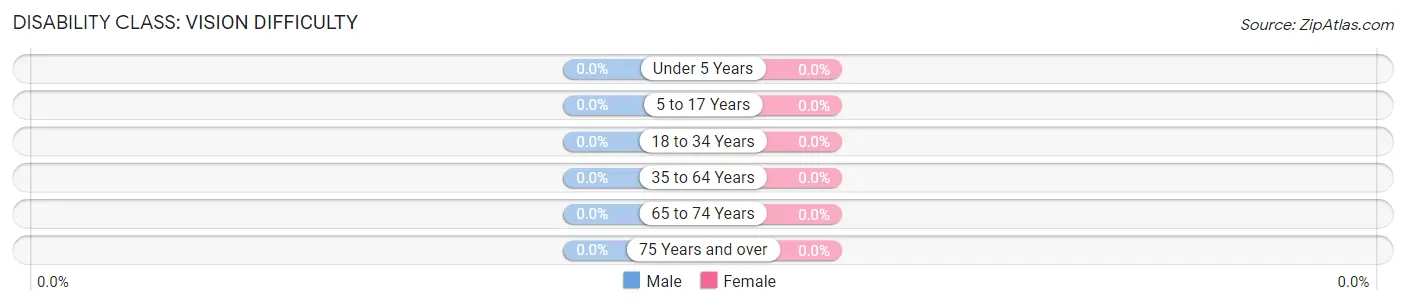
| Age Bracket | Male | Female |
| Under 5 Years | 0 (0.0%) | 0 (0.0%) |
| 5 to 17 Years | 0 (0.0%) | 0 (0.0%) |
| 18 to 34 Years | 0 (0.0%) | 0 (0.0%) |
| 35 to 64 Years | 0 (0.0%) | 0 (0.0%) |
| 65 to 74 Years | 0 (0.0%) | 0 (0.0%) |
| 75 Years and over | 0 (0.0%) | 0 (0.0%) |
Disability Class: Cognitive Difficulty
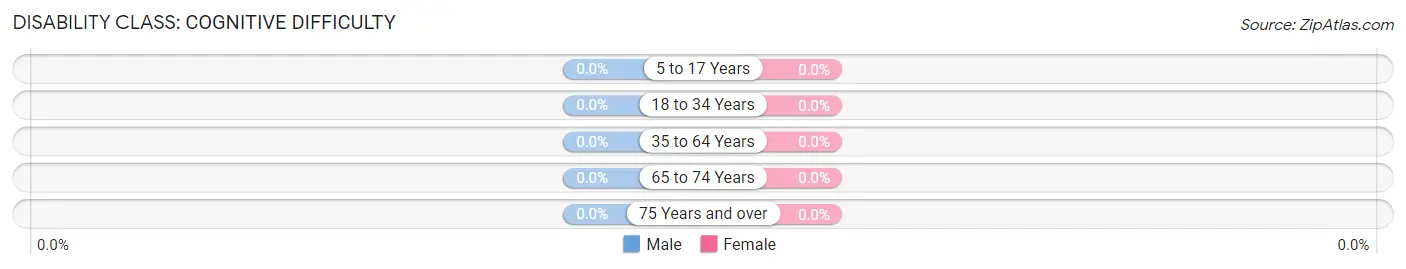
| Age Bracket | Male | Female |
| 5 to 17 Years | 0 (0.0%) | 0 (0.0%) |
| 18 to 34 Years | 0 (0.0%) | 0 (0.0%) |
| 35 to 64 Years | 0 (0.0%) | 0 (0.0%) |
| 65 to 74 Years | 0 (0.0%) | 0 (0.0%) |
| 75 Years and over | 0 (0.0%) | 0 (0.0%) |
Disability Class: Ambulatory Difficulty
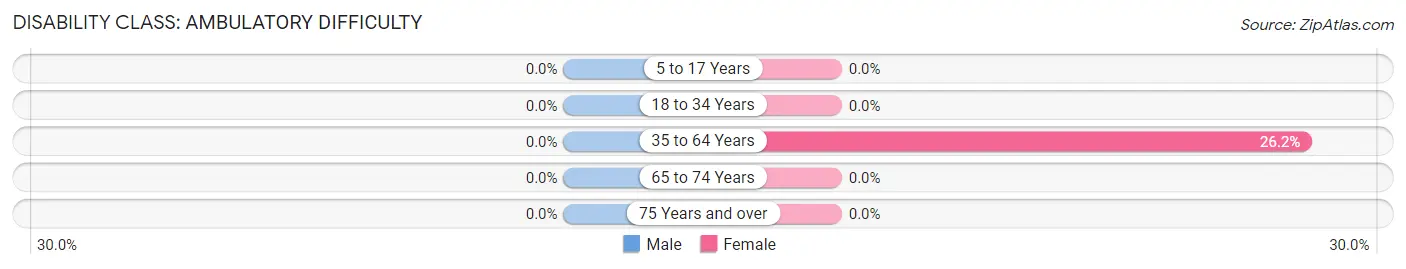
| Age Bracket | Male | Female |
| 5 to 17 Years | 0 (0.0%) | 0 (0.0%) |
| 18 to 34 Years | 0 (0.0%) | 0 (0.0%) |
| 35 to 64 Years | 0 (0.0%) | 11 (26.2%) |
| 65 to 74 Years | 0 (0.0%) | 0 (0.0%) |
| 75 Years and over | 0 (0.0%) | 0 (0.0%) |
Disability Class: Self-Care Difficulty
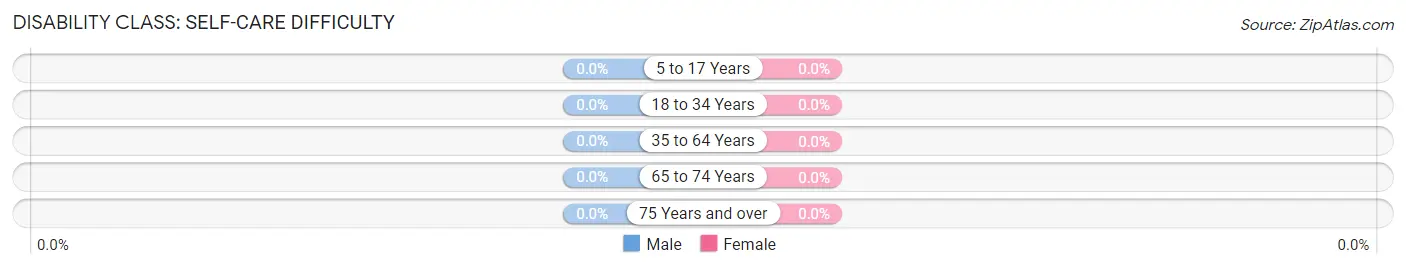
| Age Bracket | Male | Female |
| 5 to 17 Years | 0 (0.0%) | 0 (0.0%) |
| 18 to 34 Years | 0 (0.0%) | 0 (0.0%) |
| 35 to 64 Years | 0 (0.0%) | 0 (0.0%) |
| 65 to 74 Years | 0 (0.0%) | 0 (0.0%) |
| 75 Years and over | 0 (0.0%) | 0 (0.0%) |
Technology Access in Starks
Computing Device Access in Starks
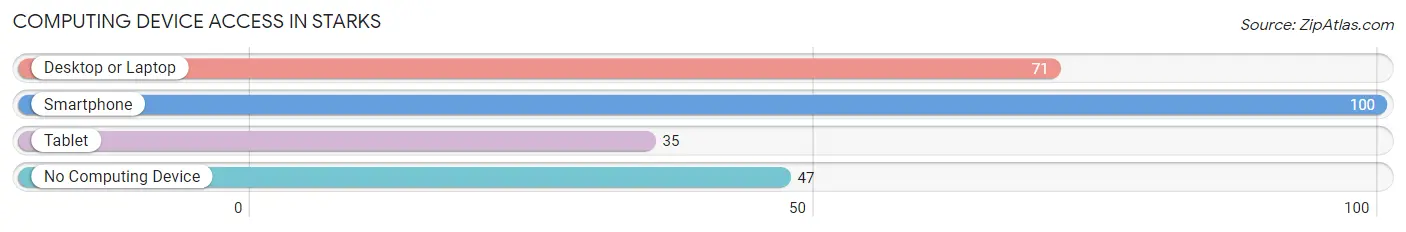
| Device Type | # Households | % Households |
| Desktop or Laptop | 71 | 47.0% |
| Smartphone | 100 | 66.2% |
| Tablet | 35 | 23.2% |
| No Computing Device | 47 | 31.1% |
| Total | 151 | 100.0% |
Internet Access in Starks
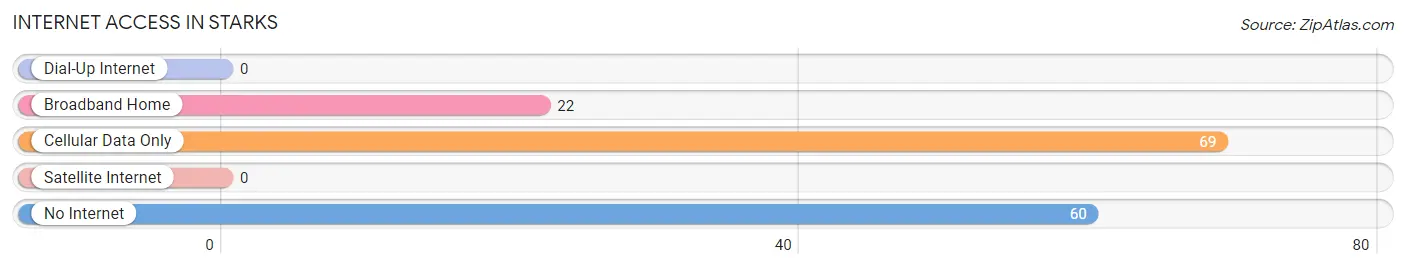
| Internet Type | # Households | % Households |
| Dial-Up Internet | 0 | 0.0% |
| Broadband Home | 22 | 14.6% |
| Cellular Data Only | 69 | 45.7% |
| Satellite Internet | 0 | 0.0% |
| No Internet | 60 | 39.7% |
| Total | 151 | 100.0% |
Starks Summary
Starks, Louisiana is a small town located in Calcasieu Parish in the southwestern part of the state. It is situated on the banks of the Calcasieu River, about 25 miles east of Lake Charles. The town was founded in 1883 and has a population of approximately 1,000 people.
Geography
Starks is located in the southwestern part of Louisiana, in Calcasieu Parish. It is situated on the banks of the Calcasieu River, about 25 miles east of Lake Charles. The town is surrounded by a number of small towns and villages, including Sulphur, Westlake, and Vinton. The terrain is mostly flat, with some rolling hills in the area. The climate is humid subtropical, with hot summers and mild winters.
Economy
Starks is a small town with a limited economy. The main industries in the area are agriculture and timber. The town is home to several small businesses, including a grocery store, a hardware store, and a few restaurants. The town also has a few small manufacturing plants, including a paper mill and a wood-processing plant.
Demographics
As of the 2010 census, the population of Starks was 1,000 people. The racial makeup of the town was 95.2% White, 0.7% African American, 0.3% Native American, 0.2% Asian, 0.1% Pacific Islander, and 3.5% from other races. The median household income was $30,000, and the median family income was $35,000.
The town is served by the Calcasieu Parish School District, which includes two elementary schools, one middle school, and one high school. The town also has a library and a few churches.
Conclusion
Starks, Louisiana is a small town located in Calcasieu Parish in the southwestern part of the state. It is situated on the banks of the Calcasieu River, about 25 miles east of Lake Charles. The town was founded in 1883 and has a population of approximately 1,000 people. The main industries in the area are agriculture and timber, and the town is home to several small businesses. The racial makeup of the town is mostly White, with a small percentage of African American, Native American, Asian, and Pacific Islander residents. The median household income is $30,000, and the median family income is $35,000. The town is served by the Calcasieu Parish School District, which includes two elementary schools, one middle school, and one high school. The town also has a library and a few churches.
Common Questions
What is Per Capita Income in Starks?
Per Capita income in Starks is $15,274.
What is the Median Family Income in Starks?
Median Family Income in Starks is $2,499.
What is the Median Household income in Starks?
Median Household Income in Starks is $14,858.
What is Inequality or Gini Index in Starks?
Inequality or Gini Index in Starks is 0.58.
What is the Total Population of Starks?
Total Population of Starks is 256.
What is the Total Male Population of Starks?
Total Male Population of Starks is 115.
What is the Total Female Population of Starks?
Total Female Population of Starks is 141.
What is the Ratio of Males per 100 Females in Starks?
There are 81.56 Males per 100 Females in Starks.
What is the Ratio of Females per 100 Males in Starks?
There are 122.61 Females per 100 Males in Starks.
What is the Median Population Age in Starks?
Median Population Age in Starks is 54.2 Years.
What is the Average Family Size in Starks
Average Family Size in Starks is 3.0 People.
What is the Average Household Size in Starks
Average Household Size in Starks is 1.7 People.
How Large is the Labor Force in Starks?
There are 35 People in the Labor Forcein in Starks.
What is the Percentage of People in the Labor Force in Starks?
14.3% of People are in the Labor Force in Starks.