Skwentna, AK Map & Demographics
Skwentna Map
Skwentna Overview
$44,040
PER CAPITA INCOME
0.55
INEQUALITY / GINI INDEX
63
TOTAL POPULATION
33
MALE POPULATION
30
FEMALE POPULATION
110.00
MALES / 100 FEMALES
90.91
FEMALES / 100 MALES
60.1
MEDIAN AGE
2.8
AVG FAMILY SIZE
1.8
AVG HOUSEHOLD SIZE
17
LABOR FORCE [ PEOPLE ]
30.4%
PERCENT IN LABOR FORCE
35.3%
UNEMPLOYMENT RATE
Skwentna Zip Codes
Skwentna Area Codes
Income in Skwentna
Income Overview in Skwentna
| Characteristic | Number | Measure |
| Per Capita Income | 63 | $44,040 |
| Median Family Income | 12 | $0 |
| Mean Family Income | 12 | $0 |
| Median Household Income | 36 | $0 |
| Mean Household Income | 36 | $76,794 |
| Income Deficit | 12 | $0 |
| Wage / Income Gap (%) | 63 | 0.00% |
| Wage / Income Gap ($) | 63 | 100.00¢ per $1 |
| Gini / Inequality Index | 63 | 0.55 |
Earnings by Sex in Skwentna
| Sex | Number | Average Earnings |
| Male | 20 (69.0%) | $0 |
| Female | 9 (31.0%) | $0 |
| Total | 29 (100.0%) | $0 |
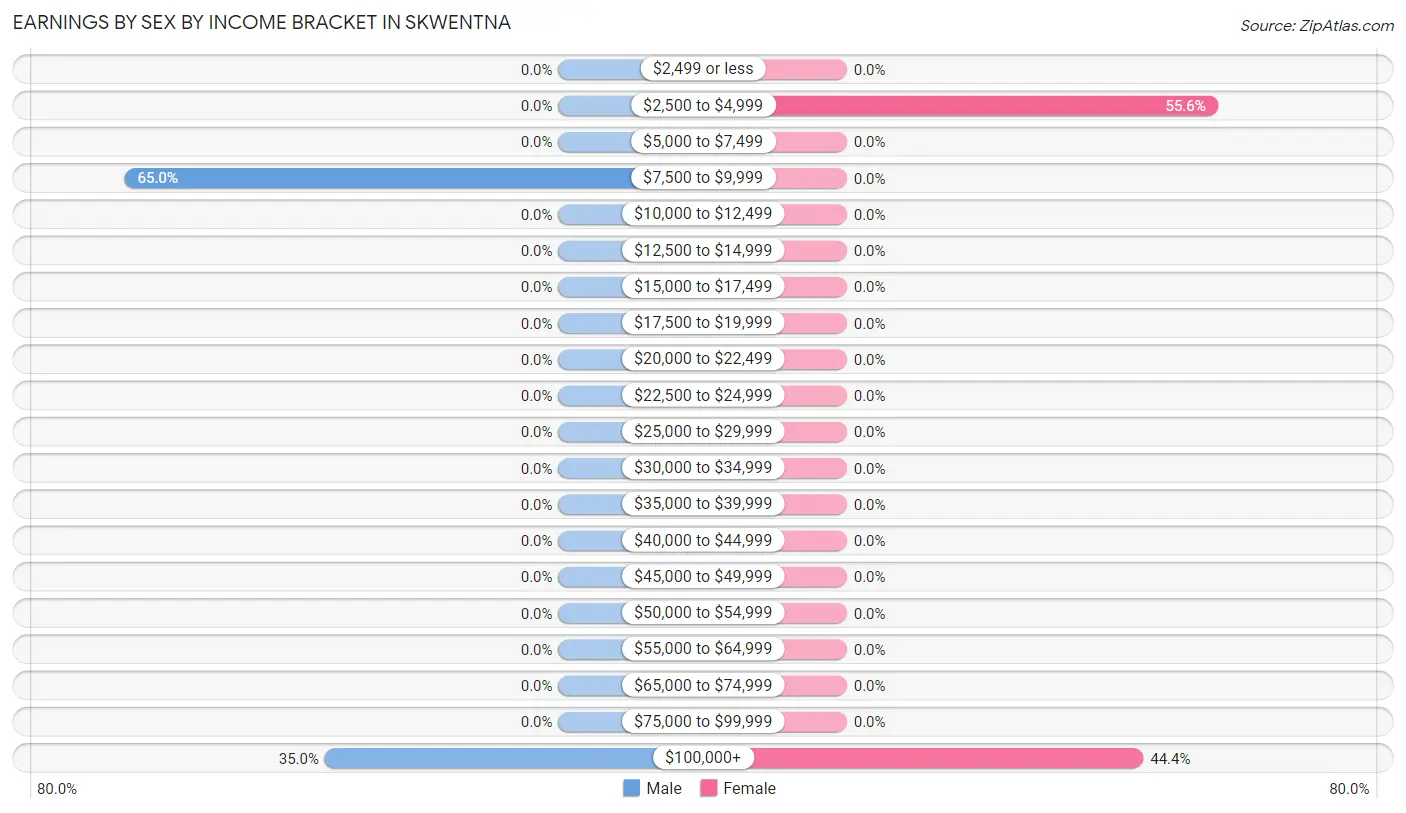
Earnings by Sex by Income Bracket in Skwentna
The most common earnings brackets in Skwentna are $7,500 to $9,999 for men (13 | 65.0%) and $2,500 to $4,999 for women (5 | 55.6%).
| Income | Male | Female |
| $2,499 or less | 0 (0.0%) | 0 (0.0%) |
| $2,500 to $4,999 | 0 (0.0%) | 5 (55.6%) |
| $5,000 to $7,499 | 0 (0.0%) | 0 (0.0%) |
| $7,500 to $9,999 | 13 (65.0%) | 0 (0.0%) |
| $10,000 to $12,499 | 0 (0.0%) | 0 (0.0%) |
| $12,500 to $14,999 | 0 (0.0%) | 0 (0.0%) |
| $15,000 to $17,499 | 0 (0.0%) | 0 (0.0%) |
| $17,500 to $19,999 | 0 (0.0%) | 0 (0.0%) |
| $20,000 to $22,499 | 0 (0.0%) | 0 (0.0%) |
| $22,500 to $24,999 | 0 (0.0%) | 0 (0.0%) |
| $25,000 to $29,999 | 0 (0.0%) | 0 (0.0%) |
| $30,000 to $34,999 | 0 (0.0%) | 0 (0.0%) |
| $35,000 to $39,999 | 0 (0.0%) | 0 (0.0%) |
| $40,000 to $44,999 | 0 (0.0%) | 0 (0.0%) |
| $45,000 to $49,999 | 0 (0.0%) | 0 (0.0%) |
| $50,000 to $54,999 | 0 (0.0%) | 0 (0.0%) |
| $55,000 to $64,999 | 0 (0.0%) | 0 (0.0%) |
| $65,000 to $74,999 | 0 (0.0%) | 0 (0.0%) |
| $75,000 to $99,999 | 0 (0.0%) | 0 (0.0%) |
| $100,000+ | 7 (35.0%) | 4 (44.4%) |
| Total | 20 (100.0%) | 9 (100.0%) |
Earnings by Sex by Educational Attainment in Skwentna
| Educational Attainment | Male Income | Female Income |
| Less than High School | - | - |
| High School Diploma | - | - |
| College or Associate's Degree | - | - |
| Bachelor's Degree | - | - |
| Graduate Degree | - | - |
| Total | - | - |
Family Income in Skwentna
Family Income Brackets in Skwentna
According to the Skwentna family income data, there are 7 families falling into the less than $10,000 income range, which is the most common income bracket and makes up 58.3% of all families.
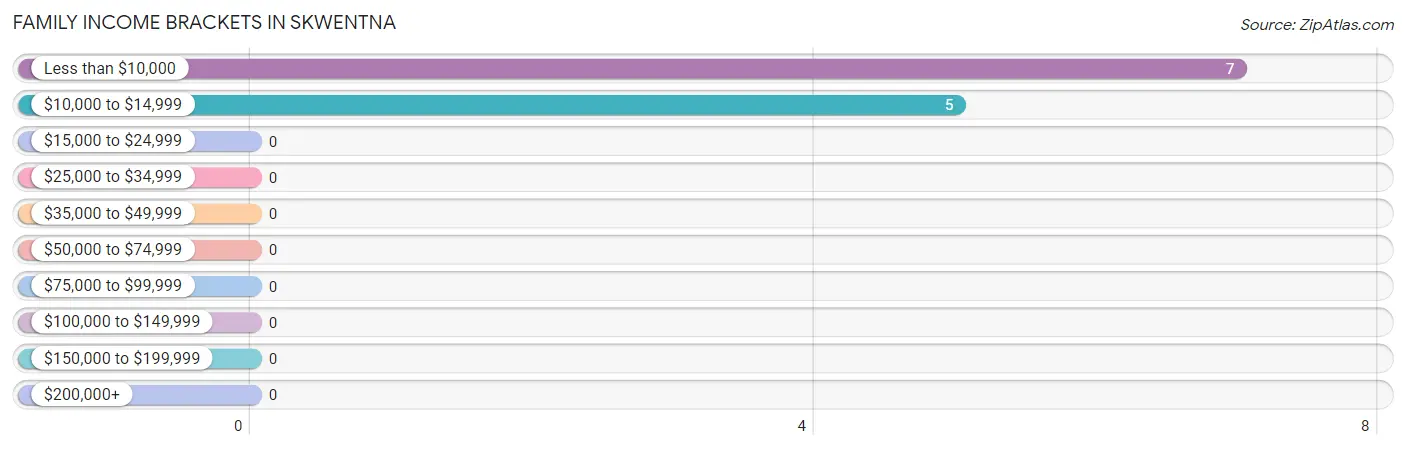
| Income Bracket | # Families | % Families |
| Less than $10,000 | 7 | 58.3% |
| $10,000 to $14,999 | 5 | 41.7% |
| $15,000 to $24,999 | 0 | 0.0% |
| $25,000 to $34,999 | 0 | 0.0% |
| $35,000 to $49,999 | 0 | 0.0% |
| $50,000 to $74,999 | 0 | 0.0% |
| $75,000 to $99,999 | 0 | 0.0% |
| $100,000 to $149,999 | 0 | 0.0% |
| $150,000 to $199,999 | 0 | 0.0% |
| $200,000+ | 0 | 0.0% |
Family Income by Famaliy Size in Skwentna
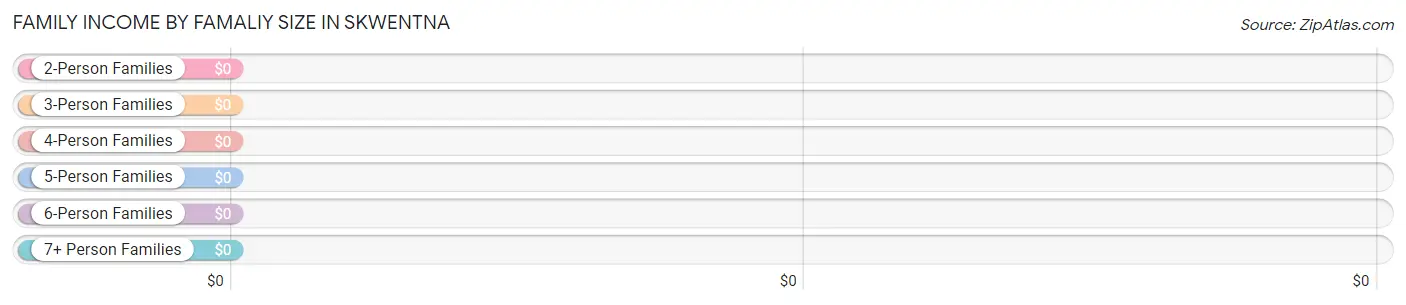
| Income Bracket | # Families | Median Income |
| 2-Person Families | 5 (41.7%) | $0 |
| 3-Person Families | 7 (58.3%) | $0 |
| 4-Person Families | 0 (0.0%) | $0 |
| 5-Person Families | 0 (0.0%) | $0 |
| 6-Person Families | 0 (0.0%) | $0 |
| 7+ Person Families | 0 (0.0%) | $0 |
| Total | 12 (100.0%) | $0 |
Family Income by Number of Earners in Skwentna
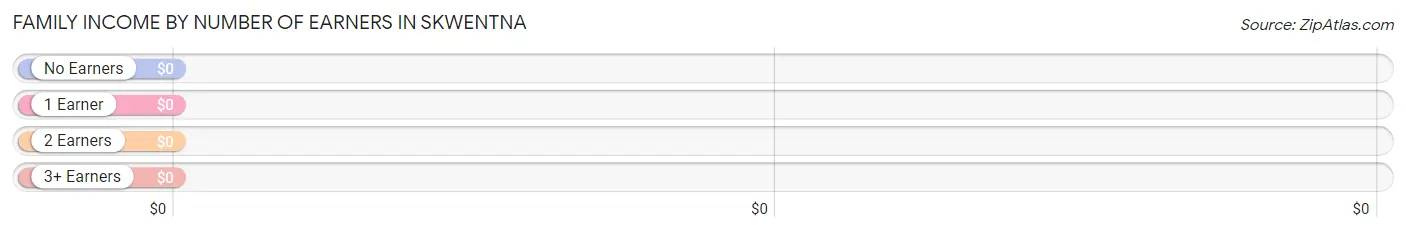
| Number of Earners | # Families | Median Income |
| No Earners | 0 (0.0%) | $0 |
| 1 Earner | 7 (58.3%) | $0 |
| 2 Earners | 5 (41.7%) | $0 |
| 3+ Earners | 0 (0.0%) | $0 |
| Total | 12 (100.0%) | $0 |
Household Income in Skwentna
Household Income Brackets in Skwentna
With 7 households falling in the category, the less than $10,000 income range is the most frequent in Skwentna, accounting for 19.4% of all households.
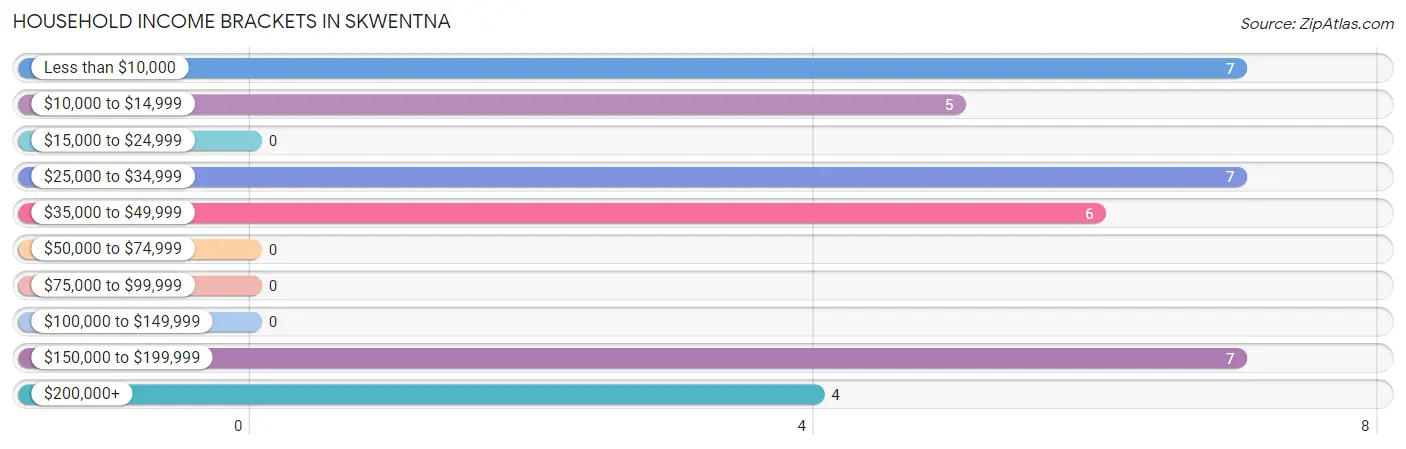
| Income Bracket | # Households | % Households |
| Less than $10,000 | 7 | 19.4% |
| $10,000 to $14,999 | 5 | 13.9% |
| $15,000 to $24,999 | 0 | 0.0% |
| $25,000 to $34,999 | 7 | 19.4% |
| $35,000 to $49,999 | 6 | 16.7% |
| $50,000 to $74,999 | 0 | 0.0% |
| $75,000 to $99,999 | 0 | 0.0% |
| $100,000 to $149,999 | 0 | 0.0% |
| $150,000 to $199,999 | 7 | 19.4% |
| $200,000+ | 4 | 11.1% |
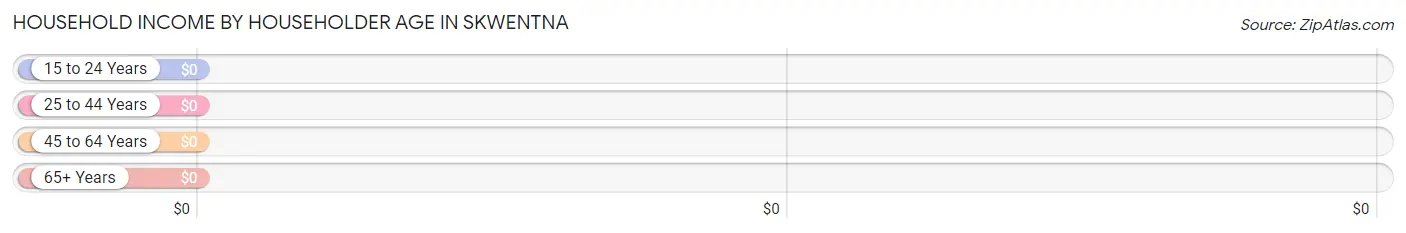
Household Income by Householder Age in Skwentna
| Income Bracket | # Households | Median Income |
| 15 to 24 Years | 0 (0.0%) | $0 |
| 25 to 44 Years | 7 (19.4%) | $0 |
| 45 to 64 Years | 12 (33.3%) | $0 |
| 65+ Years | 17 (47.2%) | $0 |
| Total | 36 (100.0%) | $0 |
Poverty in Skwentna
Income Below Poverty by Sex and Age in Skwentna
With 39.4% poverty level for males and 86.7% for females among the residents of Skwentna, 35 to 44 year old males and under 5 year old females are the most vulnerable to poverty, with 7 males (100.0%) and 7 females (100.0%) in their respective age groups living below the poverty level.
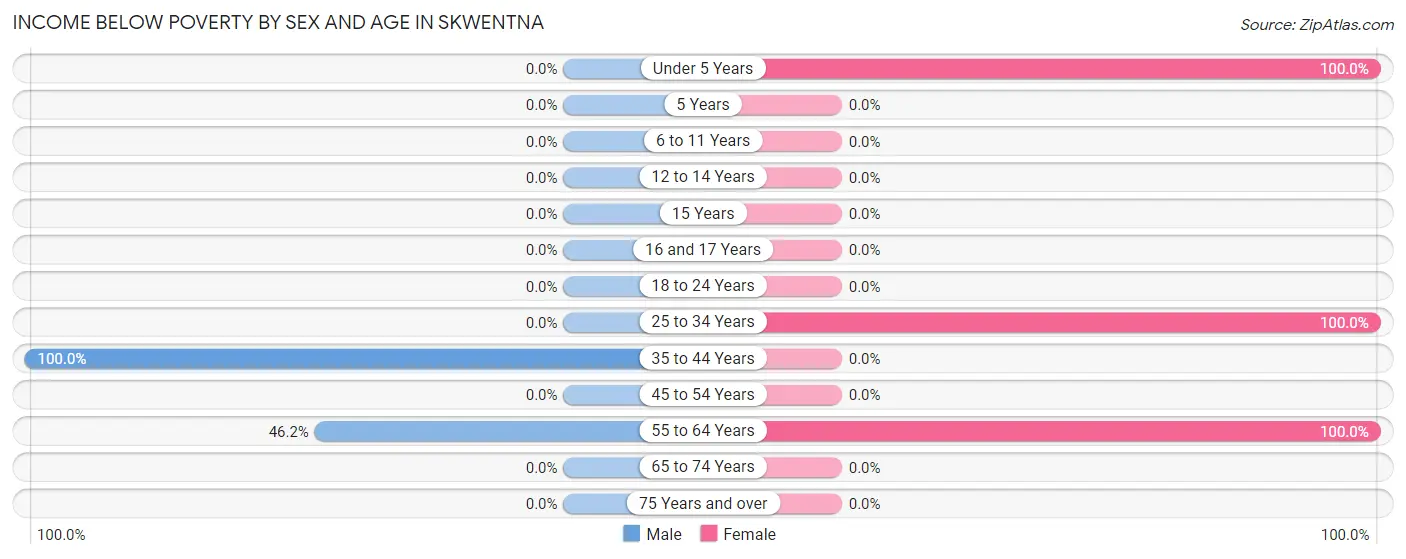
| Age Bracket | Male | Female |
| Under 5 Years | 0 (0.0%) | 7 (100.0%) |
| 5 Years | 0 (0.0%) | 0 (0.0%) |
| 6 to 11 Years | 0 (0.0%) | 0 (0.0%) |
| 12 to 14 Years | 0 (0.0%) | 0 (0.0%) |
| 15 Years | 0 (0.0%) | 0 (0.0%) |
| 16 and 17 Years | 0 (0.0%) | 0 (0.0%) |
| 18 to 24 Years | 0 (0.0%) | 0 (0.0%) |
| 25 to 34 Years | 0 (0.0%) | 9 (100.0%) |
| 35 to 44 Years | 7 (100.0%) | 0 (0.0%) |
| 45 to 54 Years | 0 (0.0%) | 0 (0.0%) |
| 55 to 64 Years | 6 (46.2%) | 10 (100.0%) |
| 65 to 74 Years | 0 (0.0%) | 0 (0.0%) |
| 75 Years and over | 0 (0.0%) | 0 (0.0%) |
| Total | 13 (39.4%) | 26 (86.7%) |
Income Above Poverty by Sex and Age in Skwentna
According to the poverty statistics in Skwentna, males aged 65 to 74 years and females aged 75 years and over are the age groups that are most secure financially, with 100.0% of males and 100.0% of females in these age groups living above the poverty line.
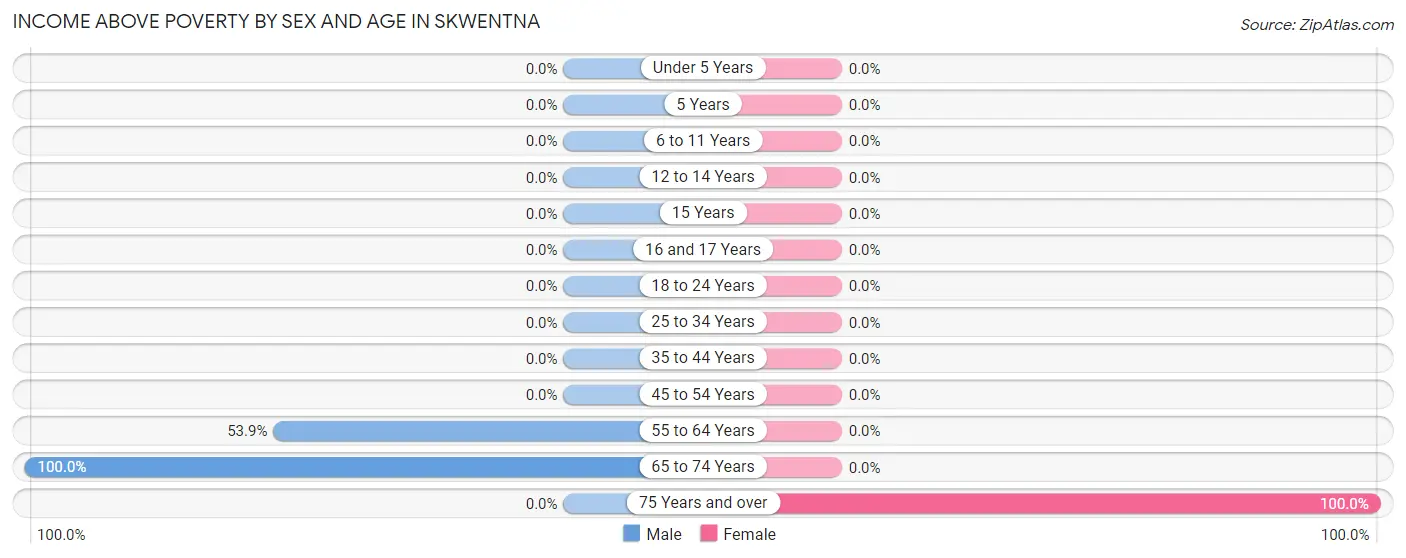
| Age Bracket | Male | Female |
| Under 5 Years | 0 (0.0%) | 0 (0.0%) |
| 5 Years | 0 (0.0%) | 0 (0.0%) |
| 6 to 11 Years | 0 (0.0%) | 0 (0.0%) |
| 12 to 14 Years | 0 (0.0%) | 0 (0.0%) |
| 15 Years | 0 (0.0%) | 0 (0.0%) |
| 16 and 17 Years | 0 (0.0%) | 0 (0.0%) |
| 18 to 24 Years | 0 (0.0%) | 0 (0.0%) |
| 25 to 34 Years | 0 (0.0%) | 0 (0.0%) |
| 35 to 44 Years | 0 (0.0%) | 0 (0.0%) |
| 45 to 54 Years | 0 (0.0%) | 0 (0.0%) |
| 55 to 64 Years | 7 (53.8%) | 0 (0.0%) |
| 65 to 74 Years | 13 (100.0%) | 0 (0.0%) |
| 75 Years and over | 0 (0.0%) | 4 (100.0%) |
| Total | 20 (60.6%) | 4 (13.3%) |
Income Below Poverty Among Married-Couple Families in Skwentna
The poverty statistics for married-couple families in Skwentna show that 100.0% or 12 of the total 12 families live below the poverty line. Families with no children have the highest poverty rate of 100.0%, comprising of 5 families. On the other hand, families with no children have the lowest poverty rate of 100.0%, which includes 5 families.
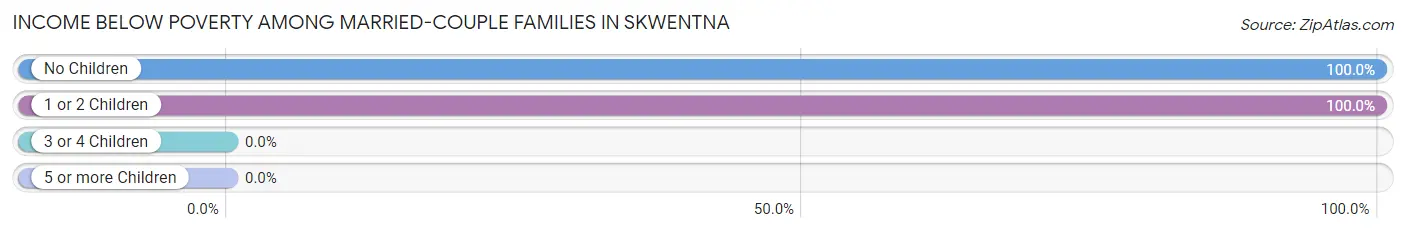
| Children | Above Poverty | Below Poverty |
| No Children | 0 (0.0%) | 5 (100.0%) |
| 1 or 2 Children | 0 (0.0%) | 7 (100.0%) |
| 3 or 4 Children | 0 (0.0%) | 0 (0.0%) |
| 5 or more Children | 0 (0.0%) | 0 (0.0%) |
| Total | 0 (0.0%) | 12 (100.0%) |
Income Below Poverty Among Single-Parent Households in Skwentna
| Children | Single Father | Single Mother |
| No Children | 0 (0.0%) | 0 (0.0%) |
| 1 or 2 Children | 0 (0.0%) | 0 (0.0%) |
| 3 or 4 Children | 0 (0.0%) | 0 (0.0%) |
| 5 or more Children | 0 (0.0%) | 0 (0.0%) |
| Total | 0 (0.0%) | 0 (0.0%) |
Income Below Poverty Among Married-Couple vs Single-Parent Households in Skwentna
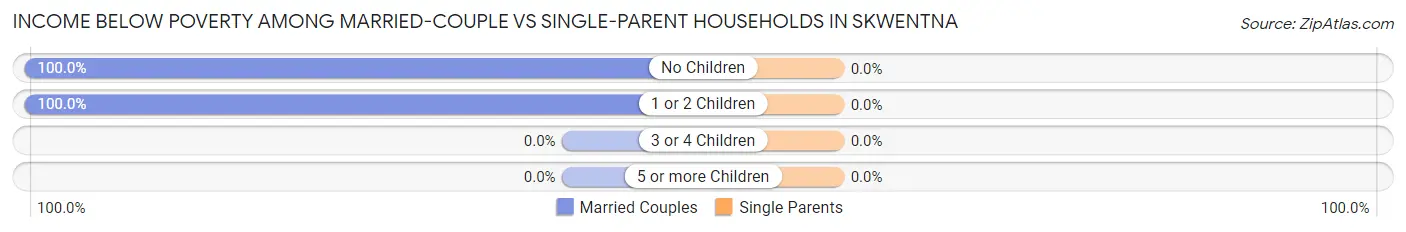
| Children | Married-Couple Families | Single-Parent Households |
| No Children | 5 (100.0%) | 0 (0.0%) |
| 1 or 2 Children | 7 (100.0%) | 0 (0.0%) |
| 3 or 4 Children | 0 (0.0%) | 0 (0.0%) |
| 5 or more Children | 0 (0.0%) | 0 (0.0%) |
| Total | 12 (100.0%) | 0 (0.0%) |
Race in Skwentna
The most populous races in Skwentna are , and White / Caucasian (63 | 100.0%).
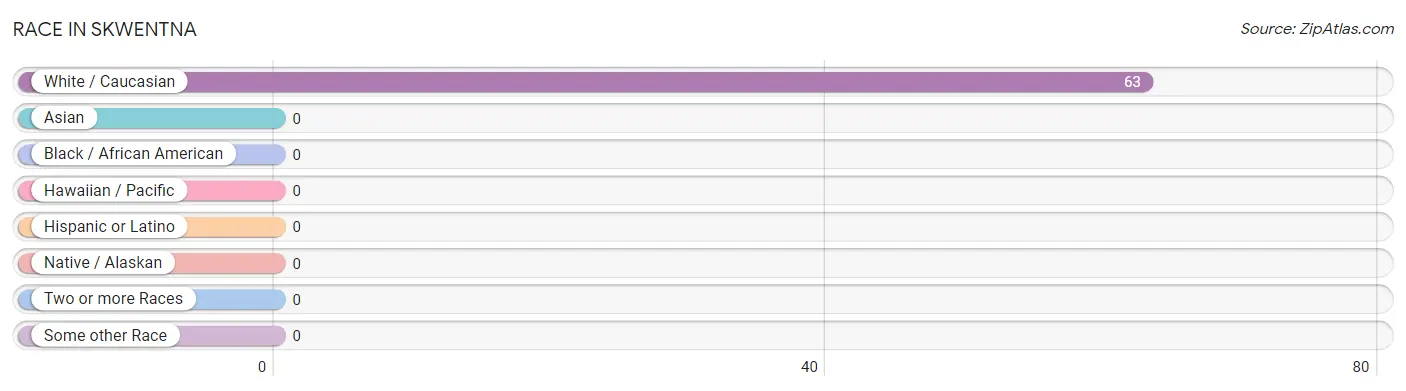
| Race | # Population | % Population |
| Asian | 0 | 0.0% |
| Black / African American | 0 | 0.0% |
| Hawaiian / Pacific | 0 | 0.0% |
| Hispanic or Latino | 0 | 0.0% |
| Native / Alaskan | 0 | 0.0% |
| White / Caucasian | 63 | 100.0% |
| Two or more Races | 0 | 0.0% |
| Some other Race | 0 | 0.0% |
| Total | 63 | 100.0% |
Ancestry in Skwentna
The most populous ancestries reported in Skwentna are German (28 | 44.4%), Irish (16 | 25.4%), Scotch-Irish (9 | 14.3%), Czech (7 | 11.1%), and French (7 | 11.1%), together accounting for 106.4% of all Skwentna residents.
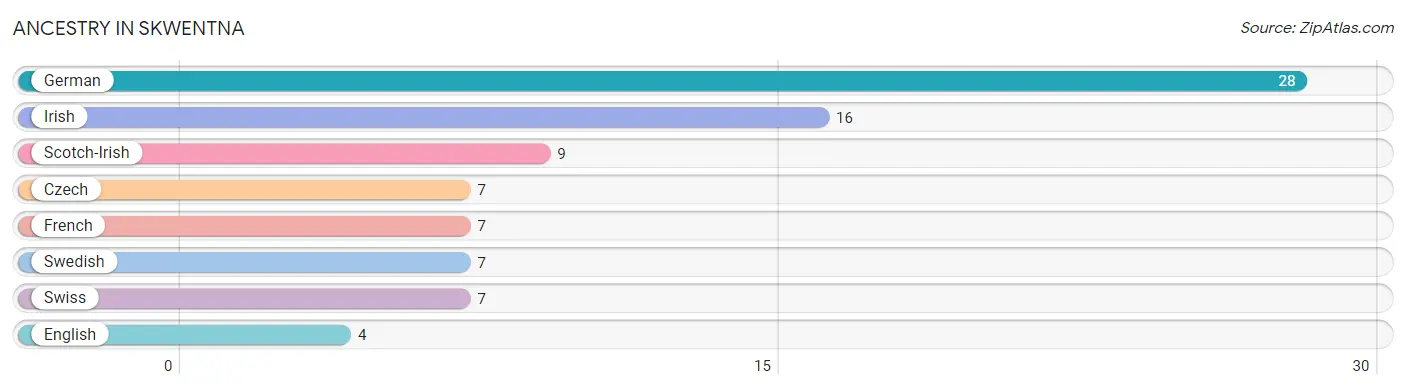
| Ancestry | # Population | % Population |
| Czech | 7 | 11.1% |
| English | 4 | 6.4% |
| French | 7 | 11.1% |
| German | 28 | 44.4% |
| Irish | 16 | 25.4% |
| Scotch-Irish | 9 | 14.3% |
| Swedish | 7 | 11.1% |
| Swiss | 7 | 11.1% | View All 8 Rows |
Immigrants in Skwentna
The most numerous immigrant groups reported in Skwentna came from , and Canada (5 | 7.9%), together accounting for 7.9% of all Skwentna residents.

| Immigration Origin | # Population | % Population |
| Canada | 5 | 7.9% | View All 1 Rows |
Sex and Age in Skwentna
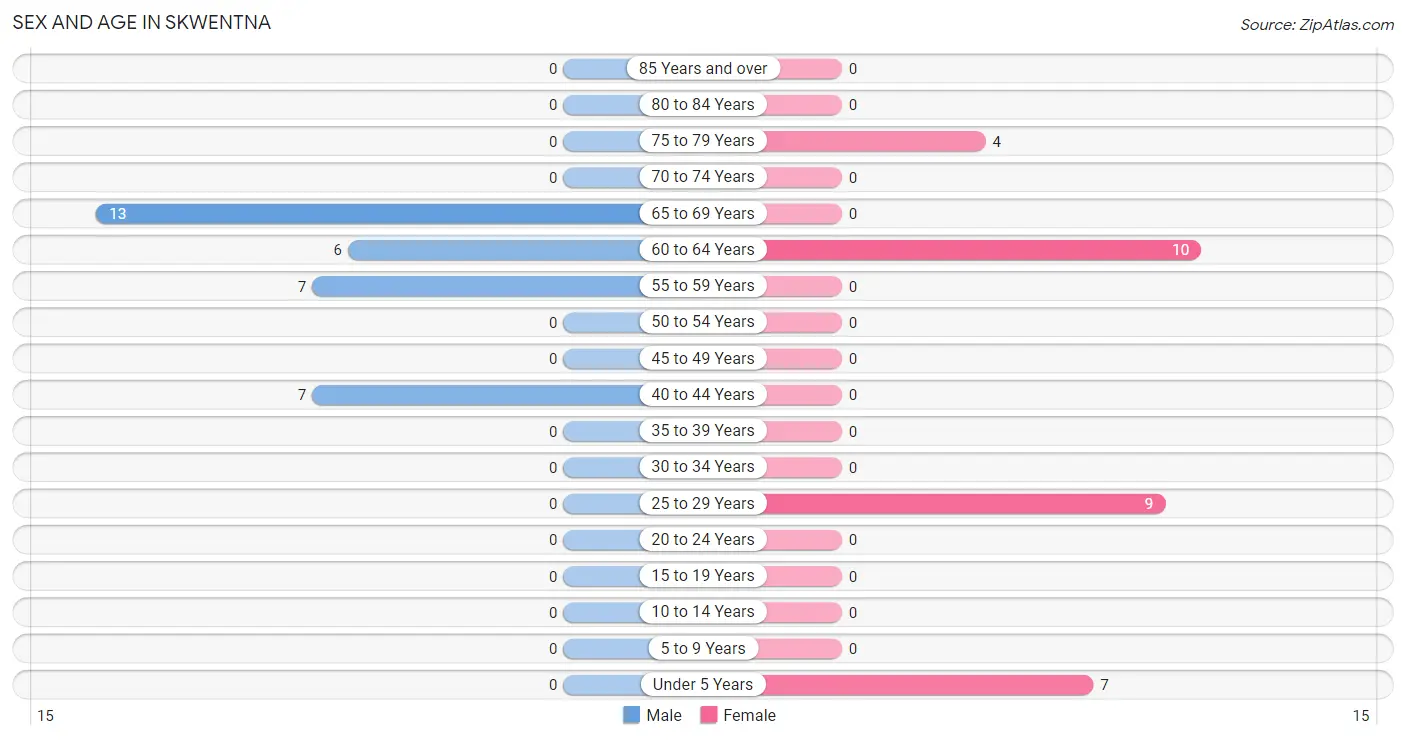
Sex and Age in Skwentna
The most populous age groups in Skwentna are 65 to 69 Years (13 | 39.4%) for men and 60 to 64 Years (10 | 33.3%) for women.
| Age Bracket | Male | Female |
| Under 5 Years | 0 (0.0%) | 7 (23.3%) |
| 5 to 9 Years | 0 (0.0%) | 0 (0.0%) |
| 10 to 14 Years | 0 (0.0%) | 0 (0.0%) |
| 15 to 19 Years | 0 (0.0%) | 0 (0.0%) |
| 20 to 24 Years | 0 (0.0%) | 0 (0.0%) |
| 25 to 29 Years | 0 (0.0%) | 9 (30.0%) |
| 30 to 34 Years | 0 (0.0%) | 0 (0.0%) |
| 35 to 39 Years | 0 (0.0%) | 0 (0.0%) |
| 40 to 44 Years | 7 (21.2%) | 0 (0.0%) |
| 45 to 49 Years | 0 (0.0%) | 0 (0.0%) |
| 50 to 54 Years | 0 (0.0%) | 0 (0.0%) |
| 55 to 59 Years | 7 (21.2%) | 0 (0.0%) |
| 60 to 64 Years | 6 (18.2%) | 10 (33.3%) |
| 65 to 69 Years | 13 (39.4%) | 0 (0.0%) |
| 70 to 74 Years | 0 (0.0%) | 0 (0.0%) |
| 75 to 79 Years | 0 (0.0%) | 4 (13.3%) |
| 80 to 84 Years | 0 (0.0%) | 0 (0.0%) |
| 85 Years and over | 0 (0.0%) | 0 (0.0%) |
| Total | 33 (100.0%) | 30 (100.0%) |
Families and Households in Skwentna
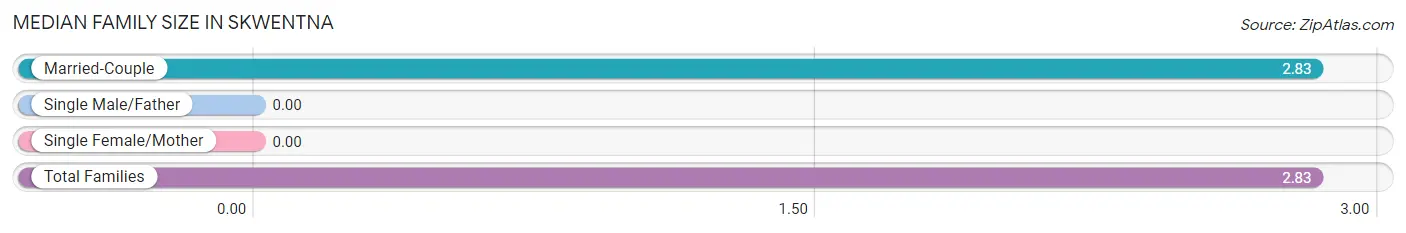
Median Family Size in Skwentna
| Family Type | # Families | Family Size |
| Married-Couple | 12 (100.0%) | 2.83 |
| Single Male/Father | 0 (0.0%) | - |
| Single Female/Mother | 0 (0.0%) | - |
| Total Families | 12 (100.0%) | 2.83 |
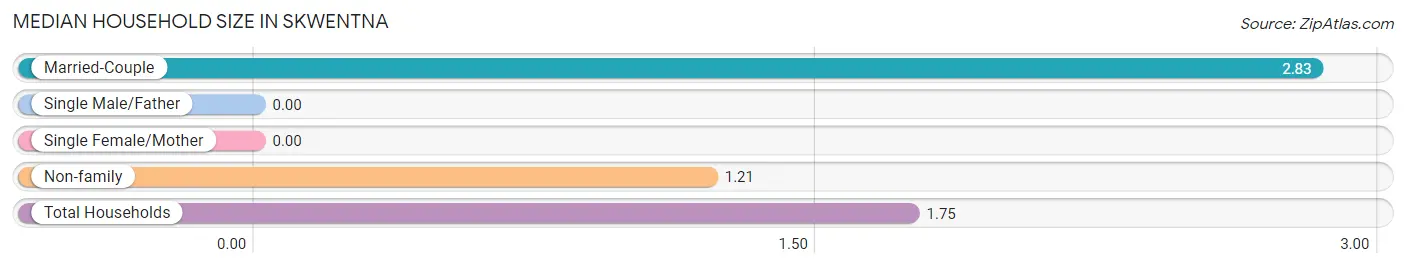
Median Household Size in Skwentna
| Household Type | # Households | Household Size |
| Married-Couple | 12 (33.3%) | 2.83 |
| Single Male/Father | 0 (0.0%) | - |
| Single Female/Mother | 0 (0.0%) | - |
| Non-family | 24 (66.7%) | 1.21 |
| Total Households | 36 (100.0%) | 1.75 |
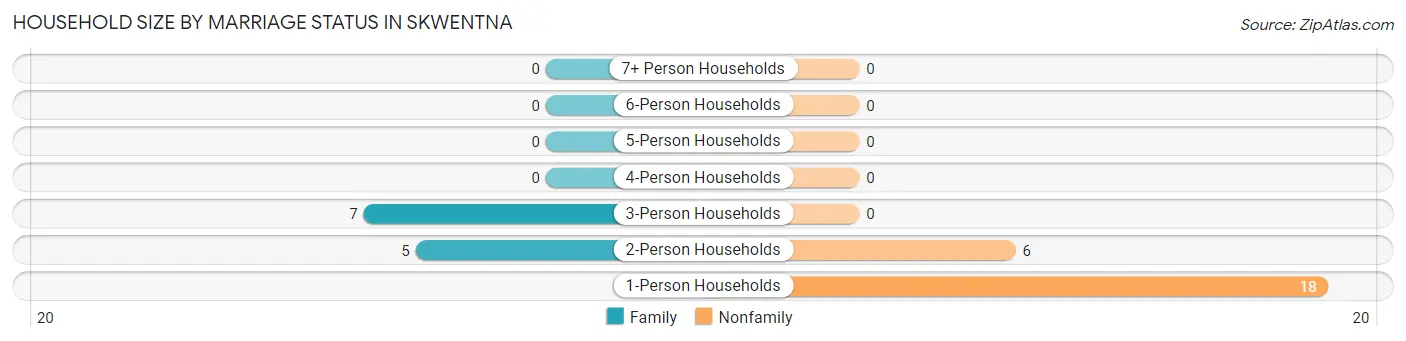
Household Size by Marriage Status in Skwentna
Out of a total of 36 households in Skwentna, 12 (33.3%) are family households, while 24 (66.7%) are nonfamily households. The most numerous type of family households are 3-person households, comprising 7, and the most common type of nonfamily households are 1-person households, comprising 18.
| Household Size | Family Households | Nonfamily Households |
| 1-Person Households | - | 18 (50.0%) |
| 2-Person Households | 5 (13.9%) | 6 (16.7%) |
| 3-Person Households | 7 (19.4%) | 0 (0.0%) |
| 4-Person Households | 0 (0.0%) | 0 (0.0%) |
| 5-Person Households | 0 (0.0%) | 0 (0.0%) |
| 6-Person Households | 0 (0.0%) | 0 (0.0%) |
| 7+ Person Households | 0 (0.0%) | 0 (0.0%) |
| Total | 12 (33.3%) | 24 (66.7%) |
Female Fertility in Skwentna
Fertility by Age in Skwentna
| Age Bracket | Women with Births | Births / 1,000 Women |
| 15 to 19 years | 0 (0.0%) | 0.0 |
| 20 to 34 years | 0 (0.0%) | 0.0 |
| 35 to 50 years | 0 (0.0%) | 0.0 |
| Total | 0 (0.0%) | 0.0 |
Fertility by Age by Marriage Status in Skwentna
| Age Bracket | Married | Unmarried |
| 15 to 19 years | 0 (0.0%) | 0 (0.0%) |
| 20 to 34 years | 0 (0.0%) | 0 (0.0%) |
| 35 to 50 years | 0 (0.0%) | 0 (0.0%) |
| Total | 0 (0.0%) | 0 (0.0%) |
Fertility by Education in Skwentna
| Educational Attainment | Women with Births | Births / 1,000 Women |
| Less than High School | 0 (0.0%) | 0.0 |
| High School Diploma | 0 (0.0%) | 0.0 |
| College or Associate's Degree | 0 (0.0%) | 0.0 |
| Bachelor's Degree | 0 (0.0%) | 0.0 |
| Graduate Degree | 0 (0.0%) | 0.0 |
| Total | 0 (0.0%) | 0.0 |
Fertility by Education by Marriage Status in Skwentna
| Educational Attainment | Married | Unmarried |
| Less than High School | 0 (0.0%) | 0 (0.0%) |
| High School Diploma | 0 (0.0%) | 0 (0.0%) |
| College or Associate's Degree | 0 (0.0%) | 0 (0.0%) |
| Bachelor's Degree | 0 (0.0%) | 0 (0.0%) |
| Graduate Degree | 0 (0.0%) | 0 (0.0%) |
| Total | 0 (0.0%) | 0 (0.0%) |
Employment Characteristics in Skwentna
Employment by Class of Employer in Skwentna
Among the 11 employed individuals in Skwentna, private company employees (7 | 63.6%), and self-employed (incorporated) (4 | 36.4%) make up the most common classes of employment.
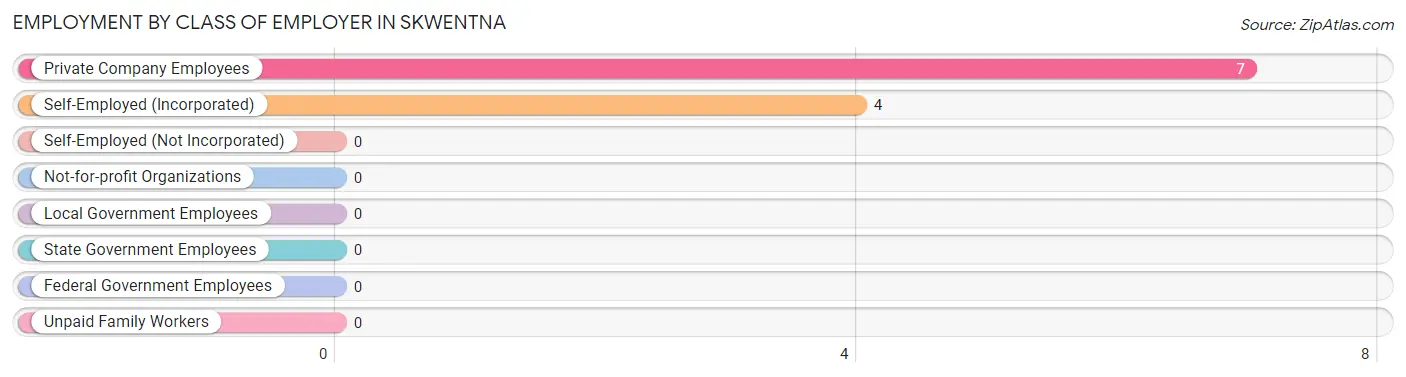
| Employer Class | # Employees | % Employees |
| Private Company Employees | 7 | 63.6% |
| Self-Employed (Incorporated) | 4 | 36.4% |
| Self-Employed (Not Incorporated) | 0 | 0.0% |
| Not-for-profit Organizations | 0 | 0.0% |
| Local Government Employees | 0 | 0.0% |
| State Government Employees | 0 | 0.0% |
| Federal Government Employees | 0 | 0.0% |
| Unpaid Family Workers | 0 | 0.0% |
| Total | 11 | 100.0% |
Employment Status by Age in Skwentna
According to the labor force statistics for Skwentna, out of the total population over 16 years of age (56), 30.4% or 17 individuals are in the labor force, with 35.3% or 6 of them unemployed. The age group with the highest labor force participation rate is 55 to 59 years, with 100.0% or 7 individuals in the labor force. Within the labor force, the 60 to 64 years age range has the highest percentage of unemployed individuals, with 100.0% or 6 of them being unemployed.
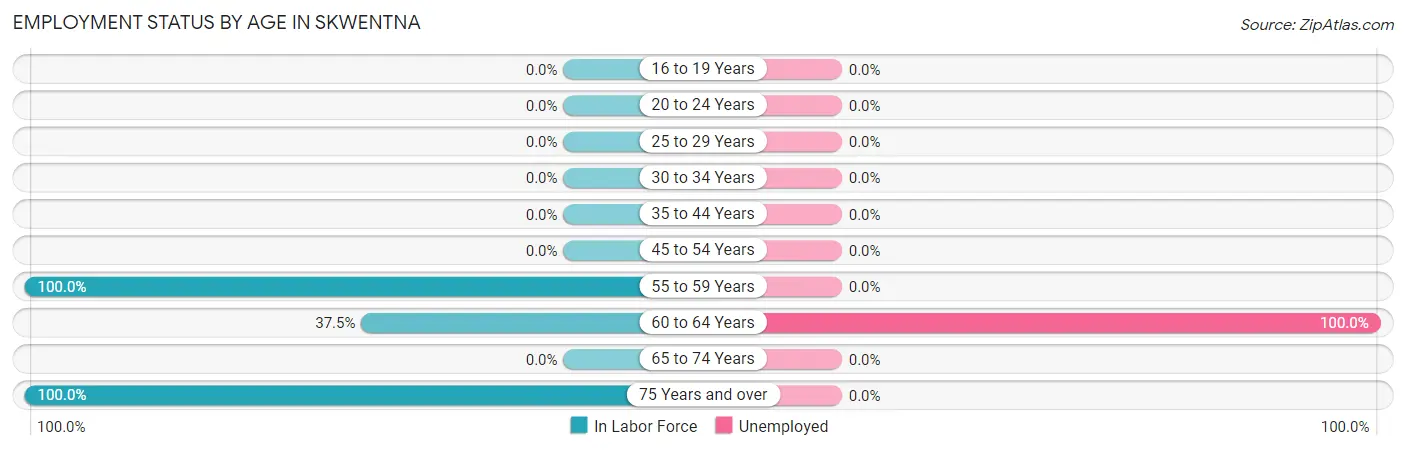
| Age Bracket | In Labor Force | Unemployed |
| 16 to 19 Years | 0 (0.0%) | 0 (0.0%) |
| 20 to 24 Years | 0 (0.0%) | 0 (0.0%) |
| 25 to 29 Years | 0 (0.0%) | 0 (0.0%) |
| 30 to 34 Years | 0 (0.0%) | 0 (0.0%) |
| 35 to 44 Years | 0 (0.0%) | 0 (0.0%) |
| 45 to 54 Years | 0 (0.0%) | 0 (0.0%) |
| 55 to 59 Years | 7 (100.0%) | 0 (0.0%) |
| 60 to 64 Years | 6 (37.5%) | 6 (100.0%) |
| 65 to 74 Years | 0 (0.0%) | 0 (0.0%) |
| 75 Years and over | 4 (100.0%) | 0 (0.0%) |
| Total | 17 (30.4%) | 6 (35.3%) |
Employment Status by Educational Attainment in Skwentna
According to labor force statistics for Skwentna, 33.3% of individuals (13) out of the total population between 25 and 64 years of age (39) are in the labor force, with 46.2% or 6 of them being unemployed. The group with the highest labor force participation rate are those with the educational attainment of high school diploma, with 44.8% or 13 individuals in the labor force. Within the labor force, individuals with high school diploma education have the highest percentage of unemployment, with 46.2% or 6 of them being unemployed.
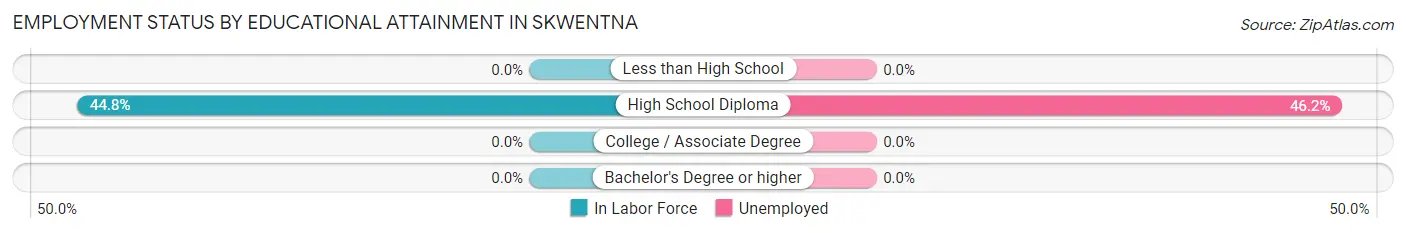
| Educational Attainment | In Labor Force | Unemployed |
| Less than High School | 0 (0.0%) | 0 (0.0%) |
| High School Diploma | 13 (44.8%) | 13 (46.2%) |
| College / Associate Degree | 0 (0.0%) | 0 (0.0%) |
| Bachelor's Degree or higher | 0 (0.0%) | 0 (0.0%) |
| Total | 13 (33.3%) | 18 (46.2%) |
Employment Occupations by Sex in Skwentna
Management, Business, Science and Arts Occupations
The most common Management, Business, Science and Arts occupations in Skwentna are , and Management (4 | 36.4%).
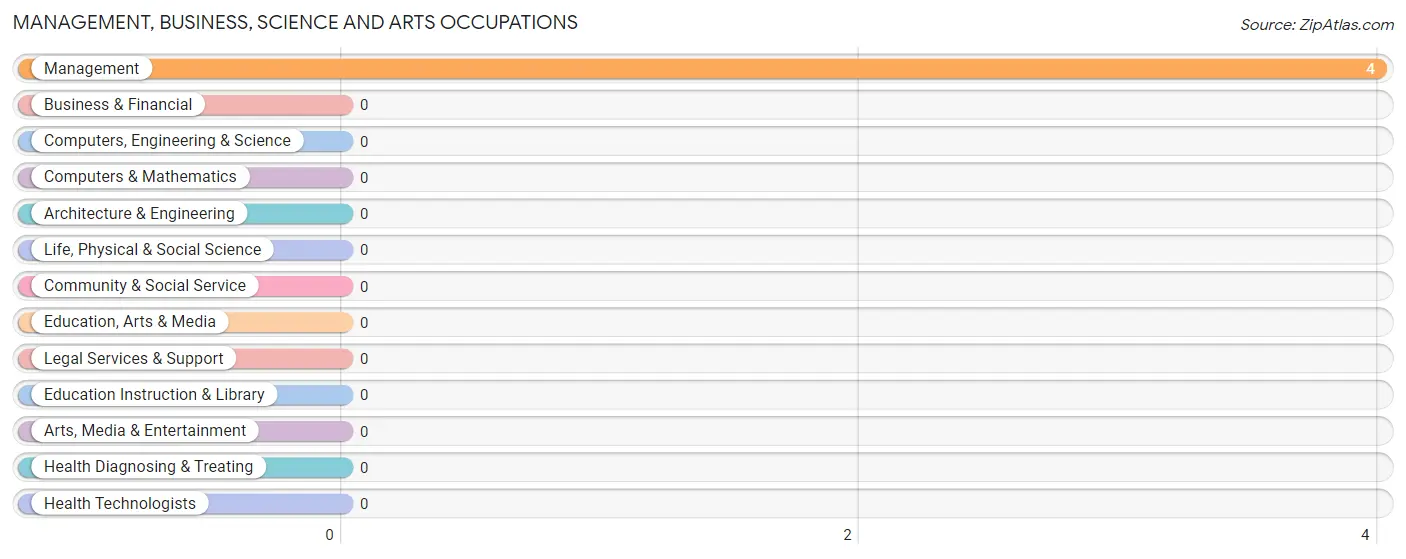
Management, Business, Science and Arts Occupations by Sex
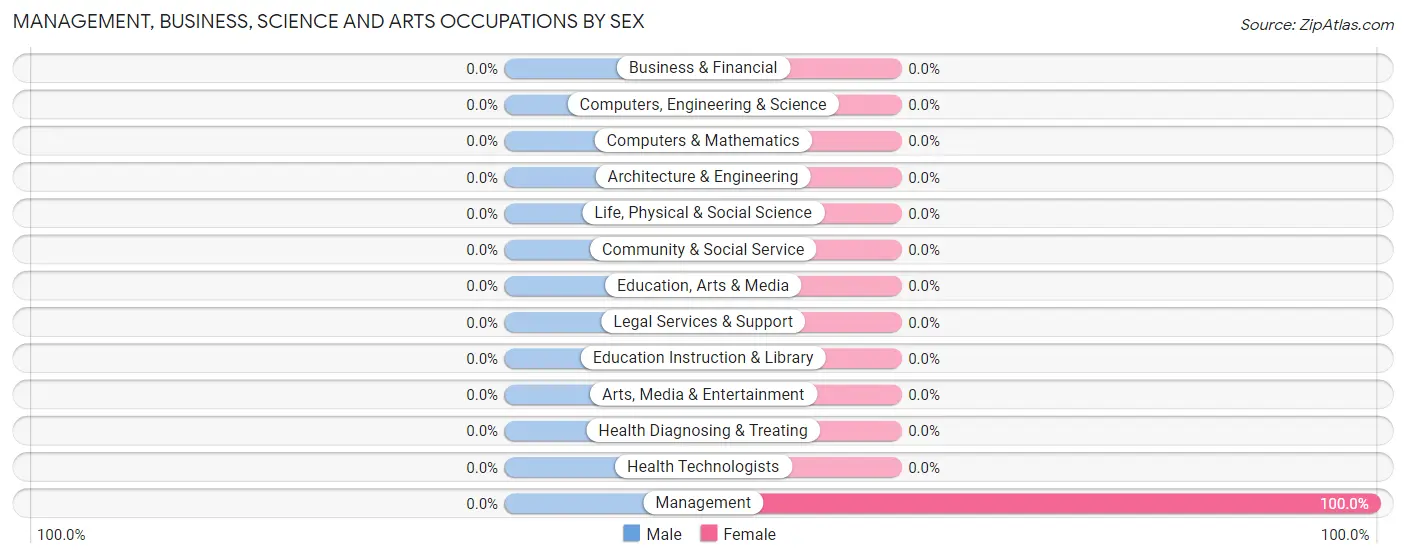
| Occupation | Male | Female |
| Management | 0 (0.0%) | 4 (100.0%) |
| Business & Financial | 0 (0.0%) | 0 (0.0%) |
| Computers, Engineering & Science | 0 (0.0%) | 0 (0.0%) |
| Computers & Mathematics | 0 (0.0%) | 0 (0.0%) |
| Architecture & Engineering | 0 (0.0%) | 0 (0.0%) |
| Life, Physical & Social Science | 0 (0.0%) | 0 (0.0%) |
| Community & Social Service | 0 (0.0%) | 0 (0.0%) |
| Education, Arts & Media | 0 (0.0%) | 0 (0.0%) |
| Legal Services & Support | 0 (0.0%) | 0 (0.0%) |
| Education Instruction & Library | 0 (0.0%) | 0 (0.0%) |
| Arts, Media & Entertainment | 0 (0.0%) | 0 (0.0%) |
| Health Diagnosing & Treating | 0 (0.0%) | 0 (0.0%) |
| Health Technologists | 0 (0.0%) | 0 (0.0%) |
| Total (Category) | 0 (0.0%) | 4 (100.0%) |
| Total (Overall) | 7 (63.6%) | 4 (36.4%) |
Services Occupations
Services Occupations by Sex
| Occupation | Male | Female |
| Healthcare Support | 0 (0.0%) | 0 (0.0%) |
| Security & Protection | 0 (0.0%) | 0 (0.0%) |
| Firefighting & Prevention | 0 (0.0%) | 0 (0.0%) |
| Law Enforcement | 0 (0.0%) | 0 (0.0%) |
| Food Preparation & Serving | 0 (0.0%) | 0 (0.0%) |
| Cleaning & Maintenance | 0 (0.0%) | 0 (0.0%) |
| Personal Care & Service | 0 (0.0%) | 0 (0.0%) |
| Total (Category) | 0 (0.0%) | 0 (0.0%) |
| Total (Overall) | 7 (63.6%) | 4 (36.4%) |
Sales and Office Occupations
Sales and Office Occupations by Sex
| Occupation | Male | Female |
| Sales & Related | 0 (0.0%) | 0 (0.0%) |
| Office & Administration | 0 (0.0%) | 0 (0.0%) |
| Total (Category) | 0 (0.0%) | 0 (0.0%) |
| Total (Overall) | 7 (63.6%) | 4 (36.4%) |
Natural Resources, Construction and Maintenance Occupations
The most common Natural Resources, Construction and Maintenance occupations in Skwentna are , and Construction & Extraction (7 | 63.6%).
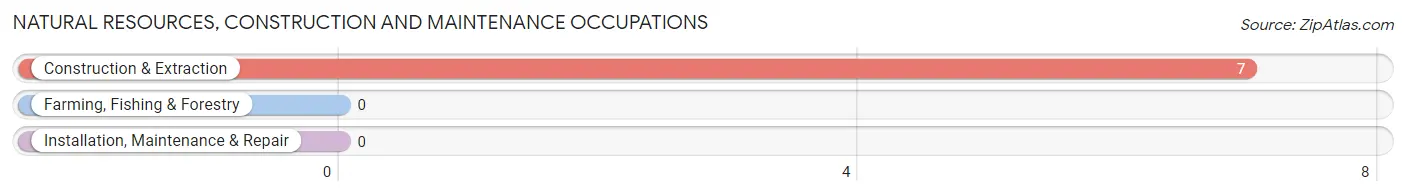
Natural Resources, Construction and Maintenance Occupations by Sex
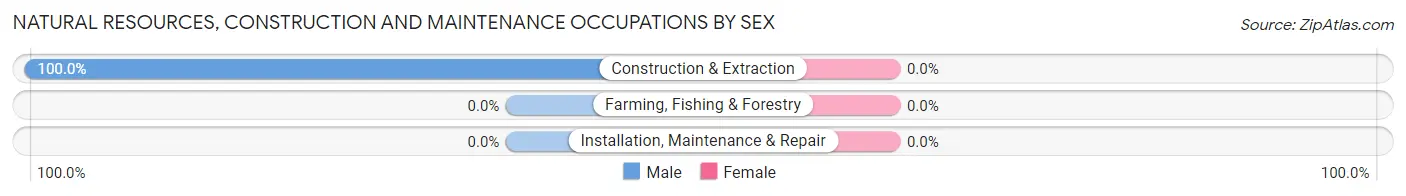
| Occupation | Male | Female |
| Farming, Fishing & Forestry | 0 (0.0%) | 0 (0.0%) |
| Construction & Extraction | 7 (100.0%) | 0 (0.0%) |
| Installation, Maintenance & Repair | 0 (0.0%) | 0 (0.0%) |
| Total (Category) | 7 (100.0%) | 0 (0.0%) |
| Total (Overall) | 7 (63.6%) | 4 (36.4%) |
Production, Transportation and Moving Occupations
Production, Transportation and Moving Occupations by Sex
| Occupation | Male | Female |
| Production | 0 (0.0%) | 0 (0.0%) |
| Transportation | 0 (0.0%) | 0 (0.0%) |
| Material Moving | 0 (0.0%) | 0 (0.0%) |
| Total (Category) | 0 (0.0%) | 0 (0.0%) |
| Total (Overall) | 7 (63.6%) | 4 (36.4%) |
Employment Industries by Sex in Skwentna
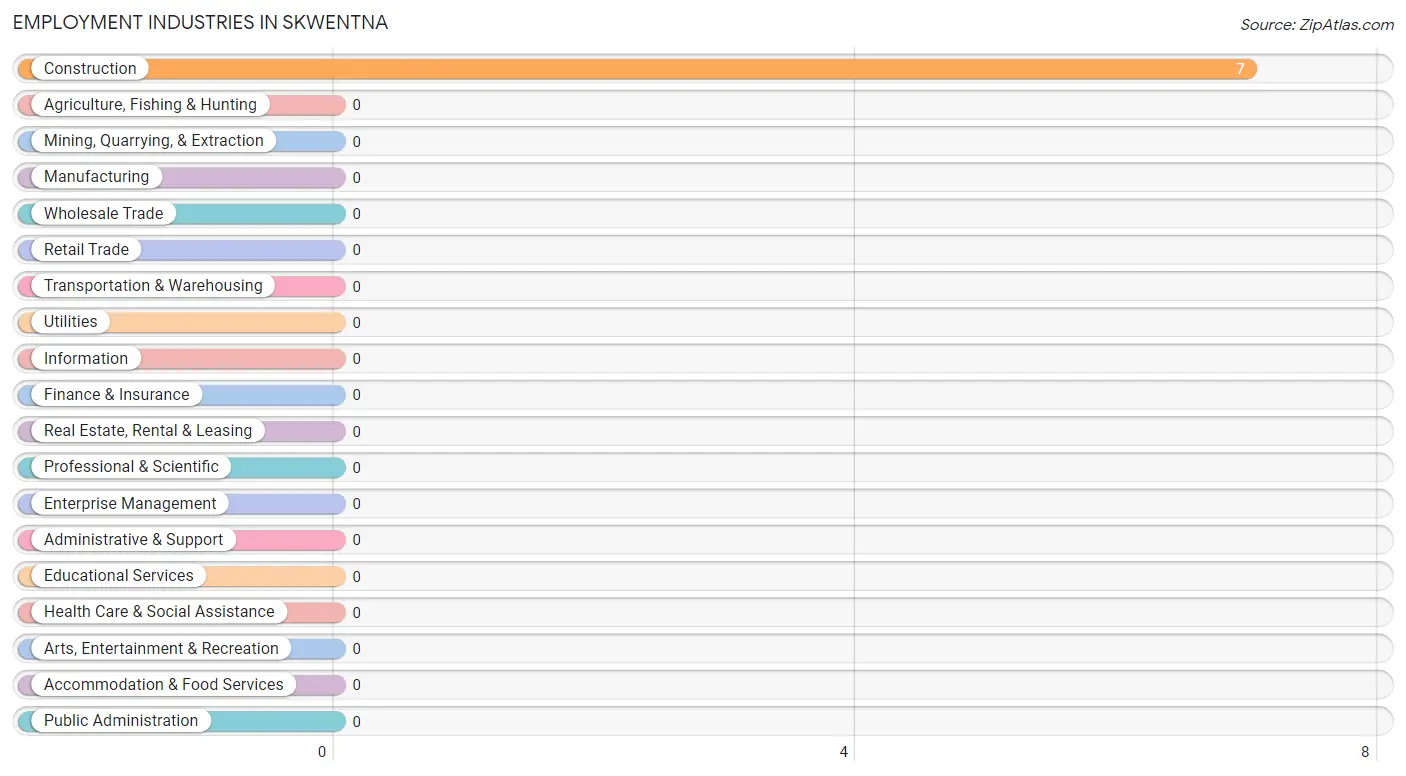
Employment Industries in Skwentna
The major employment industries in Skwentna include , and Construction (7 | 63.6%).
Employment Industries by Sex in Skwentna
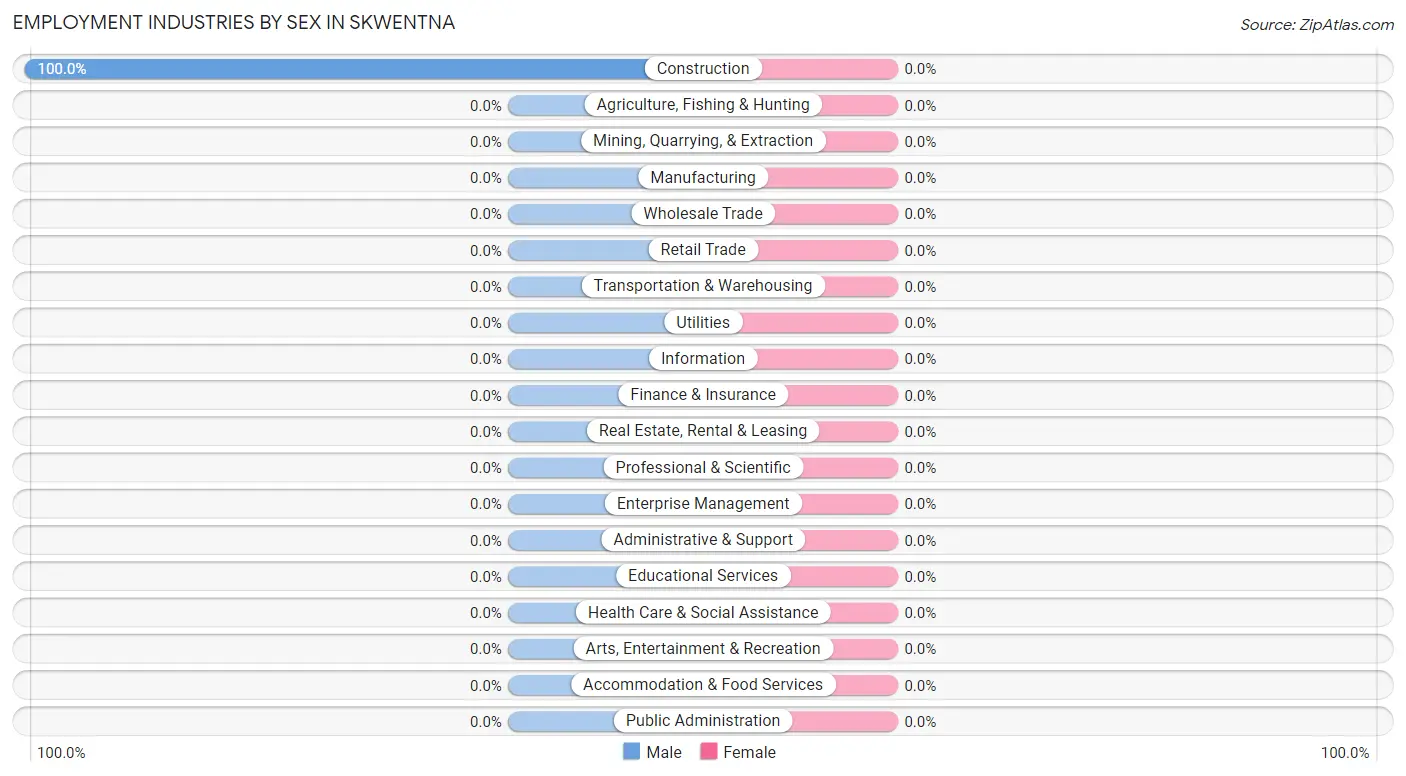
| Industry | Male | Female |
| Agriculture, Fishing & Hunting | 0 (0.0%) | 0 (0.0%) |
| Mining, Quarrying, & Extraction | 0 (0.0%) | 0 (0.0%) |
| Construction | 7 (100.0%) | 0 (0.0%) |
| Manufacturing | 0 (0.0%) | 0 (0.0%) |
| Wholesale Trade | 0 (0.0%) | 0 (0.0%) |
| Retail Trade | 0 (0.0%) | 0 (0.0%) |
| Transportation & Warehousing | 0 (0.0%) | 0 (0.0%) |
| Utilities | 0 (0.0%) | 0 (0.0%) |
| Information | 0 (0.0%) | 0 (0.0%) |
| Finance & Insurance | 0 (0.0%) | 0 (0.0%) |
| Real Estate, Rental & Leasing | 0 (0.0%) | 0 (0.0%) |
| Professional & Scientific | 0 (0.0%) | 0 (0.0%) |
| Enterprise Management | 0 (0.0%) | 0 (0.0%) |
| Administrative & Support | 0 (0.0%) | 0 (0.0%) |
| Educational Services | 0 (0.0%) | 0 (0.0%) |
| Health Care & Social Assistance | 0 (0.0%) | 0 (0.0%) |
| Arts, Entertainment & Recreation | 0 (0.0%) | 0 (0.0%) |
| Accommodation & Food Services | 0 (0.0%) | 0 (0.0%) |
| Public Administration | 0 (0.0%) | 0 (0.0%) |
| Total | 7 (63.6%) | 4 (36.4%) |
Education in Skwentna
School Enrollment in Skwentna
| School Level | # Students | % Students |
| Nursery / Preschool | 0 | 0.0% |
| Kindergarten | 0 | 0.0% |
| Elementary School | 0 | 0.0% |
| Middle School | 0 | 0.0% |
| High School | 0 | 0.0% |
| College / Undergraduate | 0 | 0.0% |
| Graduate / Professional | 0 | 0.0% |
| Total | 0 | 0.0% |
School Enrollment by Age by Funding Source in Skwentna
| Age Bracket | Public School | Private School |
| 3 to 4 Year Olds | 0 (0.0%) | 0 (0.0%) |
| 5 to 9 Year Old | 0 (0.0%) | 0 (0.0%) |
| 10 to 14 Year Olds | 0 (0.0%) | 0 (0.0%) |
| 15 to 17 Year Olds | 0 (0.0%) | 0 (0.0%) |
| 18 to 19 Year Olds | 0 (0.0%) | 0 (0.0%) |
| 20 to 24 Year Olds | 0 (0.0%) | 0 (0.0%) |
| 25 to 34 Year Olds | 0 (0.0%) | 0 (0.0%) |
| 35 Years and over | 0 (0.0%) | 0 (0.0%) |
| Total | 0 (0.0%) | 0 (0.0%) |
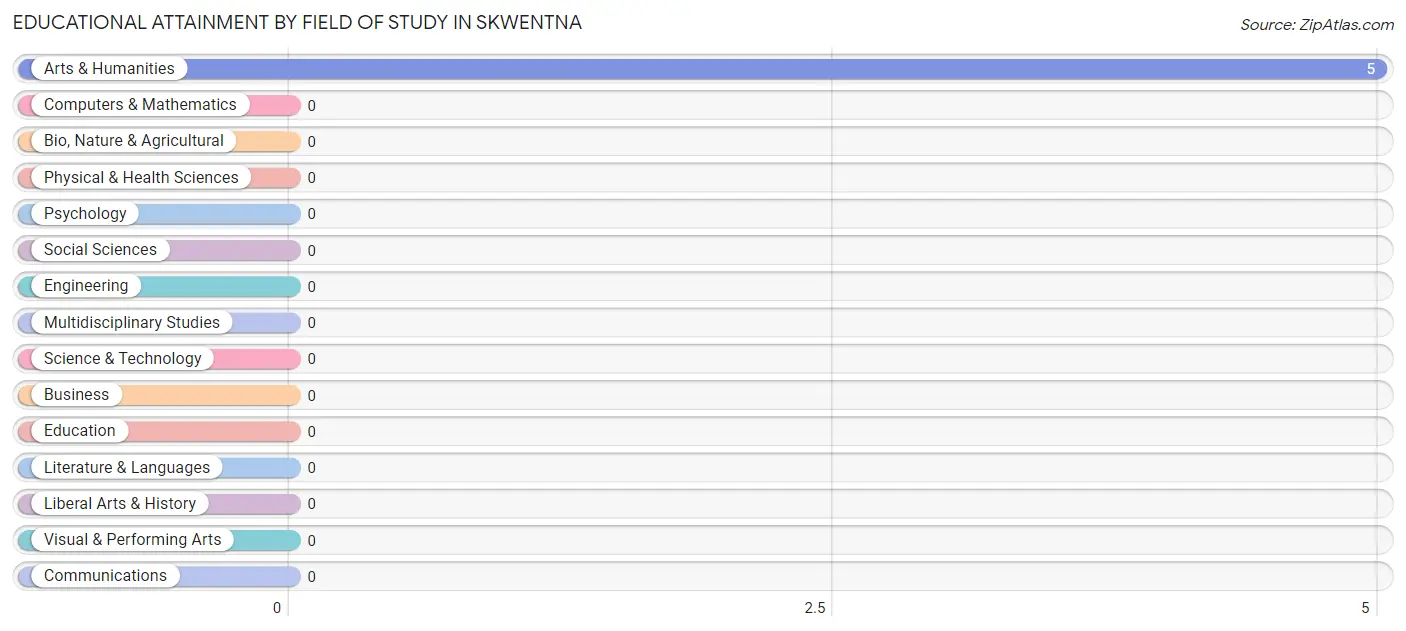
Educational Attainment by Field of Study in Skwentna
, and arts & humanities (5 | 100.0%) are the most common fields of study among 5 individuals in Skwentna who have obtained a bachelor's degree or higher.
| Field of Study | # Graduates | % Graduates |
| Computers & Mathematics | 0 | 0.0% |
| Bio, Nature & Agricultural | 0 | 0.0% |
| Physical & Health Sciences | 0 | 0.0% |
| Psychology | 0 | 0.0% |
| Social Sciences | 0 | 0.0% |
| Engineering | 0 | 0.0% |
| Multidisciplinary Studies | 0 | 0.0% |
| Science & Technology | 0 | 0.0% |
| Business | 0 | 0.0% |
| Education | 0 | 0.0% |
| Literature & Languages | 0 | 0.0% |
| Liberal Arts & History | 0 | 0.0% |
| Visual & Performing Arts | 0 | 0.0% |
| Communications | 0 | 0.0% |
| Arts & Humanities | 5 | 100.0% |
| Total | 5 | 100.0% |
Transportation & Commute in Skwentna
Vehicle Availability by Sex in Skwentna
The most prevalent vehicle ownership categories in Skwentna are males with no vehicle (7, accounting for 100.0%) and females with no vehicle (4, making up 175.0%).
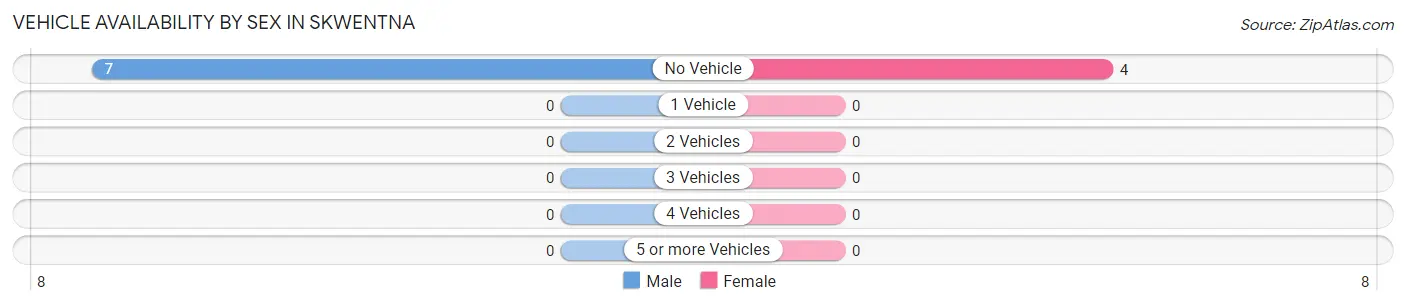
| Vehicles Available | Male | Female |
| No Vehicle | 7 (100.0%) | 4 (100.0%) |
| 1 Vehicle | 0 (0.0%) | 0 (0.0%) |
| 2 Vehicles | 0 (0.0%) | 0 (0.0%) |
| 3 Vehicles | 0 (0.0%) | 0 (0.0%) |
| 4 Vehicles | 0 (0.0%) | 0 (0.0%) |
| 5 or more Vehicles | 0 (0.0%) | 0 (0.0%) |
| Total | 7 (100.0%) | 4 (100.0%) |
Commute Time in Skwentna
The most frequently occuring commute durations in Skwentna are 90 or more minutes (7 commuters, 100.0%), less than 5 minutes (0 commuters, 0.0%), and 5 to 9 minutes (0 commuters, 0.0%).
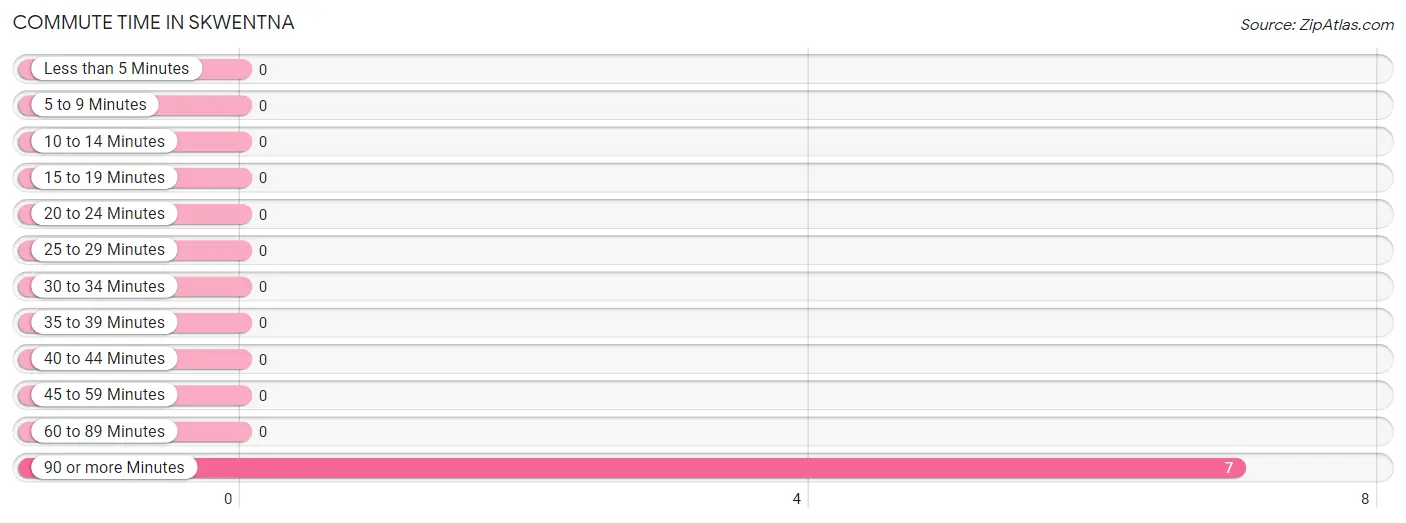
| Commute Time | # Commuters | % Commuters |
| Less than 5 Minutes | 0 | 0.0% |
| 5 to 9 Minutes | 0 | 0.0% |
| 10 to 14 Minutes | 0 | 0.0% |
| 15 to 19 Minutes | 0 | 0.0% |
| 20 to 24 Minutes | 0 | 0.0% |
| 25 to 29 Minutes | 0 | 0.0% |
| 30 to 34 Minutes | 0 | 0.0% |
| 35 to 39 Minutes | 0 | 0.0% |
| 40 to 44 Minutes | 0 | 0.0% |
| 45 to 59 Minutes | 0 | 0.0% |
| 60 to 89 Minutes | 0 | 0.0% |
| 90 or more Minutes | 7 | 100.0% |
Commute Time by Sex in Skwentna
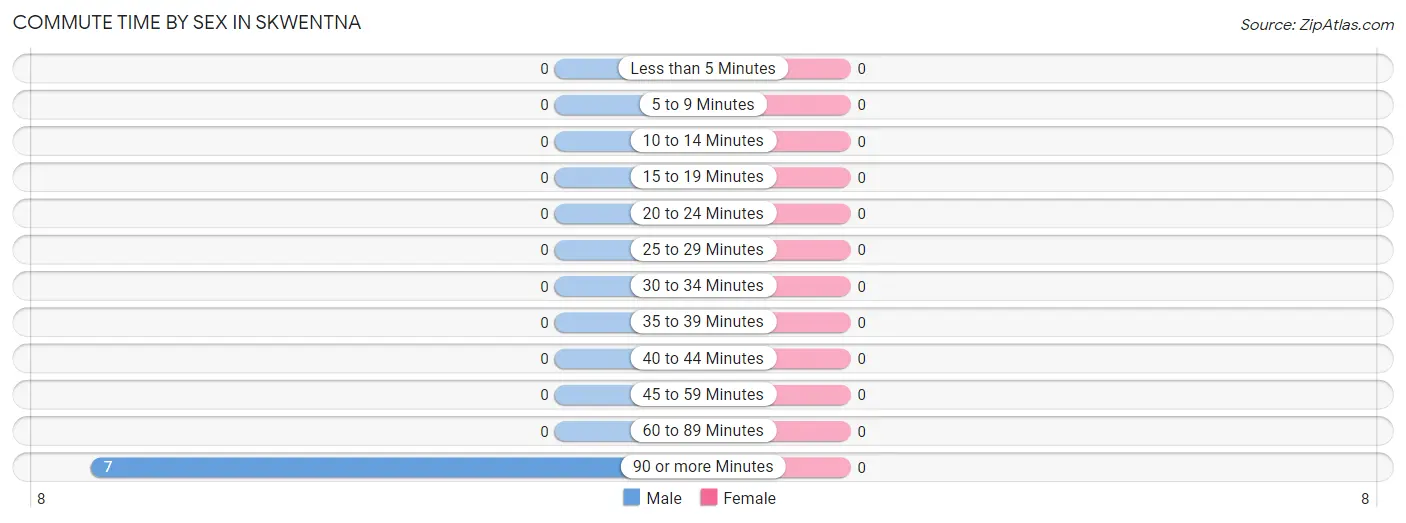
| Commute Time | Male | Female |
| Less than 5 Minutes | 0 (0.0%) | 0 (0.0%) |
| 5 to 9 Minutes | 0 (0.0%) | 0 (0.0%) |
| 10 to 14 Minutes | 0 (0.0%) | 0 (0.0%) |
| 15 to 19 Minutes | 0 (0.0%) | 0 (0.0%) |
| 20 to 24 Minutes | 0 (0.0%) | 0 (0.0%) |
| 25 to 29 Minutes | 0 (0.0%) | 0 (0.0%) |
| 30 to 34 Minutes | 0 (0.0%) | 0 (0.0%) |
| 35 to 39 Minutes | 0 (0.0%) | 0 (0.0%) |
| 40 to 44 Minutes | 0 (0.0%) | 0 (0.0%) |
| 45 to 59 Minutes | 0 (0.0%) | 0 (0.0%) |
| 60 to 89 Minutes | 0 (0.0%) | 0 (0.0%) |
| 90 or more Minutes | 7 (100.0%) | 0 (0.0%) |
Time of Departure to Work by Sex in Skwentna
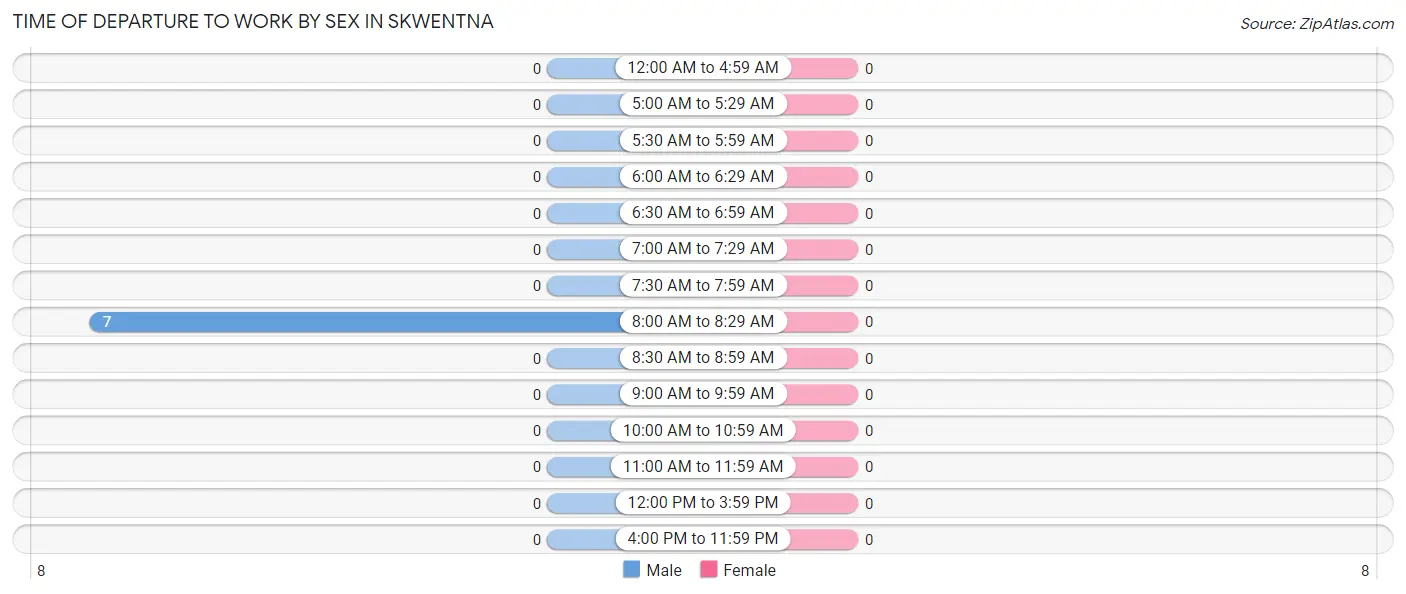
| Time of Departure | Male | Female |
| 12:00 AM to 4:59 AM | 0 (0.0%) | 0 (0.0%) |
| 5:00 AM to 5:29 AM | 0 (0.0%) | 0 (0.0%) |
| 5:30 AM to 5:59 AM | 0 (0.0%) | 0 (0.0%) |
| 6:00 AM to 6:29 AM | 0 (0.0%) | 0 (0.0%) |
| 6:30 AM to 6:59 AM | 0 (0.0%) | 0 (0.0%) |
| 7:00 AM to 7:29 AM | 0 (0.0%) | 0 (0.0%) |
| 7:30 AM to 7:59 AM | 0 (0.0%) | 0 (0.0%) |
| 8:00 AM to 8:29 AM | 7 (100.0%) | 0 (0.0%) |
| 8:30 AM to 8:59 AM | 0 (0.0%) | 0 (0.0%) |
| 9:00 AM to 9:59 AM | 0 (0.0%) | 0 (0.0%) |
| 10:00 AM to 10:59 AM | 0 (0.0%) | 0 (0.0%) |
| 11:00 AM to 11:59 AM | 0 (0.0%) | 0 (0.0%) |
| 12:00 PM to 3:59 PM | 0 (0.0%) | 0 (0.0%) |
| 4:00 PM to 11:59 PM | 0 (0.0%) | 0 (0.0%) |
| Total | 7 (100.0%) | 0 (0.0%) |
Housing Occupancy in Skwentna
Occupancy by Ownership in Skwentna
Of the total 36 dwellings in Skwentna, owner-occupied units account for 36 (100.0%), while renter-occupied units make up 0 (0.0%).
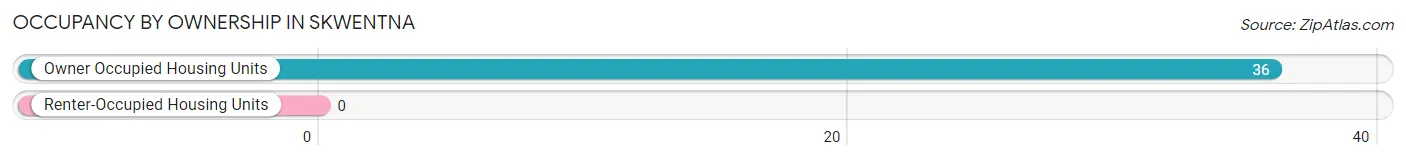
| Occupancy | # Housing Units | % Housing Units |
| Owner Occupied Housing Units | 36 | 100.0% |
| Renter-Occupied Housing Units | 0 | 0.0% |
| Total Occupied Housing Units | 36 | 100.0% |
Occupancy by Household Size in Skwentna
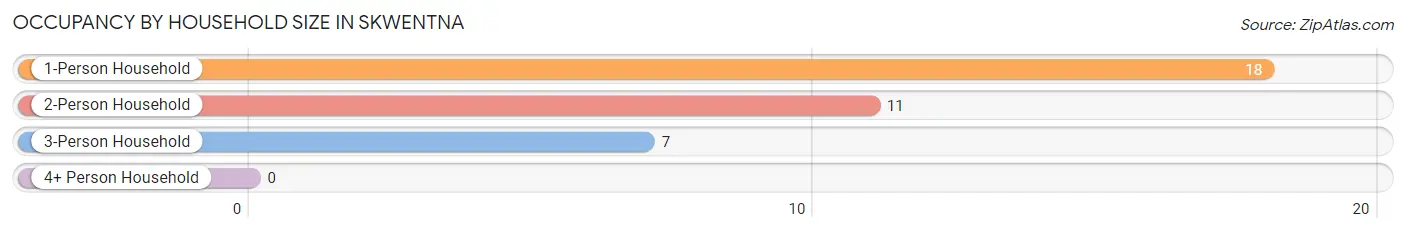
| Household Size | # Housing Units | % Housing Units |
| 1-Person Household | 18 | 50.0% |
| 2-Person Household | 11 | 30.6% |
| 3-Person Household | 7 | 19.4% |
| 4+ Person Household | 0 | 0.0% |
| Total Housing Units | 36 | 100.0% |
Occupancy by Ownership by Household Size in Skwentna
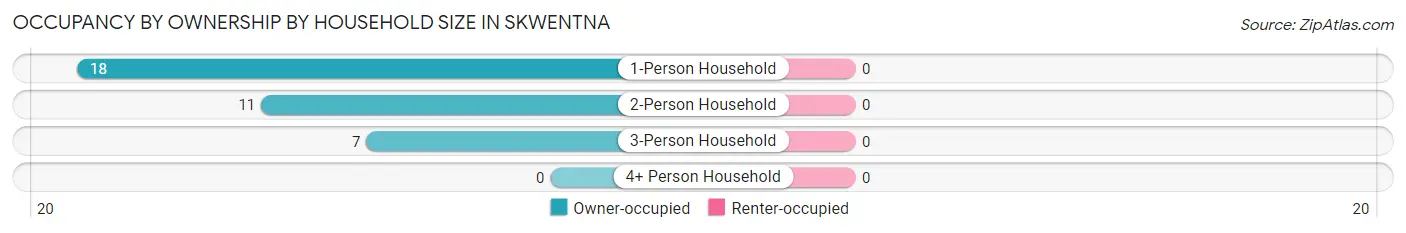
| Household Size | Owner-occupied | Renter-occupied |
| 1-Person Household | 18 (100.0%) | 0 (0.0%) |
| 2-Person Household | 11 (100.0%) | 0 (0.0%) |
| 3-Person Household | 7 (100.0%) | 0 (0.0%) |
| 4+ Person Household | 0 (0.0%) | 0 (0.0%) |
| Total Housing Units | 36 (100.0%) | 0 (0.0%) |
Occupancy by Educational Attainment in Skwentna
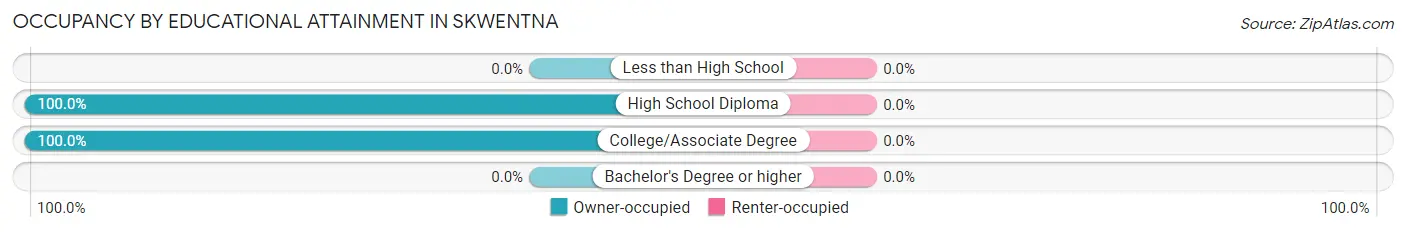
| Household Size | Owner-occupied | Renter-occupied |
| Less than High School | 0 (0.0%) | 0 (0.0%) |
| High School Diploma | 18 (100.0%) | 0 (0.0%) |
| College/Associate Degree | 18 (100.0%) | 0 (0.0%) |
| Bachelor's Degree or higher | 0 (0.0%) | 0 (0.0%) |
Occupancy by Age of Householder in Skwentna
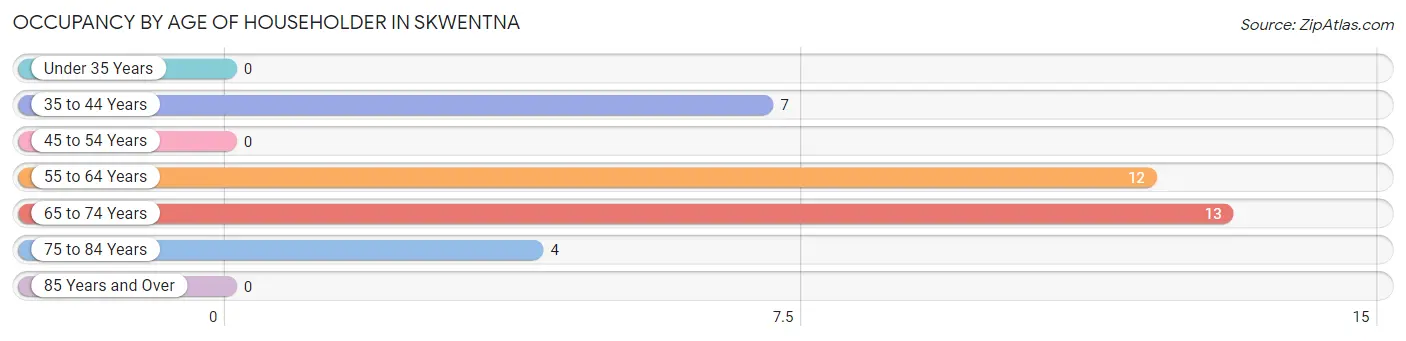
| Age Bracket | # Households | % Households |
| Under 35 Years | 0 | 0.0% |
| 35 to 44 Years | 7 | 19.4% |
| 45 to 54 Years | 0 | 0.0% |
| 55 to 64 Years | 12 | 33.3% |
| 65 to 74 Years | 13 | 36.1% |
| 75 to 84 Years | 4 | 11.1% |
| 85 Years and Over | 0 | 0.0% |
| Total | 36 | 100.0% |
Housing Finances in Skwentna
Median Income by Occupancy in Skwentna
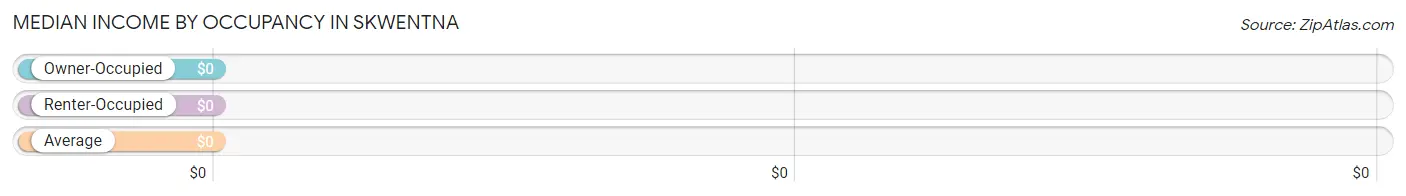
| Occupancy Type | # Households | Median Income |
| Owner-Occupied | 36 (100.0%) | $0 |
| Renter-Occupied | 0 (0.0%) | $0 |
| Average | 36 (100.0%) | $0 |
Occupancy by Householder Income Bracket in Skwentna

| Income Bracket | Owner-occupied | Renter-occupied |
| Less than $5,000 | 0 (0.0%) | 0 (0.0%) |
| $5,000 to $9,999 | 7 (19.4%) | 0 (0.0%) |
| $10,000 to $14,999 | 5 (13.9%) | 0 (0.0%) |
| $15,000 to $19,999 | 0 (0.0%) | 0 (0.0%) |
| $20,000 to $24,999 | 0 (0.0%) | 0 (0.0%) |
| $25,000 to $34,999 | 7 (19.4%) | 0 (0.0%) |
| $35,000 to $49,999 | 6 (16.7%) | 0 (0.0%) |
| $50,000 to $74,999 | 0 (0.0%) | 0 (0.0%) |
| $75,000 to $99,999 | 0 (0.0%) | 0 (0.0%) |
| $100,000 to $149,999 | 0 (0.0%) | 0 (0.0%) |
| $150,000 or more | 11 (30.6%) | 0 (0.0%) |
| Total | 36 (100.0%) | 0 (0.0%) |
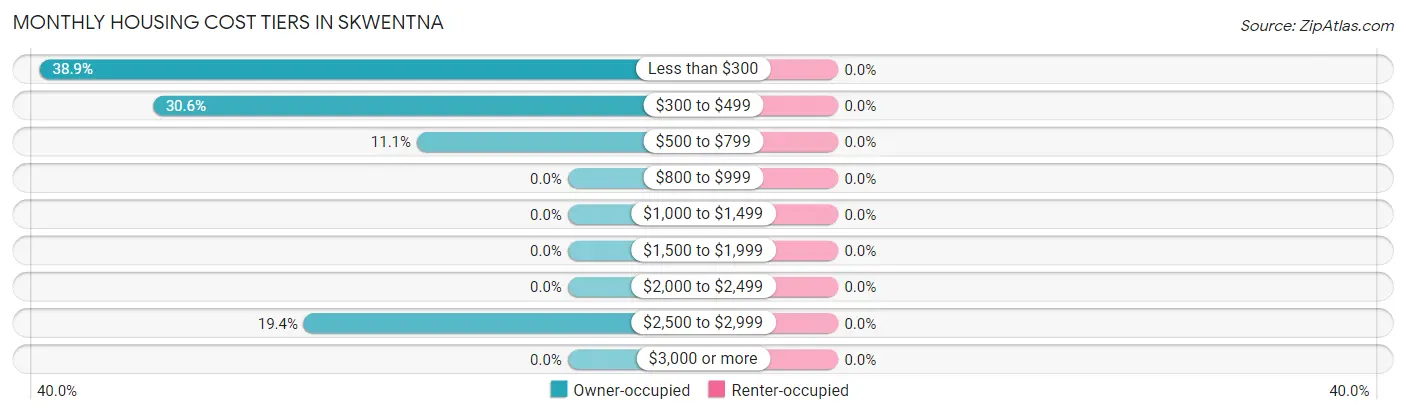
Monthly Housing Cost Tiers in Skwentna
| Monthly Cost | Owner-occupied | Renter-occupied |
| Less than $300 | 14 (38.9%) | 0 (0.0%) |
| $300 to $499 | 11 (30.6%) | 0 (0.0%) |
| $500 to $799 | 4 (11.1%) | 0 (0.0%) |
| $800 to $999 | 0 (0.0%) | 0 (0.0%) |
| $1,000 to $1,499 | 0 (0.0%) | 0 (0.0%) |
| $1,500 to $1,999 | 0 (0.0%) | 0 (0.0%) |
| $2,000 to $2,499 | 0 (0.0%) | 0 (0.0%) |
| $2,500 to $2,999 | 7 (19.4%) | 0 (0.0%) |
| $3,000 or more | 0 (0.0%) | 0 (0.0%) |
| Total | 36 (100.0%) | 0 (0.0%) |
Physical Housing Characteristics in Skwentna
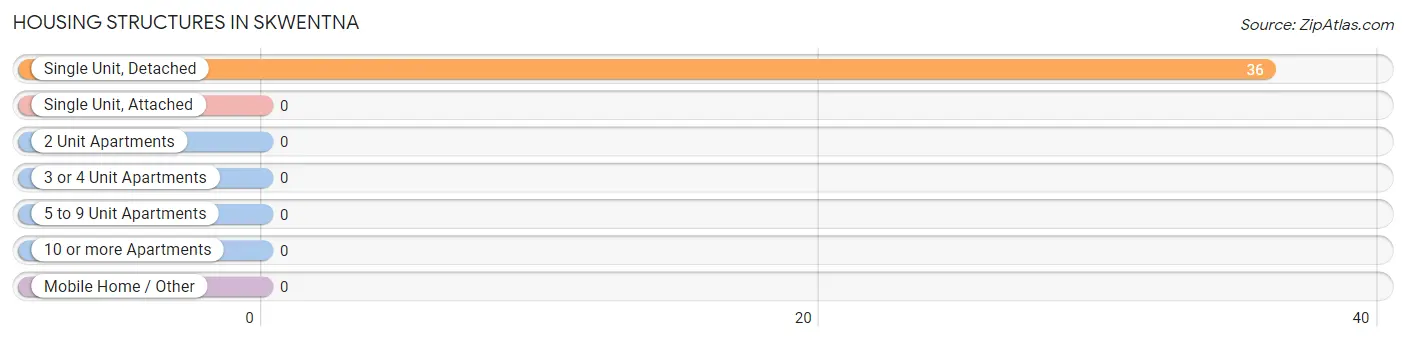
Housing Structures in Skwentna
| Structure Type | # Housing Units | % Housing Units |
| Single Unit, Detached | 36 | 100.0% |
| Single Unit, Attached | 0 | 0.0% |
| 2 Unit Apartments | 0 | 0.0% |
| 3 or 4 Unit Apartments | 0 | 0.0% |
| 5 to 9 Unit Apartments | 0 | 0.0% |
| 10 or more Apartments | 0 | 0.0% |
| Mobile Home / Other | 0 | 0.0% |
| Total | 36 | 100.0% |
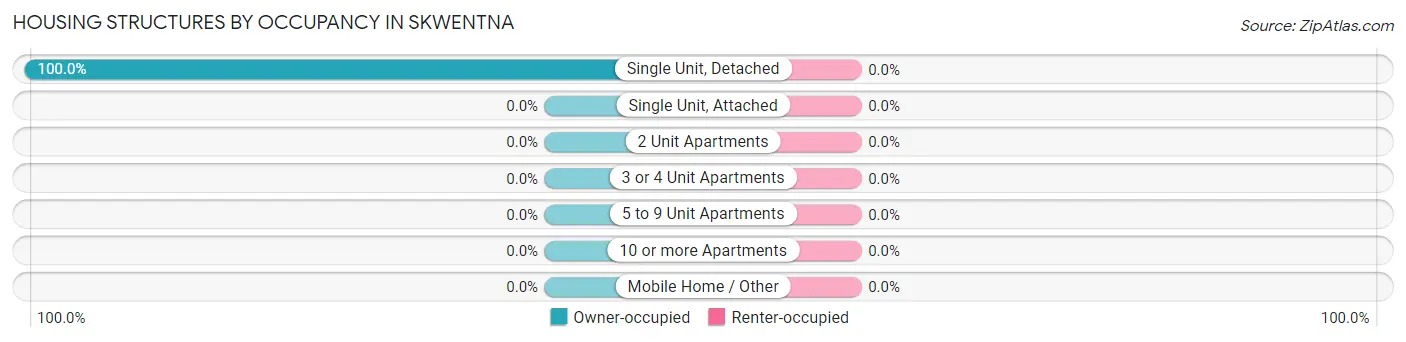
Housing Structures by Occupancy in Skwentna
| Structure Type | Owner-occupied | Renter-occupied |
| Single Unit, Detached | 36 (100.0%) | 0 (0.0%) |
| Single Unit, Attached | 0 (0.0%) | 0 (0.0%) |
| 2 Unit Apartments | 0 (0.0%) | 0 (0.0%) |
| 3 or 4 Unit Apartments | 0 (0.0%) | 0 (0.0%) |
| 5 to 9 Unit Apartments | 0 (0.0%) | 0 (0.0%) |
| 10 or more Apartments | 0 (0.0%) | 0 (0.0%) |
| Mobile Home / Other | 0 (0.0%) | 0 (0.0%) |
| Total | 36 (100.0%) | 0 (0.0%) |
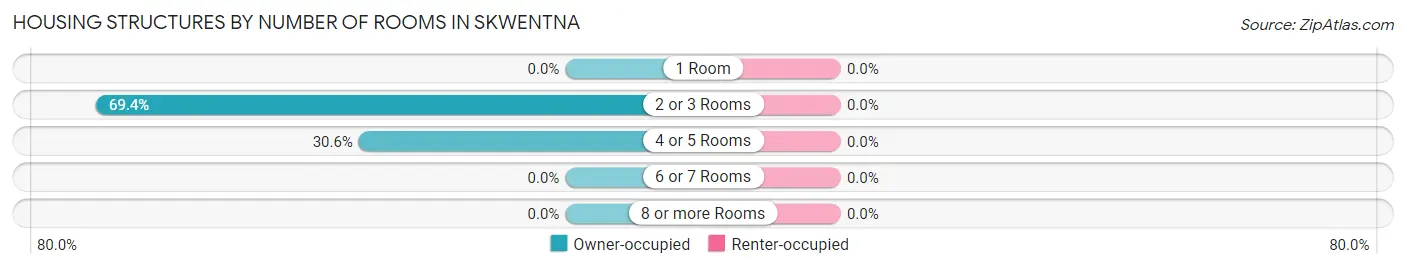
Housing Structures by Number of Rooms in Skwentna
| Number of Rooms | Owner-occupied | Renter-occupied |
| 1 Room | 0 (0.0%) | 0 (0.0%) |
| 2 or 3 Rooms | 25 (69.4%) | 0 (0.0%) |
| 4 or 5 Rooms | 11 (30.6%) | 0 (0.0%) |
| 6 or 7 Rooms | 0 (0.0%) | 0 (0.0%) |
| 8 or more Rooms | 0 (0.0%) | 0 (0.0%) |
| Total | 36 (100.0%) | 0 (0.0%) |
Housing Structure by Heating Type in Skwentna
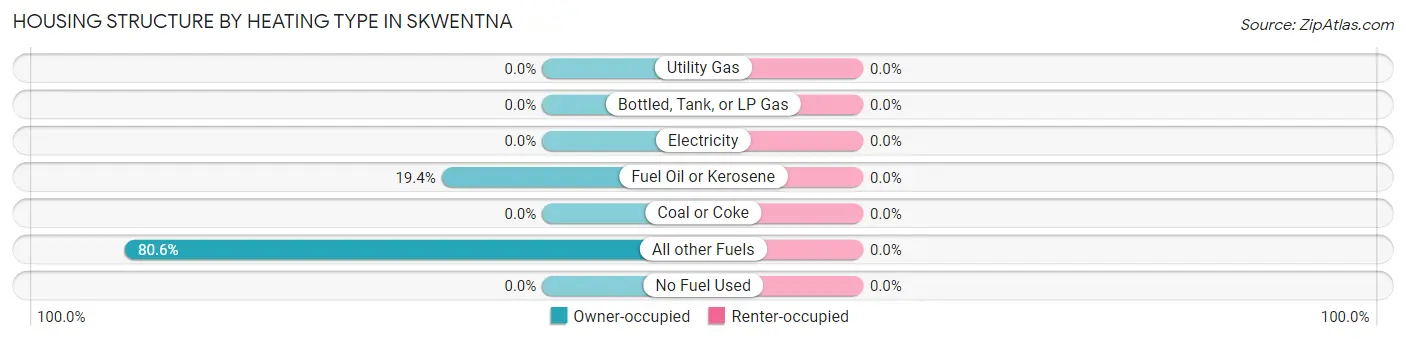
| Heating Type | Owner-occupied | Renter-occupied |
| Utility Gas | 0 (0.0%) | 0 (0.0%) |
| Bottled, Tank, or LP Gas | 0 (0.0%) | 0 (0.0%) |
| Electricity | 0 (0.0%) | 0 (0.0%) |
| Fuel Oil or Kerosene | 7 (19.4%) | 0 (0.0%) |
| Coal or Coke | 0 (0.0%) | 0 (0.0%) |
| All other Fuels | 29 (80.6%) | 0 (0.0%) |
| No Fuel Used | 0 (0.0%) | 0 (0.0%) |
| Total | 36 (100.0%) | 0 (0.0%) |
Household Vehicle Usage in Skwentna
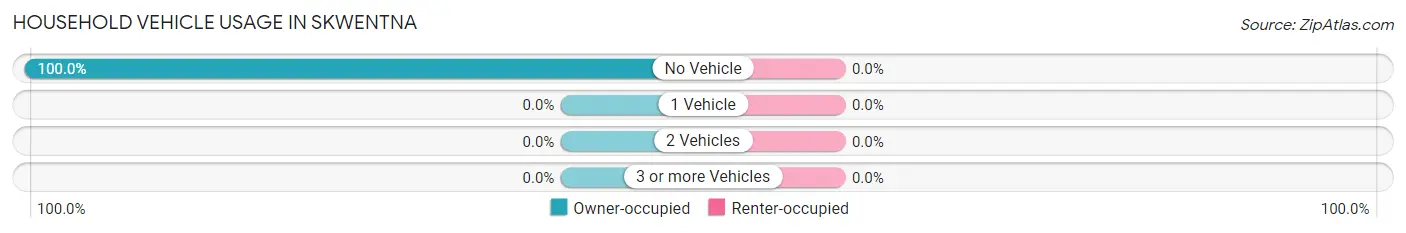
| Vehicles per Household | Owner-occupied | Renter-occupied |
| No Vehicle | 36 (100.0%) | 0 (0.0%) |
| 1 Vehicle | 0 (0.0%) | 0 (0.0%) |
| 2 Vehicles | 0 (0.0%) | 0 (0.0%) |
| 3 or more Vehicles | 0 (0.0%) | 0 (0.0%) |
| Total | 36 (100.0%) | 0 (0.0%) |
Real Estate & Mortgages in Skwentna
Real Estate and Mortgage Overview in Skwentna
| Characteristic | Without Mortgage | With Mortgage |
| Housing Units | 29 | 7 |
| Median Property Value | $83,600 | $0 |
| Median Household Income | $25,893 | $7 |
| Monthly Housing Costs | $304 | $0 |
| Real Estate Taxes | - | - |
Property Value by Mortgage Status in Skwentna
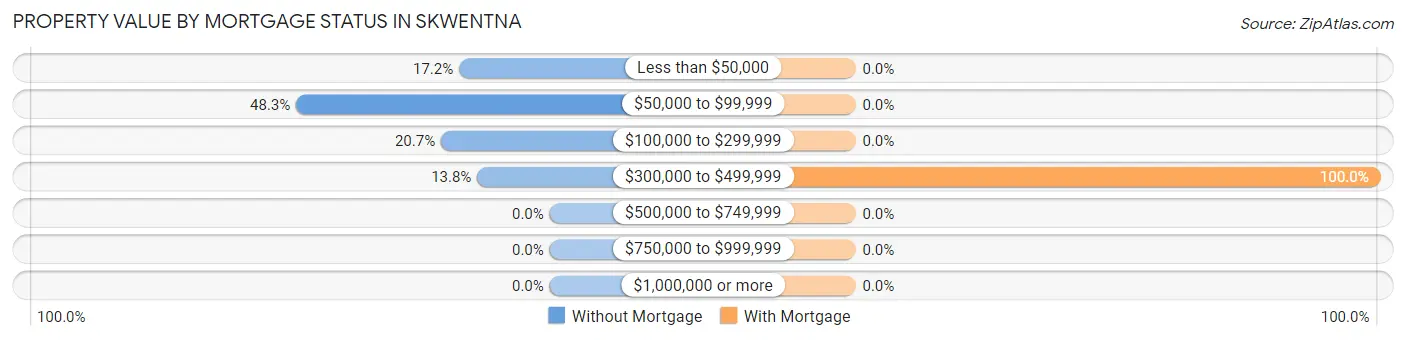
| Property Value | Without Mortgage | With Mortgage |
| Less than $50,000 | 5 (17.2%) | 0 (0.0%) |
| $50,000 to $99,999 | 14 (48.3%) | 0 (0.0%) |
| $100,000 to $299,999 | 6 (20.7%) | 0 (0.0%) |
| $300,000 to $499,999 | 4 (13.8%) | 7 (100.0%) |
| $500,000 to $749,999 | 0 (0.0%) | 0 (0.0%) |
| $750,000 to $999,999 | 0 (0.0%) | 0 (0.0%) |
| $1,000,000 or more | 0 (0.0%) | 0 (0.0%) |
| Total | 29 (100.0%) | 7 (100.0%) |
Household Income by Mortgage Status in Skwentna
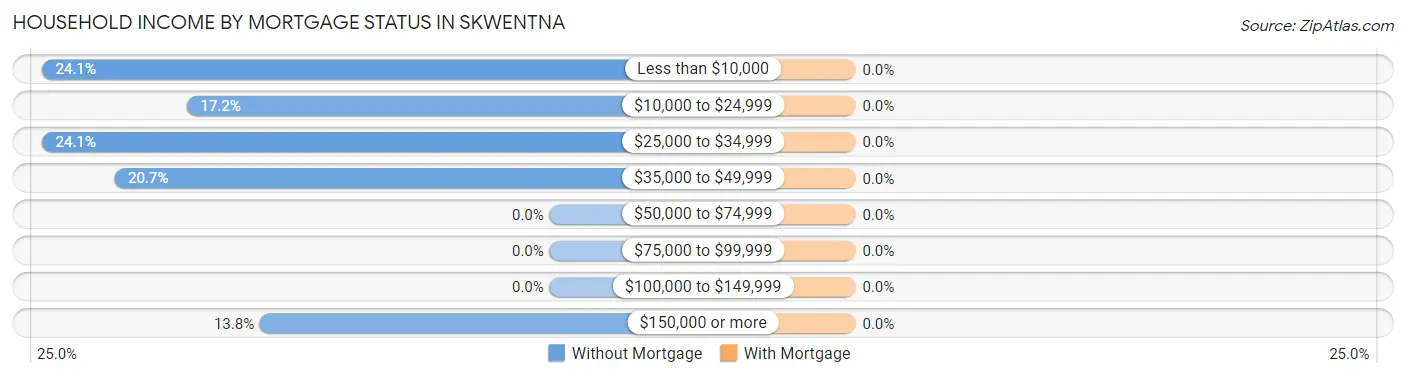
| Household Income | Without Mortgage | With Mortgage |
| Less than $10,000 | 7 (24.1%) | 0 (0.0%) |
| $10,000 to $24,999 | 5 (17.2%) | 0 (0.0%) |
| $25,000 to $34,999 | 7 (24.1%) | 0 (0.0%) |
| $35,000 to $49,999 | 6 (20.7%) | 0 (0.0%) |
| $50,000 to $74,999 | 0 (0.0%) | 0 (0.0%) |
| $75,000 to $99,999 | 0 (0.0%) | 0 (0.0%) |
| $100,000 to $149,999 | 0 (0.0%) | 0 (0.0%) |
| $150,000 or more | 4 (13.8%) | 0 (0.0%) |
| Total | 29 (100.0%) | 7 (100.0%) |
Property Value to Household Income Ratio in Skwentna
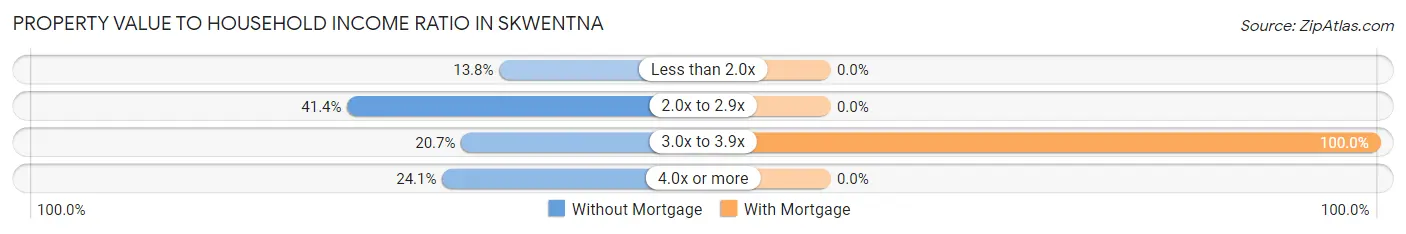
| Value-to-Income Ratio | Without Mortgage | With Mortgage |
| Less than 2.0x | 4 (13.8%) | 0 (0.0%) |
| 2.0x to 2.9x | 12 (41.4%) | 0 (0.0%) |
| 3.0x to 3.9x | 6 (20.7%) | 7 (100.0%) |
| 4.0x or more | 7 (24.1%) | 0 (0.0%) |
| Total | 29 (100.0%) | 7 (100.0%) |
Real Estate Taxes by Mortgage Status in Skwentna
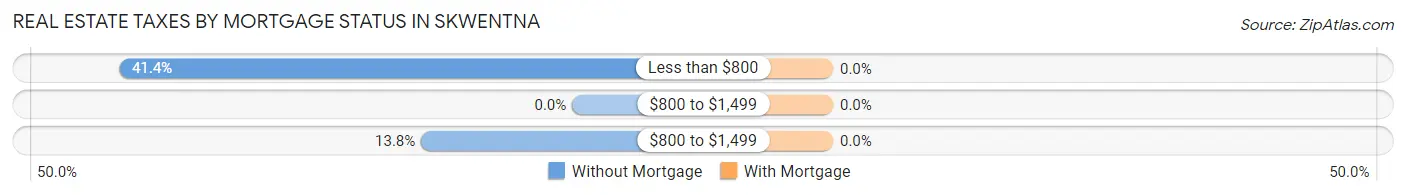
| Property Taxes | Without Mortgage | With Mortgage |
| Less than $800 | 12 (41.4%) | 0 (0.0%) |
| $800 to $1,499 | 0 (0.0%) | 0 (0.0%) |
| $800 to $1,499 | 4 (13.8%) | 0 (0.0%) |
| Total | 29 (100.0%) | 7 (100.0%) |
Health & Disability in Skwentna
Health Insurance Coverage by Age in Skwentna
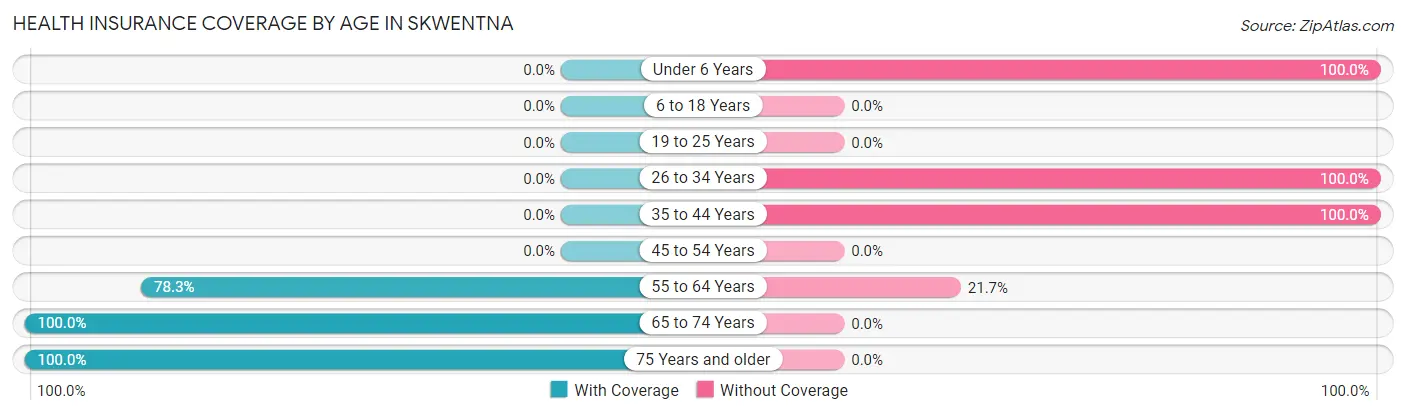
| Age Bracket | With Coverage | Without Coverage |
| Under 6 Years | 0 (0.0%) | 7 (100.0%) |
| 6 to 18 Years | 0 (0.0%) | 0 (0.0%) |
| 19 to 25 Years | 0 (0.0%) | 0 (0.0%) |
| 26 to 34 Years | 0 (0.0%) | 9 (100.0%) |
| 35 to 44 Years | 0 (0.0%) | 7 (100.0%) |
| 45 to 54 Years | 0 (0.0%) | 0 (0.0%) |
| 55 to 64 Years | 18 (78.3%) | 5 (21.7%) |
| 65 to 74 Years | 13 (100.0%) | 0 (0.0%) |
| 75 Years and older | 4 (100.0%) | 0 (0.0%) |
| Total | 35 (55.6%) | 28 (44.4%) |
Health Insurance Coverage by Citizenship Status in Skwentna
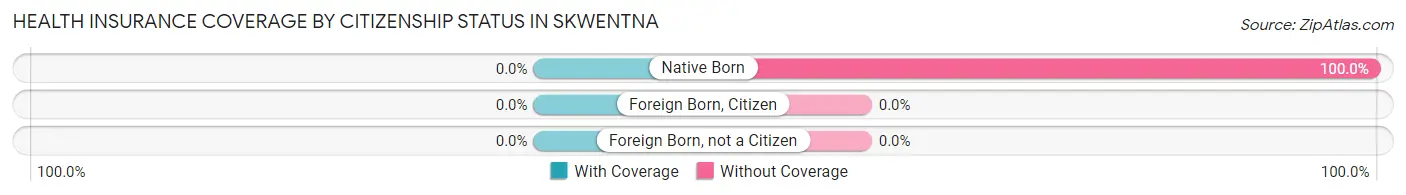
| Citizenship Status | With Coverage | Without Coverage |
| Native Born | 0 (0.0%) | 7 (100.0%) |
| Foreign Born, Citizen | 0 (0.0%) | 0 (0.0%) |
| Foreign Born, not a Citizen | 0 (0.0%) | 0 (0.0%) |
Health Insurance Coverage by Household Income in Skwentna
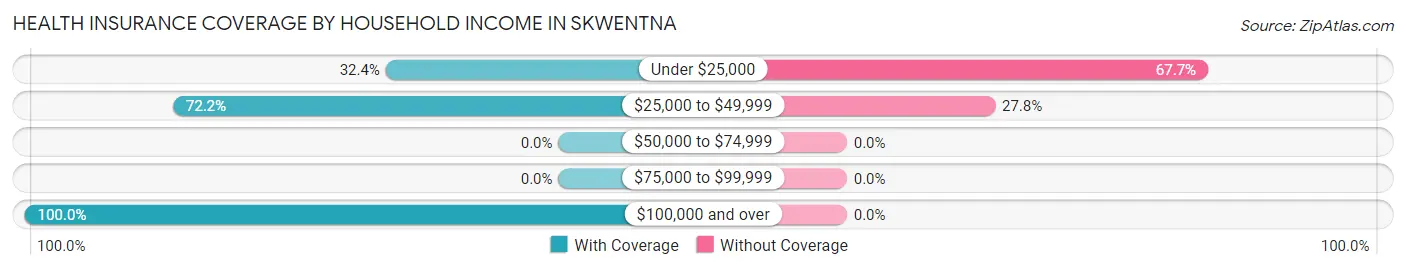
| Household Income | With Coverage | Without Coverage |
| Under $25,000 | 11 (32.4%) | 23 (67.6%) |
| $25,000 to $49,999 | 13 (72.2%) | 5 (27.8%) |
| $50,000 to $74,999 | 0 (0.0%) | 0 (0.0%) |
| $75,000 to $99,999 | 0 (0.0%) | 0 (0.0%) |
| $100,000 and over | 11 (100.0%) | 0 (0.0%) |
Public vs Private Health Insurance Coverage by Age in Skwentna
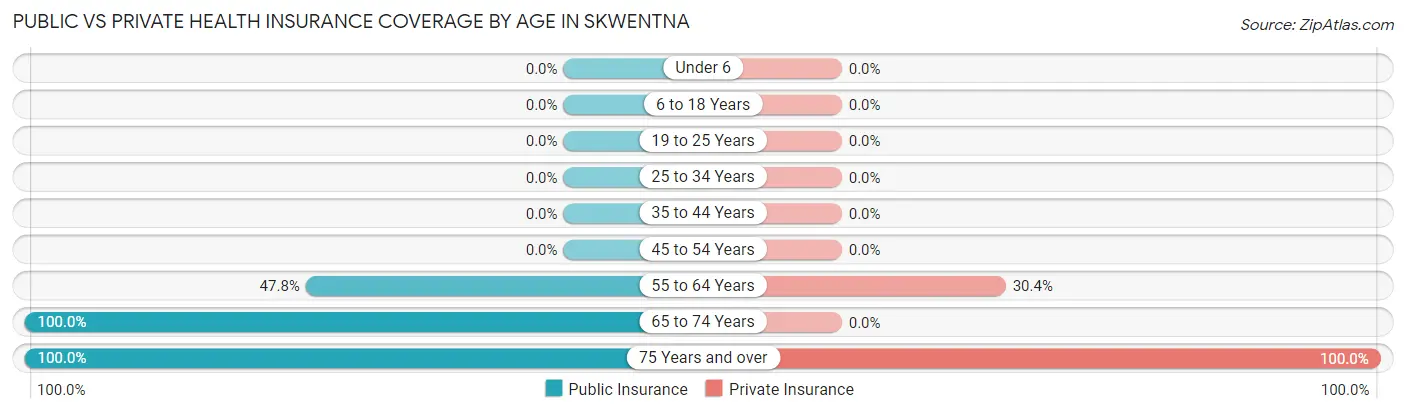
| Age Bracket | Public Insurance | Private Insurance |
| Under 6 | 0 (0.0%) | 0 (0.0%) |
| 6 to 18 Years | 0 (0.0%) | 0 (0.0%) |
| 19 to 25 Years | 0 (0.0%) | 0 (0.0%) |
| 25 to 34 Years | 0 (0.0%) | 0 (0.0%) |
| 35 to 44 Years | 0 (0.0%) | 0 (0.0%) |
| 45 to 54 Years | 0 (0.0%) | 0 (0.0%) |
| 55 to 64 Years | 11 (47.8%) | 7 (30.4%) |
| 65 to 74 Years | 13 (100.0%) | 0 (0.0%) |
| 75 Years and over | 4 (100.0%) | 4 (100.0%) |
| Total | 28 (44.4%) | 11 (17.5%) |
Disability Status by Sex by Age in Skwentna
| Age Bracket | Male | Female |
| Under 5 Years | 0 (0.0%) | 0 (0.0%) |
| 5 to 17 Years | 0 (0.0%) | 0 (0.0%) |
| 18 to 34 Years | 0 (0.0%) | 0 (0.0%) |
| 35 to 64 Years | 0 (0.0%) | 0 (0.0%) |
| 65 to 74 Years | 0 (0.0%) | 0 (0.0%) |
| 75 Years and over | 0 (0.0%) | 0 (0.0%) |
Disability Class by Sex by Age in Skwentna
Disability Class: Hearing Difficulty
| Age Bracket | Male | Female |
| Under 5 Years | 0 (0.0%) | 0 (0.0%) |
| 5 to 17 Years | 0 (0.0%) | 0 (0.0%) |
| 18 to 34 Years | 0 (0.0%) | 0 (0.0%) |
| 35 to 64 Years | 0 (0.0%) | 0 (0.0%) |
| 65 to 74 Years | 0 (0.0%) | 0 (0.0%) |
| 75 Years and over | 0 (0.0%) | 0 (0.0%) |
Disability Class: Vision Difficulty
| Age Bracket | Male | Female |
| Under 5 Years | 0 (0.0%) | 0 (0.0%) |
| 5 to 17 Years | 0 (0.0%) | 0 (0.0%) |
| 18 to 34 Years | 0 (0.0%) | 0 (0.0%) |
| 35 to 64 Years | 0 (0.0%) | 0 (0.0%) |
| 65 to 74 Years | 0 (0.0%) | 0 (0.0%) |
| 75 Years and over | 0 (0.0%) | 0 (0.0%) |
Disability Class: Cognitive Difficulty
| Age Bracket | Male | Female |
| 5 to 17 Years | 0 (0.0%) | 0 (0.0%) |
| 18 to 34 Years | 0 (0.0%) | 0 (0.0%) |
| 35 to 64 Years | 0 (0.0%) | 0 (0.0%) |
| 65 to 74 Years | 0 (0.0%) | 0 (0.0%) |
| 75 Years and over | 0 (0.0%) | 0 (0.0%) |
Disability Class: Ambulatory Difficulty
| Age Bracket | Male | Female |
| 5 to 17 Years | 0 (0.0%) | 0 (0.0%) |
| 18 to 34 Years | 0 (0.0%) | 0 (0.0%) |
| 35 to 64 Years | 0 (0.0%) | 0 (0.0%) |
| 65 to 74 Years | 0 (0.0%) | 0 (0.0%) |
| 75 Years and over | 0 (0.0%) | 0 (0.0%) |
Disability Class: Self-Care Difficulty
| Age Bracket | Male | Female |
| 5 to 17 Years | 0 (0.0%) | 0 (0.0%) |
| 18 to 34 Years | 0 (0.0%) | 0 (0.0%) |
| 35 to 64 Years | 0 (0.0%) | 0 (0.0%) |
| 65 to 74 Years | 0 (0.0%) | 0 (0.0%) |
| 75 Years and over | 0 (0.0%) | 0 (0.0%) |
Technology Access in Skwentna
Computing Device Access in Skwentna
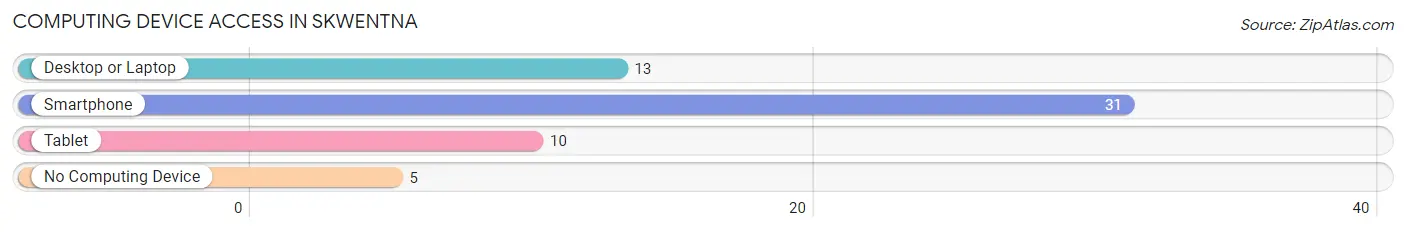
| Device Type | # Households | % Households |
| Desktop or Laptop | 13 | 36.1% |
| Smartphone | 31 | 86.1% |
| Tablet | 10 | 27.8% |
| No Computing Device | 5 | 13.9% |
| Total | 36 | 100.0% |
Internet Access in Skwentna
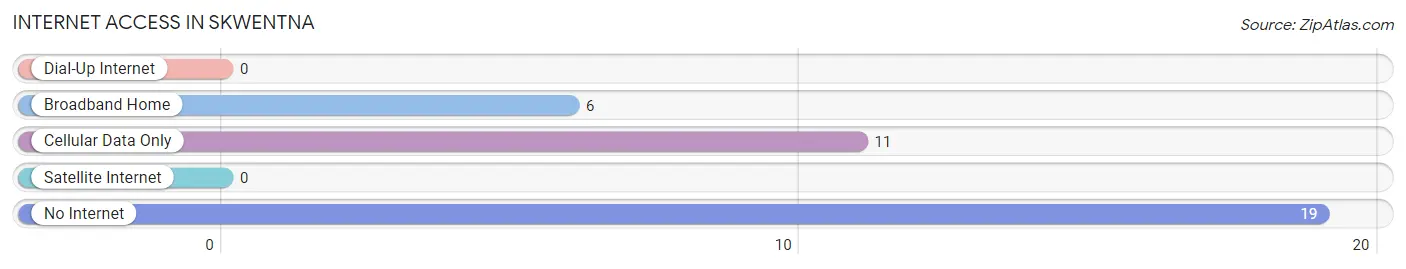
| Internet Type | # Households | % Households |
| Dial-Up Internet | 0 | 0.0% |
| Broadband Home | 6 | 16.7% |
| Cellular Data Only | 11 | 30.6% |
| Satellite Internet | 0 | 0.0% |
| No Internet | 19 | 52.8% |
| Total | 36 | 100.0% |
Skwentna Summary
Skwentna is a small unincorporated community located in the Matanuska-Susitna Borough of Alaska. It is situated on the west bank of the Skwentna River, approximately 80 miles northwest of Anchorage. The community is accessible by air and by boat, and is home to approximately 50 full-time residents.
History
Skwentna was first settled in the late 1800s by trappers and miners who were drawn to the area by the abundance of fur-bearing animals and gold. The first post office was established in the area in 1902, and the community was officially incorporated in 1906.
The area was home to a number of gold mines, including the Skwentna Mine, which operated from 1906 to 1910. The mine produced over $1 million in gold, but was eventually abandoned due to the difficulty of transporting the ore to market.
In the early 1900s, the area was also home to a number of homesteaders, who were drawn to the area by the promise of free land. The homesteaders built cabins and cleared land for farming, but the harsh climate and short growing season made it difficult to make a living.
Geography
Skwentna is located in the Matanuska-Susitna Borough of Alaska, approximately 80 miles northwest of Anchorage. The community is situated on the west bank of the Skwentna River, which flows through the area.
The area is characterized by rolling hills and mountains, with the highest peak in the area being Mount Skwentna, which rises to an elevation of 4,890 feet. The area is also home to numerous lakes, including Skwentna Lake, which is located just north of the community.
The climate in Skwentna is generally cold and dry, with temperatures ranging from -20°F in the winter to 70°F in the summer. The area receives an average of 20 inches of precipitation per year, with most of it falling in the form of snow.
Economy
The economy of Skwentna is largely based on subsistence activities, such as fishing, hunting, and trapping. The area is also home to a number of small businesses, including a general store, a gas station, and a restaurant.
Tourism is also an important part of the local economy, with visitors coming to the area to take advantage of the area’s natural beauty and recreational opportunities. The area is home to a number of lodges and cabins, as well as a number of trails for hiking, biking, and snowmobiling.
Demographics
As of the 2010 census, Skwentna had a population of 50 people. The racial makeup of the community was 100% White. The median age of the population was 44.5 years, with a median household income of $45,000.
The majority of the population (90%) was born in the United States, with the remaining 10% being foreign-born. The most common language spoken in the community was English (90%), followed by Spanish (5%) and Russian (5%).
Conclusion
Skwentna is a small unincorporated community located in the Matanuska-Susitna Borough of Alaska. It is situated on the west bank of the Skwentna River, approximately 80 miles northwest of Anchorage. The community is home to approximately 50 full-time residents, and is largely dependent on subsistence activities, such as fishing, hunting, and trapping. Tourism is also an important part of the local economy, with visitors coming to the area to take advantage of the area’s natural beauty and recreational opportunities. The population of Skwentna is predominantly White, with the majority of the population being born in the United States.
Common Questions
What is Per Capita Income in Skwentna?
Per Capita income in Skwentna is $44,040.
What is Inequality or Gini Index in Skwentna?
Inequality or Gini Index in Skwentna is 0.55.
What is the Total Population of Skwentna?
Total Population of Skwentna is 63.
What is the Total Male Population of Skwentna?
Total Male Population of Skwentna is 33.
What is the Total Female Population of Skwentna?
Total Female Population of Skwentna is 30.
What is the Ratio of Males per 100 Females in Skwentna?
There are 110.00 Males per 100 Females in Skwentna.
What is the Ratio of Females per 100 Males in Skwentna?
There are 90.91 Females per 100 Males in Skwentna.
What is the Median Population Age in Skwentna?
Median Population Age in Skwentna is 60.1 Years.
What is the Average Family Size in Skwentna
Average Family Size in Skwentna is 2.8 People.
What is the Average Household Size in Skwentna
Average Household Size in Skwentna is 1.8 People.
How Large is the Labor Force in Skwentna?
There are 17 People in the Labor Forcein in Skwentna.
What is the Percentage of People in the Labor Force in Skwentna?
30.4% of People are in the Labor Force in Skwentna.
What is the Unemployment Rate in Skwentna?
Unemployment Rate in Skwentna is 35.3%.