Zip Codes with the Highest Percentage of Population with a Degree in Liberal Arts and History in Vermont
RELATED REPORTS & OPTIONS
Liberal Arts and History
Vermont
Compare Zip Codes
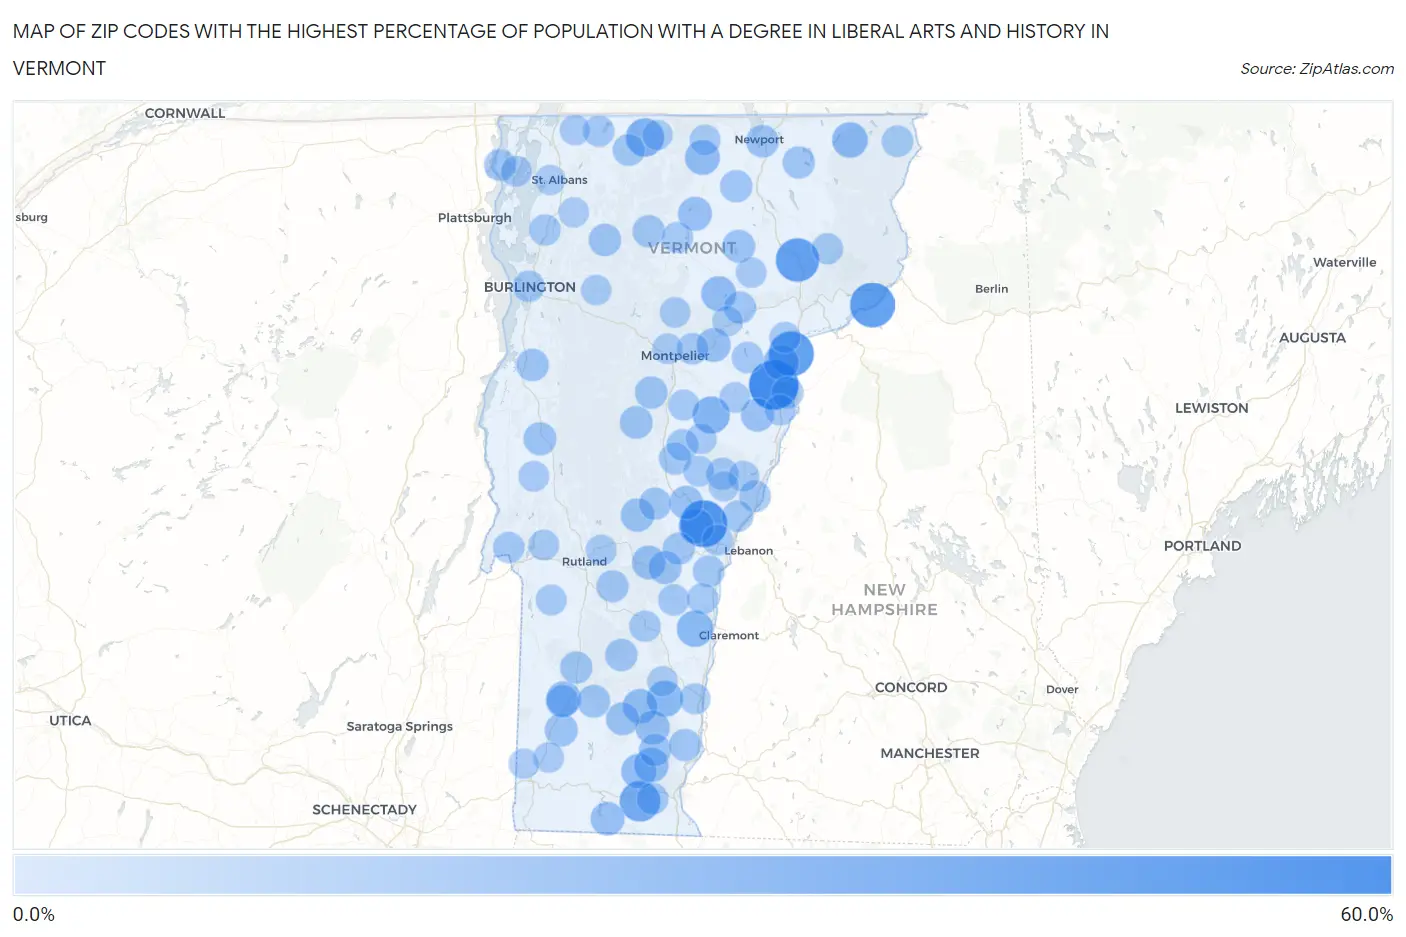
Map of Zip Codes with the Highest Percentage of Population with a Degree in Liberal Arts and History in Vermont
0.0%
60.0%
Zip Codes with the Highest Percentage of Population with a Degree in Liberal Arts and History in Vermont
| Zip Code | % Graduates | vs State | vs National | |
| 1. | 05069 | 54.4% | 7.2%(+47.1)#1 | 4.9%(+49.5)#124 |
| 2. | 05084 | 47.9% | 7.2%(+40.7)#2 | 4.9%(+43.0)#184 |
| 3. | 05050 | 43.5% | 7.2%(+36.2)#3 | 4.9%(+38.6)#214 |
| 4. | 05904 | 42.5% | 7.2%(+35.3)#4 | 4.9%(+37.6)#227 |
| 5. | 05850 | 39.2% | 7.2%(+31.9)#5 | 4.9%(+34.3)#256 |
| 6. | 05344 | 32.4% | 7.2%(+25.1)#6 | 4.9%(+27.5)#372 |
| 7. | 05447 | 26.3% | 7.2%(+19.1)#7 | 4.9%(+21.4)#525 |
| 8. | 05675 | 23.7% | 7.2%(+16.5)#8 | 4.9%(+18.8)#643 |
| 9. | 05151 | 21.6% | 7.2%(+14.4)#9 | 4.9%(+16.8)#757 |
| 10. | 05146 | 21.2% | 7.2%(+13.9)#10 | 4.9%(+16.3)#790 |
| 11. | 05907 | 20.0% | 7.2%(+12.8)#11 | 4.9%(+15.1)#868 |
| 12. | 05042 | 19.6% | 7.2%(+12.4)#12 | 4.9%(+14.7)#891 |
| 13. | 05053 | 18.7% | 7.2%(+11.5)#13 | 4.9%(+13.8)#961 |
| 14. | 05681 | 18.5% | 7.2%(+11.3)#14 | 4.9%(+13.6)#977 |
| 15. | 05874 | 18.2% | 7.2%(+11.0)#15 | 4.9%(+13.4)#1,000 |
| 16. | 05351 | 18.2% | 7.2%(+10.9)#16 | 4.9%(+13.3)#1,014 |
| 17. | 05362 | 17.9% | 7.2%(+10.7)#17 | 4.9%(+13.1)#1,041 |
| 18. | 05255 | 17.9% | 7.2%(+10.6)#18 | 4.9%(+13.0)#1,050 |
| 19. | 05359 | 17.5% | 7.2%(+10.2)#19 | 4.9%(+12.6)#1,085 |
| 20. | 05353 | 16.6% | 7.2%(+9.35)#20 | 4.9%(+11.7)#1,183 |
| 21. | 05667 | 16.0% | 7.2%(+8.80)#21 | 4.9%(+11.2)#1,256 |
| 22. | 05653 | 15.9% | 7.2%(+8.68)#22 | 4.9%(+11.0)#1,272 |
| 23. | 05035 | 15.6% | 7.2%(+8.35)#23 | 4.9%(+10.7)#1,317 |
| 24. | 05361 | 15.4% | 7.2%(+8.21)#24 | 4.9%(+10.6)#1,334 |
| 25. | 05068 | 15.1% | 7.2%(+7.86)#25 | 4.9%(+10.2)#1,406 |
| 26. | 05772 | 14.7% | 7.2%(+7.51)#26 | 4.9%(+9.87)#1,473 |
| 27. | 05040 | 14.4% | 7.2%(+7.14)#27 | 4.9%(+9.50)#1,541 |
| 28. | 05034 | 14.0% | 7.2%(+6.80)#28 | 4.9%(+9.16)#1,631 |
| 29. | 05753 | 13.9% | 7.2%(+6.71)#29 | 4.9%(+9.07)#1,654 |
| 30. | 05343 | 13.8% | 7.2%(+6.60)#30 | 4.9%(+8.96)#1,674 |
| 31. | 05252 | 13.7% | 7.2%(+6.48)#31 | 4.9%(+8.84)#1,709 |
| 32. | 05841 | 13.4% | 7.2%(+6.20)#32 | 4.9%(+8.56)#1,793 |
| 33. | 05254 | 13.3% | 7.2%(+6.07)#33 | 4.9%(+8.43)#1,830 |
| 34. | 05669 | 13.3% | 7.2%(+6.04)#34 | 4.9%(+8.40)#1,835 |
| 35. | 05340 | 13.1% | 7.2%(+5.86)#35 | 4.9%(+8.22)#1,880 |
| 36. | 05855 | 12.9% | 7.2%(+5.65)#36 | 4.9%(+8.02)#1,942 |
| 37. | 05663 | 12.7% | 7.2%(+5.50)#37 | 4.9%(+7.86)#1,975 |
| 38. | 05473 | 12.5% | 7.2%(+5.27)#38 | 4.9%(+7.63)#2,038 |
| 39. | 05444 | 12.5% | 7.2%(+5.24)#39 | 4.9%(+7.60)#2,058 |
| 40. | 05872 | 12.4% | 7.2%(+5.15)#40 | 4.9%(+7.51)#2,087 |
| 41. | 05656 | 12.4% | 7.2%(+5.12)#41 | 4.9%(+7.48)#2,096 |
| 42. | 05161 | 12.3% | 7.2%(+5.08)#42 | 4.9%(+7.44)#2,104 |
| 43. | 05253 | 12.2% | 7.2%(+4.98)#43 | 4.9%(+7.34)#2,132 |
| 44. | 05845 | 12.2% | 7.2%(+4.93)#44 | 4.9%(+7.29)#2,150 |
| 45. | 05032 | 12.1% | 7.2%(+4.89)#45 | 4.9%(+7.25)#2,161 |
| 46. | 05345 | 12.1% | 7.2%(+4.88)#46 | 4.9%(+7.24)#2,173 |
| 47. | 05091 | 11.9% | 7.2%(+4.71)#47 | 4.9%(+7.07)#2,223 |
| 48. | 05346 | 11.7% | 7.2%(+4.49)#48 | 4.9%(+6.85)#2,289 |
| 49. | 05738 | 11.5% | 7.2%(+4.29)#49 | 4.9%(+6.65)#2,354 |
| 50. | 05647 | 11.5% | 7.2%(+4.27)#50 | 4.9%(+6.63)#2,359 |
| 51. | 05081 | 11.3% | 7.2%(+4.11)#51 | 4.9%(+6.47)#2,427 |
| 52. | 05061 | 11.3% | 7.2%(+4.06)#52 | 4.9%(+6.42)#2,436 |
| 53. | 05072 | 11.3% | 7.2%(+4.06)#53 | 4.9%(+6.42)#2,442 |
| 54. | 05450 | 11.2% | 7.2%(+4.00)#54 | 4.9%(+6.36)#2,459 |
| 55. | 05463 | 10.8% | 7.2%(+3.60)#55 | 4.9%(+5.96)#2,630 |
| 56. | 05301 | 10.8% | 7.2%(+3.53)#56 | 4.9%(+5.89)#2,660 |
| 57. | 05041 | 10.7% | 7.2%(+3.48)#57 | 4.9%(+5.84)#2,690 |
| 58. | 05401 | 10.6% | 7.2%(+3.38)#58 | 4.9%(+5.74)#2,752 |
| 59. | 05043 | 10.6% | 7.2%(+3.37)#59 | 4.9%(+5.73)#2,761 |
| 60. | 05048 | 10.6% | 7.2%(+3.32)#60 | 4.9%(+5.68)#2,790 |
| 61. | 05903 | 10.3% | 7.2%(+3.06)#61 | 4.9%(+5.42)#2,934 |
| 62. | 05651 | 10.2% | 7.2%(+2.93)#62 | 4.9%(+5.29)#3,018 |
| 63. | 05046 | 10.0% | 7.2%(+2.77)#63 | 4.9%(+5.13)#3,107 |
| 64. | 05149 | 9.8% | 7.2%(+2.60)#64 | 4.9%(+4.96)#3,218 |
| 65. | 05468 | 9.8% | 7.2%(+2.57)#65 | 4.9%(+4.93)#3,239 |
| 66. | 05062 | 9.7% | 7.2%(+2.50)#66 | 4.9%(+4.86)#3,283 |
| 67. | 05743 | 9.7% | 7.2%(+2.44)#67 | 4.9%(+4.80)#3,325 |
| 68. | 05457 | 9.6% | 7.2%(+2.40)#68 | 4.9%(+4.76)#3,346 |
| 69. | 05055 | 9.6% | 7.2%(+2.39)#69 | 4.9%(+4.75)#3,357 |
| 70. | 05832 | 9.5% | 7.2%(+2.28)#70 | 4.9%(+4.64)#3,451 |
| 71. | 05655 | 9.5% | 7.2%(+2.25)#71 | 4.9%(+4.61)#3,466 |
| 72. | 05821 | 9.4% | 7.2%(+2.12)#72 | 4.9%(+4.48)#3,552 |
| 73. | 05089 | 9.3% | 7.2%(+2.09)#73 | 4.9%(+4.45)#3,582 |
| 74. | 05101 | 9.1% | 7.2%(+1.83)#74 | 4.9%(+4.19)#3,794 |
| 75. | 05679 | 8.8% | 7.2%(+1.60)#75 | 4.9%(+3.96)#3,997 |
| 76. | 05001 | 8.8% | 7.2%(+1.53)#76 | 4.9%(+3.89)#4,069 |
| 77. | 05757 | 8.7% | 7.2%(+1.48)#77 | 4.9%(+3.84)#4,111 |
| 78. | 05077 | 8.7% | 7.2%(+1.42)#78 | 4.9%(+3.78)#4,170 |
| 79. | 05701 | 8.6% | 7.2%(+1.36)#79 | 4.9%(+3.72)#4,242 |
| 80. | 05058 | 8.6% | 7.2%(+1.34)#80 | 4.9%(+3.70)#4,275 |
| 81. | 05474 | 8.5% | 7.2%(+1.27)#81 | 4.9%(+3.63)#4,334 |
| 82. | 05051 | 8.5% | 7.2%(+1.23)#82 | 4.9%(+3.59)#4,367 |
| 83. | 05859 | 8.4% | 7.2%(+1.14)#83 | 4.9%(+3.50)#4,469 |
| 84. | 05086 | 8.3% | 7.2%(+1.10)#84 | 4.9%(+3.46)#4,521 |
| 85. | 05038 | 8.3% | 7.2%(+1.08)#85 | 4.9%(+3.44)#4,545 |
| 86. | 05735 | 8.2% | 7.2%(+0.973)#86 | 4.9%(+3.33)#4,653 |
| 87. | 05778 | 8.2% | 7.2%(+0.957)#87 | 4.9%(+3.32)#4,679 |
| 88. | 05836 | 8.2% | 7.2%(+0.919)#88 | 4.9%(+3.28)#4,720 |
| 89. | 05602 | 8.0% | 7.2%(+0.797)#89 | 4.9%(+3.16)#4,864 |
| 90. | 05682 | 8.0% | 7.2%(+0.776)#90 | 4.9%(+3.14)#4,883 |
| 91. | 05262 | 7.9% | 7.2%(+0.662)#91 | 4.9%(+3.02)#5,040 |
| 92. | 05465 | 7.9% | 7.2%(+0.650)#92 | 4.9%(+3.01)#5,057 |
| 93. | 05459 | 7.7% | 7.2%(+0.459)#93 | 4.9%(+2.82)#5,315 |
| 94. | 05658 | 7.6% | 7.2%(+0.349)#94 | 4.9%(+2.71)#5,466 |
| 95. | 05143 | 7.5% | 7.2%(+0.310)#95 | 4.9%(+2.67)#5,527 |
| 96. | 05454 | 7.5% | 7.2%(+0.302)#96 | 4.9%(+2.66)#5,534 |
| 97. | 05257 | 7.3% | 7.2%(+0.107)#97 | 4.9%(+2.47)#5,814 |
| 98. | 05478 | 7.2% | 7.2%(+0.015)#98 | 4.9%(+2.38)#5,965 |
| 99. | 05476 | 7.2% | 7.2%(-0.017)#99 | 4.9%(+2.34)#6,019 |
| 100. | 05070 | 7.2% | 7.2%(-0.022)#100 | 4.9%(+2.34)#6,030 |
Common Questions
What are the Top 10 Zip Codes with the Highest Percentage of Population with a Degree in Liberal Arts and History in Vermont?
Top 10 Zip Codes with the Highest Percentage of Population with a Degree in Liberal Arts and History in Vermont are:
What zip code has the Highest Percentage of Population with a Degree in Liberal Arts and History in Vermont?
05069 has the Highest Percentage of Population with a Degree in Liberal Arts and History in Vermont with 54.4%.
What is the Percentage of Population with a Degree in Liberal Arts and History in the State of Vermont?
Percentage of Population with a Degree in Liberal Arts and History in Vermont is 7.2%.
What is the Percentage of Population with a Degree in Liberal Arts and History in the United States?
Percentage of Population with a Degree in Liberal Arts and History in the United States is 4.9%.