Zip Codes with the Highest Percentage of Population Employed in Installation, Maintenance & Repair in Burlington, VT
RELATED REPORTS & OPTIONS
Installation, Maintenance & Repair
Burlington
Compare Zip Codes
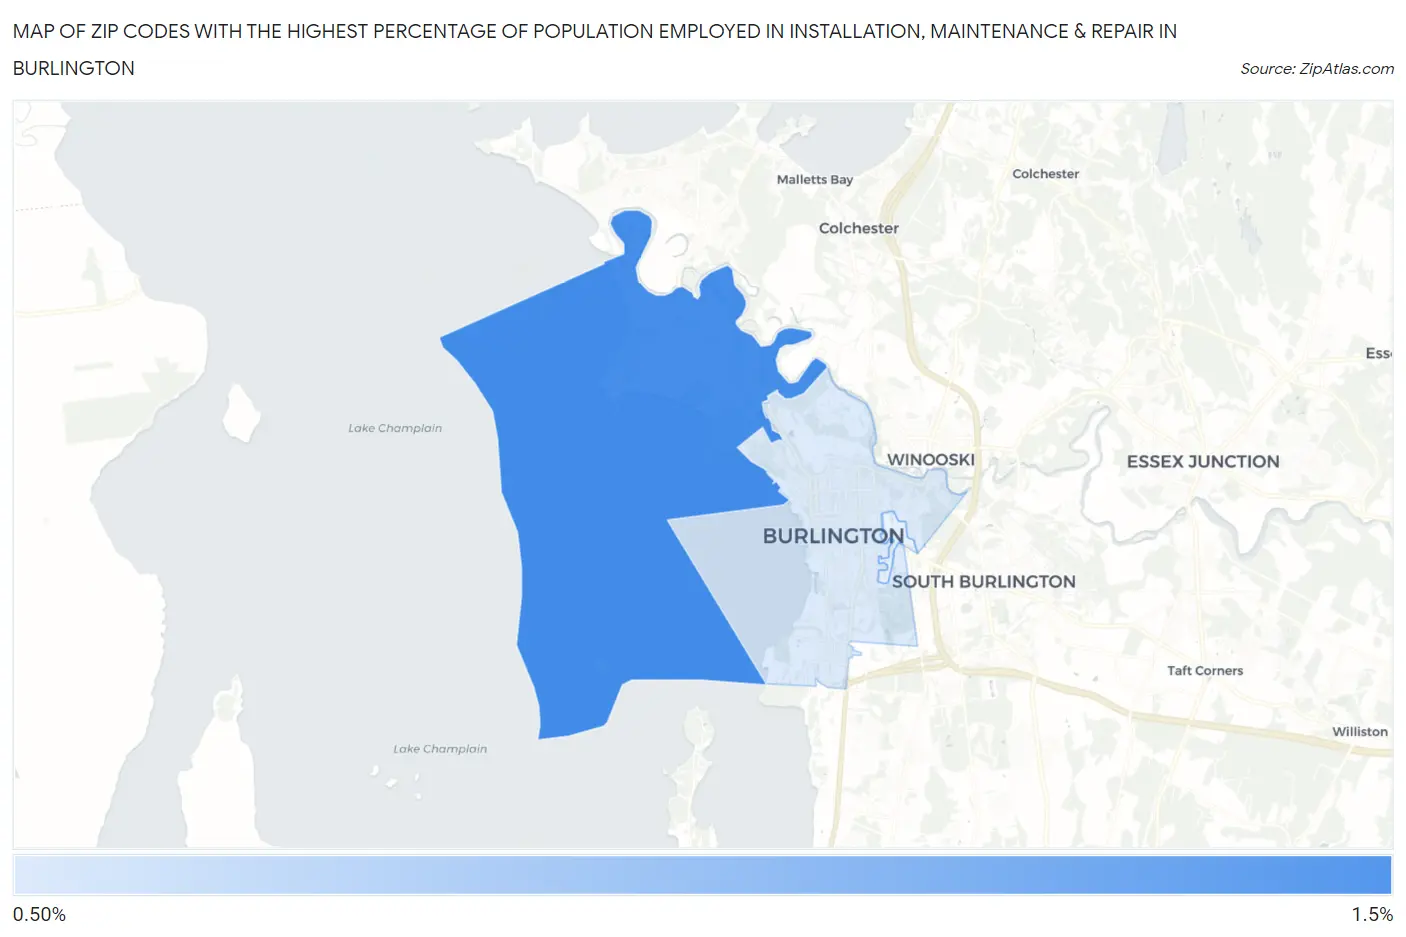
Map of Zip Codes with the Highest Percentage of Population Employed in Installation, Maintenance & Repair in Burlington
1.1%
1.4%
Zip Codes with the Highest Percentage of Population Employed in Installation, Maintenance & Repair in Burlington, VT
| Zip Code | % Employed | vs State | vs National | |
| 1. | 05408 | 1.4% | 3.2%(-1.74)#175 | 3.1%(-1.62)#24,394 |
| 2. | 05401 | 1.1% | 3.2%(-2.08)#188 | 3.1%(-1.97)#25,594 |
1
Common Questions
What are the Top Zip Codes with the Highest Percentage of Population Employed in Installation, Maintenance & Repair in Burlington, VT?
Top Zip Codes with the Highest Percentage of Population Employed in Installation, Maintenance & Repair in Burlington, VT are:
What zip code has the Highest Percentage of Population Employed in Installation, Maintenance & Repair in Burlington, VT?
05408 has the Highest Percentage of Population Employed in Installation, Maintenance & Repair in Burlington, VT with 1.4%.
What is the Percentage of Population Employed in Installation, Maintenance & Repair in Burlington, VT?
Percentage of Population Employed in Installation, Maintenance & Repair in Burlington is 1.1%.
What is the Percentage of Population Employed in Installation, Maintenance & Repair in Vermont?
Percentage of Population Employed in Installation, Maintenance & Repair in Vermont is 3.2%.
What is the Percentage of Population Employed in Installation, Maintenance & Repair in the United States?
Percentage of Population Employed in Installation, Maintenance & Repair in the United States is 3.1%.