Jefferson, SD Map & Demographics
Jefferson Map
Jefferson Overview
$32,058
PER CAPITA INCOME
$78,108
AVG FAMILY INCOME
$77,601
AVG HOUSEHOLD INCOME
33.5%
WAGE / INCOME GAP [ % ]
66.5¢/ $1
WAGE / INCOME GAP [ $ ]
0.34
INEQUALITY / GINI INDEX
631
TOTAL POPULATION
305
MALE POPULATION
326
FEMALE POPULATION
93.56
MALES / 100 FEMALES
106.89
FEMALES / 100 MALES
37.1
MEDIAN AGE
2.7
AVG FAMILY SIZE
2.2
AVG HOUSEHOLD SIZE
352
LABOR FORCE [ PEOPLE ]
72.4%
PERCENT IN LABOR FORCE
12.8%
UNEMPLOYMENT RATE
Jefferson Zip Codes
Jefferson Area Codes
Income in Jefferson
Income Overview in Jefferson
Per Capita Income in Jefferson is $32,058, while median incomes of families and households are $78,108 and $77,601 respectively.
| Characteristic | Number | Measure |
| Per Capita Income | 631 | $32,058 |
| Median Family Income | 184 | $78,108 |
| Mean Family Income | 184 | $80,642 |
| Median Household Income | 281 | $77,601 |
| Mean Household Income | 281 | $75,114 |
| Income Deficit | 184 | $0 |
| Wage / Income Gap (%) | 631 | 33.46% |
| Wage / Income Gap ($) | 631 | 66.54¢ per $1 |
| Gini / Inequality Index | 631 | 0.34 |
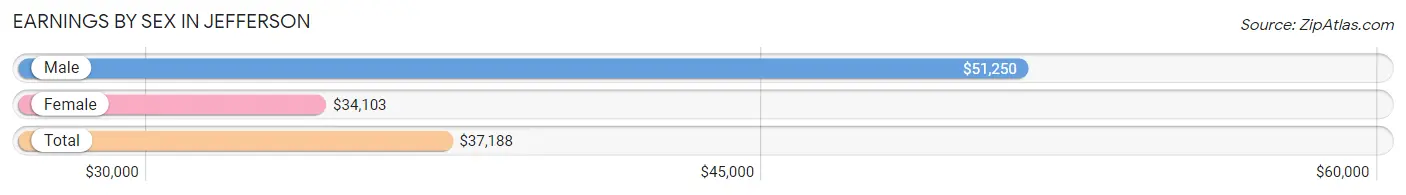
Earnings by Sex in Jefferson
Average Earnings in Jefferson are $37,188, $51,250 for men and $34,103 for women, a difference of 33.5%.
| Sex | Number | Average Earnings |
| Male | 172 (47.9%) | $51,250 |
| Female | 187 (52.1%) | $34,103 |
| Total | 359 (100.0%) | $37,188 |
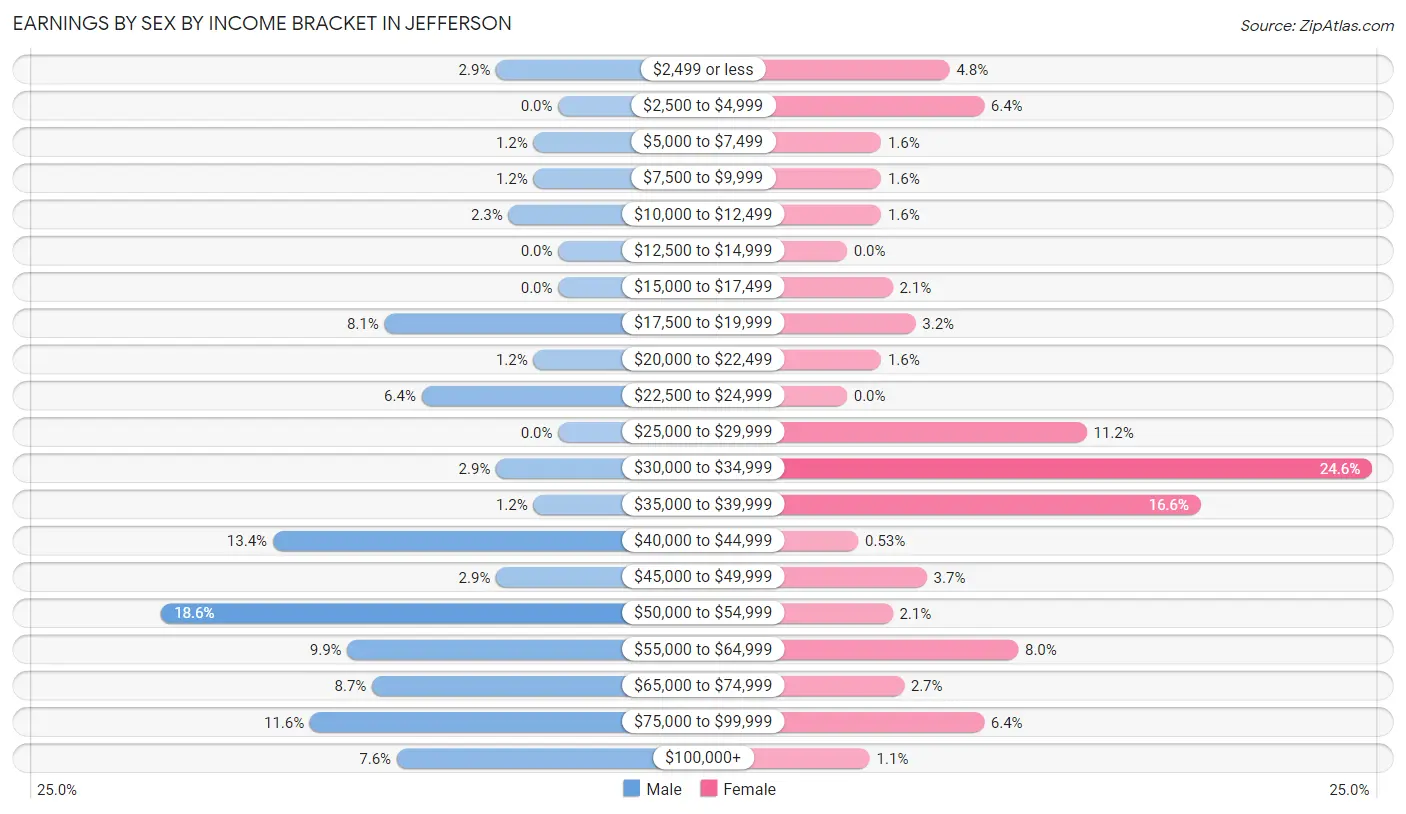
Earnings by Sex by Income Bracket in Jefferson
The most common earnings brackets in Jefferson are $50,000 to $54,999 for men (32 | 18.6%) and $30,000 to $34,999 for women (46 | 24.6%).
| Income | Male | Female |
| $2,499 or less | 5 (2.9%) | 9 (4.8%) |
| $2,500 to $4,999 | 0 (0.0%) | 12 (6.4%) |
| $5,000 to $7,499 | 2 (1.2%) | 3 (1.6%) |
| $7,500 to $9,999 | 2 (1.2%) | 3 (1.6%) |
| $10,000 to $12,499 | 4 (2.3%) | 3 (1.6%) |
| $12,500 to $14,999 | 0 (0.0%) | 0 (0.0%) |
| $15,000 to $17,499 | 0 (0.0%) | 4 (2.1%) |
| $17,500 to $19,999 | 14 (8.1%) | 6 (3.2%) |
| $20,000 to $22,499 | 2 (1.2%) | 3 (1.6%) |
| $22,500 to $24,999 | 11 (6.4%) | 0 (0.0%) |
| $25,000 to $29,999 | 0 (0.0%) | 21 (11.2%) |
| $30,000 to $34,999 | 5 (2.9%) | 46 (24.6%) |
| $35,000 to $39,999 | 2 (1.2%) | 31 (16.6%) |
| $40,000 to $44,999 | 23 (13.4%) | 1 (0.5%) |
| $45,000 to $49,999 | 5 (2.9%) | 7 (3.7%) |
| $50,000 to $54,999 | 32 (18.6%) | 4 (2.1%) |
| $55,000 to $64,999 | 17 (9.9%) | 15 (8.0%) |
| $65,000 to $74,999 | 15 (8.7%) | 5 (2.7%) |
| $75,000 to $99,999 | 20 (11.6%) | 12 (6.4%) |
| $100,000+ | 13 (7.6%) | 2 (1.1%) |
| Total | 172 (100.0%) | 187 (100.0%) |
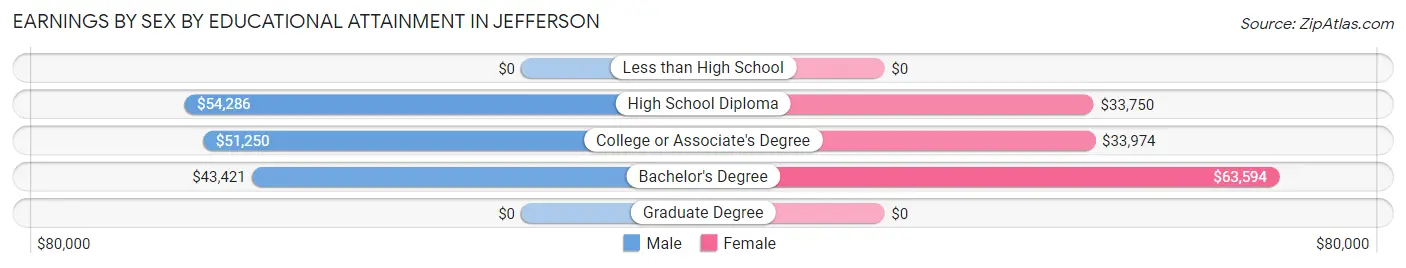
Earnings by Sex by Educational Attainment in Jefferson
Average earnings in Jefferson are $50,739 for men and $34,565 for women, a difference of 31.9%. Men with an educational attainment of high school diploma enjoy the highest average annual earnings of $54,286, while those with bachelor's degree education earn the least with $43,421. Women with an educational attainment of bachelor's degree earn the most with the average annual earnings of $63,594, while those with high school diploma education have the smallest earnings of $33,750.
| Educational Attainment | Male Income | Female Income |
| Less than High School | - | - |
| High School Diploma | $54,286 | $33,750 |
| College or Associate's Degree | $51,250 | $33,974 |
| Bachelor's Degree | $43,421 | $63,594 |
| Graduate Degree | - | - |
| Total | $50,739 | $34,565 |
Family Income in Jefferson
Family Income Brackets in Jefferson
According to the Jefferson family income data, there are 67 families falling into the $75,000 to $99,999 income range, which is the most common income bracket and makes up 36.4% of all families.
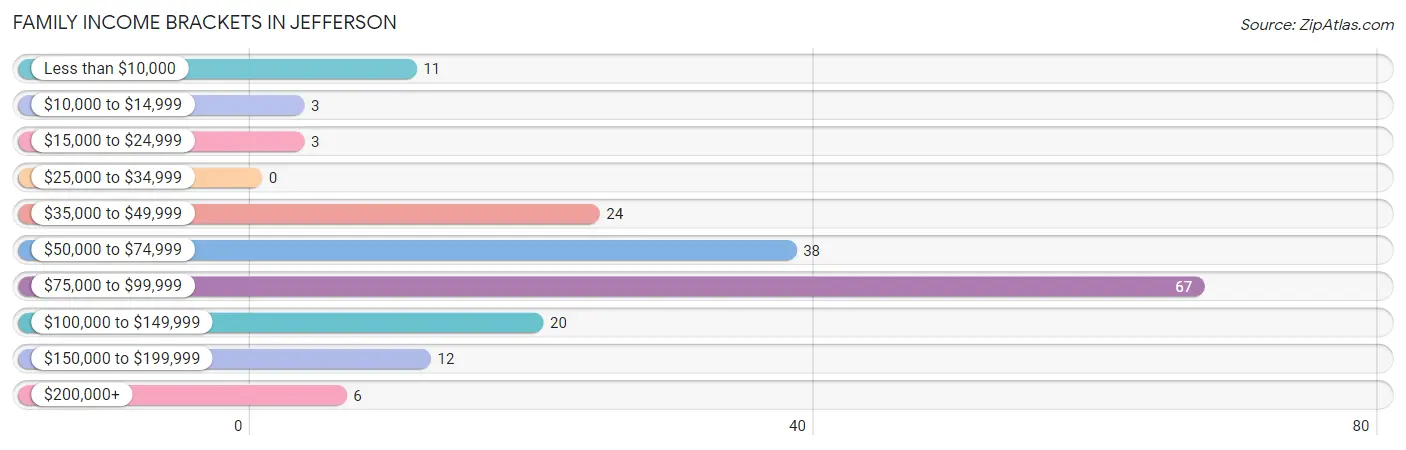
| Income Bracket | # Families | % Families |
| Less than $10,000 | 11 | 6.0% |
| $10,000 to $14,999 | 3 | 1.6% |
| $15,000 to $24,999 | 3 | 1.6% |
| $25,000 to $34,999 | 0 | 0.0% |
| $35,000 to $49,999 | 24 | 13.0% |
| $50,000 to $74,999 | 38 | 20.7% |
| $75,000 to $99,999 | 67 | 36.4% |
| $100,000 to $149,999 | 20 | 10.9% |
| $150,000 to $199,999 | 12 | 6.5% |
| $200,000+ | 6 | 3.3% |
Family Income by Famaliy Size in Jefferson
4-person families (27 | 14.7%) account for the highest median family income in Jefferson with $87,083 per family, while 2-person families (112 | 60.9%) have the highest median income of $38,125 per family member.
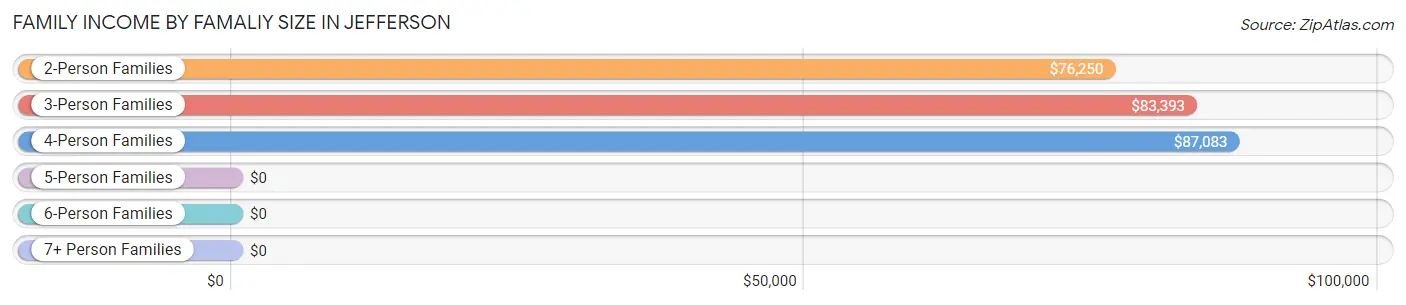
| Income Bracket | # Families | Median Income |
| 2-Person Families | 112 (60.9%) | $76,250 |
| 3-Person Families | 32 (17.4%) | $83,393 |
| 4-Person Families | 27 (14.7%) | $87,083 |
| 5-Person Families | 5 (2.7%) | $0 |
| 6-Person Families | 2 (1.1%) | $0 |
| 7+ Person Families | 6 (3.3%) | $0 |
| Total | 184 (100.0%) | $78,108 |
Family Income by Number of Earners in Jefferson
The median family income in Jefferson is $78,108, with families comprising 3+ earners (11) having the highest median family income of $250,001, while families with no earners (28) have the lowest median family income of $43,500, accounting for 6.0% and 15.2% of families, respectively.
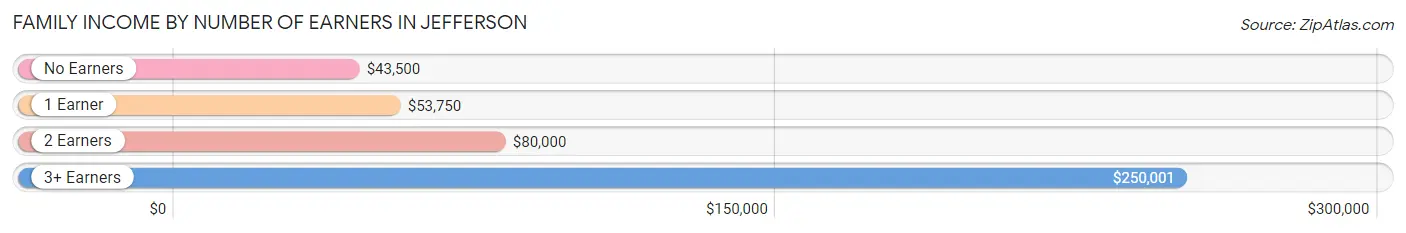
| Number of Earners | # Families | Median Income |
| No Earners | 28 (15.2%) | $43,500 |
| 1 Earner | 51 (27.7%) | $53,750 |
| 2 Earners | 94 (51.1%) | $80,000 |
| 3+ Earners | 11 (6.0%) | $250,001 |
| Total | 184 (100.0%) | $78,108 |
Household Income in Jefferson
Household Income Brackets in Jefferson
With 75 households falling in the category, the $75,000 to $99,999 income range is the most frequent in Jefferson, accounting for 26.7% of all households. In contrast, only 2 households (0.7%) fall into the $25,000 to $34,999 income bracket, making it the least populous group.
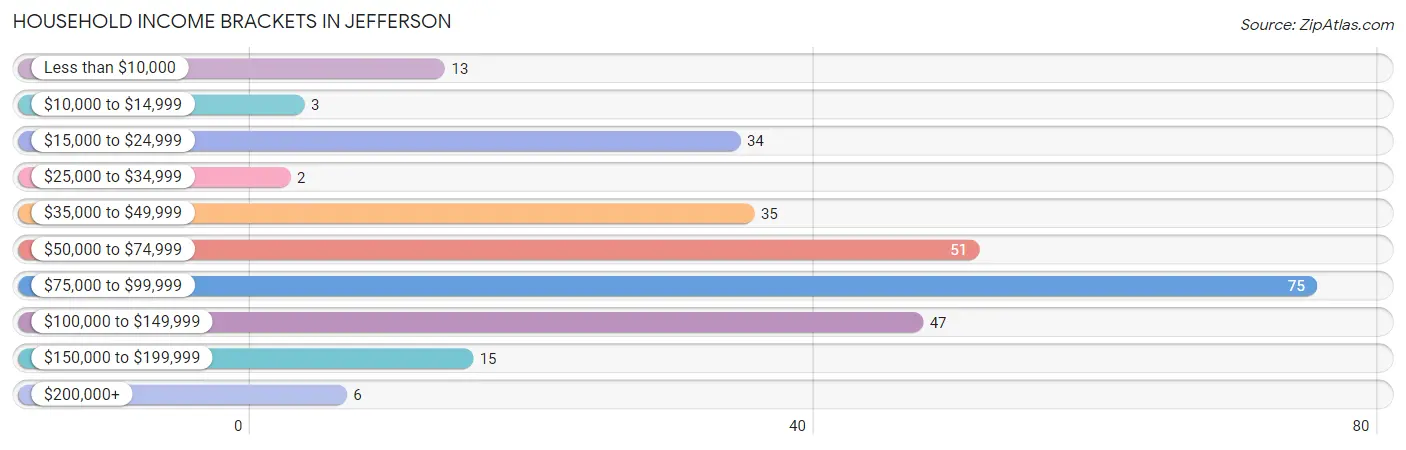
| Income Bracket | # Households | % Households |
| Less than $10,000 | 13 | 4.6% |
| $10,000 to $14,999 | 3 | 1.1% |
| $15,000 to $24,999 | 34 | 12.1% |
| $25,000 to $34,999 | 2 | 0.7% |
| $35,000 to $49,999 | 35 | 12.5% |
| $50,000 to $74,999 | 51 | 18.1% |
| $75,000 to $99,999 | 75 | 26.7% |
| $100,000 to $149,999 | 47 | 16.7% |
| $150,000 to $199,999 | 15 | 5.3% |
| $200,000+ | 6 | 2.1% |
Household Income by Householder Age in Jefferson
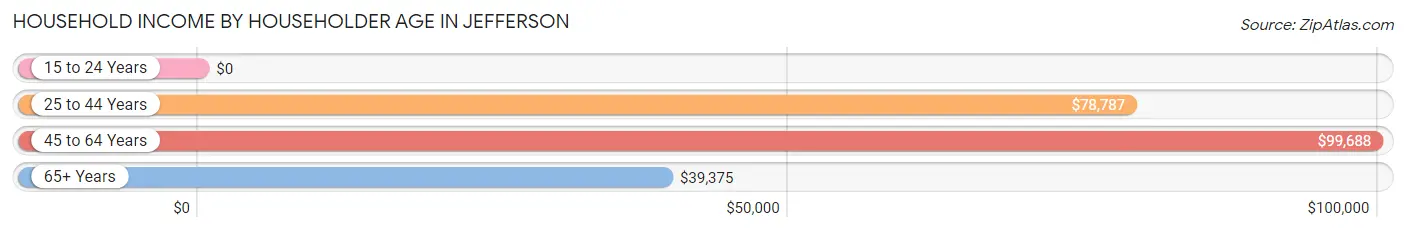
The median household income in Jefferson is $77,601, with the highest median household income of $99,688 found in the 45 to 64 years age bracket for the primary householder. A total of 89 households (31.7%) fall into this category.
| Income Bracket | # Households | Median Income |
| 15 to 24 Years | 0 (0.0%) | $0 |
| 25 to 44 Years | 127 (45.2%) | $78,787 |
| 45 to 64 Years | 89 (31.7%) | $99,688 |
| 65+ Years | 65 (23.1%) | $39,375 |
| Total | 281 (100.0%) | $77,601 |
Poverty in Jefferson
Income Below Poverty by Sex and Age in Jefferson
With 3.3% poverty level for males and 11.7% for females among the residents of Jefferson, 6 to 11 year old males and 16 and 17 year old females are the most vulnerable to poverty, with 3 males (14.3%) and 9 females (100.0%) in their respective age groups living below the poverty level.
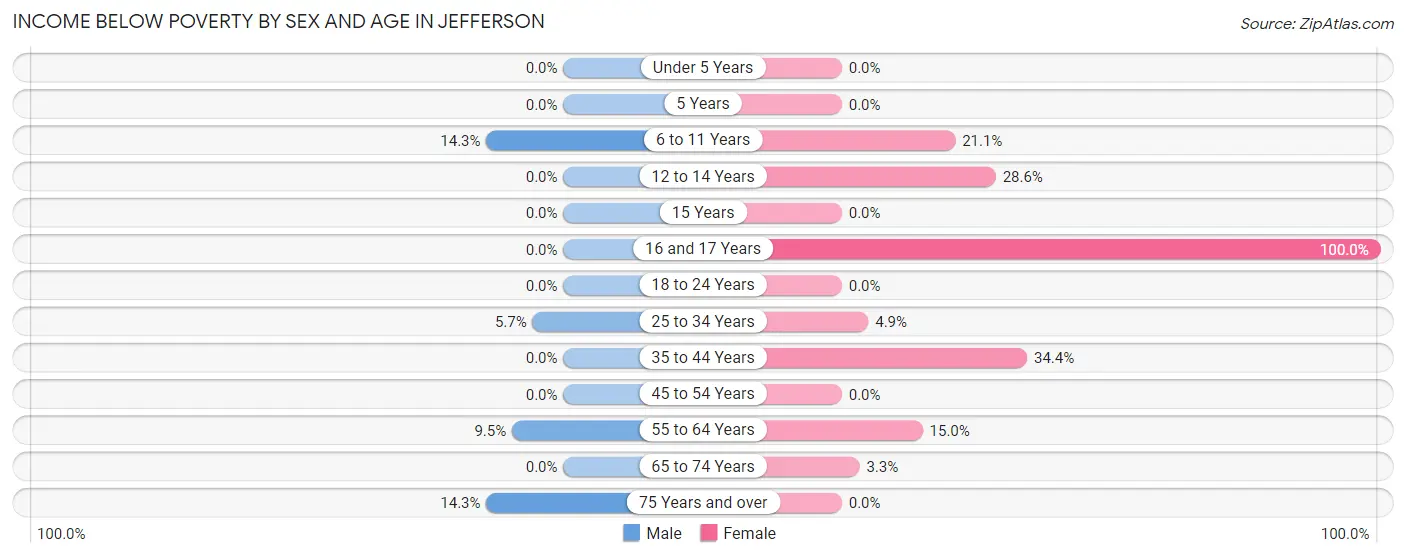
| Age Bracket | Male | Female |
| Under 5 Years | 0 (0.0%) | 0 (0.0%) |
| 5 Years | 0 (0.0%) | 0 (0.0%) |
| 6 to 11 Years | 3 (14.3%) | 4 (21.0%) |
| 12 to 14 Years | 0 (0.0%) | 6 (28.6%) |
| 15 Years | 0 (0.0%) | 0 (0.0%) |
| 16 and 17 Years | 0 (0.0%) | 9 (100.0%) |
| 18 to 24 Years | 0 (0.0%) | 0 (0.0%) |
| 25 to 34 Years | 4 (5.7%) | 3 (4.9%) |
| 35 to 44 Years | 0 (0.0%) | 11 (34.4%) |
| 45 to 54 Years | 0 (0.0%) | 0 (0.0%) |
| 55 to 64 Years | 2 (9.5%) | 3 (15.0%) |
| 65 to 74 Years | 0 (0.0%) | 2 (3.3%) |
| 75 Years and over | 1 (14.3%) | 0 (0.0%) |
| Total | 10 (3.3%) | 38 (11.7%) |
Income Above Poverty by Sex and Age in Jefferson
According to the poverty statistics in Jefferson, males aged under 5 years and females aged under 5 years are the age groups that are most secure financially, with 100.0% of males and 100.0% of females in these age groups living above the poverty line.
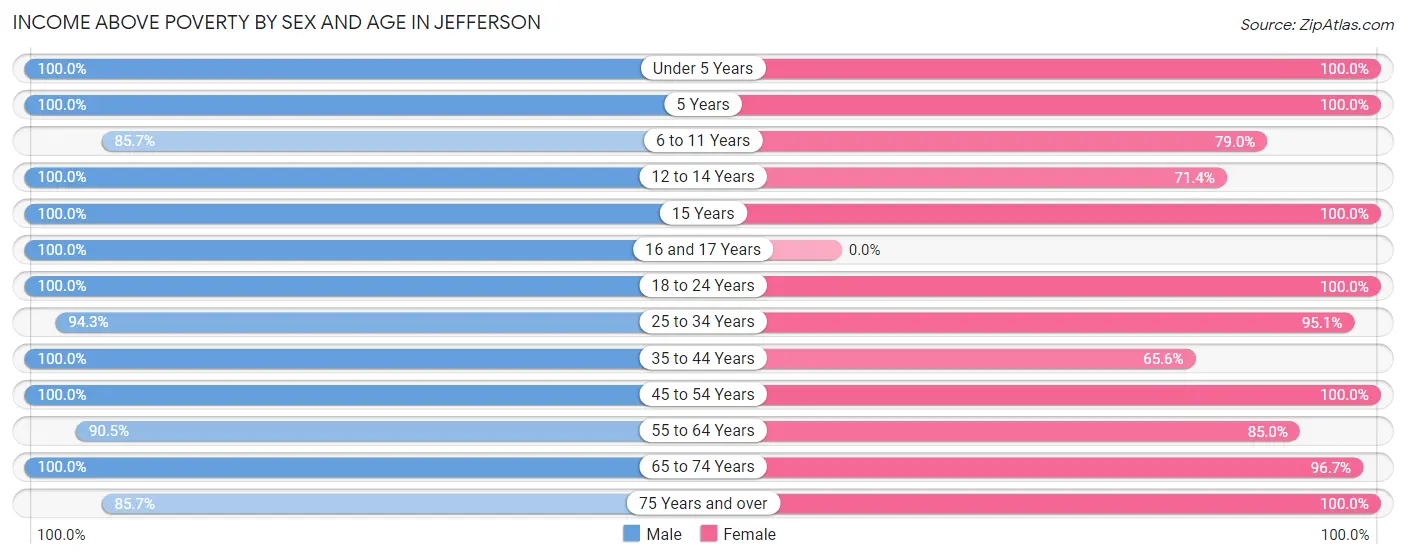
| Age Bracket | Male | Female |
| Under 5 Years | 2 (100.0%) | 13 (100.0%) |
| 5 Years | 8 (100.0%) | 3 (100.0%) |
| 6 to 11 Years | 18 (85.7%) | 15 (78.9%) |
| 12 to 14 Years | 13 (100.0%) | 15 (71.4%) |
| 15 Years | 35 (100.0%) | 10 (100.0%) |
| 16 and 17 Years | 5 (100.0%) | 0 (0.0%) |
| 18 to 24 Years | 9 (100.0%) | 8 (100.0%) |
| 25 to 34 Years | 66 (94.3%) | 58 (95.1%) |
| 35 to 44 Years | 40 (100.0%) | 21 (65.6%) |
| 45 to 54 Years | 41 (100.0%) | 63 (100.0%) |
| 55 to 64 Years | 19 (90.5%) | 17 (85.0%) |
| 65 to 74 Years | 33 (100.0%) | 59 (96.7%) |
| 75 Years and over | 6 (85.7%) | 6 (100.0%) |
| Total | 295 (96.7%) | 288 (88.3%) |
Income Below Poverty Among Married-Couple Families in Jefferson
The poverty statistics for married-couple families in Jefferson show that 2.2% or 3 of the total 136 families live below the poverty line. Families with 1 or 2 children have the highest poverty rate of 6.8%, comprising of 3 families. On the other hand, families with no children have the lowest poverty rate of 0.0%, which includes 0 families.
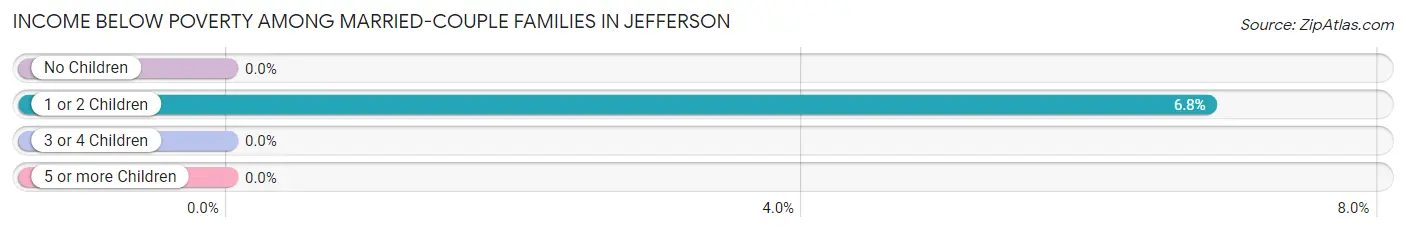
| Children | Above Poverty | Below Poverty |
| No Children | 92 (100.0%) | 0 (0.0%) |
| 1 or 2 Children | 41 (93.2%) | 3 (6.8%) |
| 3 or 4 Children | 0 (0.0%) | 0 (0.0%) |
| 5 or more Children | 0 (0.0%) | 0 (0.0%) |
| Total | 133 (97.8%) | 3 (2.2%) |
Income Below Poverty Among Single-Parent Households in Jefferson
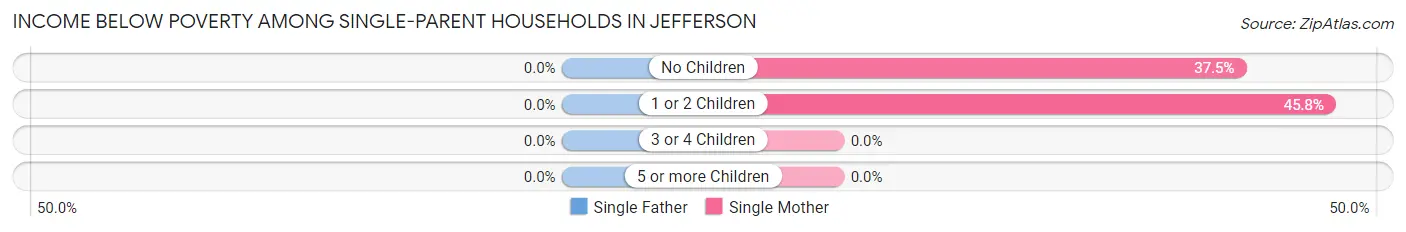
| Children | Single Father | Single Mother |
| No Children | 0 (0.0%) | 3 (37.5%) |
| 1 or 2 Children | 0 (0.0%) | 11 (45.8%) |
| 3 or 4 Children | 0 (0.0%) | 0 (0.0%) |
| 5 or more Children | 0 (0.0%) | 0 (0.0%) |
| Total | 0 (0.0%) | 14 (43.8%) |
Income Below Poverty Among Married-Couple vs Single-Parent Households in Jefferson
The poverty data for Jefferson shows that 3 of the married-couple family households (2.2%) and 14 of the single-parent households (29.2%) are living below the poverty level. Within the married-couple family households, those with 1 or 2 children have the highest poverty rate, with 3 households (6.8%) falling below the poverty line. Among the single-parent households, those with 1 or 2 children have the highest poverty rate, with 11 household (40.7%) living below poverty.
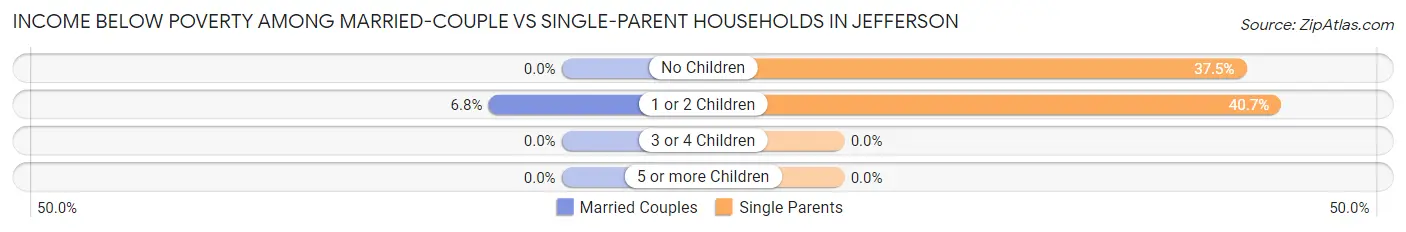
| Children | Married-Couple Families | Single-Parent Households |
| No Children | 0 (0.0%) | 3 (37.5%) |
| 1 or 2 Children | 3 (6.8%) | 11 (40.7%) |
| 3 or 4 Children | 0 (0.0%) | 0 (0.0%) |
| 5 or more Children | 0 (0.0%) | 0 (0.0%) |
| Total | 3 (2.2%) | 14 (29.2%) |
Race in Jefferson
The most populous races in Jefferson are White / Caucasian (580 | 91.9%), Hispanic or Latino (26 | 4.1%), and Native / Alaskan (23 | 3.6%).
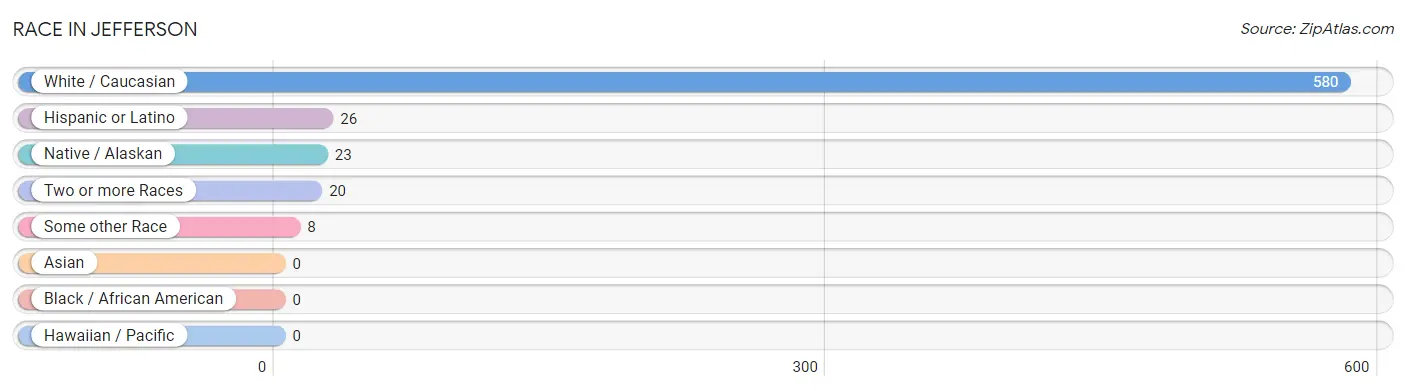
| Race | # Population | % Population |
| Asian | 0 | 0.0% |
| Black / African American | 0 | 0.0% |
| Hawaiian / Pacific | 0 | 0.0% |
| Hispanic or Latino | 26 | 4.1% |
| Native / Alaskan | 23 | 3.6% |
| White / Caucasian | 580 | 91.9% |
| Two or more Races | 20 | 3.2% |
| Some other Race | 8 | 1.3% |
| Total | 631 | 100.0% |
Ancestry in Jefferson
The most populous ancestries reported in Jefferson are German (165 | 26.2%), American (70 | 11.1%), Irish (56 | 8.9%), French (51 | 8.1%), and French Canadian (45 | 7.1%), together accounting for 61.3% of all Jefferson residents.
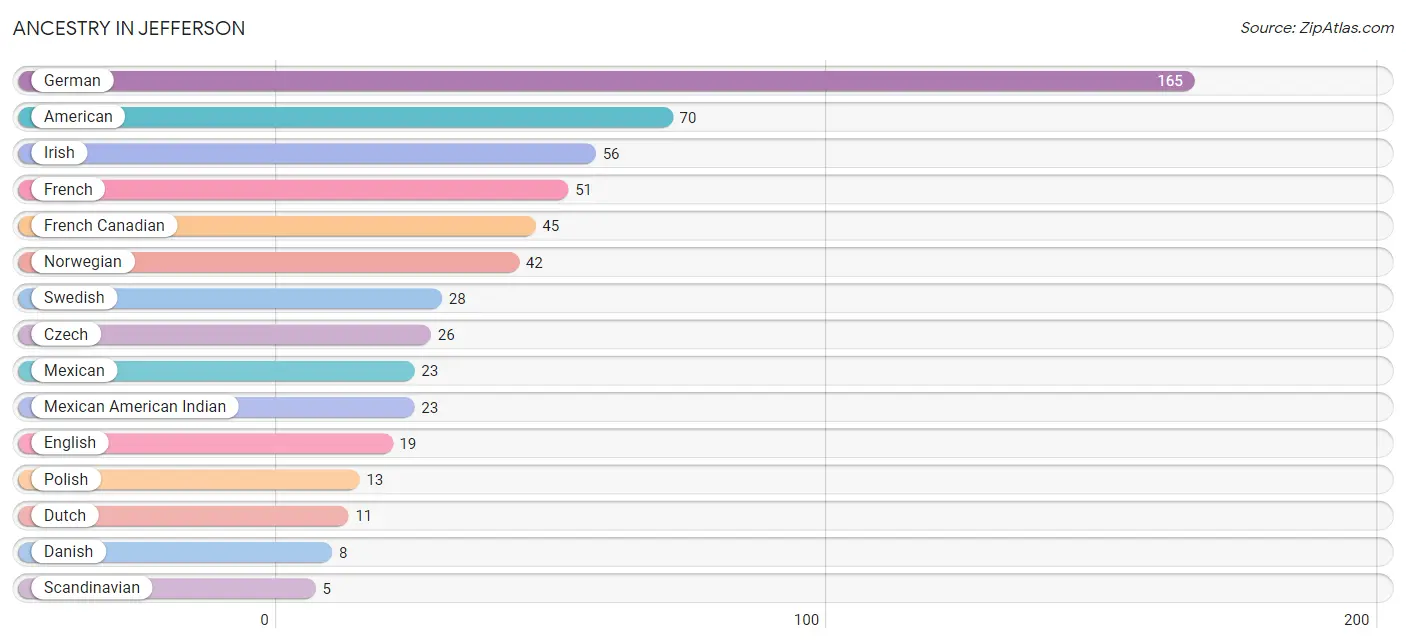
| Ancestry | # Population | % Population |
| American | 70 | 11.1% |
| Cuban | 3 | 0.5% |
| Czech | 26 | 4.1% |
| Danish | 8 | 1.3% |
| Dutch | 11 | 1.7% |
| Dutch West Indian | 2 | 0.3% |
| English | 19 | 3.0% |
| French | 51 | 8.1% |
| French Canadian | 45 | 7.1% |
| German | 165 | 26.2% |
| Icelander | 1 | 0.2% |
| Irish | 56 | 8.9% |
| Italian | 2 | 0.3% |
| Luxembourger | 2 | 0.3% |
| Mexican | 23 | 3.6% |
| Mexican American Indian | 23 | 3.6% |
| Norwegian | 42 | 6.7% |
| Polish | 13 | 2.1% |
| Russian | 2 | 0.3% |
| Scandinavian | 5 | 0.8% |
| Scotch-Irish | 3 | 0.5% |
| Swedish | 28 | 4.4% |
| Swiss | 3 | 0.5% | View All 23 Rows |
Immigrants in Jefferson
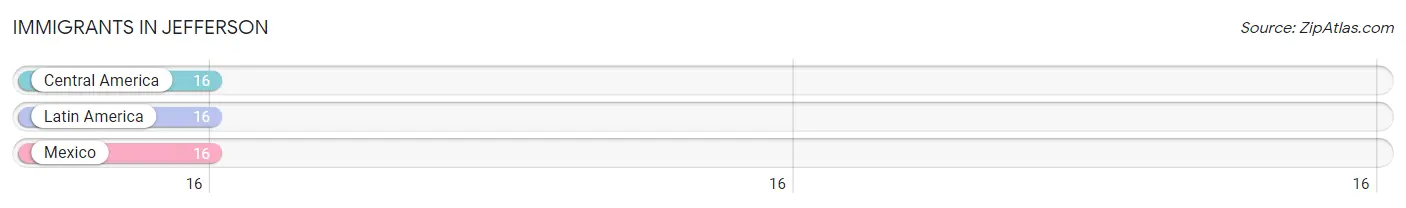
The most numerous immigrant groups reported in Jefferson came from Central America (16 | 2.5%), Latin America (16 | 2.5%), and Mexico (16 | 2.5%), together accounting for 7.6% of all Jefferson residents.
| Immigration Origin | # Population | % Population |
| Central America | 16 | 2.5% |
| Latin America | 16 | 2.5% |
| Mexico | 16 | 2.5% | View All 3 Rows |
Sex and Age in Jefferson
Sex and Age in Jefferson
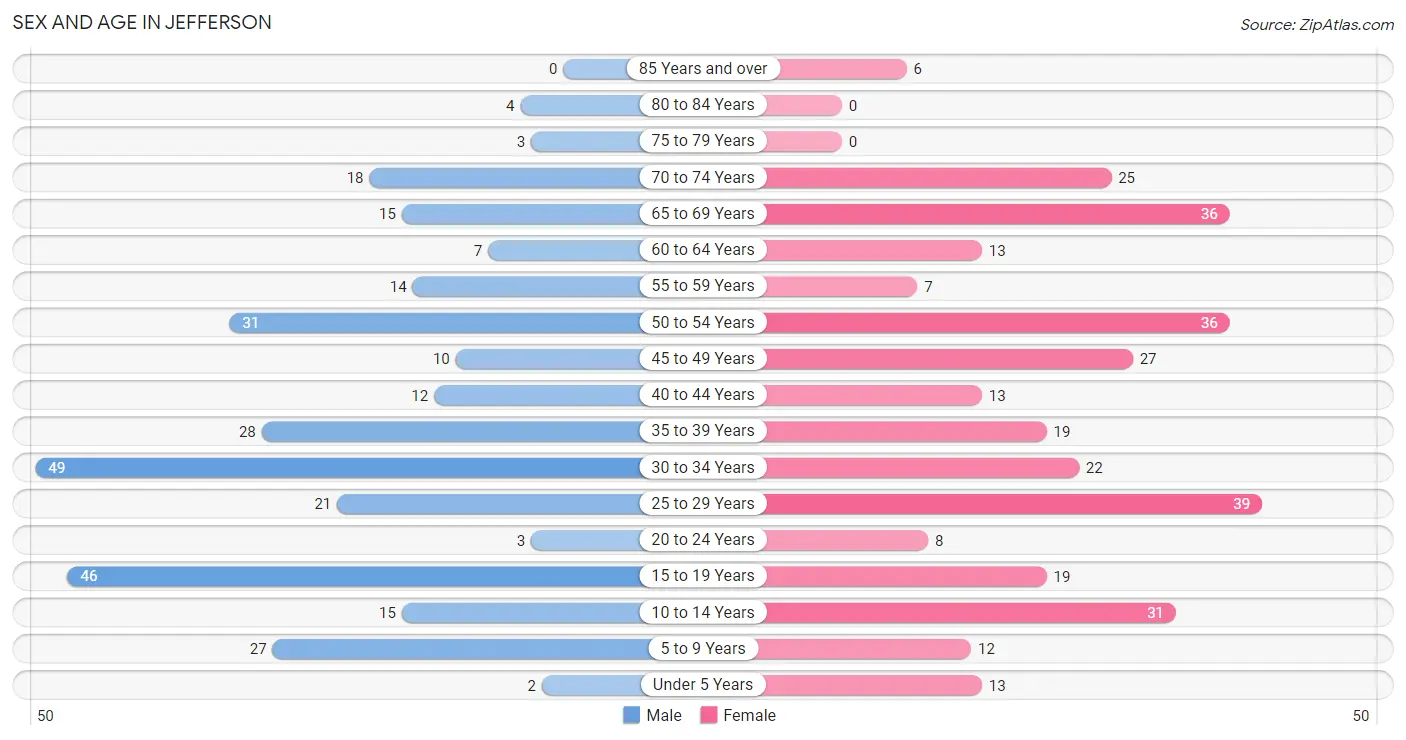
The most populous age groups in Jefferson are 30 to 34 Years (49 | 16.1%) for men and 25 to 29 Years (39 | 12.0%) for women.
| Age Bracket | Male | Female |
| Under 5 Years | 2 (0.7%) | 13 (4.0%) |
| 5 to 9 Years | 27 (8.8%) | 12 (3.7%) |
| 10 to 14 Years | 15 (4.9%) | 31 (9.5%) |
| 15 to 19 Years | 46 (15.1%) | 19 (5.8%) |
| 20 to 24 Years | 3 (1.0%) | 8 (2.5%) |
| 25 to 29 Years | 21 (6.9%) | 39 (12.0%) |
| 30 to 34 Years | 49 (16.1%) | 22 (6.8%) |
| 35 to 39 Years | 28 (9.2%) | 19 (5.8%) |
| 40 to 44 Years | 12 (3.9%) | 13 (4.0%) |
| 45 to 49 Years | 10 (3.3%) | 27 (8.3%) |
| 50 to 54 Years | 31 (10.2%) | 36 (11.0%) |
| 55 to 59 Years | 14 (4.6%) | 7 (2.1%) |
| 60 to 64 Years | 7 (2.3%) | 13 (4.0%) |
| 65 to 69 Years | 15 (4.9%) | 36 (11.0%) |
| 70 to 74 Years | 18 (5.9%) | 25 (7.7%) |
| 75 to 79 Years | 3 (1.0%) | 0 (0.0%) |
| 80 to 84 Years | 4 (1.3%) | 0 (0.0%) |
| 85 Years and over | 0 (0.0%) | 6 (1.8%) |
| Total | 305 (100.0%) | 326 (100.0%) |
Families and Households in Jefferson
Median Family Size in Jefferson
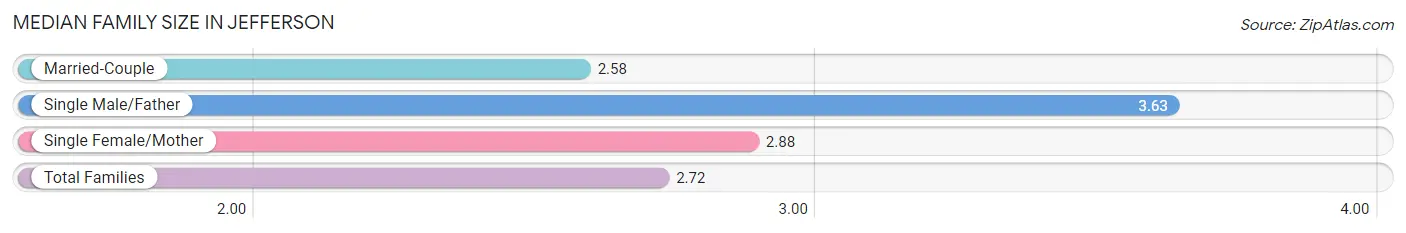
The median family size in Jefferson is 2.72 persons per family, with single male/father families (16 | 8.7%) accounting for the largest median family size of 3.63 persons per family. On the other hand, married-couple families (136 | 73.9%) represent the smallest median family size with 2.58 persons per family.
| Family Type | # Families | Family Size |
| Married-Couple | 136 (73.9%) | 2.58 |
| Single Male/Father | 16 (8.7%) | 3.63 |
| Single Female/Mother | 32 (17.4%) | 2.88 |
| Total Families | 184 (100.0%) | 2.72 |
Median Household Size in Jefferson
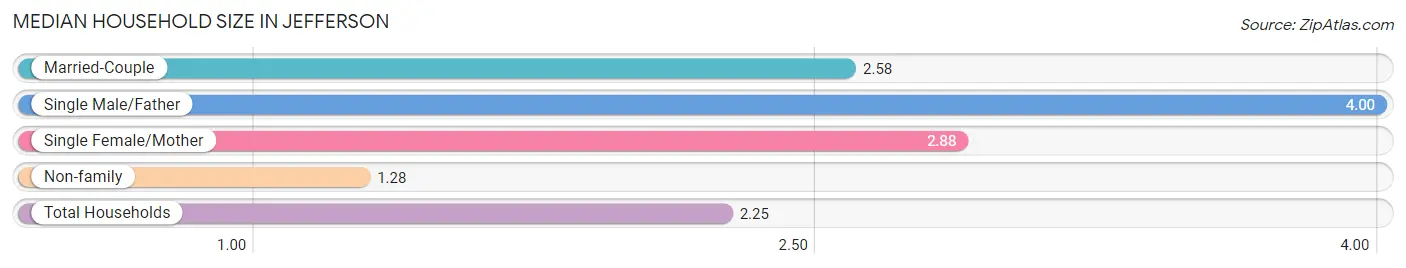
The median household size in Jefferson is 2.25 persons per household, with single male/father households (16 | 5.7%) accounting for the largest median household size of 4 persons per household. non-family households (97 | 34.5%) represent the smallest median household size with 1.28 persons per household.
| Household Type | # Households | Household Size |
| Married-Couple | 136 (48.4%) | 2.58 |
| Single Male/Father | 16 (5.7%) | 4.00 |
| Single Female/Mother | 32 (11.4%) | 2.88 |
| Non-family | 97 (34.5%) | 1.28 |
| Total Households | 281 (100.0%) | 2.25 |
Household Size by Marriage Status in Jefferson
Out of a total of 281 households in Jefferson, 184 (65.5%) are family households, while 97 (34.5%) are nonfamily households. The most numerous type of family households are 2-person households, comprising 110, and the most common type of nonfamily households are 1-person households, comprising 69.
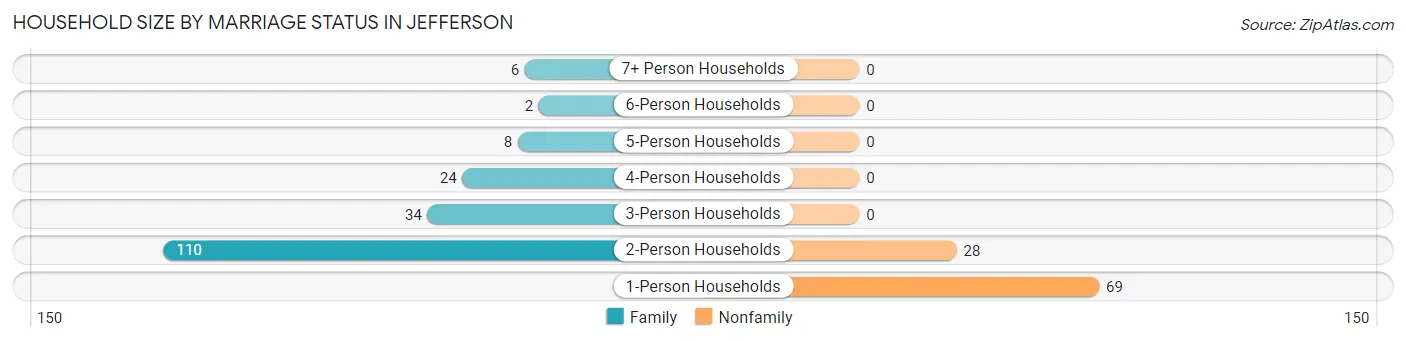
| Household Size | Family Households | Nonfamily Households |
| 1-Person Households | - | 69 (24.6%) |
| 2-Person Households | 110 (39.2%) | 28 (10.0%) |
| 3-Person Households | 34 (12.1%) | 0 (0.0%) |
| 4-Person Households | 24 (8.5%) | 0 (0.0%) |
| 5-Person Households | 8 (2.9%) | 0 (0.0%) |
| 6-Person Households | 2 (0.7%) | 0 (0.0%) |
| 7+ Person Households | 6 (2.1%) | 0 (0.0%) |
| Total | 184 (65.5%) | 97 (34.5%) |
Female Fertility in Jefferson
Fertility by Age in Jefferson
| Age Bracket | Women with Births | Births / 1,000 Women |
| 15 to 19 years | 0 (0.0%) | 0.0 |
| 20 to 34 years | 0 (0.0%) | 0.0 |
| 35 to 50 years | 0 (0.0%) | 0.0 |
| Total | 0 (0.0%) | 0.0 |
Fertility by Age by Marriage Status in Jefferson
| Age Bracket | Married | Unmarried |
| 15 to 19 years | 0 (0.0%) | 0 (0.0%) |
| 20 to 34 years | 0 (0.0%) | 0 (0.0%) |
| 35 to 50 years | 0 (0.0%) | 0 (0.0%) |
| Total | 0 (0.0%) | 0 (0.0%) |
Fertility by Education in Jefferson
| Educational Attainment | Women with Births | Births / 1,000 Women |
| Less than High School | 0 (0.0%) | 0.0 |
| High School Diploma | 0 (0.0%) | 0.0 |
| College or Associate's Degree | 0 (0.0%) | 0.0 |
| Bachelor's Degree | 0 (0.0%) | 0.0 |
| Graduate Degree | 0 (0.0%) | 0.0 |
| Total | 0 (0.0%) | 0.0 |
Fertility by Education by Marriage Status in Jefferson
| Educational Attainment | Married | Unmarried |
| Less than High School | 0 (0.0%) | 0 (0.0%) |
| High School Diploma | 0 (0.0%) | 0 (0.0%) |
| College or Associate's Degree | 0 (0.0%) | 0 (0.0%) |
| Bachelor's Degree | 0 (0.0%) | 0 (0.0%) |
| Graduate Degree | 0 (0.0%) | 0 (0.0%) |
| Total | 0 (0.0%) | 0 (0.0%) |
Employment Characteristics in Jefferson
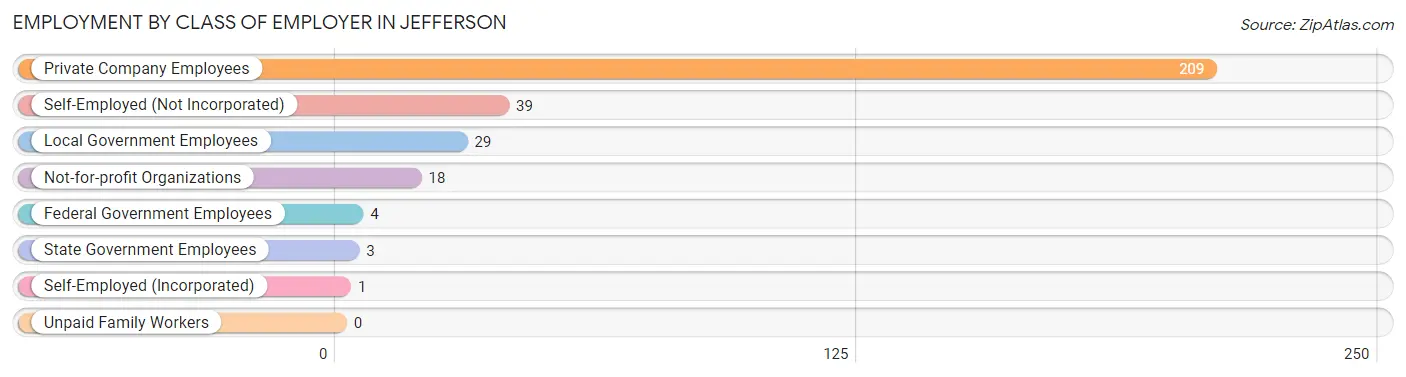
Employment by Class of Employer in Jefferson
Among the 303 employed individuals in Jefferson, private company employees (209 | 69.0%), self-employed (not incorporated) (39 | 12.9%), and local government employees (29 | 9.6%) make up the most common classes of employment.
| Employer Class | # Employees | % Employees |
| Private Company Employees | 209 | 69.0% |
| Self-Employed (Incorporated) | 1 | 0.3% |
| Self-Employed (Not Incorporated) | 39 | 12.9% |
| Not-for-profit Organizations | 18 | 5.9% |
| Local Government Employees | 29 | 9.6% |
| State Government Employees | 3 | 1.0% |
| Federal Government Employees | 4 | 1.3% |
| Unpaid Family Workers | 0 | 0.0% |
| Total | 303 | 100.0% |
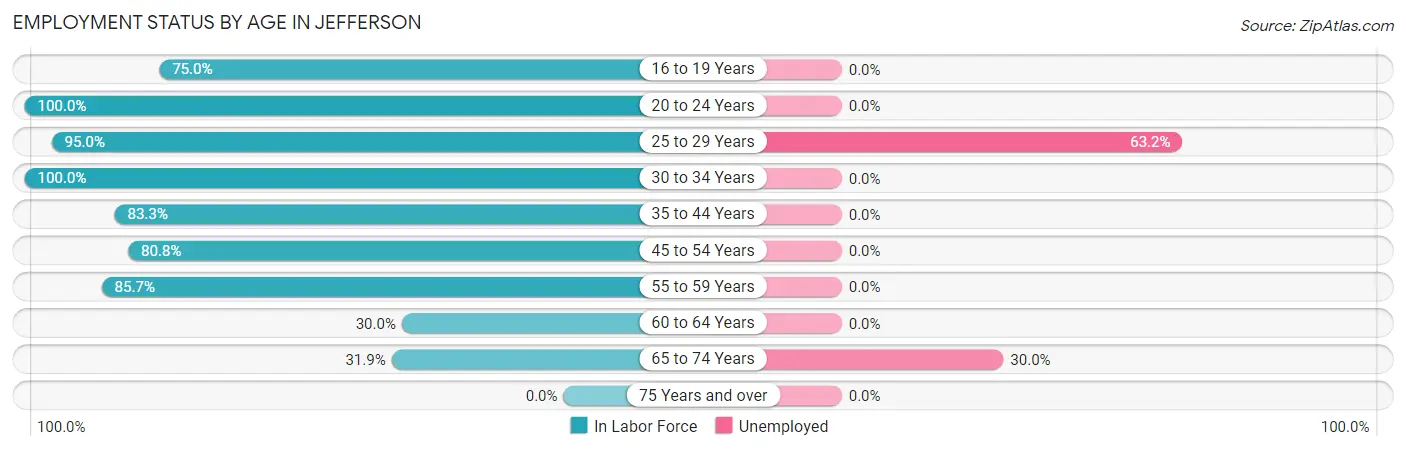
Employment Status by Age in Jefferson
According to the labor force statistics for Jefferson, out of the total population over 16 years of age (486), 72.4% or 352 individuals are in the labor force, with 12.8% or 45 of them unemployed. The age group with the highest labor force participation rate is 20 to 24 years, with 100.0% or 11 individuals in the labor force. Within the labor force, the 25 to 29 years age range has the highest percentage of unemployed individuals, with 63.2% or 36 of them being unemployed.
| Age Bracket | In Labor Force | Unemployed |
| 16 to 19 Years | 15 (75.0%) | 0 (0.0%) |
| 20 to 24 Years | 11 (100.0%) | 0 (0.0%) |
| 25 to 29 Years | 57 (95.0%) | 36 (63.2%) |
| 30 to 34 Years | 71 (100.0%) | 0 (0.0%) |
| 35 to 44 Years | 60 (83.3%) | 0 (0.0%) |
| 45 to 54 Years | 84 (80.8%) | 0 (0.0%) |
| 55 to 59 Years | 18 (85.7%) | 0 (0.0%) |
| 60 to 64 Years | 6 (30.0%) | 0 (0.0%) |
| 65 to 74 Years | 30 (31.9%) | 9 (30.0%) |
| 75 Years and over | 0 (0.0%) | 0 (0.0%) |
| Total | 352 (72.4%) | 45 (12.8%) |
Employment Status by Educational Attainment in Jefferson
According to labor force statistics for Jefferson, 85.1% of individuals (296) out of the total population between 25 and 64 years of age (348) are in the labor force, with 12.2% or 36 of them being unemployed. The group with the highest labor force participation rate are those with the educational attainment of bachelor's degree or higher, with 95.3% or 82 individuals in the labor force. Within the labor force, individuals with college / associate degree education have the highest percentage of unemployment, with 21.3% or 34 of them being unemployed.
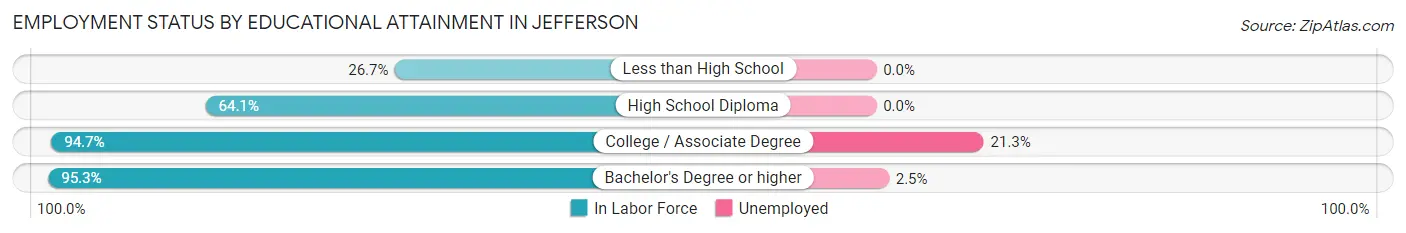
| Educational Attainment | In Labor Force | Unemployed |
| Less than High School | 4 (26.7%) | 0 (0.0%) |
| High School Diploma | 50 (64.1%) | 0 (0.0%) |
| College / Associate Degree | 160 (94.7%) | 36 (21.3%) |
| Bachelor's Degree or higher | 82 (95.3%) | 2 (2.5%) |
| Total | 296 (85.1%) | 42 (12.2%) |
Employment Occupations by Sex in Jefferson
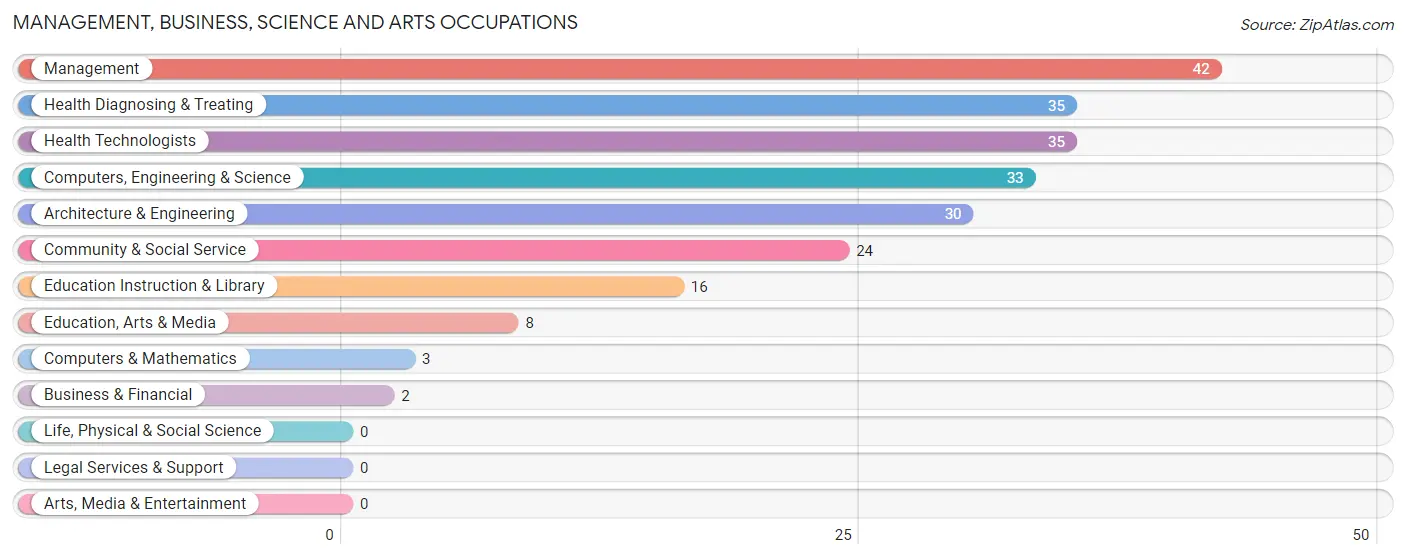
Management, Business, Science and Arts Occupations
The most common Management, Business, Science and Arts occupations in Jefferson are Management (42 | 13.7%), Health Diagnosing & Treating (35 | 11.4%), Health Technologists (35 | 11.4%), Computers, Engineering & Science (33 | 10.8%), and Architecture & Engineering (30 | 9.8%).
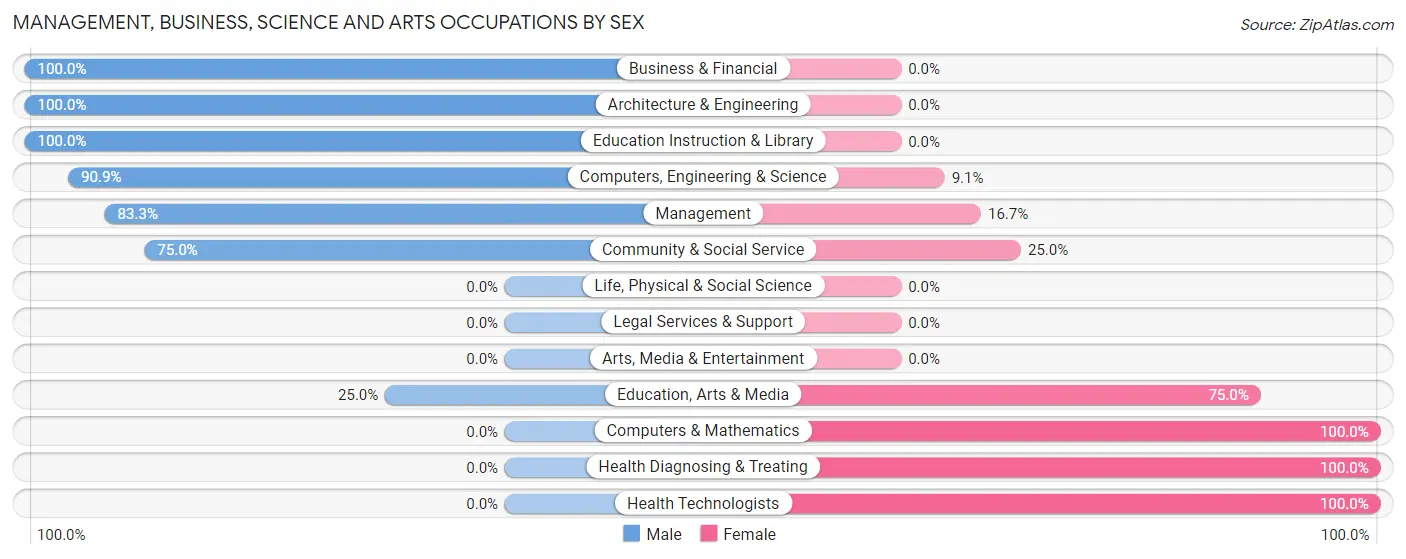
Management, Business, Science and Arts Occupations by Sex
Within the Management, Business, Science and Arts occupations in Jefferson, the most male-oriented occupations are Business & Financial (100.0%), Architecture & Engineering (100.0%), and Education Instruction & Library (100.0%), while the most female-oriented occupations are Computers & Mathematics (100.0%), Health Diagnosing & Treating (100.0%), and Health Technologists (100.0%).
| Occupation | Male | Female |
| Management | 35 (83.3%) | 7 (16.7%) |
| Business & Financial | 2 (100.0%) | 0 (0.0%) |
| Computers, Engineering & Science | 30 (90.9%) | 3 (9.1%) |
| Computers & Mathematics | 0 (0.0%) | 3 (100.0%) |
| Architecture & Engineering | 30 (100.0%) | 0 (0.0%) |
| Life, Physical & Social Science | 0 (0.0%) | 0 (0.0%) |
| Community & Social Service | 18 (75.0%) | 6 (25.0%) |
| Education, Arts & Media | 2 (25.0%) | 6 (75.0%) |
| Legal Services & Support | 0 (0.0%) | 0 (0.0%) |
| Education Instruction & Library | 16 (100.0%) | 0 (0.0%) |
| Arts, Media & Entertainment | 0 (0.0%) | 0 (0.0%) |
| Health Diagnosing & Treating | 0 (0.0%) | 35 (100.0%) |
| Health Technologists | 0 (0.0%) | 35 (100.0%) |
| Total (Category) | 85 (62.5%) | 51 (37.5%) |
| Total (Overall) | 165 (53.9%) | 141 (46.1%) |
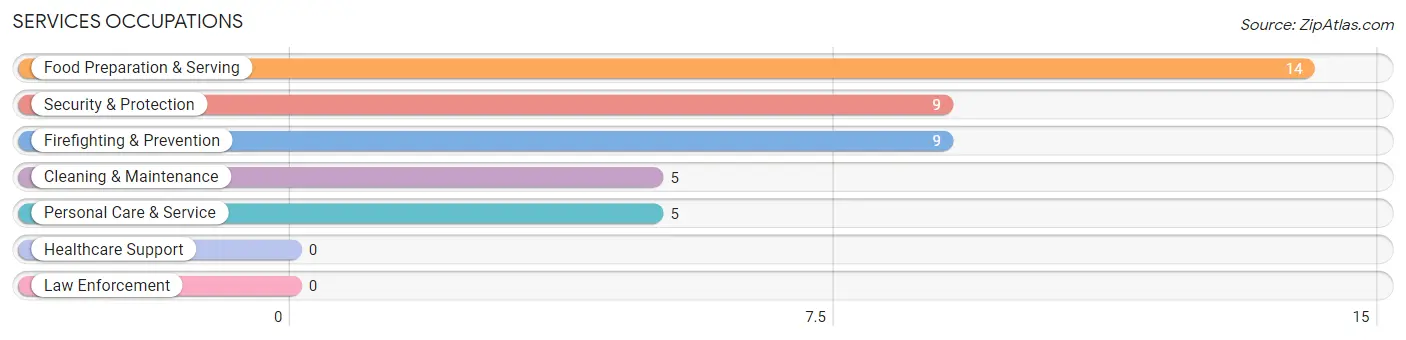
Services Occupations
The most common Services occupations in Jefferson are Food Preparation & Serving (14 | 4.6%), Security & Protection (9 | 2.9%), Firefighting & Prevention (9 | 2.9%), Cleaning & Maintenance (5 | 1.6%), and Personal Care & Service (5 | 1.6%).
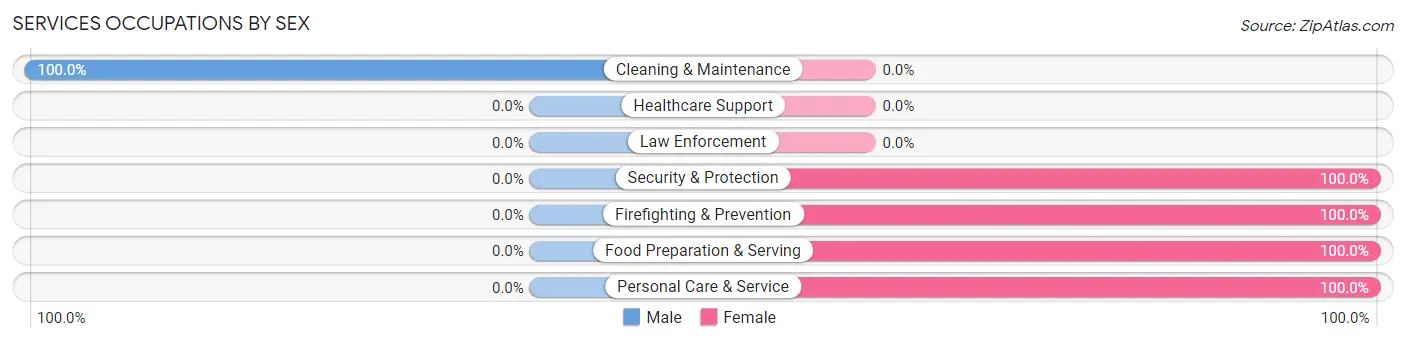
Services Occupations by Sex
| Occupation | Male | Female |
| Healthcare Support | 0 (0.0%) | 0 (0.0%) |
| Security & Protection | 0 (0.0%) | 9 (100.0%) |
| Firefighting & Prevention | 0 (0.0%) | 9 (100.0%) |
| Law Enforcement | 0 (0.0%) | 0 (0.0%) |
| Food Preparation & Serving | 0 (0.0%) | 14 (100.0%) |
| Cleaning & Maintenance | 5 (100.0%) | 0 (0.0%) |
| Personal Care & Service | 0 (0.0%) | 5 (100.0%) |
| Total (Category) | 5 (15.1%) | 28 (84.9%) |
| Total (Overall) | 165 (53.9%) | 141 (46.1%) |
Sales and Office Occupations
The most common Sales and Office occupations in Jefferson are Office & Administration (49 | 16.0%), and Sales & Related (5 | 1.6%).
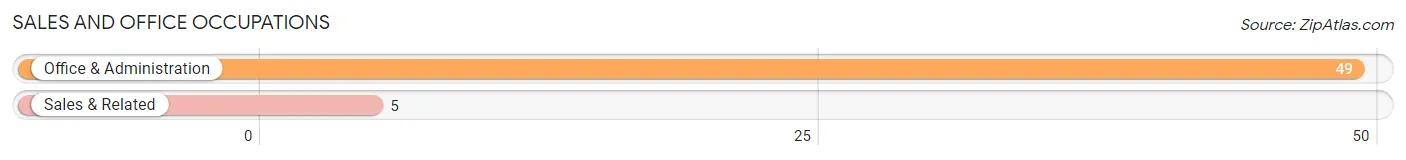
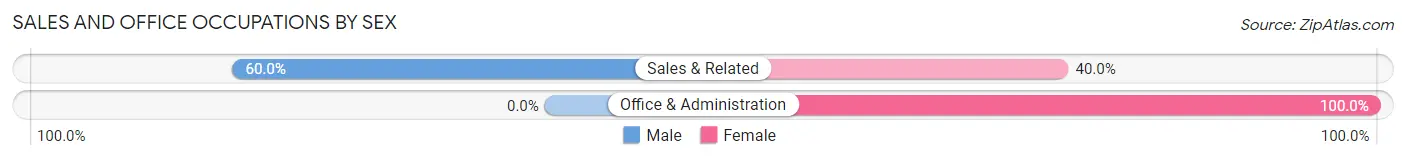
Sales and Office Occupations by Sex
| Occupation | Male | Female |
| Sales & Related | 3 (60.0%) | 2 (40.0%) |
| Office & Administration | 0 (0.0%) | 49 (100.0%) |
| Total (Category) | 3 (5.6%) | 51 (94.4%) |
| Total (Overall) | 165 (53.9%) | 141 (46.1%) |
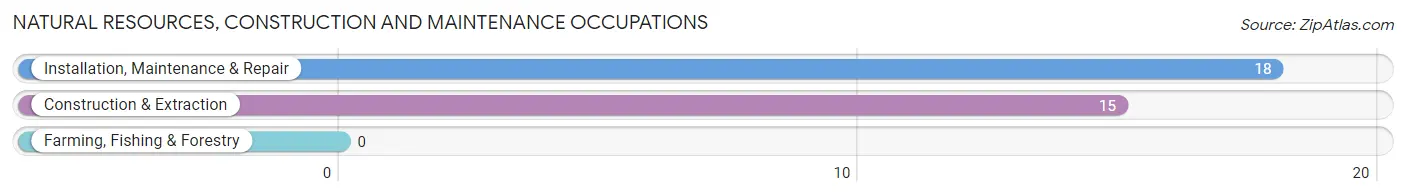
Natural Resources, Construction and Maintenance Occupations
The most common Natural Resources, Construction and Maintenance occupations in Jefferson are Installation, Maintenance & Repair (18 | 5.9%), and Construction & Extraction (15 | 4.9%).
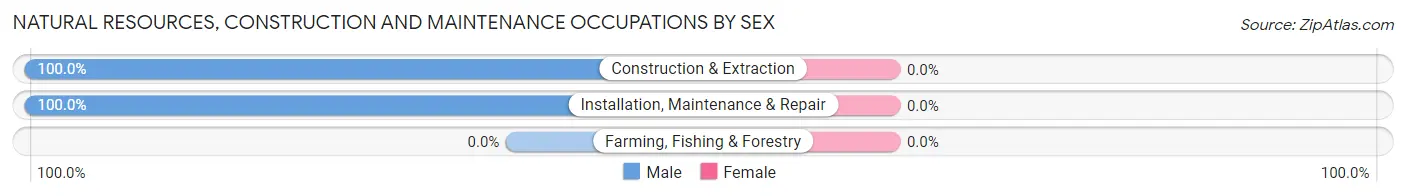
Natural Resources, Construction and Maintenance Occupations by Sex
| Occupation | Male | Female |
| Farming, Fishing & Forestry | 0 (0.0%) | 0 (0.0%) |
| Construction & Extraction | 15 (100.0%) | 0 (0.0%) |
| Installation, Maintenance & Repair | 18 (100.0%) | 0 (0.0%) |
| Total (Category) | 33 (100.0%) | 0 (0.0%) |
| Total (Overall) | 165 (53.9%) | 141 (46.1%) |
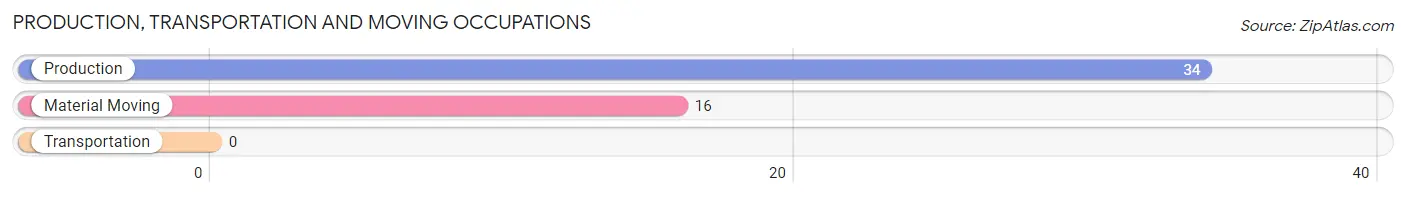
Production, Transportation and Moving Occupations
The most common Production, Transportation and Moving occupations in Jefferson are Production (34 | 11.1%), and Material Moving (16 | 5.2%).
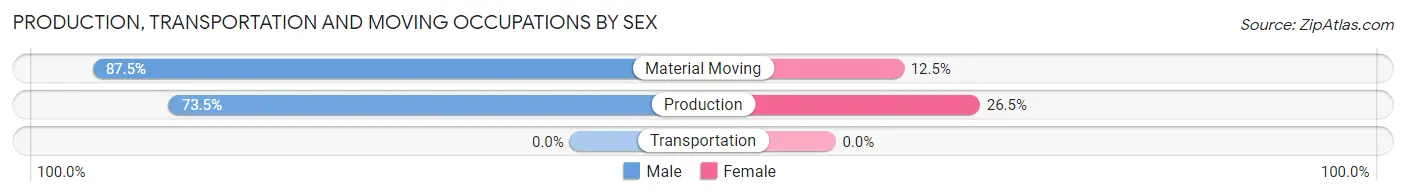
Production, Transportation and Moving Occupations by Sex
| Occupation | Male | Female |
| Production | 25 (73.5%) | 9 (26.5%) |
| Transportation | 0 (0.0%) | 0 (0.0%) |
| Material Moving | 14 (87.5%) | 2 (12.5%) |
| Total (Category) | 39 (78.0%) | 11 (22.0%) |
| Total (Overall) | 165 (53.9%) | 141 (46.1%) |
Employment Industries by Sex in Jefferson
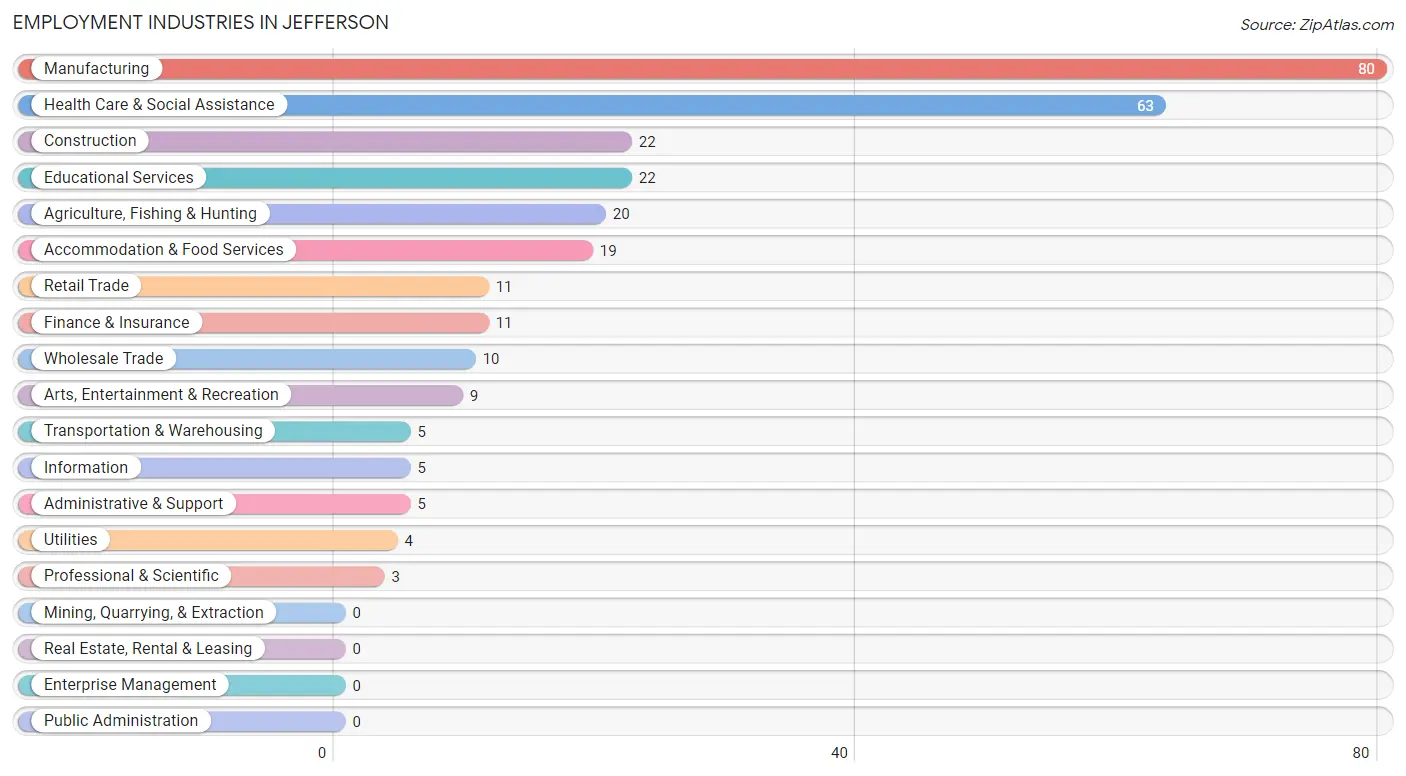
Employment Industries in Jefferson
The major employment industries in Jefferson include Manufacturing (80 | 26.1%), Health Care & Social Assistance (63 | 20.6%), Construction (22 | 7.2%), Educational Services (22 | 7.2%), and Agriculture, Fishing & Hunting (20 | 6.5%).
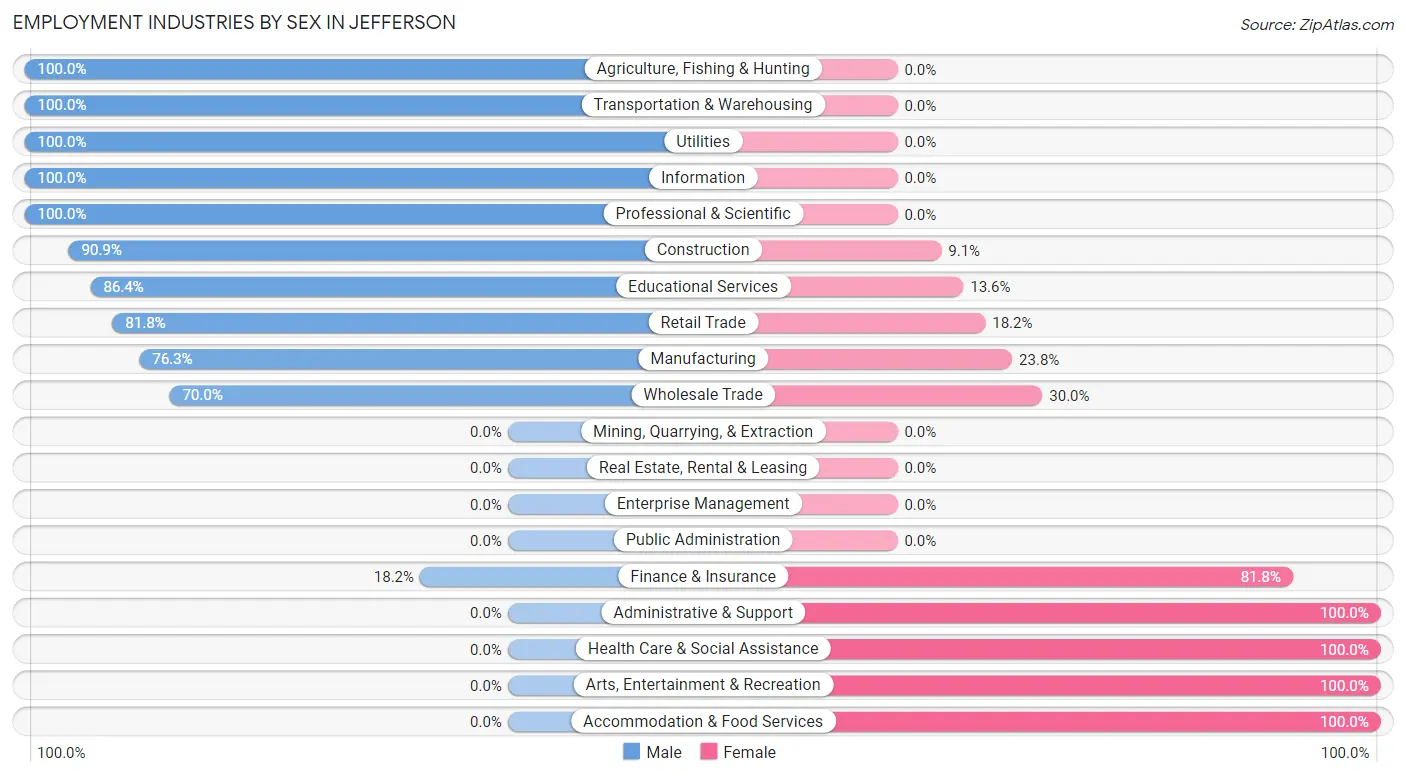
Employment Industries by Sex in Jefferson
The Jefferson industries that see more men than women are Agriculture, Fishing & Hunting (100.0%), Transportation & Warehousing (100.0%), and Utilities (100.0%), whereas the industries that tend to have a higher number of women are Administrative & Support (100.0%), Health Care & Social Assistance (100.0%), and Arts, Entertainment & Recreation (100.0%).
| Industry | Male | Female |
| Agriculture, Fishing & Hunting | 20 (100.0%) | 0 (0.0%) |
| Mining, Quarrying, & Extraction | 0 (0.0%) | 0 (0.0%) |
| Construction | 20 (90.9%) | 2 (9.1%) |
| Manufacturing | 61 (76.2%) | 19 (23.7%) |
| Wholesale Trade | 7 (70.0%) | 3 (30.0%) |
| Retail Trade | 9 (81.8%) | 2 (18.2%) |
| Transportation & Warehousing | 5 (100.0%) | 0 (0.0%) |
| Utilities | 4 (100.0%) | 0 (0.0%) |
| Information | 5 (100.0%) | 0 (0.0%) |
| Finance & Insurance | 2 (18.2%) | 9 (81.8%) |
| Real Estate, Rental & Leasing | 0 (0.0%) | 0 (0.0%) |
| Professional & Scientific | 3 (100.0%) | 0 (0.0%) |
| Enterprise Management | 0 (0.0%) | 0 (0.0%) |
| Administrative & Support | 0 (0.0%) | 5 (100.0%) |
| Educational Services | 19 (86.4%) | 3 (13.6%) |
| Health Care & Social Assistance | 0 (0.0%) | 63 (100.0%) |
| Arts, Entertainment & Recreation | 0 (0.0%) | 9 (100.0%) |
| Accommodation & Food Services | 0 (0.0%) | 19 (100.0%) |
| Public Administration | 0 (0.0%) | 0 (0.0%) |
| Total | 165 (53.9%) | 141 (46.1%) |
Education in Jefferson
School Enrollment in Jefferson
The most common levels of schooling among the 155 students in Jefferson are high school (64 | 41.3%), middle school (33 | 21.3%), and elementary school (27 | 17.4%).
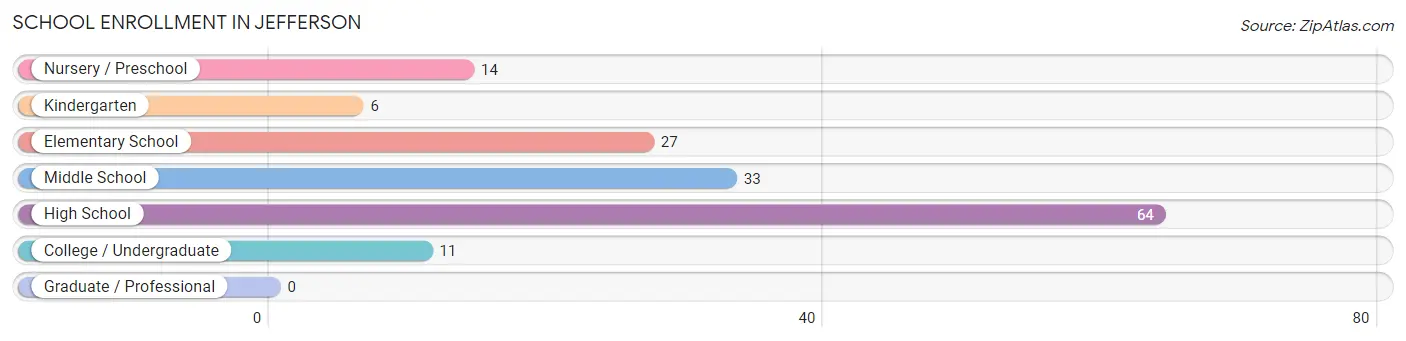
| School Level | # Students | % Students |
| Nursery / Preschool | 14 | 9.0% |
| Kindergarten | 6 | 3.9% |
| Elementary School | 27 | 17.4% |
| Middle School | 33 | 21.3% |
| High School | 64 | 41.3% |
| College / Undergraduate | 11 | 7.1% |
| Graduate / Professional | 0 | 0.0% |
| Total | 155 | 100.0% |
School Enrollment by Age by Funding Source in Jefferson
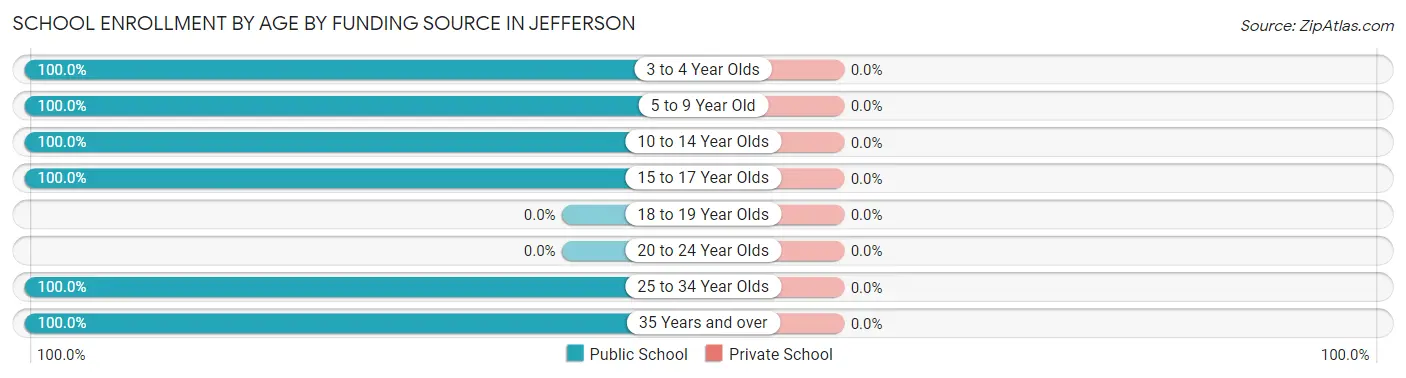
| Age Bracket | Public School | Private School |
| 3 to 4 Year Olds | 13 (100.0%) | 0 (0.0%) |
| 5 to 9 Year Old | 29 (100.0%) | 0 (0.0%) |
| 10 to 14 Year Olds | 43 (100.0%) | 0 (0.0%) |
| 15 to 17 Year Olds | 59 (100.0%) | 0 (0.0%) |
| 18 to 19 Year Olds | 0 (0.0%) | 0 (0.0%) |
| 20 to 24 Year Olds | 0 (0.0%) | 0 (0.0%) |
| 25 to 34 Year Olds | 5 (100.0%) | 0 (0.0%) |
| 35 Years and over | 6 (100.0%) | 0 (0.0%) |
| Total | 155 (100.0%) | 0 (0.0%) |
Educational Attainment by Field of Study in Jefferson
Bio, nature & agricultural (21 | 18.9%), business (20 | 18.0%), science & technology (15 | 13.5%), education (15 | 13.5%), and arts & humanities (14 | 12.6%) are the most common fields of study among 111 individuals in Jefferson who have obtained a bachelor's degree or higher.
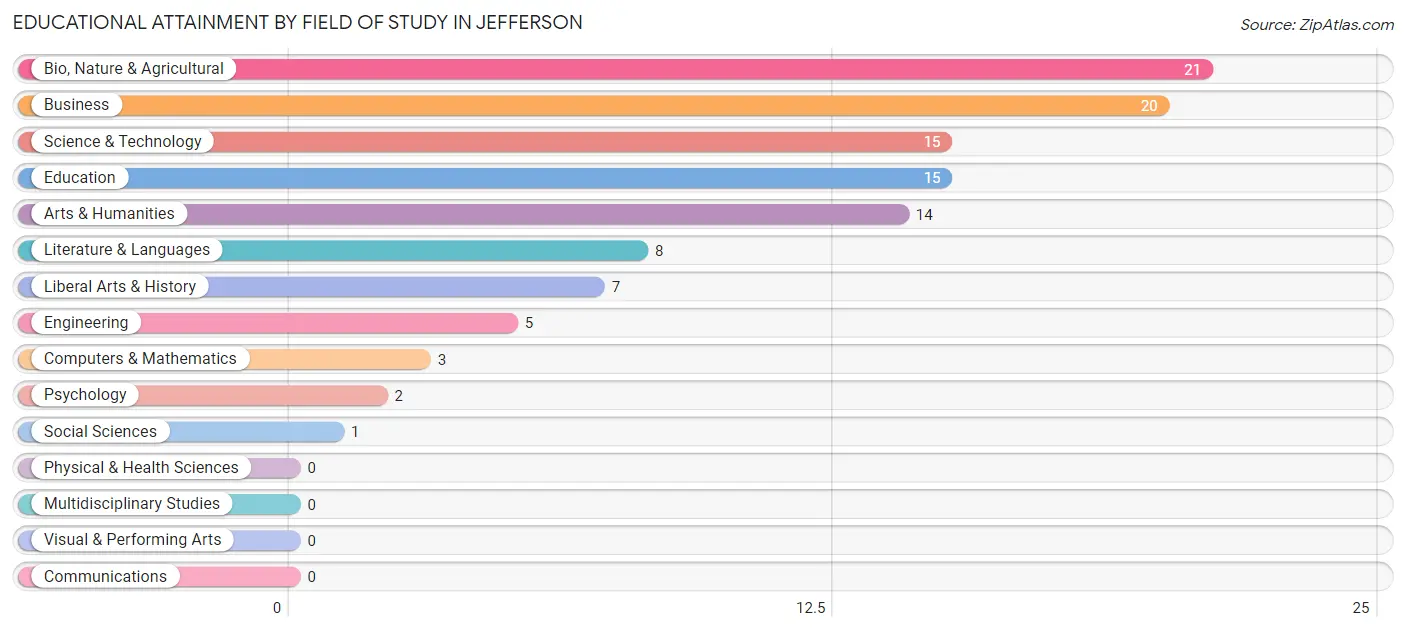
| Field of Study | # Graduates | % Graduates |
| Computers & Mathematics | 3 | 2.7% |
| Bio, Nature & Agricultural | 21 | 18.9% |
| Physical & Health Sciences | 0 | 0.0% |
| Psychology | 2 | 1.8% |
| Social Sciences | 1 | 0.9% |
| Engineering | 5 | 4.5% |
| Multidisciplinary Studies | 0 | 0.0% |
| Science & Technology | 15 | 13.5% |
| Business | 20 | 18.0% |
| Education | 15 | 13.5% |
| Literature & Languages | 8 | 7.2% |
| Liberal Arts & History | 7 | 6.3% |
| Visual & Performing Arts | 0 | 0.0% |
| Communications | 0 | 0.0% |
| Arts & Humanities | 14 | 12.6% |
| Total | 111 | 100.0% |
Transportation & Commute in Jefferson
Vehicle Availability by Sex in Jefferson
The most prevalent vehicle ownership categories in Jefferson are males with 3 vehicles (75, accounting for 45.2%) and females with 3 vehicles (57, making up 54.7%).
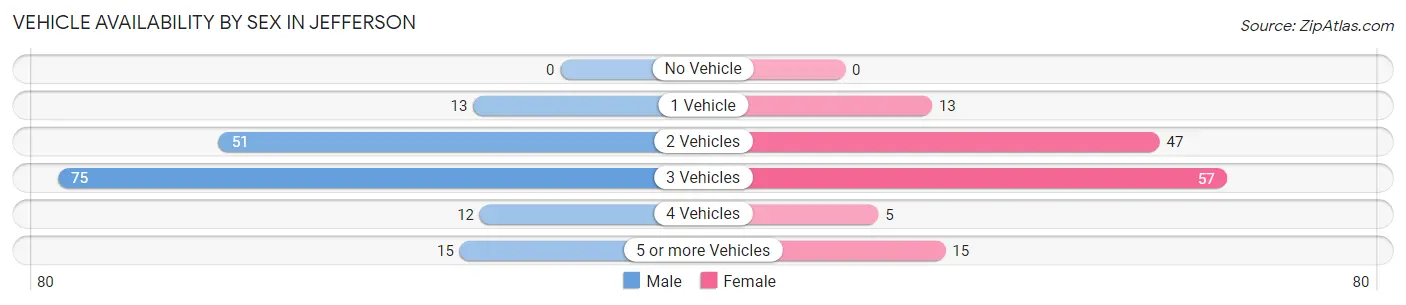
| Vehicles Available | Male | Female |
| No Vehicle | 0 (0.0%) | 0 (0.0%) |
| 1 Vehicle | 13 (7.8%) | 13 (9.5%) |
| 2 Vehicles | 51 (30.7%) | 47 (34.3%) |
| 3 Vehicles | 75 (45.2%) | 57 (41.6%) |
| 4 Vehicles | 12 (7.2%) | 5 (3.6%) |
| 5 or more Vehicles | 15 (9.0%) | 15 (11.0%) |
| Total | 166 (100.0%) | 137 (100.0%) |
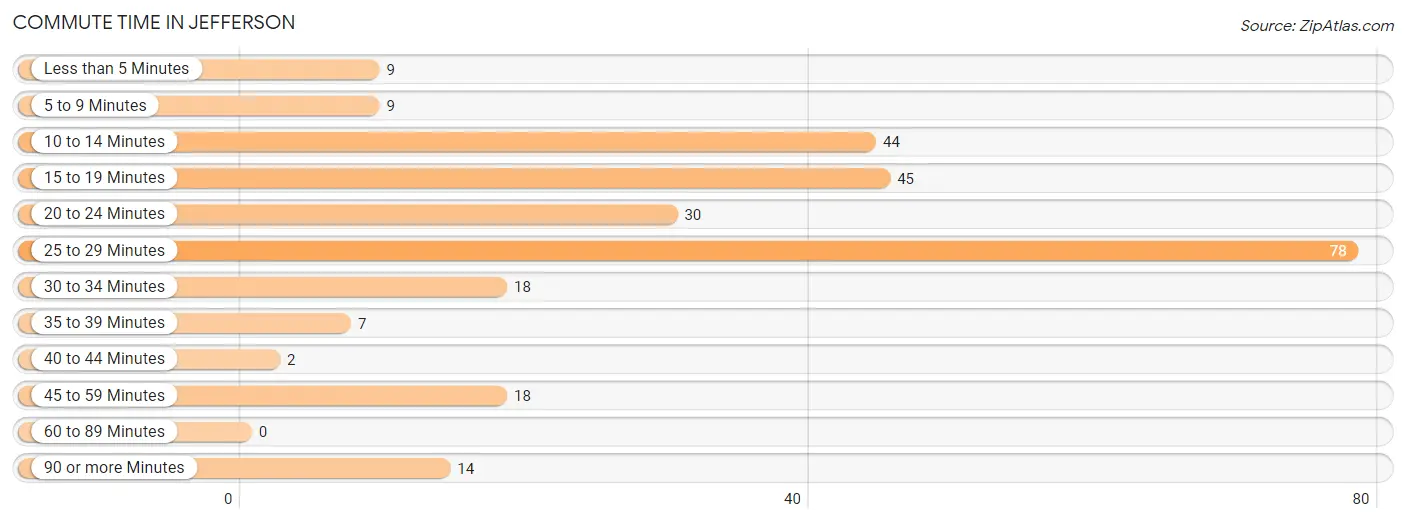
Commute Time in Jefferson
The most frequently occuring commute durations in Jefferson are 25 to 29 minutes (78 commuters, 28.5%), 15 to 19 minutes (45 commuters, 16.4%), and 10 to 14 minutes (44 commuters, 16.1%).
| Commute Time | # Commuters | % Commuters |
| Less than 5 Minutes | 9 | 3.3% |
| 5 to 9 Minutes | 9 | 3.3% |
| 10 to 14 Minutes | 44 | 16.1% |
| 15 to 19 Minutes | 45 | 16.4% |
| 20 to 24 Minutes | 30 | 11.0% |
| 25 to 29 Minutes | 78 | 28.5% |
| 30 to 34 Minutes | 18 | 6.6% |
| 35 to 39 Minutes | 7 | 2.5% |
| 40 to 44 Minutes | 2 | 0.7% |
| 45 to 59 Minutes | 18 | 6.6% |
| 60 to 89 Minutes | 0 | 0.0% |
| 90 or more Minutes | 14 | 5.1% |
Commute Time by Sex in Jefferson
The most common commute times in Jefferson are 25 to 29 minutes (54 commuters, 39.4%) for males and 15 to 19 minutes (25 commuters, 18.2%) for females.
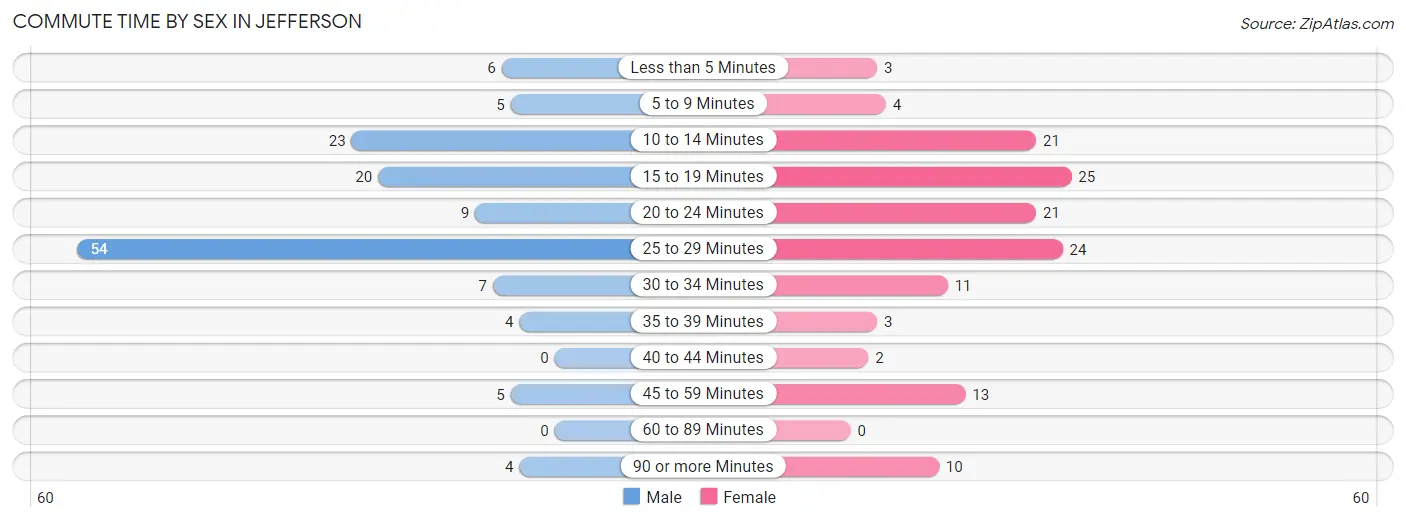
| Commute Time | Male | Female |
| Less than 5 Minutes | 6 (4.4%) | 3 (2.2%) |
| 5 to 9 Minutes | 5 (3.6%) | 4 (2.9%) |
| 10 to 14 Minutes | 23 (16.8%) | 21 (15.3%) |
| 15 to 19 Minutes | 20 (14.6%) | 25 (18.2%) |
| 20 to 24 Minutes | 9 (6.6%) | 21 (15.3%) |
| 25 to 29 Minutes | 54 (39.4%) | 24 (17.5%) |
| 30 to 34 Minutes | 7 (5.1%) | 11 (8.0%) |
| 35 to 39 Minutes | 4 (2.9%) | 3 (2.2%) |
| 40 to 44 Minutes | 0 (0.0%) | 2 (1.5%) |
| 45 to 59 Minutes | 5 (3.6%) | 13 (9.5%) |
| 60 to 89 Minutes | 0 (0.0%) | 0 (0.0%) |
| 90 or more Minutes | 4 (2.9%) | 10 (7.3%) |
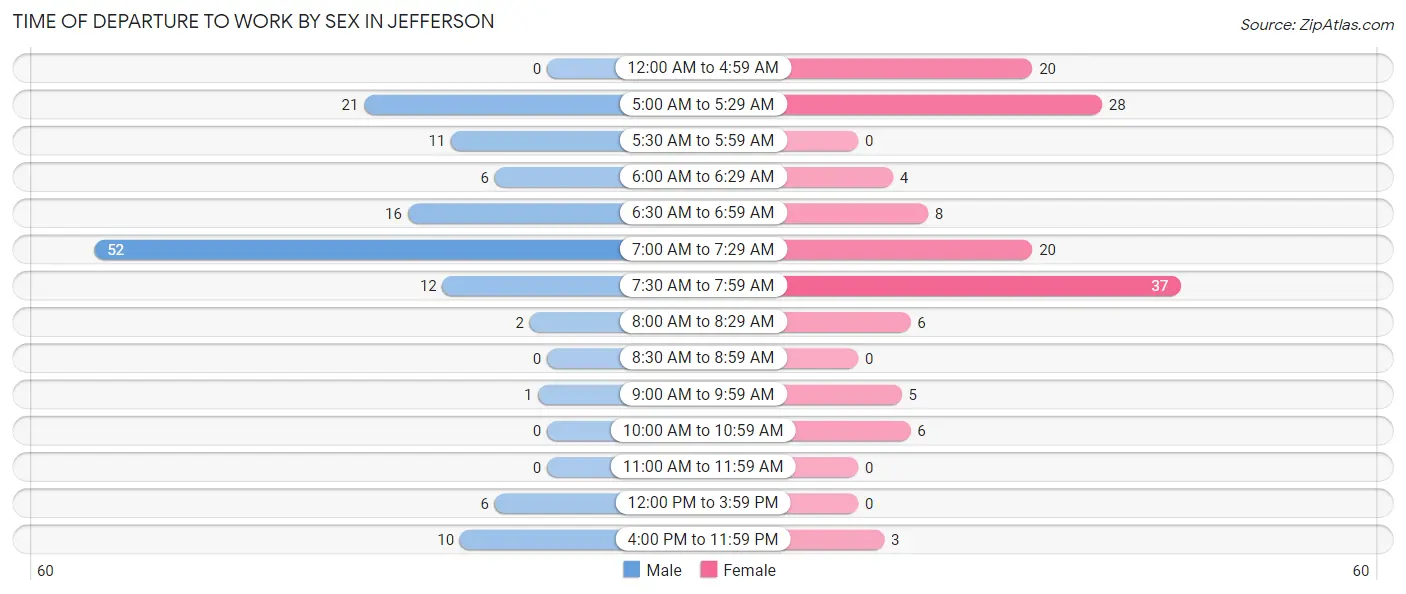
Time of Departure to Work by Sex in Jefferson
The most frequent times of departure to work in Jefferson are 7:00 AM to 7:29 AM (52, 38.0%) for males and 7:30 AM to 7:59 AM (37, 27.0%) for females.
| Time of Departure | Male | Female |
| 12:00 AM to 4:59 AM | 0 (0.0%) | 20 (14.6%) |
| 5:00 AM to 5:29 AM | 21 (15.3%) | 28 (20.4%) |
| 5:30 AM to 5:59 AM | 11 (8.0%) | 0 (0.0%) |
| 6:00 AM to 6:29 AM | 6 (4.4%) | 4 (2.9%) |
| 6:30 AM to 6:59 AM | 16 (11.7%) | 8 (5.8%) |
| 7:00 AM to 7:29 AM | 52 (38.0%) | 20 (14.6%) |
| 7:30 AM to 7:59 AM | 12 (8.8%) | 37 (27.0%) |
| 8:00 AM to 8:29 AM | 2 (1.5%) | 6 (4.4%) |
| 8:30 AM to 8:59 AM | 0 (0.0%) | 0 (0.0%) |
| 9:00 AM to 9:59 AM | 1 (0.7%) | 5 (3.6%) |
| 10:00 AM to 10:59 AM | 0 (0.0%) | 6 (4.4%) |
| 11:00 AM to 11:59 AM | 0 (0.0%) | 0 (0.0%) |
| 12:00 PM to 3:59 PM | 6 (4.4%) | 0 (0.0%) |
| 4:00 PM to 11:59 PM | 10 (7.3%) | 3 (2.2%) |
| Total | 137 (100.0%) | 137 (100.0%) |
Housing Occupancy in Jefferson
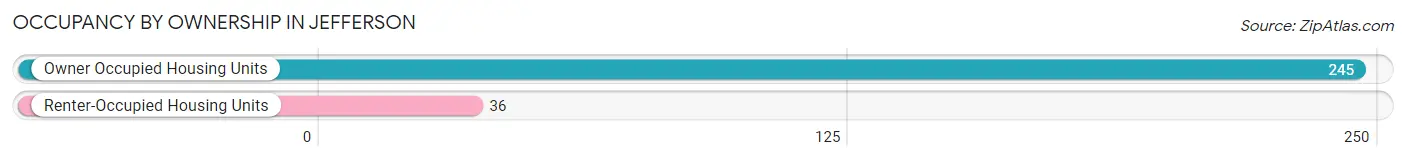
Occupancy by Ownership in Jefferson
Of the total 281 dwellings in Jefferson, owner-occupied units account for 245 (87.2%), while renter-occupied units make up 36 (12.8%).
| Occupancy | # Housing Units | % Housing Units |
| Owner Occupied Housing Units | 245 | 87.2% |
| Renter-Occupied Housing Units | 36 | 12.8% |
| Total Occupied Housing Units | 281 | 100.0% |
Occupancy by Household Size in Jefferson
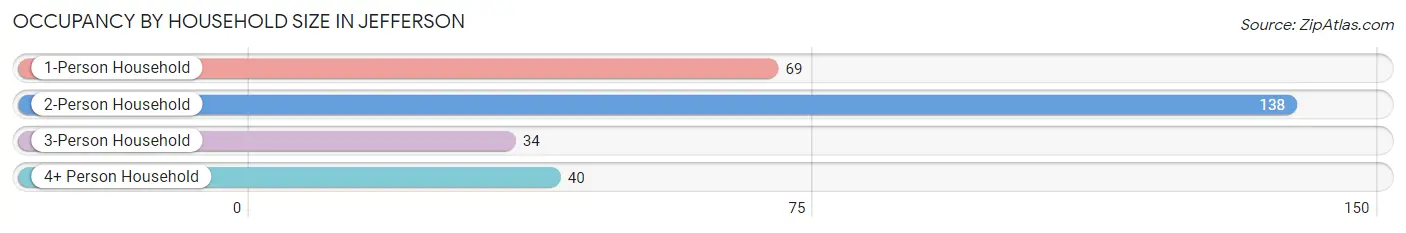
| Household Size | # Housing Units | % Housing Units |
| 1-Person Household | 69 | 24.6% |
| 2-Person Household | 138 | 49.1% |
| 3-Person Household | 34 | 12.1% |
| 4+ Person Household | 40 | 14.2% |
| Total Housing Units | 281 | 100.0% |
Occupancy by Ownership by Household Size in Jefferson
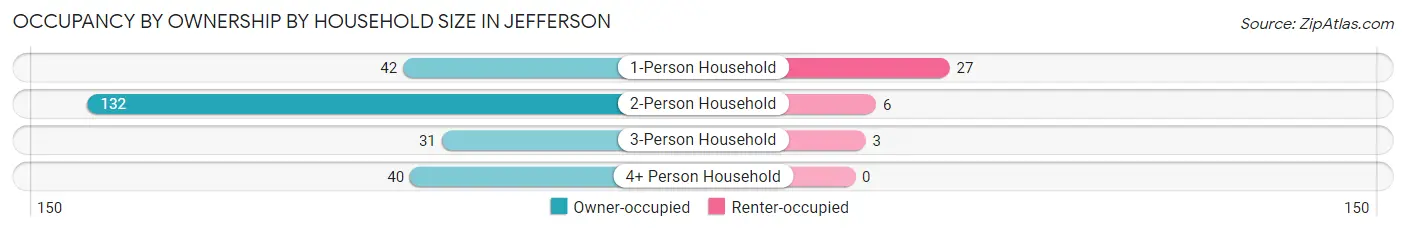
| Household Size | Owner-occupied | Renter-occupied |
| 1-Person Household | 42 (60.9%) | 27 (39.1%) |
| 2-Person Household | 132 (95.7%) | 6 (4.3%) |
| 3-Person Household | 31 (91.2%) | 3 (8.8%) |
| 4+ Person Household | 40 (100.0%) | 0 (0.0%) |
| Total Housing Units | 245 (87.2%) | 36 (12.8%) |
Occupancy by Educational Attainment in Jefferson
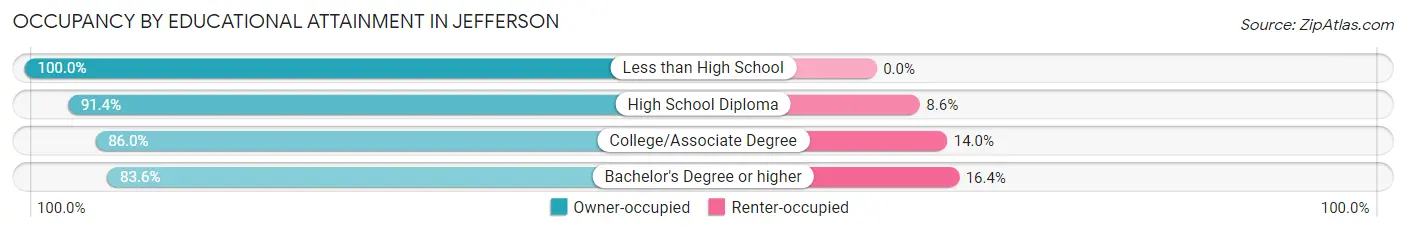
| Household Size | Owner-occupied | Renter-occupied |
| Less than High School | 6 (100.0%) | 0 (0.0%) |
| High School Diploma | 64 (91.4%) | 6 (8.6%) |
| College/Associate Degree | 129 (86.0%) | 21 (14.0%) |
| Bachelor's Degree or higher | 46 (83.6%) | 9 (16.4%) |
Occupancy by Age of Householder in Jefferson
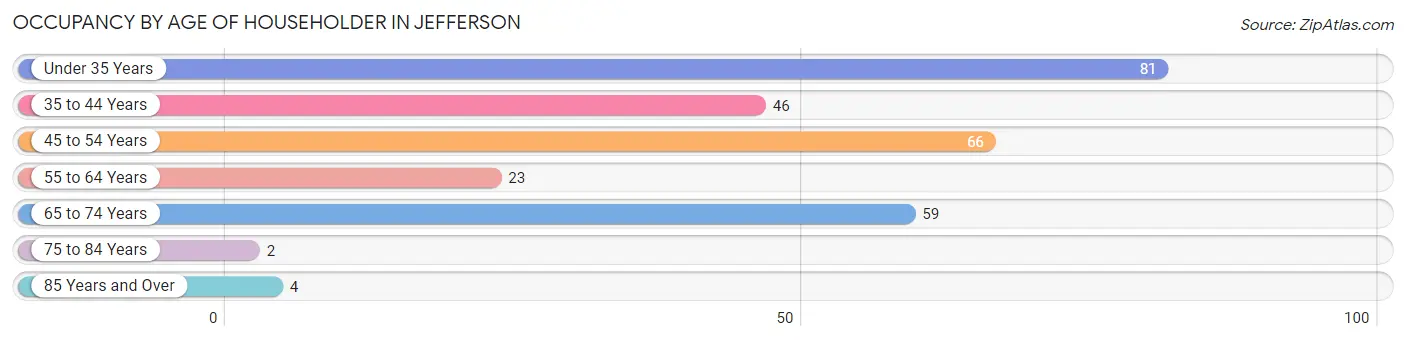
| Age Bracket | # Households | % Households |
| Under 35 Years | 81 | 28.8% |
| 35 to 44 Years | 46 | 16.4% |
| 45 to 54 Years | 66 | 23.5% |
| 55 to 64 Years | 23 | 8.2% |
| 65 to 74 Years | 59 | 21.0% |
| 75 to 84 Years | 2 | 0.7% |
| 85 Years and Over | 4 | 1.4% |
| Total | 281 | 100.0% |
Housing Finances in Jefferson
Median Income by Occupancy in Jefferson
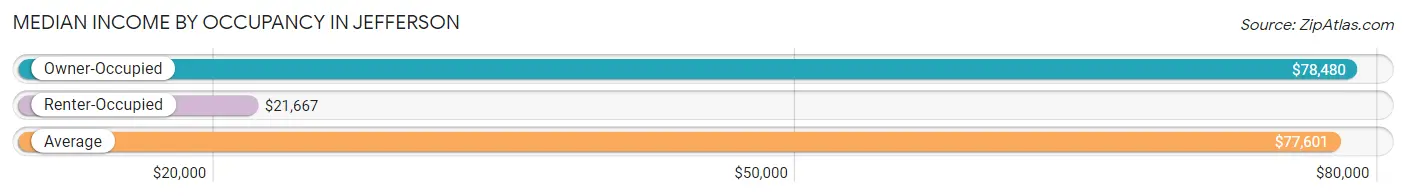
| Occupancy Type | # Households | Median Income |
| Owner-Occupied | 245 (87.2%) | $78,480 |
| Renter-Occupied | 36 (12.8%) | $21,667 |
| Average | 281 (100.0%) | $77,601 |
Occupancy by Householder Income Bracket in Jefferson
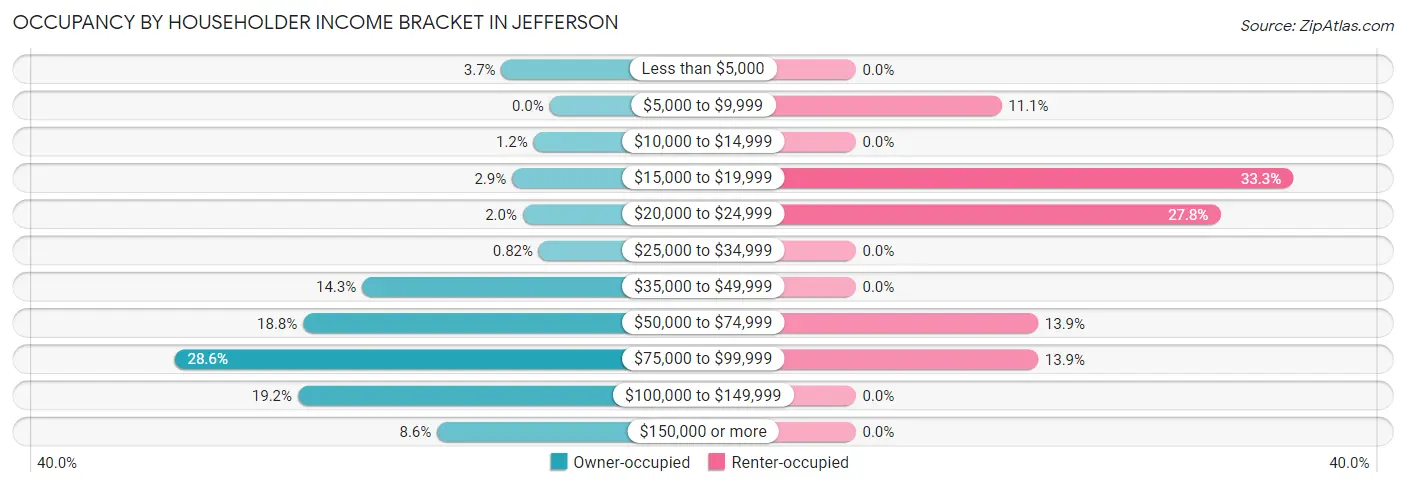
| Income Bracket | Owner-occupied | Renter-occupied |
| Less than $5,000 | 9 (3.7%) | 0 (0.0%) |
| $5,000 to $9,999 | 0 (0.0%) | 4 (11.1%) |
| $10,000 to $14,999 | 3 (1.2%) | 0 (0.0%) |
| $15,000 to $19,999 | 7 (2.9%) | 12 (33.3%) |
| $20,000 to $24,999 | 5 (2.0%) | 10 (27.8%) |
| $25,000 to $34,999 | 2 (0.8%) | 0 (0.0%) |
| $35,000 to $49,999 | 35 (14.3%) | 0 (0.0%) |
| $50,000 to $74,999 | 46 (18.8%) | 5 (13.9%) |
| $75,000 to $99,999 | 70 (28.6%) | 5 (13.9%) |
| $100,000 to $149,999 | 47 (19.2%) | 0 (0.0%) |
| $150,000 or more | 21 (8.6%) | 0 (0.0%) |
| Total | 245 (100.0%) | 36 (100.0%) |
Monthly Housing Cost Tiers in Jefferson
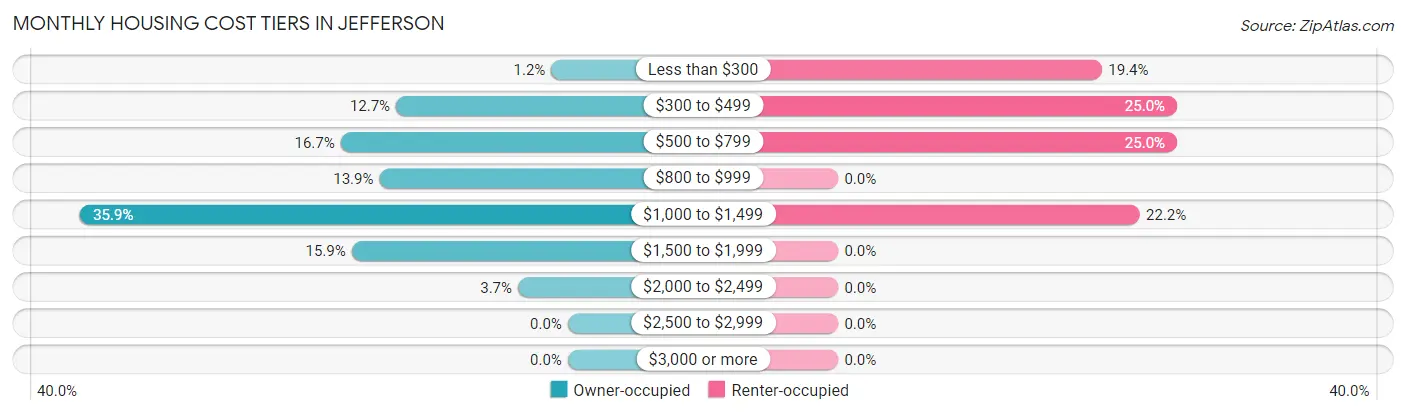
| Monthly Cost | Owner-occupied | Renter-occupied |
| Less than $300 | 3 (1.2%) | 7 (19.4%) |
| $300 to $499 | 31 (12.7%) | 9 (25.0%) |
| $500 to $799 | 41 (16.7%) | 9 (25.0%) |
| $800 to $999 | 34 (13.9%) | 0 (0.0%) |
| $1,000 to $1,499 | 88 (35.9%) | 8 (22.2%) |
| $1,500 to $1,999 | 39 (15.9%) | 0 (0.0%) |
| $2,000 to $2,499 | 9 (3.7%) | 0 (0.0%) |
| $2,500 to $2,999 | 0 (0.0%) | 0 (0.0%) |
| $3,000 or more | 0 (0.0%) | 0 (0.0%) |
| Total | 245 (100.0%) | 36 (100.0%) |
Physical Housing Characteristics in Jefferson
Housing Structures in Jefferson
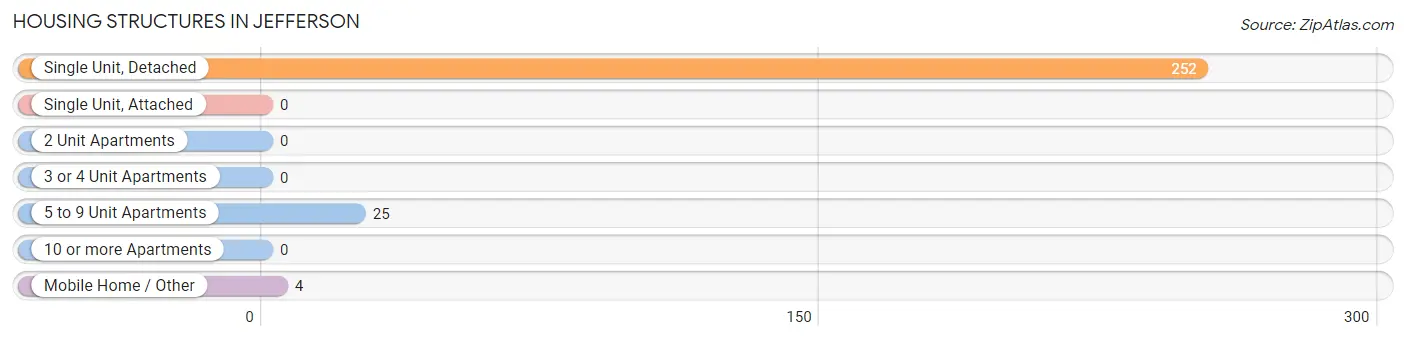
| Structure Type | # Housing Units | % Housing Units |
| Single Unit, Detached | 252 | 89.7% |
| Single Unit, Attached | 0 | 0.0% |
| 2 Unit Apartments | 0 | 0.0% |
| 3 or 4 Unit Apartments | 0 | 0.0% |
| 5 to 9 Unit Apartments | 25 | 8.9% |
| 10 or more Apartments | 0 | 0.0% |
| Mobile Home / Other | 4 | 1.4% |
| Total | 281 | 100.0% |
Housing Structures by Occupancy in Jefferson
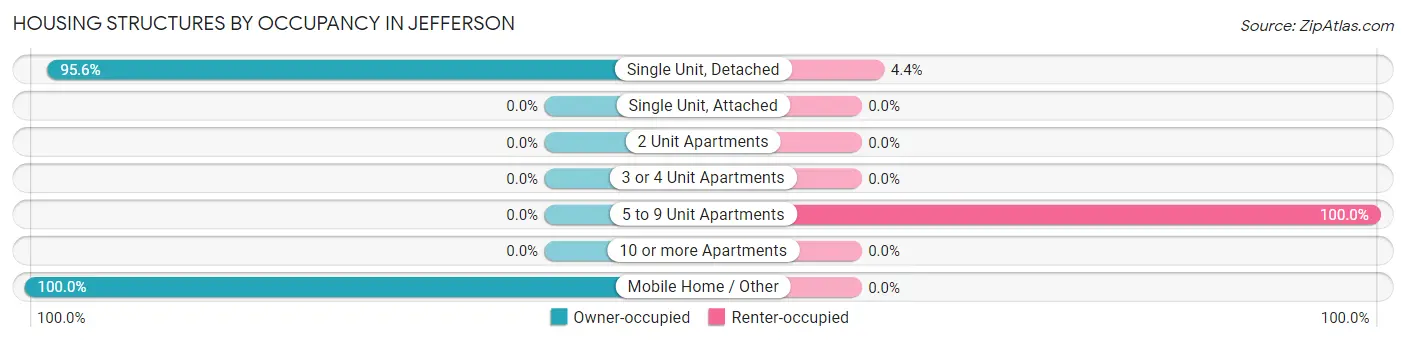
| Structure Type | Owner-occupied | Renter-occupied |
| Single Unit, Detached | 241 (95.6%) | 11 (4.4%) |
| Single Unit, Attached | 0 (0.0%) | 0 (0.0%) |
| 2 Unit Apartments | 0 (0.0%) | 0 (0.0%) |
| 3 or 4 Unit Apartments | 0 (0.0%) | 0 (0.0%) |
| 5 to 9 Unit Apartments | 0 (0.0%) | 25 (100.0%) |
| 10 or more Apartments | 0 (0.0%) | 0 (0.0%) |
| Mobile Home / Other | 4 (100.0%) | 0 (0.0%) |
| Total | 245 (87.2%) | 36 (12.8%) |
Housing Structures by Number of Rooms in Jefferson
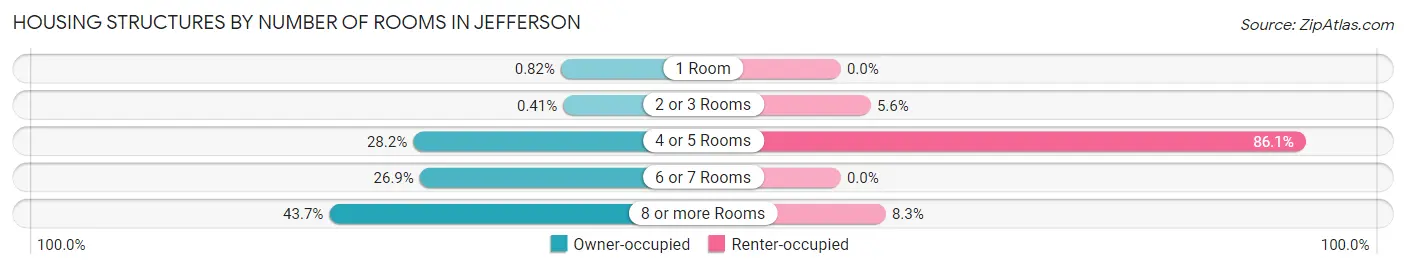
| Number of Rooms | Owner-occupied | Renter-occupied |
| 1 Room | 2 (0.8%) | 0 (0.0%) |
| 2 or 3 Rooms | 1 (0.4%) | 2 (5.6%) |
| 4 or 5 Rooms | 69 (28.2%) | 31 (86.1%) |
| 6 or 7 Rooms | 66 (26.9%) | 0 (0.0%) |
| 8 or more Rooms | 107 (43.7%) | 3 (8.3%) |
| Total | 245 (100.0%) | 36 (100.0%) |
Housing Structure by Heating Type in Jefferson
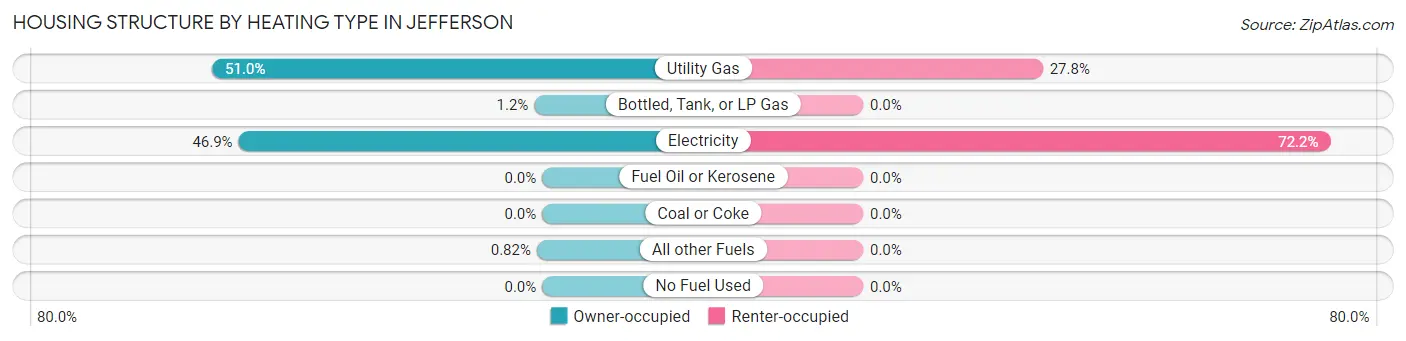
| Heating Type | Owner-occupied | Renter-occupied |
| Utility Gas | 125 (51.0%) | 10 (27.8%) |
| Bottled, Tank, or LP Gas | 3 (1.2%) | 0 (0.0%) |
| Electricity | 115 (46.9%) | 26 (72.2%) |
| Fuel Oil or Kerosene | 0 (0.0%) | 0 (0.0%) |
| Coal or Coke | 0 (0.0%) | 0 (0.0%) |
| All other Fuels | 2 (0.8%) | 0 (0.0%) |
| No Fuel Used | 0 (0.0%) | 0 (0.0%) |
| Total | 245 (100.0%) | 36 (100.0%) |
Household Vehicle Usage in Jefferson
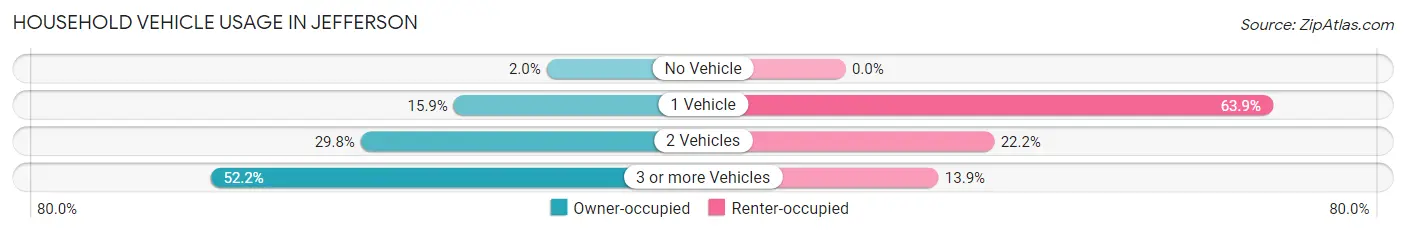
| Vehicles per Household | Owner-occupied | Renter-occupied |
| No Vehicle | 5 (2.0%) | 0 (0.0%) |
| 1 Vehicle | 39 (15.9%) | 23 (63.9%) |
| 2 Vehicles | 73 (29.8%) | 8 (22.2%) |
| 3 or more Vehicles | 128 (52.2%) | 5 (13.9%) |
| Total | 245 (100.0%) | 36 (100.0%) |
Real Estate & Mortgages in Jefferson
Real Estate and Mortgage Overview in Jefferson
| Characteristic | Without Mortgage | With Mortgage |
| Housing Units | 80 | 165 |
| Median Property Value | $183,000 | $161,700 |
| Median Household Income | $45,208 | $9 |
| Monthly Housing Costs | $521 | $0 |
| Real Estate Taxes | $1,926 | $0 |
Property Value by Mortgage Status in Jefferson
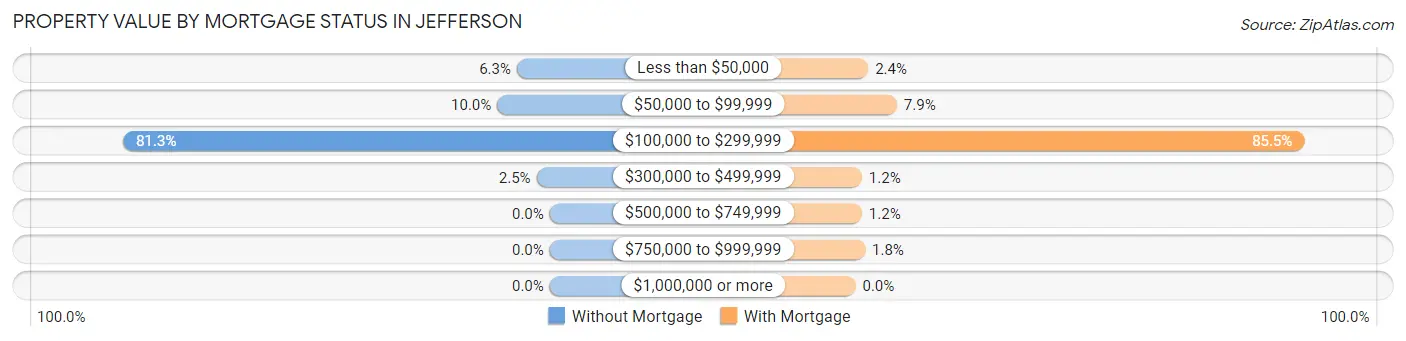
| Property Value | Without Mortgage | With Mortgage |
| Less than $50,000 | 5 (6.2%) | 4 (2.4%) |
| $50,000 to $99,999 | 8 (10.0%) | 13 (7.9%) |
| $100,000 to $299,999 | 65 (81.2%) | 141 (85.5%) |
| $300,000 to $499,999 | 2 (2.5%) | 2 (1.2%) |
| $500,000 to $749,999 | 0 (0.0%) | 2 (1.2%) |
| $750,000 to $999,999 | 0 (0.0%) | 3 (1.8%) |
| $1,000,000 or more | 0 (0.0%) | 0 (0.0%) |
| Total | 80 (100.0%) | 165 (100.0%) |
Household Income by Mortgage Status in Jefferson
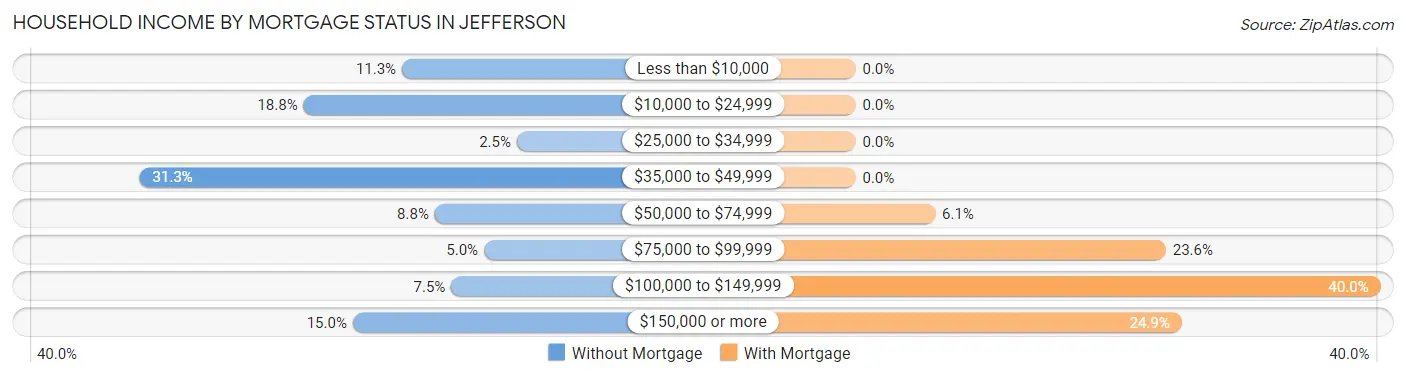
| Household Income | Without Mortgage | With Mortgage |
| Less than $10,000 | 9 (11.3%) | 0 (0.0%) |
| $10,000 to $24,999 | 15 (18.8%) | 0 (0.0%) |
| $25,000 to $34,999 | 2 (2.5%) | 0 (0.0%) |
| $35,000 to $49,999 | 25 (31.2%) | 0 (0.0%) |
| $50,000 to $74,999 | 7 (8.7%) | 10 (6.1%) |
| $75,000 to $99,999 | 4 (5.0%) | 39 (23.6%) |
| $100,000 to $149,999 | 6 (7.5%) | 66 (40.0%) |
| $150,000 or more | 12 (15.0%) | 41 (24.8%) |
| Total | 80 (100.0%) | 165 (100.0%) |
Property Value to Household Income Ratio in Jefferson
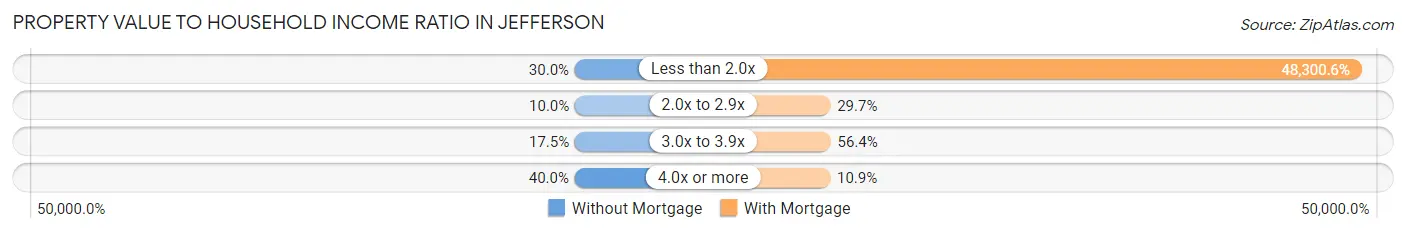
| Value-to-Income Ratio | Without Mortgage | With Mortgage |
| Less than 2.0x | 24 (30.0%) | 79,696 (48,300.6%) |
| 2.0x to 2.9x | 8 (10.0%) | 49 (29.7%) |
| 3.0x to 3.9x | 14 (17.5%) | 93 (56.4%) |
| 4.0x or more | 32 (40.0%) | 18 (10.9%) |
| Total | 80 (100.0%) | 165 (100.0%) |
Real Estate Taxes by Mortgage Status in Jefferson
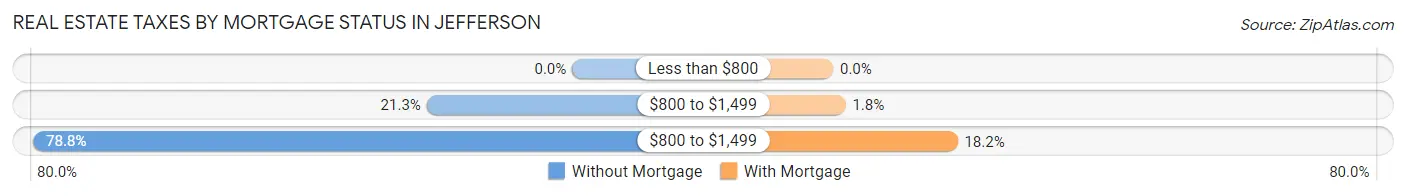
| Property Taxes | Without Mortgage | With Mortgage |
| Less than $800 | 0 (0.0%) | 0 (0.0%) |
| $800 to $1,499 | 17 (21.2%) | 3 (1.8%) |
| $800 to $1,499 | 63 (78.7%) | 30 (18.2%) |
| Total | 80 (100.0%) | 165 (100.0%) |
Health & Disability in Jefferson
Health Insurance Coverage by Age in Jefferson
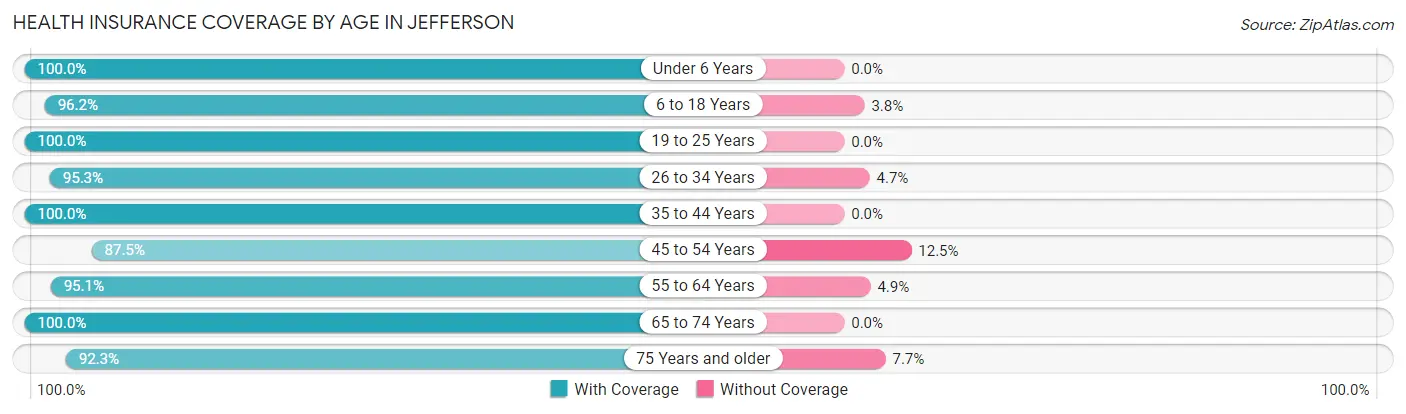
| Age Bracket | With Coverage | Without Coverage |
| Under 6 Years | 26 (100.0%) | 0 (0.0%) |
| 6 to 18 Years | 128 (96.2%) | 5 (3.8%) |
| 19 to 25 Years | 20 (100.0%) | 0 (0.0%) |
| 26 to 34 Years | 121 (95.3%) | 6 (4.7%) |
| 35 to 44 Years | 72 (100.0%) | 0 (0.0%) |
| 45 to 54 Years | 91 (87.5%) | 13 (12.5%) |
| 55 to 64 Years | 39 (95.1%) | 2 (4.9%) |
| 65 to 74 Years | 94 (100.0%) | 0 (0.0%) |
| 75 Years and older | 12 (92.3%) | 1 (7.7%) |
| Total | 603 (95.7%) | 27 (4.3%) |
Health Insurance Coverage by Citizenship Status in Jefferson
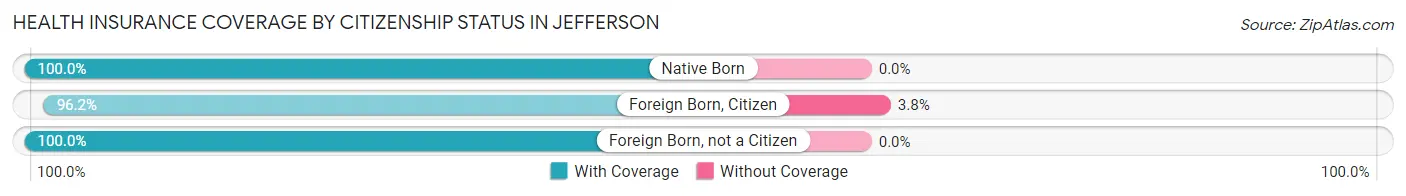
| Citizenship Status | With Coverage | Without Coverage |
| Native Born | 26 (100.0%) | 0 (0.0%) |
| Foreign Born, Citizen | 128 (96.2%) | 5 (3.8%) |
| Foreign Born, not a Citizen | 20 (100.0%) | 0 (0.0%) |
Health Insurance Coverage by Household Income in Jefferson
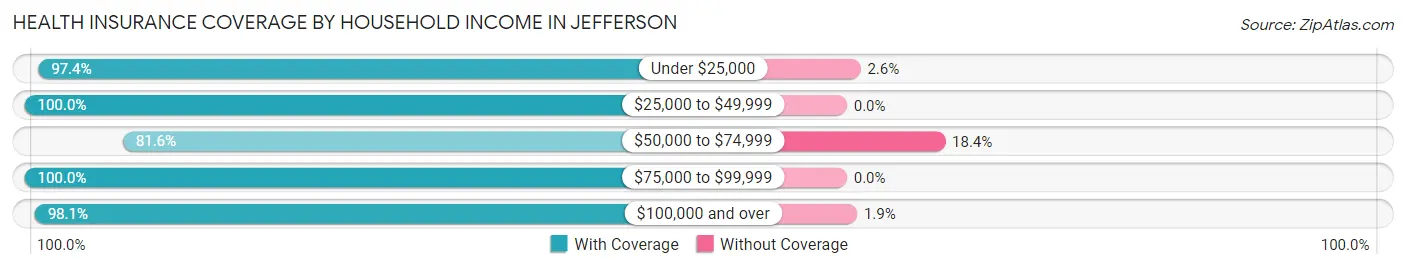
| Household Income | With Coverage | Without Coverage |
| Under $25,000 | 76 (97.4%) | 2 (2.6%) |
| $25,000 to $49,999 | 79 (100.0%) | 0 (0.0%) |
| $50,000 to $74,999 | 93 (81.6%) | 21 (18.4%) |
| $75,000 to $99,999 | 149 (100.0%) | 0 (0.0%) |
| $100,000 and over | 206 (98.1%) | 4 (1.9%) |
Public vs Private Health Insurance Coverage by Age in Jefferson
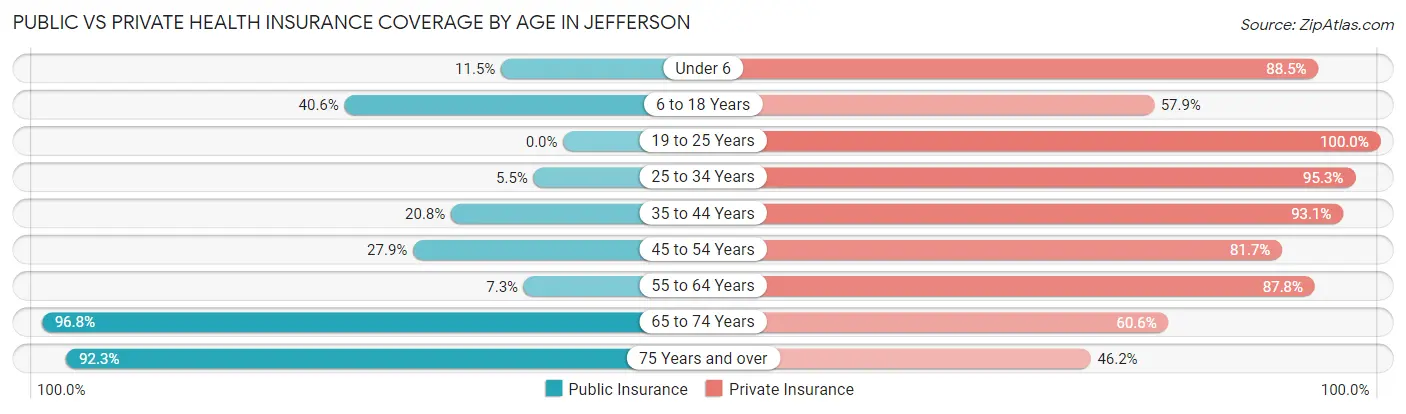
| Age Bracket | Public Insurance | Private Insurance |
| Under 6 | 3 (11.5%) | 23 (88.5%) |
| 6 to 18 Years | 54 (40.6%) | 77 (57.9%) |
| 19 to 25 Years | 0 (0.0%) | 20 (100.0%) |
| 25 to 34 Years | 7 (5.5%) | 121 (95.3%) |
| 35 to 44 Years | 15 (20.8%) | 67 (93.1%) |
| 45 to 54 Years | 29 (27.9%) | 85 (81.7%) |
| 55 to 64 Years | 3 (7.3%) | 36 (87.8%) |
| 65 to 74 Years | 91 (96.8%) | 57 (60.6%) |
| 75 Years and over | 12 (92.3%) | 6 (46.2%) |
| Total | 214 (34.0%) | 492 (78.1%) |
Disability Status by Sex by Age in Jefferson
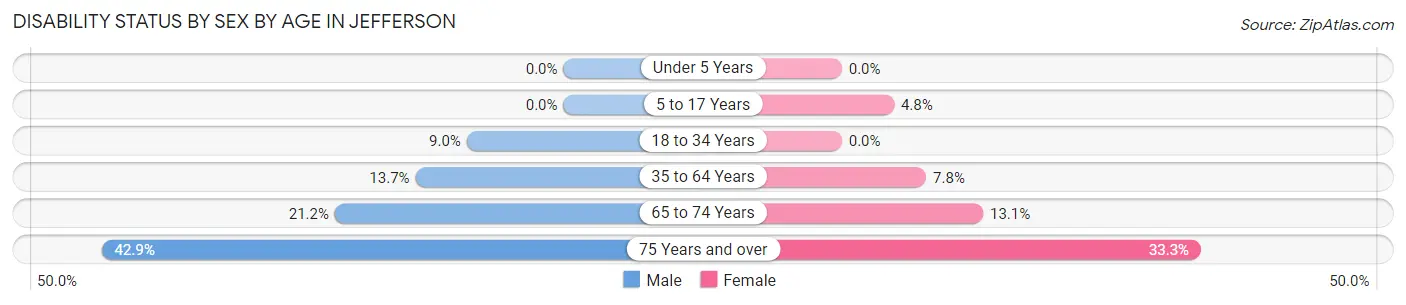
| Age Bracket | Male | Female |
| Under 5 Years | 0 (0.0%) | 0 (0.0%) |
| 5 to 17 Years | 0 (0.0%) | 3 (4.8%) |
| 18 to 34 Years | 7 (9.0%) | 0 (0.0%) |
| 35 to 64 Years | 14 (13.7%) | 9 (7.8%) |
| 65 to 74 Years | 7 (21.2%) | 8 (13.1%) |
| 75 Years and over | 3 (42.9%) | 2 (33.3%) |
Disability Class by Sex by Age in Jefferson
Disability Class: Hearing Difficulty
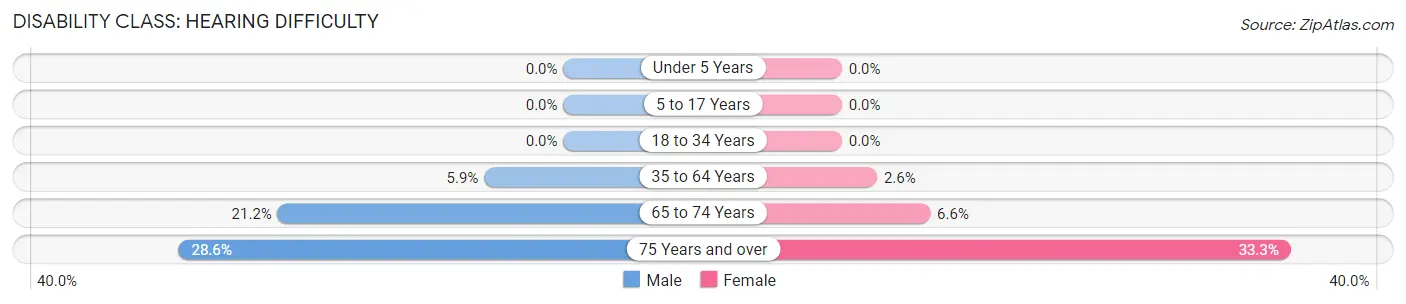
| Age Bracket | Male | Female |
| Under 5 Years | 0 (0.0%) | 0 (0.0%) |
| 5 to 17 Years | 0 (0.0%) | 0 (0.0%) |
| 18 to 34 Years | 0 (0.0%) | 0 (0.0%) |
| 35 to 64 Years | 6 (5.9%) | 3 (2.6%) |
| 65 to 74 Years | 7 (21.2%) | 4 (6.6%) |
| 75 Years and over | 2 (28.6%) | 2 (33.3%) |
Disability Class: Vision Difficulty
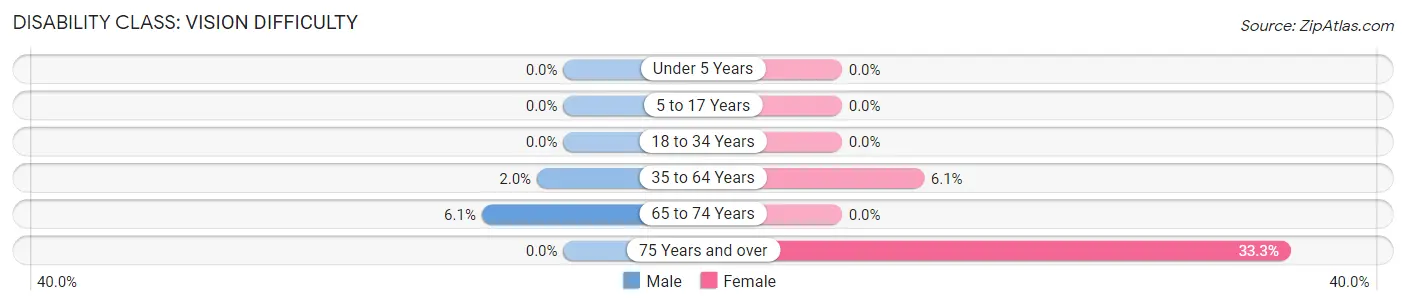
| Age Bracket | Male | Female |
| Under 5 Years | 0 (0.0%) | 0 (0.0%) |
| 5 to 17 Years | 0 (0.0%) | 0 (0.0%) |
| 18 to 34 Years | 0 (0.0%) | 0 (0.0%) |
| 35 to 64 Years | 2 (2.0%) | 7 (6.1%) |
| 65 to 74 Years | 2 (6.1%) | 0 (0.0%) |
| 75 Years and over | 0 (0.0%) | 2 (33.3%) |
Disability Class: Cognitive Difficulty
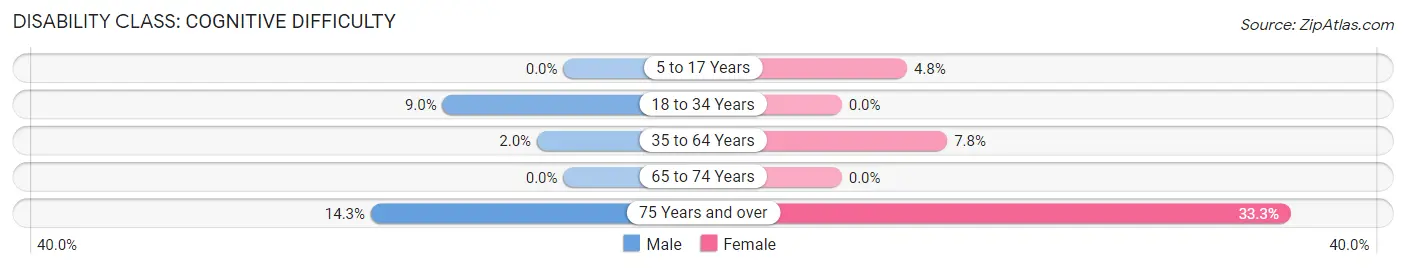
| Age Bracket | Male | Female |
| 5 to 17 Years | 0 (0.0%) | 3 (4.8%) |
| 18 to 34 Years | 7 (9.0%) | 0 (0.0%) |
| 35 to 64 Years | 2 (2.0%) | 9 (7.8%) |
| 65 to 74 Years | 0 (0.0%) | 0 (0.0%) |
| 75 Years and over | 1 (14.3%) | 2 (33.3%) |
Disability Class: Ambulatory Difficulty
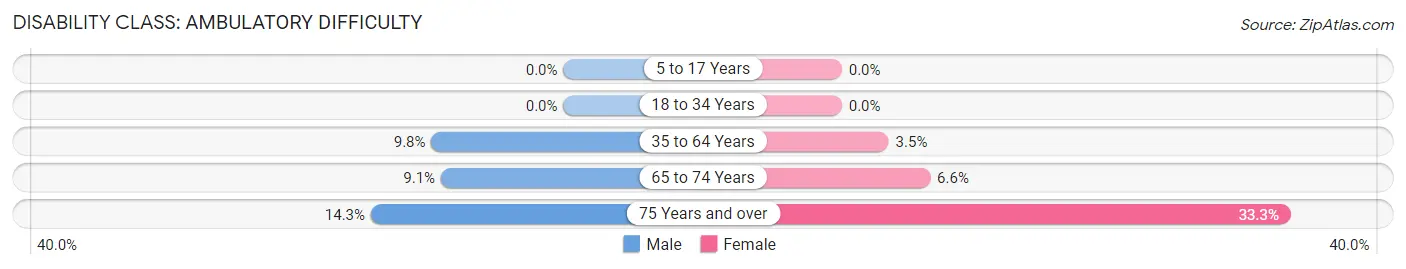
| Age Bracket | Male | Female |
| 5 to 17 Years | 0 (0.0%) | 0 (0.0%) |
| 18 to 34 Years | 0 (0.0%) | 0 (0.0%) |
| 35 to 64 Years | 10 (9.8%) | 4 (3.5%) |
| 65 to 74 Years | 3 (9.1%) | 4 (6.6%) |
| 75 Years and over | 1 (14.3%) | 2 (33.3%) |
Disability Class: Self-Care Difficulty
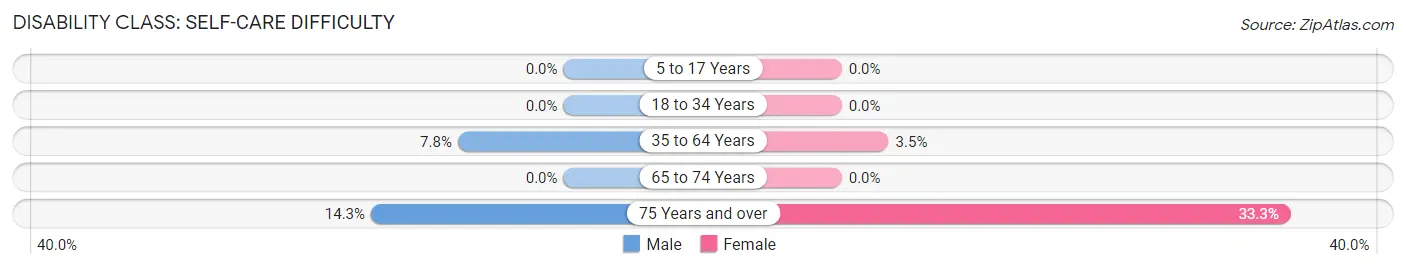
| Age Bracket | Male | Female |
| 5 to 17 Years | 0 (0.0%) | 0 (0.0%) |
| 18 to 34 Years | 0 (0.0%) | 0 (0.0%) |
| 35 to 64 Years | 8 (7.8%) | 4 (3.5%) |
| 65 to 74 Years | 0 (0.0%) | 0 (0.0%) |
| 75 Years and over | 1 (14.3%) | 2 (33.3%) |
Technology Access in Jefferson
Computing Device Access in Jefferson
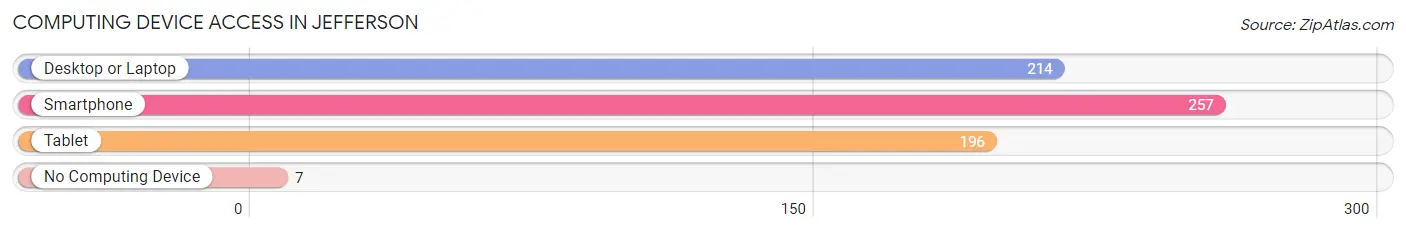
| Device Type | # Households | % Households |
| Desktop or Laptop | 214 | 76.2% |
| Smartphone | 257 | 91.5% |
| Tablet | 196 | 69.8% |
| No Computing Device | 7 | 2.5% |
| Total | 281 | 100.0% |
Internet Access in Jefferson
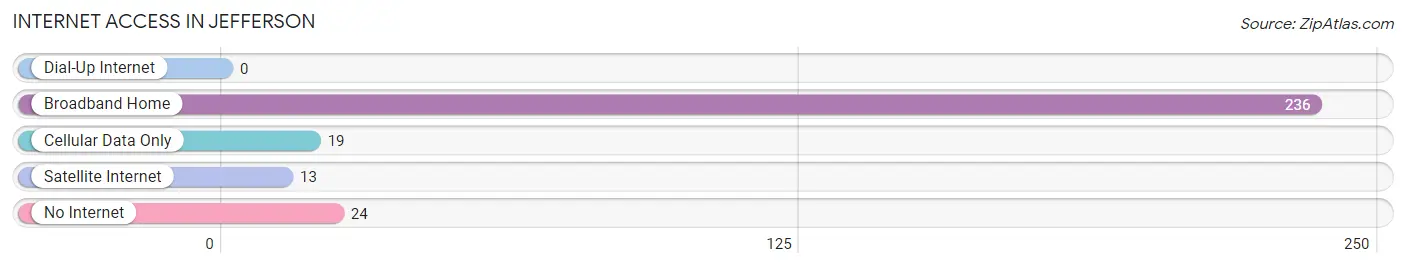
| Internet Type | # Households | % Households |
| Dial-Up Internet | 0 | 0.0% |
| Broadband Home | 236 | 84.0% |
| Cellular Data Only | 19 | 6.8% |
| Satellite Internet | 13 | 4.6% |
| No Internet | 24 | 8.5% |
| Total | 281 | 100.0% |
Jefferson Summary
Jefferson, South Dakota is a small town located in the southeastern corner of the state. It is situated in the rolling hills of the Missouri River Valley, and is surrounded by the scenic beauty of the Black Hills. The town was founded in 1883 and has a population of approximately 1,000 people.
History
Jefferson was founded in 1883 by a group of settlers from Wisconsin. The town was named after Thomas Jefferson, the third president of the United States. The settlers were attracted to the area due to its fertile soil and abundant natural resources. The town quickly grew and by the early 1900s, it had become a thriving agricultural community.
In the early 1900s, the town was home to a variety of businesses, including a flour mill, a creamery, a blacksmith shop, and a general store. The town also had a school, a post office, and a bank.
In the 1920s, the town experienced a period of growth and prosperity. The population increased from 500 to 1,000 people, and the town was home to a variety of businesses, including a hotel, a movie theater, and a variety of stores.
In the 1950s, the town experienced a period of decline. The population decreased to 500 people, and many of the businesses closed. The town was also affected by the construction of the Oahe Dam, which flooded much of the surrounding area.
Geography
Jefferson is located in the southeastern corner of South Dakota, in the rolling hills of the Missouri River Valley. The town is surrounded by the scenic beauty of the Black Hills. The town is located approximately 30 miles from the state capital of Pierre.
The town is situated at an elevation of 2,400 feet above sea level. The climate is semi-arid, with hot summers and cold winters. The average annual temperature is 48 degrees Fahrenheit.
Economy
The economy of Jefferson is largely based on agriculture. The town is home to a variety of farms, including cattle, sheep, and grain farms. The town is also home to a variety of businesses, including a grocery store, a hardware store, and a variety of restaurants.
The town is also home to a variety of manufacturing businesses, including a furniture factory and a metal fabrication plant. The town is also home to a variety of service businesses, including a bank, a post office, and a variety of professional services.
Demographics
As of the 2010 census, the population of Jefferson was 1,000 people. The racial makeup of the town was 97.2% White, 0.7% African American, 0.3% Native American, 0.2% Asian, and 1.6% from other races. The median household income was $37,500, and the median family income was $45,000.
The town is home to a variety of religious denominations, including Catholic, Lutheran, and Methodist. The town is also home to a variety of cultural organizations, including a library, a museum, and a theater.
Conclusion
Jefferson, South Dakota is a small town located in the southeastern corner of the state. It is situated in the rolling hills of the Missouri River Valley, and is surrounded by the scenic beauty of the Black Hills. The town was founded in 1883 and has a population of approximately 1,000 people. The economy of Jefferson is largely based on agriculture, and the town is home to a variety of businesses, including a grocery store, a hardware store, and a variety of restaurants. The town is also home to a variety of religious denominations, including Catholic, Lutheran, and Methodist. The town is also home to a variety of cultural organizations, including a library, a museum, and a theater.
Common Questions
What is Per Capita Income in Jefferson?
Per Capita income in Jefferson is $32,058.
What is the Median Family Income in Jefferson?
Median Family Income in Jefferson is $78,108.
What is the Median Household income in Jefferson?
Median Household Income in Jefferson is $77,601.
What is Income or Wage Gap in Jefferson?
Income or Wage Gap in Jefferson is 33.5%.
Women in Jefferson earn 66.5 cents for every dollar earned by a man.
What is Inequality or Gini Index in Jefferson?
Inequality or Gini Index in Jefferson is 0.34.
What is the Total Population of Jefferson?
Total Population of Jefferson is 631.
What is the Total Male Population of Jefferson?
Total Male Population of Jefferson is 305.
What is the Total Female Population of Jefferson?
Total Female Population of Jefferson is 326.
What is the Ratio of Males per 100 Females in Jefferson?
There are 93.56 Males per 100 Females in Jefferson.
What is the Ratio of Females per 100 Males in Jefferson?
There are 106.89 Females per 100 Males in Jefferson.
What is the Median Population Age in Jefferson?
Median Population Age in Jefferson is 37.1 Years.
What is the Average Family Size in Jefferson
Average Family Size in Jefferson is 2.7 People.
What is the Average Household Size in Jefferson
Average Household Size in Jefferson is 2.2 People.
How Large is the Labor Force in Jefferson?
There are 352 People in the Labor Forcein in Jefferson.
What is the Percentage of People in the Labor Force in Jefferson?
72.4% of People are in the Labor Force in Jefferson.
What is the Unemployment Rate in Jefferson?
Unemployment Rate in Jefferson is 12.8%.