Antelope, SD Map & Demographics
Antelope Map
Antelope Overview
$10,266
PER CAPITA INCOME
$17,946
AVG FAMILY INCOME
$17,622
AVG HOUSEHOLD INCOME
0.58
INEQUALITY / GINI INDEX
701
TOTAL POPULATION
409
MALE POPULATION
292
FEMALE POPULATION
140.07
MALES / 100 FEMALES
71.39
FEMALES / 100 MALES
30.8
MEDIAN AGE
4.3
AVG FAMILY SIZE
3.5
AVG HOUSEHOLD SIZE
142
LABOR FORCE [ PEOPLE ]
29.6%
PERCENT IN LABOR FORCE
21.1%
UNEMPLOYMENT RATE
Income in Antelope
Income Overview in Antelope
Per Capita Income in Antelope is $10,266, while median incomes of families and households are $17,946 and $17,622 respectively.
| Characteristic | Number | Measure |
| Per Capita Income | 701 | $10,266 |
| Median Family Income | 147 | $17,946 |
| Mean Family Income | 147 | $36,079 |
| Median Household Income | 202 | $17,622 |
| Mean Household Income | 202 | $30,466 |
| Income Deficit | 147 | $0 |
| Wage / Income Gap (%) | 701 | 0.00% |
| Wage / Income Gap ($) | 701 | 100.00¢ per $1 |
| Gini / Inequality Index | 701 | 0.58 |
Earnings by Sex in Antelope
| Sex | Number | Average Earnings |
| Male | 79 (53.0%) | $0 |
| Female | 70 (47.0%) | $0 |
| Total | 149 (100.0%) | $0 |
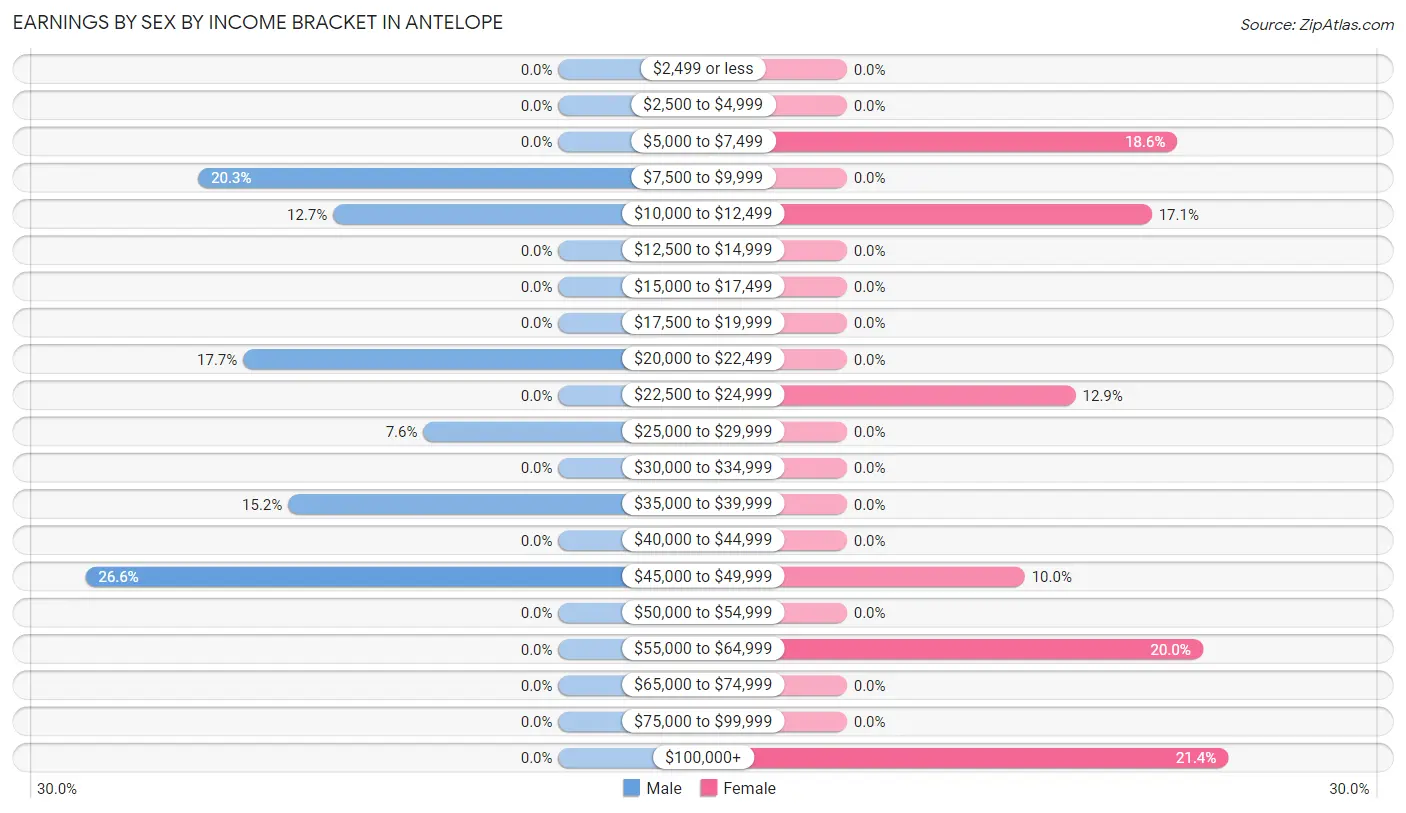
Earnings by Sex by Income Bracket in Antelope
The most common earnings brackets in Antelope are $45,000 to $49,999 for men (21 | 26.6%) and $100,000+ for women (15 | 21.4%).
| Income | Male | Female |
| $2,499 or less | 0 (0.0%) | 0 (0.0%) |
| $2,500 to $4,999 | 0 (0.0%) | 0 (0.0%) |
| $5,000 to $7,499 | 0 (0.0%) | 13 (18.6%) |
| $7,500 to $9,999 | 16 (20.3%) | 0 (0.0%) |
| $10,000 to $12,499 | 10 (12.7%) | 12 (17.1%) |
| $12,500 to $14,999 | 0 (0.0%) | 0 (0.0%) |
| $15,000 to $17,499 | 0 (0.0%) | 0 (0.0%) |
| $17,500 to $19,999 | 0 (0.0%) | 0 (0.0%) |
| $20,000 to $22,499 | 14 (17.7%) | 0 (0.0%) |
| $22,500 to $24,999 | 0 (0.0%) | 9 (12.9%) |
| $25,000 to $29,999 | 6 (7.6%) | 0 (0.0%) |
| $30,000 to $34,999 | 0 (0.0%) | 0 (0.0%) |
| $35,000 to $39,999 | 12 (15.2%) | 0 (0.0%) |
| $40,000 to $44,999 | 0 (0.0%) | 0 (0.0%) |
| $45,000 to $49,999 | 21 (26.6%) | 7 (10.0%) |
| $50,000 to $54,999 | 0 (0.0%) | 0 (0.0%) |
| $55,000 to $64,999 | 0 (0.0%) | 14 (20.0%) |
| $65,000 to $74,999 | 0 (0.0%) | 0 (0.0%) |
| $75,000 to $99,999 | 0 (0.0%) | 0 (0.0%) |
| $100,000+ | 0 (0.0%) | 15 (21.4%) |
| Total | 79 (100.0%) | 70 (100.0%) |
Earnings by Sex by Educational Attainment in Antelope
| Educational Attainment | Male Income | Female Income |
| Less than High School | - | - |
| High School Diploma | - | - |
| College or Associate's Degree | - | - |
| Bachelor's Degree | - | - |
| Graduate Degree | - | - |
| Total | - | - |
Family Income in Antelope
Family Income Brackets in Antelope
According to the Antelope family income data, there are 55 families falling into the less than $10,000 income range, which is the most common income bracket and makes up 37.4% of all families.
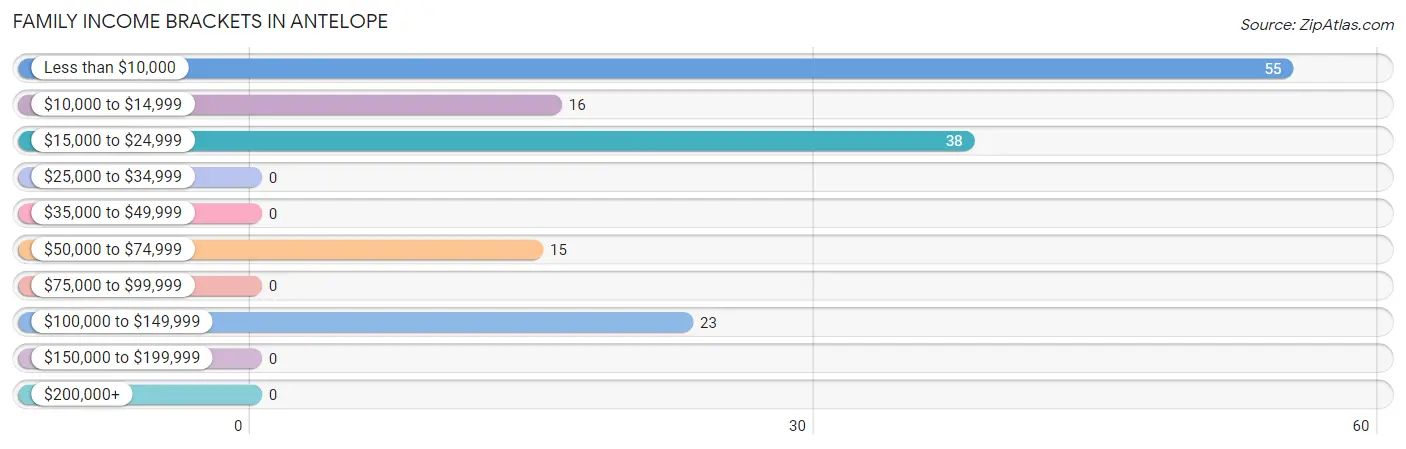
| Income Bracket | # Families | % Families |
| Less than $10,000 | 55 | 37.4% |
| $10,000 to $14,999 | 16 | 10.9% |
| $15,000 to $24,999 | 38 | 25.9% |
| $25,000 to $34,999 | 0 | 0.0% |
| $35,000 to $49,999 | 0 | 0.0% |
| $50,000 to $74,999 | 15 | 10.2% |
| $75,000 to $99,999 | 0 | 0.0% |
| $100,000 to $149,999 | 23 | 15.6% |
| $150,000 to $199,999 | 0 | 0.0% |
| $200,000+ | 0 | 0.0% |
Family Income by Famaliy Size in Antelope
2-person families (46 | 31.3%) account for the highest median family income in Antelope with $17,500 per family, while 2-person families (46 | 31.3%) have the highest median income of $8,750 per family member.
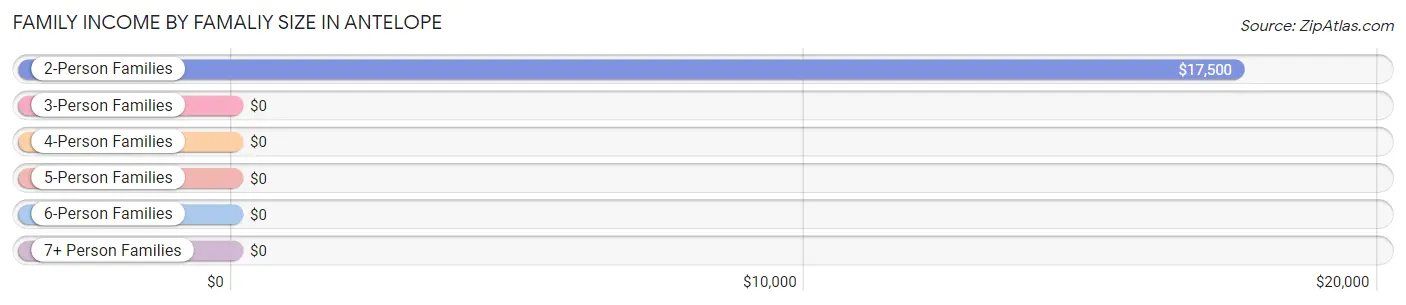
| Income Bracket | # Families | Median Income |
| 2-Person Families | 46 (31.3%) | $17,500 |
| 3-Person Families | 38 (25.9%) | $0 |
| 4-Person Families | 20 (13.6%) | $0 |
| 5-Person Families | 11 (7.5%) | $0 |
| 6-Person Families | 22 (15.0%) | $0 |
| 7+ Person Families | 10 (6.8%) | $0 |
| Total | 147 (100.0%) | $17,946 |
Family Income by Number of Earners in Antelope
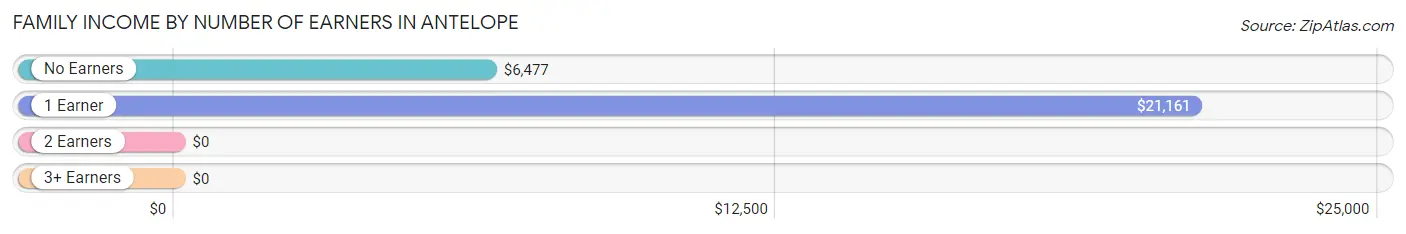
| Number of Earners | # Families | Median Income |
| No Earners | 69 (46.9%) | $6,477 |
| 1 Earner | 45 (30.6%) | $21,161 |
| 2 Earners | 19 (12.9%) | $0 |
| 3+ Earners | 14 (9.5%) | $0 |
| Total | 147 (100.0%) | $17,946 |
Household Income in Antelope
Household Income Brackets in Antelope
With 76 households falling in the category, the $15,000 to $24,999 income range is the most frequent in Antelope, accounting for 37.6% of all households.
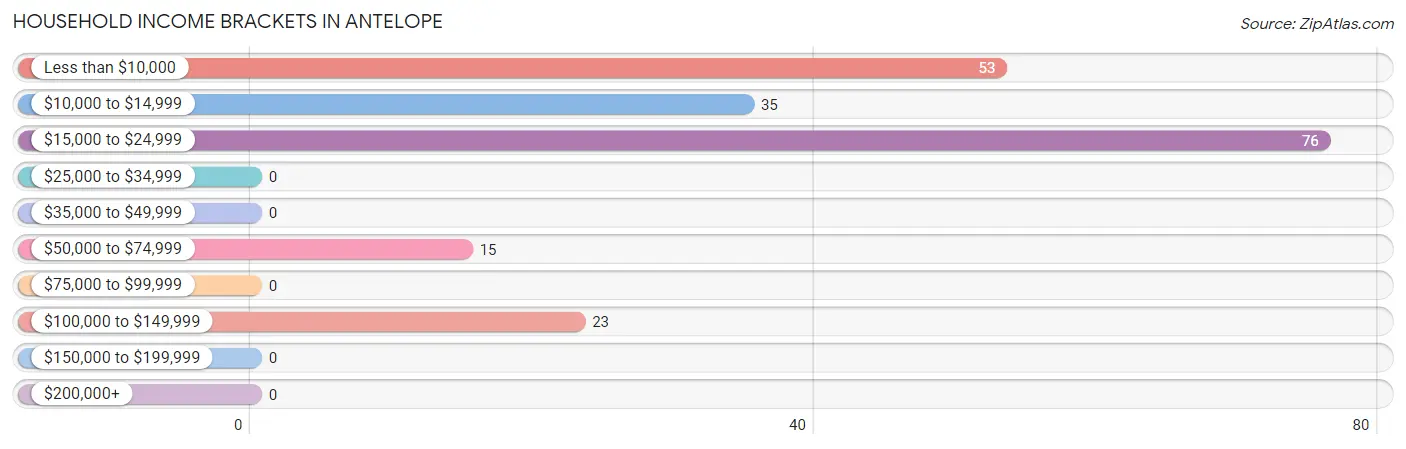
| Income Bracket | # Households | % Households |
| Less than $10,000 | 53 | 26.2% |
| $10,000 to $14,999 | 35 | 17.3% |
| $15,000 to $24,999 | 76 | 37.6% |
| $25,000 to $34,999 | 0 | 0.0% |
| $35,000 to $49,999 | 0 | 0.0% |
| $50,000 to $74,999 | 15 | 7.4% |
| $75,000 to $99,999 | 0 | 0.0% |
| $100,000 to $149,999 | 23 | 11.4% |
| $150,000 to $199,999 | 0 | 0.0% |
| $200,000+ | 0 | 0.0% |
Household Income by Householder Age in Antelope
The median household income in Antelope is $17,622, with the highest median household income of $18,235 found in the 65+ years age bracket for the primary householder. A total of 40 households (19.8%) fall into this category.
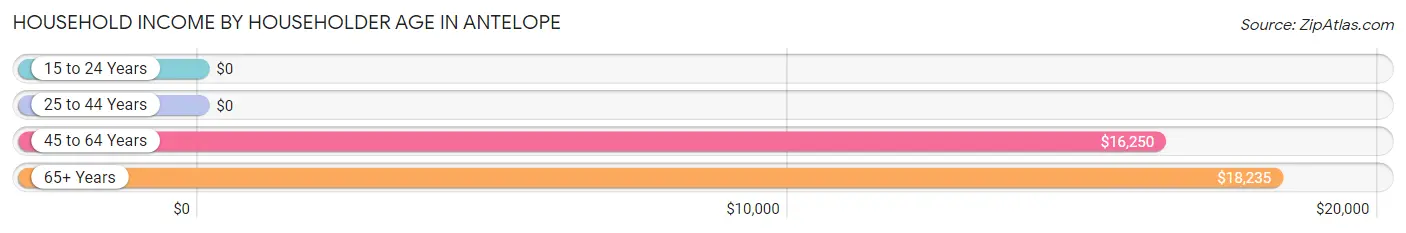
| Income Bracket | # Households | Median Income |
| 15 to 24 Years | 0 (0.0%) | $0 |
| 25 to 44 Years | 86 (42.6%) | $0 |
| 45 to 64 Years | 76 (37.6%) | $16,250 |
| 65+ Years | 40 (19.8%) | $18,235 |
| Total | 202 (100.0%) | $17,622 |
Poverty in Antelope
Income Below Poverty by Sex and Age in Antelope
With 70.9% poverty level for males and 65.1% for females among the residents of Antelope, under 5 year old males and under 5 year old females are the most vulnerable to poverty, with 33 males (100.0%) and 26 females (100.0%) in their respective age groups living below the poverty level.
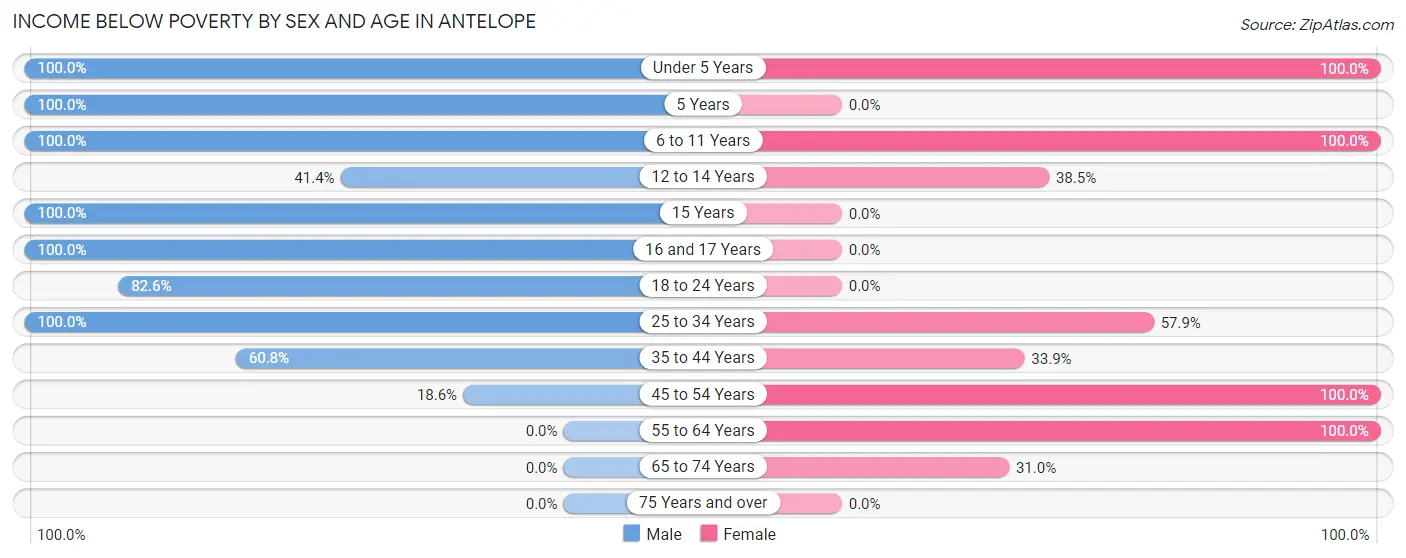
| Age Bracket | Male | Female |
| Under 5 Years | 33 (100.0%) | 26 (100.0%) |
| 5 Years | 10 (100.0%) | 0 (0.0%) |
| 6 to 11 Years | 62 (100.0%) | 37 (100.0%) |
| 12 to 14 Years | 12 (41.4%) | 5 (38.5%) |
| 15 Years | 11 (100.0%) | 0 (0.0%) |
| 16 and 17 Years | 41 (100.0%) | 0 (0.0%) |
| 18 to 24 Years | 38 (82.6%) | 0 (0.0%) |
| 25 to 34 Years | 10 (100.0%) | 33 (57.9%) |
| 35 to 44 Years | 62 (60.8%) | 20 (33.9%) |
| 45 to 54 Years | 11 (18.6%) | 43 (100.0%) |
| 55 to 64 Years | 0 (0.0%) | 17 (100.0%) |
| 65 to 74 Years | 0 (0.0%) | 9 (31.0%) |
| 75 Years and over | 0 (0.0%) | 0 (0.0%) |
| Total | 290 (70.9%) | 190 (65.1%) |
Income Above Poverty by Sex and Age in Antelope
According to the poverty statistics in Antelope, males aged 65 to 74 years and females aged 75 years and over are the age groups that are most secure financially, with 100.0% of males and 100.0% of females in these age groups living above the poverty line.
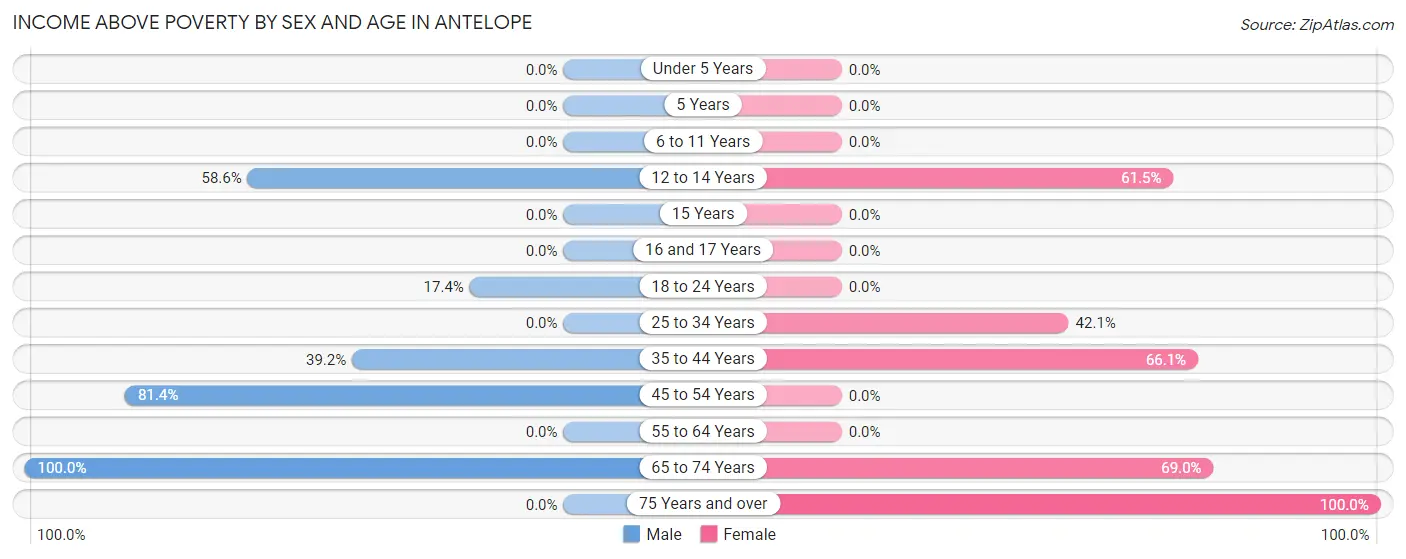
| Age Bracket | Male | Female |
| Under 5 Years | 0 (0.0%) | 0 (0.0%) |
| 5 Years | 0 (0.0%) | 0 (0.0%) |
| 6 to 11 Years | 0 (0.0%) | 0 (0.0%) |
| 12 to 14 Years | 17 (58.6%) | 8 (61.5%) |
| 15 Years | 0 (0.0%) | 0 (0.0%) |
| 16 and 17 Years | 0 (0.0%) | 0 (0.0%) |
| 18 to 24 Years | 8 (17.4%) | 0 (0.0%) |
| 25 to 34 Years | 0 (0.0%) | 24 (42.1%) |
| 35 to 44 Years | 40 (39.2%) | 39 (66.1%) |
| 45 to 54 Years | 48 (81.4%) | 0 (0.0%) |
| 55 to 64 Years | 0 (0.0%) | 0 (0.0%) |
| 65 to 74 Years | 6 (100.0%) | 20 (69.0%) |
| 75 Years and over | 0 (0.0%) | 11 (100.0%) |
| Total | 119 (29.1%) | 102 (34.9%) |
Income Below Poverty Among Married-Couple Families in Antelope
The poverty statistics for married-couple families in Antelope show that 20.8% or 10 of the total 48 families live below the poverty line. Families with 5 or more children have the highest poverty rate of 100.0%, comprising of 10 families. On the other hand, families with no children have the lowest poverty rate of 0.0%, which includes 0 families.
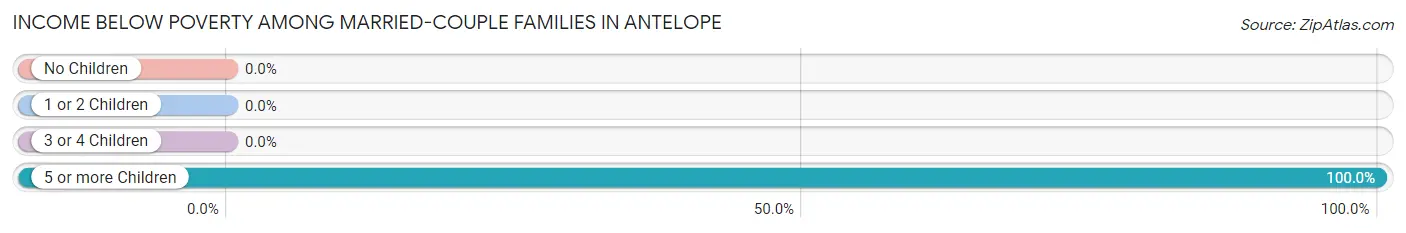
| Children | Above Poverty | Below Poverty |
| No Children | 31 (100.0%) | 0 (0.0%) |
| 1 or 2 Children | 7 (100.0%) | 0 (0.0%) |
| 3 or 4 Children | 0 (0.0%) | 0 (0.0%) |
| 5 or more Children | 0 (0.0%) | 10 (100.0%) |
| Total | 38 (79.2%) | 10 (20.8%) |
Income Below Poverty Among Single-Parent Households in Antelope
According to the poverty data in Antelope, 48.1% or 13 single-father households and 100.0% or 72 single-mother households are living below the poverty line. Among single-father households, those with 3 or 4 children have the highest poverty rate, with 13 households (100.0%) experiencing poverty. Likewise, among single-mother households, those with no children have the highest poverty rate, with 5 households (100.0%) falling below the poverty line.
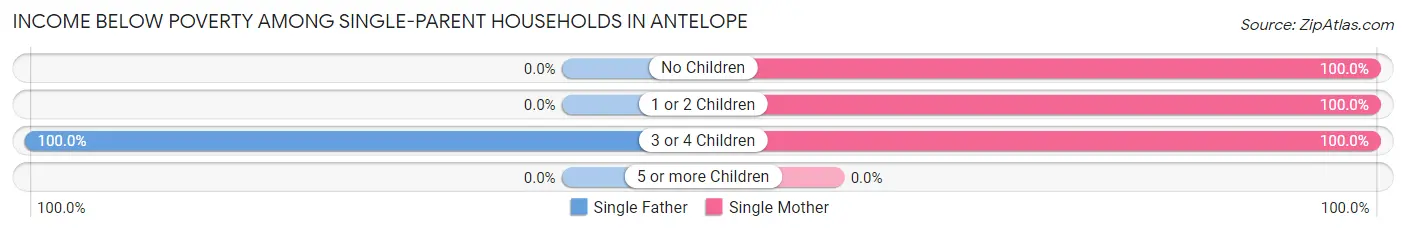
| Children | Single Father | Single Mother |
| No Children | 0 (0.0%) | 5 (100.0%) |
| 1 or 2 Children | 0 (0.0%) | 51 (100.0%) |
| 3 or 4 Children | 13 (100.0%) | 16 (100.0%) |
| 5 or more Children | 0 (0.0%) | 0 (0.0%) |
| Total | 13 (48.1%) | 72 (100.0%) |
Income Below Poverty Among Married-Couple vs Single-Parent Households in Antelope
The poverty data for Antelope shows that 10 of the married-couple family households (20.8%) and 85 of the single-parent households (85.9%) are living below the poverty level. Within the married-couple family households, those with 5 or more children have the highest poverty rate, with 10 households (100.0%) falling below the poverty line. Among the single-parent households, those with no children have the highest poverty rate, with 5 household (100.0%) living below poverty.
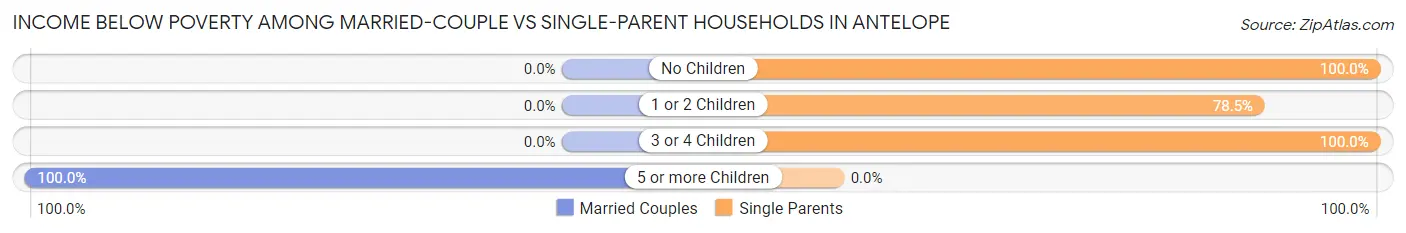
| Children | Married-Couple Families | Single-Parent Households |
| No Children | 0 (0.0%) | 5 (100.0%) |
| 1 or 2 Children | 0 (0.0%) | 51 (78.5%) |
| 3 or 4 Children | 0 (0.0%) | 29 (100.0%) |
| 5 or more Children | 10 (100.0%) | 0 (0.0%) |
| Total | 10 (20.8%) | 85 (85.9%) |
Race in Antelope
The most populous races in Antelope are Native / Alaskan (686 | 97.9%), and White / Caucasian (15 | 2.1%).
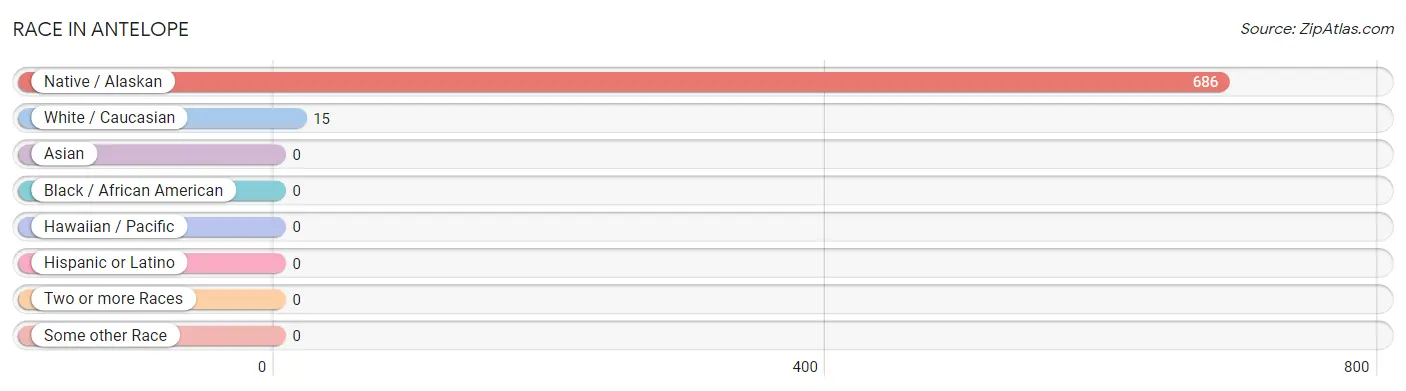
| Race | # Population | % Population |
| Asian | 0 | 0.0% |
| Black / African American | 0 | 0.0% |
| Hawaiian / Pacific | 0 | 0.0% |
| Hispanic or Latino | 0 | 0.0% |
| Native / Alaskan | 686 | 97.9% |
| White / Caucasian | 15 | 2.1% |
| Two or more Races | 0 | 0.0% |
| Some other Race | 0 | 0.0% |
| Total | 701 | 100.0% |
Ancestry in Antelope
The most populous ancestries reported in Antelope are Sioux (601 | 85.7%), German (39 | 5.6%), and Chippewa (15 | 2.1%), together accounting for 93.4% of all Antelope residents.
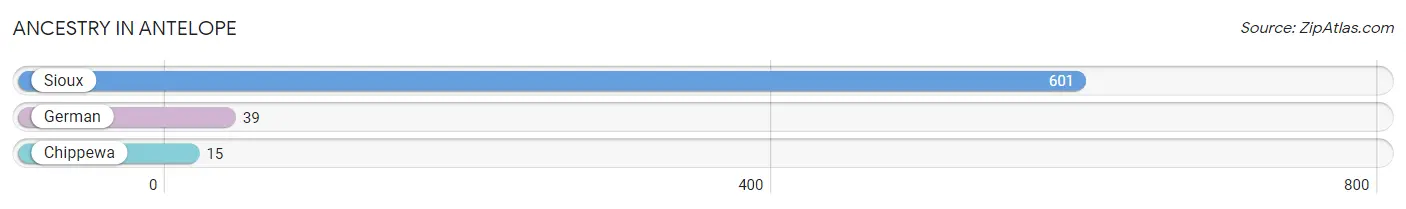
| Ancestry | # Population | % Population |
| Chippewa | 15 | 2.1% |
| German | 39 | 5.6% |
| Sioux | 601 | 85.7% | View All 3 Rows |
Immigrants in Antelope

| Immigration Origin | # Population | % Population | View All 0 Rows |
Sex and Age in Antelope
Sex and Age in Antelope
The most populous age groups in Antelope are 15 to 19 Years (98 | 24.0%) for men and 10 to 14 Years (37 | 12.7%) for women.
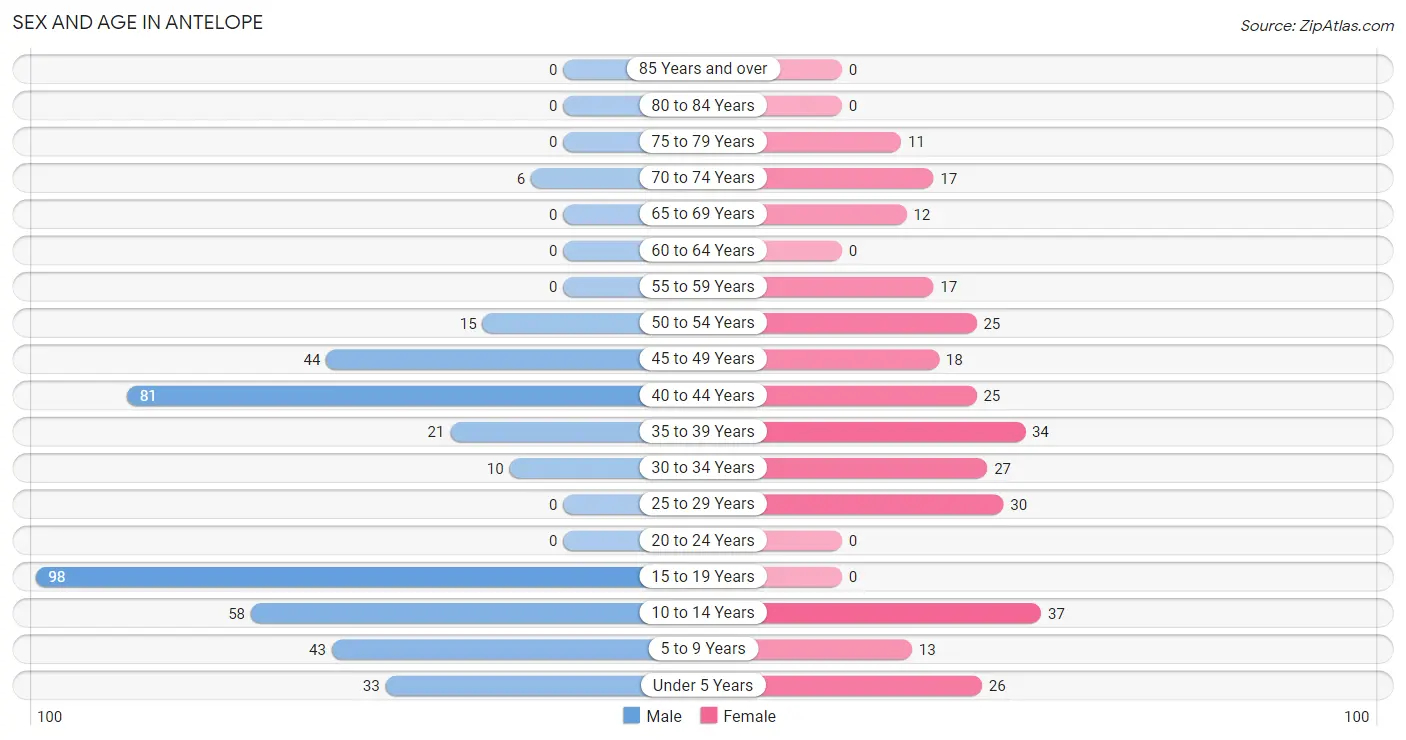
| Age Bracket | Male | Female |
| Under 5 Years | 33 (8.1%) | 26 (8.9%) |
| 5 to 9 Years | 43 (10.5%) | 13 (4.4%) |
| 10 to 14 Years | 58 (14.2%) | 37 (12.7%) |
| 15 to 19 Years | 98 (24.0%) | 0 (0.0%) |
| 20 to 24 Years | 0 (0.0%) | 0 (0.0%) |
| 25 to 29 Years | 0 (0.0%) | 30 (10.3%) |
| 30 to 34 Years | 10 (2.4%) | 27 (9.2%) |
| 35 to 39 Years | 21 (5.1%) | 34 (11.6%) |
| 40 to 44 Years | 81 (19.8%) | 25 (8.6%) |
| 45 to 49 Years | 44 (10.8%) | 18 (6.2%) |
| 50 to 54 Years | 15 (3.7%) | 25 (8.6%) |
| 55 to 59 Years | 0 (0.0%) | 17 (5.8%) |
| 60 to 64 Years | 0 (0.0%) | 0 (0.0%) |
| 65 to 69 Years | 0 (0.0%) | 12 (4.1%) |
| 70 to 74 Years | 6 (1.5%) | 17 (5.8%) |
| 75 to 79 Years | 0 (0.0%) | 11 (3.8%) |
| 80 to 84 Years | 0 (0.0%) | 0 (0.0%) |
| 85 Years and over | 0 (0.0%) | 0 (0.0%) |
| Total | 409 (100.0%) | 292 (100.0%) |
Families and Households in Antelope
Median Family Size in Antelope
The median family size in Antelope is 4.32 persons per family, with married-couple families (48 | 32.7%) accounting for the largest median family size of 5.02 persons per family. On the other hand, single male/father families (27 | 18.4%) represent the smallest median family size with 3.85 persons per family.
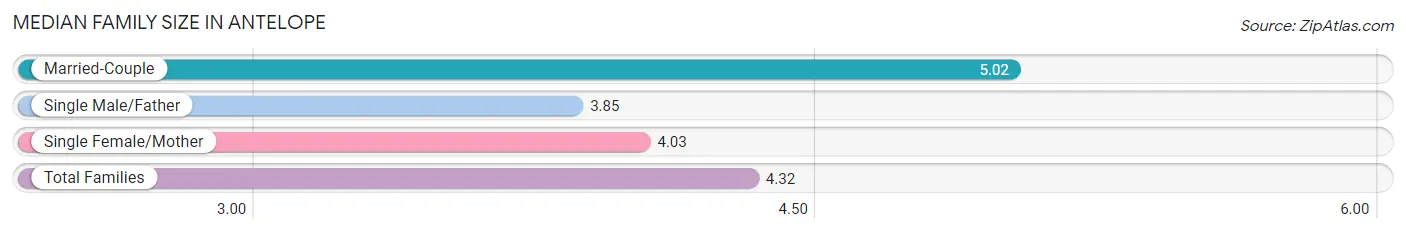
| Family Type | # Families | Family Size |
| Married-Couple | 48 (32.7%) | 5.02 |
| Single Male/Father | 27 (18.4%) | 3.85 |
| Single Female/Mother | 72 (49.0%) | 4.03 |
| Total Families | 147 (100.0%) | 4.32 |
Median Household Size in Antelope
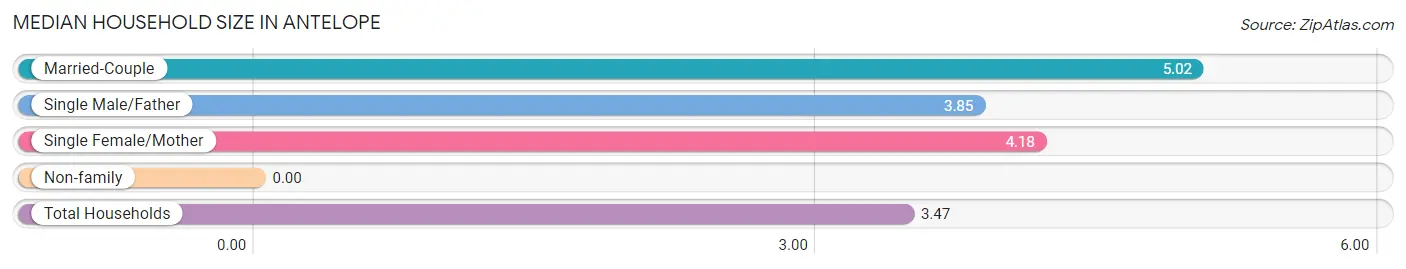
| Household Type | # Households | Household Size |
| Married-Couple | 48 (23.8%) | 5.02 |
| Single Male/Father | 27 (13.4%) | 3.85 |
| Single Female/Mother | 72 (35.6%) | 4.18 |
| Non-family | 55 (27.2%) | - |
| Total Households | 202 (100.0%) | 3.47 |
Household Size by Marriage Status in Antelope
Out of a total of 202 households in Antelope, 147 (72.8%) are family households, while 55 (27.2%) are nonfamily households. The most numerous type of family households are 3-person households, comprising 49, and the most common type of nonfamily households are 1-person households, comprising 55.
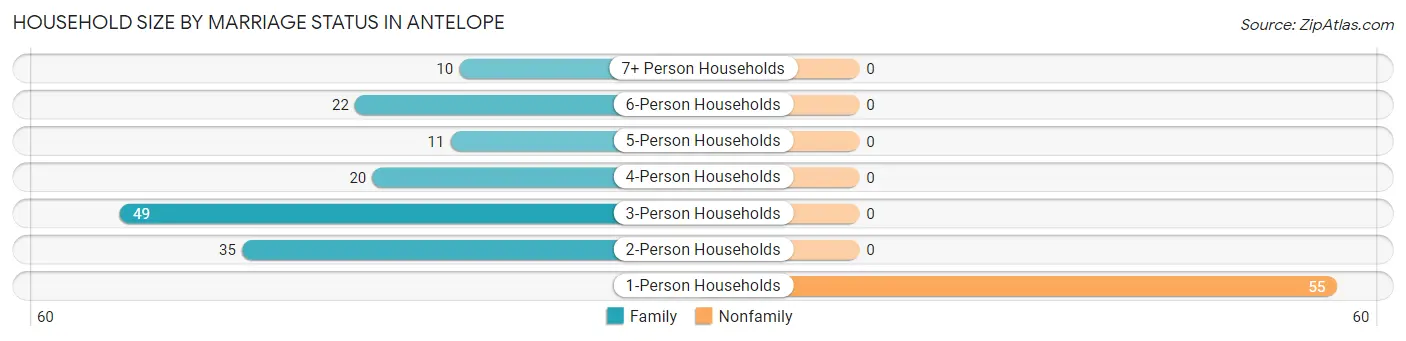
| Household Size | Family Households | Nonfamily Households |
| 1-Person Households | - | 55 (27.2%) |
| 2-Person Households | 35 (17.3%) | 0 (0.0%) |
| 3-Person Households | 49 (24.3%) | 0 (0.0%) |
| 4-Person Households | 20 (9.9%) | 0 (0.0%) |
| 5-Person Households | 11 (5.4%) | 0 (0.0%) |
| 6-Person Households | 22 (10.9%) | 0 (0.0%) |
| 7+ Person Households | 10 (5.0%) | 0 (0.0%) |
| Total | 147 (72.8%) | 55 (27.2%) |
Female Fertility in Antelope
Fertility by Age in Antelope
Average fertility rate in Antelope is 116.0 births per 1,000 women. Women in the age bracket of 35 to 50 years have the highest fertility rate with 122.0 births per 1,000 women. Women in the age bracket of 35 to 50 years acount for 64.7% of all women with births.
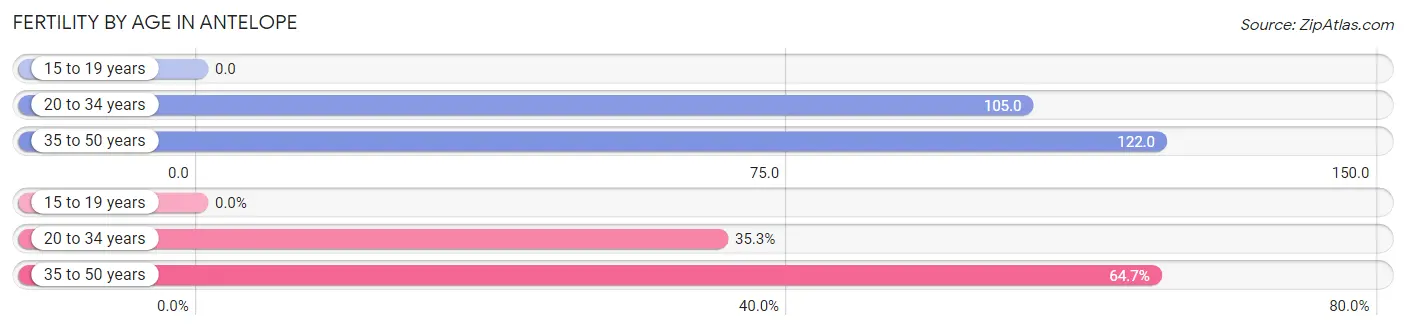
| Age Bracket | Women with Births | Births / 1,000 Women |
| 15 to 19 years | 0 (0.0%) | 0.0 |
| 20 to 34 years | 6 (35.3%) | 105.0 |
| 35 to 50 years | 11 (64.7%) | 122.0 |
| Total | 17 (100.0%) | 116.0 |
Fertility by Age by Marriage Status in Antelope
35.3% of women with births (17) in Antelope are married. The highest percentage of unmarried women with births falls into 35 to 50 years age bracket with 100.0% of them unmarried at the time of birth, while the lowest percentage of unmarried women with births belong to 20 to 34 years age bracket with 0.0% of them unmarried.
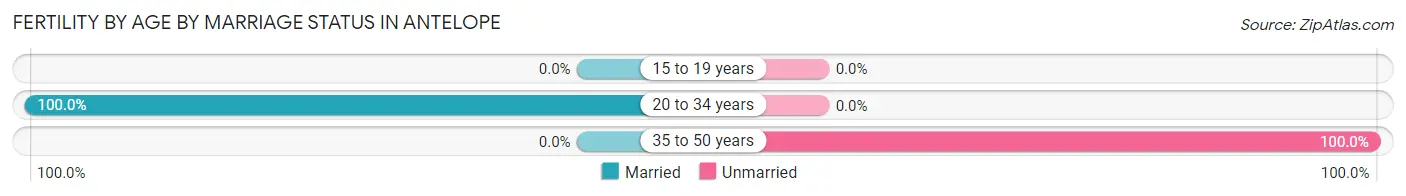
| Age Bracket | Married | Unmarried |
| 15 to 19 years | 0 (0.0%) | 0 (0.0%) |
| 20 to 34 years | 6 (100.0%) | 0 (0.0%) |
| 35 to 50 years | 0 (0.0%) | 11 (100.0%) |
| Total | 6 (35.3%) | 11 (64.7%) |
Fertility by Education in Antelope
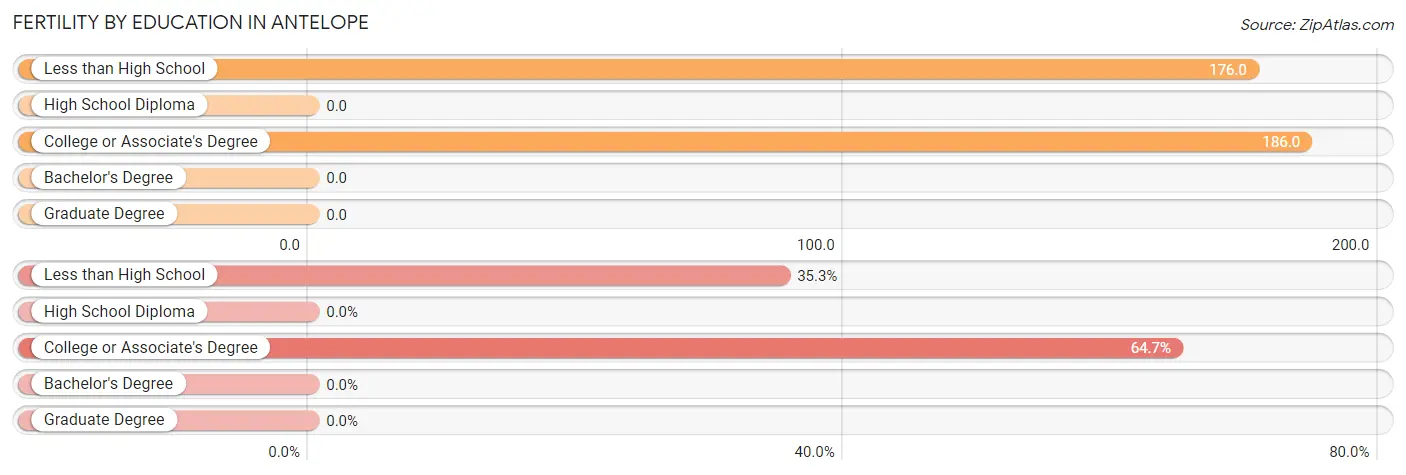
| Educational Attainment | Women with Births | Births / 1,000 Women |
| Less than High School | 6 (35.3%) | 176.0 |
| High School Diploma | 0 (0.0%) | 0.0 |
| College or Associate's Degree | 11 (64.7%) | 186.0 |
| Bachelor's Degree | 0 (0.0%) | 0.0 |
| Graduate Degree | 0 (0.0%) | 0.0 |
| Total | 17 (100.0%) | 116.0 |
Fertility by Education by Marriage Status in Antelope
64.7% of women with births in Antelope are unmarried. Women with the educational attainment of less than high school are most likely to be married with 100.0% of them married at childbirth, while women with the educational attainment of college or associate's degree are least likely to be married with 100.0% of them unmarried at childbirth.
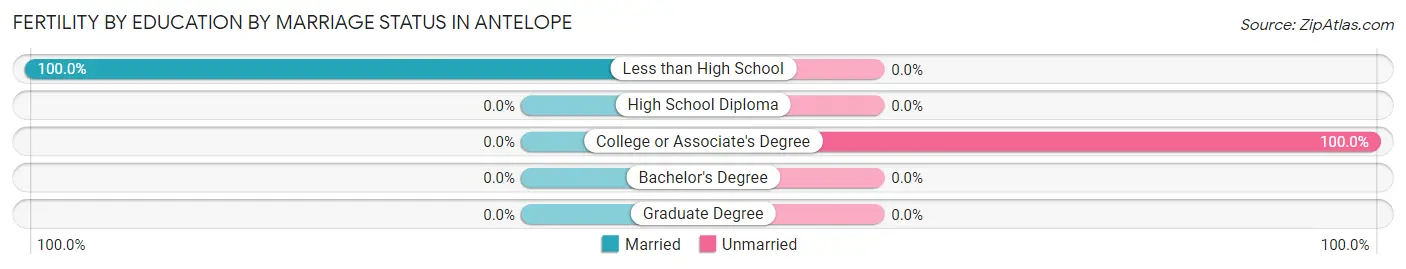
| Educational Attainment | Married | Unmarried |
| Less than High School | 6 (100.0%) | 0 (0.0%) |
| High School Diploma | 0 (0.0%) | 0 (0.0%) |
| College or Associate's Degree | 0 (0.0%) | 11 (100.0%) |
| Bachelor's Degree | 0 (0.0%) | 0 (0.0%) |
| Graduate Degree | 0 (0.0%) | 0 (0.0%) |
| Total | 6 (35.3%) | 11 (64.7%) |
Employment Characteristics in Antelope
Employment by Class of Employer in Antelope
Among the 112 employed individuals in Antelope, local government employees (68 | 60.7%), self-employed (not incorporated) (16 | 14.3%), and state government employees (15 | 13.4%) make up the most common classes of employment.
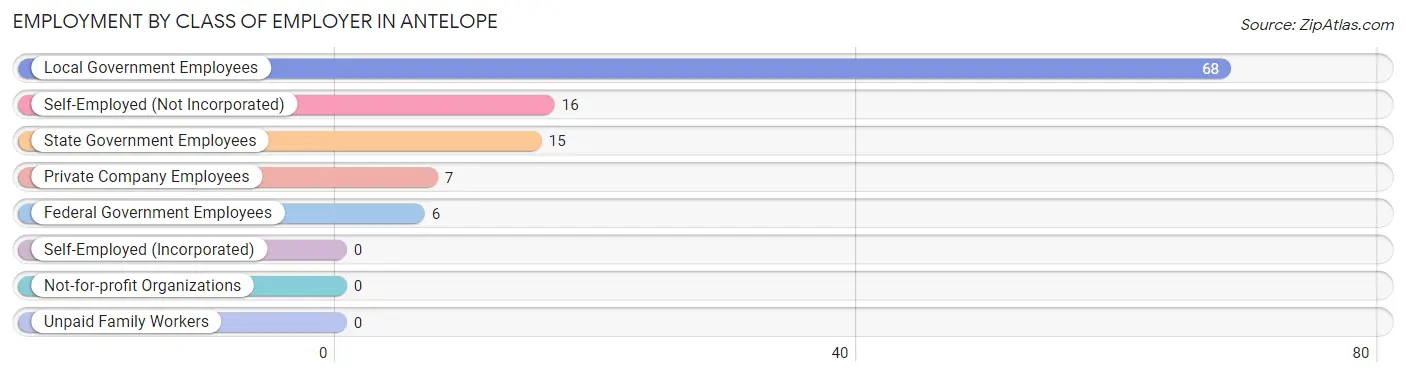
| Employer Class | # Employees | % Employees |
| Private Company Employees | 7 | 6.2% |
| Self-Employed (Incorporated) | 0 | 0.0% |
| Self-Employed (Not Incorporated) | 16 | 14.3% |
| Not-for-profit Organizations | 0 | 0.0% |
| Local Government Employees | 68 | 60.7% |
| State Government Employees | 15 | 13.4% |
| Federal Government Employees | 6 | 5.4% |
| Unpaid Family Workers | 0 | 0.0% |
| Total | 112 | 100.0% |
Employment Status by Age in Antelope
According to the labor force statistics for Antelope, out of the total population over 16 years of age (480), 29.6% or 142 individuals are in the labor force, with 21.1% or 30 of them unemployed. The age group with the highest labor force participation rate is 25 to 29 years, with 80.0% or 24 individuals in the labor force. Within the labor force, the 45 to 54 years age range has the highest percentage of unemployed individuals, with 39.1% or 9 of them being unemployed.
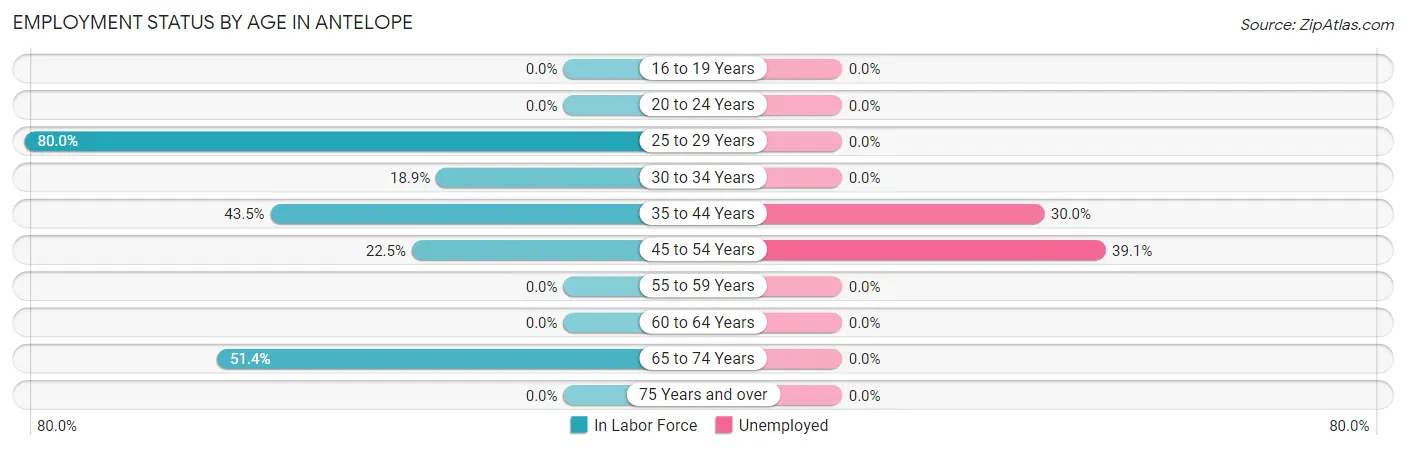
| Age Bracket | In Labor Force | Unemployed |
| 16 to 19 Years | 0 (0.0%) | 0 (0.0%) |
| 20 to 24 Years | 0 (0.0%) | 0 (0.0%) |
| 25 to 29 Years | 24 (80.0%) | 0 (0.0%) |
| 30 to 34 Years | 7 (18.9%) | 0 (0.0%) |
| 35 to 44 Years | 70 (43.5%) | 21 (30.0%) |
| 45 to 54 Years | 23 (22.5%) | 9 (39.1%) |
| 55 to 59 Years | 0 (0.0%) | 0 (0.0%) |
| 60 to 64 Years | 0 (0.0%) | 0 (0.0%) |
| 65 to 74 Years | 18 (51.4%) | 0 (0.0%) |
| 75 Years and over | 0 (0.0%) | 0 (0.0%) |
| Total | 142 (29.6%) | 30 (21.1%) |
Employment Status by Educational Attainment in Antelope
According to labor force statistics for Antelope, 35.7% of individuals (124) out of the total population between 25 and 64 years of age (347) are in the labor force, with 24.2% or 30 of them being unemployed. The group with the highest labor force participation rate are those with the educational attainment of bachelor's degree or higher, with 61.3% or 38 individuals in the labor force. Within the labor force, individuals with college / associate degree education have the highest percentage of unemployment, with 38.0% or 30 of them being unemployed.
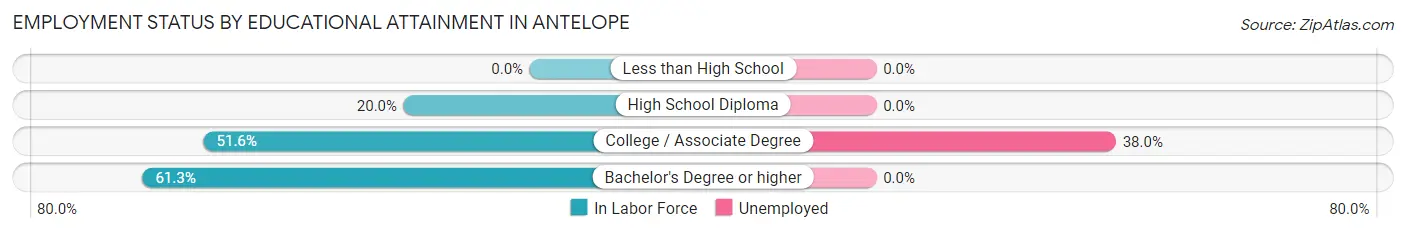
| Educational Attainment | In Labor Force | Unemployed |
| Less than High School | 0 (0.0%) | 0 (0.0%) |
| High School Diploma | 7 (20.0%) | 0 (0.0%) |
| College / Associate Degree | 79 (51.6%) | 58 (38.0%) |
| Bachelor's Degree or higher | 38 (61.3%) | 0 (0.0%) |
| Total | 124 (35.7%) | 84 (24.2%) |
Employment Occupations by Sex in Antelope
Management, Business, Science and Arts Occupations
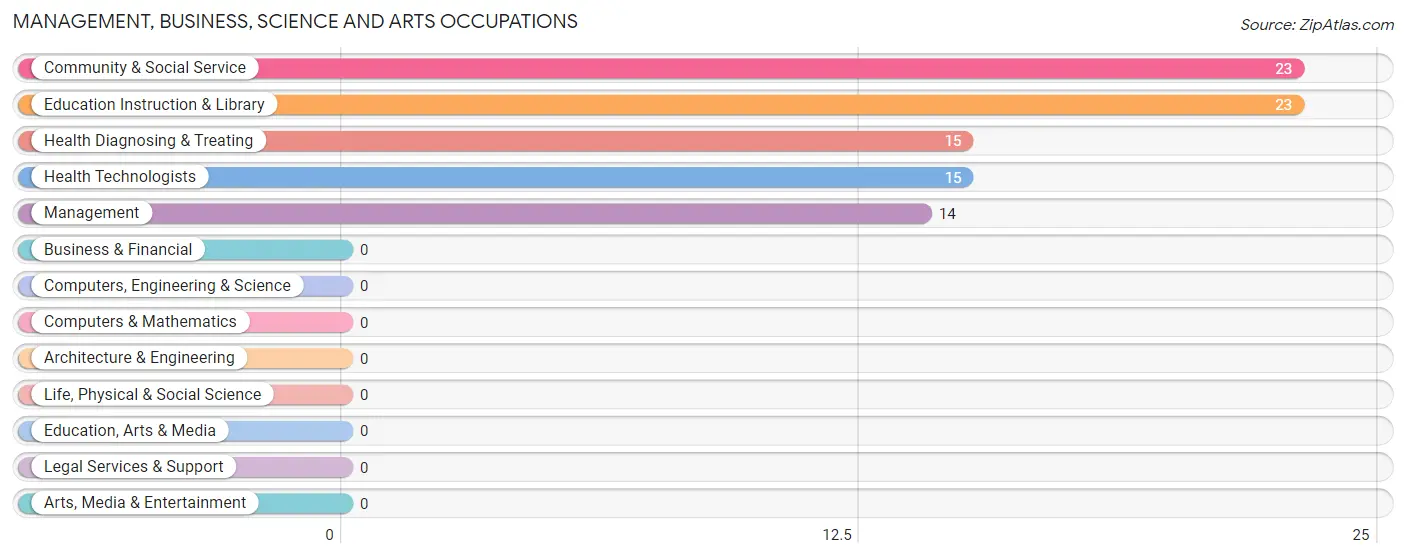
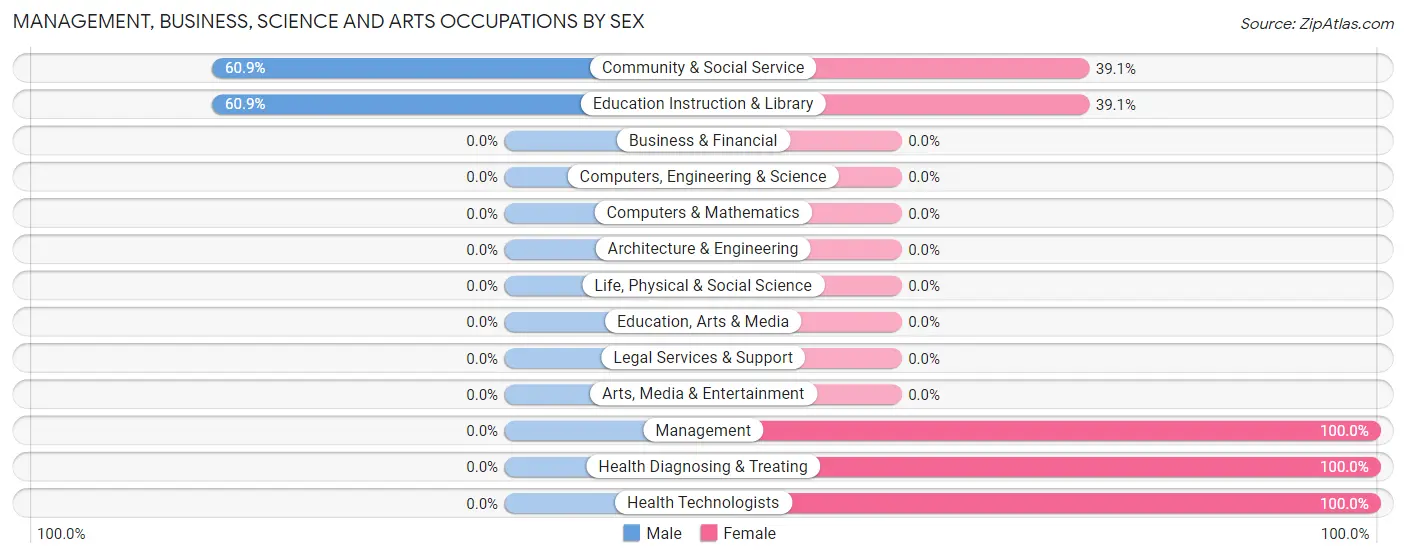
The most common Management, Business, Science and Arts occupations in Antelope are Community & Social Service (23 | 20.5%), Education Instruction & Library (23 | 20.5%), Health Diagnosing & Treating (15 | 13.4%), Health Technologists (15 | 13.4%), and Management (14 | 12.5%).
Management, Business, Science and Arts Occupations by Sex
Within the Management, Business, Science and Arts occupations in Antelope, the most male-oriented occupations are Community & Social Service (60.9%), and Education Instruction & Library (60.9%), while the most female-oriented occupations are Management (100.0%), Health Diagnosing & Treating (100.0%), and Health Technologists (100.0%).
| Occupation | Male | Female |
| Management | 0 (0.0%) | 14 (100.0%) |
| Business & Financial | 0 (0.0%) | 0 (0.0%) |
| Computers, Engineering & Science | 0 (0.0%) | 0 (0.0%) |
| Computers & Mathematics | 0 (0.0%) | 0 (0.0%) |
| Architecture & Engineering | 0 (0.0%) | 0 (0.0%) |
| Life, Physical & Social Science | 0 (0.0%) | 0 (0.0%) |
| Community & Social Service | 14 (60.9%) | 9 (39.1%) |
| Education, Arts & Media | 0 (0.0%) | 0 (0.0%) |
| Legal Services & Support | 0 (0.0%) | 0 (0.0%) |
| Education Instruction & Library | 14 (60.9%) | 9 (39.1%) |
| Arts, Media & Entertainment | 0 (0.0%) | 0 (0.0%) |
| Health Diagnosing & Treating | 0 (0.0%) | 15 (100.0%) |
| Health Technologists | 0 (0.0%) | 15 (100.0%) |
| Total (Category) | 14 (26.9%) | 38 (73.1%) |
| Total (Overall) | 48 (42.9%) | 64 (57.1%) |
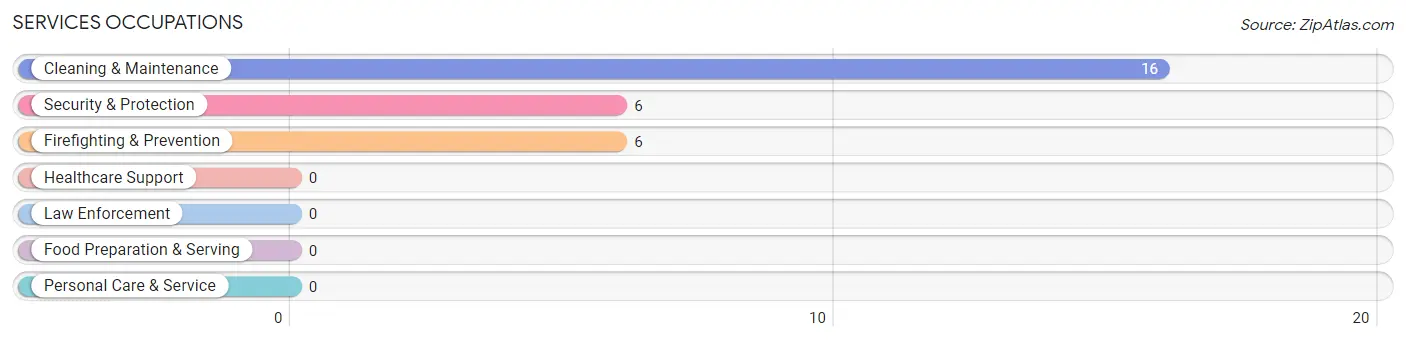
Services Occupations
The most common Services occupations in Antelope are Cleaning & Maintenance (16 | 14.3%), Security & Protection (6 | 5.4%), and Firefighting & Prevention (6 | 5.4%).
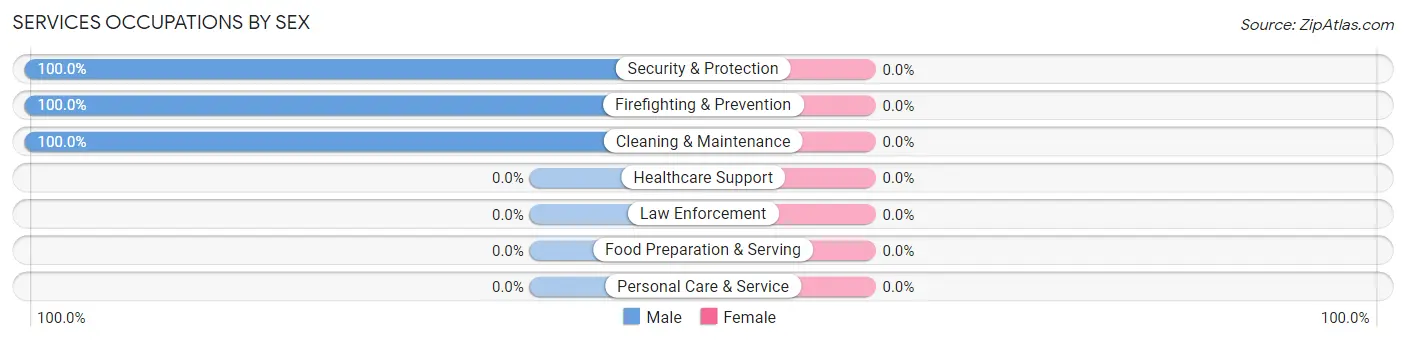
Services Occupations by Sex
| Occupation | Male | Female |
| Healthcare Support | 0 (0.0%) | 0 (0.0%) |
| Security & Protection | 6 (100.0%) | 0 (0.0%) |
| Firefighting & Prevention | 6 (100.0%) | 0 (0.0%) |
| Law Enforcement | 0 (0.0%) | 0 (0.0%) |
| Food Preparation & Serving | 0 (0.0%) | 0 (0.0%) |
| Cleaning & Maintenance | 16 (100.0%) | 0 (0.0%) |
| Personal Care & Service | 0 (0.0%) | 0 (0.0%) |
| Total (Category) | 22 (100.0%) | 0 (0.0%) |
| Total (Overall) | 48 (42.9%) | 64 (57.1%) |
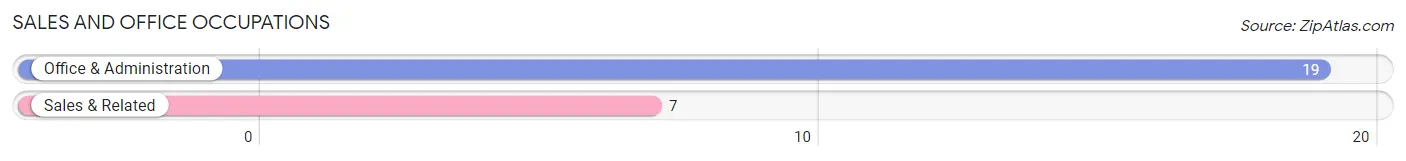
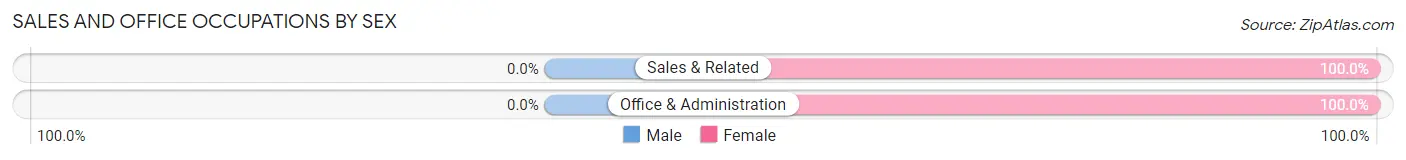
Sales and Office Occupations
The most common Sales and Office occupations in Antelope are Office & Administration (19 | 17.0%), and Sales & Related (7 | 6.2%).
Sales and Office Occupations by Sex
| Occupation | Male | Female |
| Sales & Related | 0 (0.0%) | 7 (100.0%) |
| Office & Administration | 0 (0.0%) | 19 (100.0%) |
| Total (Category) | 0 (0.0%) | 26 (100.0%) |
| Total (Overall) | 48 (42.9%) | 64 (57.1%) |
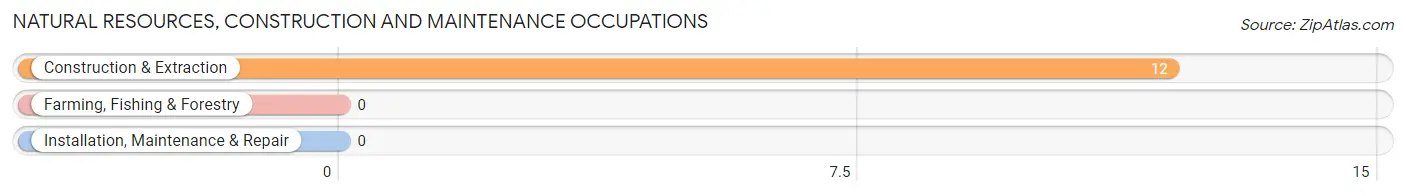
Natural Resources, Construction and Maintenance Occupations
The most common Natural Resources, Construction and Maintenance occupations in Antelope are , and Construction & Extraction (12 | 10.7%).
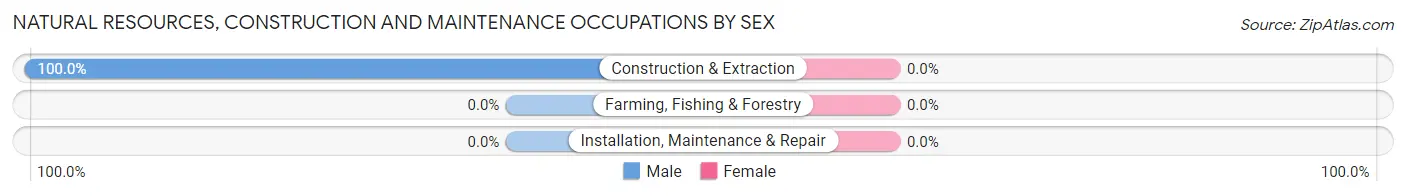
Natural Resources, Construction and Maintenance Occupations by Sex
| Occupation | Male | Female |
| Farming, Fishing & Forestry | 0 (0.0%) | 0 (0.0%) |
| Construction & Extraction | 12 (100.0%) | 0 (0.0%) |
| Installation, Maintenance & Repair | 0 (0.0%) | 0 (0.0%) |
| Total (Category) | 12 (100.0%) | 0 (0.0%) |
| Total (Overall) | 48 (42.9%) | 64 (57.1%) |
Production, Transportation and Moving Occupations
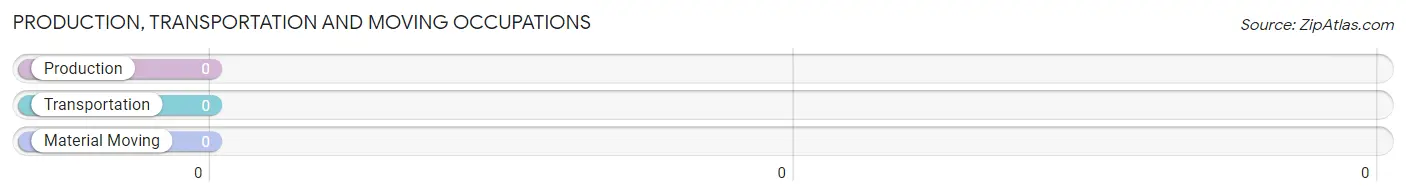
Production, Transportation and Moving Occupations by Sex
| Occupation | Male | Female |
| Production | 0 (0.0%) | 0 (0.0%) |
| Transportation | 0 (0.0%) | 0 (0.0%) |
| Material Moving | 0 (0.0%) | 0 (0.0%) |
| Total (Category) | 0 (0.0%) | 0 (0.0%) |
| Total (Overall) | 48 (42.9%) | 64 (57.1%) |
Employment Industries by Sex in Antelope
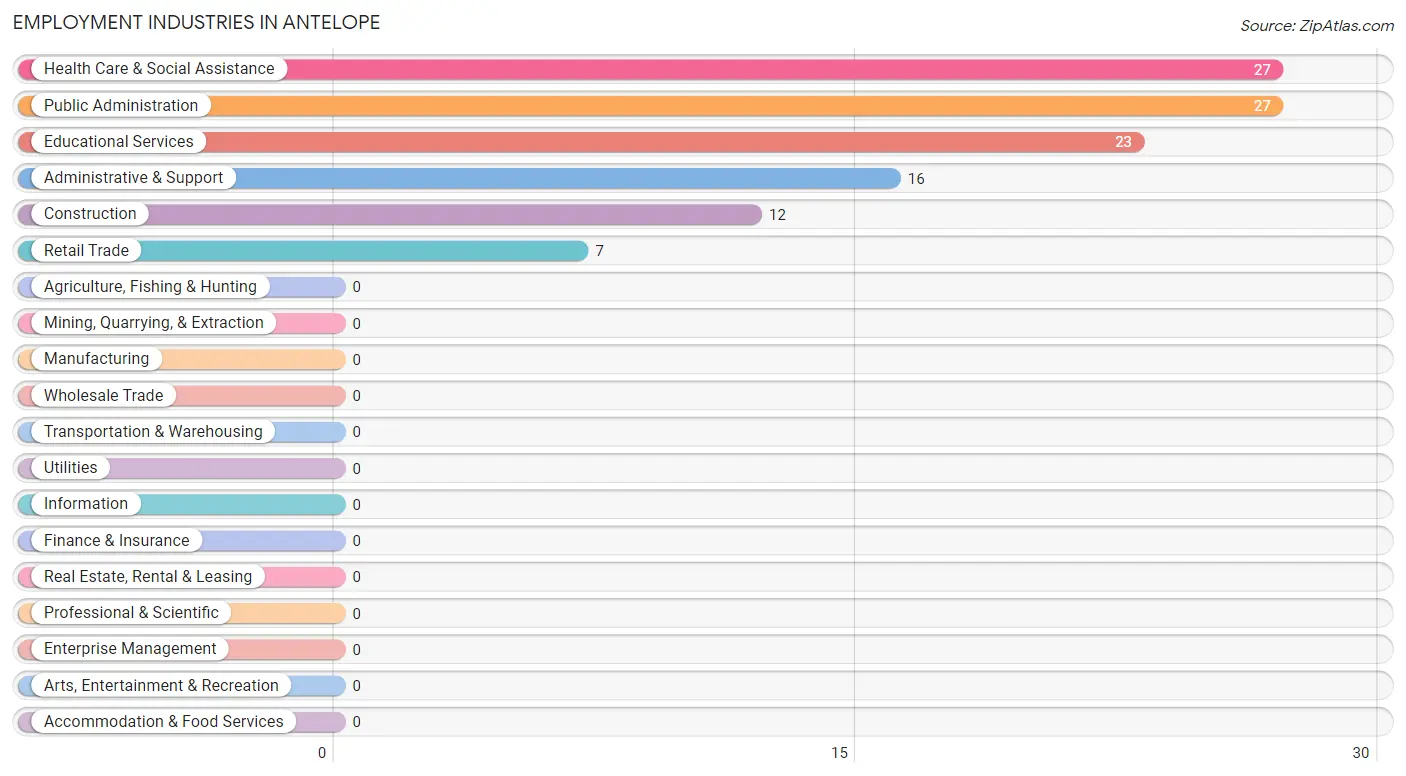
Employment Industries in Antelope
The major employment industries in Antelope include Health Care & Social Assistance (27 | 24.1%), Public Administration (27 | 24.1%), Educational Services (23 | 20.5%), Administrative & Support (16 | 14.3%), and Construction (12 | 10.7%).
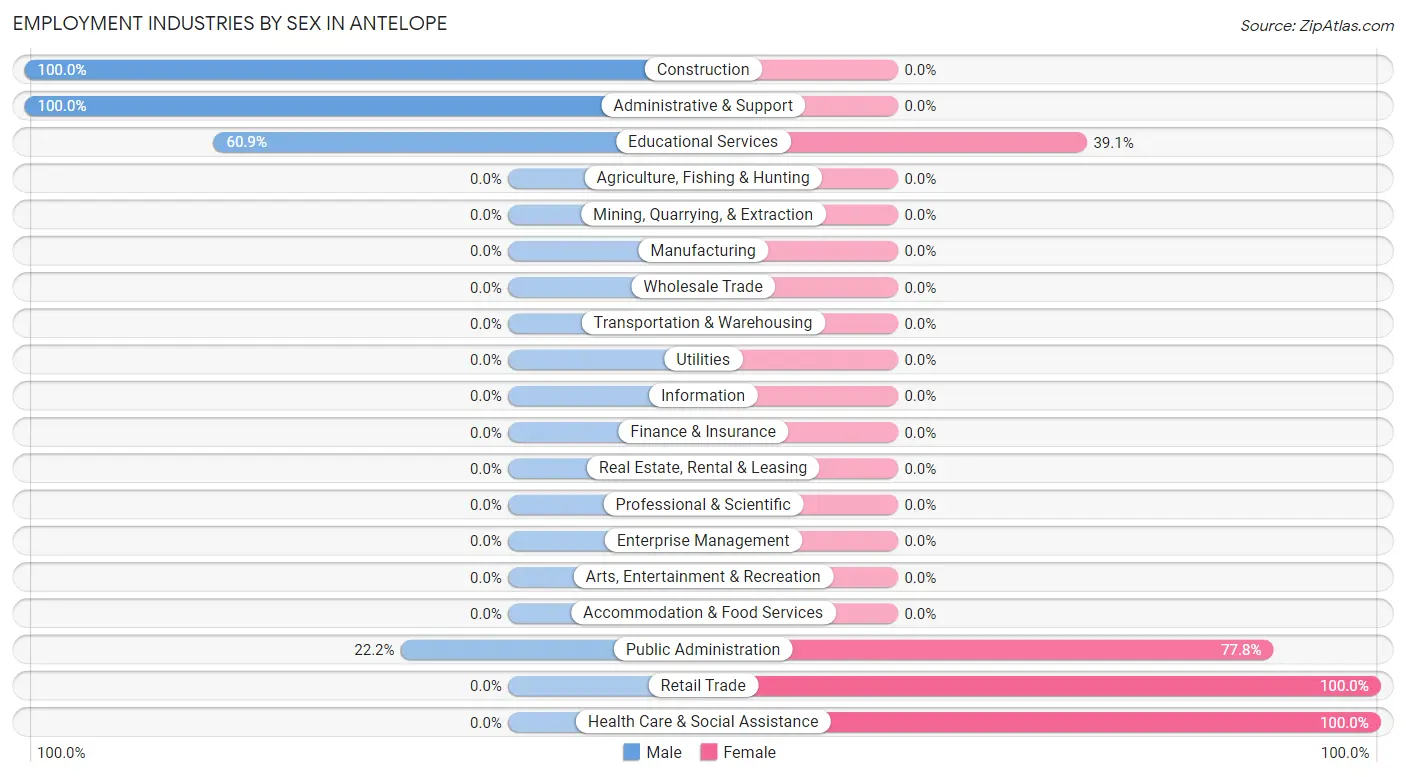
Employment Industries by Sex in Antelope
The Antelope industries that see more men than women are Construction (100.0%), Administrative & Support (100.0%), and Educational Services (60.9%), whereas the industries that tend to have a higher number of women are Retail Trade (100.0%), Health Care & Social Assistance (100.0%), and Public Administration (77.8%).
| Industry | Male | Female |
| Agriculture, Fishing & Hunting | 0 (0.0%) | 0 (0.0%) |
| Mining, Quarrying, & Extraction | 0 (0.0%) | 0 (0.0%) |
| Construction | 12 (100.0%) | 0 (0.0%) |
| Manufacturing | 0 (0.0%) | 0 (0.0%) |
| Wholesale Trade | 0 (0.0%) | 0 (0.0%) |
| Retail Trade | 0 (0.0%) | 7 (100.0%) |
| Transportation & Warehousing | 0 (0.0%) | 0 (0.0%) |
| Utilities | 0 (0.0%) | 0 (0.0%) |
| Information | 0 (0.0%) | 0 (0.0%) |
| Finance & Insurance | 0 (0.0%) | 0 (0.0%) |
| Real Estate, Rental & Leasing | 0 (0.0%) | 0 (0.0%) |
| Professional & Scientific | 0 (0.0%) | 0 (0.0%) |
| Enterprise Management | 0 (0.0%) | 0 (0.0%) |
| Administrative & Support | 16 (100.0%) | 0 (0.0%) |
| Educational Services | 14 (60.9%) | 9 (39.1%) |
| Health Care & Social Assistance | 0 (0.0%) | 27 (100.0%) |
| Arts, Entertainment & Recreation | 0 (0.0%) | 0 (0.0%) |
| Accommodation & Food Services | 0 (0.0%) | 0 (0.0%) |
| Public Administration | 6 (22.2%) | 21 (77.8%) |
| Total | 48 (42.9%) | 64 (57.1%) |
Education in Antelope
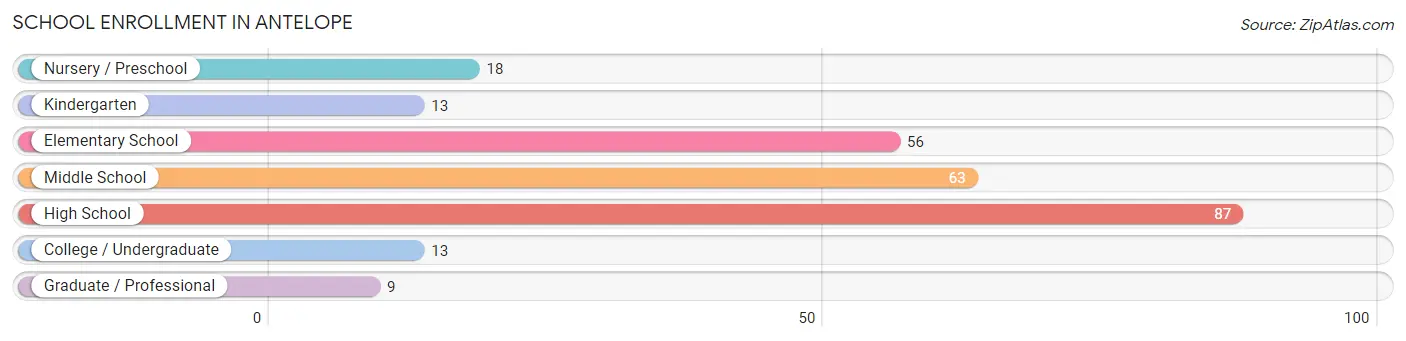
School Enrollment in Antelope
The most common levels of schooling among the 259 students in Antelope are high school (87 | 33.6%), middle school (63 | 24.3%), and elementary school (56 | 21.6%).
| School Level | # Students | % Students |
| Nursery / Preschool | 18 | 7.0% |
| Kindergarten | 13 | 5.0% |
| Elementary School | 56 | 21.6% |
| Middle School | 63 | 24.3% |
| High School | 87 | 33.6% |
| College / Undergraduate | 13 | 5.0% |
| Graduate / Professional | 9 | 3.5% |
| Total | 259 | 100.0% |
School Enrollment by Age by Funding Source in Antelope
Out of a total of 259 students who are enrolled in schools in Antelope, 46 (17.8%) attend a private institution, while the remaining 213 (82.2%) are enrolled in public schools. The age group of 35 years and over has the highest likelihood of being enrolled in private schools, with 9 (40.9% in the age bracket) enrolled. Conversely, the age group of 3 to 4 year olds has the lowest likelihood of being enrolled in a private school, with 8 (100.0% in the age bracket) attending a public institution.
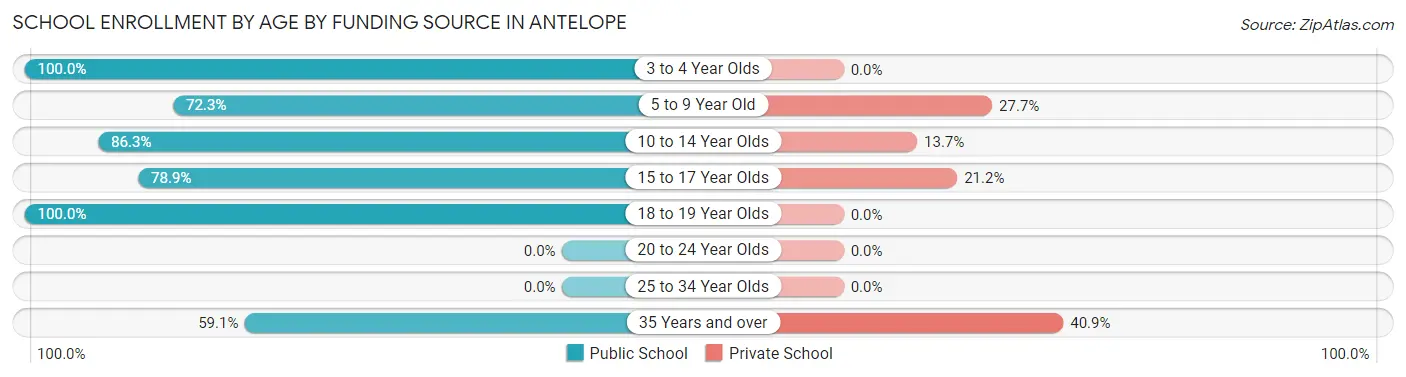
| Age Bracket | Public School | Private School |
| 3 to 4 Year Olds | 8 (100.0%) | 0 (0.0%) |
| 5 to 9 Year Old | 34 (72.3%) | 13 (27.7%) |
| 10 to 14 Year Olds | 82 (86.3%) | 13 (13.7%) |
| 15 to 17 Year Olds | 41 (78.8%) | 11 (21.1%) |
| 18 to 19 Year Olds | 35 (100.0%) | 0 (0.0%) |
| 20 to 24 Year Olds | 0 (0.0%) | 0 (0.0%) |
| 25 to 34 Year Olds | 0 (0.0%) | 0 (0.0%) |
| 35 Years and over | 13 (59.1%) | 9 (40.9%) |
| Total | 213 (82.2%) | 46 (17.8%) |
Educational Attainment by Field of Study in Antelope
Science & technology (30 | 34.1%), business (23 | 26.1%), education (20 | 22.7%), and arts & humanities (15 | 17.1%) are the most common fields of study among 88 individuals in Antelope who have obtained a bachelor's degree or higher.
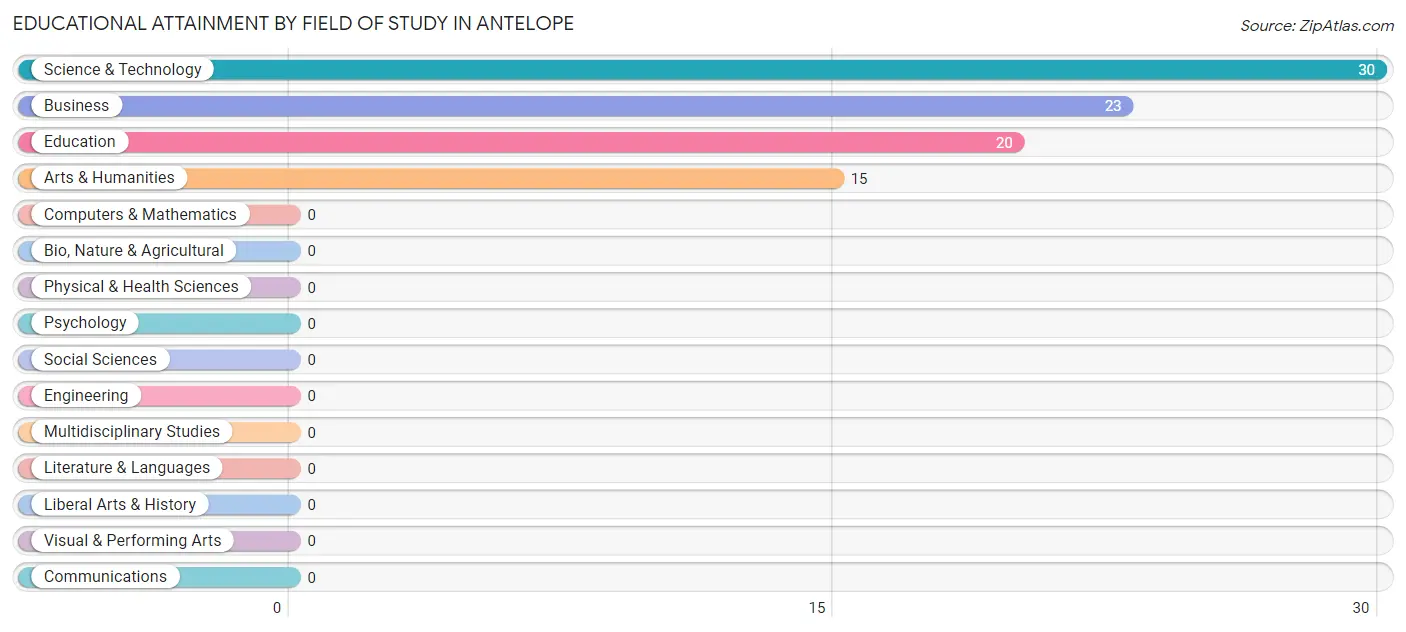
| Field of Study | # Graduates | % Graduates |
| Computers & Mathematics | 0 | 0.0% |
| Bio, Nature & Agricultural | 0 | 0.0% |
| Physical & Health Sciences | 0 | 0.0% |
| Psychology | 0 | 0.0% |
| Social Sciences | 0 | 0.0% |
| Engineering | 0 | 0.0% |
| Multidisciplinary Studies | 0 | 0.0% |
| Science & Technology | 30 | 34.1% |
| Business | 23 | 26.1% |
| Education | 20 | 22.7% |
| Literature & Languages | 0 | 0.0% |
| Liberal Arts & History | 0 | 0.0% |
| Visual & Performing Arts | 0 | 0.0% |
| Communications | 0 | 0.0% |
| Arts & Humanities | 15 | 17.1% |
| Total | 88 | 100.0% |
Transportation & Commute in Antelope
Vehicle Availability by Sex in Antelope
The most prevalent vehicle ownership categories in Antelope are males with 3 vehicles (18, accounting for 37.5%) and females with 3 vehicles (14, making up 28.1%).
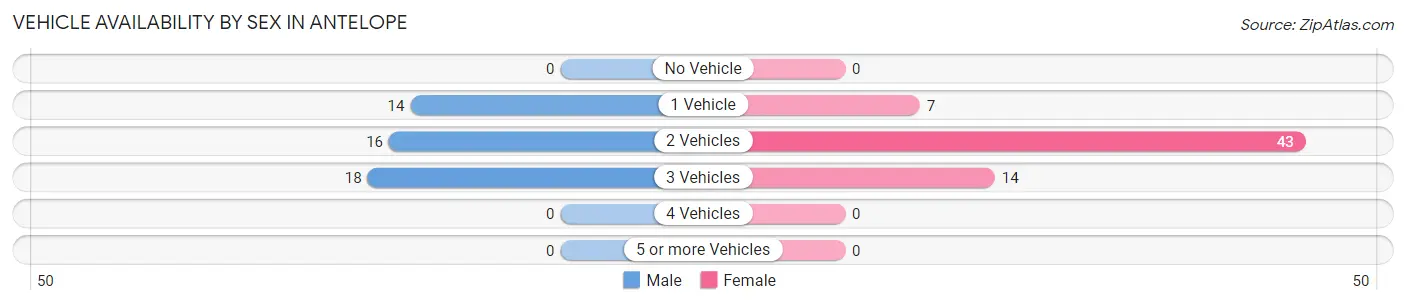
| Vehicles Available | Male | Female |
| No Vehicle | 0 (0.0%) | 0 (0.0%) |
| 1 Vehicle | 14 (29.2%) | 7 (10.9%) |
| 2 Vehicles | 16 (33.3%) | 43 (67.2%) |
| 3 Vehicles | 18 (37.5%) | 14 (21.9%) |
| 4 Vehicles | 0 (0.0%) | 0 (0.0%) |
| 5 or more Vehicles | 0 (0.0%) | 0 (0.0%) |
| Total | 48 (100.0%) | 64 (100.0%) |
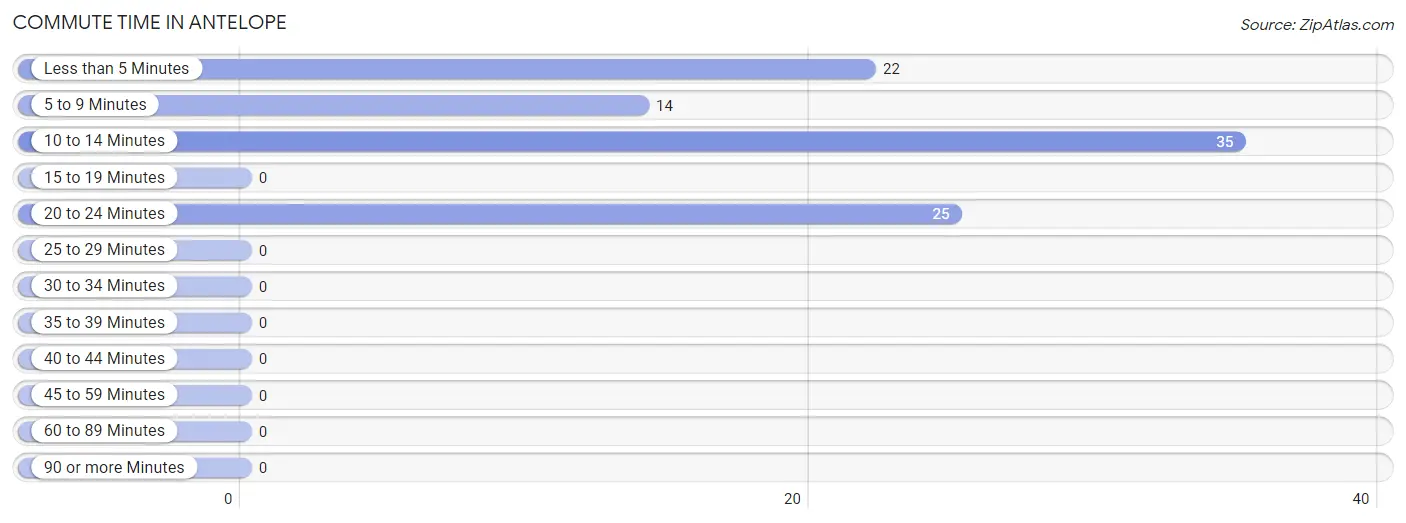
Commute Time in Antelope
The most frequently occuring commute durations in Antelope are 10 to 14 minutes (35 commuters, 36.5%), 20 to 24 minutes (25 commuters, 26.0%), and less than 5 minutes (22 commuters, 22.9%).
| Commute Time | # Commuters | % Commuters |
| Less than 5 Minutes | 22 | 22.9% |
| 5 to 9 Minutes | 14 | 14.6% |
| 10 to 14 Minutes | 35 | 36.5% |
| 15 to 19 Minutes | 0 | 0.0% |
| 20 to 24 Minutes | 25 | 26.0% |
| 25 to 29 Minutes | 0 | 0.0% |
| 30 to 34 Minutes | 0 | 0.0% |
| 35 to 39 Minutes | 0 | 0.0% |
| 40 to 44 Minutes | 0 | 0.0% |
| 45 to 59 Minutes | 0 | 0.0% |
| 60 to 89 Minutes | 0 | 0.0% |
| 90 or more Minutes | 0 | 0.0% |
Commute Time by Sex in Antelope
The most common commute times in Antelope are 5 to 9 minutes (14 commuters, 43.8%) for males and 10 to 14 minutes (23 commuters, 35.9%) for females.
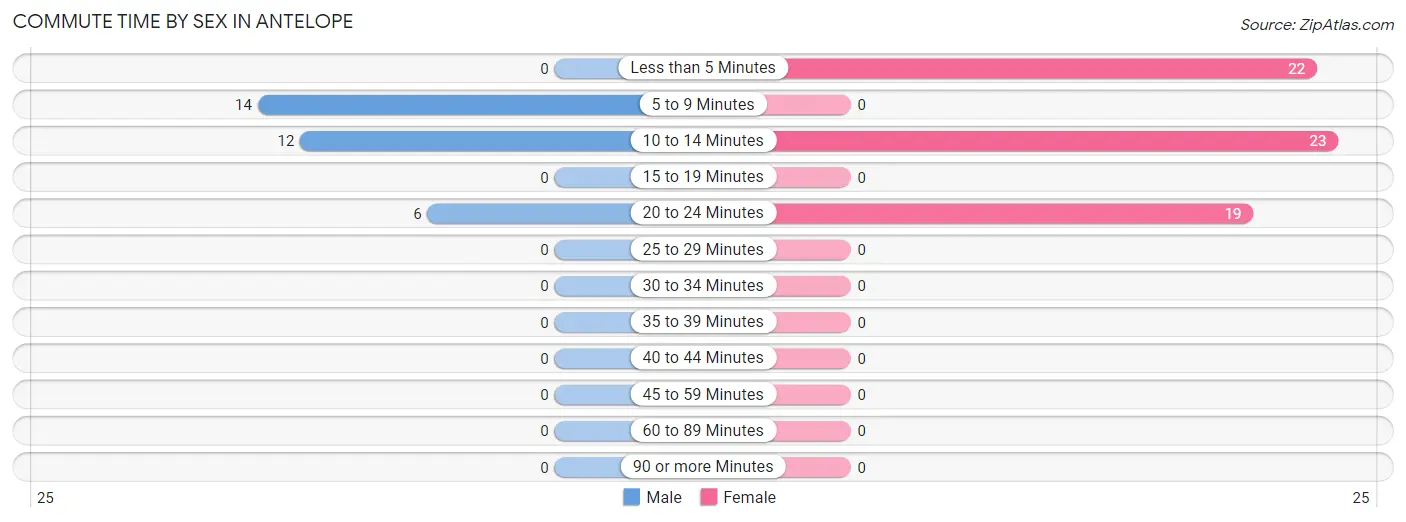
| Commute Time | Male | Female |
| Less than 5 Minutes | 0 (0.0%) | 22 (34.4%) |
| 5 to 9 Minutes | 14 (43.8%) | 0 (0.0%) |
| 10 to 14 Minutes | 12 (37.5%) | 23 (35.9%) |
| 15 to 19 Minutes | 0 (0.0%) | 0 (0.0%) |
| 20 to 24 Minutes | 6 (18.8%) | 19 (29.7%) |
| 25 to 29 Minutes | 0 (0.0%) | 0 (0.0%) |
| 30 to 34 Minutes | 0 (0.0%) | 0 (0.0%) |
| 35 to 39 Minutes | 0 (0.0%) | 0 (0.0%) |
| 40 to 44 Minutes | 0 (0.0%) | 0 (0.0%) |
| 45 to 59 Minutes | 0 (0.0%) | 0 (0.0%) |
| 60 to 89 Minutes | 0 (0.0%) | 0 (0.0%) |
| 90 or more Minutes | 0 (0.0%) | 0 (0.0%) |
Time of Departure to Work by Sex in Antelope
The most frequent times of departure to work in Antelope are 7:30 AM to 7:59 AM (26, 81.2%) for males and 7:00 AM to 7:29 AM (21, 32.8%) for females.
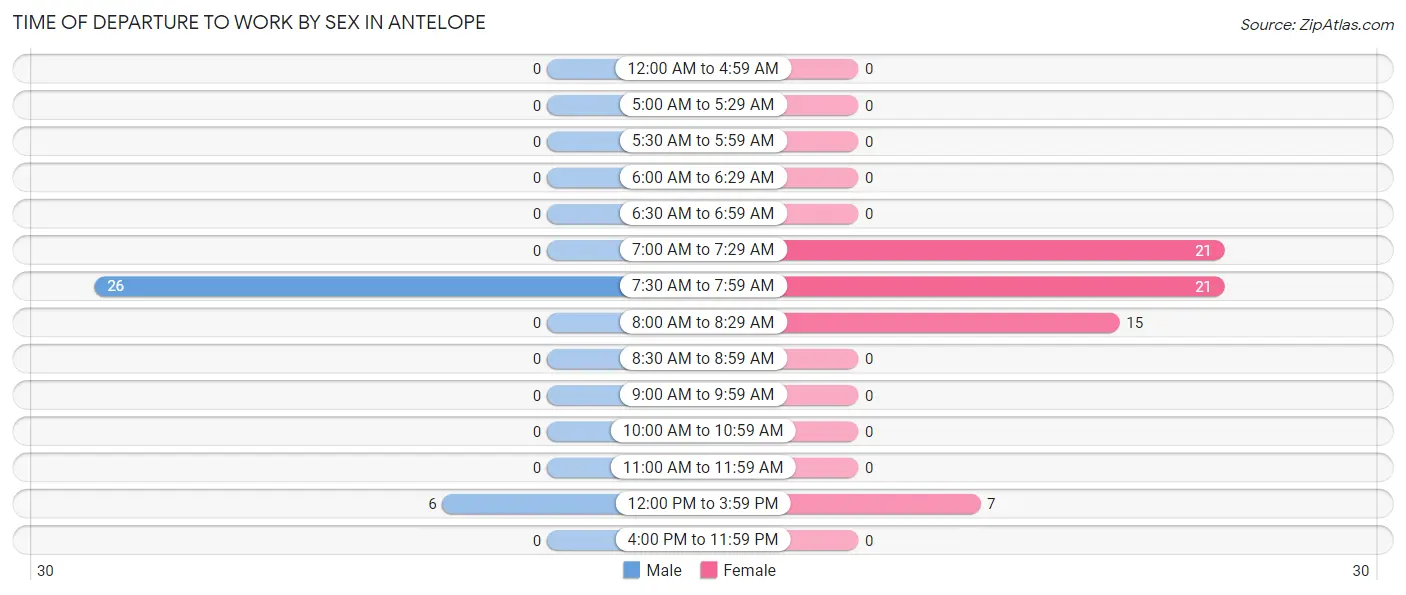
| Time of Departure | Male | Female |
| 12:00 AM to 4:59 AM | 0 (0.0%) | 0 (0.0%) |
| 5:00 AM to 5:29 AM | 0 (0.0%) | 0 (0.0%) |
| 5:30 AM to 5:59 AM | 0 (0.0%) | 0 (0.0%) |
| 6:00 AM to 6:29 AM | 0 (0.0%) | 0 (0.0%) |
| 6:30 AM to 6:59 AM | 0 (0.0%) | 0 (0.0%) |
| 7:00 AM to 7:29 AM | 0 (0.0%) | 21 (32.8%) |
| 7:30 AM to 7:59 AM | 26 (81.2%) | 21 (32.8%) |
| 8:00 AM to 8:29 AM | 0 (0.0%) | 15 (23.4%) |
| 8:30 AM to 8:59 AM | 0 (0.0%) | 0 (0.0%) |
| 9:00 AM to 9:59 AM | 0 (0.0%) | 0 (0.0%) |
| 10:00 AM to 10:59 AM | 0 (0.0%) | 0 (0.0%) |
| 11:00 AM to 11:59 AM | 0 (0.0%) | 0 (0.0%) |
| 12:00 PM to 3:59 PM | 6 (18.8%) | 7 (10.9%) |
| 4:00 PM to 11:59 PM | 0 (0.0%) | 0 (0.0%) |
| Total | 32 (100.0%) | 64 (100.0%) |
Housing Occupancy in Antelope
Occupancy by Ownership in Antelope
Of the total 202 dwellings in Antelope, owner-occupied units account for 64 (31.7%), while renter-occupied units make up 138 (68.3%).
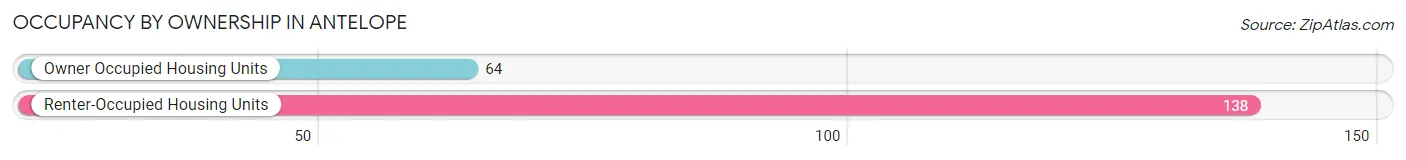
| Occupancy | # Housing Units | % Housing Units |
| Owner Occupied Housing Units | 64 | 31.7% |
| Renter-Occupied Housing Units | 138 | 68.3% |
| Total Occupied Housing Units | 202 | 100.0% |
Occupancy by Household Size in Antelope
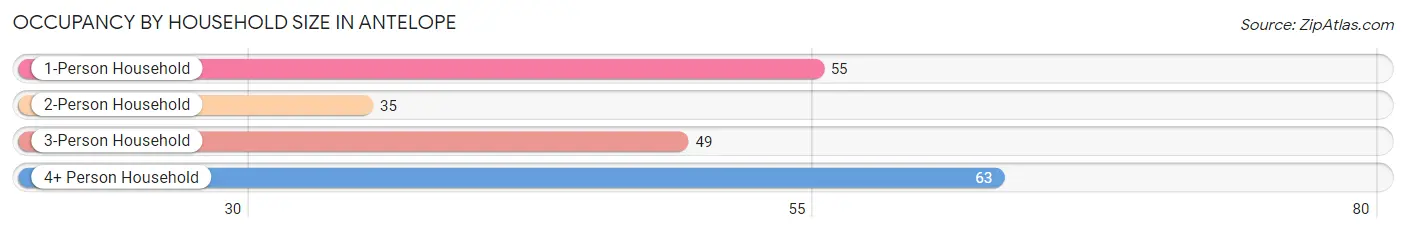
| Household Size | # Housing Units | % Housing Units |
| 1-Person Household | 55 | 27.2% |
| 2-Person Household | 35 | 17.3% |
| 3-Person Household | 49 | 24.3% |
| 4+ Person Household | 63 | 31.2% |
| Total Housing Units | 202 | 100.0% |
Occupancy by Ownership by Household Size in Antelope
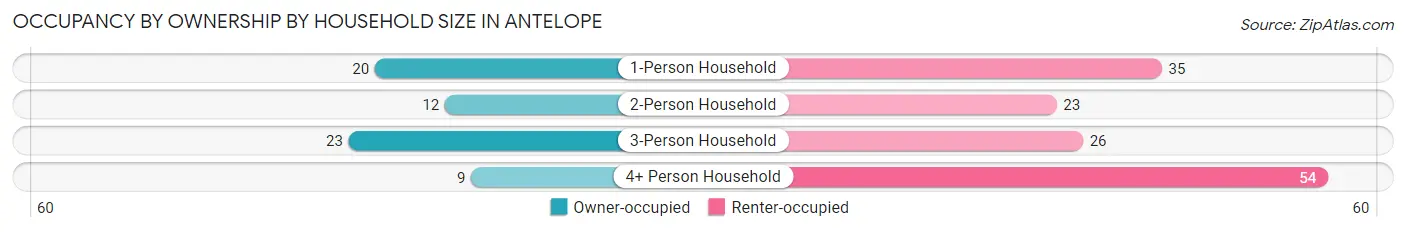
| Household Size | Owner-occupied | Renter-occupied |
| 1-Person Household | 20 (36.4%) | 35 (63.6%) |
| 2-Person Household | 12 (34.3%) | 23 (65.7%) |
| 3-Person Household | 23 (46.9%) | 26 (53.1%) |
| 4+ Person Household | 9 (14.3%) | 54 (85.7%) |
| Total Housing Units | 64 (31.7%) | 138 (68.3%) |
Occupancy by Educational Attainment in Antelope
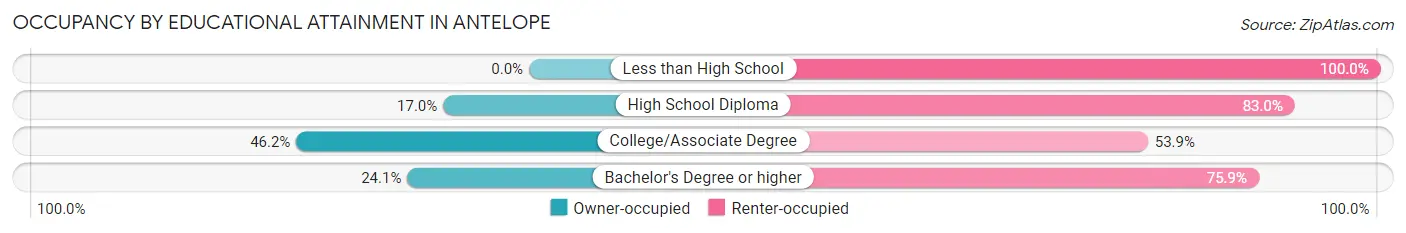
| Household Size | Owner-occupied | Renter-occupied |
| Less than High School | 0 (0.0%) | 6 (100.0%) |
| High School Diploma | 8 (17.0%) | 39 (83.0%) |
| College/Associate Degree | 42 (46.2%) | 49 (53.8%) |
| Bachelor's Degree or higher | 14 (24.1%) | 44 (75.9%) |
Occupancy by Age of Householder in Antelope
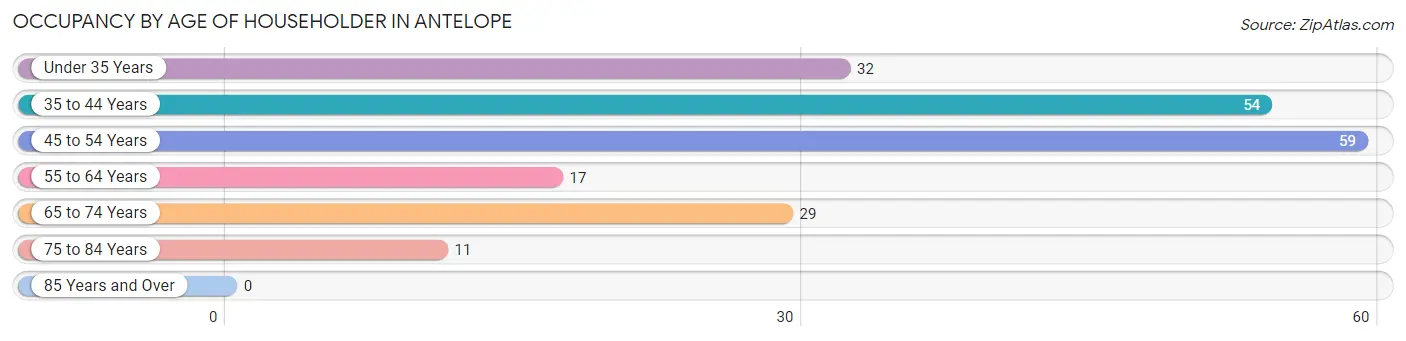
| Age Bracket | # Households | % Households |
| Under 35 Years | 32 | 15.8% |
| 35 to 44 Years | 54 | 26.7% |
| 45 to 54 Years | 59 | 29.2% |
| 55 to 64 Years | 17 | 8.4% |
| 65 to 74 Years | 29 | 14.4% |
| 75 to 84 Years | 11 | 5.4% |
| 85 Years and Over | 0 | 0.0% |
| Total | 202 | 100.0% |
Housing Finances in Antelope
Median Income by Occupancy in Antelope
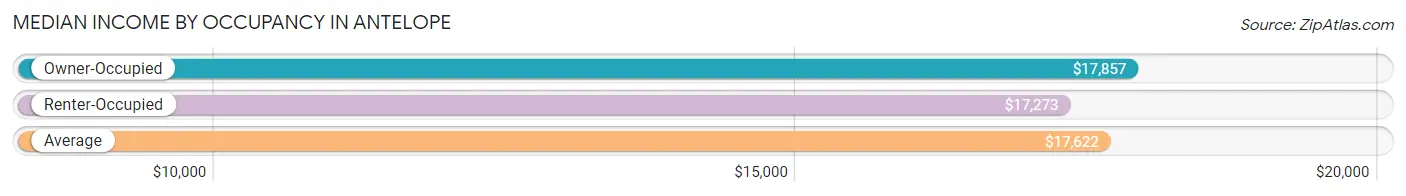
| Occupancy Type | # Households | Median Income |
| Owner-Occupied | 64 (31.7%) | $17,857 |
| Renter-Occupied | 138 (68.3%) | $17,273 |
| Average | 202 (100.0%) | $17,622 |
Occupancy by Householder Income Bracket in Antelope
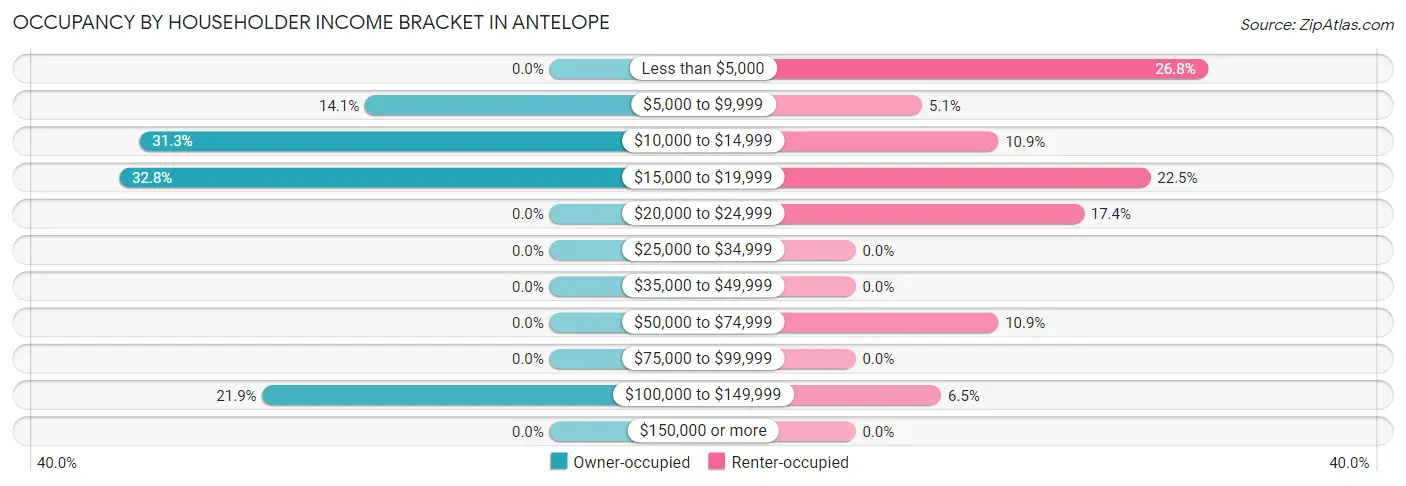
| Income Bracket | Owner-occupied | Renter-occupied |
| Less than $5,000 | 0 (0.0%) | 37 (26.8%) |
| $5,000 to $9,999 | 9 (14.1%) | 7 (5.1%) |
| $10,000 to $14,999 | 20 (31.2%) | 15 (10.9%) |
| $15,000 to $19,999 | 21 (32.8%) | 31 (22.5%) |
| $20,000 to $24,999 | 0 (0.0%) | 24 (17.4%) |
| $25,000 to $34,999 | 0 (0.0%) | 0 (0.0%) |
| $35,000 to $49,999 | 0 (0.0%) | 0 (0.0%) |
| $50,000 to $74,999 | 0 (0.0%) | 15 (10.9%) |
| $75,000 to $99,999 | 0 (0.0%) | 0 (0.0%) |
| $100,000 to $149,999 | 14 (21.9%) | 9 (6.5%) |
| $150,000 or more | 0 (0.0%) | 0 (0.0%) |
| Total | 64 (100.0%) | 138 (100.0%) |
Monthly Housing Cost Tiers in Antelope
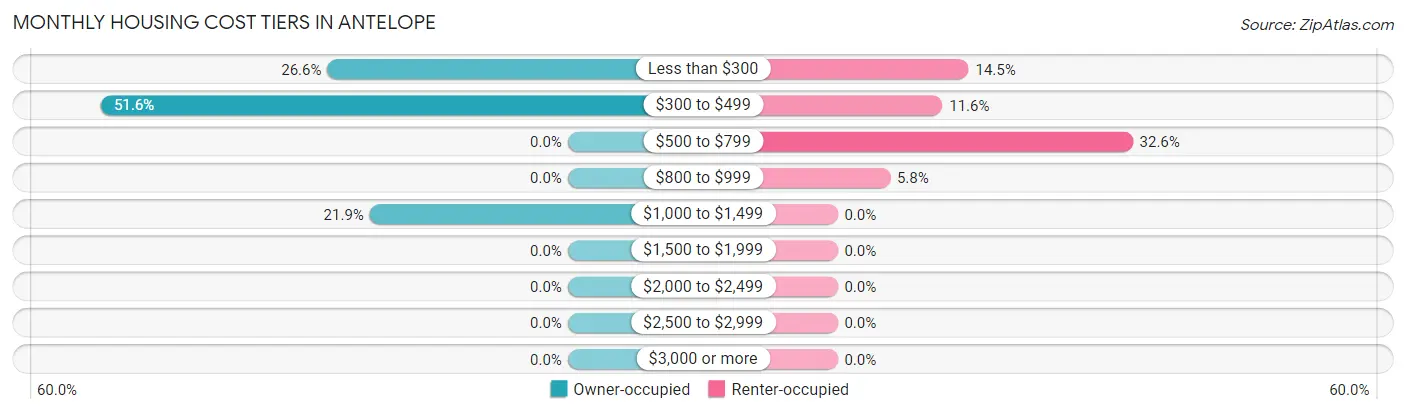
| Monthly Cost | Owner-occupied | Renter-occupied |
| Less than $300 | 17 (26.6%) | 20 (14.5%) |
| $300 to $499 | 33 (51.6%) | 16 (11.6%) |
| $500 to $799 | 0 (0.0%) | 45 (32.6%) |
| $800 to $999 | 0 (0.0%) | 8 (5.8%) |
| $1,000 to $1,499 | 14 (21.9%) | 0 (0.0%) |
| $1,500 to $1,999 | 0 (0.0%) | 0 (0.0%) |
| $2,000 to $2,499 | 0 (0.0%) | 0 (0.0%) |
| $2,500 to $2,999 | 0 (0.0%) | 0 (0.0%) |
| $3,000 or more | 0 (0.0%) | 0 (0.0%) |
| Total | 64 (100.0%) | 138 (100.0%) |
Physical Housing Characteristics in Antelope
Housing Structures in Antelope
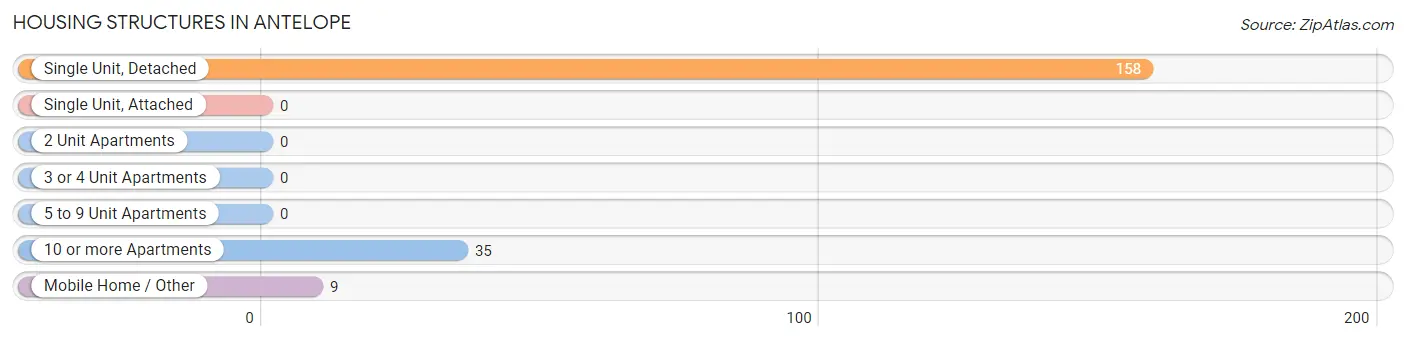
| Structure Type | # Housing Units | % Housing Units |
| Single Unit, Detached | 158 | 78.2% |
| Single Unit, Attached | 0 | 0.0% |
| 2 Unit Apartments | 0 | 0.0% |
| 3 or 4 Unit Apartments | 0 | 0.0% |
| 5 to 9 Unit Apartments | 0 | 0.0% |
| 10 or more Apartments | 35 | 17.3% |
| Mobile Home / Other | 9 | 4.5% |
| Total | 202 | 100.0% |
Housing Structures by Occupancy in Antelope
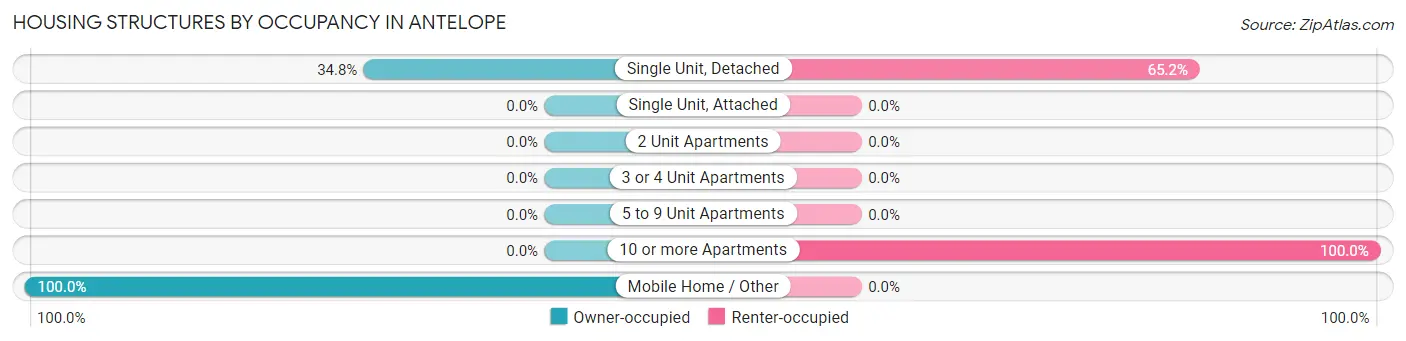
| Structure Type | Owner-occupied | Renter-occupied |
| Single Unit, Detached | 55 (34.8%) | 103 (65.2%) |
| Single Unit, Attached | 0 (0.0%) | 0 (0.0%) |
| 2 Unit Apartments | 0 (0.0%) | 0 (0.0%) |
| 3 or 4 Unit Apartments | 0 (0.0%) | 0 (0.0%) |
| 5 to 9 Unit Apartments | 0 (0.0%) | 0 (0.0%) |
| 10 or more Apartments | 0 (0.0%) | 35 (100.0%) |
| Mobile Home / Other | 9 (100.0%) | 0 (0.0%) |
| Total | 64 (31.7%) | 138 (68.3%) |
Housing Structures by Number of Rooms in Antelope
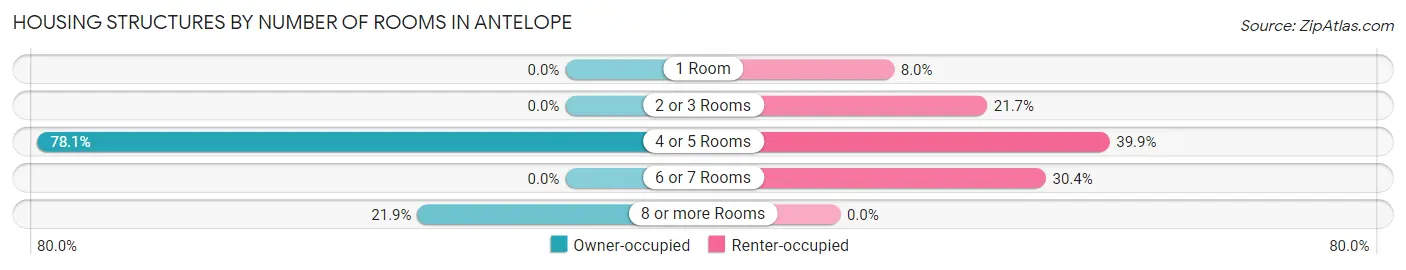
| Number of Rooms | Owner-occupied | Renter-occupied |
| 1 Room | 0 (0.0%) | 11 (8.0%) |
| 2 or 3 Rooms | 0 (0.0%) | 30 (21.7%) |
| 4 or 5 Rooms | 50 (78.1%) | 55 (39.9%) |
| 6 or 7 Rooms | 0 (0.0%) | 42 (30.4%) |
| 8 or more Rooms | 14 (21.9%) | 0 (0.0%) |
| Total | 64 (100.0%) | 138 (100.0%) |
Housing Structure by Heating Type in Antelope
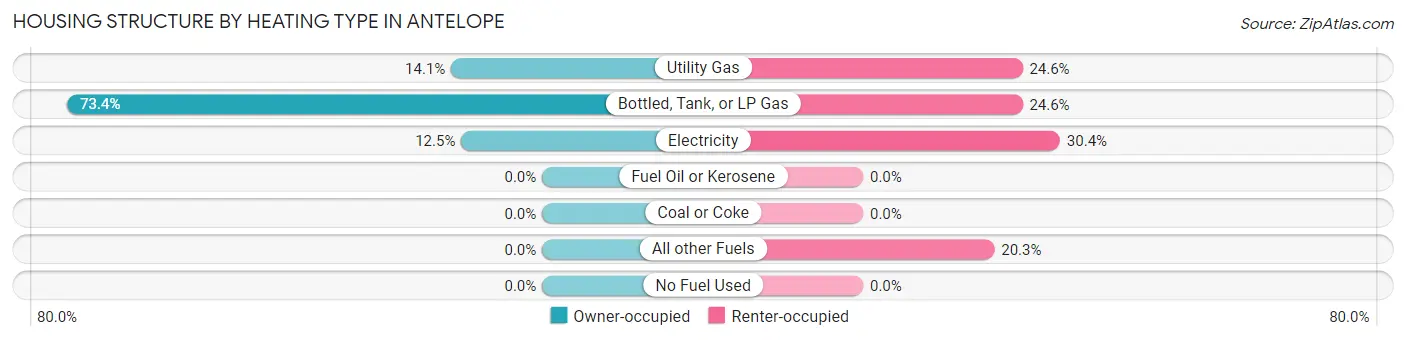
| Heating Type | Owner-occupied | Renter-occupied |
| Utility Gas | 9 (14.1%) | 34 (24.6%) |
| Bottled, Tank, or LP Gas | 47 (73.4%) | 34 (24.6%) |
| Electricity | 8 (12.5%) | 42 (30.4%) |
| Fuel Oil or Kerosene | 0 (0.0%) | 0 (0.0%) |
| Coal or Coke | 0 (0.0%) | 0 (0.0%) |
| All other Fuels | 0 (0.0%) | 28 (20.3%) |
| No Fuel Used | 0 (0.0%) | 0 (0.0%) |
| Total | 64 (100.0%) | 138 (100.0%) |
Household Vehicle Usage in Antelope
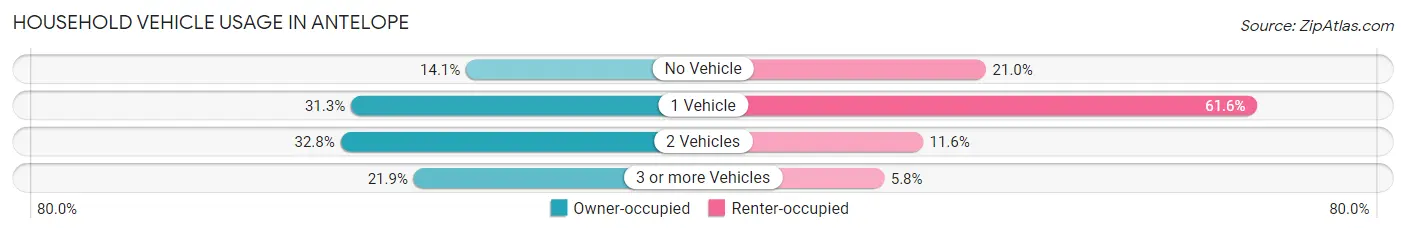
| Vehicles per Household | Owner-occupied | Renter-occupied |
| No Vehicle | 9 (14.1%) | 29 (21.0%) |
| 1 Vehicle | 20 (31.2%) | 85 (61.6%) |
| 2 Vehicles | 21 (32.8%) | 16 (11.6%) |
| 3 or more Vehicles | 14 (21.9%) | 8 (5.8%) |
| Total | 64 (100.0%) | 138 (100.0%) |
Real Estate & Mortgages in Antelope
Real Estate and Mortgage Overview in Antelope
| Characteristic | Without Mortgage | With Mortgage |
| Housing Units | 50 | 14 |
| Median Property Value | $9,999 | $0 |
| Median Household Income | $14,167 | $0 |
| Monthly Housing Costs | $317 | $0 |
| Real Estate Taxes | - | - |
Property Value by Mortgage Status in Antelope
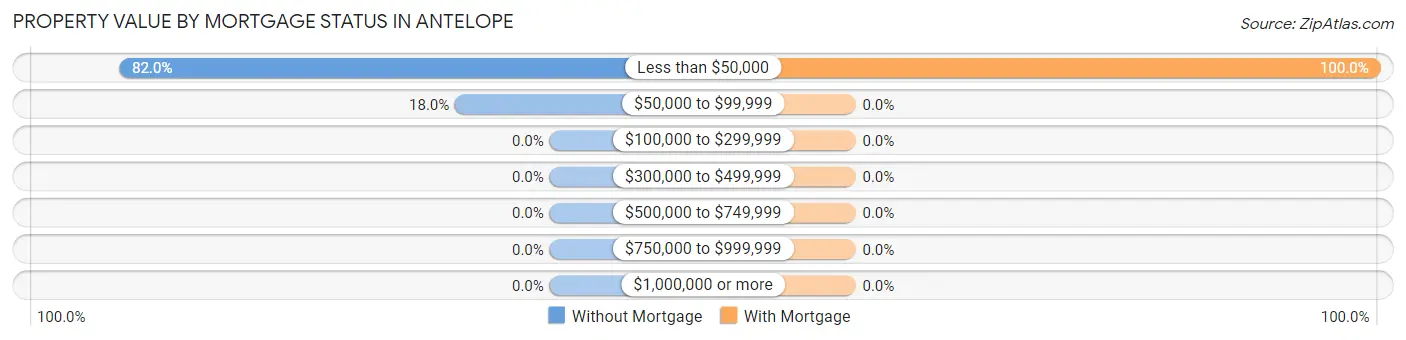
| Property Value | Without Mortgage | With Mortgage |
| Less than $50,000 | 41 (82.0%) | 14 (100.0%) |
| $50,000 to $99,999 | 9 (18.0%) | 0 (0.0%) |
| $100,000 to $299,999 | 0 (0.0%) | 0 (0.0%) |
| $300,000 to $499,999 | 0 (0.0%) | 0 (0.0%) |
| $500,000 to $749,999 | 0 (0.0%) | 0 (0.0%) |
| $750,000 to $999,999 | 0 (0.0%) | 0 (0.0%) |
| $1,000,000 or more | 0 (0.0%) | 0 (0.0%) |
| Total | 50 (100.0%) | 14 (100.0%) |
Household Income by Mortgage Status in Antelope
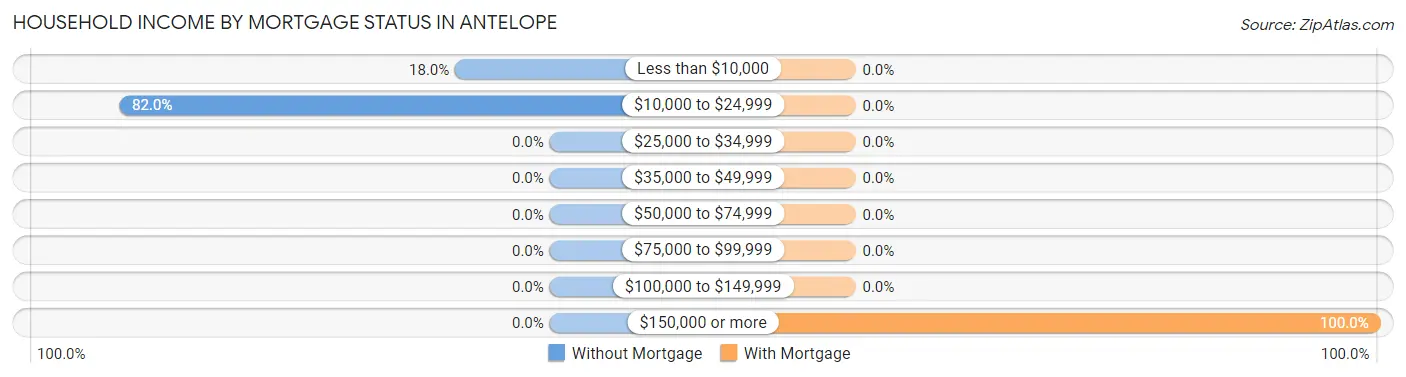
| Household Income | Without Mortgage | With Mortgage |
| Less than $10,000 | 9 (18.0%) | 0 (0.0%) |
| $10,000 to $24,999 | 41 (82.0%) | 0 (0.0%) |
| $25,000 to $34,999 | 0 (0.0%) | 0 (0.0%) |
| $35,000 to $49,999 | 0 (0.0%) | 0 (0.0%) |
| $50,000 to $74,999 | 0 (0.0%) | 0 (0.0%) |
| $75,000 to $99,999 | 0 (0.0%) | 0 (0.0%) |
| $100,000 to $149,999 | 0 (0.0%) | 0 (0.0%) |
| $150,000 or more | 0 (0.0%) | 14 (100.0%) |
| Total | 50 (100.0%) | 14 (100.0%) |
Property Value to Household Income Ratio in Antelope
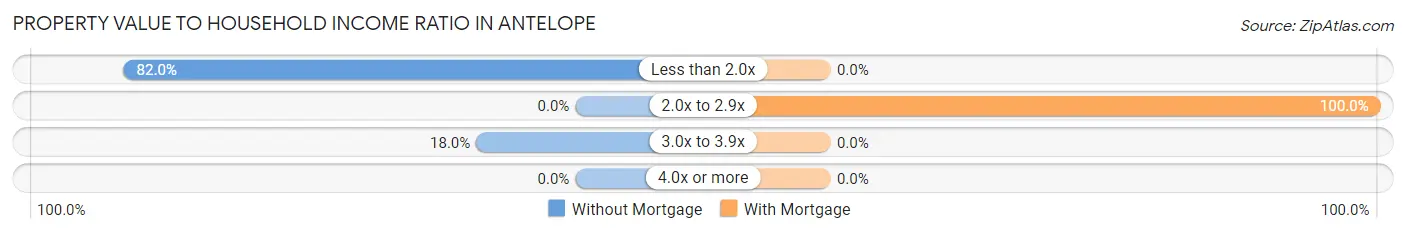
| Value-to-Income Ratio | Without Mortgage | With Mortgage |
| Less than 2.0x | 41 (82.0%) | 0 (0.0%) |
| 2.0x to 2.9x | 0 (0.0%) | 14 (100.0%) |
| 3.0x to 3.9x | 9 (18.0%) | 0 (0.0%) |
| 4.0x or more | 0 (0.0%) | 0 (0.0%) |
| Total | 50 (100.0%) | 14 (100.0%) |
Real Estate Taxes by Mortgage Status in Antelope
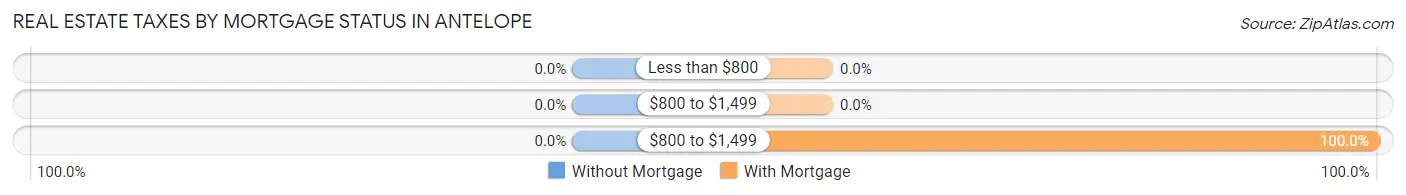
| Property Taxes | Without Mortgage | With Mortgage |
| Less than $800 | 0 (0.0%) | 0 (0.0%) |
| $800 to $1,499 | 0 (0.0%) | 0 (0.0%) |
| $800 to $1,499 | 0 (0.0%) | 14 (100.0%) |
| Total | 50 (100.0%) | 14 (100.0%) |
Health & Disability in Antelope
Health Insurance Coverage by Age in Antelope
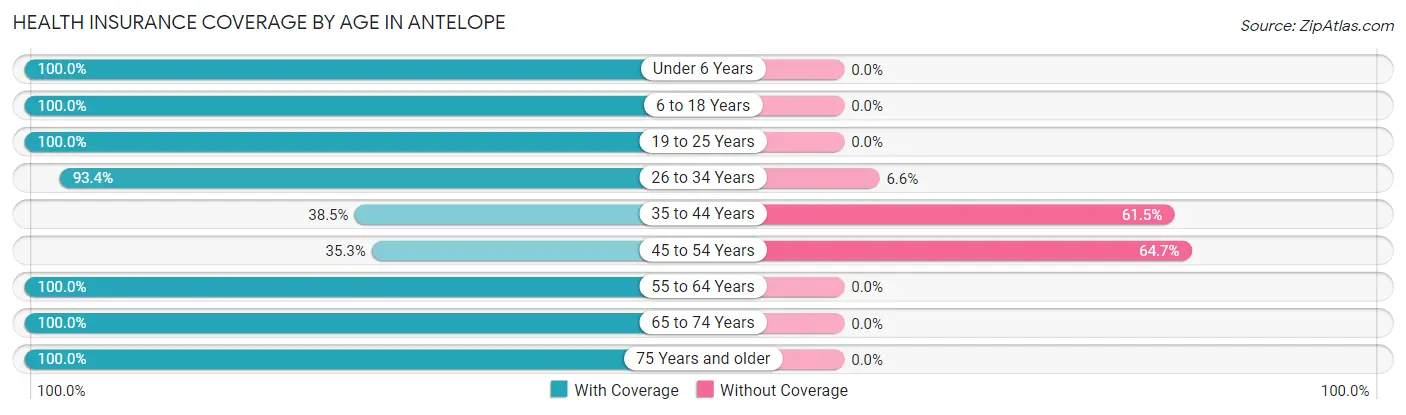
| Age Bracket | With Coverage | Without Coverage |
| Under 6 Years | 69 (100.0%) | 0 (0.0%) |
| 6 to 18 Years | 239 (100.0%) | 0 (0.0%) |
| 19 to 25 Years | 6 (100.0%) | 0 (0.0%) |
| 26 to 34 Years | 57 (93.4%) | 4 (6.6%) |
| 35 to 44 Years | 62 (38.5%) | 99 (61.5%) |
| 45 to 54 Years | 36 (35.3%) | 66 (64.7%) |
| 55 to 64 Years | 17 (100.0%) | 0 (0.0%) |
| 65 to 74 Years | 35 (100.0%) | 0 (0.0%) |
| 75 Years and older | 11 (100.0%) | 0 (0.0%) |
| Total | 532 (75.9%) | 169 (24.1%) |
Health Insurance Coverage by Citizenship Status in Antelope
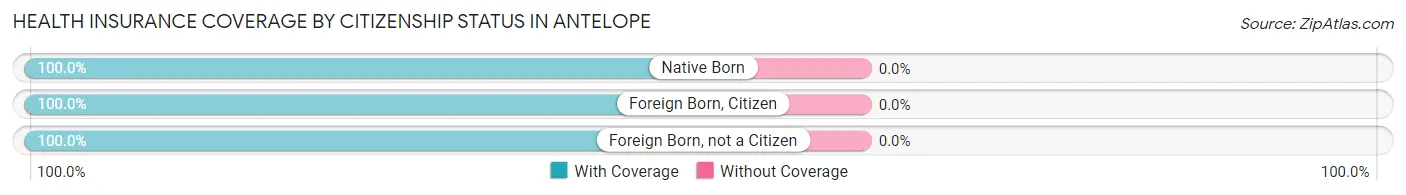
| Citizenship Status | With Coverage | Without Coverage |
| Native Born | 69 (100.0%) | 0 (0.0%) |
| Foreign Born, Citizen | 239 (100.0%) | 0 (0.0%) |
| Foreign Born, not a Citizen | 6 (100.0%) | 0 (0.0%) |
Health Insurance Coverage by Household Income in Antelope
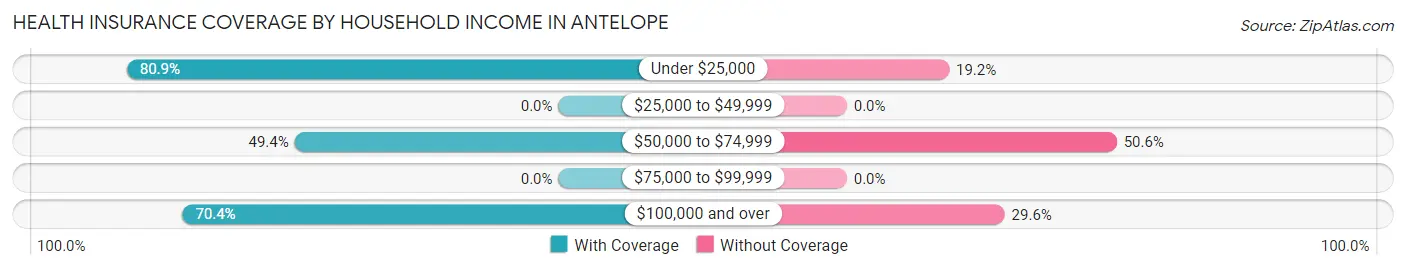
| Household Income | With Coverage | Without Coverage |
| Under $25,000 | 439 (80.8%) | 104 (19.2%) |
| $25,000 to $49,999 | 0 (0.0%) | 0 (0.0%) |
| $50,000 to $74,999 | 43 (49.4%) | 44 (50.6%) |
| $75,000 to $99,999 | 0 (0.0%) | 0 (0.0%) |
| $100,000 and over | 50 (70.4%) | 21 (29.6%) |
Public vs Private Health Insurance Coverage by Age in Antelope
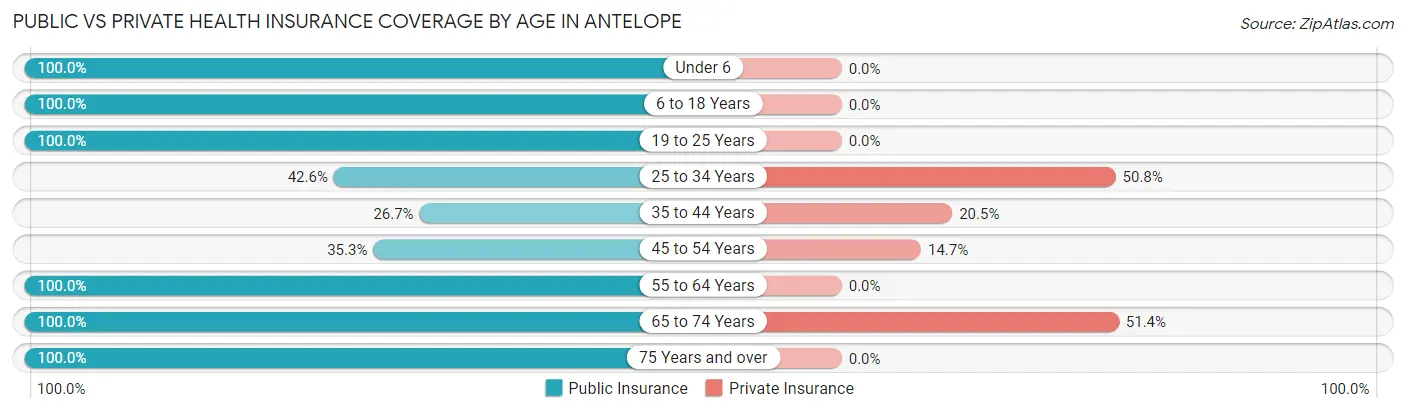
| Age Bracket | Public Insurance | Private Insurance |
| Under 6 | 69 (100.0%) | 0 (0.0%) |
| 6 to 18 Years | 239 (100.0%) | 0 (0.0%) |
| 19 to 25 Years | 6 (100.0%) | 0 (0.0%) |
| 25 to 34 Years | 26 (42.6%) | 31 (50.8%) |
| 35 to 44 Years | 43 (26.7%) | 33 (20.5%) |
| 45 to 54 Years | 36 (35.3%) | 15 (14.7%) |
| 55 to 64 Years | 17 (100.0%) | 0 (0.0%) |
| 65 to 74 Years | 35 (100.0%) | 18 (51.4%) |
| 75 Years and over | 11 (100.0%) | 0 (0.0%) |
| Total | 482 (68.8%) | 97 (13.8%) |
Disability Status by Sex by Age in Antelope
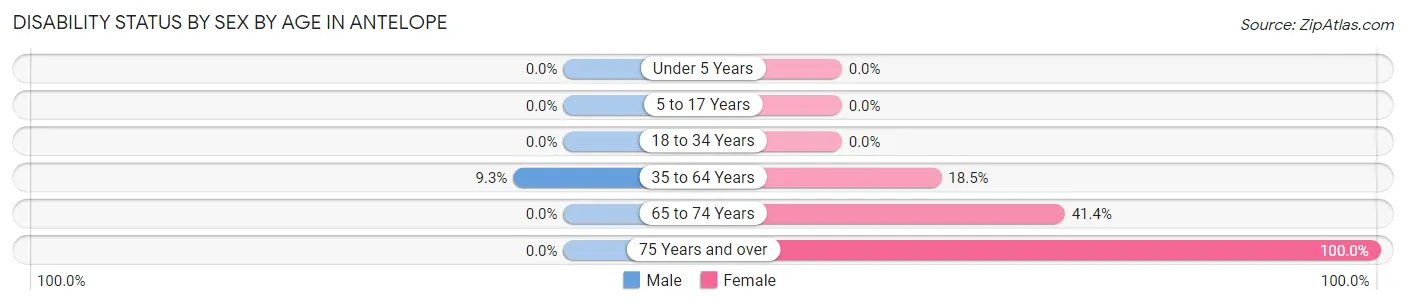
| Age Bracket | Male | Female |
| Under 5 Years | 0 (0.0%) | 0 (0.0%) |
| 5 to 17 Years | 0 (0.0%) | 0 (0.0%) |
| 18 to 34 Years | 0 (0.0%) | 0 (0.0%) |
| 35 to 64 Years | 15 (9.3%) | 22 (18.5%) |
| 65 to 74 Years | 0 (0.0%) | 12 (41.4%) |
| 75 Years and over | 0 (0.0%) | 11 (100.0%) |
Disability Class by Sex by Age in Antelope
Disability Class: Hearing Difficulty
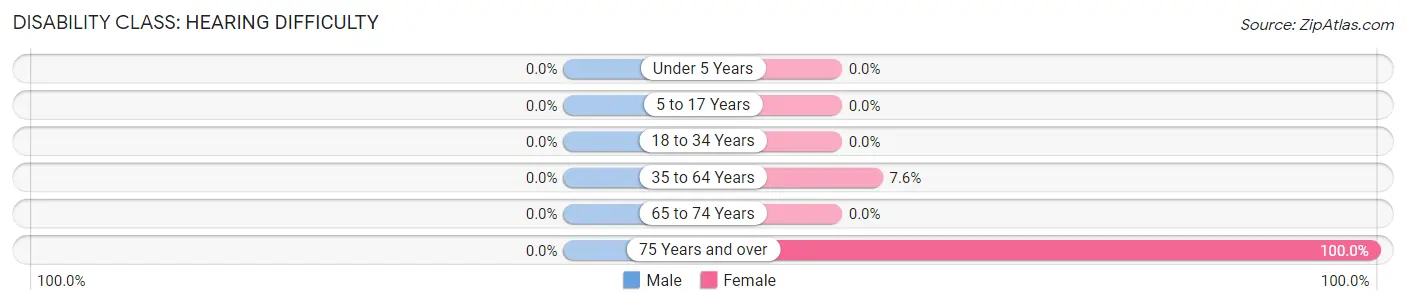
| Age Bracket | Male | Female |
| Under 5 Years | 0 (0.0%) | 0 (0.0%) |
| 5 to 17 Years | 0 (0.0%) | 0 (0.0%) |
| 18 to 34 Years | 0 (0.0%) | 0 (0.0%) |
| 35 to 64 Years | 0 (0.0%) | 9 (7.6%) |
| 65 to 74 Years | 0 (0.0%) | 0 (0.0%) |
| 75 Years and over | 0 (0.0%) | 11 (100.0%) |
Disability Class: Vision Difficulty
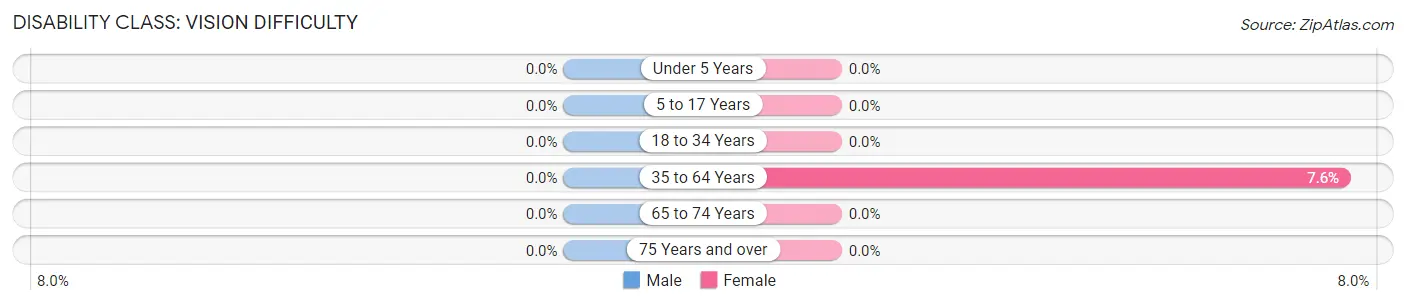
| Age Bracket | Male | Female |
| Under 5 Years | 0 (0.0%) | 0 (0.0%) |
| 5 to 17 Years | 0 (0.0%) | 0 (0.0%) |
| 18 to 34 Years | 0 (0.0%) | 0 (0.0%) |
| 35 to 64 Years | 0 (0.0%) | 9 (7.6%) |
| 65 to 74 Years | 0 (0.0%) | 0 (0.0%) |
| 75 Years and over | 0 (0.0%) | 0 (0.0%) |
Disability Class: Cognitive Difficulty
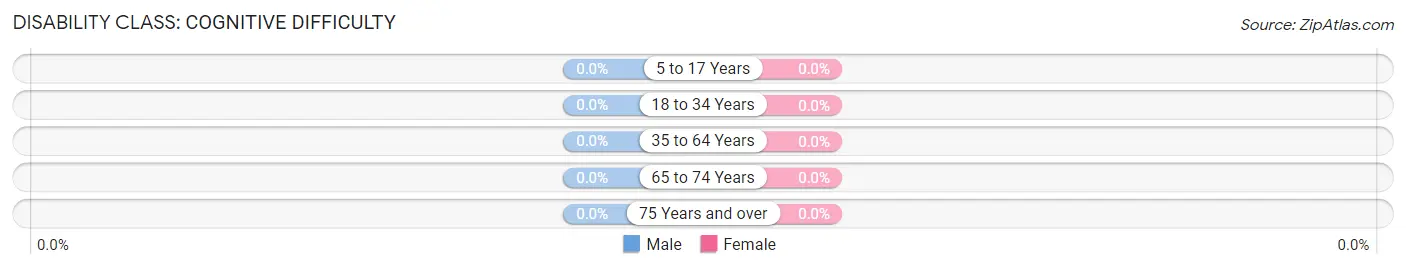
| Age Bracket | Male | Female |
| 5 to 17 Years | 0 (0.0%) | 0 (0.0%) |
| 18 to 34 Years | 0 (0.0%) | 0 (0.0%) |
| 35 to 64 Years | 0 (0.0%) | 0 (0.0%) |
| 65 to 74 Years | 0 (0.0%) | 0 (0.0%) |
| 75 Years and over | 0 (0.0%) | 0 (0.0%) |
Disability Class: Ambulatory Difficulty
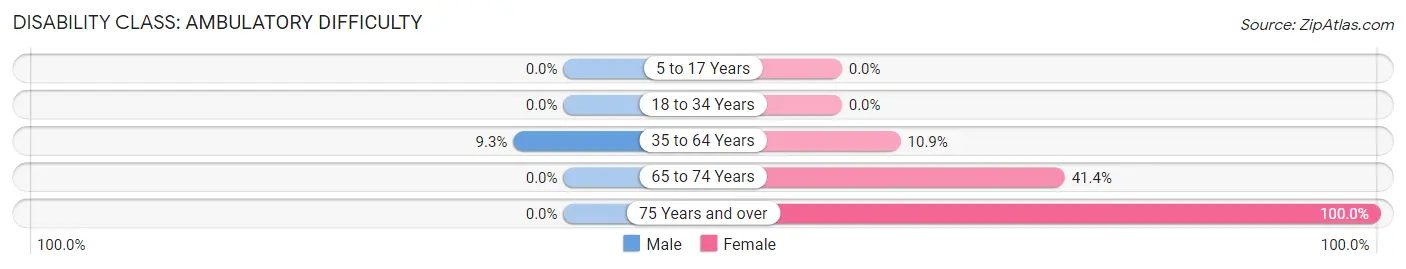
| Age Bracket | Male | Female |
| 5 to 17 Years | 0 (0.0%) | 0 (0.0%) |
| 18 to 34 Years | 0 (0.0%) | 0 (0.0%) |
| 35 to 64 Years | 15 (9.3%) | 13 (10.9%) |
| 65 to 74 Years | 0 (0.0%) | 12 (41.4%) |
| 75 Years and over | 0 (0.0%) | 11 (100.0%) |
Disability Class: Self-Care Difficulty
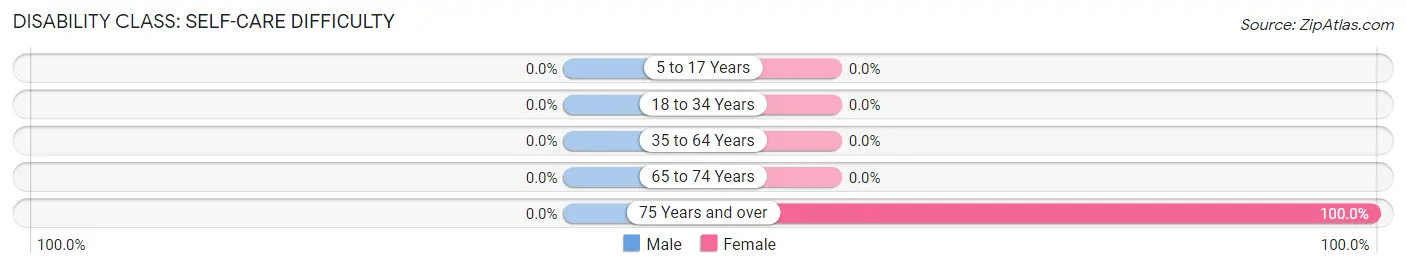
| Age Bracket | Male | Female |
| 5 to 17 Years | 0 (0.0%) | 0 (0.0%) |
| 18 to 34 Years | 0 (0.0%) | 0 (0.0%) |
| 35 to 64 Years | 0 (0.0%) | 0 (0.0%) |
| 65 to 74 Years | 0 (0.0%) | 0 (0.0%) |
| 75 Years and over | 0 (0.0%) | 11 (100.0%) |
Technology Access in Antelope
Computing Device Access in Antelope
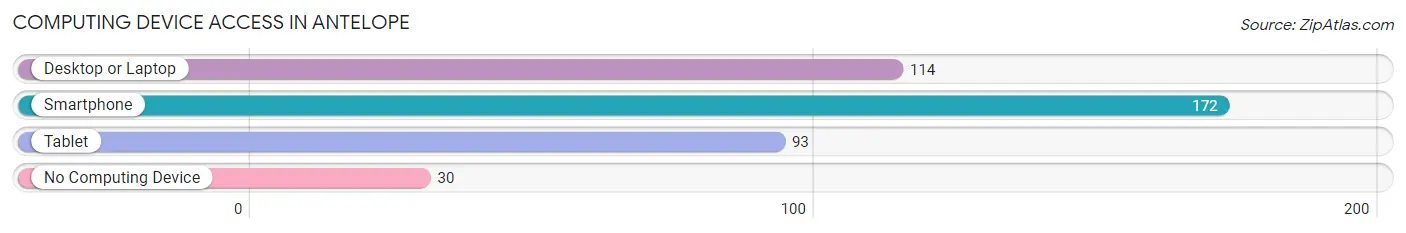
| Device Type | # Households | % Households |
| Desktop or Laptop | 114 | 56.4% |
| Smartphone | 172 | 85.2% |
| Tablet | 93 | 46.0% |
| No Computing Device | 30 | 14.8% |
| Total | 202 | 100.0% |
Internet Access in Antelope
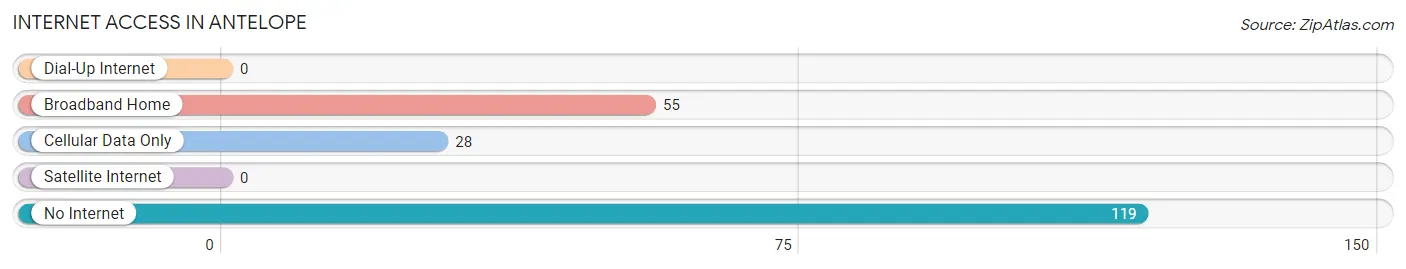
| Internet Type | # Households | % Households |
| Dial-Up Internet | 0 | 0.0% |
| Broadband Home | 55 | 27.2% |
| Cellular Data Only | 28 | 13.9% |
| Satellite Internet | 0 | 0.0% |
| No Internet | 119 | 58.9% |
| Total | 202 | 100.0% |
Antelope Summary
Antelope, South Dakota is a small town located in the southeastern corner of the state. It is situated in the rolling hills of the Missouri River Valley, and is surrounded by the vast prairies of the Great Plains. The town has a population of just over 500 people, and is the county seat of Roberts County.
History
Antelope was founded in 1883 by a group of settlers from Wisconsin. The town was named after the nearby Antelope Creek, which was named by the Lakota Sioux who lived in the area. The settlers were attracted to the area by the abundance of natural resources, including timber, water, and fertile soil.
The town quickly grew, and by the early 1900s, it had become a thriving agricultural center. The town was home to several businesses, including a bank, a hotel, a general store, and a post office. The town also had a school, a church, and a newspaper.
In the early 1900s, the town was also home to a large number of immigrants from Norway, Sweden, and Germany. These immigrants brought with them their own culture and traditions, which still influence the town today.
Geography
Antelope is located in the southeastern corner of South Dakota, in the rolling hills of the Missouri River Valley. The town is surrounded by the vast prairies of the Great Plains, and is located about 30 miles from the state capital of Pierre.
The town is situated at an elevation of 1,890 feet, and has a total area of 0.6 square miles. The town is located in a semi-arid climate, with hot summers and cold winters. The average annual temperature is around 50 degrees Fahrenheit, and the average annual precipitation is around 17 inches.
Economy
The economy of Antelope is largely based on agriculture. The town is home to several farms, which produce a variety of crops, including wheat, corn, soybeans, and alfalfa. The town also has a few small businesses, including a grocery store, a hardware store, and a gas station.
The town is also home to a few manufacturing companies, which produce a variety of products, including furniture, clothing, and electronics. The town also has a few restaurants, bars, and other services.
Demographics
As of the 2010 census, the population of Antelope was 514 people. The town is predominantly white, with a small minority population of Native Americans, Hispanics, and African Americans. The median household income is around $35,000, and the median home value is around $90,000.
The town is served by the Antelope Public School District, which includes an elementary school, a middle school, and a high school. The town also has a library, a post office, and a few churches.
Conclusion
Antelope, South Dakota is a small town located in the southeastern corner of the state. It is situated in the rolling hills of the Missouri River Valley, and is surrounded by the vast prairies of the Great Plains. The town has a population of just over 500 people, and is the county seat of Roberts County. The town has a long history, and is home to a variety of cultures and traditions. The economy of the town is largely based on agriculture, and the town also has a few small businesses. The town is predominantly white, with a small minority population of Native Americans, Hispanics, and African Americans. The town is served by the Antelope Public School District, and has a library, a post office, and a few churches.
Common Questions
What is Per Capita Income in Antelope?
Per Capita income in Antelope is $10,266.
What is the Median Family Income in Antelope?
Median Family Income in Antelope is $17,946.
What is the Median Household income in Antelope?
Median Household Income in Antelope is $17,622.
What is Inequality or Gini Index in Antelope?
Inequality or Gini Index in Antelope is 0.58.
What is the Total Population of Antelope?
Total Population of Antelope is 701.
What is the Total Male Population of Antelope?
Total Male Population of Antelope is 409.
What is the Total Female Population of Antelope?
Total Female Population of Antelope is 292.
What is the Ratio of Males per 100 Females in Antelope?
There are 140.07 Males per 100 Females in Antelope.
What is the Ratio of Females per 100 Males in Antelope?
There are 71.39 Females per 100 Males in Antelope.
What is the Median Population Age in Antelope?
Median Population Age in Antelope is 30.8 Years.
What is the Average Family Size in Antelope
Average Family Size in Antelope is 4.3 People.
What is the Average Household Size in Antelope
Average Household Size in Antelope is 3.5 People.
How Large is the Labor Force in Antelope?
There are 142 People in the Labor Forcein in Antelope.
What is the Percentage of People in the Labor Force in Antelope?
29.6% of People are in the Labor Force in Antelope.
What is the Unemployment Rate in Antelope?
Unemployment Rate in Antelope is 21.1%.