Timber Lake, SD Map & Demographics
Timber Lake Map
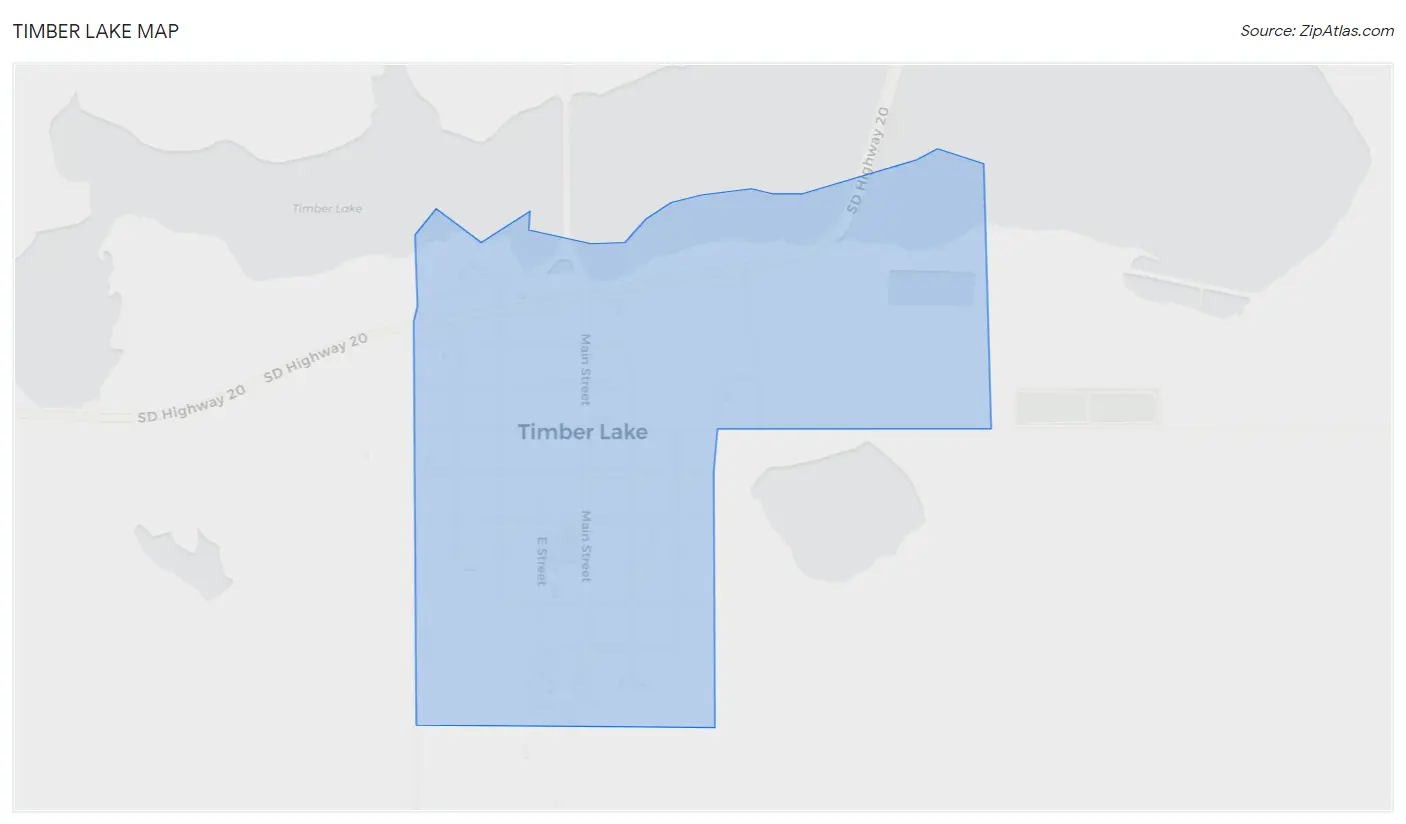
Timber Lake Overview
$26,690
PER CAPITA INCOME
$75,313
AVG FAMILY INCOME
$56,389
AVG HOUSEHOLD INCOME
46.1%
WAGE / INCOME GAP [ % ]
53.9¢/ $1
WAGE / INCOME GAP [ $ ]
$13,143
FAMILY INCOME DEFICIT
0.40
INEQUALITY / GINI INDEX
627
TOTAL POPULATION
312
MALE POPULATION
315
FEMALE POPULATION
99.05
MALES / 100 FEMALES
100.96
FEMALES / 100 MALES
30.0
MEDIAN AGE
3.2
AVG FAMILY SIZE
2.5
AVG HOUSEHOLD SIZE
306
LABOR FORCE [ PEOPLE ]
68.3%
PERCENT IN LABOR FORCE
6.2%
UNEMPLOYMENT RATE
Timber Lake Zip Codes
Timber Lake Area Codes
Income in Timber Lake
Income Overview in Timber Lake
Per Capita Income in Timber Lake is $26,690, while median incomes of families and households are $75,313 and $56,389 respectively.
| Characteristic | Number | Measure |
| Per Capita Income | 627 | $26,690 |
| Median Family Income | 151 | $75,313 |
| Mean Family Income | 151 | $82,205 |
| Median Household Income | 244 | $56,389 |
| Mean Household Income | 244 | $68,583 |
| Income Deficit | 151 | $13,143 |
| Wage / Income Gap (%) | 627 | 46.10% |
| Wage / Income Gap ($) | 627 | 53.90¢ per $1 |
| Gini / Inequality Index | 627 | 0.40 |
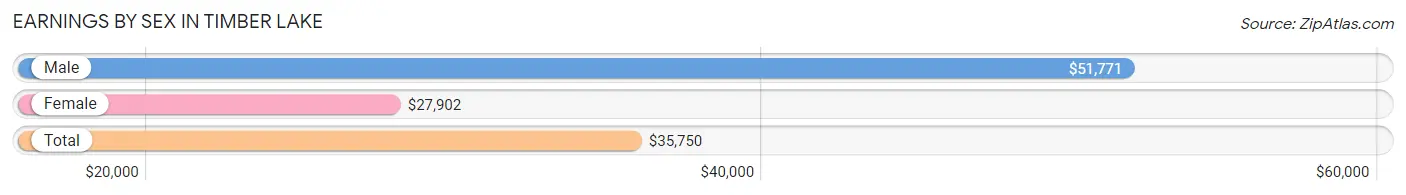
Earnings by Sex in Timber Lake
Average Earnings in Timber Lake are $35,750, $51,771 for men and $27,902 for women, a difference of 46.1%.
| Sex | Number | Average Earnings |
| Male | 159 (49.4%) | $51,771 |
| Female | 163 (50.6%) | $27,902 |
| Total | 322 (100.0%) | $35,750 |
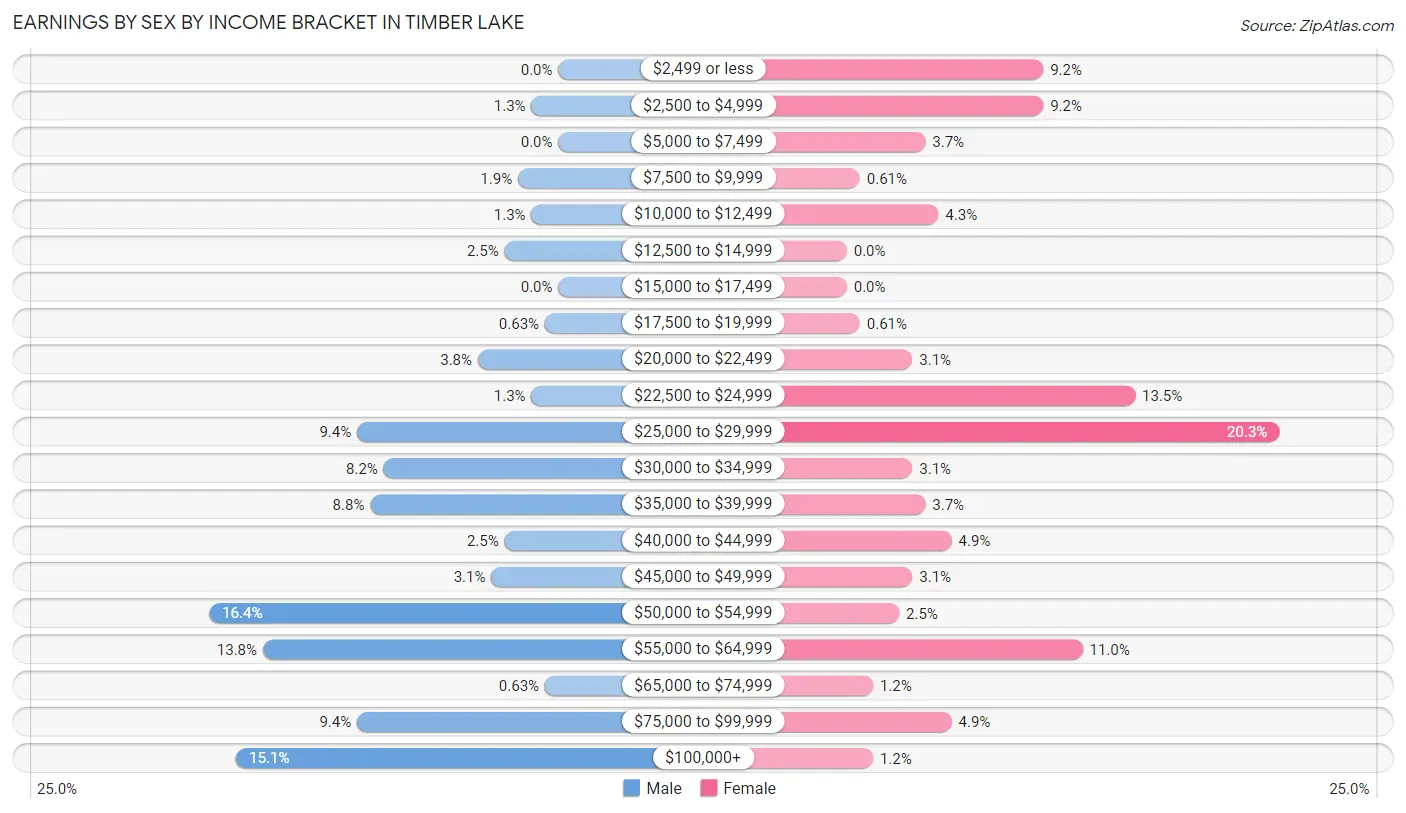
Earnings by Sex by Income Bracket in Timber Lake
The most common earnings brackets in Timber Lake are $50,000 to $54,999 for men (26 | 16.4%) and $25,000 to $29,999 for women (33 | 20.3%).
| Income | Male | Female |
| $2,499 or less | 0 (0.0%) | 15 (9.2%) |
| $2,500 to $4,999 | 2 (1.3%) | 15 (9.2%) |
| $5,000 to $7,499 | 0 (0.0%) | 6 (3.7%) |
| $7,500 to $9,999 | 3 (1.9%) | 1 (0.6%) |
| $10,000 to $12,499 | 2 (1.3%) | 7 (4.3%) |
| $12,500 to $14,999 | 4 (2.5%) | 0 (0.0%) |
| $15,000 to $17,499 | 0 (0.0%) | 0 (0.0%) |
| $17,500 to $19,999 | 1 (0.6%) | 1 (0.6%) |
| $20,000 to $22,499 | 6 (3.8%) | 5 (3.1%) |
| $22,500 to $24,999 | 2 (1.3%) | 22 (13.5%) |
| $25,000 to $29,999 | 15 (9.4%) | 33 (20.3%) |
| $30,000 to $34,999 | 13 (8.2%) | 5 (3.1%) |
| $35,000 to $39,999 | 14 (8.8%) | 6 (3.7%) |
| $40,000 to $44,999 | 4 (2.5%) | 8 (4.9%) |
| $45,000 to $49,999 | 5 (3.1%) | 5 (3.1%) |
| $50,000 to $54,999 | 26 (16.4%) | 4 (2.5%) |
| $55,000 to $64,999 | 22 (13.8%) | 18 (11.0%) |
| $65,000 to $74,999 | 1 (0.6%) | 2 (1.2%) |
| $75,000 to $99,999 | 15 (9.4%) | 8 (4.9%) |
| $100,000+ | 24 (15.1%) | 2 (1.2%) |
| Total | 159 (100.0%) | 163 (100.0%) |
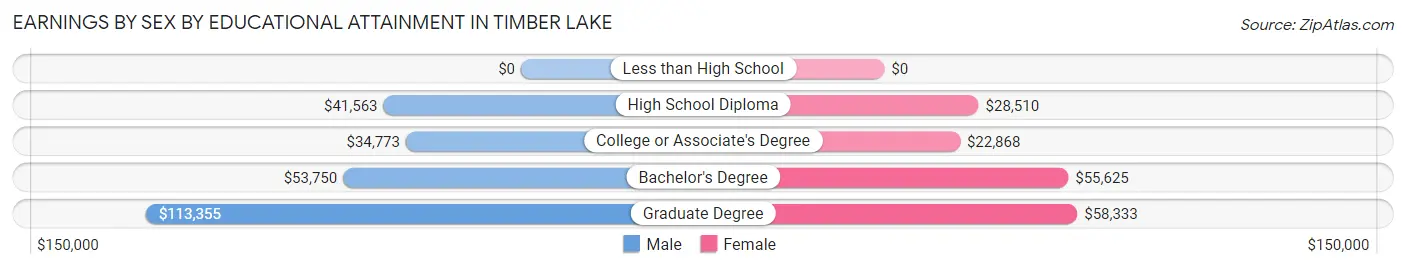
Earnings by Sex by Educational Attainment in Timber Lake
Average earnings in Timber Lake are $51,042 for men and $28,304 for women, a difference of 44.6%. Men with an educational attainment of graduate degree enjoy the highest average annual earnings of $113,355, while those with college or associate's degree education earn the least with $34,773. Women with an educational attainment of graduate degree earn the most with the average annual earnings of $58,333, while those with college or associate's degree education have the smallest earnings of $22,868.
| Educational Attainment | Male Income | Female Income |
| Less than High School | - | - |
| High School Diploma | $41,563 | $28,510 |
| College or Associate's Degree | $34,773 | $22,868 |
| Bachelor's Degree | $53,750 | $55,625 |
| Graduate Degree | $113,355 | $58,333 |
| Total | $51,042 | $28,304 |
Family Income in Timber Lake
Family Income Brackets in Timber Lake
According to the Timber Lake family income data, there are 42 families falling into the $100,000 to $149,999 income range, which is the most common income bracket and makes up 27.8% of all families. Conversely, the $200,000+ income bracket is the least frequent group with only 2 families (1.3%) belonging to this category.
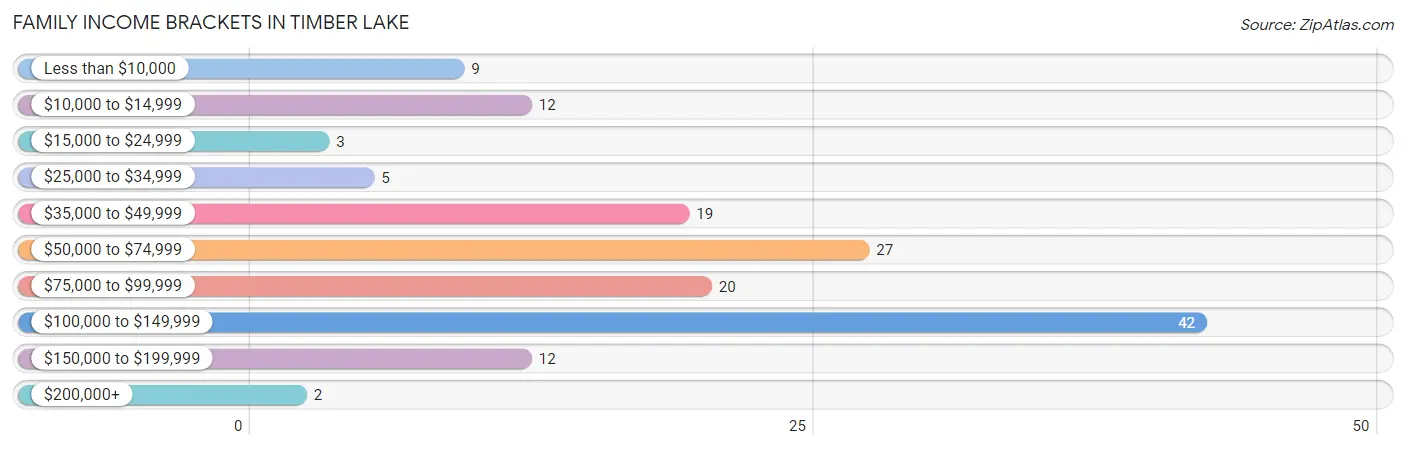
| Income Bracket | # Families | % Families |
| Less than $10,000 | 9 | 6.0% |
| $10,000 to $14,999 | 12 | 7.9% |
| $15,000 to $24,999 | 3 | 2.0% |
| $25,000 to $34,999 | 5 | 3.3% |
| $35,000 to $49,999 | 19 | 12.6% |
| $50,000 to $74,999 | 27 | 17.9% |
| $75,000 to $99,999 | 20 | 13.2% |
| $100,000 to $149,999 | 42 | 27.8% |
| $150,000 to $199,999 | 12 | 7.9% |
| $200,000+ | 2 | 1.3% |
Family Income by Famaliy Size in Timber Lake
3-person families (29 | 19.2%) account for the highest median family income in Timber Lake with $143,618 per family, while 3-person families (29 | 19.2%) have the highest median income of $47,873 per family member.
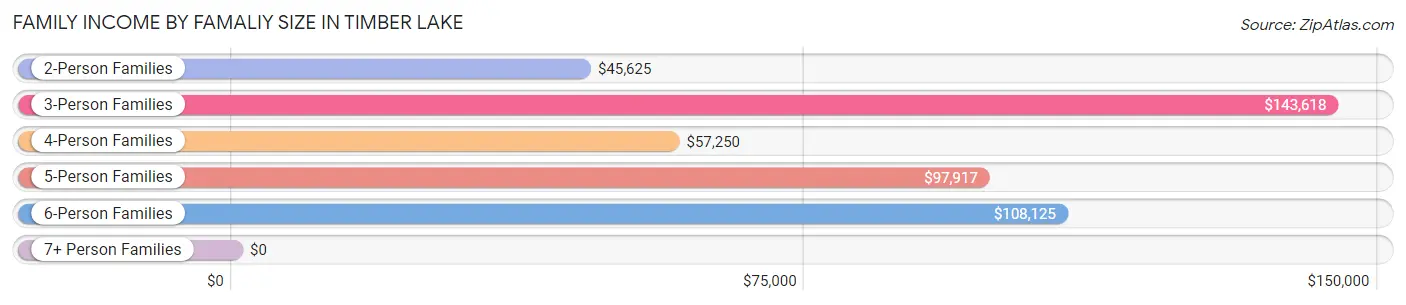
| Income Bracket | # Families | Median Income |
| 2-Person Families | 65 (43.0%) | $45,625 |
| 3-Person Families | 29 (19.2%) | $143,618 |
| 4-Person Families | 31 (20.5%) | $57,250 |
| 5-Person Families | 13 (8.6%) | $97,917 |
| 6-Person Families | 10 (6.6%) | $108,125 |
| 7+ Person Families | 3 (2.0%) | $0 |
| Total | 151 (100.0%) | $75,313 |
Family Income by Number of Earners in Timber Lake
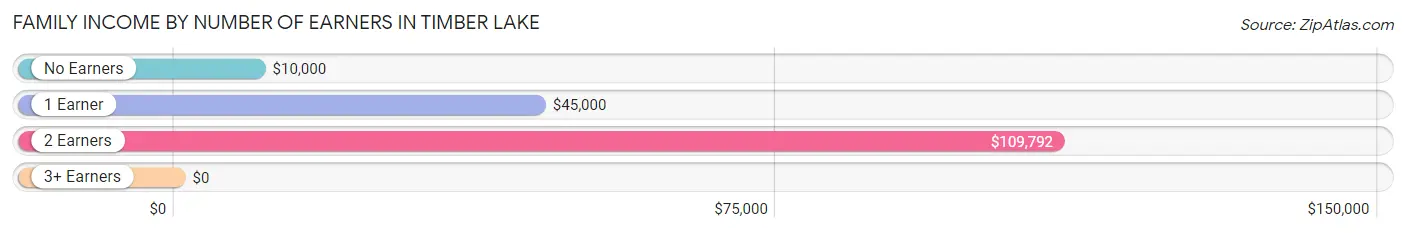
| Number of Earners | # Families | Median Income |
| No Earners | 14 (9.3%) | $10,000 |
| 1 Earner | 48 (31.8%) | $45,000 |
| 2 Earners | 87 (57.6%) | $109,792 |
| 3+ Earners | 2 (1.3%) | $0 |
| Total | 151 (100.0%) | $75,313 |
Household Income in Timber Lake
Household Income Brackets in Timber Lake
With 44 households falling in the category, the $100,000 to $149,999 income range is the most frequent in Timber Lake, accounting for 18.0% of all households. In contrast, only 2 households (0.8%) fall into the $200,000+ income bracket, making it the least populous group.
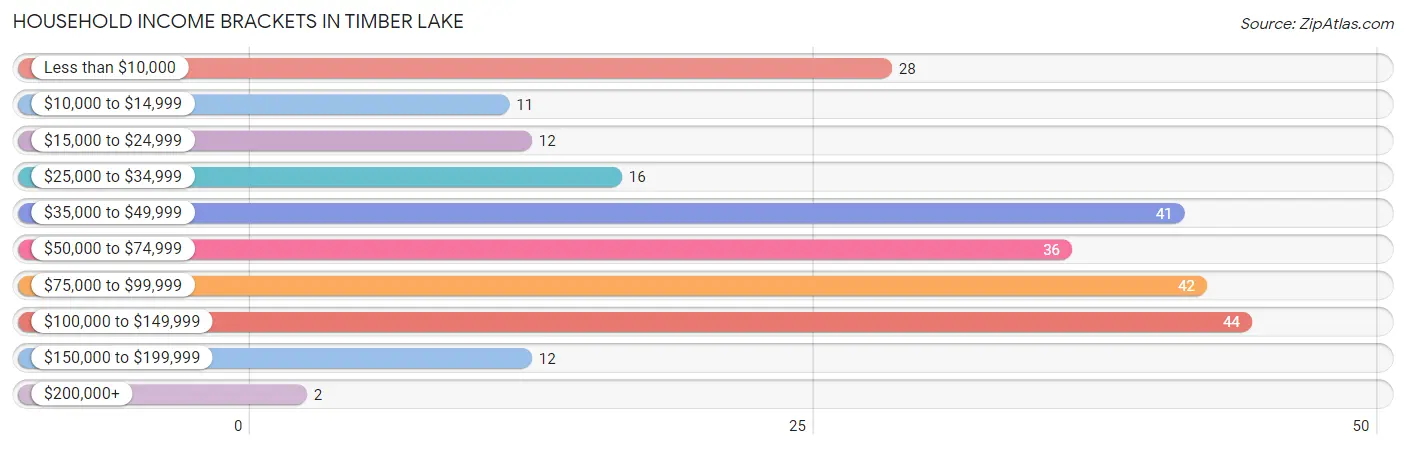
| Income Bracket | # Households | % Households |
| Less than $10,000 | 28 | 11.5% |
| $10,000 to $14,999 | 11 | 4.5% |
| $15,000 to $24,999 | 12 | 4.9% |
| $25,000 to $34,999 | 16 | 6.6% |
| $35,000 to $49,999 | 41 | 16.8% |
| $50,000 to $74,999 | 36 | 14.8% |
| $75,000 to $99,999 | 42 | 17.2% |
| $100,000 to $149,999 | 44 | 18.0% |
| $150,000 to $199,999 | 12 | 4.9% |
| $200,000+ | 2 | 0.8% |
Household Income by Householder Age in Timber Lake
The median household income in Timber Lake is $56,389, with the highest median household income of $82,917 found in the 25 to 44 years age bracket for the primary householder. A total of 103 households (42.2%) fall into this category. Meanwhile, the 45 to 64 years age bracket for the primary householder has the lowest median household income of $27,250, with 59 households (24.2%) in this group.
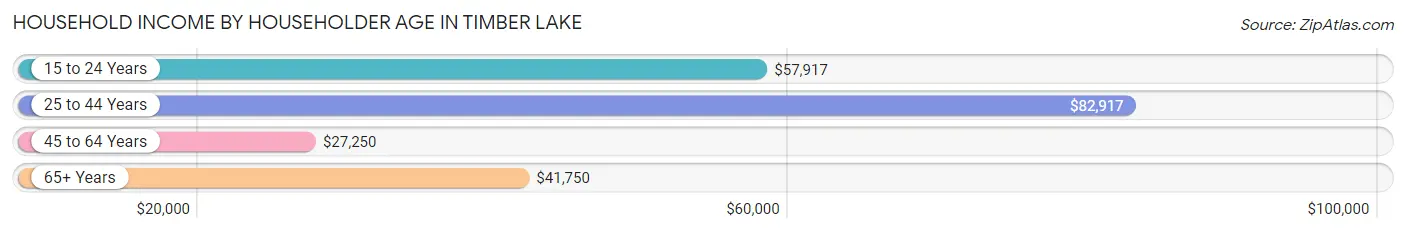
| Income Bracket | # Households | Median Income |
| 15 to 24 Years | 25 (10.2%) | $57,917 |
| 25 to 44 Years | 103 (42.2%) | $82,917 |
| 45 to 64 Years | 59 (24.2%) | $27,250 |
| 65+ Years | 57 (23.4%) | $41,750 |
| Total | 244 (100.0%) | $56,389 |
Poverty in Timber Lake
Income Below Poverty by Sex and Age in Timber Lake
With 11.2% poverty level for males and 17.5% for females among the residents of Timber Lake, 16 and 17 year old males and 18 to 24 year old females are the most vulnerable to poverty, with 4 males (44.4%) and 10 females (40.0%) in their respective age groups living below the poverty level.
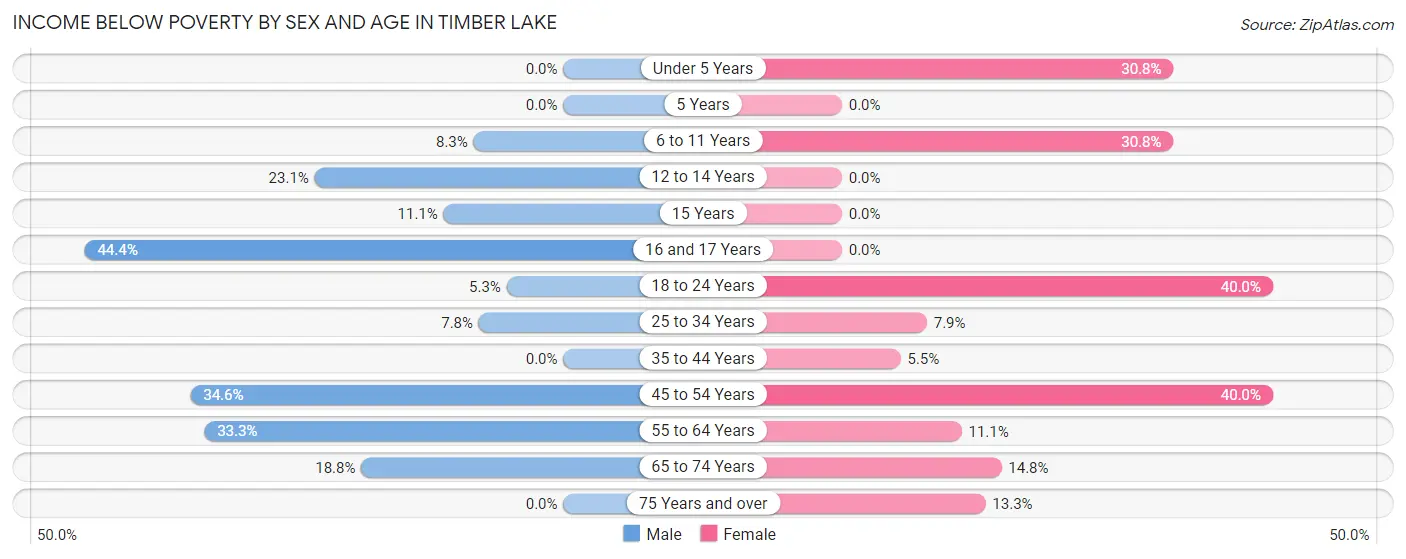
| Age Bracket | Male | Female |
| Under 5 Years | 0 (0.0%) | 8 (30.8%) |
| 5 Years | 0 (0.0%) | 0 (0.0%) |
| 6 to 11 Years | 2 (8.3%) | 8 (30.8%) |
| 12 to 14 Years | 3 (23.1%) | 0 (0.0%) |
| 15 Years | 1 (11.1%) | 0 (0.0%) |
| 16 and 17 Years | 4 (44.4%) | 0 (0.0%) |
| 18 to 24 Years | 2 (5.3%) | 10 (40.0%) |
| 25 to 34 Years | 4 (7.8%) | 3 (7.9%) |
| 35 to 44 Years | 0 (0.0%) | 3 (5.4%) |
| 45 to 54 Years | 9 (34.6%) | 12 (40.0%) |
| 55 to 64 Years | 6 (33.3%) | 2 (11.1%) |
| 65 to 74 Years | 3 (18.8%) | 4 (14.8%) |
| 75 Years and over | 0 (0.0%) | 2 (13.3%) |
| Total | 34 (11.2%) | 52 (17.5%) |
Income Above Poverty by Sex and Age in Timber Lake
According to the poverty statistics in Timber Lake, males aged under 5 years and females aged 5 years are the age groups that are most secure financially, with 100.0% of males and 100.0% of females in these age groups living above the poverty line.
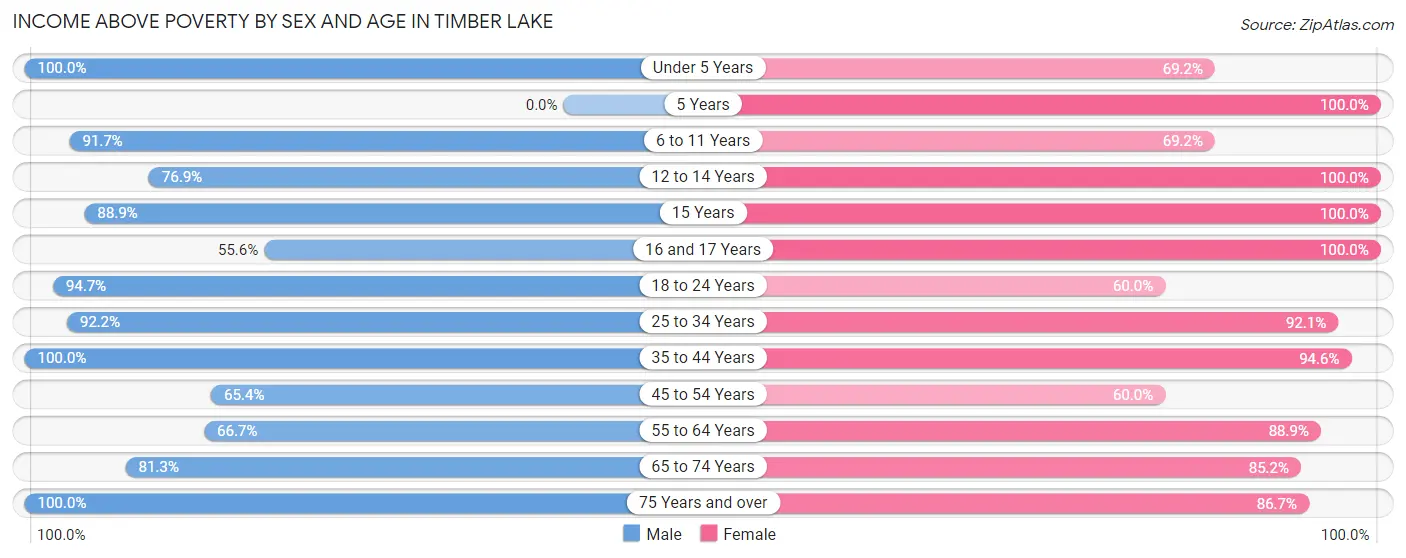
| Age Bracket | Male | Female |
| Under 5 Years | 50 (100.0%) | 18 (69.2%) |
| 5 Years | 0 (0.0%) | 3 (100.0%) |
| 6 to 11 Years | 22 (91.7%) | 18 (69.2%) |
| 12 to 14 Years | 10 (76.9%) | 21 (100.0%) |
| 15 Years | 8 (88.9%) | 7 (100.0%) |
| 16 and 17 Years | 5 (55.6%) | 6 (100.0%) |
| 18 to 24 Years | 36 (94.7%) | 15 (60.0%) |
| 25 to 34 Years | 47 (92.2%) | 35 (92.1%) |
| 35 to 44 Years | 40 (100.0%) | 52 (94.6%) |
| 45 to 54 Years | 17 (65.4%) | 18 (60.0%) |
| 55 to 64 Years | 12 (66.7%) | 16 (88.9%) |
| 65 to 74 Years | 13 (81.2%) | 23 (85.2%) |
| 75 Years and over | 9 (100.0%) | 13 (86.7%) |
| Total | 269 (88.8%) | 245 (82.5%) |
Income Below Poverty Among Married-Couple Families in Timber Lake
The poverty statistics for married-couple families in Timber Lake show that 5.0% or 5 of the total 101 families live below the poverty line. Families with 5 or more children have the highest poverty rate of 100.0%, comprising of 1 families. On the other hand, families with 3 or 4 children have the lowest poverty rate of 0.0%, which includes 0 families.
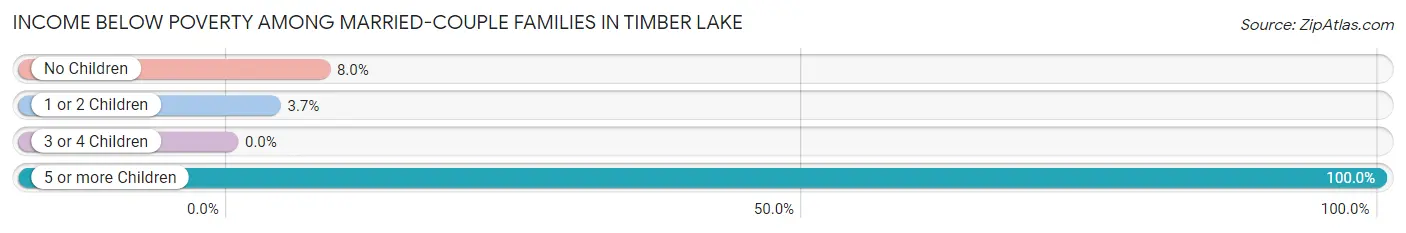
| Children | Above Poverty | Below Poverty |
| No Children | 23 (92.0%) | 2 (8.0%) |
| 1 or 2 Children | 52 (96.3%) | 2 (3.7%) |
| 3 or 4 Children | 21 (100.0%) | 0 (0.0%) |
| 5 or more Children | 0 (0.0%) | 1 (100.0%) |
| Total | 96 (95.1%) | 5 (5.0%) |
Income Below Poverty Among Single-Parent Households in Timber Lake
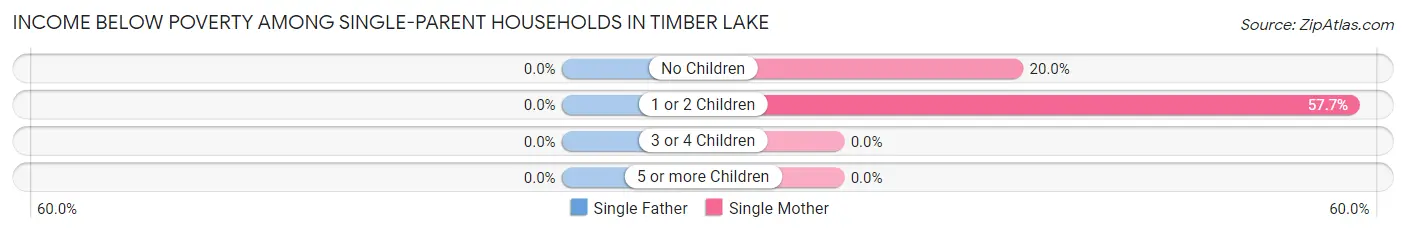
| Children | Single Father | Single Mother |
| No Children | 0 (0.0%) | 1 (20.0%) |
| 1 or 2 Children | 0 (0.0%) | 15 (57.7%) |
| 3 or 4 Children | 0 (0.0%) | 0 (0.0%) |
| 5 or more Children | 0 (0.0%) | 0 (0.0%) |
| Total | 0 (0.0%) | 16 (47.1%) |
Income Below Poverty Among Married-Couple vs Single-Parent Households in Timber Lake
The poverty data for Timber Lake shows that 5 of the married-couple family households (5.0%) and 16 of the single-parent households (32.0%) are living below the poverty level. Within the married-couple family households, those with 5 or more children have the highest poverty rate, with 1 households (100.0%) falling below the poverty line. Among the single-parent households, those with 1 or 2 children have the highest poverty rate, with 15 household (46.9%) living below poverty.
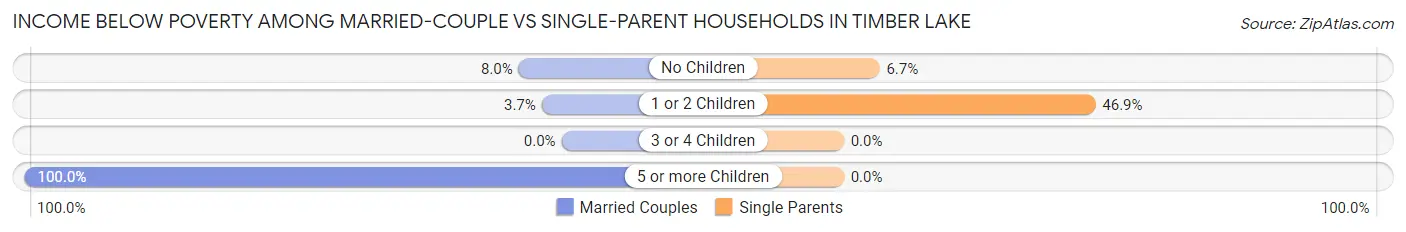
| Children | Married-Couple Families | Single-Parent Households |
| No Children | 2 (8.0%) | 1 (6.7%) |
| 1 or 2 Children | 2 (3.7%) | 15 (46.9%) |
| 3 or 4 Children | 0 (0.0%) | 0 (0.0%) |
| 5 or more Children | 1 (100.0%) | 0 (0.0%) |
| Total | 5 (5.0%) | 16 (32.0%) |
Race in Timber Lake
The most populous races in Timber Lake are White / Caucasian (318 | 50.7%), Native / Alaskan (274 | 43.7%), and Two or more Races (23 | 3.7%).
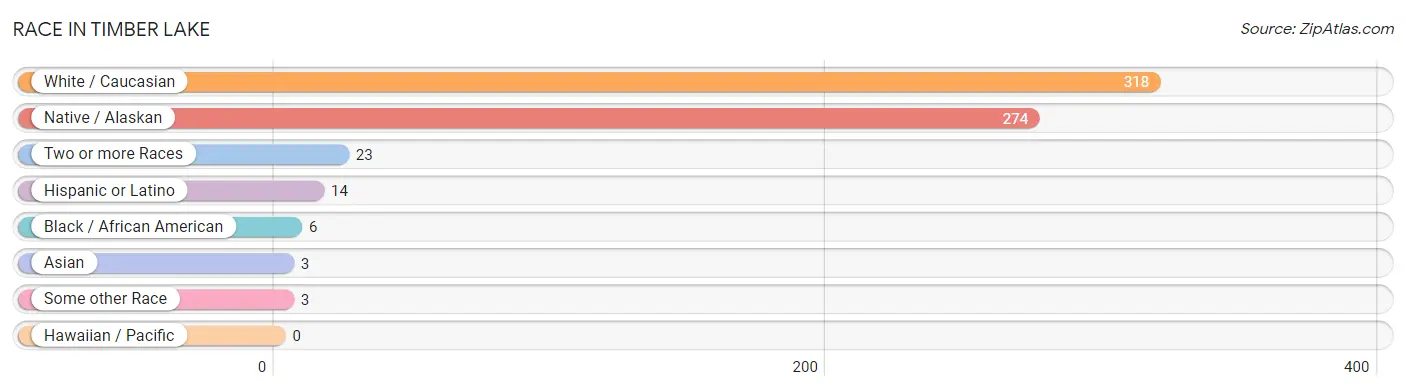
| Race | # Population | % Population |
| Asian | 3 | 0.5% |
| Black / African American | 6 | 1.0% |
| Hawaiian / Pacific | 0 | 0.0% |
| Hispanic or Latino | 14 | 2.2% |
| Native / Alaskan | 274 | 43.7% |
| White / Caucasian | 318 | 50.7% |
| Two or more Races | 23 | 3.7% |
| Some other Race | 3 | 0.5% |
| Total | 627 | 100.0% |
Ancestry in Timber Lake
The most populous ancestries reported in Timber Lake are Sioux (261 | 41.6%), German (164 | 26.2%), American (112 | 17.9%), Irish (52 | 8.3%), and Norwegian (44 | 7.0%), together accounting for 101.0% of all Timber Lake residents.
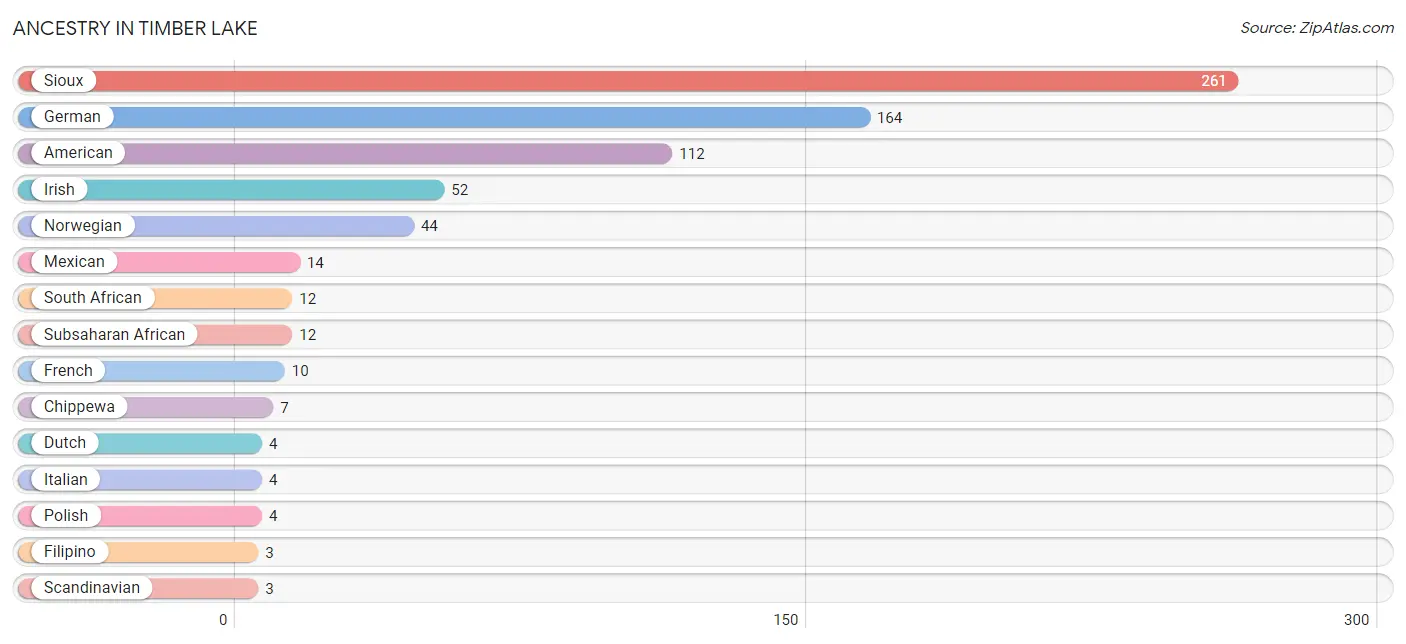
| Ancestry | # Population | % Population |
| American | 112 | 17.9% |
| Cheyenne | 2 | 0.3% |
| Chippewa | 7 | 1.1% |
| Dutch | 4 | 0.6% |
| English | 2 | 0.3% |
| Filipino | 3 | 0.5% |
| French | 10 | 1.6% |
| German | 164 | 26.2% |
| Irish | 52 | 8.3% |
| Italian | 4 | 0.6% |
| Mexican | 14 | 2.2% |
| Norwegian | 44 | 7.0% |
| Polish | 4 | 0.6% |
| Russian | 1 | 0.2% |
| Scandinavian | 3 | 0.5% |
| Sioux | 261 | 41.6% |
| South African | 12 | 1.9% |
| Subsaharan African | 12 | 1.9% |
| Swedish | 3 | 0.5% | View All 19 Rows |
Immigrants in Timber Lake
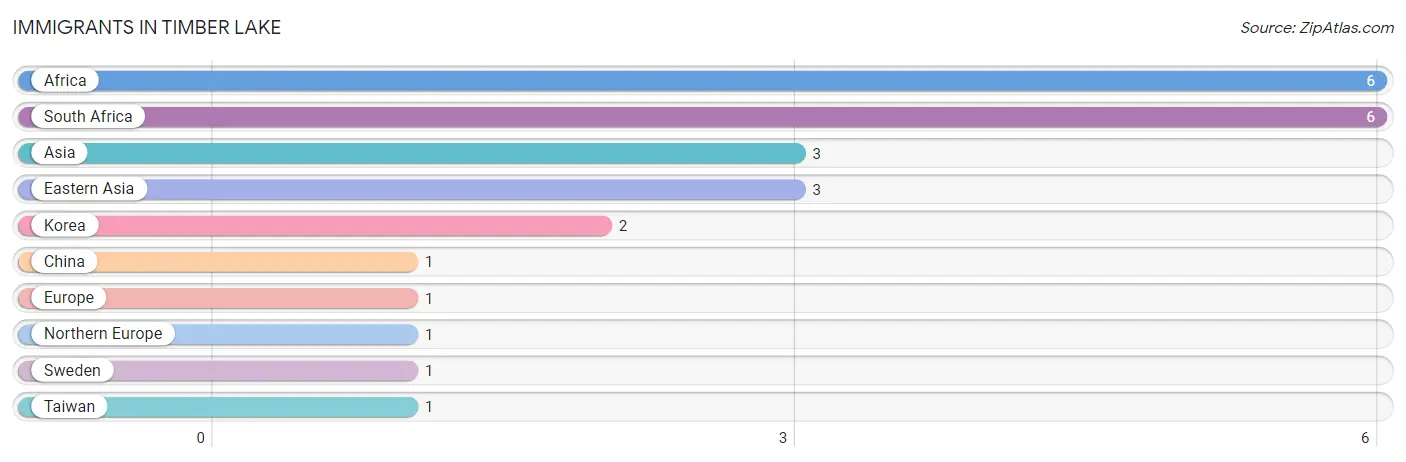
The most numerous immigrant groups reported in Timber Lake came from Africa (6 | 1.0%), South Africa (6 | 1.0%), Asia (3 | 0.5%), Eastern Asia (3 | 0.5%), and Korea (2 | 0.3%), together accounting for 3.2% of all Timber Lake residents.
| Immigration Origin | # Population | % Population |
| Africa | 6 | 1.0% |
| Asia | 3 | 0.5% |
| China | 1 | 0.2% |
| Eastern Asia | 3 | 0.5% |
| Europe | 1 | 0.2% |
| Korea | 2 | 0.3% |
| Northern Europe | 1 | 0.2% |
| South Africa | 6 | 1.0% |
| Sweden | 1 | 0.2% |
| Taiwan | 1 | 0.2% | View All 10 Rows |
Sex and Age in Timber Lake
Sex and Age in Timber Lake
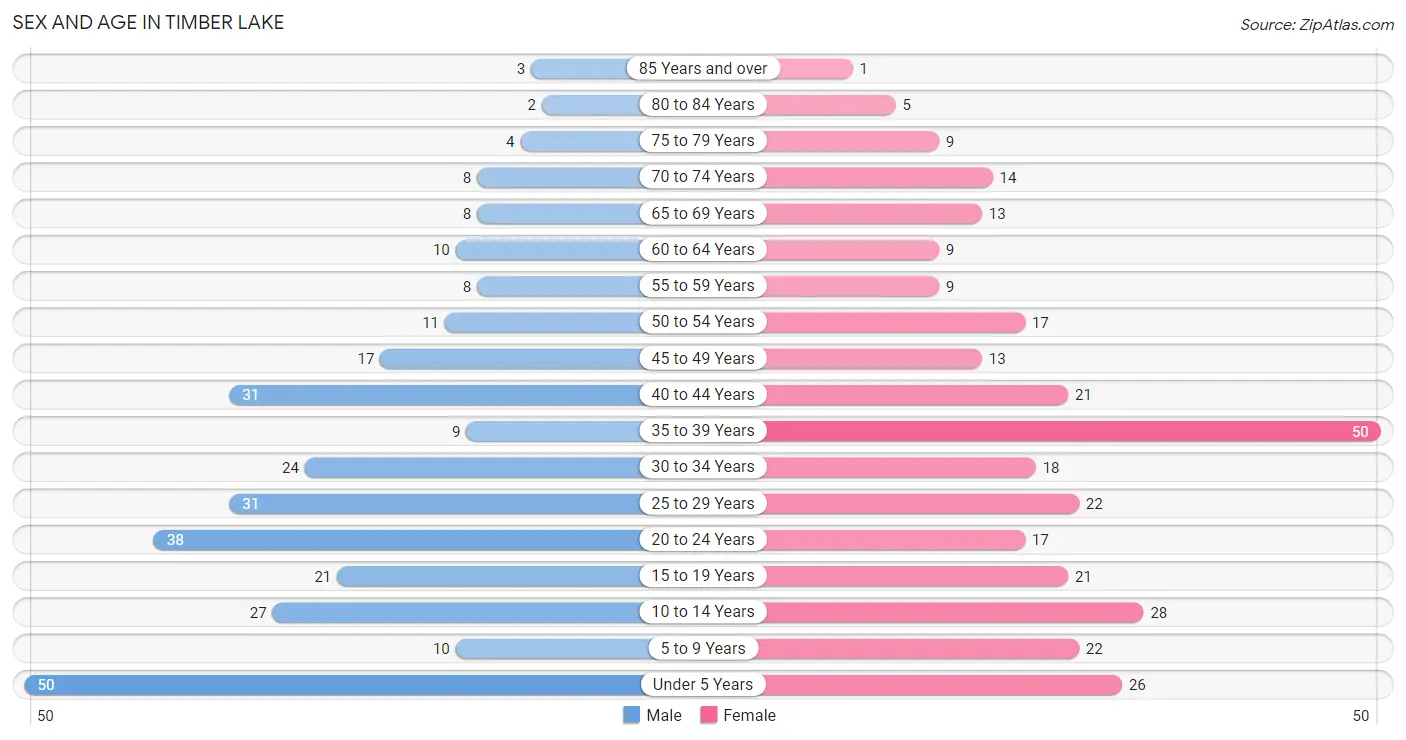
The most populous age groups in Timber Lake are Under 5 Years (50 | 16.0%) for men and 35 to 39 Years (50 | 15.9%) for women.
| Age Bracket | Male | Female |
| Under 5 Years | 50 (16.0%) | 26 (8.3%) |
| 5 to 9 Years | 10 (3.2%) | 22 (7.0%) |
| 10 to 14 Years | 27 (8.6%) | 28 (8.9%) |
| 15 to 19 Years | 21 (6.7%) | 21 (6.7%) |
| 20 to 24 Years | 38 (12.2%) | 17 (5.4%) |
| 25 to 29 Years | 31 (9.9%) | 22 (7.0%) |
| 30 to 34 Years | 24 (7.7%) | 18 (5.7%) |
| 35 to 39 Years | 9 (2.9%) | 50 (15.9%) |
| 40 to 44 Years | 31 (9.9%) | 21 (6.7%) |
| 45 to 49 Years | 17 (5.4%) | 13 (4.1%) |
| 50 to 54 Years | 11 (3.5%) | 17 (5.4%) |
| 55 to 59 Years | 8 (2.6%) | 9 (2.9%) |
| 60 to 64 Years | 10 (3.2%) | 9 (2.9%) |
| 65 to 69 Years | 8 (2.6%) | 13 (4.1%) |
| 70 to 74 Years | 8 (2.6%) | 14 (4.4%) |
| 75 to 79 Years | 4 (1.3%) | 9 (2.9%) |
| 80 to 84 Years | 2 (0.6%) | 5 (1.6%) |
| 85 Years and over | 3 (1.0%) | 1 (0.3%) |
| Total | 312 (100.0%) | 315 (100.0%) |
Families and Households in Timber Lake
Median Family Size in Timber Lake
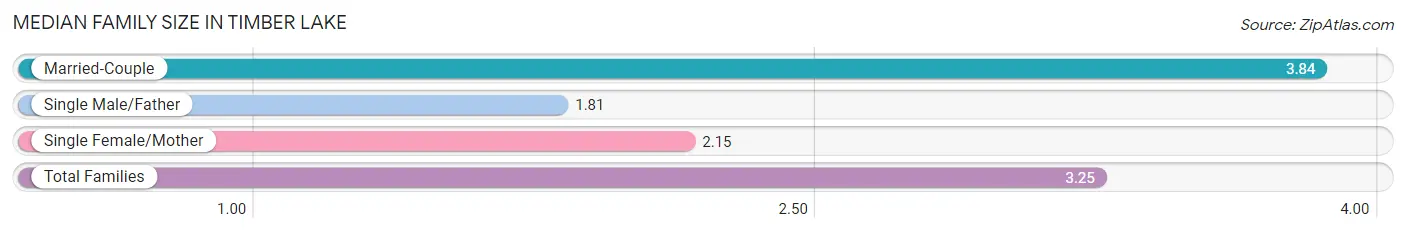
The median family size in Timber Lake is 3.25 persons per family, with married-couple families (101 | 66.9%) accounting for the largest median family size of 3.84 persons per family. On the other hand, single male/father families (16 | 10.6%) represent the smallest median family size with 1.81 persons per family.
| Family Type | # Families | Family Size |
| Married-Couple | 101 (66.9%) | 3.84 |
| Single Male/Father | 16 (10.6%) | 1.81 |
| Single Female/Mother | 34 (22.5%) | 2.15 |
| Total Families | 151 (100.0%) | 3.25 |
Median Household Size in Timber Lake
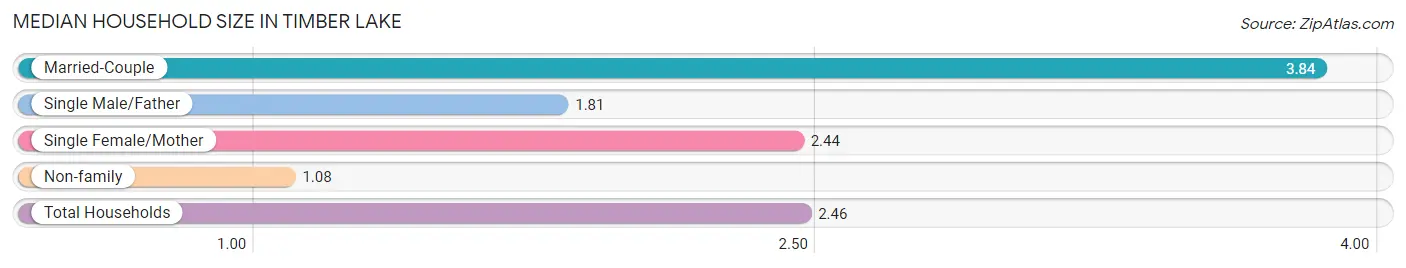
The median household size in Timber Lake is 2.46 persons per household, with married-couple households (101 | 41.4%) accounting for the largest median household size of 3.84 persons per household. non-family households (93 | 38.1%) represent the smallest median household size with 1.08 persons per household.
| Household Type | # Households | Household Size |
| Married-Couple | 101 (41.4%) | 3.84 |
| Single Male/Father | 16 (6.6%) | 1.81 |
| Single Female/Mother | 34 (13.9%) | 2.44 |
| Non-family | 93 (38.1%) | 1.08 |
| Total Households | 244 (100.0%) | 2.46 |
Household Size by Marriage Status in Timber Lake
Out of a total of 244 households in Timber Lake, 151 (61.9%) are family households, while 93 (38.1%) are nonfamily households. The most numerous type of family households are 2-person households, comprising 54, and the most common type of nonfamily households are 1-person households, comprising 88.
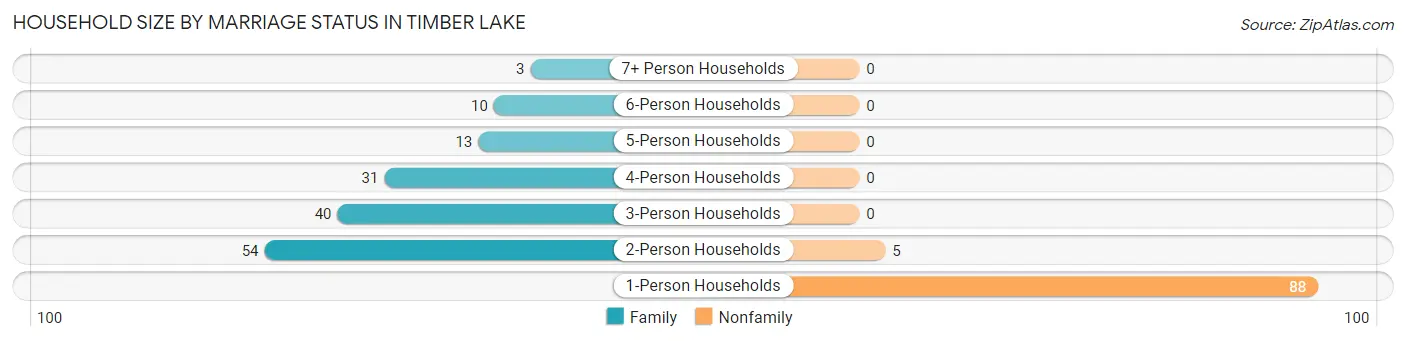
| Household Size | Family Households | Nonfamily Households |
| 1-Person Households | - | 88 (36.1%) |
| 2-Person Households | 54 (22.1%) | 5 (2.1%) |
| 3-Person Households | 40 (16.4%) | 0 (0.0%) |
| 4-Person Households | 31 (12.7%) | 0 (0.0%) |
| 5-Person Households | 13 (5.3%) | 0 (0.0%) |
| 6-Person Households | 10 (4.1%) | 0 (0.0%) |
| 7+ Person Households | 3 (1.2%) | 0 (0.0%) |
| Total | 151 (61.9%) | 93 (38.1%) |
Female Fertility in Timber Lake
Fertility by Age in Timber Lake
Average fertility rate in Timber Lake is 107.0 births per 1,000 women. Women in the age bracket of 20 to 34 years have the highest fertility rate with 263.0 births per 1,000 women. Women in the age bracket of 20 to 34 years acount for 83.3% of all women with births.
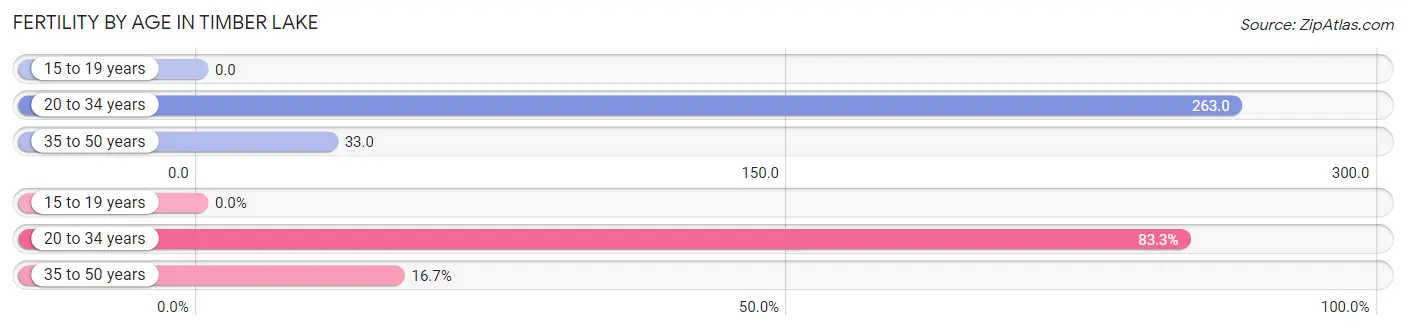
| Age Bracket | Women with Births | Births / 1,000 Women |
| 15 to 19 years | 0 (0.0%) | 0.0 |
| 20 to 34 years | 15 (83.3%) | 263.0 |
| 35 to 50 years | 3 (16.7%) | 33.0 |
| Total | 18 (100.0%) | 107.0 |
Fertility by Age by Marriage Status in Timber Lake
61.1% of women with births (18) in Timber Lake are married. The highest percentage of unmarried women with births falls into 20 to 34 years age bracket with 46.7% of them unmarried at the time of birth, while the lowest percentage of unmarried women with births belong to 35 to 50 years age bracket with 0.0% of them unmarried.
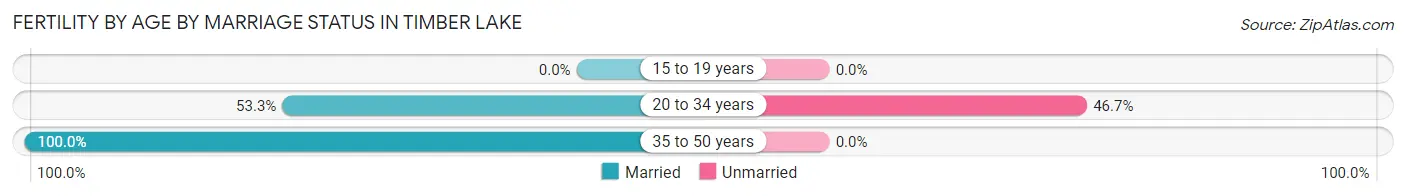
| Age Bracket | Married | Unmarried |
| 15 to 19 years | 0 (0.0%) | 0 (0.0%) |
| 20 to 34 years | 8 (53.3%) | 7 (46.7%) |
| 35 to 50 years | 3 (100.0%) | 0 (0.0%) |
| Total | 11 (61.1%) | 7 (38.9%) |
Fertility by Education in Timber Lake
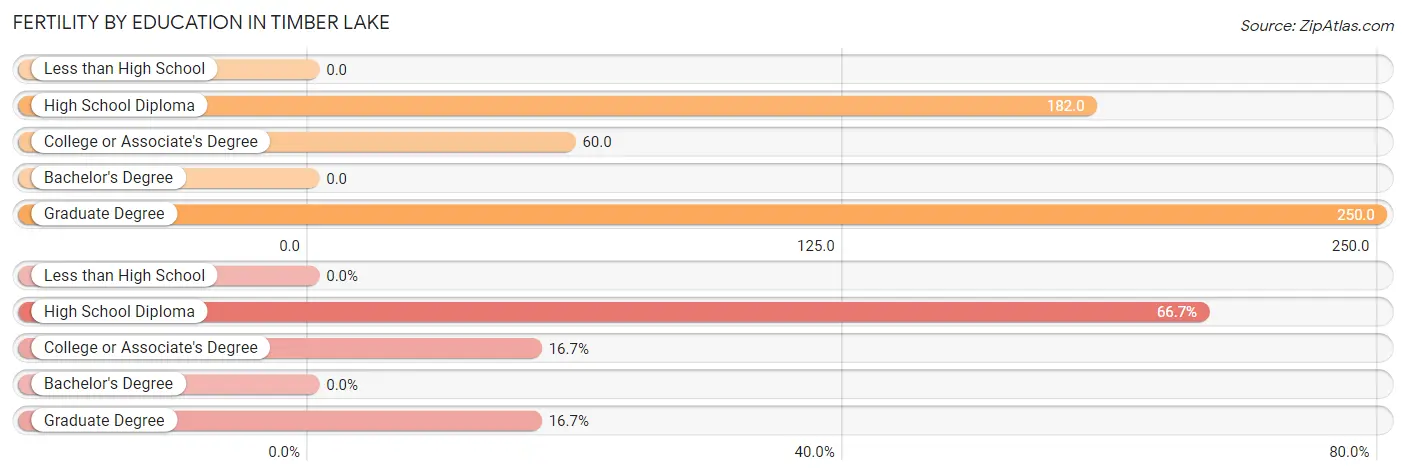
| Educational Attainment | Women with Births | Births / 1,000 Women |
| Less than High School | 0 (0.0%) | 0.0 |
| High School Diploma | 12 (66.7%) | 182.0 |
| College or Associate's Degree | 3 (16.7%) | 60.0 |
| Bachelor's Degree | 0 (0.0%) | 0.0 |
| Graduate Degree | 3 (16.7%) | 250.0 |
| Total | 18 (100.0%) | 107.0 |
Fertility by Education by Marriage Status in Timber Lake
38.9% of women with births in Timber Lake are unmarried. Women with the educational attainment of college or associate's degree are most likely to be married with 100.0% of them married at childbirth, while women with the educational attainment of high school diploma are least likely to be married with 58.3% of them unmarried at childbirth.
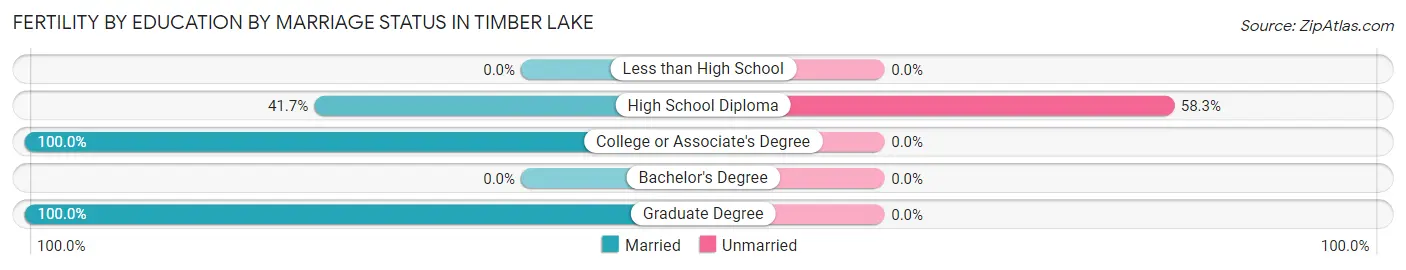
| Educational Attainment | Married | Unmarried |
| Less than High School | 0 (0.0%) | 0 (0.0%) |
| High School Diploma | 5 (41.7%) | 7 (58.3%) |
| College or Associate's Degree | 3 (100.0%) | 0 (0.0%) |
| Bachelor's Degree | 0 (0.0%) | 0 (0.0%) |
| Graduate Degree | 3 (100.0%) | 0 (0.0%) |
| Total | 11 (61.1%) | 7 (38.9%) |
Employment Characteristics in Timber Lake
Employment by Class of Employer in Timber Lake
Among the 279 employed individuals in Timber Lake, local government employees (129 | 46.2%), private company employees (75 | 26.9%), and self-employed (not incorporated) (35 | 12.5%) make up the most common classes of employment.
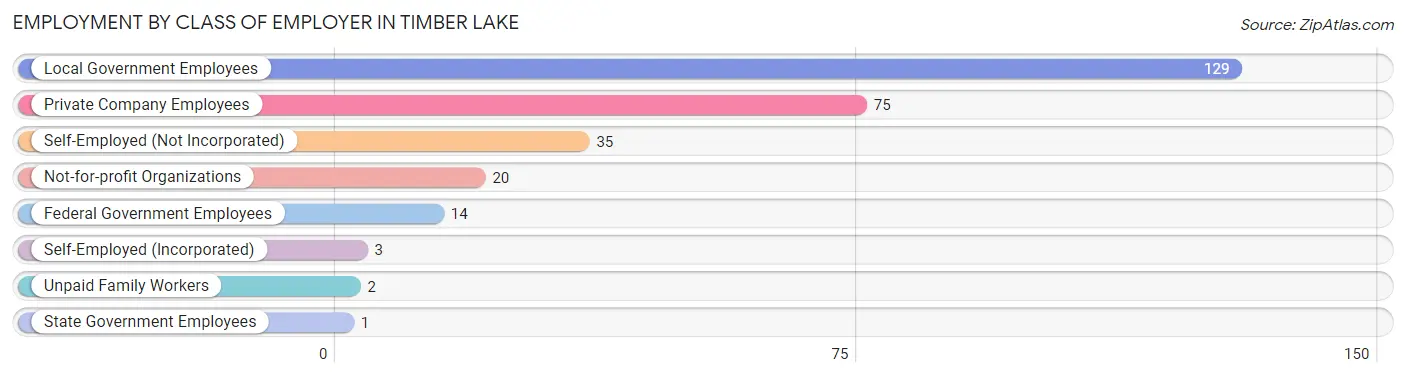
| Employer Class | # Employees | % Employees |
| Private Company Employees | 75 | 26.9% |
| Self-Employed (Incorporated) | 3 | 1.1% |
| Self-Employed (Not Incorporated) | 35 | 12.5% |
| Not-for-profit Organizations | 20 | 7.2% |
| Local Government Employees | 129 | 46.2% |
| State Government Employees | 1 | 0.4% |
| Federal Government Employees | 14 | 5.0% |
| Unpaid Family Workers | 2 | 0.7% |
| Total | 279 | 100.0% |
Employment Status by Age in Timber Lake
According to the labor force statistics for Timber Lake, out of the total population over 16 years of age (448), 68.3% or 306 individuals are in the labor force, with 6.2% or 19 of them unemployed. The age group with the highest labor force participation rate is 25 to 29 years, with 90.6% or 48 individuals in the labor force. Within the labor force, the 16 to 19 years age range has the highest percentage of unemployed individuals, with 75.0% or 6 of them being unemployed.
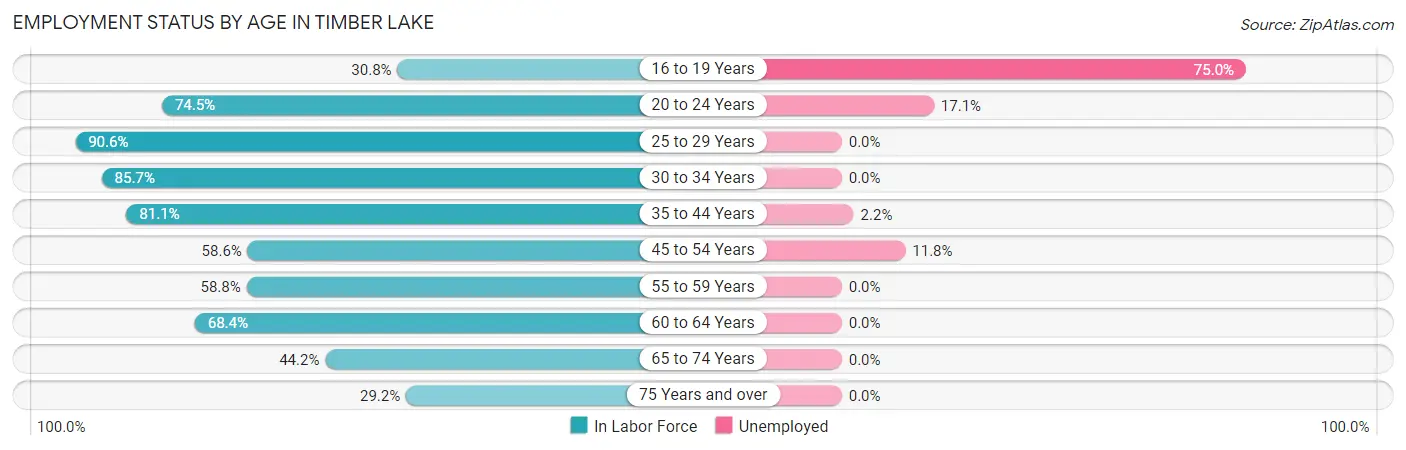
| Age Bracket | In Labor Force | Unemployed |
| 16 to 19 Years | 8 (30.8%) | 6 (75.0%) |
| 20 to 24 Years | 41 (74.5%) | 7 (17.1%) |
| 25 to 29 Years | 48 (90.6%) | 0 (0.0%) |
| 30 to 34 Years | 36 (85.7%) | 0 (0.0%) |
| 35 to 44 Years | 90 (81.1%) | 2 (2.2%) |
| 45 to 54 Years | 34 (58.6%) | 4 (11.8%) |
| 55 to 59 Years | 10 (58.8%) | 0 (0.0%) |
| 60 to 64 Years | 13 (68.4%) | 0 (0.0%) |
| 65 to 74 Years | 19 (44.2%) | 0 (0.0%) |
| 75 Years and over | 7 (29.2%) | 0 (0.0%) |
| Total | 306 (68.3%) | 19 (6.2%) |
Employment Status by Educational Attainment in Timber Lake
According to labor force statistics for Timber Lake, 77.0% of individuals (231) out of the total population between 25 and 64 years of age (300) are in the labor force, with 2.6% or 6 of them being unemployed. The group with the highest labor force participation rate are those with the educational attainment of bachelor's degree or higher, with 100.0% or 73 individuals in the labor force. Within the labor force, individuals with high school diploma education have the highest percentage of unemployment, with 4.9% or 4 of them being unemployed.
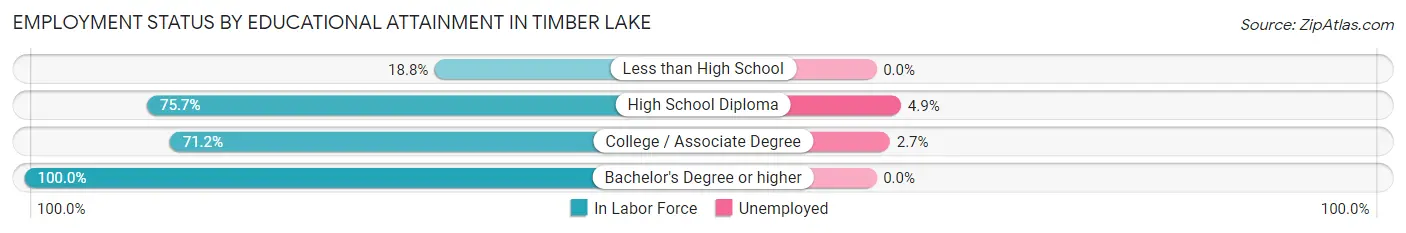
| Educational Attainment | In Labor Force | Unemployed |
| Less than High School | 3 (18.8%) | 0 (0.0%) |
| High School Diploma | 81 (75.7%) | 5 (4.9%) |
| College / Associate Degree | 74 (71.2%) | 3 (2.7%) |
| Bachelor's Degree or higher | 73 (100.0%) | 0 (0.0%) |
| Total | 231 (77.0%) | 8 (2.6%) |
Employment Occupations by Sex in Timber Lake
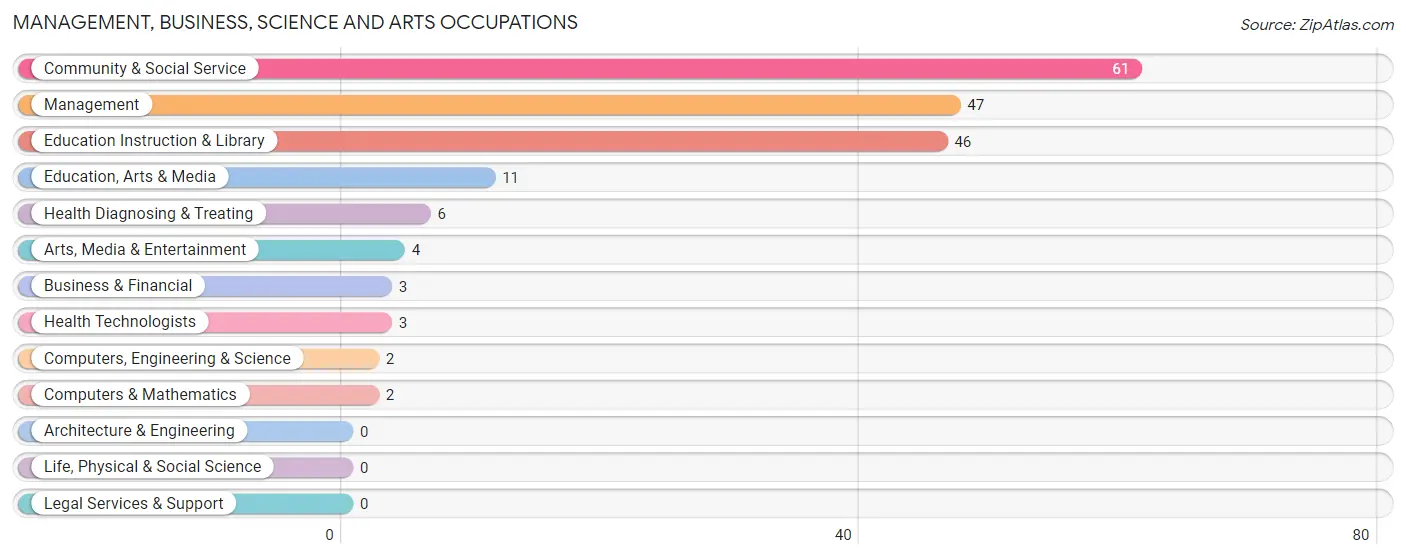
Management, Business, Science and Arts Occupations
The most common Management, Business, Science and Arts occupations in Timber Lake are Community & Social Service (61 | 21.2%), Management (47 | 16.4%), Education Instruction & Library (46 | 16.0%), Education, Arts & Media (11 | 3.8%), and Health Diagnosing & Treating (6 | 2.1%).
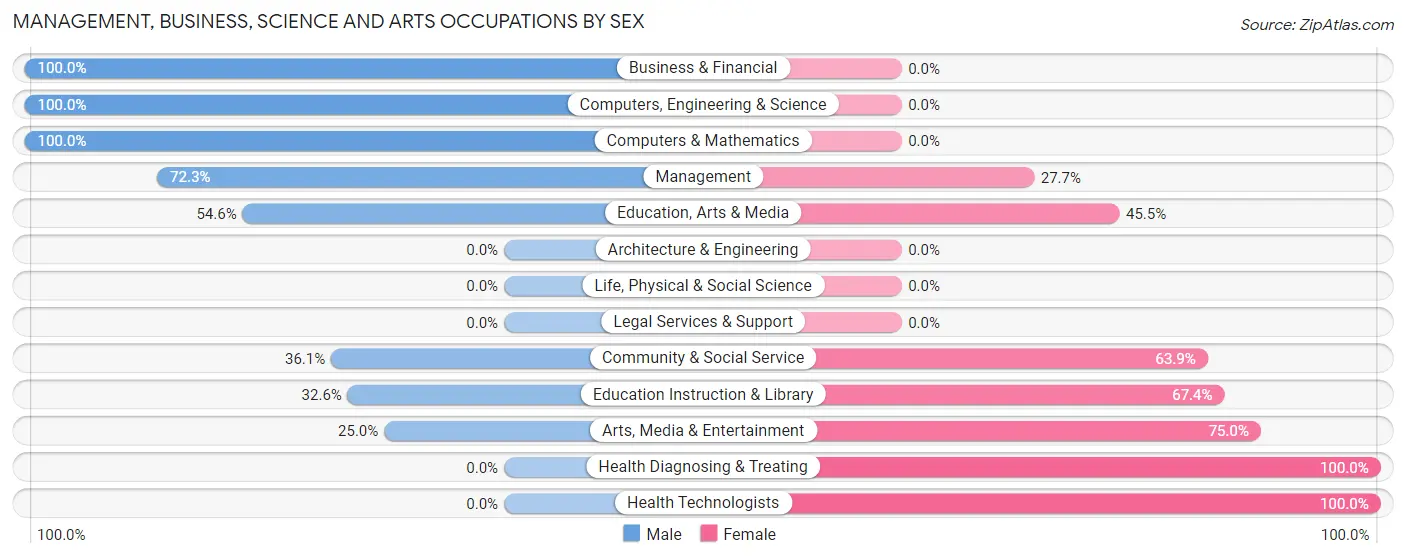
Management, Business, Science and Arts Occupations by Sex
Within the Management, Business, Science and Arts occupations in Timber Lake, the most male-oriented occupations are Business & Financial (100.0%), Computers, Engineering & Science (100.0%), and Computers & Mathematics (100.0%), while the most female-oriented occupations are Health Diagnosing & Treating (100.0%), Health Technologists (100.0%), and Arts, Media & Entertainment (75.0%).
| Occupation | Male | Female |
| Management | 34 (72.3%) | 13 (27.7%) |
| Business & Financial | 3 (100.0%) | 0 (0.0%) |
| Computers, Engineering & Science | 2 (100.0%) | 0 (0.0%) |
| Computers & Mathematics | 2 (100.0%) | 0 (0.0%) |
| Architecture & Engineering | 0 (0.0%) | 0 (0.0%) |
| Life, Physical & Social Science | 0 (0.0%) | 0 (0.0%) |
| Community & Social Service | 22 (36.1%) | 39 (63.9%) |
| Education, Arts & Media | 6 (54.5%) | 5 (45.5%) |
| Legal Services & Support | 0 (0.0%) | 0 (0.0%) |
| Education Instruction & Library | 15 (32.6%) | 31 (67.4%) |
| Arts, Media & Entertainment | 1 (25.0%) | 3 (75.0%) |
| Health Diagnosing & Treating | 0 (0.0%) | 6 (100.0%) |
| Health Technologists | 0 (0.0%) | 3 (100.0%) |
| Total (Category) | 61 (51.3%) | 58 (48.7%) |
| Total (Overall) | 150 (52.3%) | 137 (47.7%) |
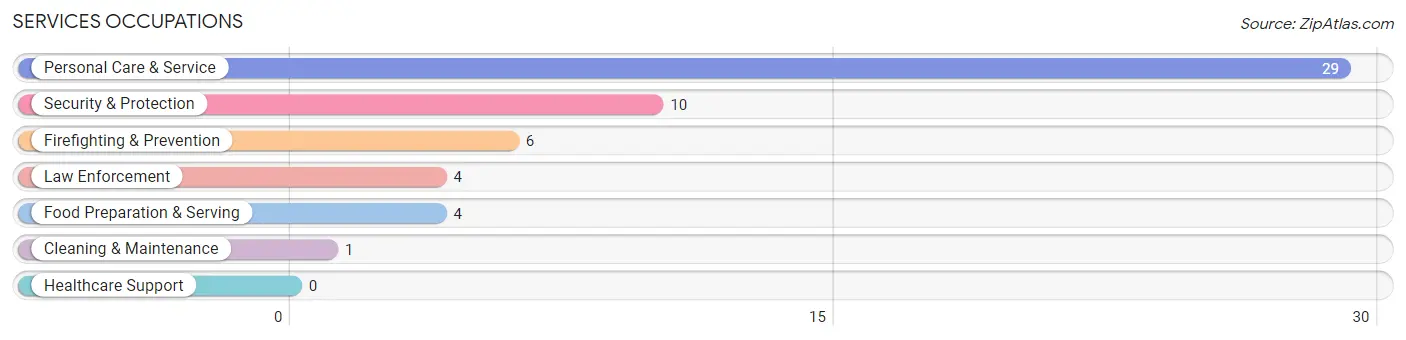
Services Occupations
The most common Services occupations in Timber Lake are Personal Care & Service (29 | 10.1%), Security & Protection (10 | 3.5%), Firefighting & Prevention (6 | 2.1%), Law Enforcement (4 | 1.4%), and Food Preparation & Serving (4 | 1.4%).
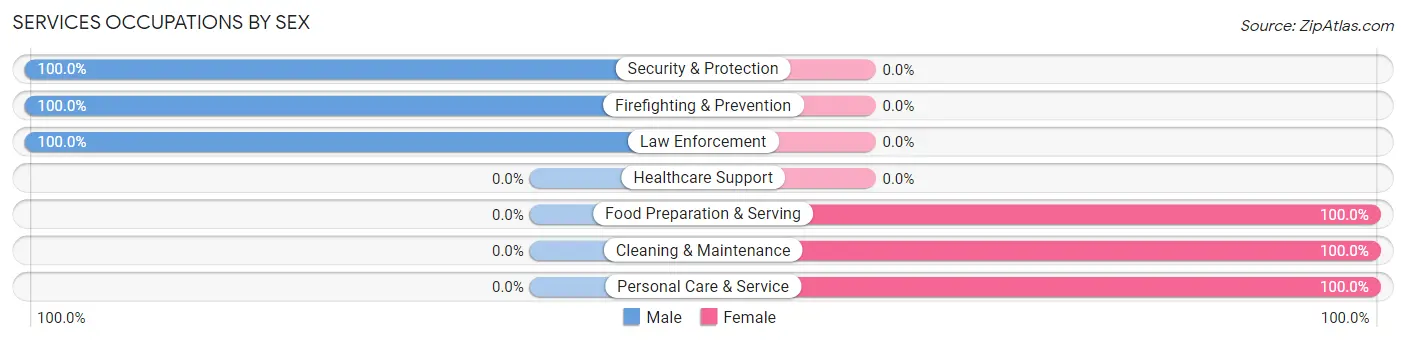
Services Occupations by Sex
Within the Services occupations in Timber Lake, the most male-oriented occupations are Security & Protection (100.0%), Firefighting & Prevention (100.0%), and Law Enforcement (100.0%), while the most female-oriented occupations are Food Preparation & Serving (100.0%), Cleaning & Maintenance (100.0%), and Personal Care & Service (100.0%).
| Occupation | Male | Female |
| Healthcare Support | 0 (0.0%) | 0 (0.0%) |
| Security & Protection | 10 (100.0%) | 0 (0.0%) |
| Firefighting & Prevention | 6 (100.0%) | 0 (0.0%) |
| Law Enforcement | 4 (100.0%) | 0 (0.0%) |
| Food Preparation & Serving | 0 (0.0%) | 4 (100.0%) |
| Cleaning & Maintenance | 0 (0.0%) | 1 (100.0%) |
| Personal Care & Service | 0 (0.0%) | 29 (100.0%) |
| Total (Category) | 10 (22.7%) | 34 (77.3%) |
| Total (Overall) | 150 (52.3%) | 137 (47.7%) |
Sales and Office Occupations
The most common Sales and Office occupations in Timber Lake are Office & Administration (31 | 10.8%), and Sales & Related (20 | 7.0%).
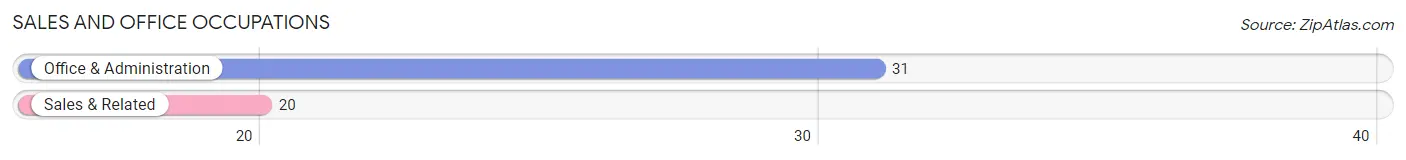
Sales and Office Occupations by Sex
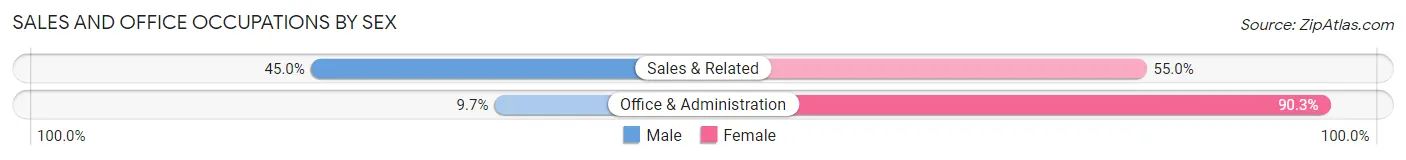
| Occupation | Male | Female |
| Sales & Related | 9 (45.0%) | 11 (55.0%) |
| Office & Administration | 3 (9.7%) | 28 (90.3%) |
| Total (Category) | 12 (23.5%) | 39 (76.5%) |
| Total (Overall) | 150 (52.3%) | 137 (47.7%) |
Natural Resources, Construction and Maintenance Occupations
The most common Natural Resources, Construction and Maintenance occupations in Timber Lake are Construction & Extraction (21 | 7.3%), Installation, Maintenance & Repair (21 | 7.3%), and Farming, Fishing & Forestry (16 | 5.6%).
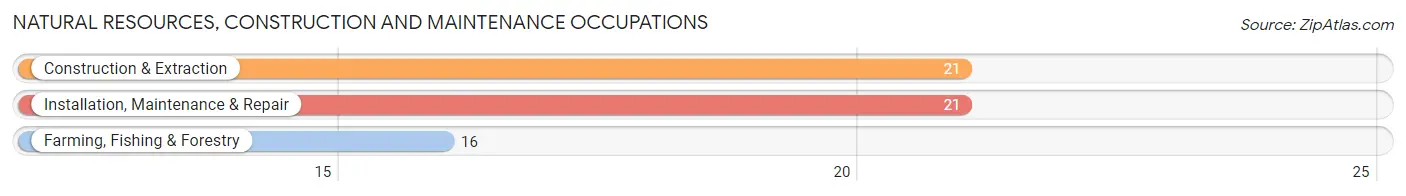
Natural Resources, Construction and Maintenance Occupations by Sex
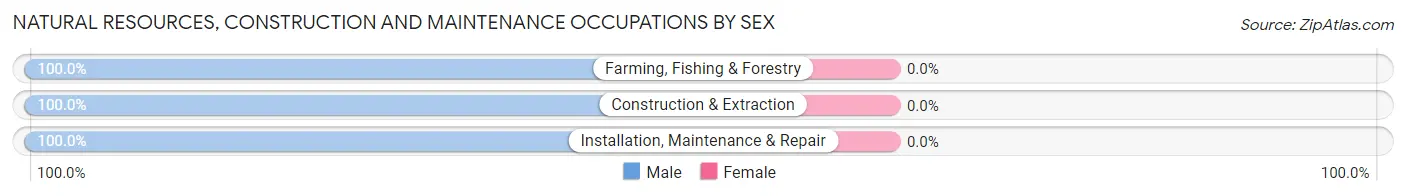
| Occupation | Male | Female |
| Farming, Fishing & Forestry | 16 (100.0%) | 0 (0.0%) |
| Construction & Extraction | 21 (100.0%) | 0 (0.0%) |
| Installation, Maintenance & Repair | 21 (100.0%) | 0 (0.0%) |
| Total (Category) | 58 (100.0%) | 0 (0.0%) |
| Total (Overall) | 150 (52.3%) | 137 (47.7%) |
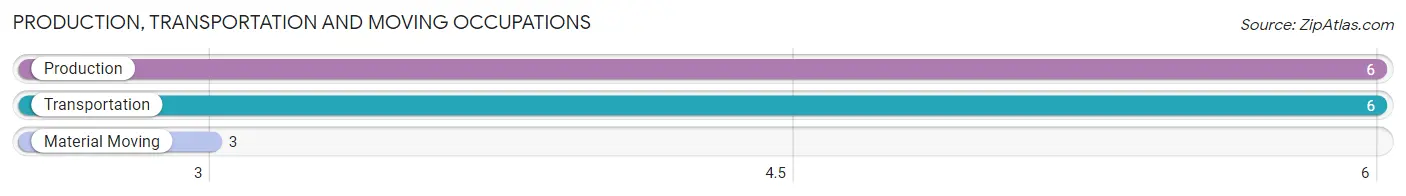
Production, Transportation and Moving Occupations
The most common Production, Transportation and Moving occupations in Timber Lake are Production (6 | 2.1%), Transportation (6 | 2.1%), and Material Moving (3 | 1.1%).
Production, Transportation and Moving Occupations by Sex
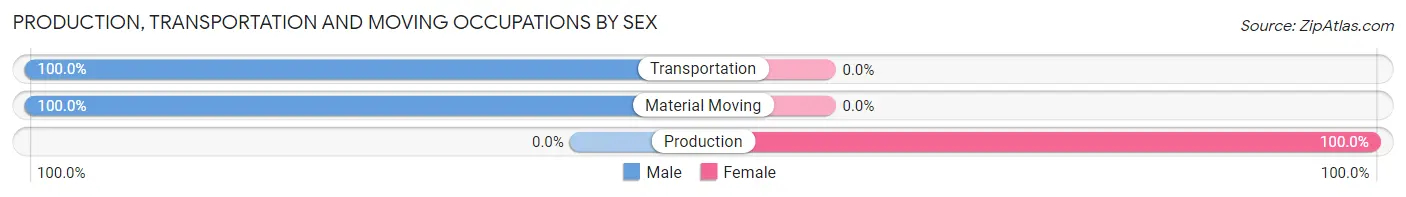
| Occupation | Male | Female |
| Production | 0 (0.0%) | 6 (100.0%) |
| Transportation | 6 (100.0%) | 0 (0.0%) |
| Material Moving | 3 (100.0%) | 0 (0.0%) |
| Total (Category) | 9 (60.0%) | 6 (40.0%) |
| Total (Overall) | 150 (52.3%) | 137 (47.7%) |
Employment Industries by Sex in Timber Lake
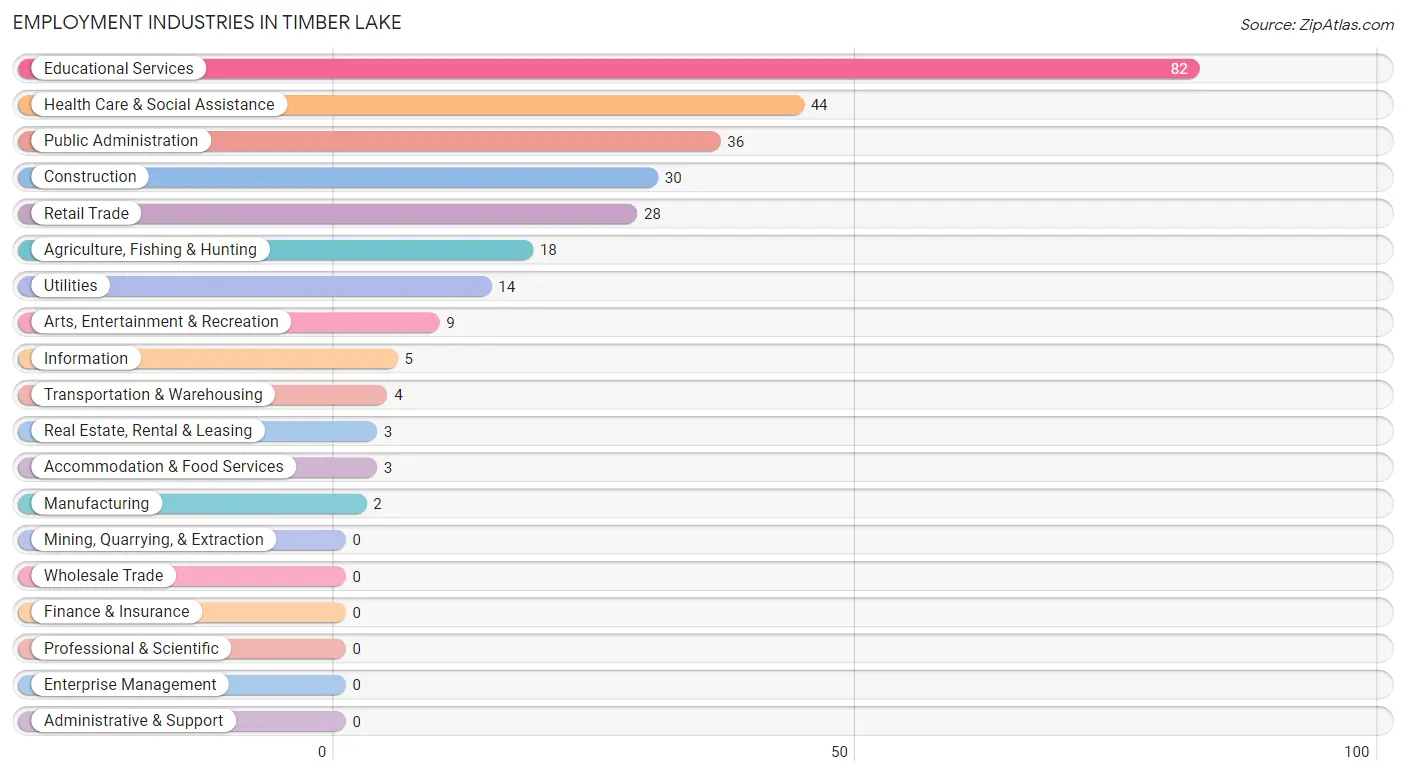
Employment Industries in Timber Lake
The major employment industries in Timber Lake include Educational Services (82 | 28.6%), Health Care & Social Assistance (44 | 15.3%), Public Administration (36 | 12.5%), Construction (30 | 10.4%), and Retail Trade (28 | 9.8%).
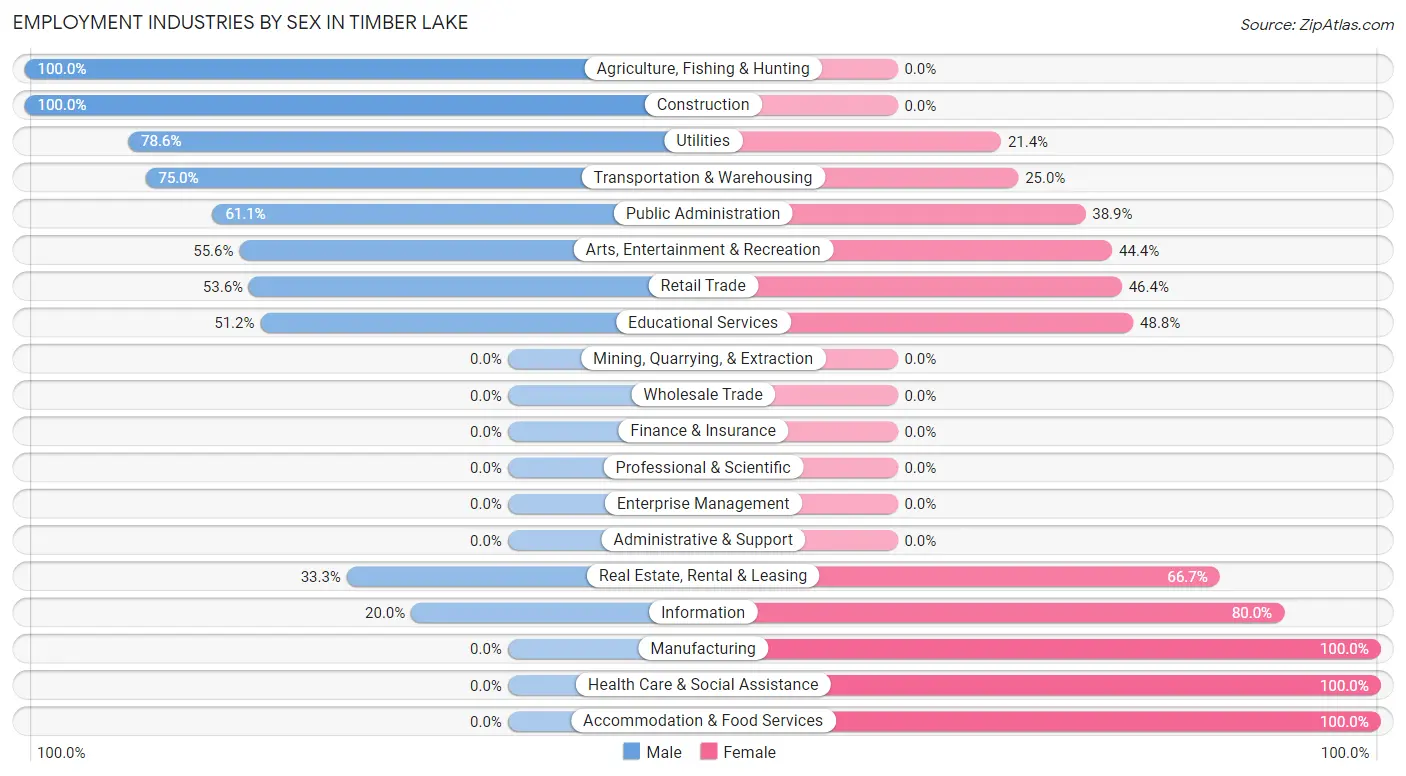
Employment Industries by Sex in Timber Lake
The Timber Lake industries that see more men than women are Agriculture, Fishing & Hunting (100.0%), Construction (100.0%), and Utilities (78.6%), whereas the industries that tend to have a higher number of women are Manufacturing (100.0%), Health Care & Social Assistance (100.0%), and Accommodation & Food Services (100.0%).
| Industry | Male | Female |
| Agriculture, Fishing & Hunting | 18 (100.0%) | 0 (0.0%) |
| Mining, Quarrying, & Extraction | 0 (0.0%) | 0 (0.0%) |
| Construction | 30 (100.0%) | 0 (0.0%) |
| Manufacturing | 0 (0.0%) | 2 (100.0%) |
| Wholesale Trade | 0 (0.0%) | 0 (0.0%) |
| Retail Trade | 15 (53.6%) | 13 (46.4%) |
| Transportation & Warehousing | 3 (75.0%) | 1 (25.0%) |
| Utilities | 11 (78.6%) | 3 (21.4%) |
| Information | 1 (20.0%) | 4 (80.0%) |
| Finance & Insurance | 0 (0.0%) | 0 (0.0%) |
| Real Estate, Rental & Leasing | 1 (33.3%) | 2 (66.7%) |
| Professional & Scientific | 0 (0.0%) | 0 (0.0%) |
| Enterprise Management | 0 (0.0%) | 0 (0.0%) |
| Administrative & Support | 0 (0.0%) | 0 (0.0%) |
| Educational Services | 42 (51.2%) | 40 (48.8%) |
| Health Care & Social Assistance | 0 (0.0%) | 44 (100.0%) |
| Arts, Entertainment & Recreation | 5 (55.6%) | 4 (44.4%) |
| Accommodation & Food Services | 0 (0.0%) | 3 (100.0%) |
| Public Administration | 22 (61.1%) | 14 (38.9%) |
| Total | 150 (52.3%) | 137 (47.7%) |
Education in Timber Lake
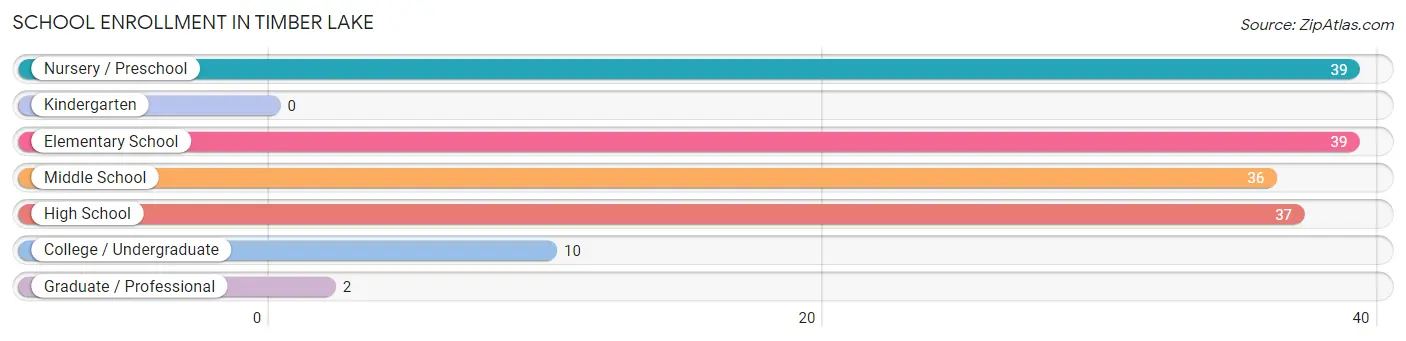
School Enrollment in Timber Lake
The most common levels of schooling among the 163 students in Timber Lake are nursery / preschool (39 | 23.9%), elementary school (39 | 23.9%), and high school (37 | 22.7%).
| School Level | # Students | % Students |
| Nursery / Preschool | 39 | 23.9% |
| Kindergarten | 0 | 0.0% |
| Elementary School | 39 | 23.9% |
| Middle School | 36 | 22.1% |
| High School | 37 | 22.7% |
| College / Undergraduate | 10 | 6.1% |
| Graduate / Professional | 2 | 1.2% |
| Total | 163 | 100.0% |
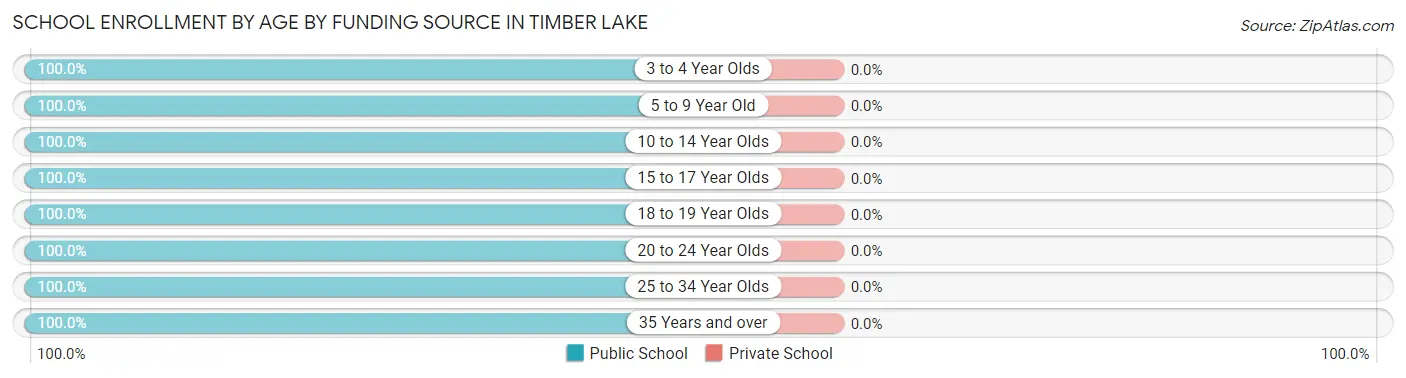
School Enrollment by Age by Funding Source in Timber Lake
| Age Bracket | Public School | Private School |
| 3 to 4 Year Olds | 36 (100.0%) | 0 (0.0%) |
| 5 to 9 Year Old | 32 (100.0%) | 0 (0.0%) |
| 10 to 14 Year Olds | 53 (100.0%) | 0 (0.0%) |
| 15 to 17 Year Olds | 27 (100.0%) | 0 (0.0%) |
| 18 to 19 Year Olds | 3 (100.0%) | 0 (0.0%) |
| 20 to 24 Year Olds | 8 (100.0%) | 0 (0.0%) |
| 25 to 34 Year Olds | 2 (100.0%) | 0 (0.0%) |
| 35 Years and over | 2 (100.0%) | 0 (0.0%) |
| Total | 163 (100.0%) | 0 (0.0%) |
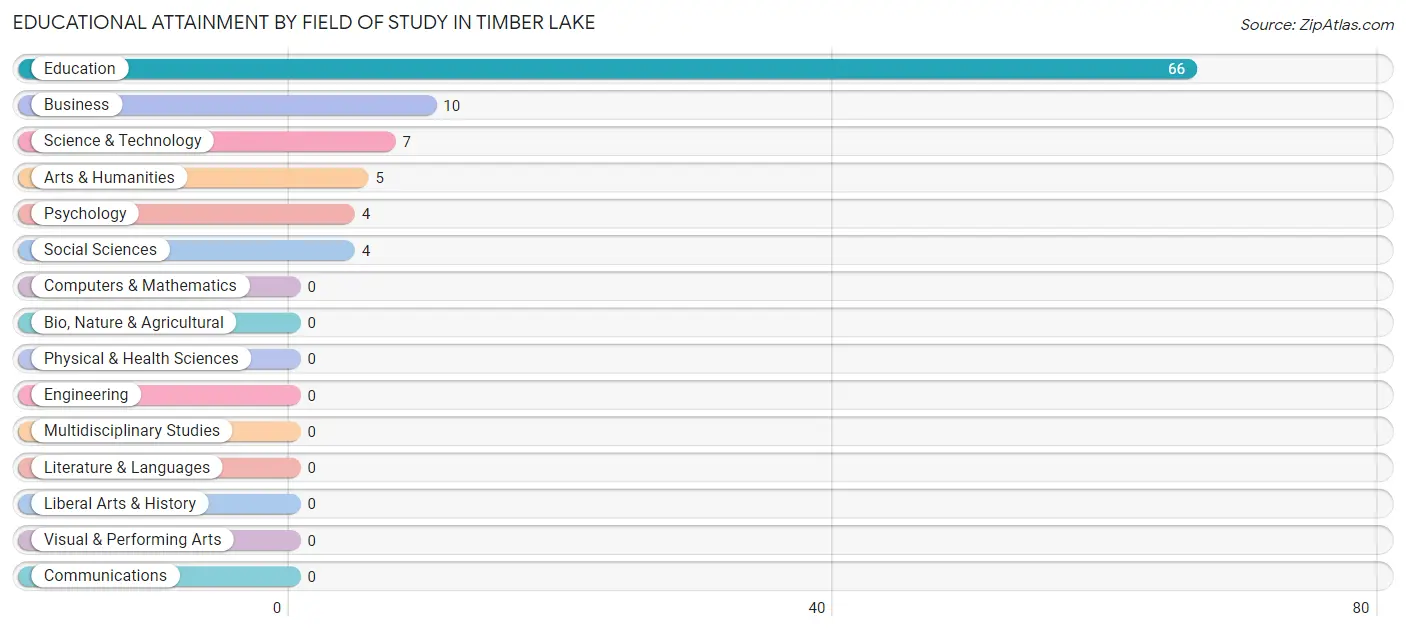
Educational Attainment by Field of Study in Timber Lake
Education (66 | 68.8%), business (10 | 10.4%), science & technology (7 | 7.3%), arts & humanities (5 | 5.2%), and psychology (4 | 4.2%) are the most common fields of study among 96 individuals in Timber Lake who have obtained a bachelor's degree or higher.
| Field of Study | # Graduates | % Graduates |
| Computers & Mathematics | 0 | 0.0% |
| Bio, Nature & Agricultural | 0 | 0.0% |
| Physical & Health Sciences | 0 | 0.0% |
| Psychology | 4 | 4.2% |
| Social Sciences | 4 | 4.2% |
| Engineering | 0 | 0.0% |
| Multidisciplinary Studies | 0 | 0.0% |
| Science & Technology | 7 | 7.3% |
| Business | 10 | 10.4% |
| Education | 66 | 68.8% |
| Literature & Languages | 0 | 0.0% |
| Liberal Arts & History | 0 | 0.0% |
| Visual & Performing Arts | 0 | 0.0% |
| Communications | 0 | 0.0% |
| Arts & Humanities | 5 | 5.2% |
| Total | 96 | 100.0% |
Transportation & Commute in Timber Lake
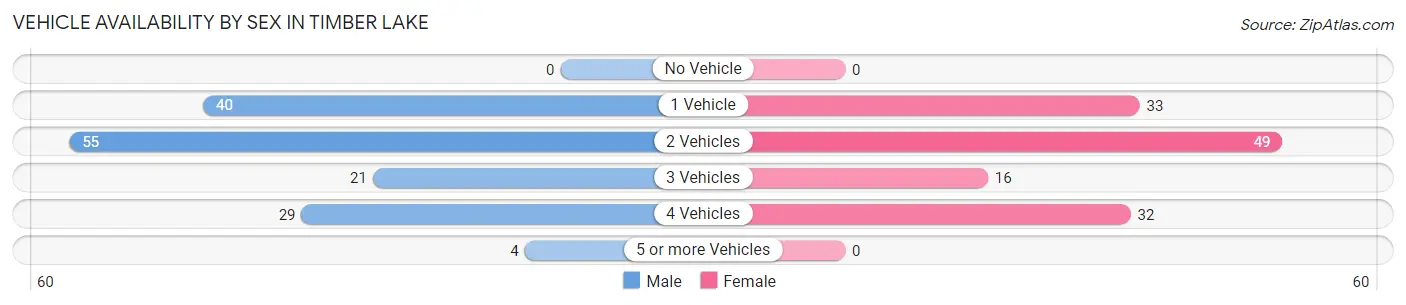
Vehicle Availability by Sex in Timber Lake
The most prevalent vehicle ownership categories in Timber Lake are males with 2 vehicles (55, accounting for 36.9%) and females with 2 vehicles (49, making up 42.3%).
| Vehicles Available | Male | Female |
| No Vehicle | 0 (0.0%) | 0 (0.0%) |
| 1 Vehicle | 40 (26.9%) | 33 (25.4%) |
| 2 Vehicles | 55 (36.9%) | 49 (37.7%) |
| 3 Vehicles | 21 (14.1%) | 16 (12.3%) |
| 4 Vehicles | 29 (19.5%) | 32 (24.6%) |
| 5 or more Vehicles | 4 (2.7%) | 0 (0.0%) |
| Total | 149 (100.0%) | 130 (100.0%) |
Commute Time in Timber Lake
The most frequently occuring commute durations in Timber Lake are 10 to 14 minutes (64 commuters, 25.8%), 45 to 59 minutes (48 commuters, 19.4%), and 5 to 9 minutes (37 commuters, 14.9%).
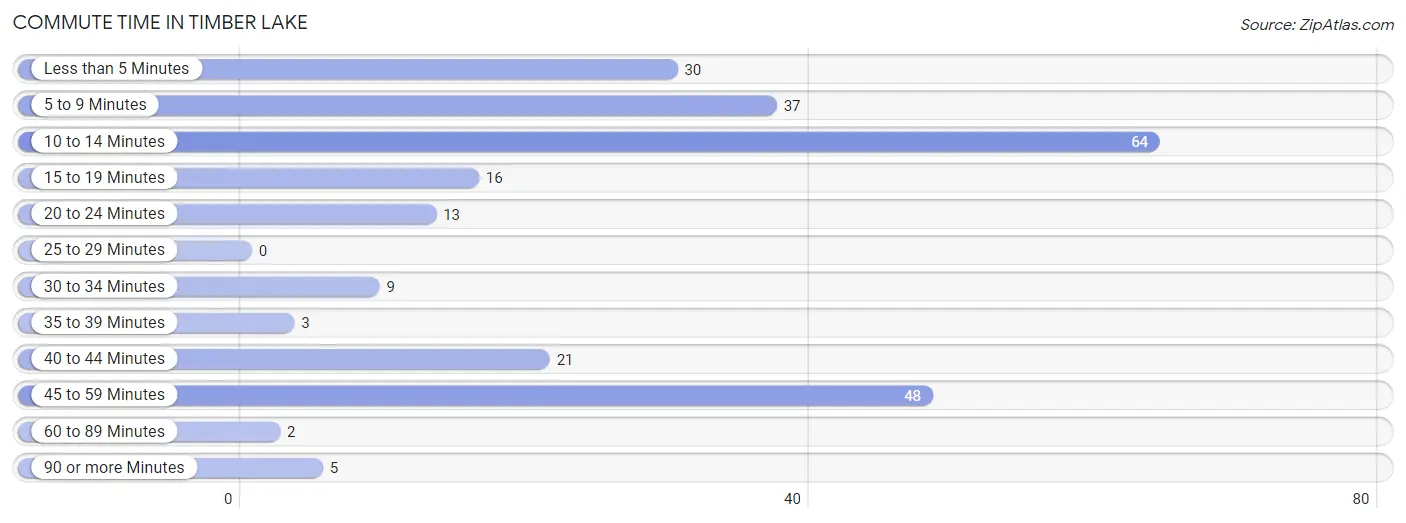
| Commute Time | # Commuters | % Commuters |
| Less than 5 Minutes | 30 | 12.1% |
| 5 to 9 Minutes | 37 | 14.9% |
| 10 to 14 Minutes | 64 | 25.8% |
| 15 to 19 Minutes | 16 | 6.5% |
| 20 to 24 Minutes | 13 | 5.2% |
| 25 to 29 Minutes | 0 | 0.0% |
| 30 to 34 Minutes | 9 | 3.6% |
| 35 to 39 Minutes | 3 | 1.2% |
| 40 to 44 Minutes | 21 | 8.5% |
| 45 to 59 Minutes | 48 | 19.4% |
| 60 to 89 Minutes | 2 | 0.8% |
| 90 or more Minutes | 5 | 2.0% |
Commute Time by Sex in Timber Lake
The most common commute times in Timber Lake are 45 to 59 minutes (39 commuters, 27.3%) for males and 10 to 14 minutes (34 commuters, 32.4%) for females.
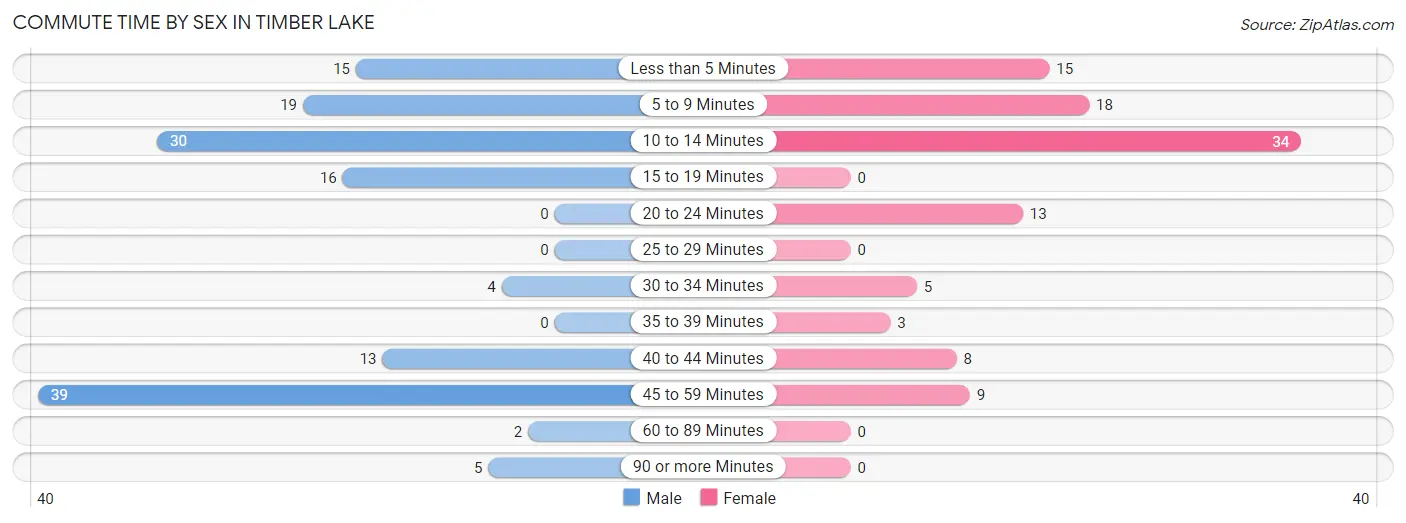
| Commute Time | Male | Female |
| Less than 5 Minutes | 15 (10.5%) | 15 (14.3%) |
| 5 to 9 Minutes | 19 (13.3%) | 18 (17.1%) |
| 10 to 14 Minutes | 30 (21.0%) | 34 (32.4%) |
| 15 to 19 Minutes | 16 (11.2%) | 0 (0.0%) |
| 20 to 24 Minutes | 0 (0.0%) | 13 (12.4%) |
| 25 to 29 Minutes | 0 (0.0%) | 0 (0.0%) |
| 30 to 34 Minutes | 4 (2.8%) | 5 (4.8%) |
| 35 to 39 Minutes | 0 (0.0%) | 3 (2.9%) |
| 40 to 44 Minutes | 13 (9.1%) | 8 (7.6%) |
| 45 to 59 Minutes | 39 (27.3%) | 9 (8.6%) |
| 60 to 89 Minutes | 2 (1.4%) | 0 (0.0%) |
| 90 or more Minutes | 5 (3.5%) | 0 (0.0%) |
Time of Departure to Work by Sex in Timber Lake
The most frequent times of departure to work in Timber Lake are 7:00 AM to 7:29 AM (58, 40.6%) for males and 7:30 AM to 7:59 AM (60, 57.1%) for females.
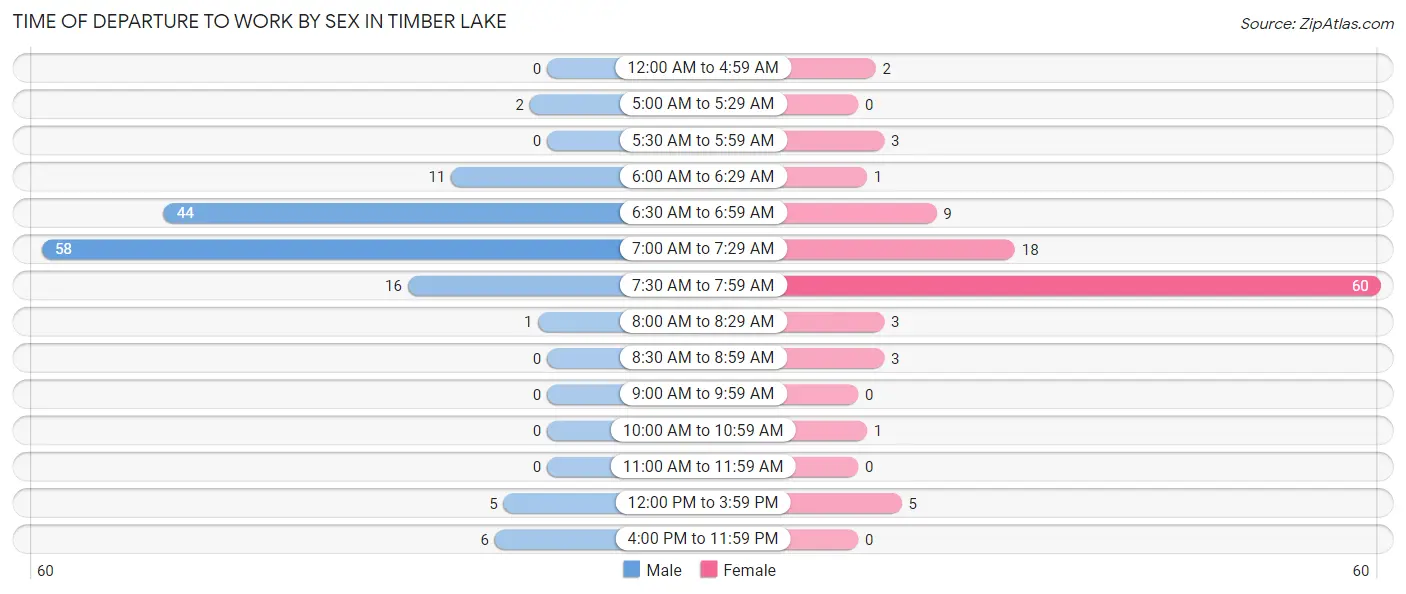
| Time of Departure | Male | Female |
| 12:00 AM to 4:59 AM | 0 (0.0%) | 2 (1.9%) |
| 5:00 AM to 5:29 AM | 2 (1.4%) | 0 (0.0%) |
| 5:30 AM to 5:59 AM | 0 (0.0%) | 3 (2.9%) |
| 6:00 AM to 6:29 AM | 11 (7.7%) | 1 (0.9%) |
| 6:30 AM to 6:59 AM | 44 (30.8%) | 9 (8.6%) |
| 7:00 AM to 7:29 AM | 58 (40.6%) | 18 (17.1%) |
| 7:30 AM to 7:59 AM | 16 (11.2%) | 60 (57.1%) |
| 8:00 AM to 8:29 AM | 1 (0.7%) | 3 (2.9%) |
| 8:30 AM to 8:59 AM | 0 (0.0%) | 3 (2.9%) |
| 9:00 AM to 9:59 AM | 0 (0.0%) | 0 (0.0%) |
| 10:00 AM to 10:59 AM | 0 (0.0%) | 1 (0.9%) |
| 11:00 AM to 11:59 AM | 0 (0.0%) | 0 (0.0%) |
| 12:00 PM to 3:59 PM | 5 (3.5%) | 5 (4.8%) |
| 4:00 PM to 11:59 PM | 6 (4.2%) | 0 (0.0%) |
| Total | 143 (100.0%) | 105 (100.0%) |
Housing Occupancy in Timber Lake
Occupancy by Ownership in Timber Lake
Of the total 244 dwellings in Timber Lake, owner-occupied units account for 154 (63.1%), while renter-occupied units make up 90 (36.9%).
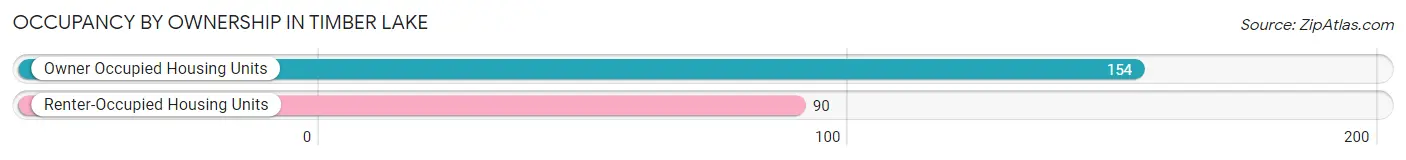
| Occupancy | # Housing Units | % Housing Units |
| Owner Occupied Housing Units | 154 | 63.1% |
| Renter-Occupied Housing Units | 90 | 36.9% |
| Total Occupied Housing Units | 244 | 100.0% |
Occupancy by Household Size in Timber Lake
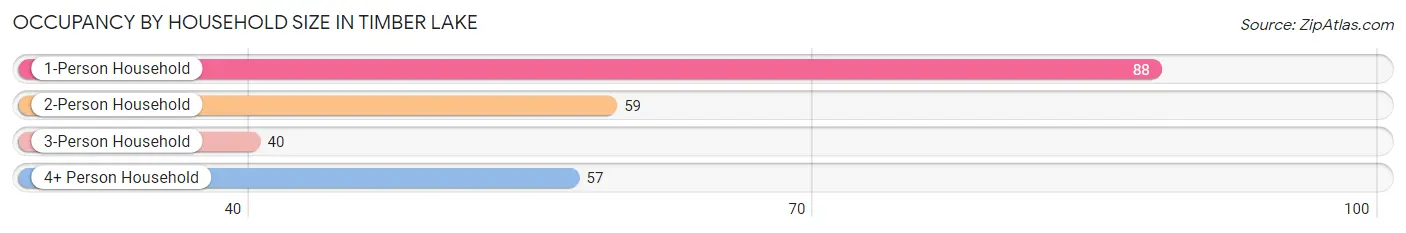
| Household Size | # Housing Units | % Housing Units |
| 1-Person Household | 88 | 36.1% |
| 2-Person Household | 59 | 24.2% |
| 3-Person Household | 40 | 16.4% |
| 4+ Person Household | 57 | 23.4% |
| Total Housing Units | 244 | 100.0% |
Occupancy by Ownership by Household Size in Timber Lake
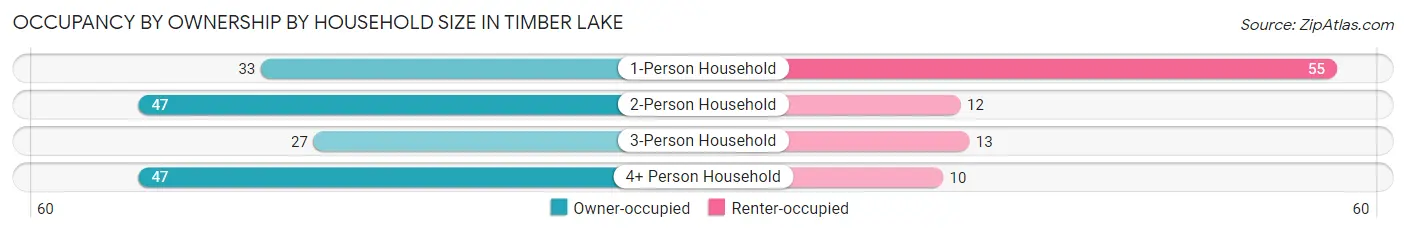
| Household Size | Owner-occupied | Renter-occupied |
| 1-Person Household | 33 (37.5%) | 55 (62.5%) |
| 2-Person Household | 47 (79.7%) | 12 (20.3%) |
| 3-Person Household | 27 (67.5%) | 13 (32.5%) |
| 4+ Person Household | 47 (82.5%) | 10 (17.5%) |
| Total Housing Units | 154 (63.1%) | 90 (36.9%) |
Occupancy by Educational Attainment in Timber Lake
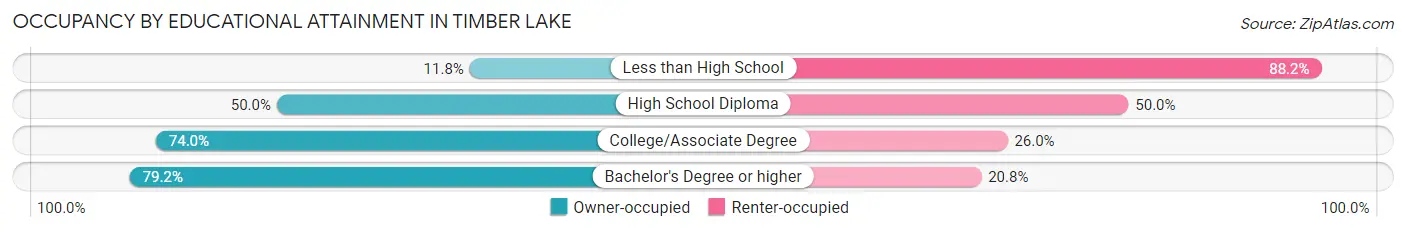
| Household Size | Owner-occupied | Renter-occupied |
| Less than High School | 2 (11.8%) | 15 (88.2%) |
| High School Diploma | 41 (50.0%) | 41 (50.0%) |
| College/Associate Degree | 54 (74.0%) | 19 (26.0%) |
| Bachelor's Degree or higher | 57 (79.2%) | 15 (20.8%) |
Occupancy by Age of Householder in Timber Lake
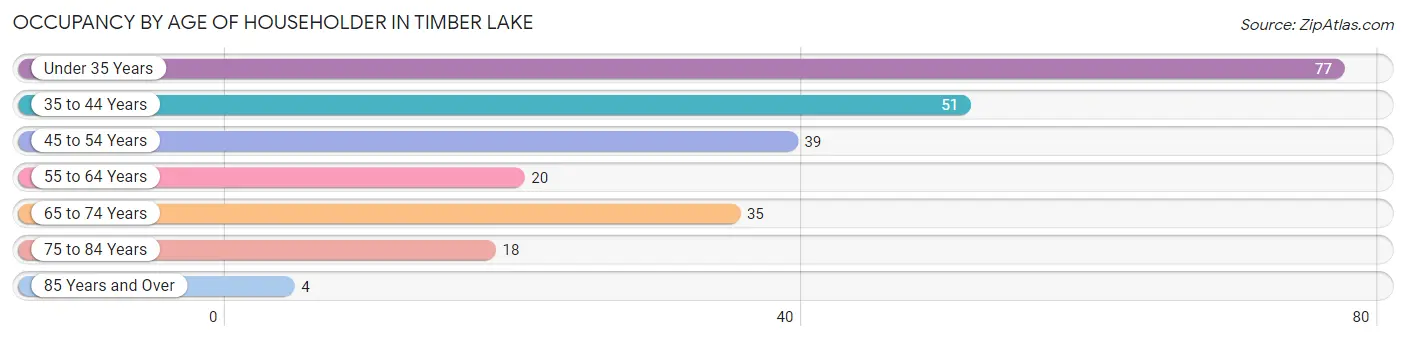
| Age Bracket | # Households | % Households |
| Under 35 Years | 77 | 31.6% |
| 35 to 44 Years | 51 | 20.9% |
| 45 to 54 Years | 39 | 16.0% |
| 55 to 64 Years | 20 | 8.2% |
| 65 to 74 Years | 35 | 14.3% |
| 75 to 84 Years | 18 | 7.4% |
| 85 Years and Over | 4 | 1.6% |
| Total | 244 | 100.0% |
Housing Finances in Timber Lake
Median Income by Occupancy in Timber Lake
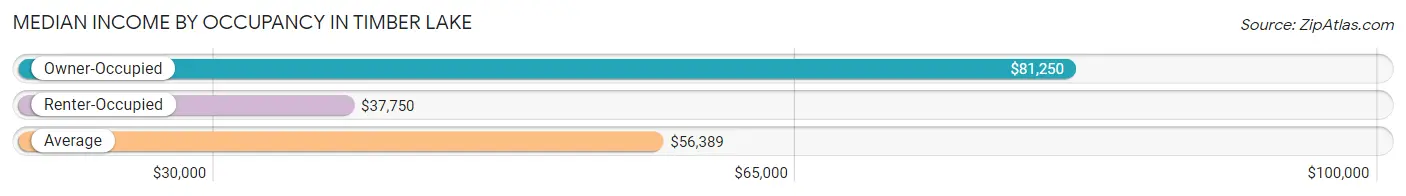
| Occupancy Type | # Households | Median Income |
| Owner-Occupied | 154 (63.1%) | $81,250 |
| Renter-Occupied | 90 (36.9%) | $37,750 |
| Average | 244 (100.0%) | $56,389 |
Occupancy by Householder Income Bracket in Timber Lake
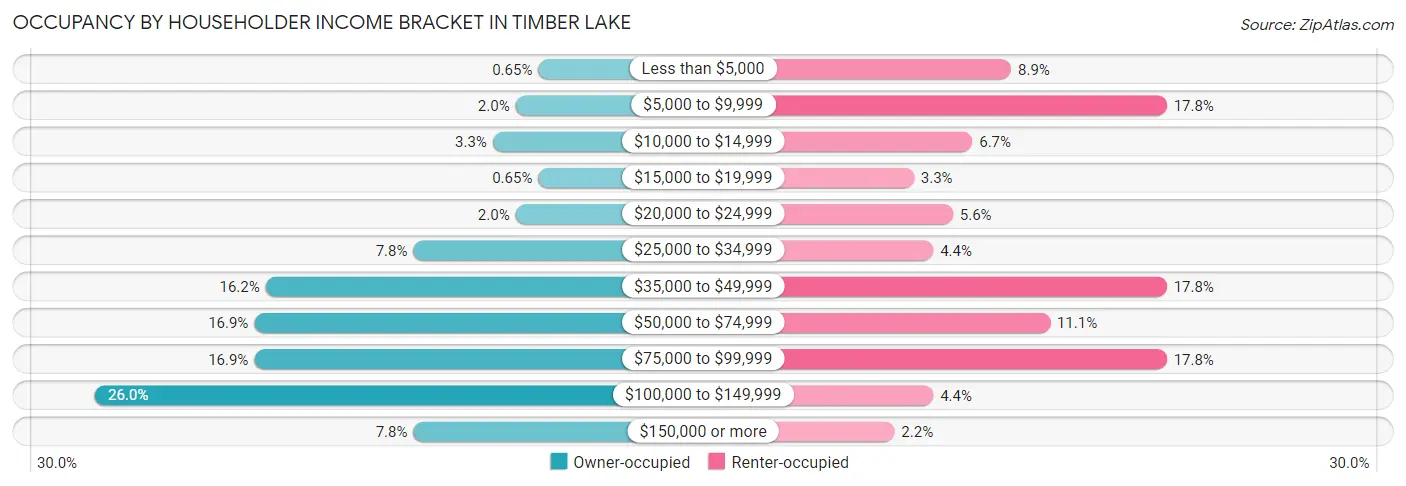
| Income Bracket | Owner-occupied | Renter-occupied |
| Less than $5,000 | 1 (0.6%) | 8 (8.9%) |
| $5,000 to $9,999 | 3 (1.9%) | 16 (17.8%) |
| $10,000 to $14,999 | 5 (3.3%) | 6 (6.7%) |
| $15,000 to $19,999 | 1 (0.6%) | 3 (3.3%) |
| $20,000 to $24,999 | 3 (1.9%) | 5 (5.6%) |
| $25,000 to $34,999 | 12 (7.8%) | 4 (4.4%) |
| $35,000 to $49,999 | 25 (16.2%) | 16 (17.8%) |
| $50,000 to $74,999 | 26 (16.9%) | 10 (11.1%) |
| $75,000 to $99,999 | 26 (16.9%) | 16 (17.8%) |
| $100,000 to $149,999 | 40 (26.0%) | 4 (4.4%) |
| $150,000 or more | 12 (7.8%) | 2 (2.2%) |
| Total | 154 (100.0%) | 90 (100.0%) |
Monthly Housing Cost Tiers in Timber Lake
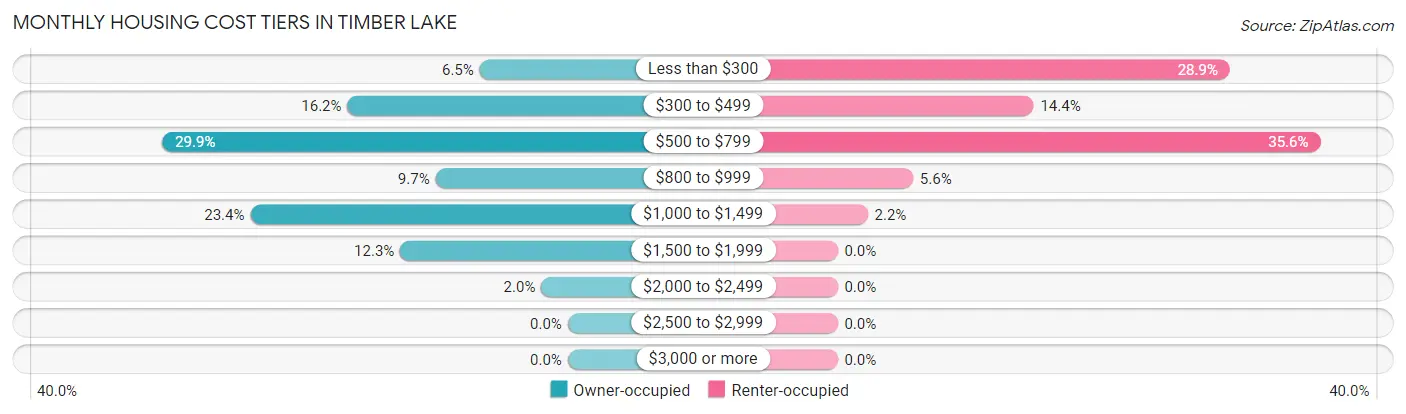
| Monthly Cost | Owner-occupied | Renter-occupied |
| Less than $300 | 10 (6.5%) | 26 (28.9%) |
| $300 to $499 | 25 (16.2%) | 13 (14.4%) |
| $500 to $799 | 46 (29.9%) | 32 (35.6%) |
| $800 to $999 | 15 (9.7%) | 5 (5.6%) |
| $1,000 to $1,499 | 36 (23.4%) | 2 (2.2%) |
| $1,500 to $1,999 | 19 (12.3%) | 0 (0.0%) |
| $2,000 to $2,499 | 3 (1.9%) | 0 (0.0%) |
| $2,500 to $2,999 | 0 (0.0%) | 0 (0.0%) |
| $3,000 or more | 0 (0.0%) | 0 (0.0%) |
| Total | 154 (100.0%) | 90 (100.0%) |
Physical Housing Characteristics in Timber Lake
Housing Structures in Timber Lake
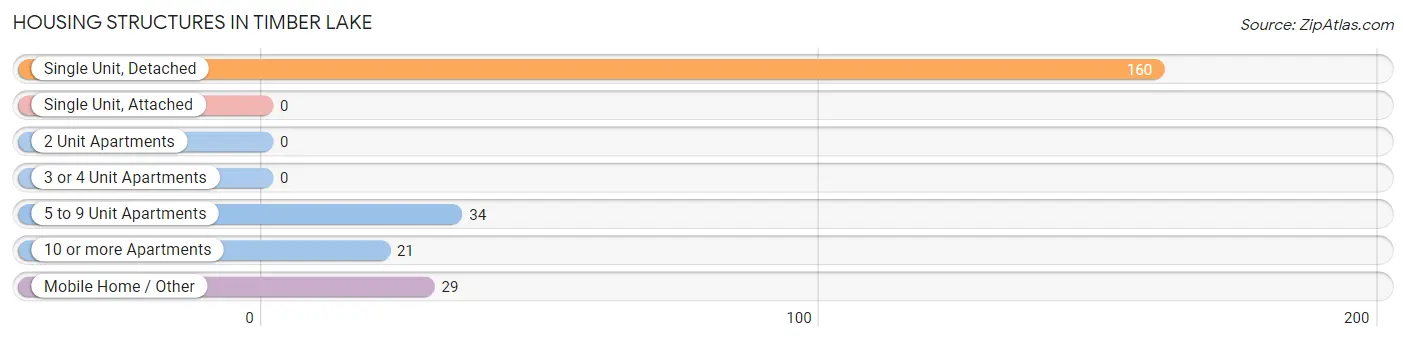
| Structure Type | # Housing Units | % Housing Units |
| Single Unit, Detached | 160 | 65.6% |
| Single Unit, Attached | 0 | 0.0% |
| 2 Unit Apartments | 0 | 0.0% |
| 3 or 4 Unit Apartments | 0 | 0.0% |
| 5 to 9 Unit Apartments | 34 | 13.9% |
| 10 or more Apartments | 21 | 8.6% |
| Mobile Home / Other | 29 | 11.9% |
| Total | 244 | 100.0% |
Housing Structures by Occupancy in Timber Lake
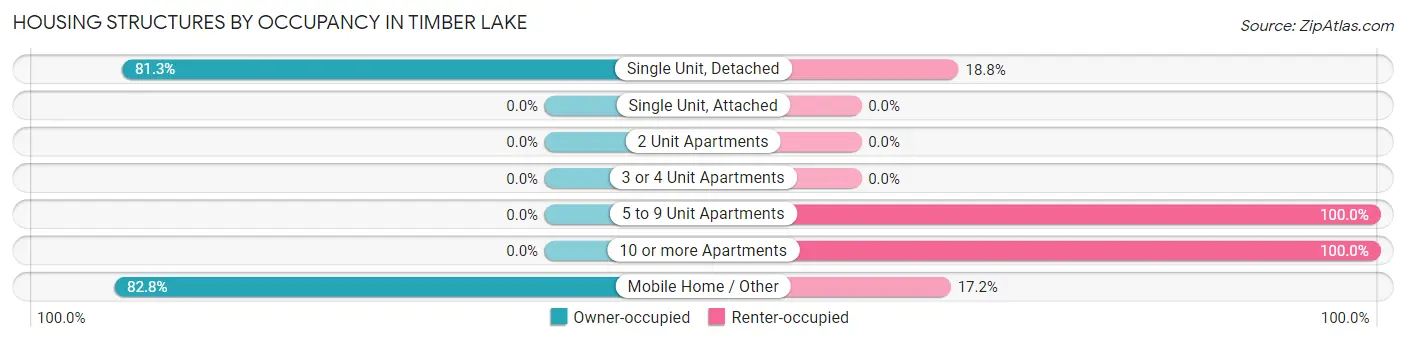
| Structure Type | Owner-occupied | Renter-occupied |
| Single Unit, Detached | 130 (81.2%) | 30 (18.8%) |
| Single Unit, Attached | 0 (0.0%) | 0 (0.0%) |
| 2 Unit Apartments | 0 (0.0%) | 0 (0.0%) |
| 3 or 4 Unit Apartments | 0 (0.0%) | 0 (0.0%) |
| 5 to 9 Unit Apartments | 0 (0.0%) | 34 (100.0%) |
| 10 or more Apartments | 0 (0.0%) | 21 (100.0%) |
| Mobile Home / Other | 24 (82.8%) | 5 (17.2%) |
| Total | 154 (63.1%) | 90 (36.9%) |
Housing Structures by Number of Rooms in Timber Lake
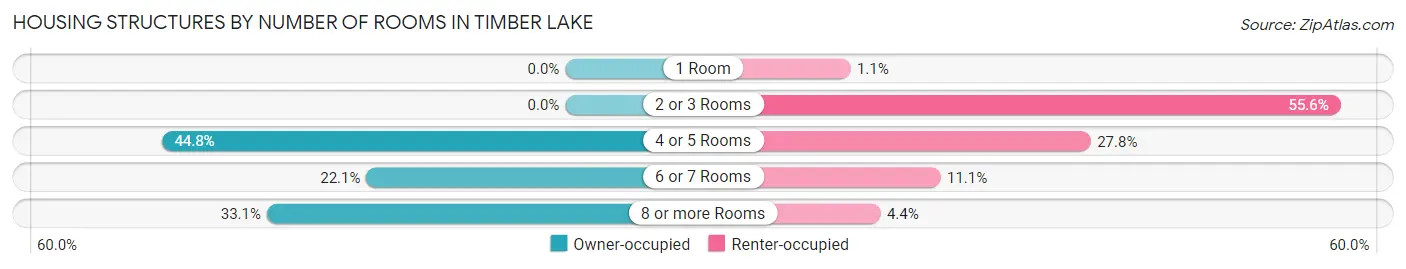
| Number of Rooms | Owner-occupied | Renter-occupied |
| 1 Room | 0 (0.0%) | 1 (1.1%) |
| 2 or 3 Rooms | 0 (0.0%) | 50 (55.6%) |
| 4 or 5 Rooms | 69 (44.8%) | 25 (27.8%) |
| 6 or 7 Rooms | 34 (22.1%) | 10 (11.1%) |
| 8 or more Rooms | 51 (33.1%) | 4 (4.4%) |
| Total | 154 (100.0%) | 90 (100.0%) |
Housing Structure by Heating Type in Timber Lake
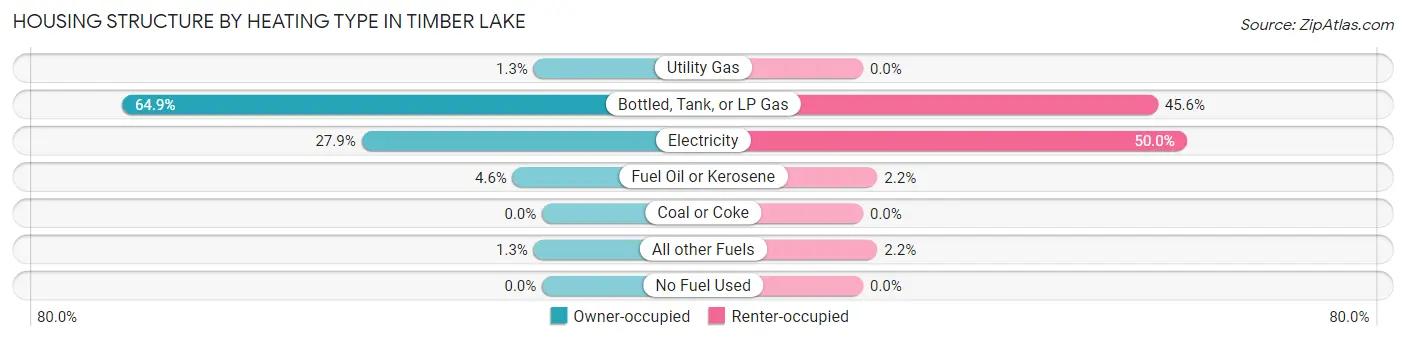
| Heating Type | Owner-occupied | Renter-occupied |
| Utility Gas | 2 (1.3%) | 0 (0.0%) |
| Bottled, Tank, or LP Gas | 100 (64.9%) | 41 (45.6%) |
| Electricity | 43 (27.9%) | 45 (50.0%) |
| Fuel Oil or Kerosene | 7 (4.5%) | 2 (2.2%) |
| Coal or Coke | 0 (0.0%) | 0 (0.0%) |
| All other Fuels | 2 (1.3%) | 2 (2.2%) |
| No Fuel Used | 0 (0.0%) | 0 (0.0%) |
| Total | 154 (100.0%) | 90 (100.0%) |
Household Vehicle Usage in Timber Lake
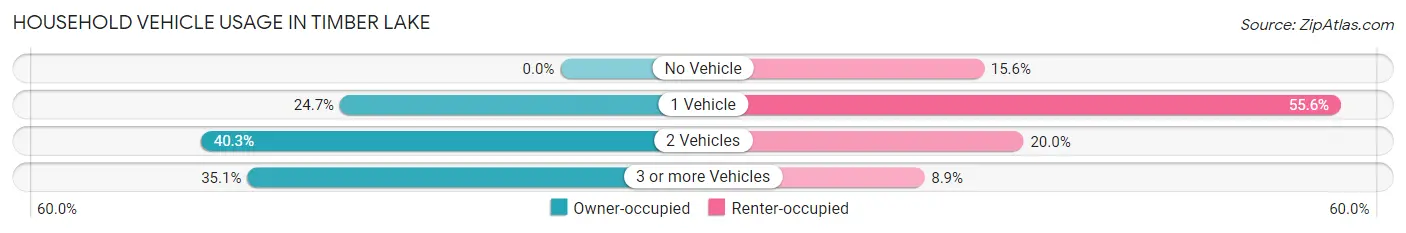
| Vehicles per Household | Owner-occupied | Renter-occupied |
| No Vehicle | 0 (0.0%) | 14 (15.6%) |
| 1 Vehicle | 38 (24.7%) | 50 (55.6%) |
| 2 Vehicles | 62 (40.3%) | 18 (20.0%) |
| 3 or more Vehicles | 54 (35.1%) | 8 (8.9%) |
| Total | 154 (100.0%) | 90 (100.0%) |
Real Estate & Mortgages in Timber Lake
Real Estate and Mortgage Overview in Timber Lake
| Characteristic | Without Mortgage | With Mortgage |
| Housing Units | 70 | 84 |
| Median Property Value | $62,200 | $101,500 |
| Median Household Income | $59,000 | $3 |
| Monthly Housing Costs | $500 | $0 |
| Real Estate Taxes | $764 | $5 |
Property Value by Mortgage Status in Timber Lake
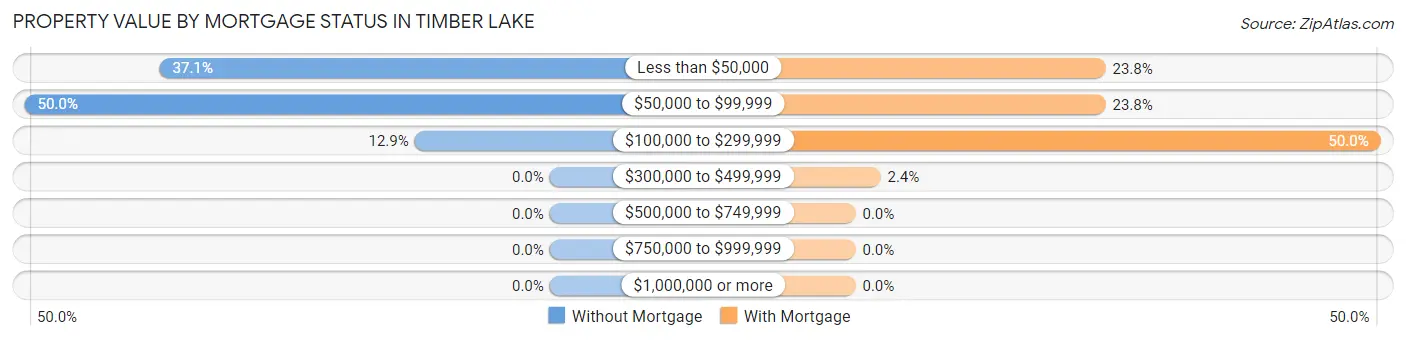
| Property Value | Without Mortgage | With Mortgage |
| Less than $50,000 | 26 (37.1%) | 20 (23.8%) |
| $50,000 to $99,999 | 35 (50.0%) | 20 (23.8%) |
| $100,000 to $299,999 | 9 (12.9%) | 42 (50.0%) |
| $300,000 to $499,999 | 0 (0.0%) | 2 (2.4%) |
| $500,000 to $749,999 | 0 (0.0%) | 0 (0.0%) |
| $750,000 to $999,999 | 0 (0.0%) | 0 (0.0%) |
| $1,000,000 or more | 0 (0.0%) | 0 (0.0%) |
| Total | 70 (100.0%) | 84 (100.0%) |
Household Income by Mortgage Status in Timber Lake
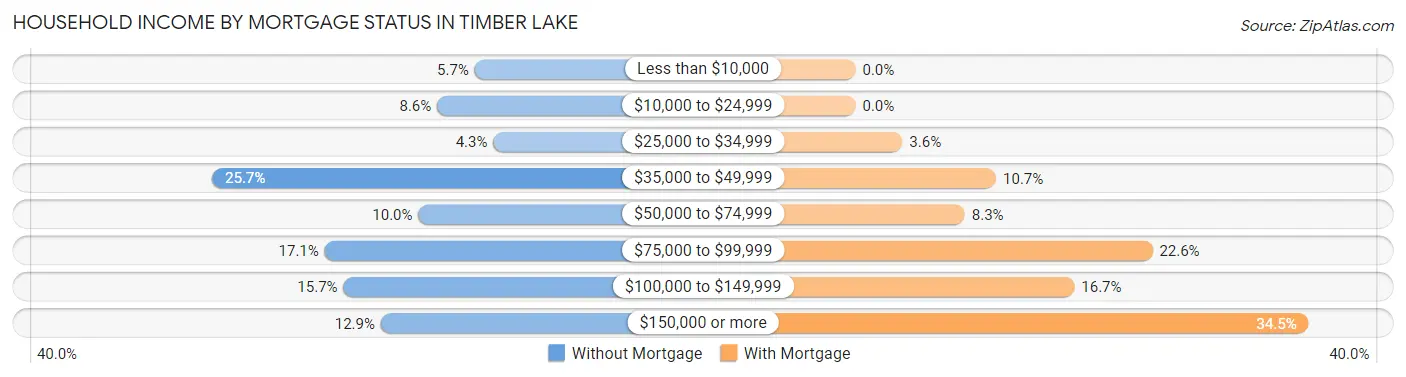
| Household Income | Without Mortgage | With Mortgage |
| Less than $10,000 | 4 (5.7%) | 0 (0.0%) |
| $10,000 to $24,999 | 6 (8.6%) | 0 (0.0%) |
| $25,000 to $34,999 | 3 (4.3%) | 3 (3.6%) |
| $35,000 to $49,999 | 18 (25.7%) | 9 (10.7%) |
| $50,000 to $74,999 | 7 (10.0%) | 7 (8.3%) |
| $75,000 to $99,999 | 12 (17.1%) | 19 (22.6%) |
| $100,000 to $149,999 | 11 (15.7%) | 14 (16.7%) |
| $150,000 or more | 9 (12.9%) | 29 (34.5%) |
| Total | 70 (100.0%) | 84 (100.0%) |
Property Value to Household Income Ratio in Timber Lake
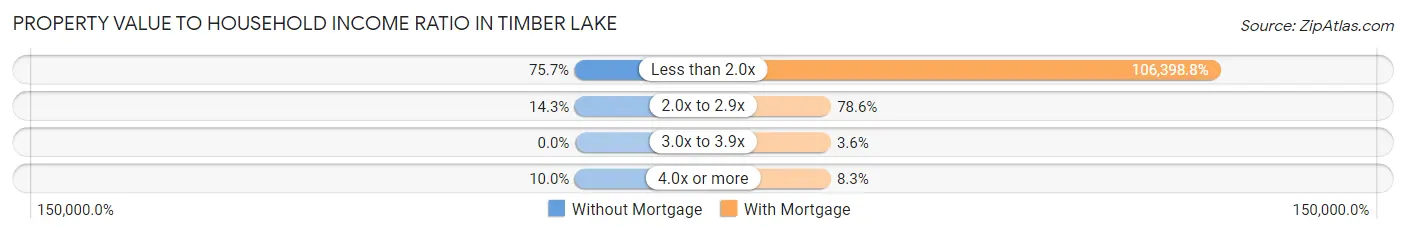
| Value-to-Income Ratio | Without Mortgage | With Mortgage |
| Less than 2.0x | 53 (75.7%) | 89,375 (106,398.8%) |
| 2.0x to 2.9x | 10 (14.3%) | 66 (78.6%) |
| 3.0x to 3.9x | 0 (0.0%) | 3 (3.6%) |
| 4.0x or more | 7 (10.0%) | 7 (8.3%) |
| Total | 70 (100.0%) | 84 (100.0%) |
Real Estate Taxes by Mortgage Status in Timber Lake
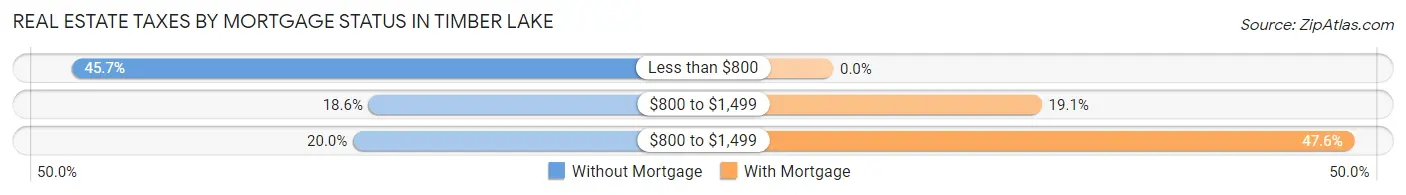
| Property Taxes | Without Mortgage | With Mortgage |
| Less than $800 | 32 (45.7%) | 0 (0.0%) |
| $800 to $1,499 | 13 (18.6%) | 16 (19.1%) |
| $800 to $1,499 | 14 (20.0%) | 40 (47.6%) |
| Total | 70 (100.0%) | 84 (100.0%) |
Health & Disability in Timber Lake
Health Insurance Coverage by Age in Timber Lake
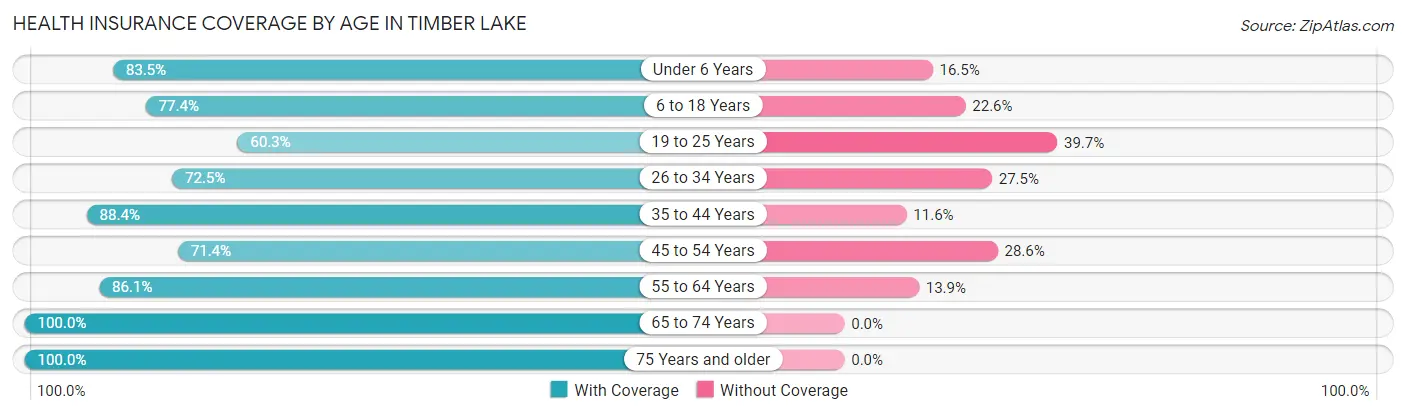
| Age Bracket | With Coverage | Without Coverage |
| Under 6 Years | 66 (83.5%) | 13 (16.5%) |
| 6 to 18 Years | 96 (77.4%) | 28 (22.6%) |
| 19 to 25 Years | 38 (60.3%) | 25 (39.7%) |
| 26 to 34 Years | 58 (72.5%) | 22 (27.5%) |
| 35 to 44 Years | 84 (88.4%) | 11 (11.6%) |
| 45 to 54 Years | 40 (71.4%) | 16 (28.6%) |
| 55 to 64 Years | 31 (86.1%) | 5 (13.9%) |
| 65 to 74 Years | 43 (100.0%) | 0 (0.0%) |
| 75 Years and older | 24 (100.0%) | 0 (0.0%) |
| Total | 480 (80.0%) | 120 (20.0%) |
Health Insurance Coverage by Citizenship Status in Timber Lake
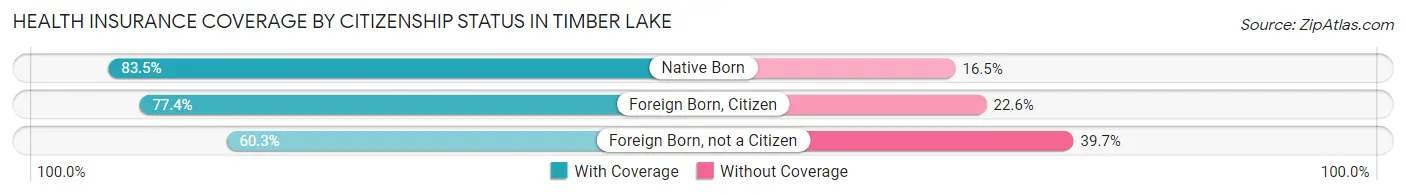
| Citizenship Status | With Coverage | Without Coverage |
| Native Born | 66 (83.5%) | 13 (16.5%) |
| Foreign Born, Citizen | 96 (77.4%) | 28 (22.6%) |
| Foreign Born, not a Citizen | 38 (60.3%) | 25 (39.7%) |
Health Insurance Coverage by Household Income in Timber Lake
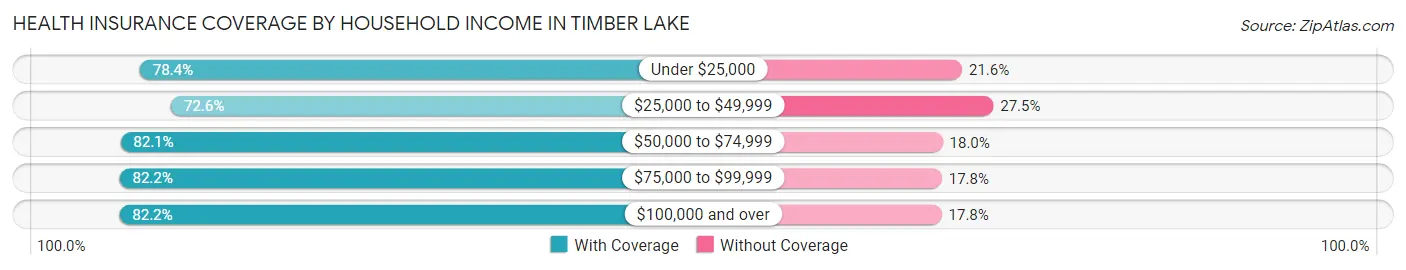
| Household Income | With Coverage | Without Coverage |
| Under $25,000 | 69 (78.4%) | 19 (21.6%) |
| $25,000 to $49,999 | 74 (72.6%) | 28 (27.5%) |
| $50,000 to $74,999 | 64 (82.1%) | 14 (17.9%) |
| $75,000 to $99,999 | 97 (82.2%) | 21 (17.8%) |
| $100,000 and over | 176 (82.2%) | 38 (17.8%) |
Public vs Private Health Insurance Coverage by Age in Timber Lake
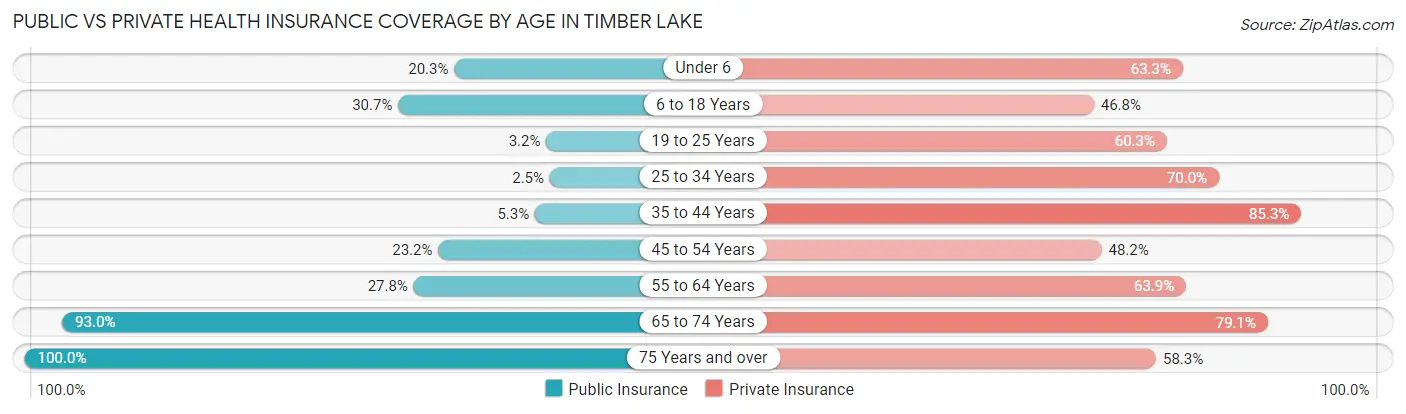
| Age Bracket | Public Insurance | Private Insurance |
| Under 6 | 16 (20.3%) | 50 (63.3%) |
| 6 to 18 Years | 38 (30.6%) | 58 (46.8%) |
| 19 to 25 Years | 2 (3.2%) | 38 (60.3%) |
| 25 to 34 Years | 2 (2.5%) | 56 (70.0%) |
| 35 to 44 Years | 5 (5.3%) | 81 (85.3%) |
| 45 to 54 Years | 13 (23.2%) | 27 (48.2%) |
| 55 to 64 Years | 10 (27.8%) | 23 (63.9%) |
| 65 to 74 Years | 40 (93.0%) | 34 (79.1%) |
| 75 Years and over | 24 (100.0%) | 14 (58.3%) |
| Total | 150 (25.0%) | 381 (63.5%) |
Disability Status by Sex by Age in Timber Lake
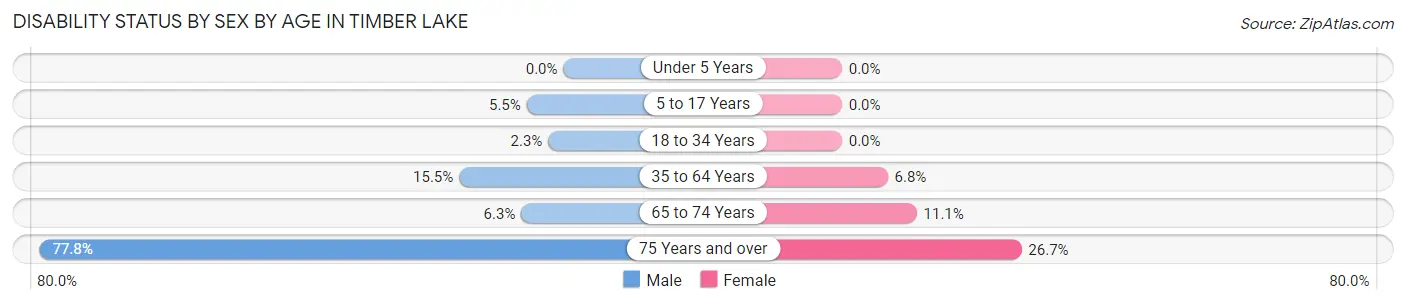
| Age Bracket | Male | Female |
| Under 5 Years | 0 (0.0%) | 0 (0.0%) |
| 5 to 17 Years | 3 (5.4%) | 0 (0.0%) |
| 18 to 34 Years | 2 (2.2%) | 0 (0.0%) |
| 35 to 64 Years | 13 (15.5%) | 7 (6.8%) |
| 65 to 74 Years | 1 (6.2%) | 3 (11.1%) |
| 75 Years and over | 7 (77.8%) | 4 (26.7%) |
Disability Class by Sex by Age in Timber Lake
Disability Class: Hearing Difficulty
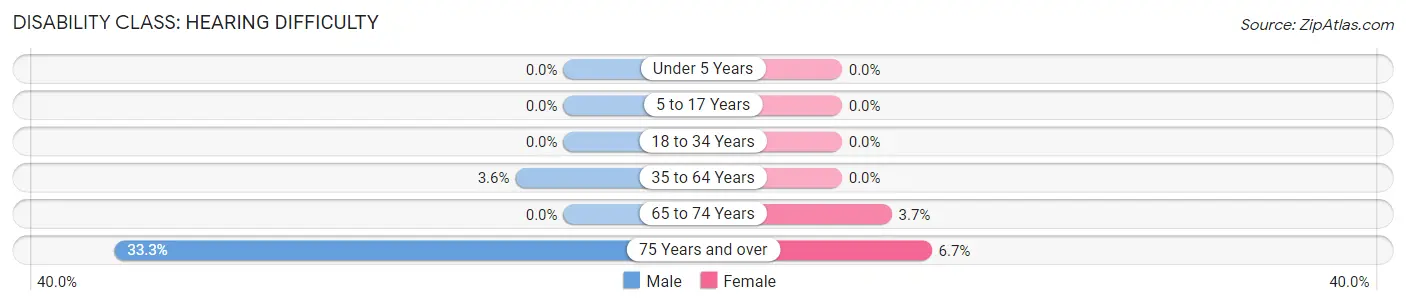
| Age Bracket | Male | Female |
| Under 5 Years | 0 (0.0%) | 0 (0.0%) |
| 5 to 17 Years | 0 (0.0%) | 0 (0.0%) |
| 18 to 34 Years | 0 (0.0%) | 0 (0.0%) |
| 35 to 64 Years | 3 (3.6%) | 0 (0.0%) |
| 65 to 74 Years | 0 (0.0%) | 1 (3.7%) |
| 75 Years and over | 3 (33.3%) | 1 (6.7%) |
Disability Class: Vision Difficulty
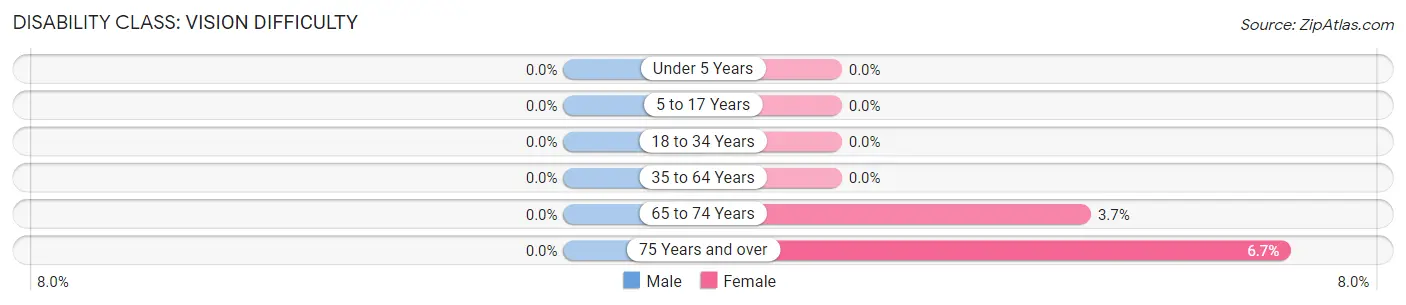
| Age Bracket | Male | Female |
| Under 5 Years | 0 (0.0%) | 0 (0.0%) |
| 5 to 17 Years | 0 (0.0%) | 0 (0.0%) |
| 18 to 34 Years | 0 (0.0%) | 0 (0.0%) |
| 35 to 64 Years | 0 (0.0%) | 0 (0.0%) |
| 65 to 74 Years | 0 (0.0%) | 1 (3.7%) |
| 75 Years and over | 0 (0.0%) | 1 (6.7%) |
Disability Class: Cognitive Difficulty
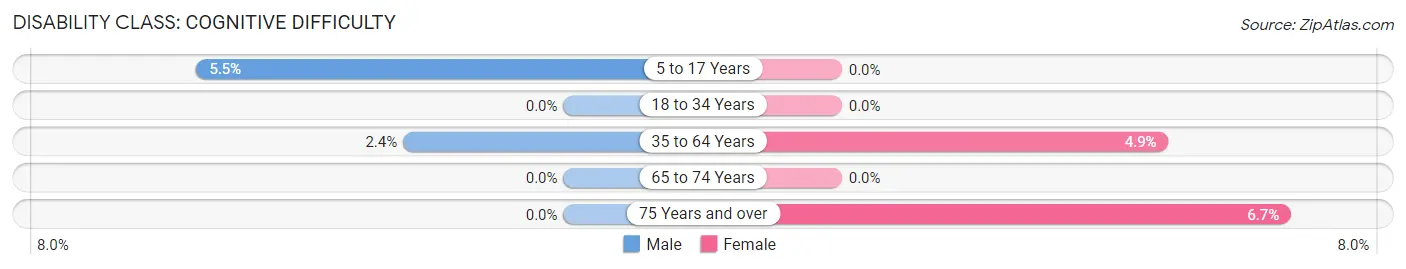
| Age Bracket | Male | Female |
| 5 to 17 Years | 3 (5.4%) | 0 (0.0%) |
| 18 to 34 Years | 0 (0.0%) | 0 (0.0%) |
| 35 to 64 Years | 2 (2.4%) | 5 (4.9%) |
| 65 to 74 Years | 0 (0.0%) | 0 (0.0%) |
| 75 Years and over | 0 (0.0%) | 1 (6.7%) |
Disability Class: Ambulatory Difficulty
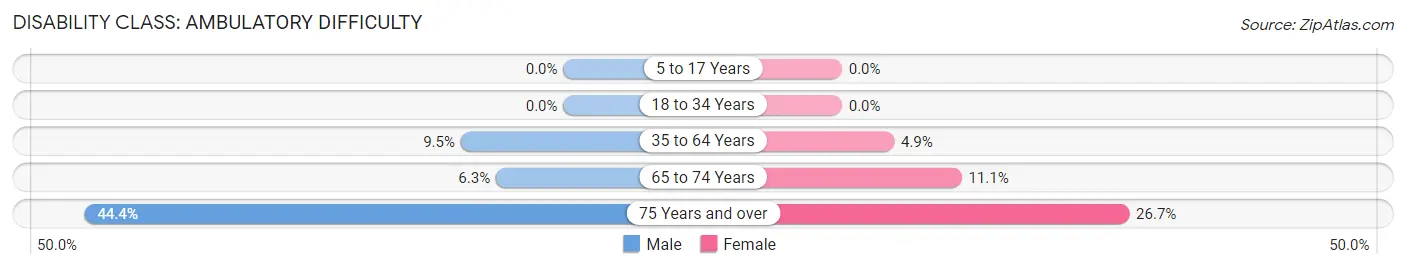
| Age Bracket | Male | Female |
| 5 to 17 Years | 0 (0.0%) | 0 (0.0%) |
| 18 to 34 Years | 0 (0.0%) | 0 (0.0%) |
| 35 to 64 Years | 8 (9.5%) | 5 (4.9%) |
| 65 to 74 Years | 1 (6.2%) | 3 (11.1%) |
| 75 Years and over | 4 (44.4%) | 4 (26.7%) |
Disability Class: Self-Care Difficulty
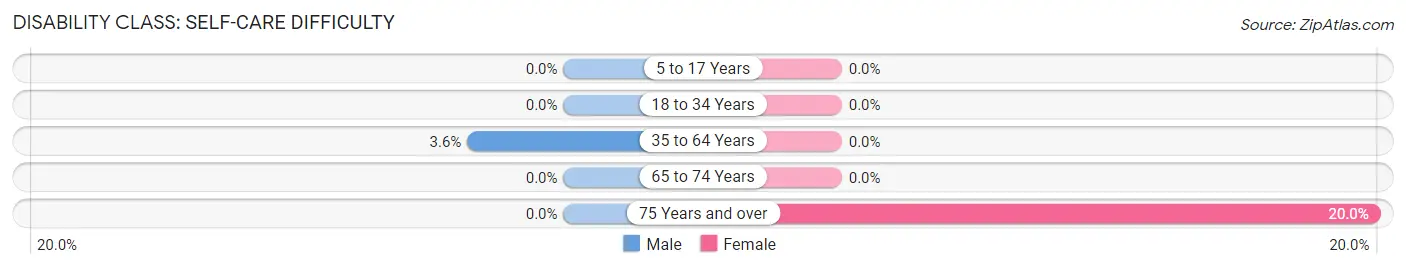
| Age Bracket | Male | Female |
| 5 to 17 Years | 0 (0.0%) | 0 (0.0%) |
| 18 to 34 Years | 0 (0.0%) | 0 (0.0%) |
| 35 to 64 Years | 3 (3.6%) | 0 (0.0%) |
| 65 to 74 Years | 0 (0.0%) | 0 (0.0%) |
| 75 Years and over | 0 (0.0%) | 3 (20.0%) |
Technology Access in Timber Lake
Computing Device Access in Timber Lake
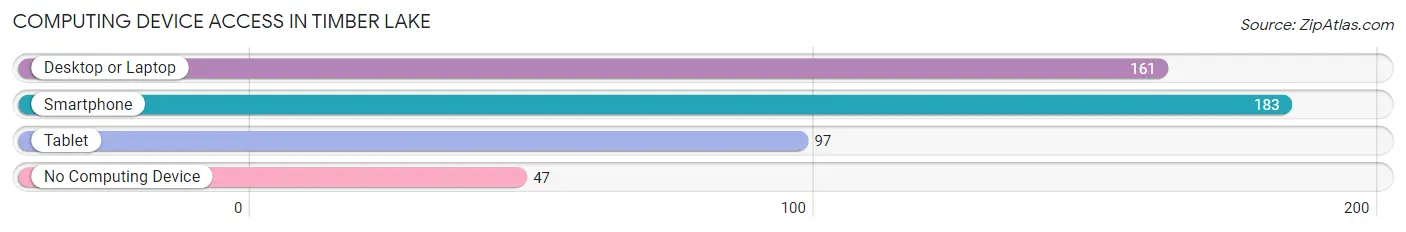
| Device Type | # Households | % Households |
| Desktop or Laptop | 161 | 66.0% |
| Smartphone | 183 | 75.0% |
| Tablet | 97 | 39.8% |
| No Computing Device | 47 | 19.3% |
| Total | 244 | 100.0% |
Internet Access in Timber Lake
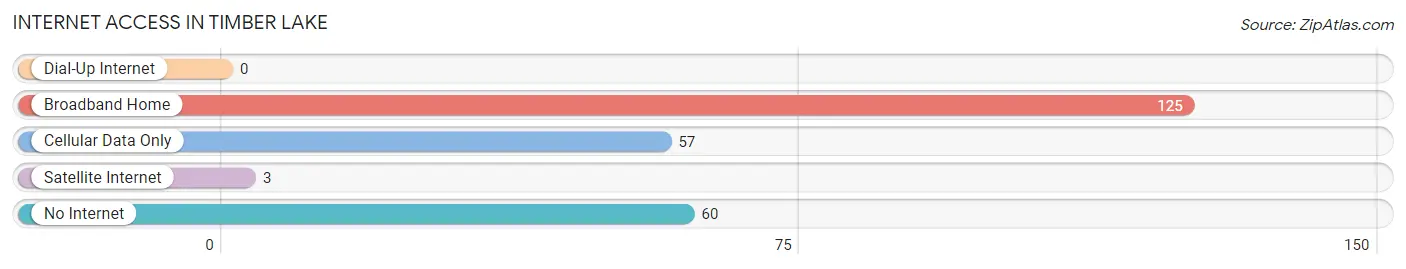
| Internet Type | # Households | % Households |
| Dial-Up Internet | 0 | 0.0% |
| Broadband Home | 125 | 51.2% |
| Cellular Data Only | 57 | 23.4% |
| Satellite Internet | 3 | 1.2% |
| No Internet | 60 | 24.6% |
| Total | 244 | 100.0% |
Timber Lake Summary
Timber Lake is a small town located in the southwestern corner of South Dakota, in the United States. It is situated in Dewey County, and is the county seat. The town is located on the edge of the Cheyenne River Indian Reservation, and is home to a population of approximately 600 people.
History
Timber Lake was founded in 1883, when the Chicago, Milwaukee, St. Paul and Pacific Railroad (the Milwaukee Road) was built through the area. The town was named after the nearby lake, which was named for the abundance of timber in the area. The town was incorporated in 1887, and the first post office was established in 1888.
In the early 1900s, Timber Lake was a bustling town, with a population of over 1,000 people. The town was home to a variety of businesses, including a bank, a hotel, a lumberyard, a blacksmith shop, a livery stable, and a variety of other stores. The town also had a school, a church, and a newspaper.
In the 1920s, the town began to decline, as the railroad began to move away from the area. The population dropped to just over 500 people by the 1930s. The town continued to decline throughout the 20th century, and by the 2000s, the population had dropped to just over 600 people.
Geography
Timber Lake is located in southwestern South Dakota, in Dewey County. The town is situated on the edge of the Cheyenne River Indian Reservation, and is located at the intersection of U.S. Route 212 and South Dakota Highway 73. The town is located approximately 50 miles east of the Montana border, and is approximately 100 miles west of the Nebraska border.
The town is situated in a semi-arid region, with an average annual precipitation of just over 16 inches. The average temperature in the summer is around 80 degrees Fahrenheit, and the average temperature in the winter is around 20 degrees Fahrenheit.
Economy
The economy of Timber Lake is largely based on agriculture and tourism. The town is home to a variety of small businesses, including a grocery store, a hardware store, a restaurant, and a variety of other stores. The town is also home to a variety of tourist attractions, including the Cheyenne River Indian Reservation, the Timber Lake Museum, and the Timber Lake Golf Course.
Demographics
As of the 2010 census, the population of Timber Lake was 602 people. The racial makeup of the town was 94.2% White, 0.2% African American, 3.3% Native American, 0.2% Asian, 0.2% from other races, and 1.9% from two or more races. The median household income was $31,250, and the median family income was $35,417. The per capita income was $15,845.
Conclusion
Timber Lake is a small town located in southwestern South Dakota, in Dewey County. The town is situated on the edge of the Cheyenne River Indian Reservation, and is home to a population of approximately 600 people. The economy of the town is largely based on agriculture and tourism, and the town is home to a variety of small businesses and tourist attractions. The population of the town is predominantly White, with a small percentage of Native American and African American residents.
Common Questions
What is Per Capita Income in Timber Lake?
Per Capita income in Timber Lake is $26,690.
What is the Median Family Income in Timber Lake?
Median Family Income in Timber Lake is $75,313.
What is the Median Household income in Timber Lake?
Median Household Income in Timber Lake is $56,389.
What is Income or Wage Gap in Timber Lake?
Income or Wage Gap in Timber Lake is 46.1%.
Women in Timber Lake earn 53.9 cents for every dollar earned by a man.
What is Family Income Deficit in Timber Lake?
Family Income Deficit in Timber Lake is $13,143.
Families that are below poverty line in Timber Lake earn $13,143 less on average than the poverty threshold level.
What is Inequality or Gini Index in Timber Lake?
Inequality or Gini Index in Timber Lake is 0.40.
What is the Total Population of Timber Lake?
Total Population of Timber Lake is 627.
What is the Total Male Population of Timber Lake?
Total Male Population of Timber Lake is 312.
What is the Total Female Population of Timber Lake?
Total Female Population of Timber Lake is 315.
What is the Ratio of Males per 100 Females in Timber Lake?
There are 99.05 Males per 100 Females in Timber Lake.
What is the Ratio of Females per 100 Males in Timber Lake?
There are 100.96 Females per 100 Males in Timber Lake.
What is the Median Population Age in Timber Lake?
Median Population Age in Timber Lake is 30.0 Years.
What is the Average Family Size in Timber Lake
Average Family Size in Timber Lake is 3.2 People.
What is the Average Household Size in Timber Lake
Average Household Size in Timber Lake is 2.5 People.
How Large is the Labor Force in Timber Lake?
There are 306 People in the Labor Forcein in Timber Lake.
What is the Percentage of People in the Labor Force in Timber Lake?
68.3% of People are in the Labor Force in Timber Lake.
What is the Unemployment Rate in Timber Lake?
Unemployment Rate in Timber Lake is 6.2%.