Rapid Valley, SD Map & Demographics
Rapid Valley Map
Rapid Valley Overview
$36,282
PER CAPITA INCOME
$93,863
AVG FAMILY INCOME
$76,827
AVG HOUSEHOLD INCOME
5.7%
WAGE / INCOME GAP [ % ]
94.3¢/ $1
WAGE / INCOME GAP [ $ ]
0.32
INEQUALITY / GINI INDEX
7,324
TOTAL POPULATION
4,068
MALE POPULATION
3,256
FEMALE POPULATION
124.94
MALES / 100 FEMALES
80.04
FEMALES / 100 MALES
41.6
MEDIAN AGE
2.8
AVG FAMILY SIZE
2.4
AVG HOUSEHOLD SIZE
4,327
LABOR FORCE [ PEOPLE ]
72.4%
PERCENT IN LABOR FORCE
3.1%
UNEMPLOYMENT RATE
Income in Rapid Valley
Income Overview in Rapid Valley
Per Capita Income in Rapid Valley is $36,282, while median incomes of families and households are $93,863 and $76,827 respectively.
| Characteristic | Number | Measure |
| Per Capita Income | 7,324 | $36,282 |
| Median Family Income | 1,979 | $93,863 |
| Mean Family Income | 1,979 | $95,817 |
| Median Household Income | 3,086 | $76,827 |
| Mean Household Income | 3,086 | $84,315 |
| Income Deficit | 1,979 | $0 |
| Wage / Income Gap (%) | 7,324 | 5.70% |
| Wage / Income Gap ($) | 7,324 | 94.30¢ per $1 |
| Gini / Inequality Index | 7,324 | 0.32 |
Earnings by Sex in Rapid Valley
Average Earnings in Rapid Valley are $40,222, $41,294 for men and $38,941 for women, a difference of 5.7%.
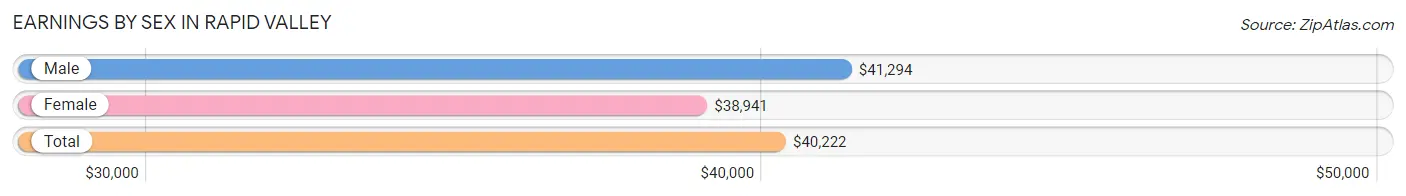
| Sex | Number | Average Earnings |
| Male | 2,687 (58.2%) | $41,294 |
| Female | 1,930 (41.8%) | $38,941 |
| Total | 4,617 (100.0%) | $40,222 |
Earnings by Sex by Income Bracket in Rapid Valley
The most common earnings brackets in Rapid Valley are $55,000 to $64,999 for men (294 | 10.9%) and $40,000 to $44,999 for women (215 | 11.1%).
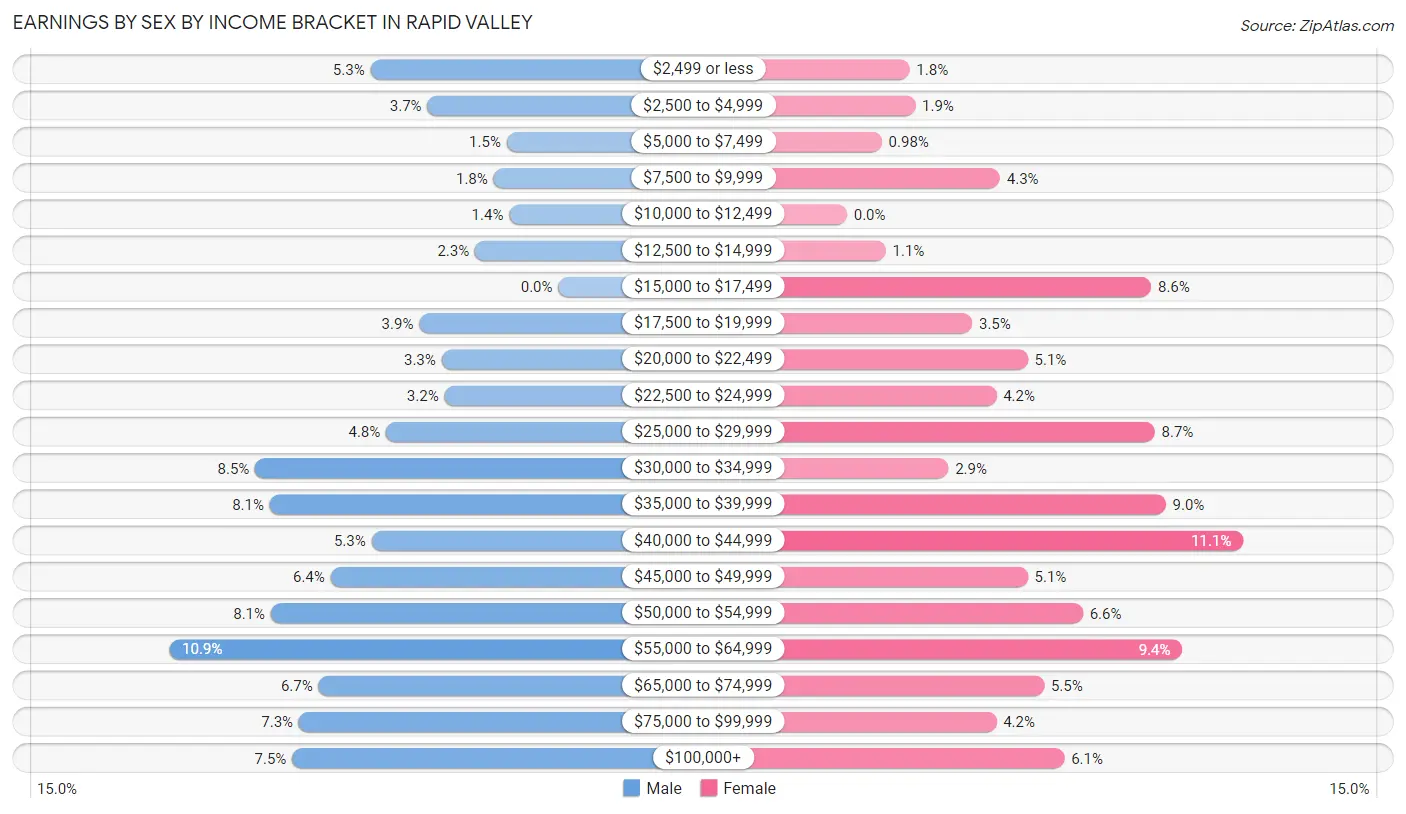
| Income | Male | Female |
| $2,499 or less | 142 (5.3%) | 34 (1.8%) |
| $2,500 to $4,999 | 99 (3.7%) | 37 (1.9%) |
| $5,000 to $7,499 | 39 (1.5%) | 19 (1.0%) |
| $7,500 to $9,999 | 49 (1.8%) | 83 (4.3%) |
| $10,000 to $12,499 | 37 (1.4%) | 0 (0.0%) |
| $12,500 to $14,999 | 63 (2.3%) | 21 (1.1%) |
| $15,000 to $17,499 | 0 (0.0%) | 165 (8.6%) |
| $17,500 to $19,999 | 105 (3.9%) | 68 (3.5%) |
| $20,000 to $22,499 | 88 (3.3%) | 98 (5.1%) |
| $22,500 to $24,999 | 86 (3.2%) | 81 (4.2%) |
| $25,000 to $29,999 | 130 (4.8%) | 167 (8.6%) |
| $30,000 to $34,999 | 229 (8.5%) | 55 (2.9%) |
| $35,000 to $39,999 | 218 (8.1%) | 173 (9.0%) |
| $40,000 to $44,999 | 141 (5.2%) | 215 (11.1%) |
| $45,000 to $49,999 | 172 (6.4%) | 98 (5.1%) |
| $50,000 to $54,999 | 217 (8.1%) | 128 (6.6%) |
| $55,000 to $64,999 | 294 (10.9%) | 182 (9.4%) |
| $65,000 to $74,999 | 181 (6.7%) | 107 (5.5%) |
| $75,000 to $99,999 | 196 (7.3%) | 81 (4.2%) |
| $100,000+ | 201 (7.5%) | 118 (6.1%) |
| Total | 2,687 (100.0%) | 1,930 (100.0%) |
Earnings by Sex by Educational Attainment in Rapid Valley
Average earnings in Rapid Valley are $50,163 for men and $41,286 for women, a difference of 17.7%. Men with an educational attainment of bachelor's degree enjoy the highest average annual earnings of $71,161, while those with less than high school education earn the least with $33,689. Women with an educational attainment of bachelor's degree earn the most with the average annual earnings of $60,673, while those with college or associate's degree education have the smallest earnings of $37,629.
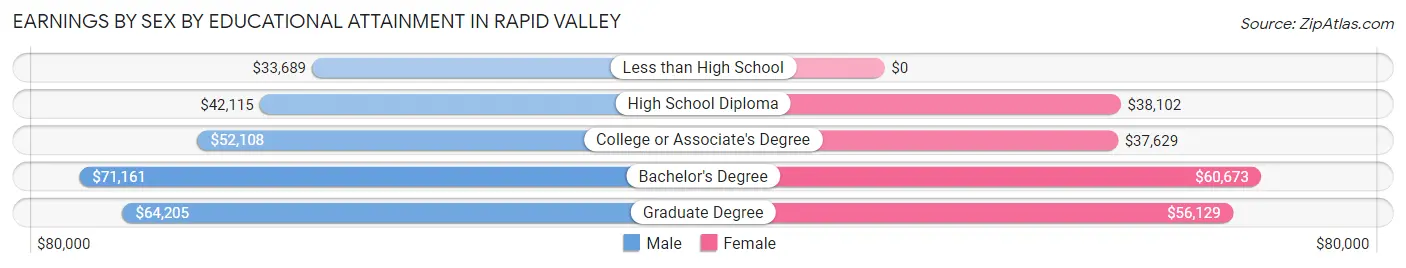
| Educational Attainment | Male Income | Female Income |
| Less than High School | $33,689 | $0 |
| High School Diploma | $42,115 | $38,102 |
| College or Associate's Degree | $52,108 | $37,629 |
| Bachelor's Degree | $71,161 | $60,673 |
| Graduate Degree | $64,205 | $56,129 |
| Total | $50,163 | $41,286 |
Family Income in Rapid Valley
Family Income Brackets in Rapid Valley
According to the Rapid Valley family income data, there are 667 families falling into the $100,000 to $149,999 income range, which is the most common income bracket and makes up 33.7% of all families. Conversely, the $10,000 to $14,999 income bracket is the least frequent group with only 12 families (0.6%) belonging to this category.
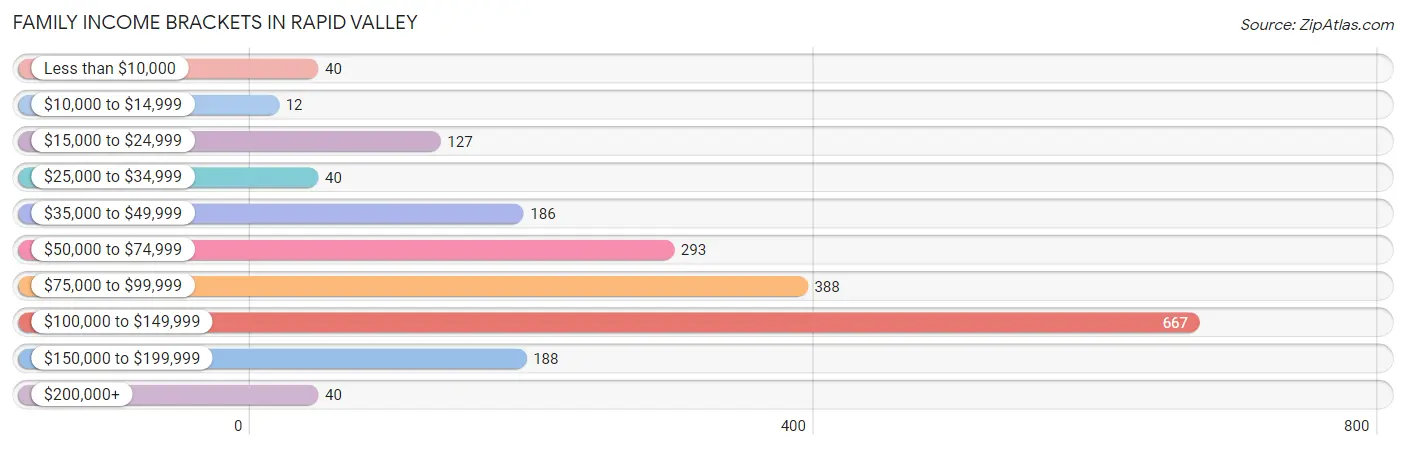
| Income Bracket | # Families | % Families |
| Less than $10,000 | 40 | 2.0% |
| $10,000 to $14,999 | 12 | 0.6% |
| $15,000 to $24,999 | 127 | 6.4% |
| $25,000 to $34,999 | 40 | 2.0% |
| $35,000 to $49,999 | 186 | 9.4% |
| $50,000 to $74,999 | 293 | 14.8% |
| $75,000 to $99,999 | 388 | 19.6% |
| $100,000 to $149,999 | 667 | 33.7% |
| $150,000 to $199,999 | 188 | 9.5% |
| $200,000+ | 40 | 2.0% |
Family Income by Famaliy Size in Rapid Valley
4-person families (392 | 19.8%) account for the highest median family income in Rapid Valley with $104,603 per family, while 2-person families (1,087 | 54.9%) have the highest median income of $40,683 per family member.
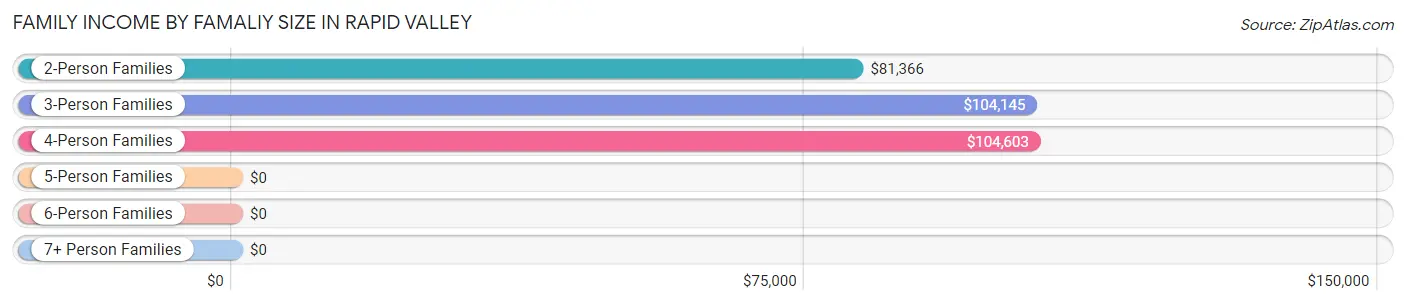
| Income Bracket | # Families | Median Income |
| 2-Person Families | 1,087 (54.9%) | $81,366 |
| 3-Person Families | 418 (21.1%) | $104,145 |
| 4-Person Families | 392 (19.8%) | $104,603 |
| 5-Person Families | 82 (4.1%) | $0 |
| 6-Person Families | 0 (0.0%) | $0 |
| 7+ Person Families | 0 (0.0%) | $0 |
| Total | 1,979 (100.0%) | $93,863 |
Family Income by Number of Earners in Rapid Valley
The median family income in Rapid Valley is $93,863, with families comprising 3+ earners (172) having the highest median family income of $119,554, while families with 1 earner (514) have the lowest median family income of $55,772, accounting for 8.7% and 26.0% of families, respectively.
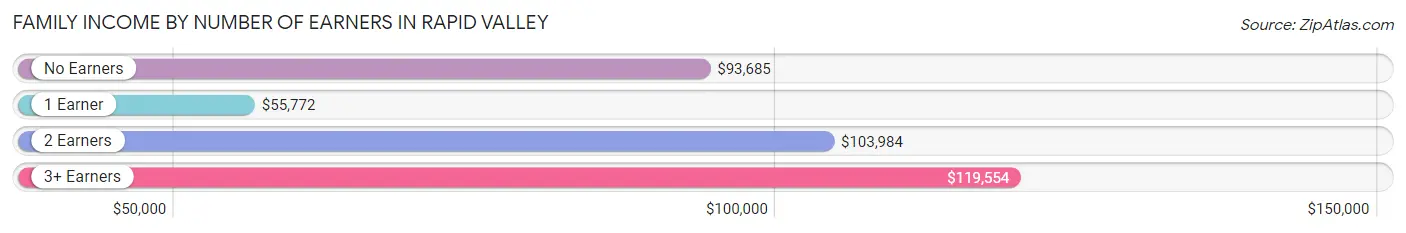
| Number of Earners | # Families | Median Income |
| No Earners | 153 (7.7%) | $93,685 |
| 1 Earner | 514 (26.0%) | $55,772 |
| 2 Earners | 1,140 (57.6%) | $103,984 |
| 3+ Earners | 172 (8.7%) | $119,554 |
| Total | 1,979 (100.0%) | $93,863 |
Household Income in Rapid Valley
Household Income Brackets in Rapid Valley
With 778 households falling in the category, the $100,000 to $149,999 income range is the most frequent in Rapid Valley, accounting for 25.2% of all households. In contrast, only 19 households (0.6%) fall into the $10,000 to $14,999 income bracket, making it the least populous group.
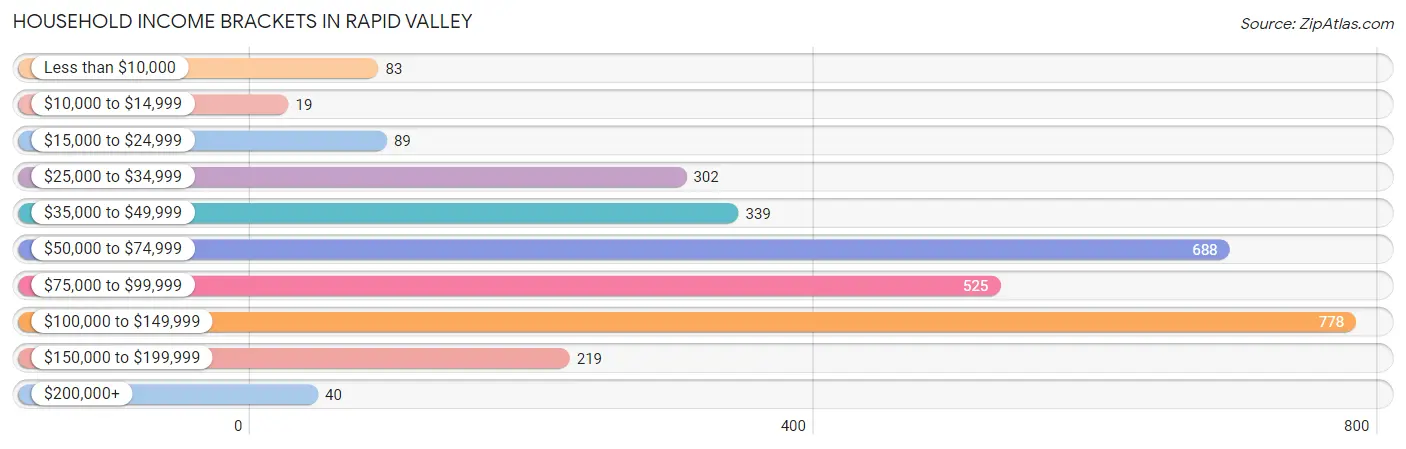
| Income Bracket | # Households | % Households |
| Less than $10,000 | 83 | 2.7% |
| $10,000 to $14,999 | 19 | 0.6% |
| $15,000 to $24,999 | 89 | 2.9% |
| $25,000 to $34,999 | 302 | 9.8% |
| $35,000 to $49,999 | 339 | 11.0% |
| $50,000 to $74,999 | 688 | 22.3% |
| $75,000 to $99,999 | 525 | 17.0% |
| $100,000 to $149,999 | 778 | 25.2% |
| $150,000 to $199,999 | 219 | 7.1% |
| $200,000+ | 40 | 1.3% |
Household Income by Householder Age in Rapid Valley
The median household income in Rapid Valley is $76,827, with the highest median household income of $94,972 found in the 45 to 64 years age bracket for the primary householder. A total of 1,157 households (37.5%) fall into this category. Meanwhile, the 15 to 24 years age bracket for the primary householder has the lowest median household income of $54,448, with 189 households (6.1%) in this group.
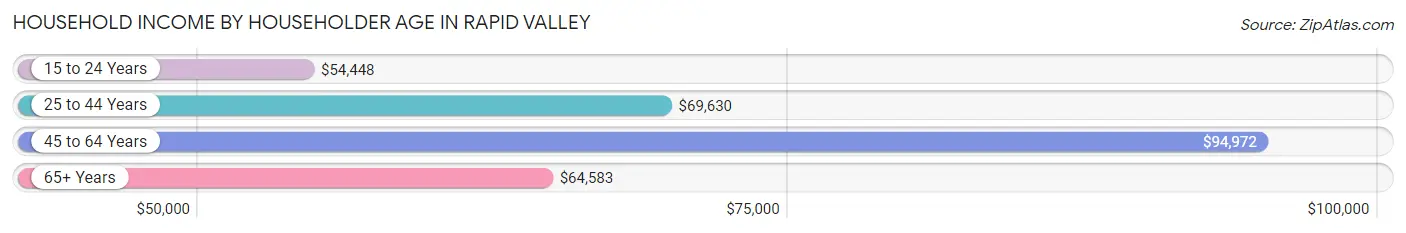
| Income Bracket | # Households | Median Income |
| 15 to 24 Years | 189 (6.1%) | $54,448 |
| 25 to 44 Years | 1,026 (33.3%) | $69,630 |
| 45 to 64 Years | 1,157 (37.5%) | $94,972 |
| 65+ Years | 714 (23.1%) | $64,583 |
| Total | 3,086 (100.0%) | $76,827 |
Poverty in Rapid Valley
Income Below Poverty by Sex and Age in Rapid Valley
With 5.8% poverty level for males and 17.7% for females among the residents of Rapid Valley, 12 to 14 year old males and 5 year old females are the most vulnerable to poverty, with 13 males (23.2%) and 23 females (100.0%) in their respective age groups living below the poverty level.
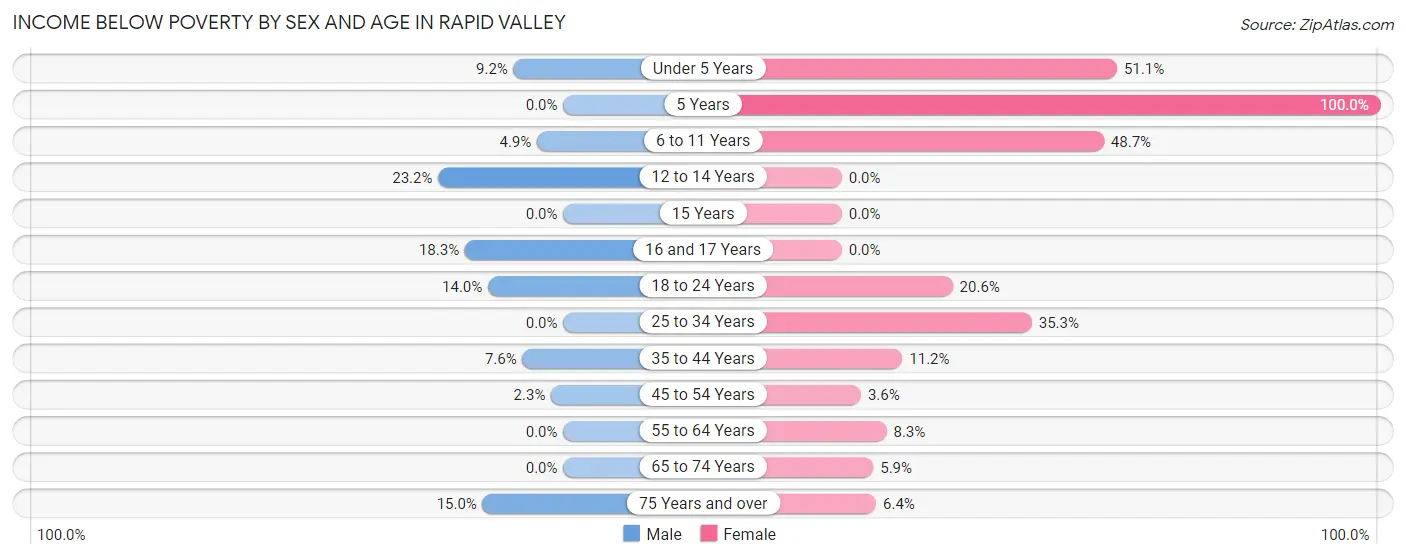
| Age Bracket | Male | Female |
| Under 5 Years | 13 (9.2%) | 189 (51.1%) |
| 5 Years | 0 (0.0%) | 23 (100.0%) |
| 6 to 11 Years | 20 (4.9%) | 54 (48.6%) |
| 12 to 14 Years | 13 (23.2%) | 0 (0.0%) |
| 15 Years | 0 (0.0%) | 0 (0.0%) |
| 16 and 17 Years | 21 (18.3%) | 0 (0.0%) |
| 18 to 24 Years | 76 (14.0%) | 50 (20.6%) |
| 25 to 34 Years | 0 (0.0%) | 103 (35.3%) |
| 35 to 44 Years | 50 (7.6%) | 58 (11.2%) |
| 45 to 54 Years | 12 (2.2%) | 19 (3.6%) |
| 55 to 64 Years | 0 (0.0%) | 40 (8.3%) |
| 65 to 74 Years | 0 (0.0%) | 22 (5.9%) |
| 75 Years and over | 28 (15.0%) | 10 (6.4%) |
| Total | 233 (5.8%) | 568 (17.7%) |
Income Above Poverty by Sex and Age in Rapid Valley
According to the poverty statistics in Rapid Valley, males aged 5 years and females aged 12 to 14 years are the age groups that are most secure financially, with 100.0% of males and 100.0% of females in these age groups living above the poverty line.
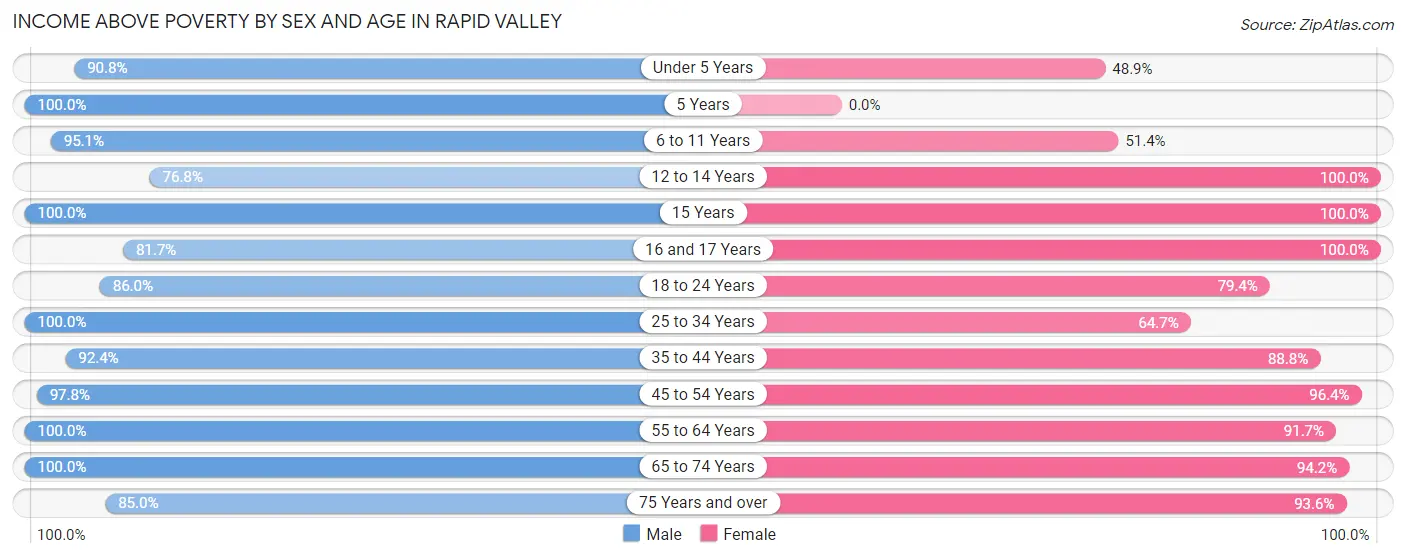
| Age Bracket | Male | Female |
| Under 5 Years | 128 (90.8%) | 181 (48.9%) |
| 5 Years | 43 (100.0%) | 0 (0.0%) |
| 6 to 11 Years | 391 (95.1%) | 57 (51.3%) |
| 12 to 14 Years | 43 (76.8%) | 35 (100.0%) |
| 15 Years | 54 (100.0%) | 29 (100.0%) |
| 16 and 17 Years | 94 (81.7%) | 37 (100.0%) |
| 18 to 24 Years | 468 (86.0%) | 193 (79.4%) |
| 25 to 34 Years | 397 (100.0%) | 189 (64.7%) |
| 35 to 44 Years | 610 (92.4%) | 458 (88.8%) |
| 45 to 54 Years | 521 (97.8%) | 514 (96.4%) |
| 55 to 64 Years | 556 (100.0%) | 442 (91.7%) |
| 65 to 74 Years | 349 (100.0%) | 354 (94.2%) |
| 75 Years and over | 159 (85.0%) | 147 (93.6%) |
| Total | 3,813 (94.2%) | 2,636 (82.3%) |
Income Below Poverty Among Married-Couple Families in Rapid Valley
The poverty statistics for married-couple families in Rapid Valley show that 2.0% or 31 of the total 1,518 families live below the poverty line. Families with 3 or 4 children have the highest poverty rate of 48.7%, comprising of 19 families. On the other hand, families with 1 or 2 children have the lowest poverty rate of 0.0%, which includes 0 families.
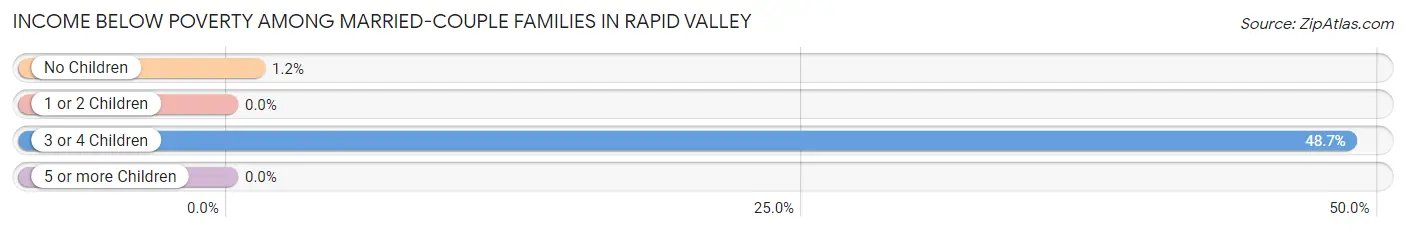
| Children | Above Poverty | Below Poverty |
| No Children | 1,002 (98.8%) | 12 (1.2%) |
| 1 or 2 Children | 465 (100.0%) | 0 (0.0%) |
| 3 or 4 Children | 20 (51.3%) | 19 (48.7%) |
| 5 or more Children | 0 (0.0%) | 0 (0.0%) |
| Total | 1,487 (98.0%) | 31 (2.0%) |
Income Below Poverty Among Single-Parent Households in Rapid Valley
According to the poverty data in Rapid Valley, 5.9% or 12 single-father households and 55.4% or 143 single-mother households are living below the poverty line. Among single-father households, those with 1 or 2 children have the highest poverty rate, with 12 households (100.0%) experiencing poverty. Likewise, among single-mother households, those with 3 or 4 children have the highest poverty rate, with 82 households (85.4%) falling below the poverty line.
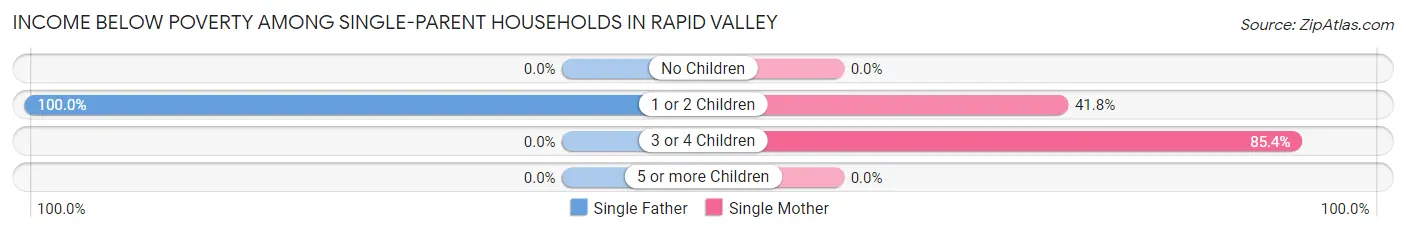
| Children | Single Father | Single Mother |
| No Children | 0 (0.0%) | 0 (0.0%) |
| 1 or 2 Children | 12 (100.0%) | 61 (41.8%) |
| 3 or 4 Children | 0 (0.0%) | 82 (85.4%) |
| 5 or more Children | 0 (0.0%) | 0 (0.0%) |
| Total | 12 (5.9%) | 143 (55.4%) |
Income Below Poverty Among Married-Couple vs Single-Parent Households in Rapid Valley
The poverty data for Rapid Valley shows that 31 of the married-couple family households (2.0%) and 155 of the single-parent households (33.6%) are living below the poverty level. Within the married-couple family households, those with 3 or 4 children have the highest poverty rate, with 19 households (48.7%) falling below the poverty line. Among the single-parent households, those with 3 or 4 children have the highest poverty rate, with 82 household (54.7%) living below poverty.
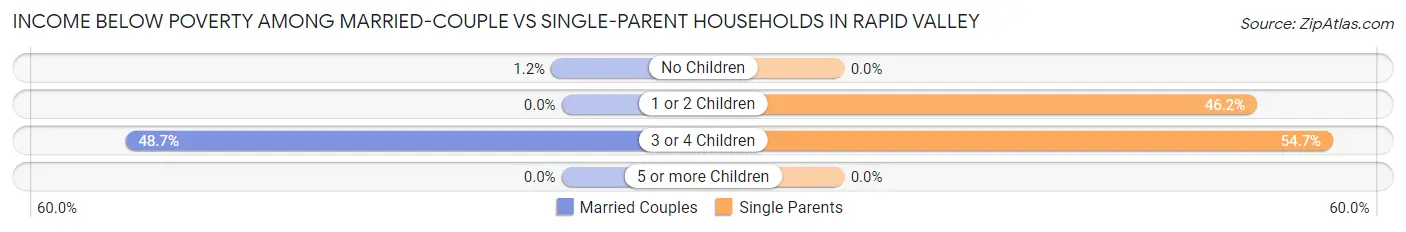
| Children | Married-Couple Families | Single-Parent Households |
| No Children | 12 (1.2%) | 0 (0.0%) |
| 1 or 2 Children | 0 (0.0%) | 73 (46.2%) |
| 3 or 4 Children | 19 (48.7%) | 82 (54.7%) |
| 5 or more Children | 0 (0.0%) | 0 (0.0%) |
| Total | 31 (2.0%) | 155 (33.6%) |
Race in Rapid Valley
The most populous races in Rapid Valley are White / Caucasian (6,151 | 84.0%), Two or more Races (622 | 8.5%), and Hispanic or Latino (483 | 6.6%).
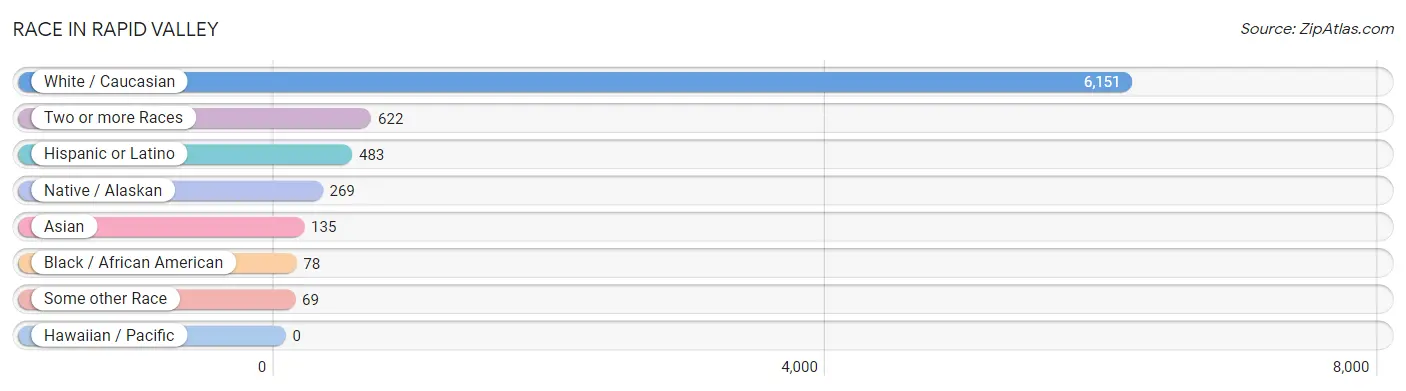
| Race | # Population | % Population |
| Asian | 135 | 1.8% |
| Black / African American | 78 | 1.1% |
| Hawaiian / Pacific | 0 | 0.0% |
| Hispanic or Latino | 483 | 6.6% |
| Native / Alaskan | 269 | 3.7% |
| White / Caucasian | 6,151 | 84.0% |
| Two or more Races | 622 | 8.5% |
| Some other Race | 69 | 0.9% |
| Total | 7,324 | 100.0% |
Ancestry in Rapid Valley
The most populous ancestries reported in Rapid Valley are German (2,363 | 32.3%), Irish (972 | 13.3%), Norwegian (594 | 8.1%), English (569 | 7.8%), and Sioux (438 | 6.0%), together accounting for 67.4% of all Rapid Valley residents.
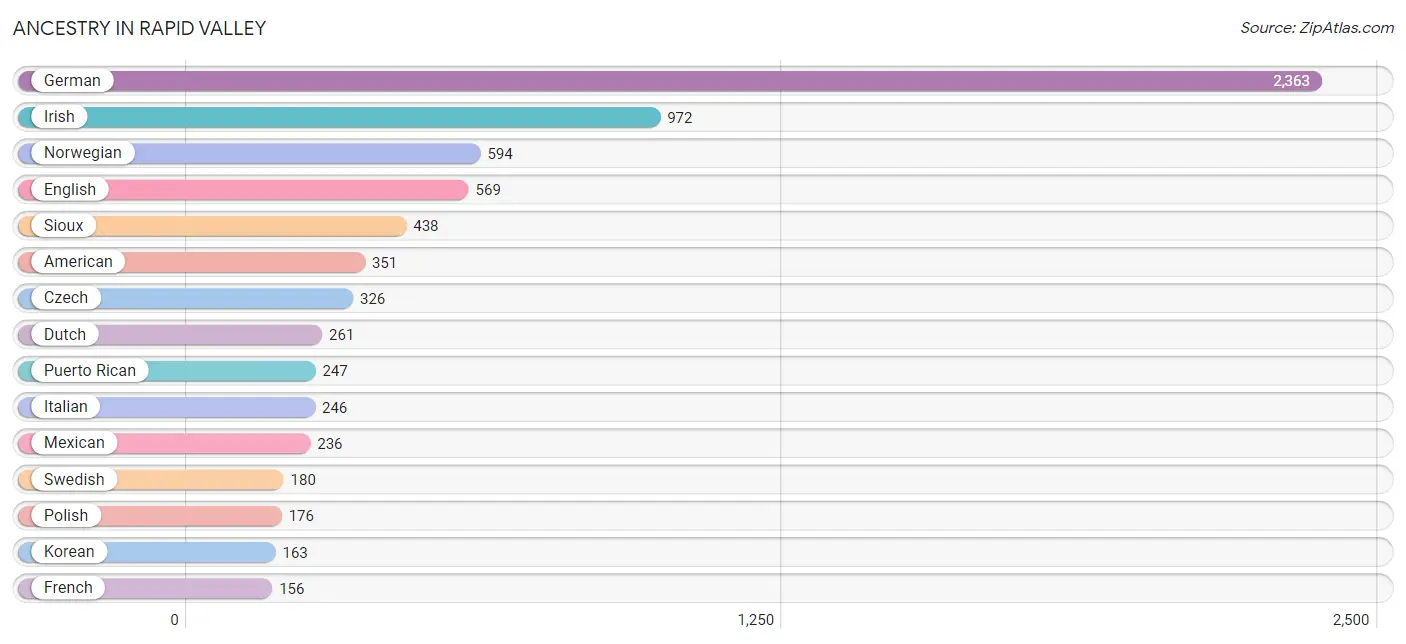
| Ancestry | # Population | % Population |
| American | 351 | 4.8% |
| Belgian | 31 | 0.4% |
| Bhutanese | 17 | 0.2% |
| British | 34 | 0.5% |
| Burmese | 24 | 0.3% |
| Cherokee | 5 | 0.1% |
| Czech | 326 | 4.4% |
| Czechoslovakian | 74 | 1.0% |
| Danish | 101 | 1.4% |
| Dutch | 261 | 3.6% |
| Eastern European | 61 | 0.8% |
| English | 569 | 7.8% |
| Ethiopian | 63 | 0.9% |
| European | 100 | 1.4% |
| Finnish | 135 | 1.8% |
| French | 156 | 2.1% |
| French Canadian | 37 | 0.5% |
| German | 2,363 | 32.3% |
| Greek | 22 | 0.3% |
| Hungarian | 11 | 0.2% |
| Indian (Asian) | 10 | 0.1% |
| Irish | 972 | 13.3% |
| Italian | 246 | 3.4% |
| Korean | 163 | 2.2% |
| Luxembourger | 11 | 0.2% |
| Mexican | 236 | 3.2% |
| Native Hawaiian | 31 | 0.4% |
| Northern European | 15 | 0.2% |
| Norwegian | 594 | 8.1% |
| Pakistani | 28 | 0.4% |
| Polish | 176 | 2.4% |
| Puerto Rican | 247 | 3.4% |
| Russian | 79 | 1.1% |
| Scandinavian | 38 | 0.5% |
| Scotch-Irish | 51 | 0.7% |
| Scottish | 53 | 0.7% |
| Sioux | 438 | 6.0% |
| Subsaharan African | 63 | 0.9% |
| Swedish | 180 | 2.5% |
| Swiss | 12 | 0.2% |
| Ukrainian | 25 | 0.3% |
| Welsh | 96 | 1.3% | View All 42 Rows |
Immigrants in Rapid Valley
The most numerous immigrant groups reported in Rapid Valley came from Asia (85 | 1.2%), Europe (77 | 1.1%), South Eastern Asia (68 | 0.9%), Germany (66 | 0.9%), and Western Europe (66 | 0.9%), together accounting for 4.9% of all Rapid Valley residents.
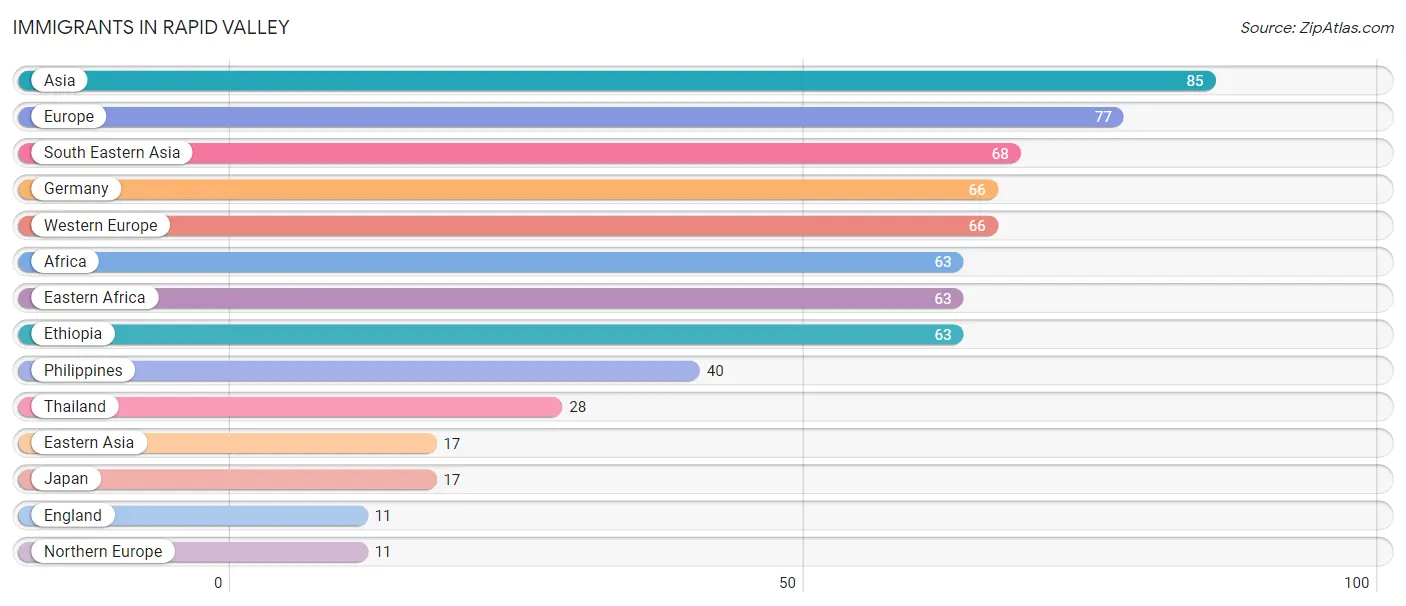
| Immigration Origin | # Population | % Population |
| Africa | 63 | 0.9% |
| Asia | 85 | 1.2% |
| Eastern Africa | 63 | 0.9% |
| Eastern Asia | 17 | 0.2% |
| England | 11 | 0.2% |
| Ethiopia | 63 | 0.9% |
| Europe | 77 | 1.1% |
| Germany | 66 | 0.9% |
| Japan | 17 | 0.2% |
| Northern Europe | 11 | 0.2% |
| Philippines | 40 | 0.5% |
| South Eastern Asia | 68 | 0.9% |
| Thailand | 28 | 0.4% |
| Western Europe | 66 | 0.9% | View All 14 Rows |
Sex and Age in Rapid Valley
Sex and Age in Rapid Valley
The most populous age groups in Rapid Valley are 50 to 54 Years (382 | 9.4%) for men and 60 to 64 Years (383 | 11.8%) for women.
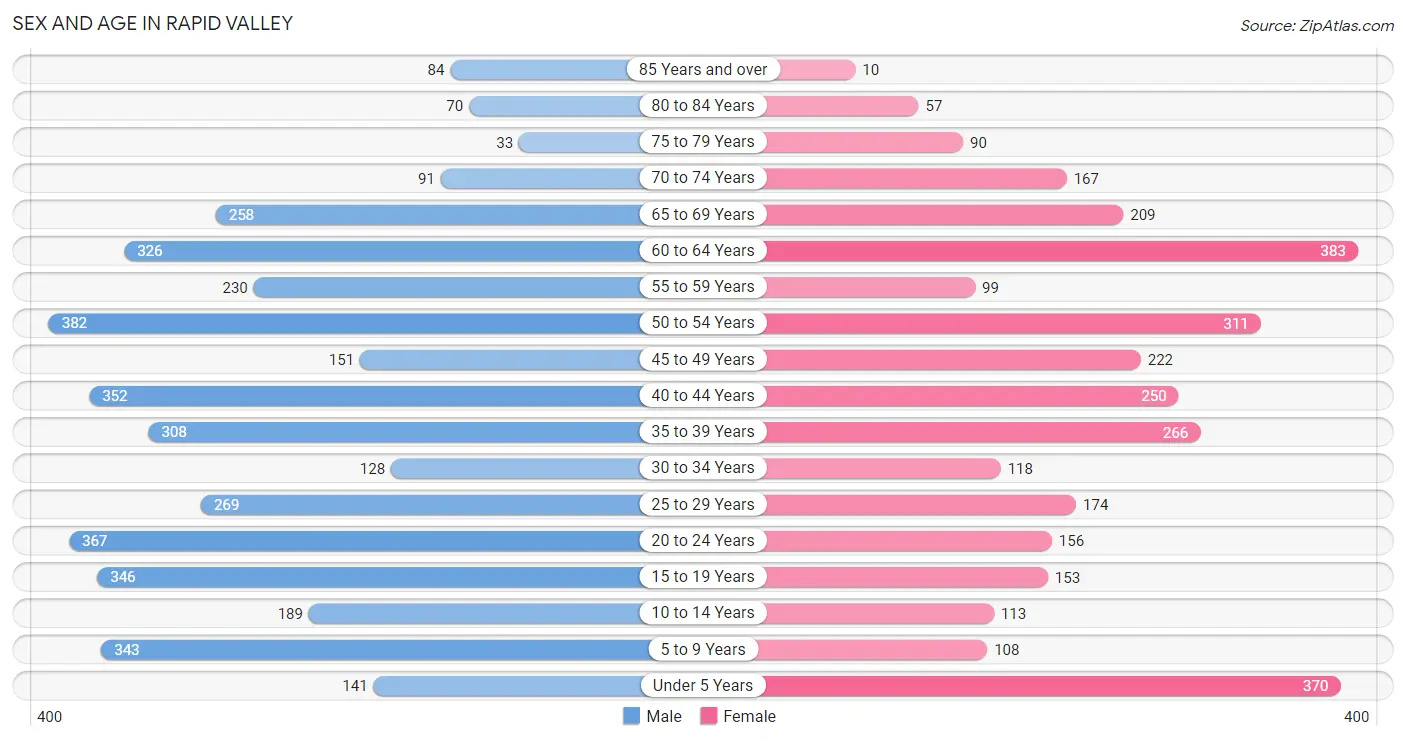
| Age Bracket | Male | Female |
| Under 5 Years | 141 (3.5%) | 370 (11.4%) |
| 5 to 9 Years | 343 (8.4%) | 108 (3.3%) |
| 10 to 14 Years | 189 (4.6%) | 113 (3.5%) |
| 15 to 19 Years | 346 (8.5%) | 153 (4.7%) |
| 20 to 24 Years | 367 (9.0%) | 156 (4.8%) |
| 25 to 29 Years | 269 (6.6%) | 174 (5.3%) |
| 30 to 34 Years | 128 (3.2%) | 118 (3.6%) |
| 35 to 39 Years | 308 (7.6%) | 266 (8.2%) |
| 40 to 44 Years | 352 (8.6%) | 250 (7.7%) |
| 45 to 49 Years | 151 (3.7%) | 222 (6.8%) |
| 50 to 54 Years | 382 (9.4%) | 311 (9.6%) |
| 55 to 59 Years | 230 (5.7%) | 99 (3.0%) |
| 60 to 64 Years | 326 (8.0%) | 383 (11.8%) |
| 65 to 69 Years | 258 (6.3%) | 209 (6.4%) |
| 70 to 74 Years | 91 (2.2%) | 167 (5.1%) |
| 75 to 79 Years | 33 (0.8%) | 90 (2.8%) |
| 80 to 84 Years | 70 (1.7%) | 57 (1.8%) |
| 85 Years and over | 84 (2.1%) | 10 (0.3%) |
| Total | 4,068 (100.0%) | 3,256 (100.0%) |
Families and Households in Rapid Valley
Median Family Size in Rapid Valley
The median family size in Rapid Valley is 2.78 persons per family, with single female/mother families (258 | 13.0%) accounting for the largest median family size of 3.76 persons per family. On the other hand, single male/father families (203 | 10.3%) represent the smallest median family size with 2.22 persons per family.
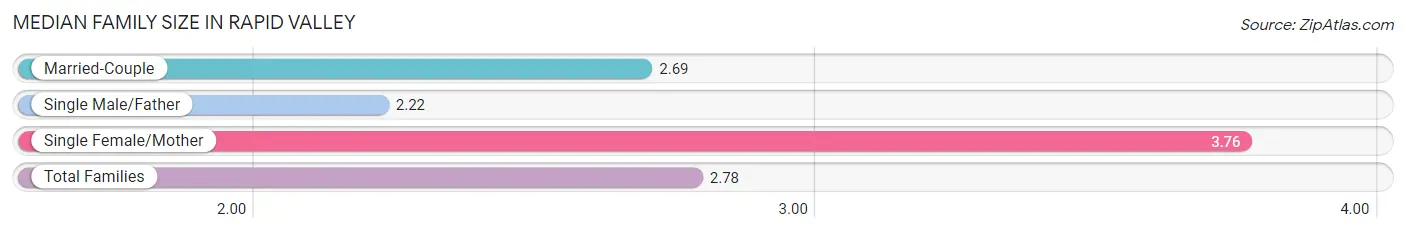
| Family Type | # Families | Family Size |
| Married-Couple | 1,518 (76.7%) | 2.69 |
| Single Male/Father | 203 (10.3%) | 2.22 |
| Single Female/Mother | 258 (13.0%) | 3.76 |
| Total Families | 1,979 (100.0%) | 2.78 |
Median Household Size in Rapid Valley
The median household size in Rapid Valley is 2.37 persons per household, with single female/mother households (258 | 8.4%) accounting for the largest median household size of 4.29 persons per household. non-family households (1,107 | 35.9%) represent the smallest median household size with 1.47 persons per household.
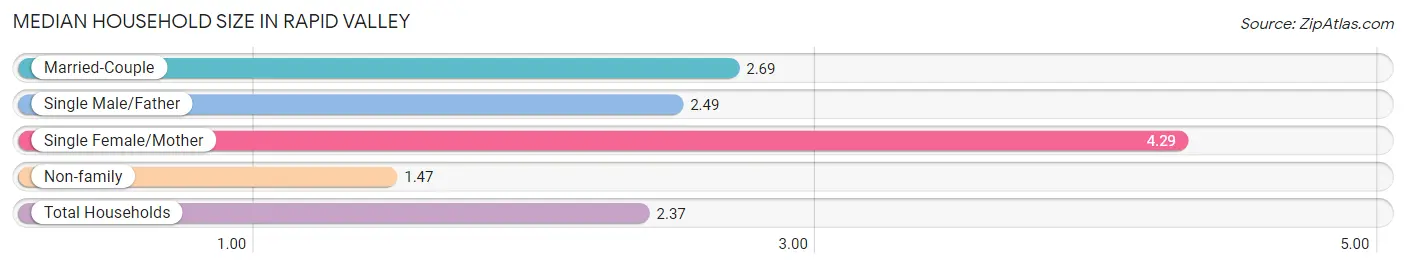
| Household Type | # Households | Household Size |
| Married-Couple | 1,518 (49.2%) | 2.69 |
| Single Male/Father | 203 (6.6%) | 2.49 |
| Single Female/Mother | 258 (8.4%) | 4.29 |
| Non-family | 1,107 (35.9%) | 1.47 |
| Total Households | 3,086 (100.0%) | 2.37 |
Household Size by Marriage Status in Rapid Valley
Out of a total of 3,086 households in Rapid Valley, 1,979 (64.1%) are family households, while 1,107 (35.9%) are nonfamily households. The most numerous type of family households are 2-person households, comprising 1,066, and the most common type of nonfamily households are 1-person households, comprising 787.
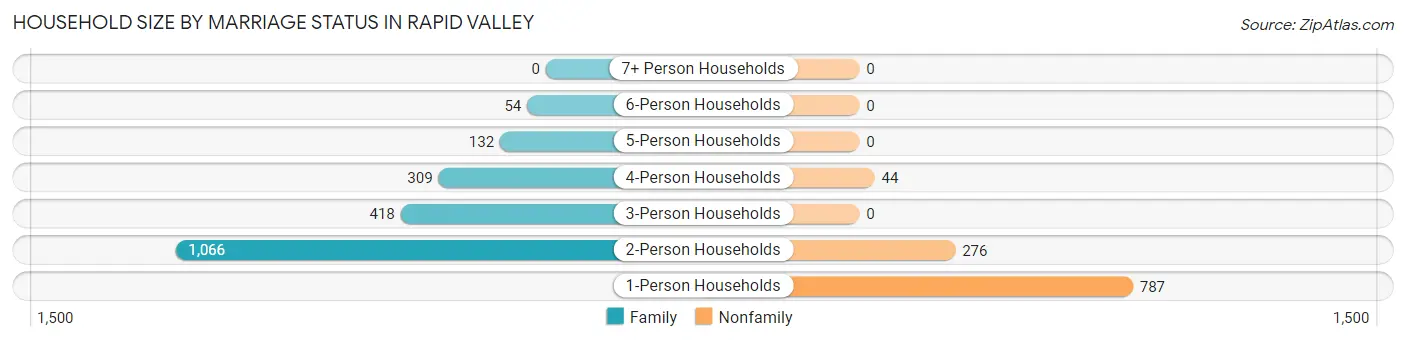
| Household Size | Family Households | Nonfamily Households |
| 1-Person Households | - | 787 (25.5%) |
| 2-Person Households | 1,066 (34.5%) | 276 (8.9%) |
| 3-Person Households | 418 (13.6%) | 0 (0.0%) |
| 4-Person Households | 309 (10.0%) | 44 (1.4%) |
| 5-Person Households | 132 (4.3%) | 0 (0.0%) |
| 6-Person Households | 54 (1.8%) | 0 (0.0%) |
| 7+ Person Households | 0 (0.0%) | 0 (0.0%) |
| Total | 1,979 (64.1%) | 1,107 (35.9%) |
Female Fertility in Rapid Valley
Fertility by Age in Rapid Valley
Average fertility rate in Rapid Valley is 57.0 births per 1,000 women. Women in the age bracket of 20 to 34 years have the highest fertility rate with 165.0 births per 1,000 women. Women in the age bracket of 20 to 34 years acount for 93.7% of all women with births.
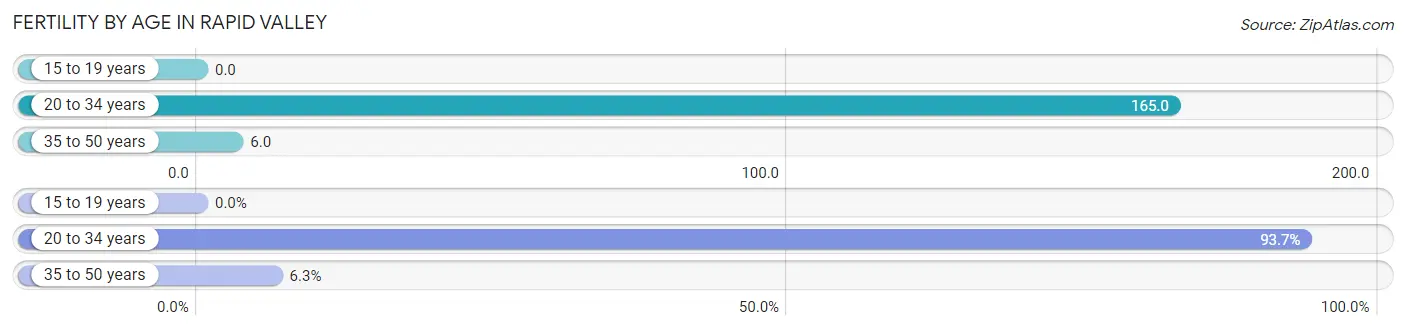
| Age Bracket | Women with Births | Births / 1,000 Women |
| 15 to 19 years | 0 (0.0%) | 0.0 |
| 20 to 34 years | 74 (93.7%) | 165.0 |
| 35 to 50 years | 5 (6.3%) | 6.0 |
| Total | 79 (100.0%) | 57.0 |
Fertility by Age by Marriage Status in Rapid Valley
38.0% of women with births (79) in Rapid Valley are married. The highest percentage of unmarried women with births falls into 20 to 34 years age bracket with 66.2% of them unmarried at the time of birth, while the lowest percentage of unmarried women with births belong to 35 to 50 years age bracket with 0.0% of them unmarried.
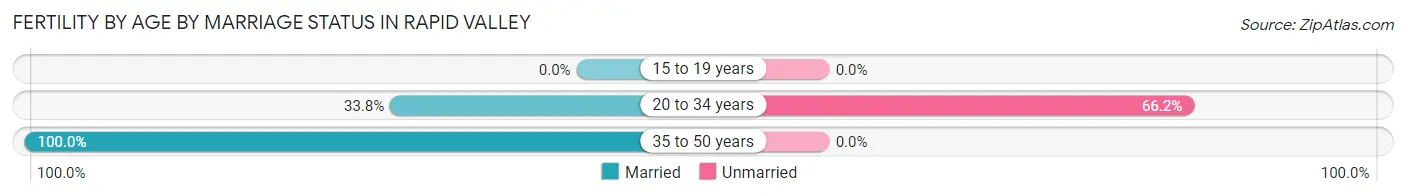
| Age Bracket | Married | Unmarried |
| 15 to 19 years | 0 (0.0%) | 0 (0.0%) |
| 20 to 34 years | 25 (33.8%) | 49 (66.2%) |
| 35 to 50 years | 5 (100.0%) | 0 (0.0%) |
| Total | 30 (38.0%) | 49 (62.0%) |
Fertility by Education in Rapid Valley
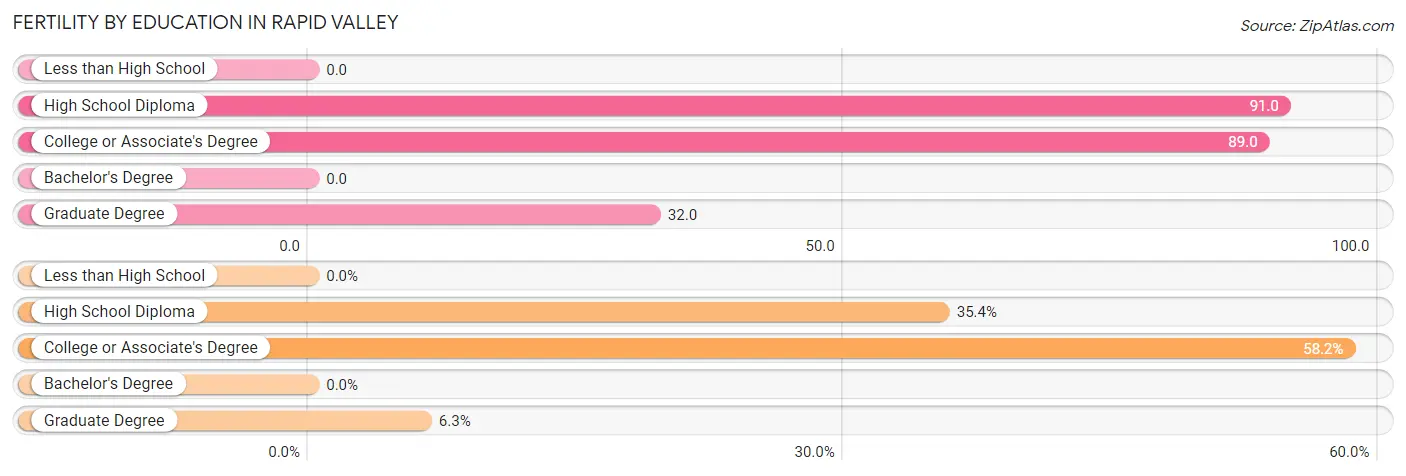
| Educational Attainment | Women with Births | Births / 1,000 Women |
| Less than High School | 0 (0.0%) | 0.0 |
| High School Diploma | 28 (35.4%) | 91.0 |
| College or Associate's Degree | 46 (58.2%) | 89.0 |
| Bachelor's Degree | 0 (0.0%) | 0.0 |
| Graduate Degree | 5 (6.3%) | 32.0 |
| Total | 79 (100.0%) | 57.0 |
Fertility by Education by Marriage Status in Rapid Valley
62.0% of women with births in Rapid Valley are unmarried. Women with the educational attainment of graduate degree are most likely to be married with 100.0% of them married at childbirth, while women with the educational attainment of high school diploma are least likely to be married with 100.0% of them unmarried at childbirth.
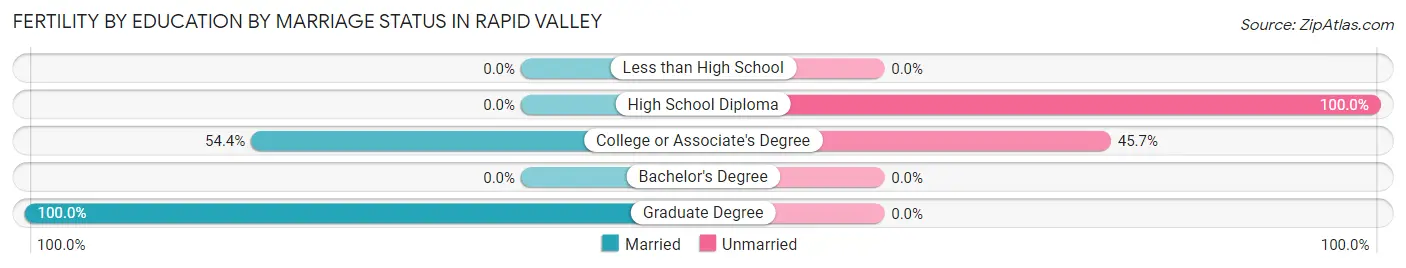
| Educational Attainment | Married | Unmarried |
| Less than High School | 0 (0.0%) | 0 (0.0%) |
| High School Diploma | 0 (0.0%) | 28 (100.0%) |
| College or Associate's Degree | 25 (54.3%) | 21 (45.7%) |
| Bachelor's Degree | 0 (0.0%) | 0 (0.0%) |
| Graduate Degree | 5 (100.0%) | 0 (0.0%) |
| Total | 30 (38.0%) | 49 (62.0%) |
Employment Characteristics in Rapid Valley
Employment by Class of Employer in Rapid Valley
Among the 4,172 employed individuals in Rapid Valley, private company employees (2,617 | 62.7%), not-for-profit organizations (531 | 12.7%), and local government employees (417 | 10.0%) make up the most common classes of employment.
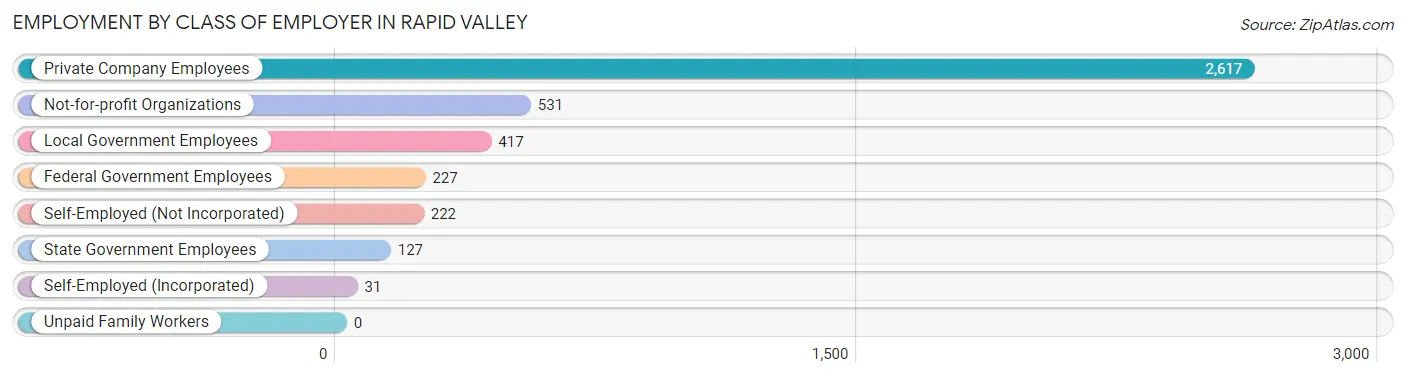
| Employer Class | # Employees | % Employees |
| Private Company Employees | 2,617 | 62.7% |
| Self-Employed (Incorporated) | 31 | 0.7% |
| Self-Employed (Not Incorporated) | 222 | 5.3% |
| Not-for-profit Organizations | 531 | 12.7% |
| Local Government Employees | 417 | 10.0% |
| State Government Employees | 127 | 3.0% |
| Federal Government Employees | 227 | 5.4% |
| Unpaid Family Workers | 0 | 0.0% |
| Total | 4,172 | 100.0% |
Employment Status by Age in Rapid Valley
According to the labor force statistics for Rapid Valley, out of the total population over 16 years of age (5,977), 72.4% or 4,327 individuals are in the labor force, with 3.1% or 134 of them unemployed. The age group with the highest labor force participation rate is 45 to 54 years, with 91.5% or 975 individuals in the labor force. Within the labor force, the 16 to 19 years age range has the highest percentage of unemployed individuals, with 23.3% or 65 of them being unemployed.
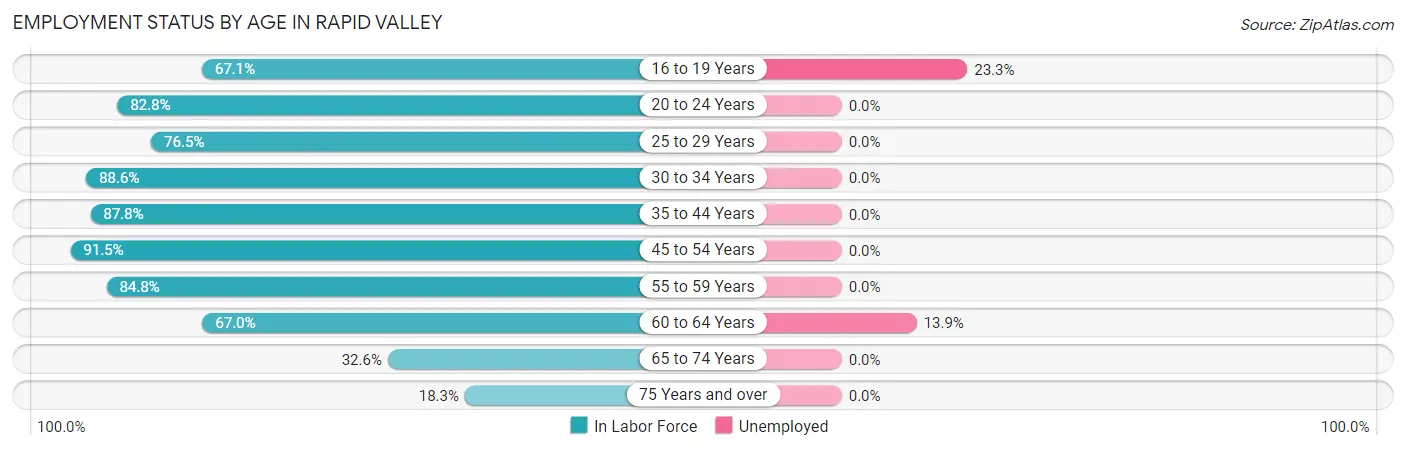
| Age Bracket | In Labor Force | Unemployed |
| 16 to 19 Years | 279 (67.1%) | 65 (23.3%) |
| 20 to 24 Years | 433 (82.8%) | 0 (0.0%) |
| 25 to 29 Years | 339 (76.5%) | 0 (0.0%) |
| 30 to 34 Years | 218 (88.6%) | 0 (0.0%) |
| 35 to 44 Years | 1,033 (87.8%) | 0 (0.0%) |
| 45 to 54 Years | 975 (91.5%) | 0 (0.0%) |
| 55 to 59 Years | 279 (84.8%) | 0 (0.0%) |
| 60 to 64 Years | 475 (67.0%) | 66 (13.9%) |
| 65 to 74 Years | 236 (32.6%) | 0 (0.0%) |
| 75 Years and over | 63 (18.3%) | 0 (0.0%) |
| Total | 4,327 (72.4%) | 134 (3.1%) |
Employment Status by Educational Attainment in Rapid Valley
According to labor force statistics for Rapid Valley, 83.6% of individuals (3,318) out of the total population between 25 and 64 years of age (3,969) are in the labor force, with 2.0% or 66 of them being unemployed. The group with the highest labor force participation rate are those with the educational attainment of bachelor's degree or higher, with 93.8% or 780 individuals in the labor force. Within the labor force, individuals with college / associate degree education have the highest percentage of unemployment, with 4.9% or 70 of them being unemployed.
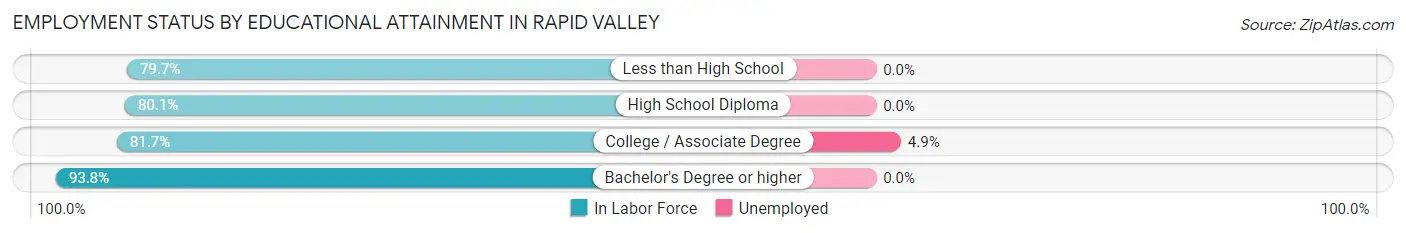
| Educational Attainment | In Labor Force | Unemployed |
| Less than High School | 251 (79.7%) | 0 (0.0%) |
| High School Diploma | 864 (80.1%) | 0 (0.0%) |
| College / Associate Degree | 1,424 (81.7%) | 85 (4.9%) |
| Bachelor's Degree or higher | 780 (93.8%) | 0 (0.0%) |
| Total | 3,318 (83.6%) | 79 (2.0%) |
Employment Occupations by Sex in Rapid Valley
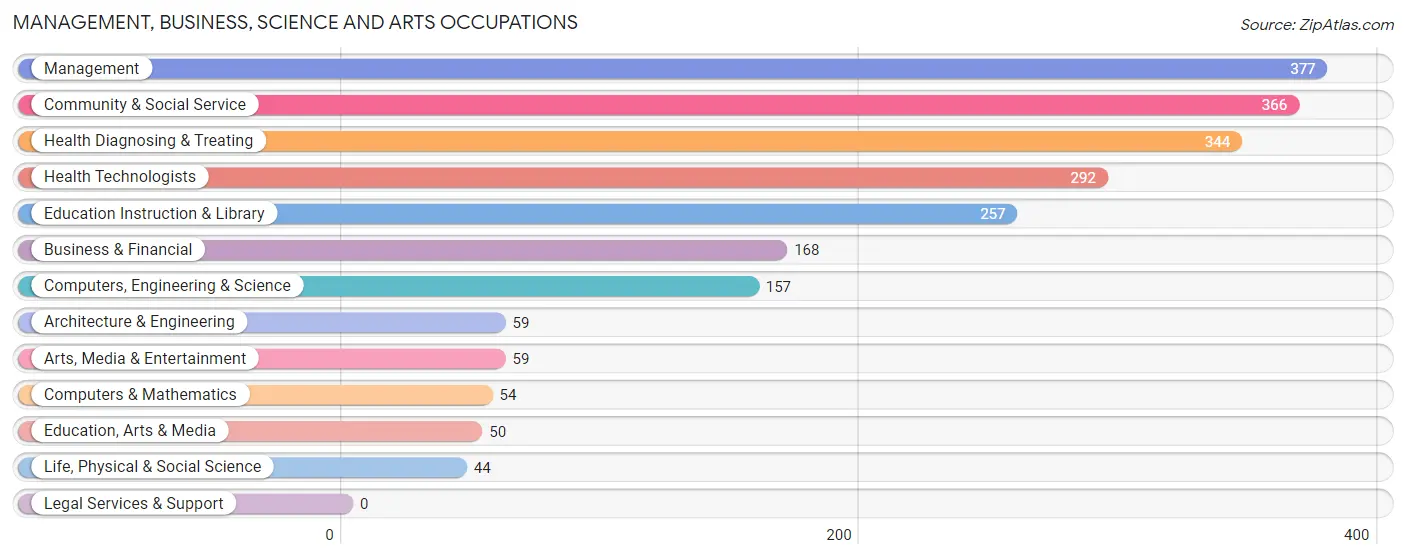
Management, Business, Science and Arts Occupations
The most common Management, Business, Science and Arts occupations in Rapid Valley are Management (377 | 9.2%), Community & Social Service (366 | 8.9%), Health Diagnosing & Treating (344 | 8.4%), Health Technologists (292 | 7.1%), and Education Instruction & Library (257 | 6.2%).
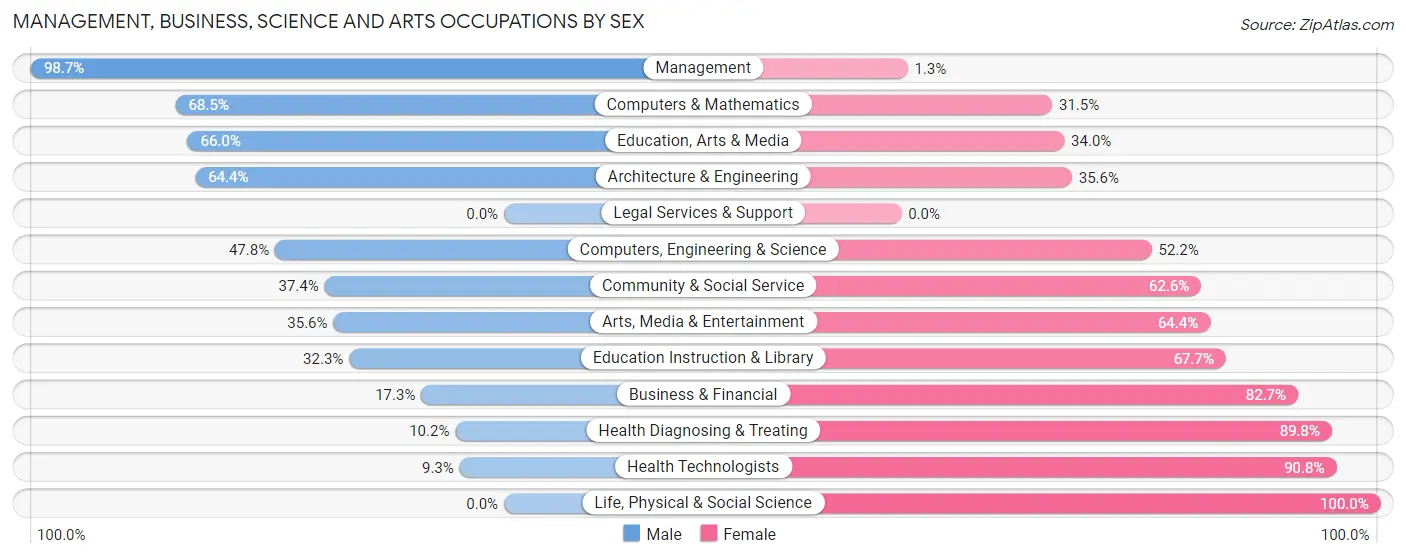
Management, Business, Science and Arts Occupations by Sex
Within the Management, Business, Science and Arts occupations in Rapid Valley, the most male-oriented occupations are Management (98.7%), Computers & Mathematics (68.5%), and Education, Arts & Media (66.0%), while the most female-oriented occupations are Life, Physical & Social Science (100.0%), Health Technologists (90.7%), and Health Diagnosing & Treating (89.8%).
| Occupation | Male | Female |
| Management | 372 (98.7%) | 5 (1.3%) |
| Business & Financial | 29 (17.3%) | 139 (82.7%) |
| Computers, Engineering & Science | 75 (47.8%) | 82 (52.2%) |
| Computers & Mathematics | 37 (68.5%) | 17 (31.5%) |
| Architecture & Engineering | 38 (64.4%) | 21 (35.6%) |
| Life, Physical & Social Science | 0 (0.0%) | 44 (100.0%) |
| Community & Social Service | 137 (37.4%) | 229 (62.6%) |
| Education, Arts & Media | 33 (66.0%) | 17 (34.0%) |
| Legal Services & Support | 0 (0.0%) | 0 (0.0%) |
| Education Instruction & Library | 83 (32.3%) | 174 (67.7%) |
| Arts, Media & Entertainment | 21 (35.6%) | 38 (64.4%) |
| Health Diagnosing & Treating | 35 (10.2%) | 309 (89.8%) |
| Health Technologists | 27 (9.2%) | 265 (90.7%) |
| Total (Category) | 648 (45.9%) | 764 (54.1%) |
| Total (Overall) | 2,347 (57.1%) | 1,767 (42.9%) |
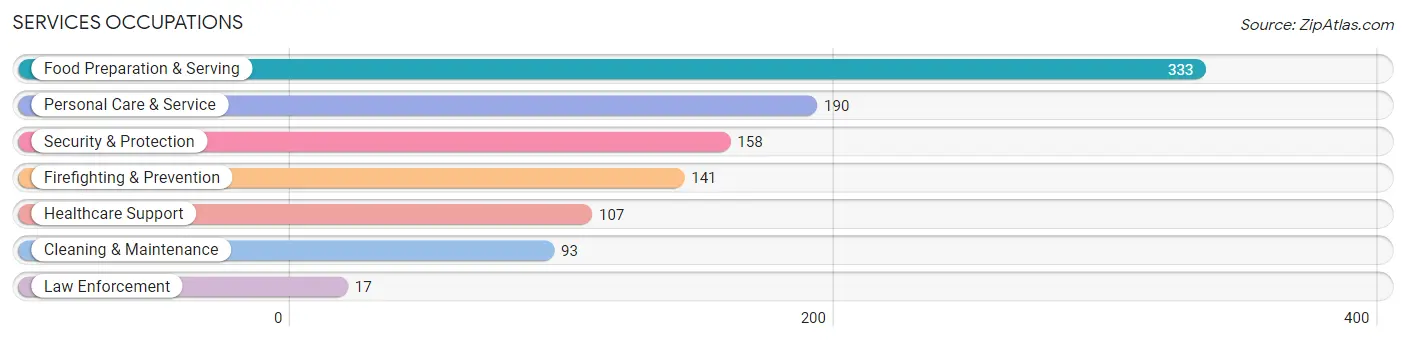
Services Occupations
The most common Services occupations in Rapid Valley are Food Preparation & Serving (333 | 8.1%), Personal Care & Service (190 | 4.6%), Security & Protection (158 | 3.8%), Firefighting & Prevention (141 | 3.4%), and Healthcare Support (107 | 2.6%).
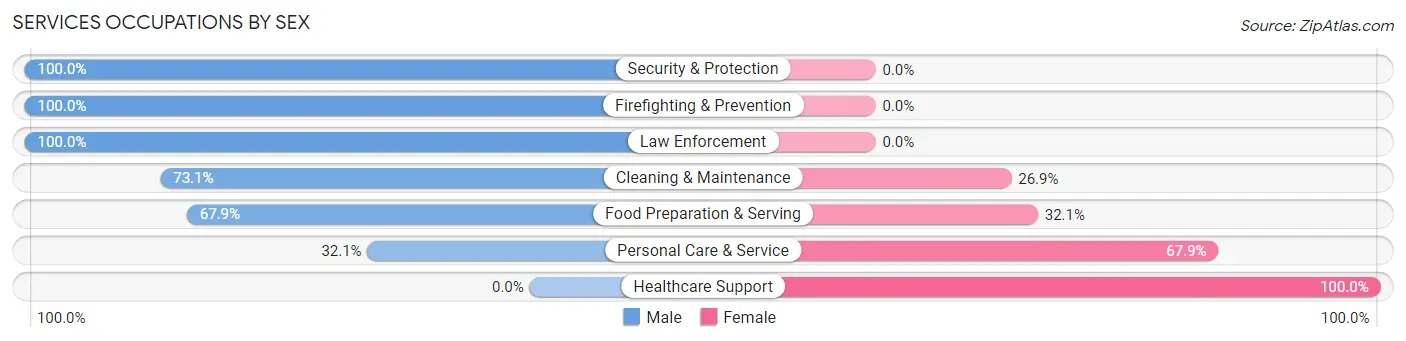
Services Occupations by Sex
Within the Services occupations in Rapid Valley, the most male-oriented occupations are Security & Protection (100.0%), Firefighting & Prevention (100.0%), and Law Enforcement (100.0%), while the most female-oriented occupations are Healthcare Support (100.0%), Personal Care & Service (67.9%), and Food Preparation & Serving (32.1%).
| Occupation | Male | Female |
| Healthcare Support | 0 (0.0%) | 107 (100.0%) |
| Security & Protection | 158 (100.0%) | 0 (0.0%) |
| Firefighting & Prevention | 141 (100.0%) | 0 (0.0%) |
| Law Enforcement | 17 (100.0%) | 0 (0.0%) |
| Food Preparation & Serving | 226 (67.9%) | 107 (32.1%) |
| Cleaning & Maintenance | 68 (73.1%) | 25 (26.9%) |
| Personal Care & Service | 61 (32.1%) | 129 (67.9%) |
| Total (Category) | 513 (58.2%) | 368 (41.8%) |
| Total (Overall) | 2,347 (57.1%) | 1,767 (42.9%) |
Sales and Office Occupations
The most common Sales and Office occupations in Rapid Valley are Office & Administration (442 | 10.7%), and Sales & Related (344 | 8.4%).
Sales and Office Occupations by Sex
| Occupation | Male | Female |
| Sales & Related | 126 (36.6%) | 218 (63.4%) |
| Office & Administration | 124 (28.1%) | 318 (72.0%) |
| Total (Category) | 250 (31.8%) | 536 (68.2%) |
| Total (Overall) | 2,347 (57.1%) | 1,767 (42.9%) |
Natural Resources, Construction and Maintenance Occupations
The most common Natural Resources, Construction and Maintenance occupations in Rapid Valley are Construction & Extraction (358 | 8.7%), and Installation, Maintenance & Repair (145 | 3.5%).
Natural Resources, Construction and Maintenance Occupations by Sex
| Occupation | Male | Female |
| Farming, Fishing & Forestry | 0 (0.0%) | 0 (0.0%) |
| Construction & Extraction | 324 (90.5%) | 34 (9.5%) |
| Installation, Maintenance & Repair | 145 (100.0%) | 0 (0.0%) |
| Total (Category) | 469 (93.2%) | 34 (6.8%) |
| Total (Overall) | 2,347 (57.1%) | 1,767 (42.9%) |
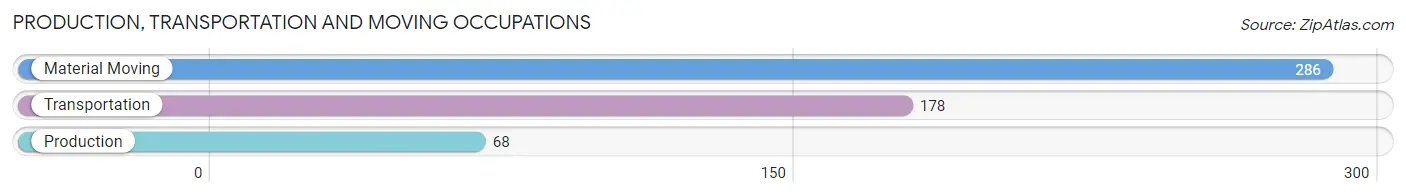
Production, Transportation and Moving Occupations
The most common Production, Transportation and Moving occupations in Rapid Valley are Material Moving (286 | 7.0%), Transportation (178 | 4.3%), and Production (68 | 1.7%).
Production, Transportation and Moving Occupations by Sex
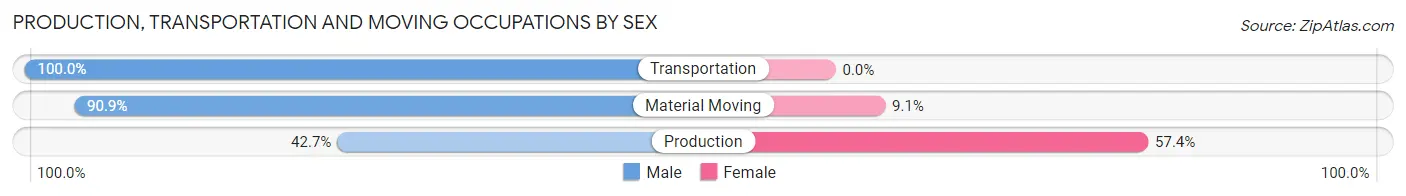
| Occupation | Male | Female |
| Production | 29 (42.6%) | 39 (57.4%) |
| Transportation | 178 (100.0%) | 0 (0.0%) |
| Material Moving | 260 (90.9%) | 26 (9.1%) |
| Total (Category) | 467 (87.8%) | 65 (12.2%) |
| Total (Overall) | 2,347 (57.1%) | 1,767 (42.9%) |
Employment Industries by Sex in Rapid Valley
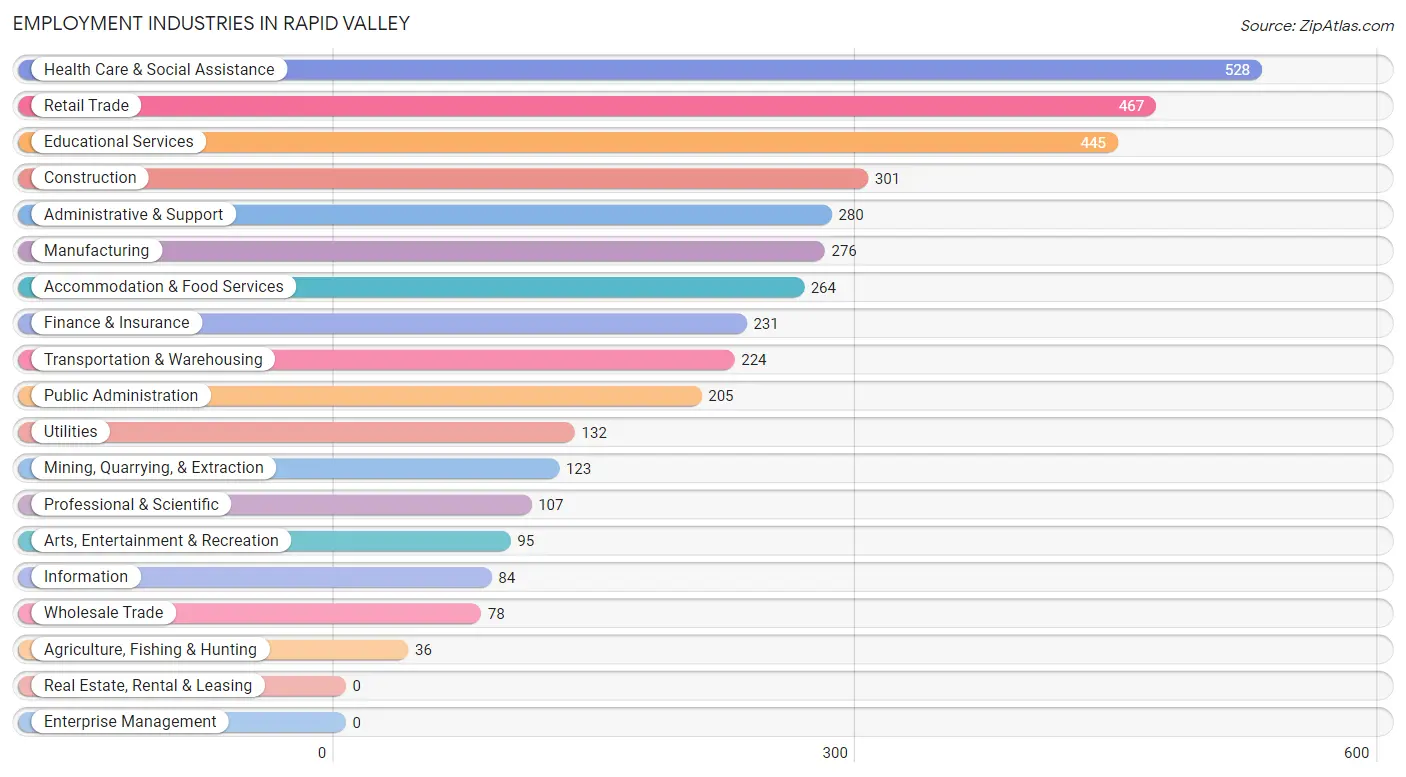
Employment Industries in Rapid Valley
The major employment industries in Rapid Valley include Health Care & Social Assistance (528 | 12.8%), Retail Trade (467 | 11.4%), Educational Services (445 | 10.8%), Construction (301 | 7.3%), and Administrative & Support (280 | 6.8%).
Employment Industries by Sex in Rapid Valley
The Rapid Valley industries that see more men than women are Agriculture, Fishing & Hunting (100.0%), Mining, Quarrying, & Extraction (100.0%), and Manufacturing (89.9%), whereas the industries that tend to have a higher number of women are Health Care & Social Assistance (91.1%), Information (75.0%), and Educational Services (61.8%).
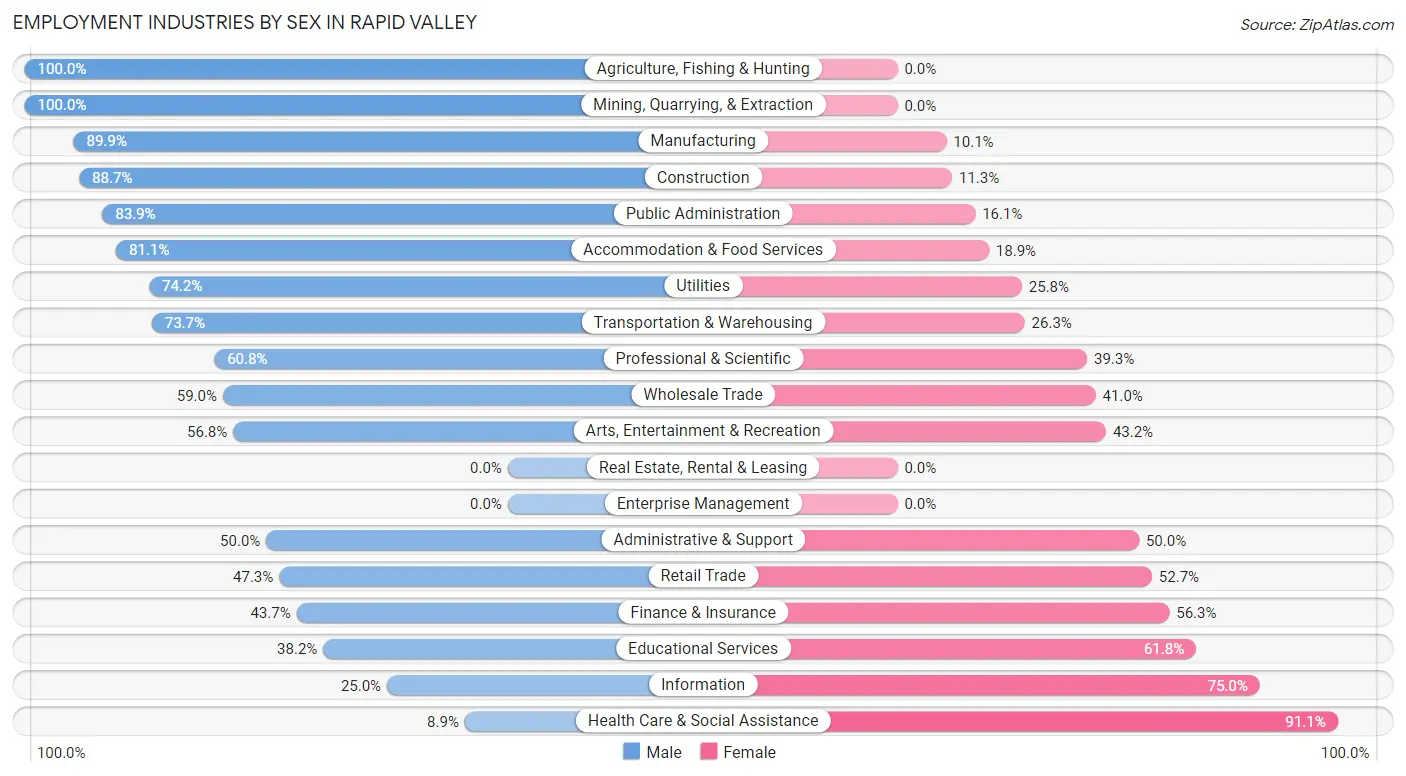
| Industry | Male | Female |
| Agriculture, Fishing & Hunting | 36 (100.0%) | 0 (0.0%) |
| Mining, Quarrying, & Extraction | 123 (100.0%) | 0 (0.0%) |
| Construction | 267 (88.7%) | 34 (11.3%) |
| Manufacturing | 248 (89.9%) | 28 (10.1%) |
| Wholesale Trade | 46 (59.0%) | 32 (41.0%) |
| Retail Trade | 221 (47.3%) | 246 (52.7%) |
| Transportation & Warehousing | 165 (73.7%) | 59 (26.3%) |
| Utilities | 98 (74.2%) | 34 (25.8%) |
| Information | 21 (25.0%) | 63 (75.0%) |
| Finance & Insurance | 101 (43.7%) | 130 (56.3%) |
| Real Estate, Rental & Leasing | 0 (0.0%) | 0 (0.0%) |
| Professional & Scientific | 65 (60.8%) | 42 (39.3%) |
| Enterprise Management | 0 (0.0%) | 0 (0.0%) |
| Administrative & Support | 140 (50.0%) | 140 (50.0%) |
| Educational Services | 170 (38.2%) | 275 (61.8%) |
| Health Care & Social Assistance | 47 (8.9%) | 481 (91.1%) |
| Arts, Entertainment & Recreation | 54 (56.8%) | 41 (43.2%) |
| Accommodation & Food Services | 214 (81.1%) | 50 (18.9%) |
| Public Administration | 172 (83.9%) | 33 (16.1%) |
| Total | 2,347 (57.1%) | 1,767 (42.9%) |
Education in Rapid Valley
School Enrollment in Rapid Valley
The most common levels of schooling among the 1,614 students in Rapid Valley are elementary school (424 | 26.3%), high school (344 | 21.3%), and nursery / preschool (260 | 16.1%).
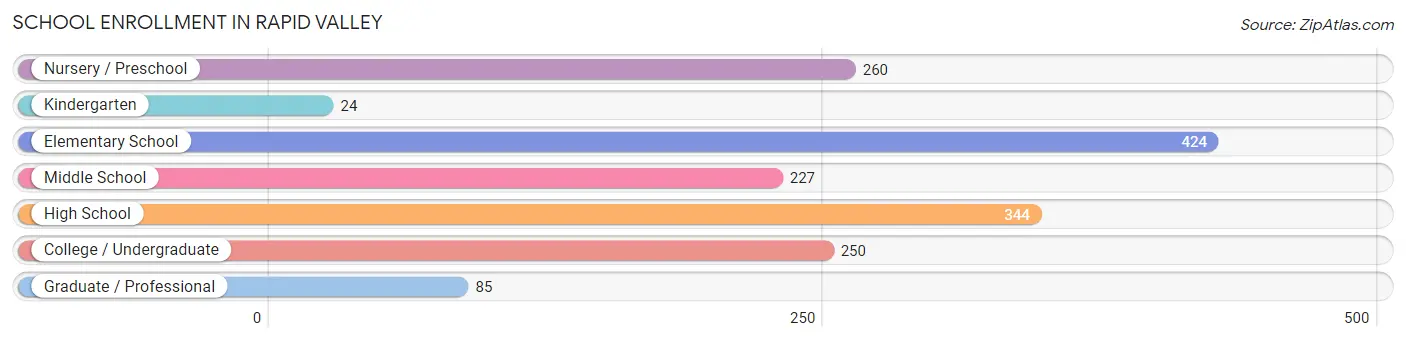
| School Level | # Students | % Students |
| Nursery / Preschool | 260 | 16.1% |
| Kindergarten | 24 | 1.5% |
| Elementary School | 424 | 26.3% |
| Middle School | 227 | 14.1% |
| High School | 344 | 21.3% |
| College / Undergraduate | 250 | 15.5% |
| Graduate / Professional | 85 | 5.3% |
| Total | 1,614 | 100.0% |
School Enrollment by Age by Funding Source in Rapid Valley
Out of a total of 1,614 students who are enrolled in schools in Rapid Valley, 224 (13.9%) attend a private institution, while the remaining 1,390 (86.1%) are enrolled in public schools. The age group of 3 to 4 year olds has the highest likelihood of being enrolled in private schools, with 99 (51.3% in the age bracket) enrolled. Conversely, the age group of 18 to 19 year olds has the lowest likelihood of being enrolled in a private school, with 156 (100.0% in the age bracket) attending a public institution.
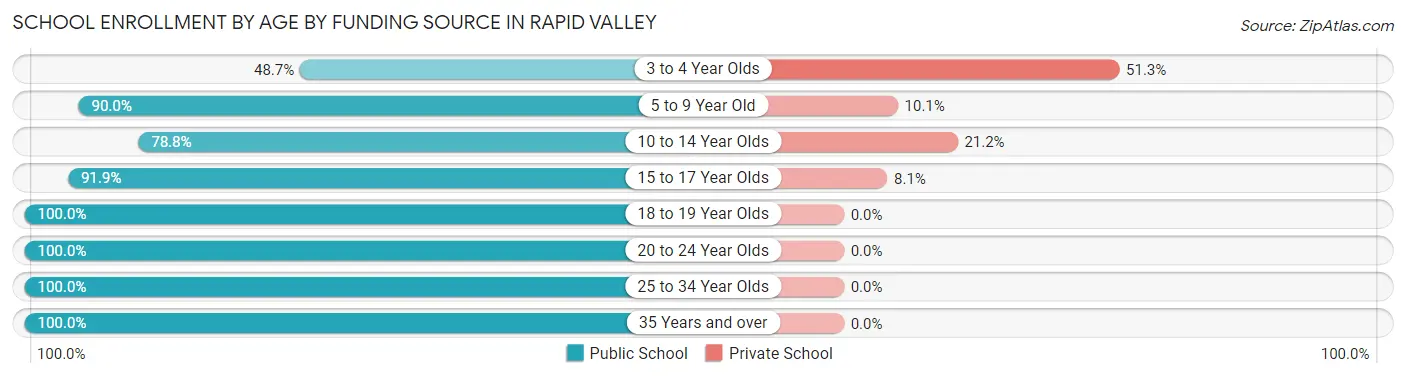
| Age Bracket | Public School | Private School |
| 3 to 4 Year Olds | 94 (48.7%) | 99 (51.3%) |
| 5 to 9 Year Old | 385 (89.9%) | 43 (10.1%) |
| 10 to 14 Year Olds | 238 (78.8%) | 64 (21.2%) |
| 15 to 17 Year Olds | 216 (91.9%) | 19 (8.1%) |
| 18 to 19 Year Olds | 156 (100.0%) | 0 (0.0%) |
| 20 to 24 Year Olds | 118 (100.0%) | 0 (0.0%) |
| 25 to 34 Year Olds | 69 (100.0%) | 0 (0.0%) |
| 35 Years and over | 113 (100.0%) | 0 (0.0%) |
| Total | 1,390 (86.1%) | 224 (13.9%) |
Educational Attainment by Field of Study in Rapid Valley
Business (281 | 25.4%), education (275 | 24.8%), science & technology (162 | 14.6%), social sciences (68 | 6.1%), and arts & humanities (66 | 6.0%) are the most common fields of study among 1,108 individuals in Rapid Valley who have obtained a bachelor's degree or higher.
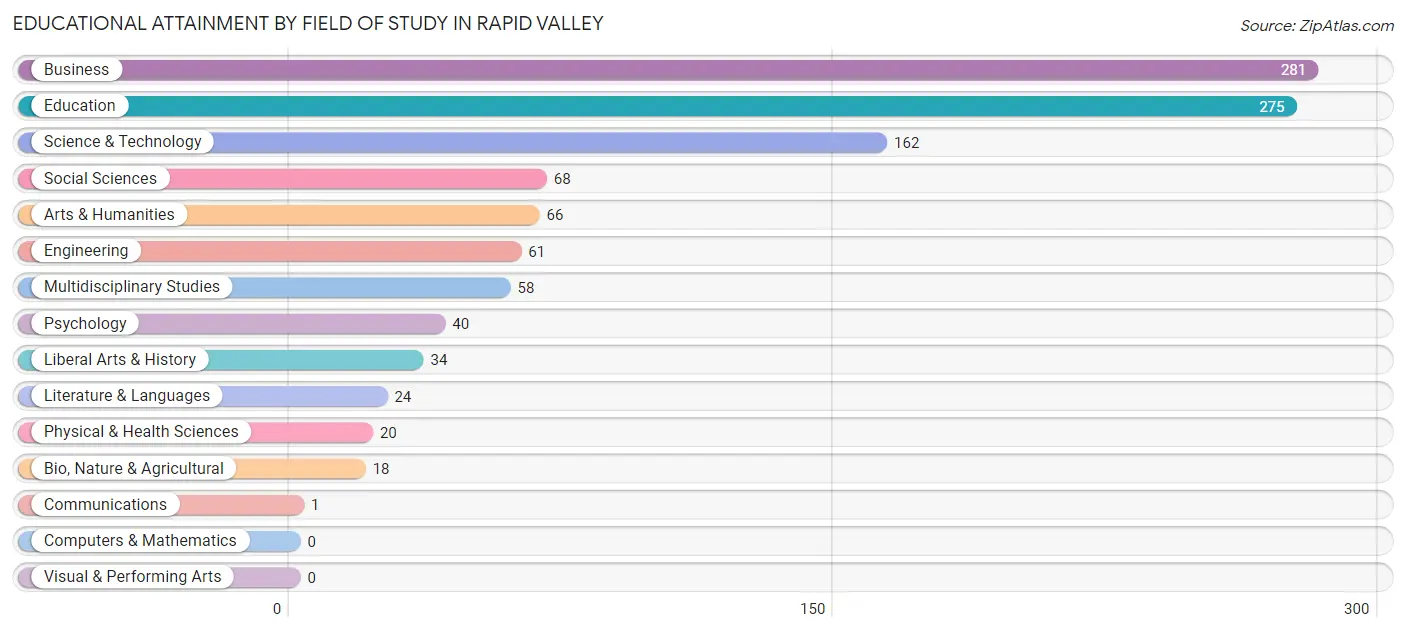
| Field of Study | # Graduates | % Graduates |
| Computers & Mathematics | 0 | 0.0% |
| Bio, Nature & Agricultural | 18 | 1.6% |
| Physical & Health Sciences | 20 | 1.8% |
| Psychology | 40 | 3.6% |
| Social Sciences | 68 | 6.1% |
| Engineering | 61 | 5.5% |
| Multidisciplinary Studies | 58 | 5.2% |
| Science & Technology | 162 | 14.6% |
| Business | 281 | 25.4% |
| Education | 275 | 24.8% |
| Literature & Languages | 24 | 2.2% |
| Liberal Arts & History | 34 | 3.1% |
| Visual & Performing Arts | 0 | 0.0% |
| Communications | 1 | 0.1% |
| Arts & Humanities | 66 | 6.0% |
| Total | 1,108 | 100.0% |
Transportation & Commute in Rapid Valley
Vehicle Availability by Sex in Rapid Valley
The most prevalent vehicle ownership categories in Rapid Valley are males with 2 vehicles (970, accounting for 39.9%) and females with 2 vehicles (704, making up 55.7%).
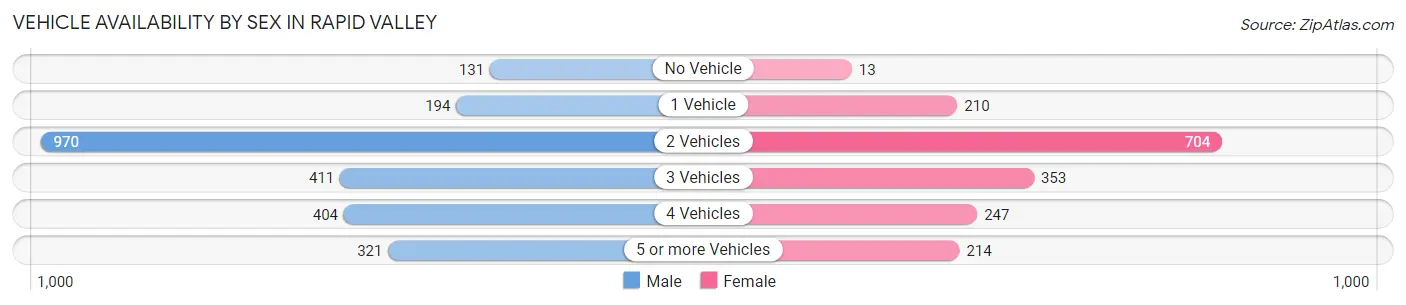
| Vehicles Available | Male | Female |
| No Vehicle | 131 (5.4%) | 13 (0.7%) |
| 1 Vehicle | 194 (8.0%) | 210 (12.1%) |
| 2 Vehicles | 970 (39.9%) | 704 (40.4%) |
| 3 Vehicles | 411 (16.9%) | 353 (20.3%) |
| 4 Vehicles | 404 (16.6%) | 247 (14.2%) |
| 5 or more Vehicles | 321 (13.2%) | 214 (12.3%) |
| Total | 2,431 (100.0%) | 1,741 (100.0%) |
Commute Time in Rapid Valley
The most frequently occuring commute durations in Rapid Valley are 15 to 19 minutes (1,063 commuters, 26.8%), 20 to 24 minutes (1,049 commuters, 26.4%), and 10 to 14 minutes (887 commuters, 22.4%).
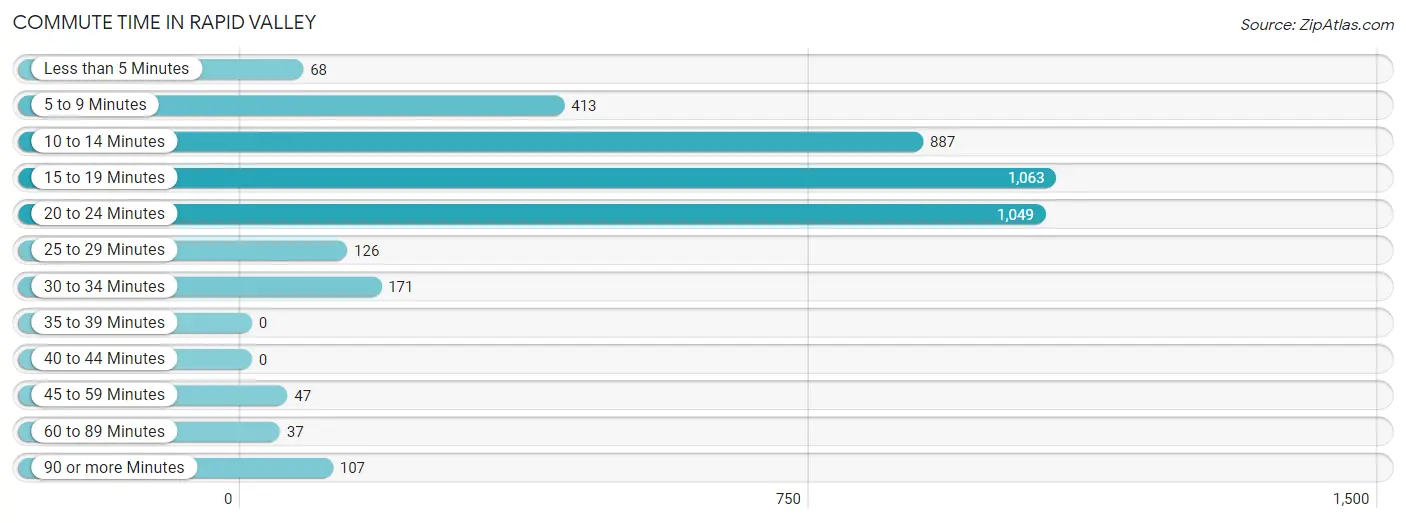
| Commute Time | # Commuters | % Commuters |
| Less than 5 Minutes | 68 | 1.7% |
| 5 to 9 Minutes | 413 | 10.4% |
| 10 to 14 Minutes | 887 | 22.4% |
| 15 to 19 Minutes | 1,063 | 26.8% |
| 20 to 24 Minutes | 1,049 | 26.4% |
| 25 to 29 Minutes | 126 | 3.2% |
| 30 to 34 Minutes | 171 | 4.3% |
| 35 to 39 Minutes | 0 | 0.0% |
| 40 to 44 Minutes | 0 | 0.0% |
| 45 to 59 Minutes | 47 | 1.2% |
| 60 to 89 Minutes | 37 | 0.9% |
| 90 or more Minutes | 107 | 2.7% |
Commute Time by Sex in Rapid Valley
The most common commute times in Rapid Valley are 20 to 24 minutes (682 commuters, 28.8%) for males and 15 to 19 minutes (461 commuters, 28.8%) for females.
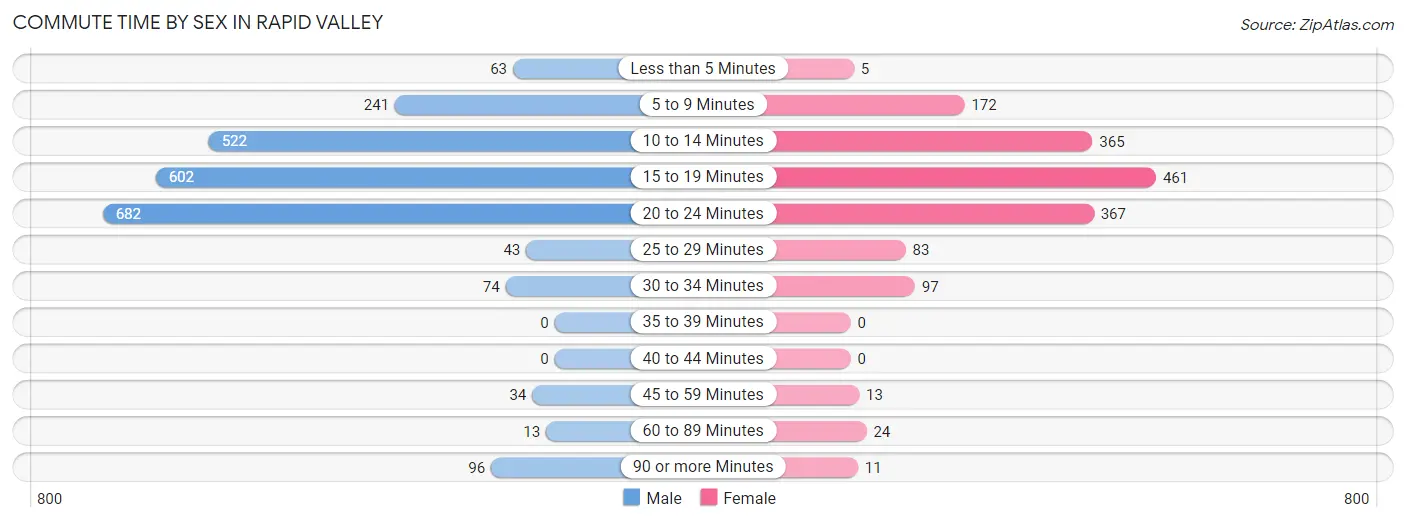
| Commute Time | Male | Female |
| Less than 5 Minutes | 63 (2.7%) | 5 (0.3%) |
| 5 to 9 Minutes | 241 (10.2%) | 172 (10.8%) |
| 10 to 14 Minutes | 522 (22.0%) | 365 (22.8%) |
| 15 to 19 Minutes | 602 (25.4%) | 461 (28.8%) |
| 20 to 24 Minutes | 682 (28.8%) | 367 (23.0%) |
| 25 to 29 Minutes | 43 (1.8%) | 83 (5.2%) |
| 30 to 34 Minutes | 74 (3.1%) | 97 (6.1%) |
| 35 to 39 Minutes | 0 (0.0%) | 0 (0.0%) |
| 40 to 44 Minutes | 0 (0.0%) | 0 (0.0%) |
| 45 to 59 Minutes | 34 (1.4%) | 13 (0.8%) |
| 60 to 89 Minutes | 13 (0.5%) | 24 (1.5%) |
| 90 or more Minutes | 96 (4.1%) | 11 (0.7%) |
Time of Departure to Work by Sex in Rapid Valley
The most frequent times of departure to work in Rapid Valley are 6:30 AM to 6:59 AM (607, 25.6%) for males and 7:00 AM to 7:29 AM (539, 33.7%) for females.
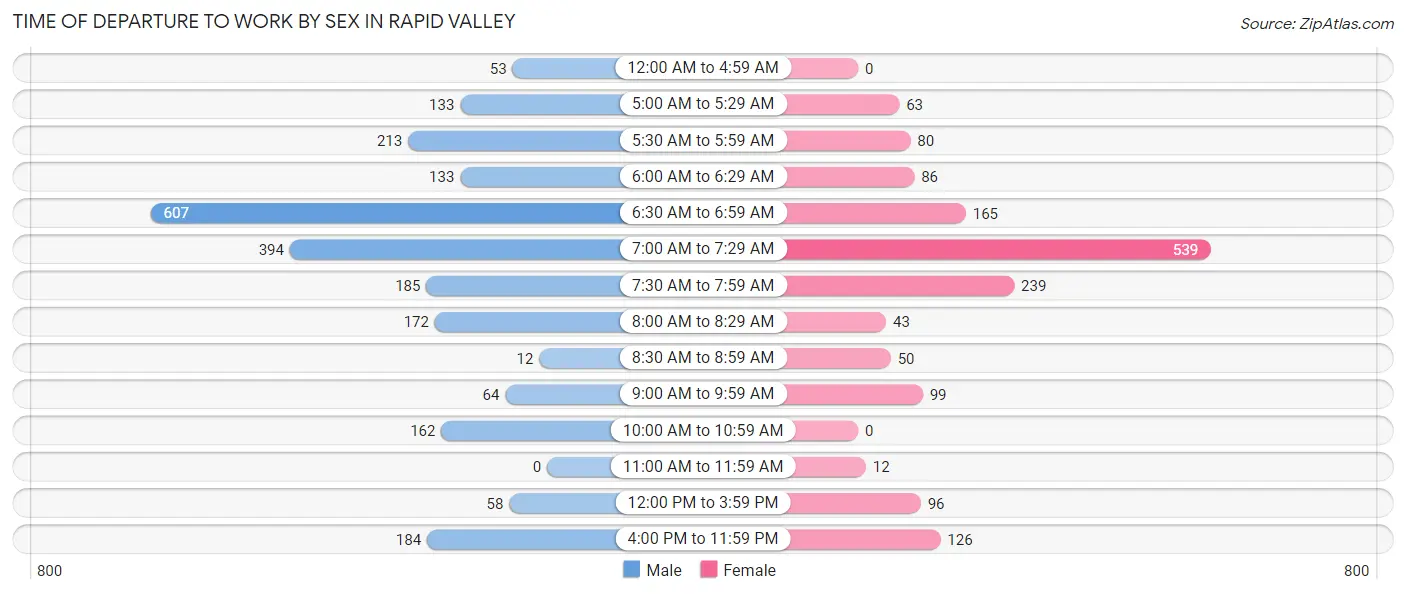
| Time of Departure | Male | Female |
| 12:00 AM to 4:59 AM | 53 (2.2%) | 0 (0.0%) |
| 5:00 AM to 5:29 AM | 133 (5.6%) | 63 (3.9%) |
| 5:30 AM to 5:59 AM | 213 (9.0%) | 80 (5.0%) |
| 6:00 AM to 6:29 AM | 133 (5.6%) | 86 (5.4%) |
| 6:30 AM to 6:59 AM | 607 (25.6%) | 165 (10.3%) |
| 7:00 AM to 7:29 AM | 394 (16.6%) | 539 (33.7%) |
| 7:30 AM to 7:59 AM | 185 (7.8%) | 239 (15.0%) |
| 8:00 AM to 8:29 AM | 172 (7.3%) | 43 (2.7%) |
| 8:30 AM to 8:59 AM | 12 (0.5%) | 50 (3.1%) |
| 9:00 AM to 9:59 AM | 64 (2.7%) | 99 (6.2%) |
| 10:00 AM to 10:59 AM | 162 (6.8%) | 0 (0.0%) |
| 11:00 AM to 11:59 AM | 0 (0.0%) | 12 (0.7%) |
| 12:00 PM to 3:59 PM | 58 (2.5%) | 96 (6.0%) |
| 4:00 PM to 11:59 PM | 184 (7.8%) | 126 (7.9%) |
| Total | 2,370 (100.0%) | 1,598 (100.0%) |
Housing Occupancy in Rapid Valley
Occupancy by Ownership in Rapid Valley
Of the total 3,086 dwellings in Rapid Valley, owner-occupied units account for 2,891 (93.7%), while renter-occupied units make up 195 (6.3%).
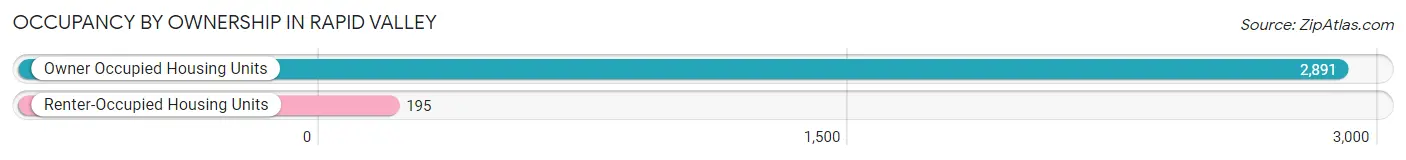
| Occupancy | # Housing Units | % Housing Units |
| Owner Occupied Housing Units | 2,891 | 93.7% |
| Renter-Occupied Housing Units | 195 | 6.3% |
| Total Occupied Housing Units | 3,086 | 100.0% |
Occupancy by Household Size in Rapid Valley
| Household Size | # Housing Units | % Housing Units |
| 1-Person Household | 787 | 25.5% |
| 2-Person Household | 1,342 | 43.5% |
| 3-Person Household | 418 | 13.6% |
| 4+ Person Household | 539 | 17.5% |
| Total Housing Units | 3,086 | 100.0% |
Occupancy by Ownership by Household Size in Rapid Valley
| Household Size | Owner-occupied | Renter-occupied |
| 1-Person Household | 717 (91.1%) | 70 (8.9%) |
| 2-Person Household | 1,287 (95.9%) | 55 (4.1%) |
| 3-Person Household | 418 (100.0%) | 0 (0.0%) |
| 4+ Person Household | 469 (87.0%) | 70 (13.0%) |
| Total Housing Units | 2,891 (93.7%) | 195 (6.3%) |
Occupancy by Educational Attainment in Rapid Valley
| Household Size | Owner-occupied | Renter-occupied |
| Less than High School | 182 (100.0%) | 0 (0.0%) |
| High School Diploma | 728 (82.8%) | 151 (17.2%) |
| College/Associate Degree | 1,308 (97.8%) | 30 (2.2%) |
| Bachelor's Degree or higher | 673 (98.0%) | 14 (2.0%) |
Occupancy by Age of Householder in Rapid Valley
| Age Bracket | # Households | % Households |
| Under 35 Years | 486 | 15.8% |
| 35 to 44 Years | 729 | 23.6% |
| 45 to 54 Years | 582 | 18.9% |
| 55 to 64 Years | 575 | 18.6% |
| 65 to 74 Years | 473 | 15.3% |
| 75 to 84 Years | 157 | 5.1% |
| 85 Years and Over | 84 | 2.7% |
| Total | 3,086 | 100.0% |
Housing Finances in Rapid Valley
Median Income by Occupancy in Rapid Valley
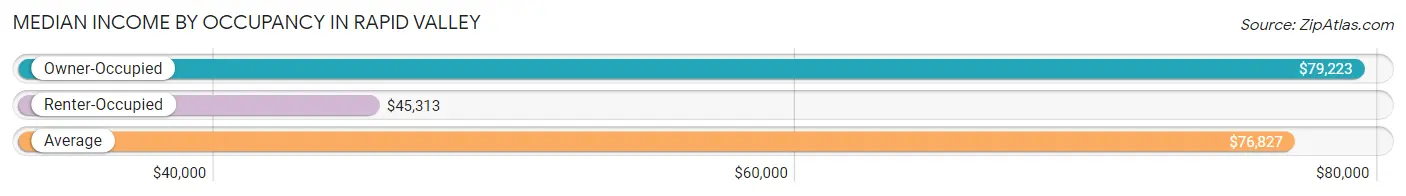
| Occupancy Type | # Households | Median Income |
| Owner-Occupied | 2,891 (93.7%) | $79,223 |
| Renter-Occupied | 195 (6.3%) | $45,313 |
| Average | 3,086 (100.0%) | $76,827 |
Occupancy by Householder Income Bracket in Rapid Valley
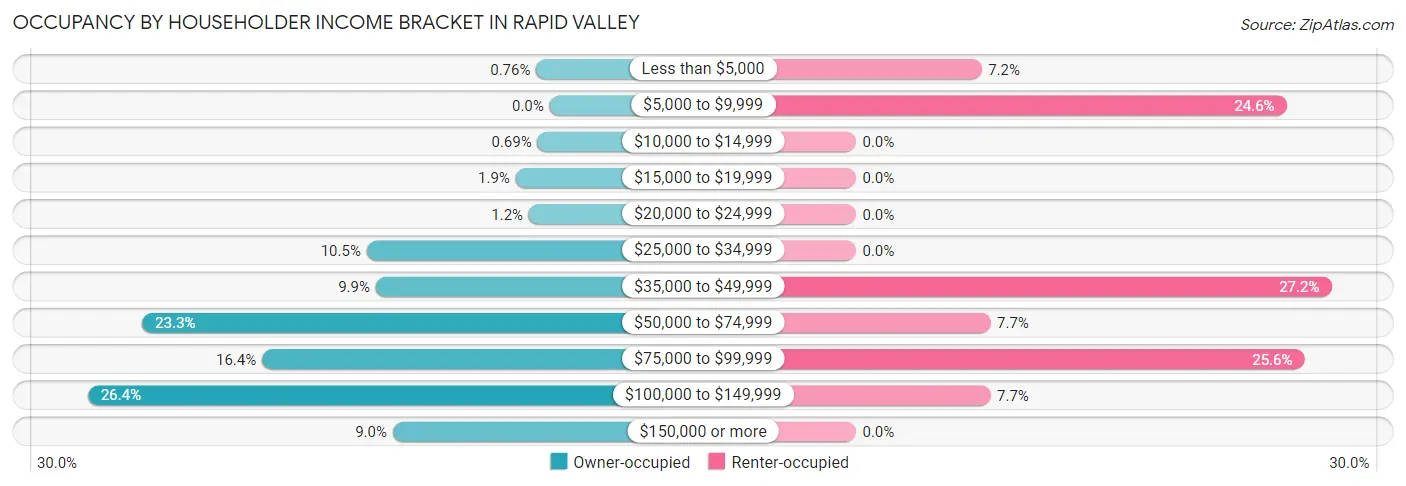
| Income Bracket | Owner-occupied | Renter-occupied |
| Less than $5,000 | 22 (0.8%) | 14 (7.2%) |
| $5,000 to $9,999 | 0 (0.0%) | 48 (24.6%) |
| $10,000 to $14,999 | 20 (0.7%) | 0 (0.0%) |
| $15,000 to $19,999 | 56 (1.9%) | 0 (0.0%) |
| $20,000 to $24,999 | 34 (1.2%) | 0 (0.0%) |
| $25,000 to $34,999 | 302 (10.4%) | 0 (0.0%) |
| $35,000 to $49,999 | 287 (9.9%) | 53 (27.2%) |
| $50,000 to $74,999 | 673 (23.3%) | 15 (7.7%) |
| $75,000 to $99,999 | 475 (16.4%) | 50 (25.6%) |
| $100,000 to $149,999 | 763 (26.4%) | 15 (7.7%) |
| $150,000 or more | 259 (9.0%) | 0 (0.0%) |
| Total | 2,891 (100.0%) | 195 (100.0%) |
Monthly Housing Cost Tiers in Rapid Valley
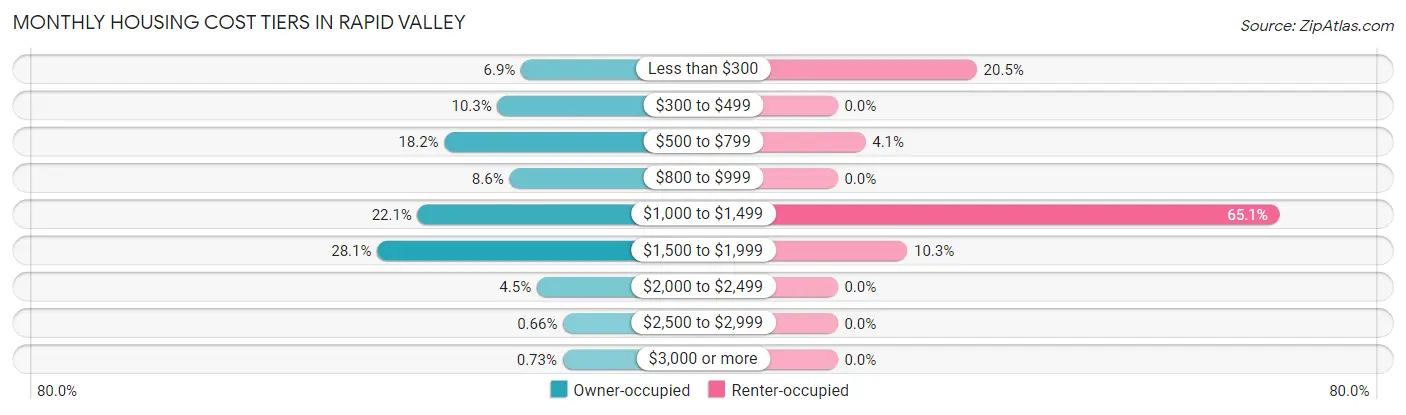
| Monthly Cost | Owner-occupied | Renter-occupied |
| Less than $300 | 198 (6.9%) | 40 (20.5%) |
| $300 to $499 | 299 (10.3%) | 0 (0.0%) |
| $500 to $799 | 525 (18.2%) | 8 (4.1%) |
| $800 to $999 | 248 (8.6%) | 0 (0.0%) |
| $1,000 to $1,499 | 639 (22.1%) | 127 (65.1%) |
| $1,500 to $1,999 | 811 (28.1%) | 20 (10.3%) |
| $2,000 to $2,499 | 131 (4.5%) | 0 (0.0%) |
| $2,500 to $2,999 | 19 (0.7%) | 0 (0.0%) |
| $3,000 or more | 21 (0.7%) | 0 (0.0%) |
| Total | 2,891 (100.0%) | 195 (100.0%) |
Physical Housing Characteristics in Rapid Valley
Housing Structures in Rapid Valley
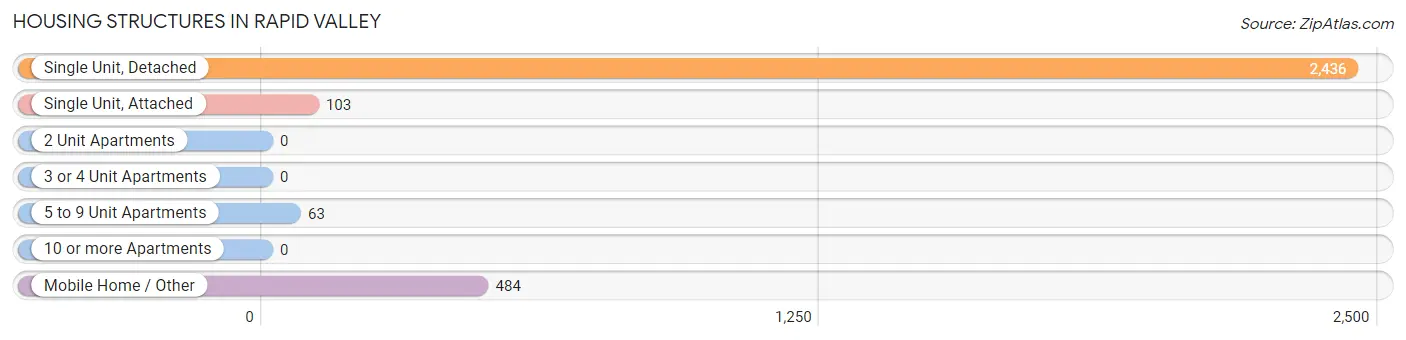
| Structure Type | # Housing Units | % Housing Units |
| Single Unit, Detached | 2,436 | 78.9% |
| Single Unit, Attached | 103 | 3.3% |
| 2 Unit Apartments | 0 | 0.0% |
| 3 or 4 Unit Apartments | 0 | 0.0% |
| 5 to 9 Unit Apartments | 63 | 2.0% |
| 10 or more Apartments | 0 | 0.0% |
| Mobile Home / Other | 484 | 15.7% |
| Total | 3,086 | 100.0% |
Housing Structures by Occupancy in Rapid Valley
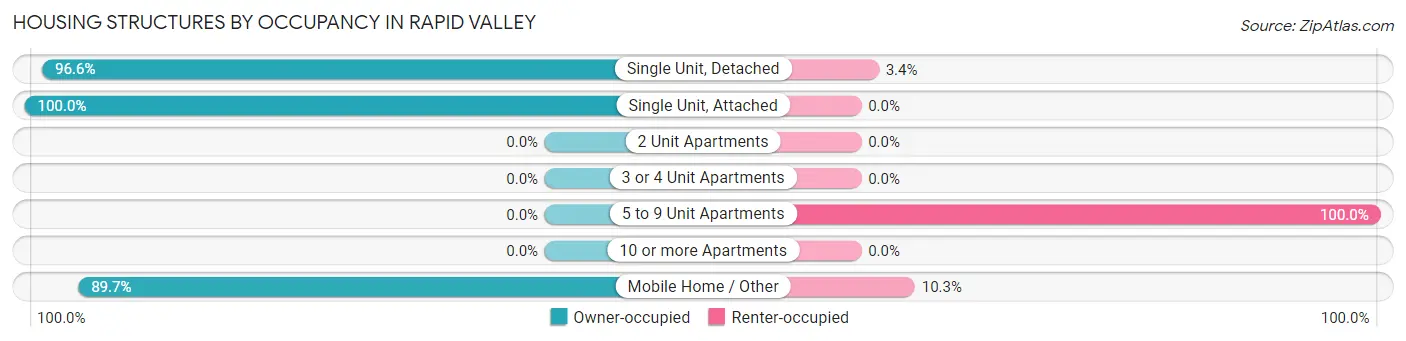
| Structure Type | Owner-occupied | Renter-occupied |
| Single Unit, Detached | 2,354 (96.6%) | 82 (3.4%) |
| Single Unit, Attached | 103 (100.0%) | 0 (0.0%) |
| 2 Unit Apartments | 0 (0.0%) | 0 (0.0%) |
| 3 or 4 Unit Apartments | 0 (0.0%) | 0 (0.0%) |
| 5 to 9 Unit Apartments | 0 (0.0%) | 63 (100.0%) |
| 10 or more Apartments | 0 (0.0%) | 0 (0.0%) |
| Mobile Home / Other | 434 (89.7%) | 50 (10.3%) |
| Total | 2,891 (93.7%) | 195 (6.3%) |
Housing Structures by Number of Rooms in Rapid Valley
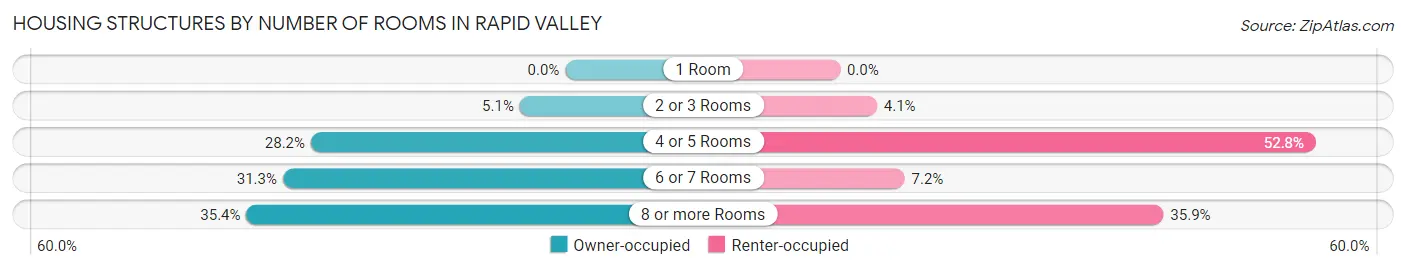
| Number of Rooms | Owner-occupied | Renter-occupied |
| 1 Room | 0 (0.0%) | 0 (0.0%) |
| 2 or 3 Rooms | 146 (5.1%) | 8 (4.1%) |
| 4 or 5 Rooms | 816 (28.2%) | 103 (52.8%) |
| 6 or 7 Rooms | 906 (31.3%) | 14 (7.2%) |
| 8 or more Rooms | 1,023 (35.4%) | 70 (35.9%) |
| Total | 2,891 (100.0%) | 195 (100.0%) |
Housing Structure by Heating Type in Rapid Valley
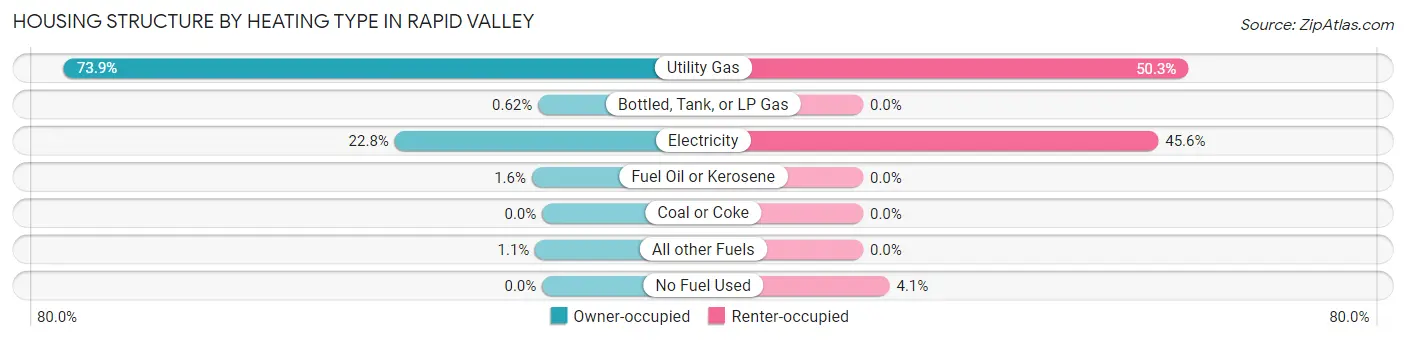
| Heating Type | Owner-occupied | Renter-occupied |
| Utility Gas | 2,137 (73.9%) | 98 (50.3%) |
| Bottled, Tank, or LP Gas | 18 (0.6%) | 0 (0.0%) |
| Electricity | 659 (22.8%) | 89 (45.6%) |
| Fuel Oil or Kerosene | 46 (1.6%) | 0 (0.0%) |
| Coal or Coke | 0 (0.0%) | 0 (0.0%) |
| All other Fuels | 31 (1.1%) | 0 (0.0%) |
| No Fuel Used | 0 (0.0%) | 8 (4.1%) |
| Total | 2,891 (100.0%) | 195 (100.0%) |
Household Vehicle Usage in Rapid Valley
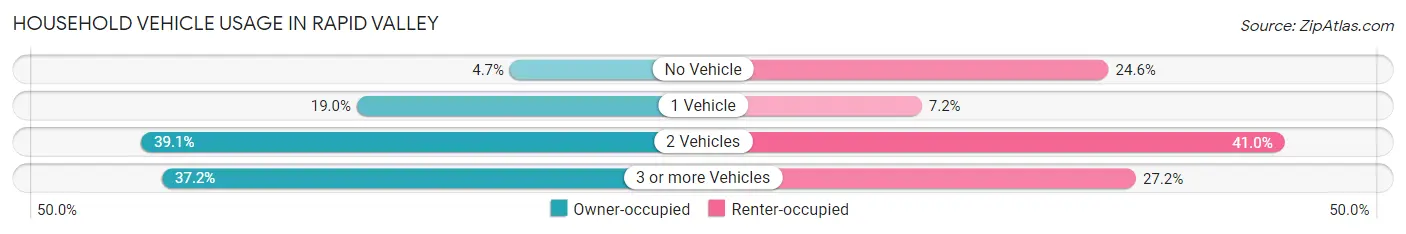
| Vehicles per Household | Owner-occupied | Renter-occupied |
| No Vehicle | 136 (4.7%) | 48 (24.6%) |
| 1 Vehicle | 549 (19.0%) | 14 (7.2%) |
| 2 Vehicles | 1,131 (39.1%) | 80 (41.0%) |
| 3 or more Vehicles | 1,075 (37.2%) | 53 (27.2%) |
| Total | 2,891 (100.0%) | 195 (100.0%) |
Real Estate & Mortgages in Rapid Valley
Real Estate and Mortgage Overview in Rapid Valley
| Characteristic | Without Mortgage | With Mortgage |
| Housing Units | 1,079 | 1,812 |
| Median Property Value | $174,400 | $207,200 |
| Median Household Income | $56,122 | $188 |
| Monthly Housing Costs | $517 | $21 |
| Real Estate Taxes | $2,094 | $70 |
Property Value by Mortgage Status in Rapid Valley
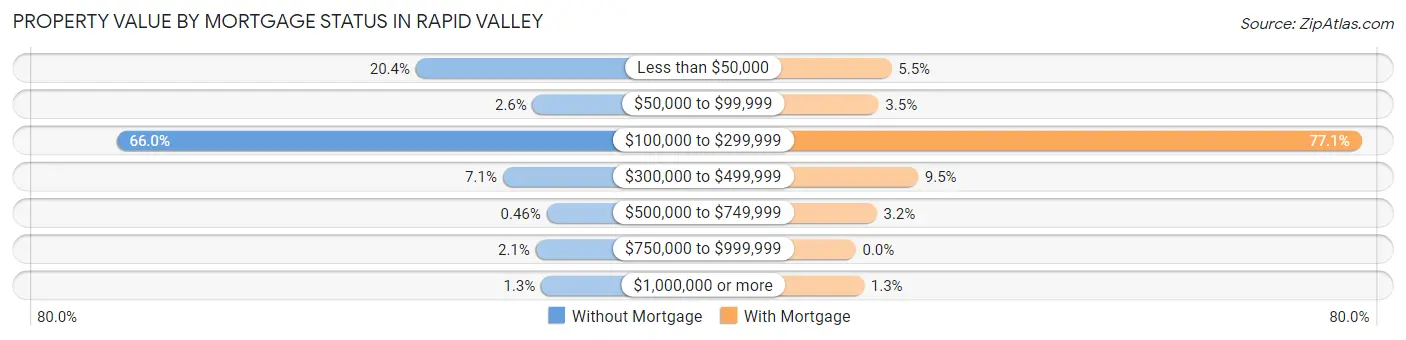
| Property Value | Without Mortgage | With Mortgage |
| Less than $50,000 | 220 (20.4%) | 99 (5.5%) |
| $50,000 to $99,999 | 28 (2.6%) | 63 (3.5%) |
| $100,000 to $299,999 | 712 (66.0%) | 1,397 (77.1%) |
| $300,000 to $499,999 | 77 (7.1%) | 172 (9.5%) |
| $500,000 to $749,999 | 5 (0.5%) | 58 (3.2%) |
| $750,000 to $999,999 | 23 (2.1%) | 0 (0.0%) |
| $1,000,000 or more | 14 (1.3%) | 23 (1.3%) |
| Total | 1,079 (100.0%) | 1,812 (100.0%) |
Household Income by Mortgage Status in Rapid Valley
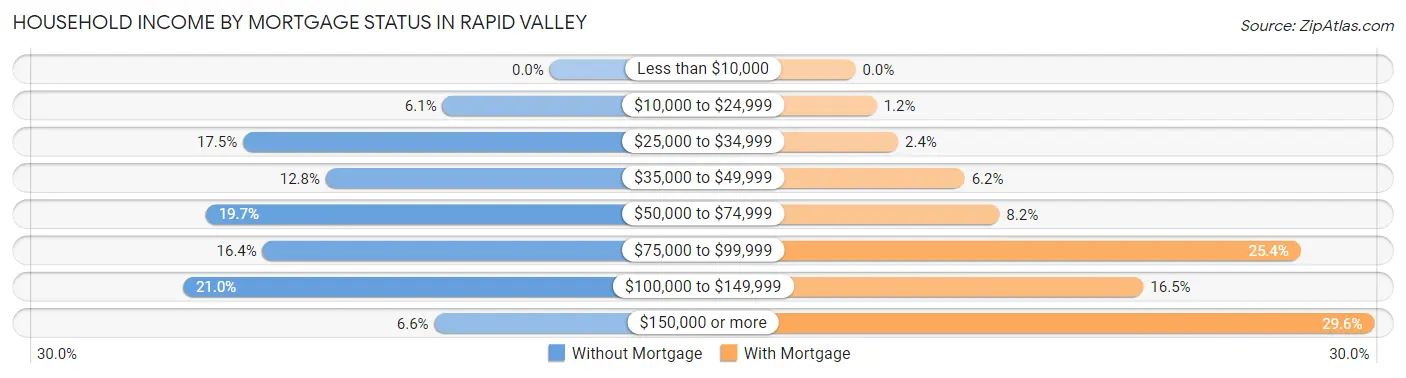
| Household Income | Without Mortgage | With Mortgage |
| Less than $10,000 | 0 (0.0%) | 0 (0.0%) |
| $10,000 to $24,999 | 66 (6.1%) | 22 (1.2%) |
| $25,000 to $34,999 | 189 (17.5%) | 44 (2.4%) |
| $35,000 to $49,999 | 138 (12.8%) | 113 (6.2%) |
| $50,000 to $74,999 | 212 (19.7%) | 149 (8.2%) |
| $75,000 to $99,999 | 177 (16.4%) | 461 (25.4%) |
| $100,000 to $149,999 | 226 (20.9%) | 298 (16.5%) |
| $150,000 or more | 71 (6.6%) | 537 (29.6%) |
| Total | 1,079 (100.0%) | 1,812 (100.0%) |
Property Value to Household Income Ratio in Rapid Valley
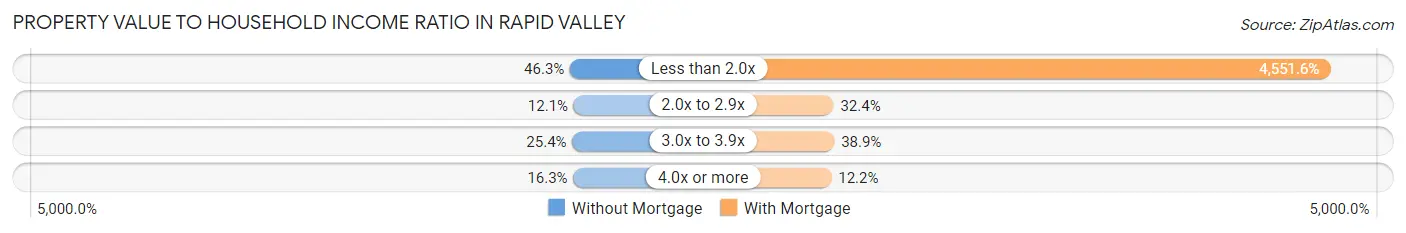
| Value-to-Income Ratio | Without Mortgage | With Mortgage |
| Less than 2.0x | 499 (46.3%) | 82,474 (4,551.6%) |
| 2.0x to 2.9x | 130 (12.0%) | 587 (32.4%) |
| 3.0x to 3.9x | 274 (25.4%) | 705 (38.9%) |
| 4.0x or more | 176 (16.3%) | 221 (12.2%) |
| Total | 1,079 (100.0%) | 1,812 (100.0%) |
Real Estate Taxes by Mortgage Status in Rapid Valley
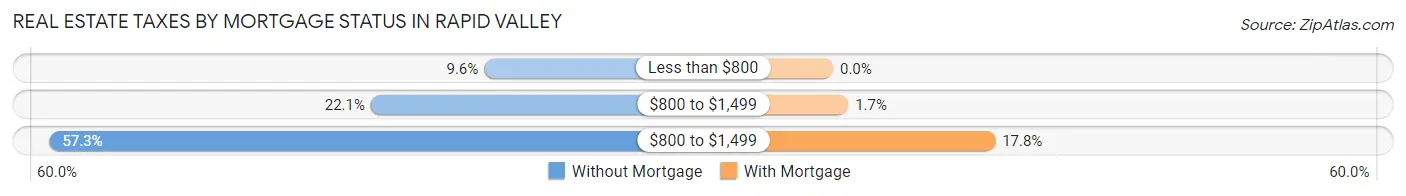
| Property Taxes | Without Mortgage | With Mortgage |
| Less than $800 | 104 (9.6%) | 0 (0.0%) |
| $800 to $1,499 | 238 (22.1%) | 30 (1.7%) |
| $800 to $1,499 | 618 (57.3%) | 322 (17.8%) |
| Total | 1,079 (100.0%) | 1,812 (100.0%) |
Health & Disability in Rapid Valley
Health Insurance Coverage by Age in Rapid Valley
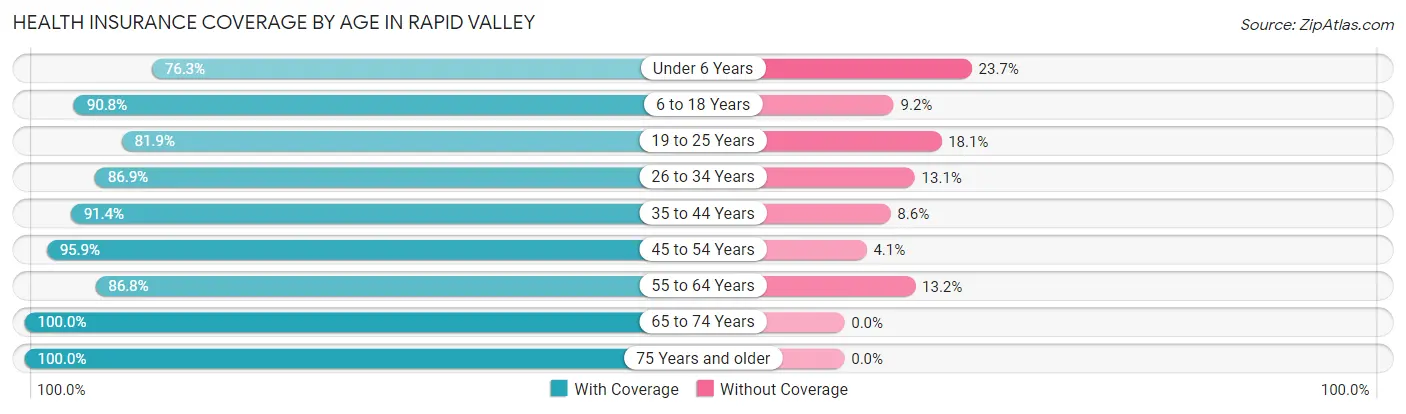
| Age Bracket | With Coverage | Without Coverage |
| Under 6 Years | 440 (76.3%) | 137 (23.7%) |
| 6 to 18 Years | 939 (90.8%) | 95 (9.2%) |
| 19 to 25 Years | 644 (81.9%) | 142 (18.1%) |
| 26 to 34 Years | 490 (86.9%) | 74 (13.1%) |
| 35 to 44 Years | 1,010 (91.4%) | 95 (8.6%) |
| 45 to 54 Years | 1,022 (95.9%) | 44 (4.1%) |
| 55 to 64 Years | 901 (86.8%) | 137 (13.2%) |
| 65 to 74 Years | 725 (100.0%) | 0 (0.0%) |
| 75 Years and older | 344 (100.0%) | 0 (0.0%) |
| Total | 6,515 (90.0%) | 724 (10.0%) |
Health Insurance Coverage by Citizenship Status in Rapid Valley
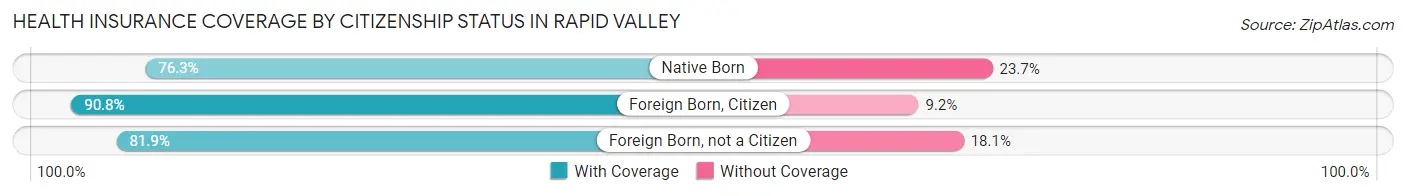
| Citizenship Status | With Coverage | Without Coverage |
| Native Born | 440 (76.3%) | 137 (23.7%) |
| Foreign Born, Citizen | 939 (90.8%) | 95 (9.2%) |
| Foreign Born, not a Citizen | 644 (81.9%) | 142 (18.1%) |
Health Insurance Coverage by Household Income in Rapid Valley
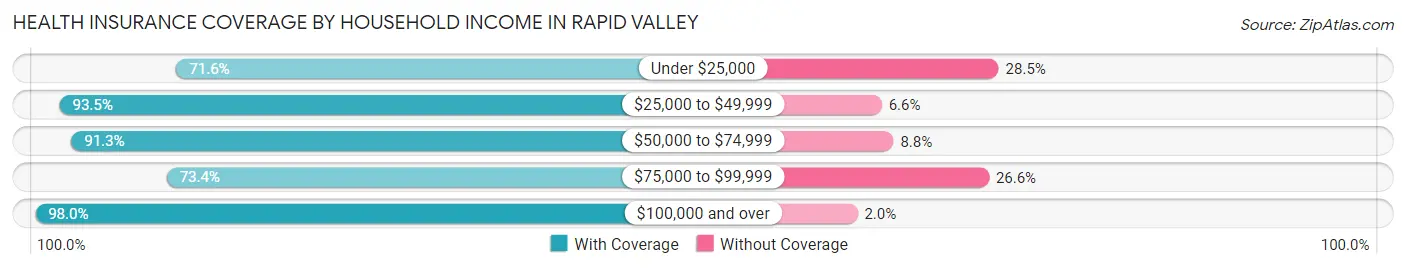
| Household Income | With Coverage | Without Coverage |
| Under $25,000 | 259 (71.6%) | 103 (28.4%) |
| $25,000 to $49,999 | 1,084 (93.4%) | 76 (6.6%) |
| $50,000 to $74,999 | 1,283 (91.2%) | 123 (8.7%) |
| $75,000 to $99,999 | 1,000 (73.4%) | 363 (26.6%) |
| $100,000 and over | 2,889 (98.0%) | 59 (2.0%) |
Public vs Private Health Insurance Coverage by Age in Rapid Valley
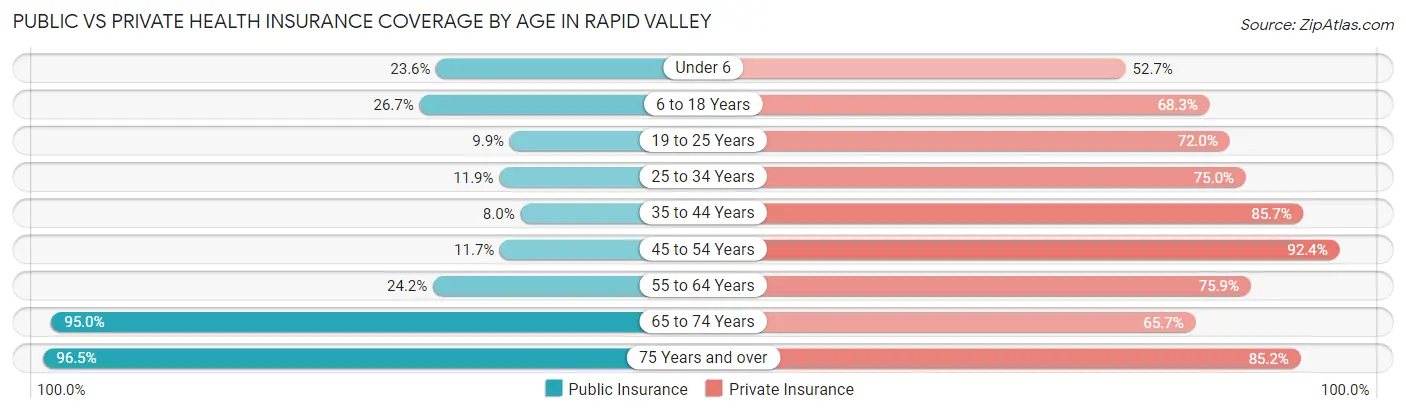
| Age Bracket | Public Insurance | Private Insurance |
| Under 6 | 136 (23.6%) | 304 (52.7%) |
| 6 to 18 Years | 276 (26.7%) | 706 (68.3%) |
| 19 to 25 Years | 78 (9.9%) | 566 (72.0%) |
| 25 to 34 Years | 67 (11.9%) | 423 (75.0%) |
| 35 to 44 Years | 88 (8.0%) | 947 (85.7%) |
| 45 to 54 Years | 125 (11.7%) | 985 (92.4%) |
| 55 to 64 Years | 251 (24.2%) | 788 (75.9%) |
| 65 to 74 Years | 689 (95.0%) | 476 (65.7%) |
| 75 Years and over | 332 (96.5%) | 293 (85.2%) |
| Total | 2,042 (28.2%) | 5,488 (75.8%) |
Disability Status by Sex by Age in Rapid Valley
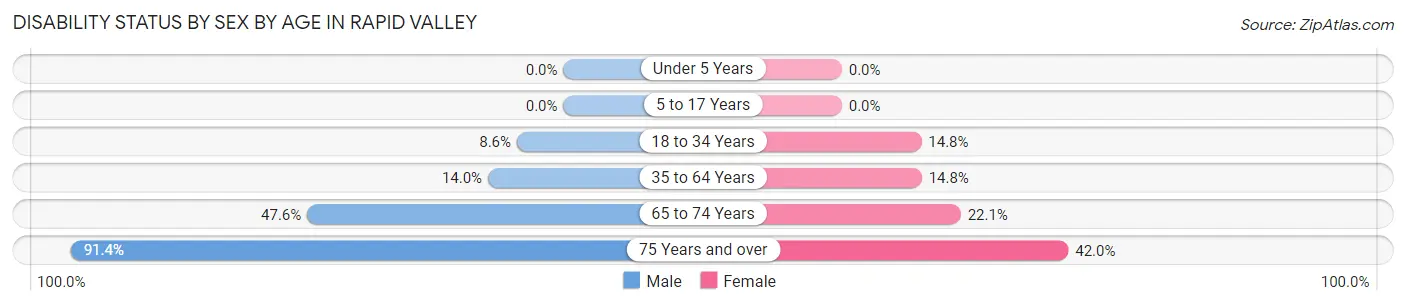
| Age Bracket | Male | Female |
| Under 5 Years | 0 (0.0%) | 0 (0.0%) |
| 5 to 17 Years | 0 (0.0%) | 0 (0.0%) |
| 18 to 34 Years | 80 (8.6%) | 79 (14.8%) |
| 35 to 64 Years | 235 (14.0%) | 227 (14.8%) |
| 65 to 74 Years | 166 (47.6%) | 83 (22.1%) |
| 75 Years and over | 171 (91.4%) | 66 (42.0%) |
Disability Class by Sex by Age in Rapid Valley
Disability Class: Hearing Difficulty
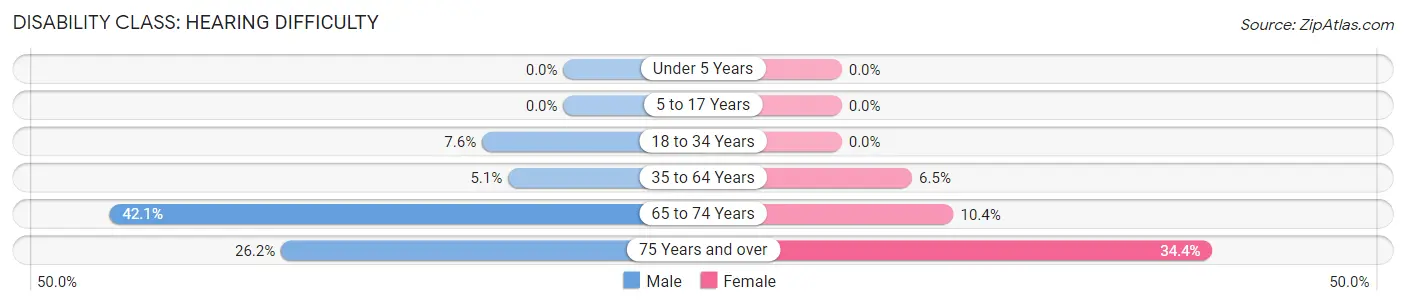
| Age Bracket | Male | Female |
| Under 5 Years | 0 (0.0%) | 0 (0.0%) |
| 5 to 17 Years | 0 (0.0%) | 0 (0.0%) |
| 18 to 34 Years | 70 (7.5%) | 0 (0.0%) |
| 35 to 64 Years | 86 (5.1%) | 100 (6.5%) |
| 65 to 74 Years | 147 (42.1%) | 39 (10.4%) |
| 75 Years and over | 49 (26.2%) | 54 (34.4%) |
Disability Class: Vision Difficulty
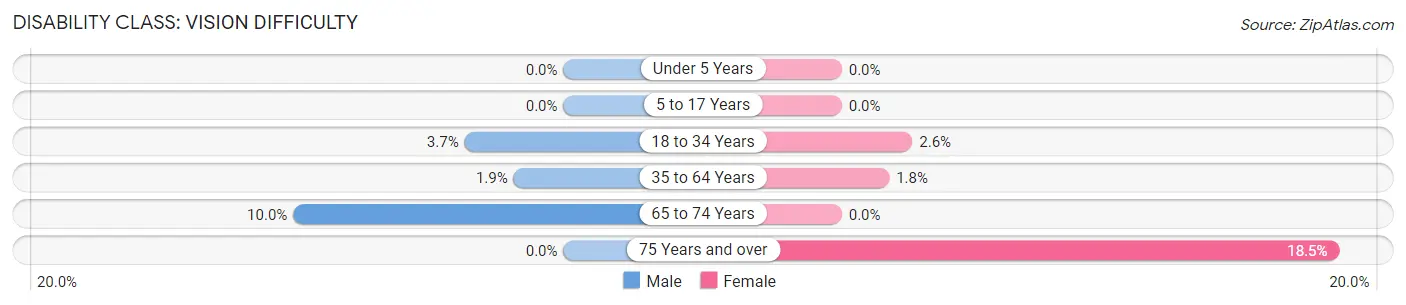
| Age Bracket | Male | Female |
| Under 5 Years | 0 (0.0%) | 0 (0.0%) |
| 5 to 17 Years | 0 (0.0%) | 0 (0.0%) |
| 18 to 34 Years | 34 (3.7%) | 14 (2.6%) |
| 35 to 64 Years | 31 (1.8%) | 27 (1.8%) |
| 65 to 74 Years | 35 (10.0%) | 0 (0.0%) |
| 75 Years and over | 0 (0.0%) | 29 (18.5%) |
Disability Class: Cognitive Difficulty
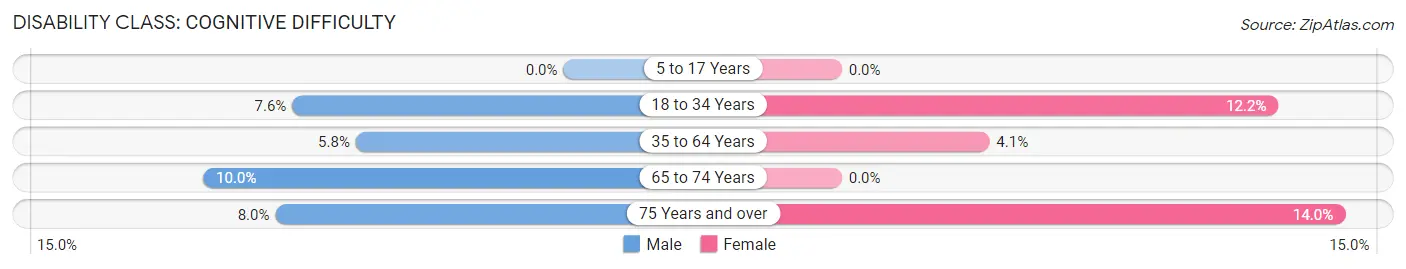
| Age Bracket | Male | Female |
| 5 to 17 Years | 0 (0.0%) | 0 (0.0%) |
| 18 to 34 Years | 70 (7.5%) | 65 (12.1%) |
| 35 to 64 Years | 97 (5.8%) | 63 (4.1%) |
| 65 to 74 Years | 35 (10.0%) | 0 (0.0%) |
| 75 Years and over | 15 (8.0%) | 22 (14.0%) |
Disability Class: Ambulatory Difficulty
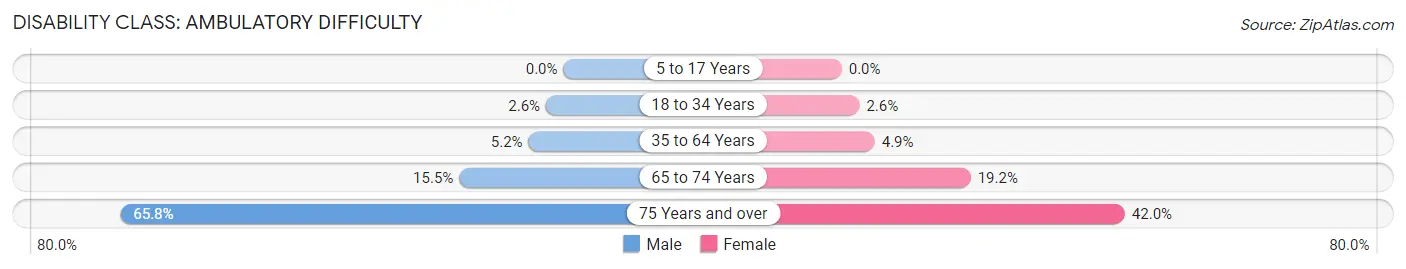
| Age Bracket | Male | Female |
| 5 to 17 Years | 0 (0.0%) | 0 (0.0%) |
| 18 to 34 Years | 24 (2.6%) | 14 (2.6%) |
| 35 to 64 Years | 87 (5.2%) | 75 (4.9%) |
| 65 to 74 Years | 54 (15.5%) | 72 (19.2%) |
| 75 Years and over | 123 (65.8%) | 66 (42.0%) |
Disability Class: Self-Care Difficulty
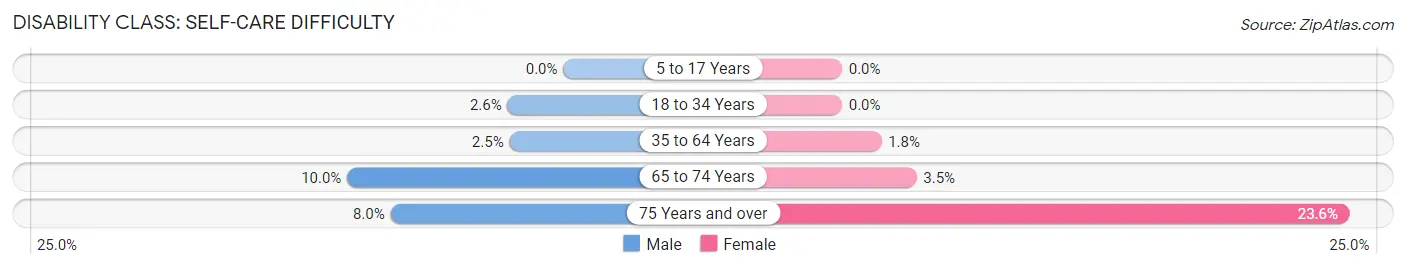
| Age Bracket | Male | Female |
| 5 to 17 Years | 0 (0.0%) | 0 (0.0%) |
| 18 to 34 Years | 24 (2.6%) | 0 (0.0%) |
| 35 to 64 Years | 42 (2.5%) | 28 (1.8%) |
| 65 to 74 Years | 35 (10.0%) | 13 (3.5%) |
| 75 Years and over | 15 (8.0%) | 37 (23.6%) |
Technology Access in Rapid Valley
Computing Device Access in Rapid Valley
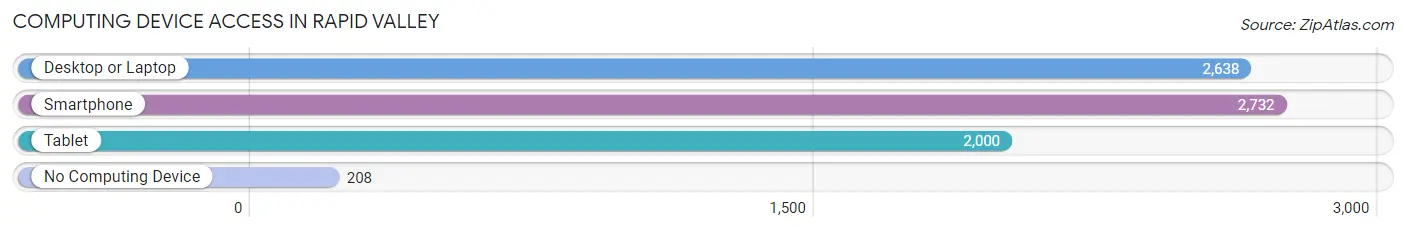
| Device Type | # Households | % Households |
| Desktop or Laptop | 2,638 | 85.5% |
| Smartphone | 2,732 | 88.5% |
| Tablet | 2,000 | 64.8% |
| No Computing Device | 208 | 6.7% |
| Total | 3,086 | 100.0% |
Internet Access in Rapid Valley
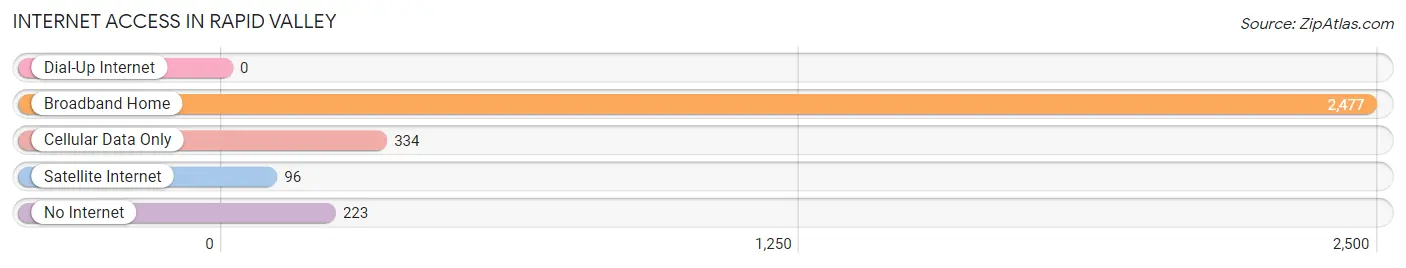
| Internet Type | # Households | % Households |
| Dial-Up Internet | 0 | 0.0% |
| Broadband Home | 2,477 | 80.3% |
| Cellular Data Only | 334 | 10.8% |
| Satellite Internet | 96 | 3.1% |
| No Internet | 223 | 7.2% |
| Total | 3,086 | 100.0% |
Rapid Valley Summary
Rapid Valley is a small unincorporated community located in Pennington County, South Dakota. It is situated in the Black Hills region of the state, approximately 8 miles east of Rapid City. The population of Rapid Valley was estimated to be 1,845 in 2019.
History
The area that is now Rapid Valley was first settled in the late 1800s by homesteaders. The town was originally known as “Rapid City East” due to its proximity to Rapid City. In the early 1900s, the town was renamed “Rapid Valley” to distinguish it from the larger city.
The town was officially incorporated in 1909 and was home to a variety of businesses, including a hotel, a general store, a post office, and a blacksmith shop. The town also had a school, which was built in 1910.
In the 1920s, Rapid Valley began to experience a population boom due to the discovery of gold in the area. This led to the construction of a number of new businesses, including a bank, a movie theater, and a bowling alley.
The town continued to grow throughout the 20th century, and by the 2000s, it had become a popular bedroom community for Rapid City.
Geography
Rapid Valley is located in the Black Hills region of South Dakota, approximately 8 miles east of Rapid City. The town is situated in a valley between two hills, which gives it its name.
The town is located at an elevation of 3,845 feet above sea level. The climate in Rapid Valley is semi-arid, with hot summers and cold winters. The average annual temperature is 48°F, and the average annual precipitation is 16.5 inches.
Economy
The economy of Rapid Valley is largely based on tourism and retail. The town is home to a variety of shops and restaurants, as well as a number of hotels and motels.
The town is also home to a number of manufacturing and industrial businesses, including a concrete plant, a lumber mill, and a metal fabrication plant.
Demographics
As of 2019, the population of Rapid Valley was estimated to be 1,845. The racial makeup of the town was 94.3% White, 1.2% Native American, 0.7% Asian, 0.5% African American, and 3.3% from other races.
The median household income in Rapid Valley was $50,938 in 2019, and the median home value was $179,400. The town has a poverty rate of 11.3%, and the unemployment rate was 3.7% in 2019.
Common Questions
What is Per Capita Income in Rapid Valley?
Per Capita income in Rapid Valley is $36,282.
What is the Median Family Income in Rapid Valley?
Median Family Income in Rapid Valley is $93,863.
What is the Median Household income in Rapid Valley?
Median Household Income in Rapid Valley is $76,827.
What is Income or Wage Gap in Rapid Valley?
Income or Wage Gap in Rapid Valley is 5.7%.
Women in Rapid Valley earn 94.3 cents for every dollar earned by a man.
What is Inequality or Gini Index in Rapid Valley?
Inequality or Gini Index in Rapid Valley is 0.32.
What is the Total Population of Rapid Valley?
Total Population of Rapid Valley is 7,324.
What is the Total Male Population of Rapid Valley?
Total Male Population of Rapid Valley is 4,068.
What is the Total Female Population of Rapid Valley?
Total Female Population of Rapid Valley is 3,256.
What is the Ratio of Males per 100 Females in Rapid Valley?
There are 124.94 Males per 100 Females in Rapid Valley.
What is the Ratio of Females per 100 Males in Rapid Valley?
There are 80.04 Females per 100 Males in Rapid Valley.
What is the Median Population Age in Rapid Valley?
Median Population Age in Rapid Valley is 41.6 Years.
What is the Average Family Size in Rapid Valley
Average Family Size in Rapid Valley is 2.8 People.
What is the Average Household Size in Rapid Valley
Average Household Size in Rapid Valley is 2.4 People.
How Large is the Labor Force in Rapid Valley?
There are 4,327 People in the Labor Forcein in Rapid Valley.
What is the Percentage of People in the Labor Force in Rapid Valley?
72.4% of People are in the Labor Force in Rapid Valley.
What is the Unemployment Rate in Rapid Valley?
Unemployment Rate in Rapid Valley is 3.1%.