Sisseton, SD Map & Demographics
Sisseton Map
Sisseton Overview
$21,741
PER CAPITA INCOME
$47,895
AVG FAMILY INCOME
$40,100
AVG HOUSEHOLD INCOME
2.2%
WAGE / INCOME GAP [ % ]
97.8¢/ $1
WAGE / INCOME GAP [ $ ]
0.42
INEQUALITY / GINI INDEX
2,564
TOTAL POPULATION
1,222
MALE POPULATION
1,342
FEMALE POPULATION
91.06
MALES / 100 FEMALES
109.82
FEMALES / 100 MALES
34.1
MEDIAN AGE
3.6
AVG FAMILY SIZE
2.7
AVG HOUSEHOLD SIZE
1,118
LABOR FORCE [ PEOPLE ]
58.4%
PERCENT IN LABOR FORCE
7.2%
UNEMPLOYMENT RATE
Sisseton Zip Codes
Sisseton Area Codes
Income in Sisseton
Income Overview in Sisseton
Per Capita Income in Sisseton is $21,741, while median incomes of families and households are $47,895 and $40,100 respectively.
| Characteristic | Number | Measure |
| Per Capita Income | 2,564 | $21,741 |
| Median Family Income | 552 | $47,895 |
| Mean Family Income | 552 | $68,214 |
| Median Household Income | 940 | $40,100 |
| Mean Household Income | 940 | $55,219 |
| Income Deficit | 552 | $0 |
| Wage / Income Gap (%) | 2,564 | 2.23% |
| Wage / Income Gap ($) | 2,564 | 97.77¢ per $1 |
| Gini / Inequality Index | 2,564 | 0.42 |
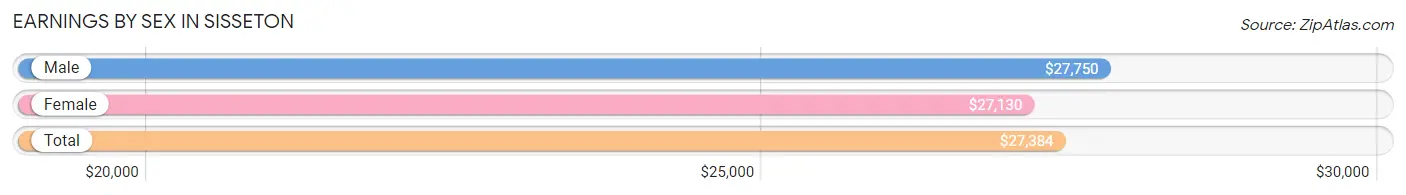
Earnings by Sex in Sisseton
Average Earnings in Sisseton are $27,384, $27,750 for men and $27,130 for women, a difference of 2.2%.
| Sex | Number | Average Earnings |
| Male | 624 (52.3%) | $27,750 |
| Female | 568 (47.6%) | $27,130 |
| Total | 1,192 (100.0%) | $27,384 |
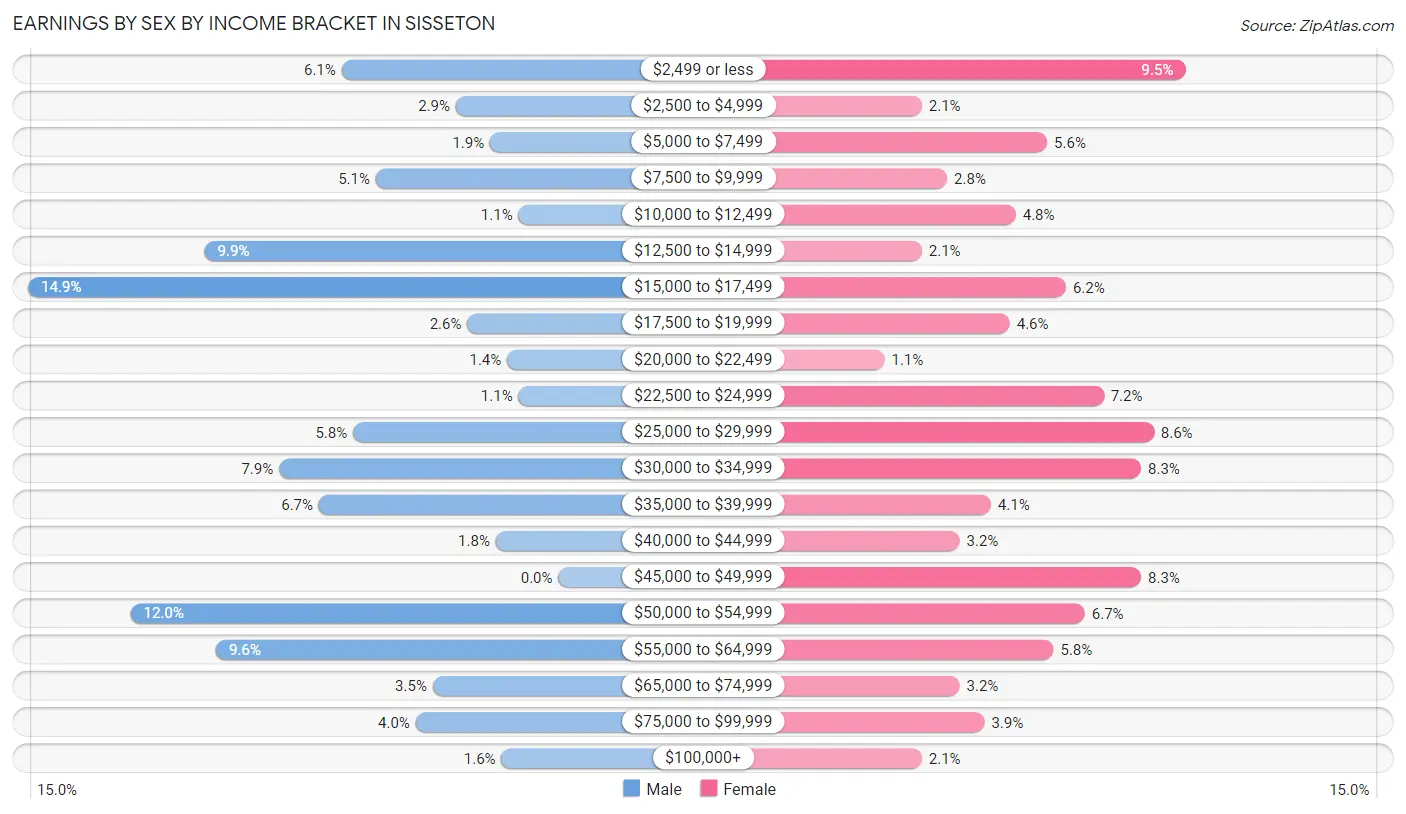
Earnings by Sex by Income Bracket in Sisseton
The most common earnings brackets in Sisseton are $15,000 to $17,499 for men (93 | 14.9%) and $2,499 or less for women (54 | 9.5%).
| Income | Male | Female |
| $2,499 or less | 38 (6.1%) | 54 (9.5%) |
| $2,500 to $4,999 | 18 (2.9%) | 12 (2.1%) |
| $5,000 to $7,499 | 12 (1.9%) | 32 (5.6%) |
| $7,500 to $9,999 | 32 (5.1%) | 16 (2.8%) |
| $10,000 to $12,499 | 7 (1.1%) | 27 (4.8%) |
| $12,500 to $14,999 | 62 (9.9%) | 12 (2.1%) |
| $15,000 to $17,499 | 93 (14.9%) | 35 (6.2%) |
| $17,500 to $19,999 | 16 (2.6%) | 26 (4.6%) |
| $20,000 to $22,499 | 9 (1.4%) | 6 (1.1%) |
| $22,500 to $24,999 | 7 (1.1%) | 41 (7.2%) |
| $25,000 to $29,999 | 36 (5.8%) | 49 (8.6%) |
| $30,000 to $34,999 | 49 (7.9%) | 47 (8.3%) |
| $35,000 to $39,999 | 42 (6.7%) | 23 (4.1%) |
| $40,000 to $44,999 | 11 (1.8%) | 18 (3.2%) |
| $45,000 to $49,999 | 0 (0.0%) | 47 (8.3%) |
| $50,000 to $54,999 | 75 (12.0%) | 38 (6.7%) |
| $55,000 to $64,999 | 60 (9.6%) | 33 (5.8%) |
| $65,000 to $74,999 | 22 (3.5%) | 18 (3.2%) |
| $75,000 to $99,999 | 25 (4.0%) | 22 (3.9%) |
| $100,000+ | 10 (1.6%) | 12 (2.1%) |
| Total | 624 (100.0%) | 568 (100.0%) |
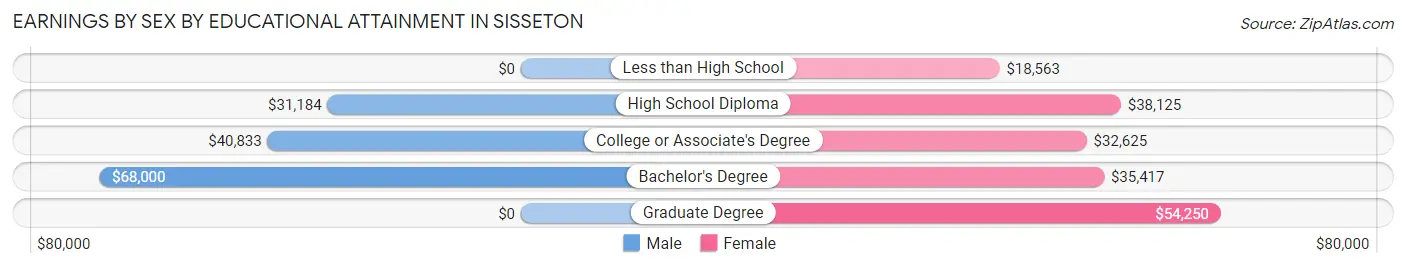
Earnings by Sex by Educational Attainment in Sisseton
Average earnings in Sisseton are $33,017 for men and $32,552 for women, a difference of 1.4%. Men with an educational attainment of bachelor's degree enjoy the highest average annual earnings of $68,000, while those with high school diploma education earn the least with $31,184. Women with an educational attainment of graduate degree earn the most with the average annual earnings of $54,250, while those with less than high school education have the smallest earnings of $18,563.
| Educational Attainment | Male Income | Female Income |
| Less than High School | - | - |
| High School Diploma | $31,184 | $38,125 |
| College or Associate's Degree | $40,833 | $32,625 |
| Bachelor's Degree | $68,000 | $35,417 |
| Graduate Degree | - | - |
| Total | $33,017 | $32,552 |
Family Income in Sisseton
Family Income Brackets in Sisseton
According to the Sisseton family income data, there are 158 families falling into the $35,000 to $49,999 income range, which is the most common income bracket and makes up 28.6% of all families.
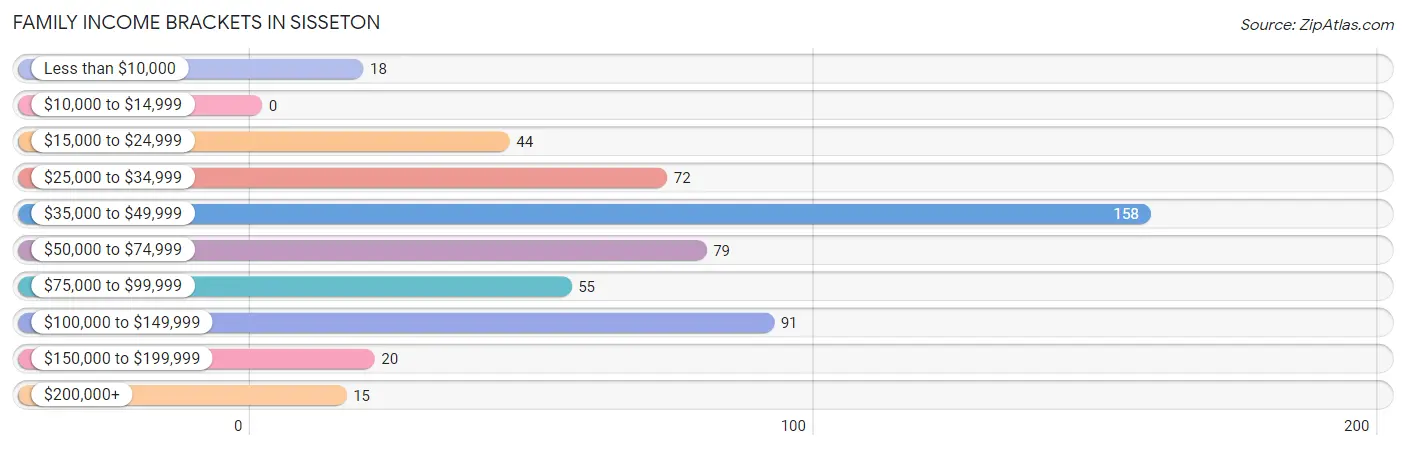
| Income Bracket | # Families | % Families |
| Less than $10,000 | 18 | 3.3% |
| $10,000 to $14,999 | 0 | 0.0% |
| $15,000 to $24,999 | 44 | 8.0% |
| $25,000 to $34,999 | 72 | 13.0% |
| $35,000 to $49,999 | 158 | 28.6% |
| $50,000 to $74,999 | 79 | 14.3% |
| $75,000 to $99,999 | 55 | 10.0% |
| $100,000 to $149,999 | 91 | 16.5% |
| $150,000 to $199,999 | 20 | 3.6% |
| $200,000+ | 15 | 2.7% |
Family Income by Famaliy Size in Sisseton
4-person families (107 | 19.4%) account for the highest median family income in Sisseton with $59,554 per family, while 2-person families (203 | 36.8%) have the highest median income of $24,532 per family member.
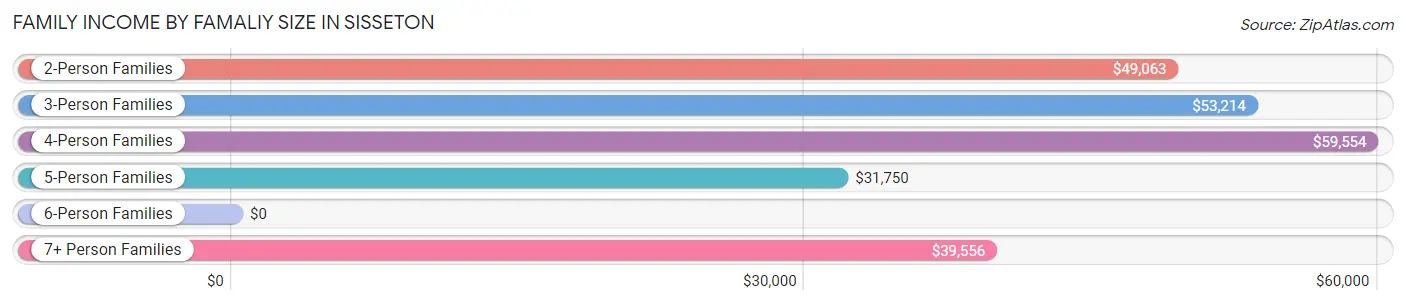
| Income Bracket | # Families | Median Income |
| 2-Person Families | 203 (36.8%) | $49,063 |
| 3-Person Families | 120 (21.7%) | $53,214 |
| 4-Person Families | 107 (19.4%) | $59,554 |
| 5-Person Families | 38 (6.9%) | $31,750 |
| 6-Person Families | 10 (1.8%) | $0 |
| 7+ Person Families | 74 (13.4%) | $39,556 |
| Total | 552 (100.0%) | $47,895 |
Family Income by Number of Earners in Sisseton
The median family income in Sisseton is $47,895, with families comprising 3+ earners (56) having the highest median family income of $107,500, while families with 1 earner (234) have the lowest median family income of $38,066, accounting for 10.1% and 42.4% of families, respectively.
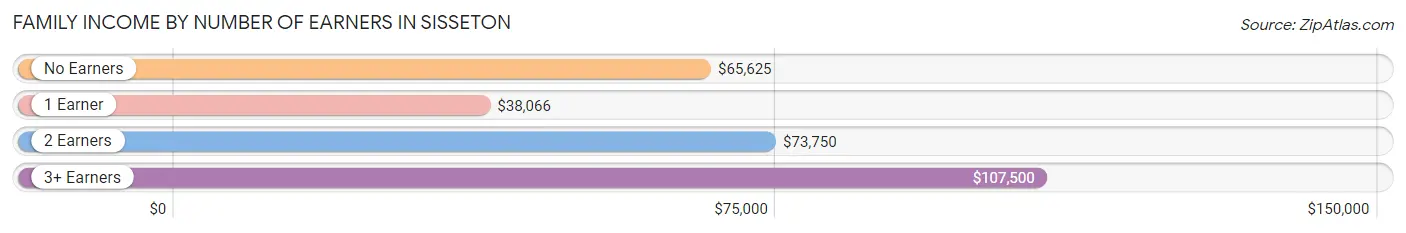
| Number of Earners | # Families | Median Income |
| No Earners | 74 (13.4%) | $65,625 |
| 1 Earner | 234 (42.4%) | $38,066 |
| 2 Earners | 188 (34.1%) | $73,750 |
| 3+ Earners | 56 (10.1%) | $107,500 |
| Total | 552 (100.0%) | $47,895 |
Household Income in Sisseton
Household Income Brackets in Sisseton
With 204 households falling in the category, the $35,000 to $49,999 income range is the most frequent in Sisseton, accounting for 21.7% of all households. In contrast, only 15 households (1.6%) fall into the $200,000+ income bracket, making it the least populous group.
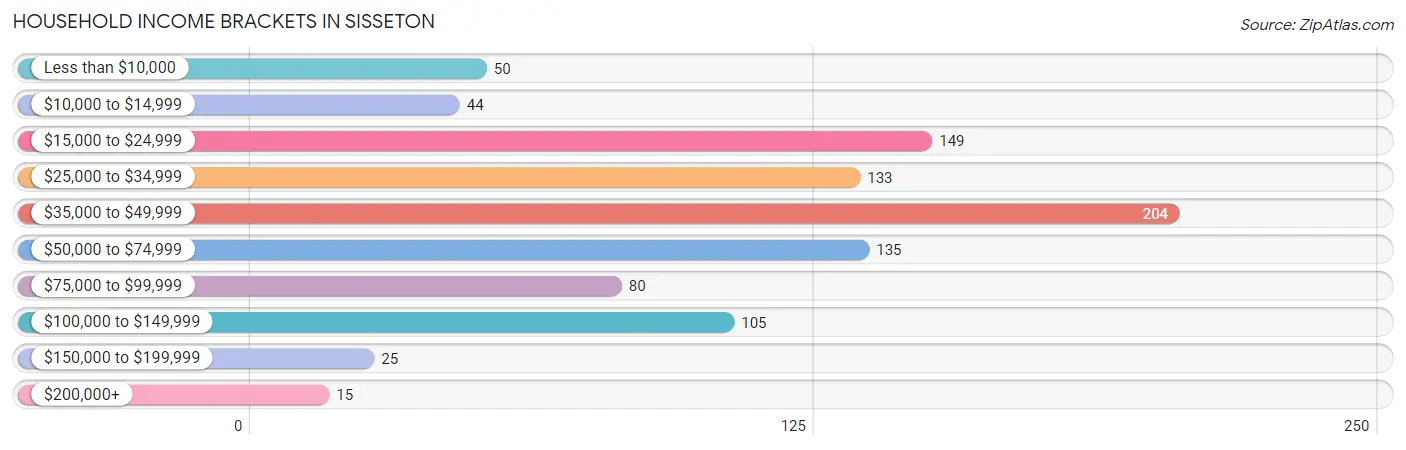
| Income Bracket | # Households | % Households |
| Less than $10,000 | 50 | 5.3% |
| $10,000 to $14,999 | 44 | 4.7% |
| $15,000 to $24,999 | 149 | 15.9% |
| $25,000 to $34,999 | 133 | 14.1% |
| $35,000 to $49,999 | 204 | 21.7% |
| $50,000 to $74,999 | 135 | 14.4% |
| $75,000 to $99,999 | 80 | 8.5% |
| $100,000 to $149,999 | 105 | 11.2% |
| $150,000 to $199,999 | 25 | 2.7% |
| $200,000+ | 15 | 1.6% |
Household Income by Householder Age in Sisseton
The median household income in Sisseton is $40,100, with the highest median household income of $54,286 found in the 45 to 64 years age bracket for the primary householder. A total of 280 households (29.8%) fall into this category. Meanwhile, the 15 to 24 years age bracket for the primary householder has the lowest median household income of $34,479, with 41 households (4.4%) in this group.
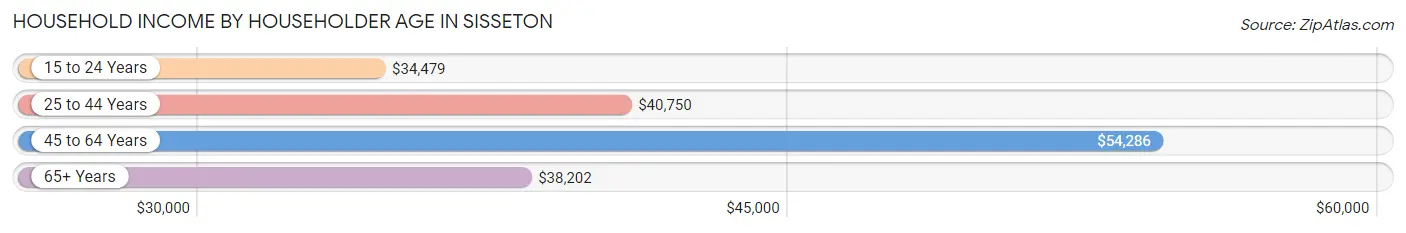
| Income Bracket | # Households | Median Income |
| 15 to 24 Years | 41 (4.4%) | $34,479 |
| 25 to 44 Years | 269 (28.6%) | $40,750 |
| 45 to 64 Years | 280 (29.8%) | $54,286 |
| 65+ Years | 350 (37.2%) | $38,202 |
| Total | 940 (100.0%) | $40,100 |
Poverty in Sisseton
Income Below Poverty by Sex and Age in Sisseton
With 24.0% poverty level for males and 25.2% for females among the residents of Sisseton, under 5 year old males and 6 to 11 year old females are the most vulnerable to poverty, with 51 males (71.8%) and 60 females (49.2%) in their respective age groups living below the poverty level.
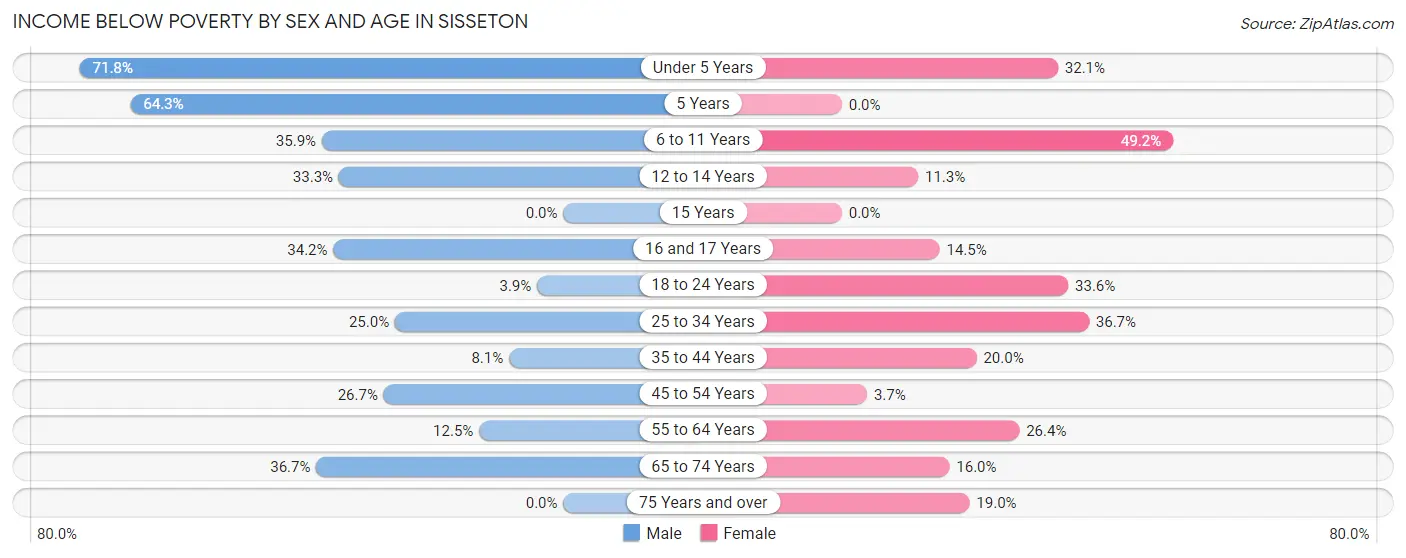
| Age Bracket | Male | Female |
| Under 5 Years | 51 (71.8%) | 51 (32.1%) |
| 5 Years | 18 (64.3%) | 0 (0.0%) |
| 6 to 11 Years | 38 (35.8%) | 60 (49.2%) |
| 12 to 14 Years | 13 (33.3%) | 6 (11.3%) |
| 15 Years | 0 (0.0%) | 0 (0.0%) |
| 16 and 17 Years | 14 (34.2%) | 9 (14.5%) |
| 18 to 24 Years | 6 (3.9%) | 40 (33.6%) |
| 25 to 34 Years | 41 (25.0%) | 51 (36.7%) |
| 35 to 44 Years | 10 (8.1%) | 19 (20.0%) |
| 45 to 54 Years | 28 (26.7%) | 4 (3.7%) |
| 55 to 64 Years | 14 (12.5%) | 39 (26.4%) |
| 65 to 74 Years | 51 (36.7%) | 19 (16.0%) |
| 75 Years and over | 0 (0.0%) | 29 (19.0%) |
| Total | 284 (24.0%) | 327 (25.2%) |
Income Above Poverty by Sex and Age in Sisseton
According to the poverty statistics in Sisseton, males aged 15 years and females aged 5 years are the age groups that are most secure financially, with 100.0% of males and 100.0% of females in these age groups living above the poverty line.
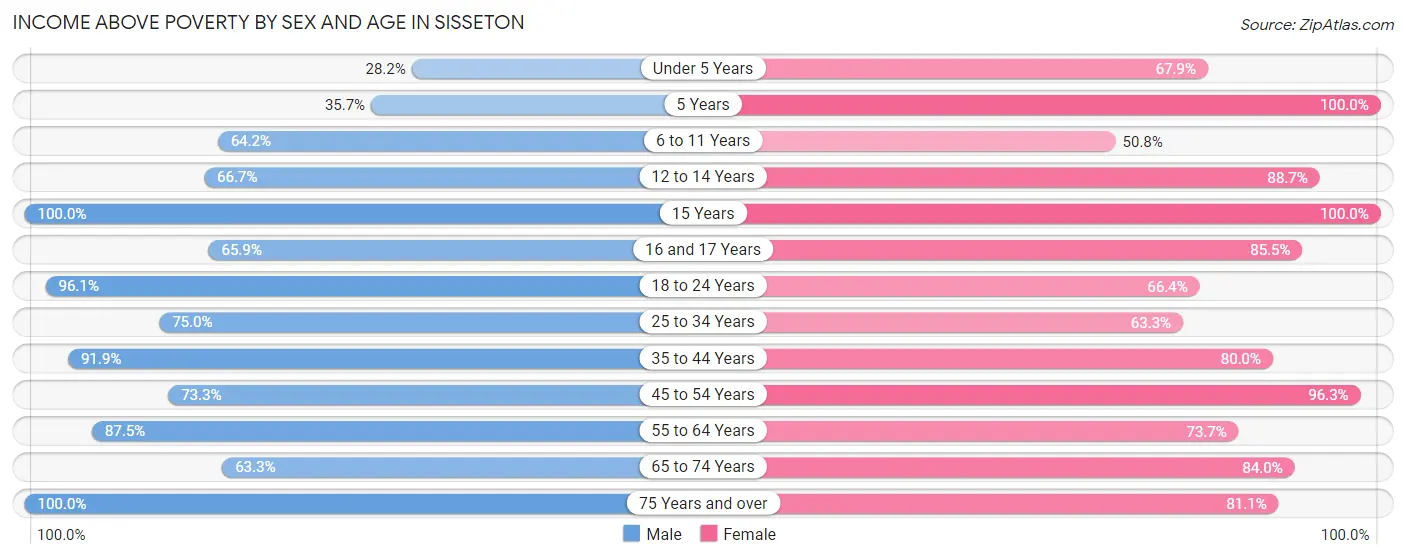
| Age Bracket | Male | Female |
| Under 5 Years | 20 (28.2%) | 108 (67.9%) |
| 5 Years | 10 (35.7%) | 15 (100.0%) |
| 6 to 11 Years | 68 (64.1%) | 62 (50.8%) |
| 12 to 14 Years | 26 (66.7%) | 47 (88.7%) |
| 15 Years | 34 (100.0%) | 9 (100.0%) |
| 16 and 17 Years | 27 (65.8%) | 53 (85.5%) |
| 18 to 24 Years | 148 (96.1%) | 79 (66.4%) |
| 25 to 34 Years | 123 (75.0%) | 88 (63.3%) |
| 35 to 44 Years | 114 (91.9%) | 76 (80.0%) |
| 45 to 54 Years | 77 (73.3%) | 103 (96.3%) |
| 55 to 64 Years | 98 (87.5%) | 109 (73.7%) |
| 65 to 74 Years | 88 (63.3%) | 100 (84.0%) |
| 75 Years and over | 67 (100.0%) | 124 (81.0%) |
| Total | 900 (76.0%) | 973 (74.9%) |
Income Below Poverty Among Married-Couple Families in Sisseton
The poverty statistics for married-couple families in Sisseton show that 19.8% or 62 of the total 313 families live below the poverty line. Families with 3 or 4 children have the highest poverty rate of 80.5%, comprising of 62 families. On the other hand, families with no children have the lowest poverty rate of 0.0%, which includes 0 families.
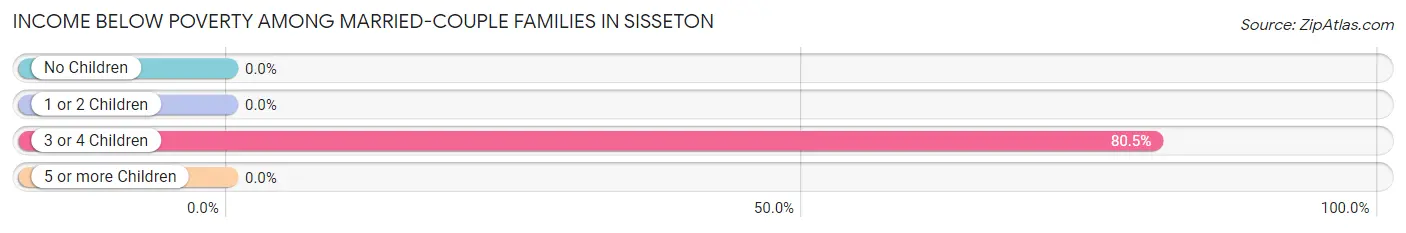
| Children | Above Poverty | Below Poverty |
| No Children | 149 (100.0%) | 0 (0.0%) |
| 1 or 2 Children | 70 (100.0%) | 0 (0.0%) |
| 3 or 4 Children | 15 (19.5%) | 62 (80.5%) |
| 5 or more Children | 17 (100.0%) | 0 (0.0%) |
| Total | 251 (80.2%) | 62 (19.8%) |
Income Below Poverty Among Single-Parent Households in Sisseton
According to the poverty data in Sisseton, 13.4% or 11 single-father households and 30.6% or 48 single-mother households are living below the poverty line. Among single-father households, those with 3 or 4 children have the highest poverty rate, with 7 households (41.2%) experiencing poverty. Likewise, among single-mother households, those with 3 or 4 children have the highest poverty rate, with 14 households (56.0%) falling below the poverty line.
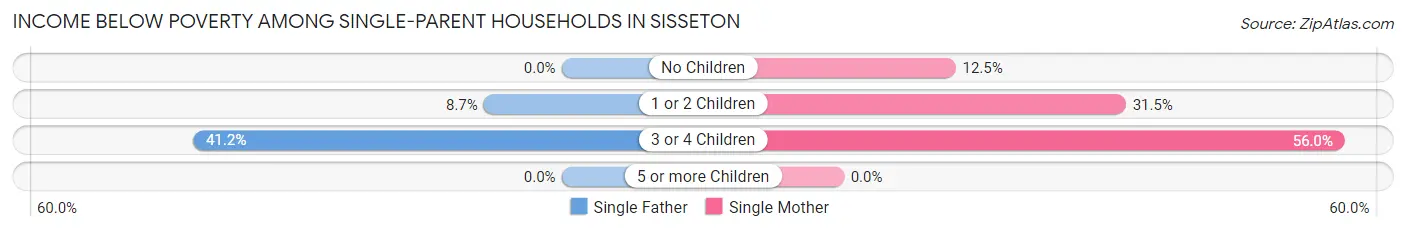
| Children | Single Father | Single Mother |
| No Children | 0 (0.0%) | 5 (12.5%) |
| 1 or 2 Children | 4 (8.7%) | 29 (31.5%) |
| 3 or 4 Children | 7 (41.2%) | 14 (56.0%) |
| 5 or more Children | 0 (0.0%) | 0 (0.0%) |
| Total | 11 (13.4%) | 48 (30.6%) |
Income Below Poverty Among Married-Couple vs Single-Parent Households in Sisseton
The poverty data for Sisseton shows that 62 of the married-couple family households (19.8%) and 59 of the single-parent households (24.7%) are living below the poverty level. Within the married-couple family households, those with 3 or 4 children have the highest poverty rate, with 62 households (80.5%) falling below the poverty line. Among the single-parent households, those with 3 or 4 children have the highest poverty rate, with 21 household (50.0%) living below poverty.
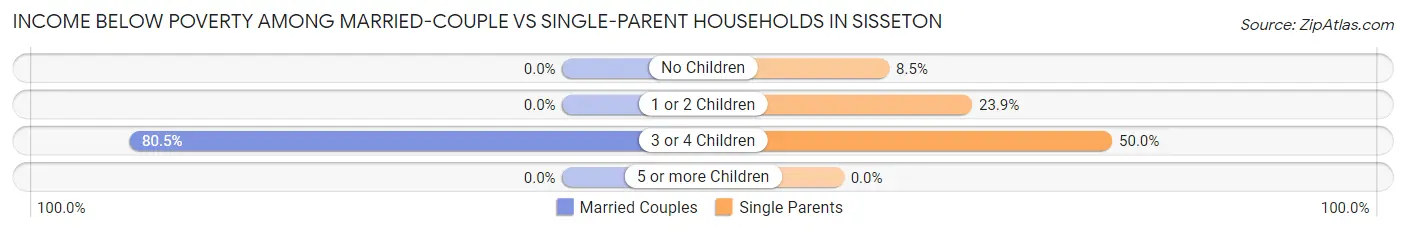
| Children | Married-Couple Families | Single-Parent Households |
| No Children | 0 (0.0%) | 5 (8.5%) |
| 1 or 2 Children | 0 (0.0%) | 33 (23.9%) |
| 3 or 4 Children | 62 (80.5%) | 21 (50.0%) |
| 5 or more Children | 0 (0.0%) | 0 (0.0%) |
| Total | 62 (19.8%) | 59 (24.7%) |
Race in Sisseton
The most populous races in Sisseton are Native / Alaskan (1,408 | 54.9%), White / Caucasian (1,064 | 41.5%), and Two or more Races (60 | 2.3%).
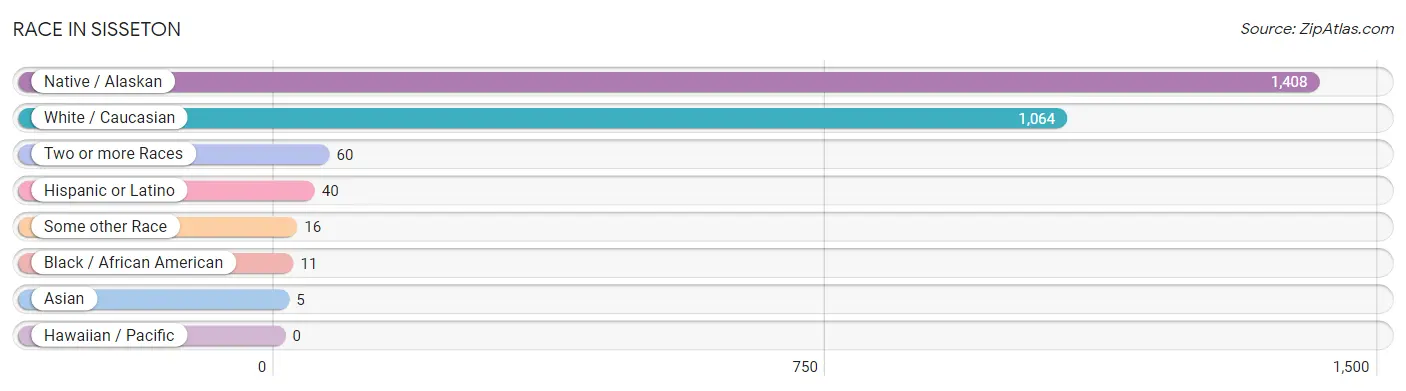
| Race | # Population | % Population |
| Asian | 5 | 0.2% |
| Black / African American | 11 | 0.4% |
| Hawaiian / Pacific | 0 | 0.0% |
| Hispanic or Latino | 40 | 1.6% |
| Native / Alaskan | 1,408 | 54.9% |
| White / Caucasian | 1,064 | 41.5% |
| Two or more Races | 60 | 2.3% |
| Some other Race | 16 | 0.6% |
| Total | 2,564 | 100.0% |
Ancestry in Sisseton
The most populous ancestries reported in Sisseton are Sioux (1,266 | 49.4%), German (446 | 17.4%), Norwegian (348 | 13.6%), Swedish (77 | 3.0%), and Irish (76 | 3.0%), together accounting for 86.3% of all Sisseton residents.
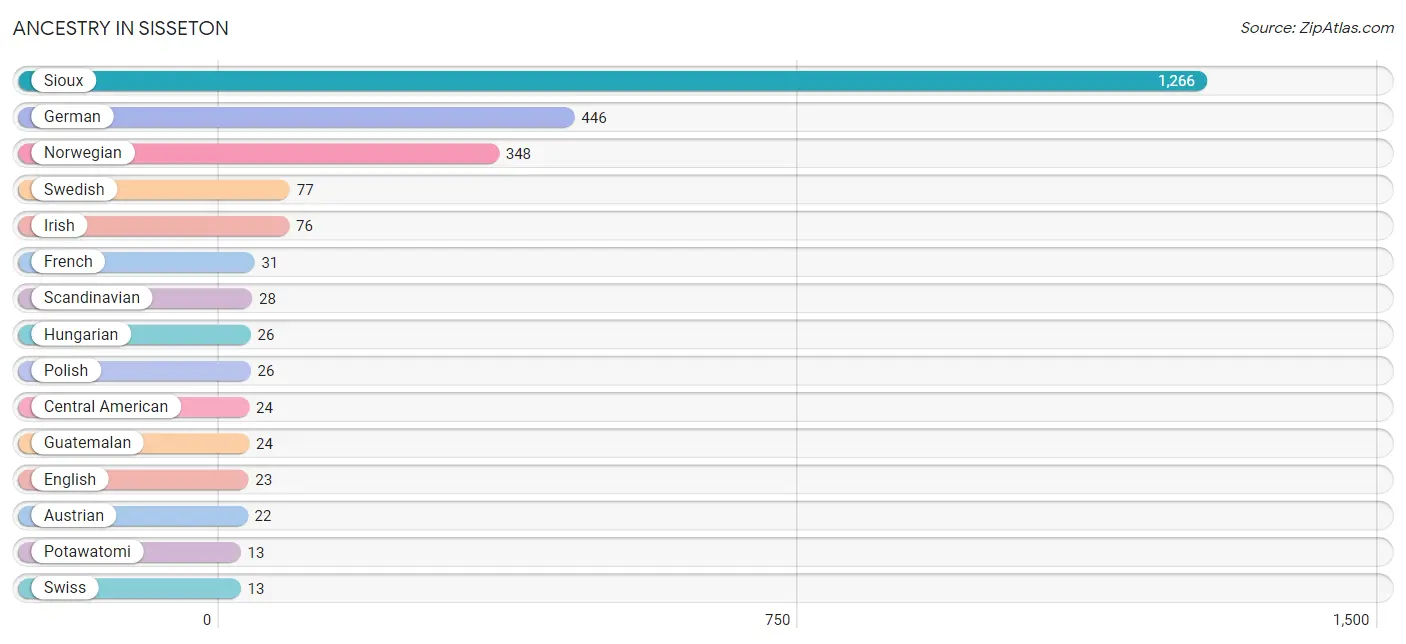
| Ancestry | # Population | % Population |
| American | 8 | 0.3% |
| Austrian | 22 | 0.9% |
| Burmese | 5 | 0.2% |
| Carpatho Rusyn | 11 | 0.4% |
| Central American | 24 | 0.9% |
| Czech | 10 | 0.4% |
| Dutch | 7 | 0.3% |
| English | 23 | 0.9% |
| European | 3 | 0.1% |
| French | 31 | 1.2% |
| French Canadian | 4 | 0.2% |
| German | 446 | 17.4% |
| Greek | 6 | 0.2% |
| Guatemalan | 24 | 0.9% |
| Hungarian | 26 | 1.0% |
| Irish | 76 | 3.0% |
| Korean | 5 | 0.2% |
| Mexican | 5 | 0.2% |
| Norwegian | 348 | 13.6% |
| Polish | 26 | 1.0% |
| Potawatomi | 13 | 0.5% |
| Puerto Rican | 11 | 0.4% |
| Russian | 10 | 0.4% |
| Scandinavian | 28 | 1.1% |
| Sioux | 1,266 | 49.4% |
| Swedish | 77 | 3.0% |
| Swiss | 13 | 0.5% | View All 27 Rows |
Immigrants in Sisseton
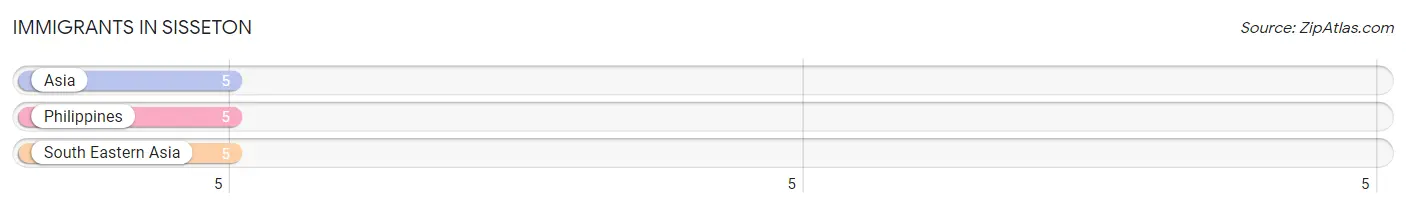
The most numerous immigrant groups reported in Sisseton came from Asia (5 | 0.2%), Philippines (5 | 0.2%), and South Eastern Asia (5 | 0.2%), together accounting for 0.6% of all Sisseton residents.
| Immigration Origin | # Population | % Population |
| Asia | 5 | 0.2% |
| Philippines | 5 | 0.2% |
| South Eastern Asia | 5 | 0.2% | View All 3 Rows |
Sex and Age in Sisseton
Sex and Age in Sisseton
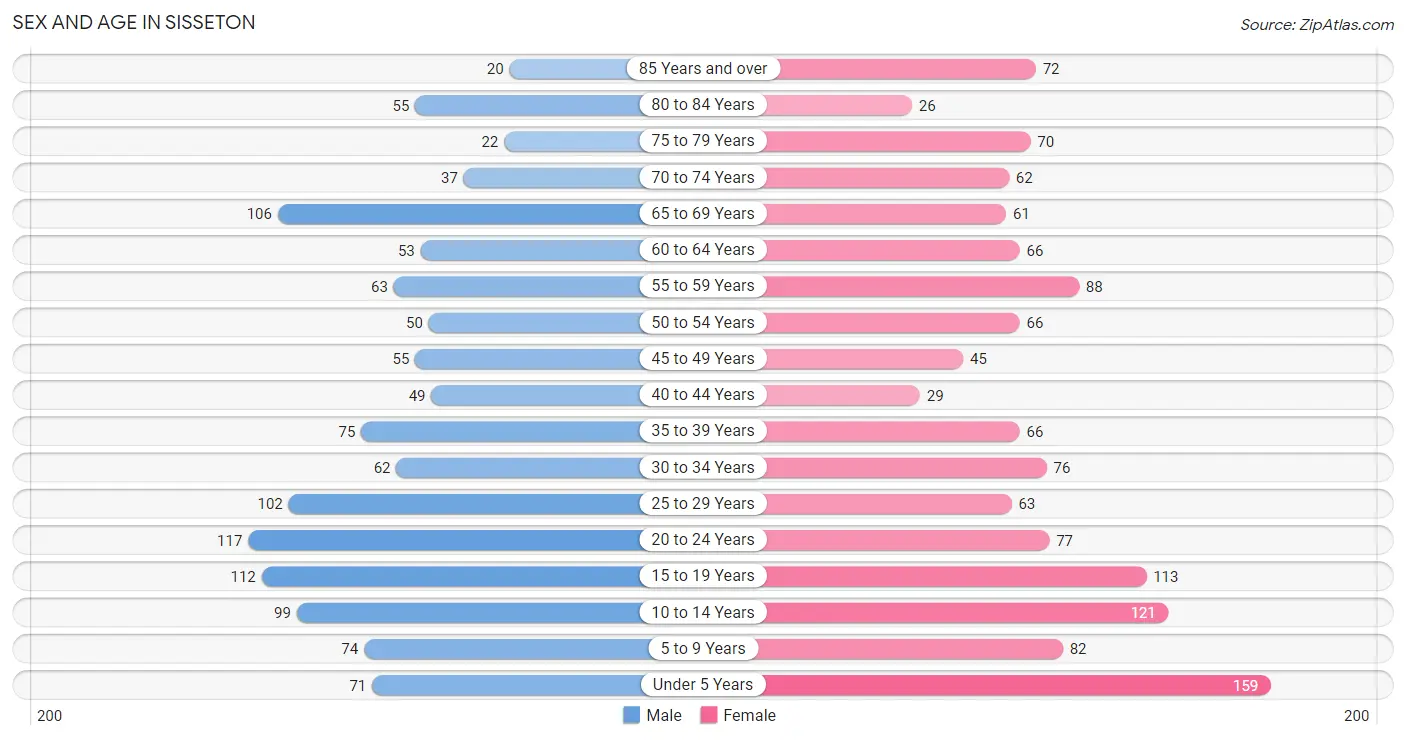
The most populous age groups in Sisseton are 20 to 24 Years (117 | 9.6%) for men and Under 5 Years (159 | 11.8%) for women.
| Age Bracket | Male | Female |
| Under 5 Years | 71 (5.8%) | 159 (11.8%) |
| 5 to 9 Years | 74 (6.1%) | 82 (6.1%) |
| 10 to 14 Years | 99 (8.1%) | 121 (9.0%) |
| 15 to 19 Years | 112 (9.2%) | 113 (8.4%) |
| 20 to 24 Years | 117 (9.6%) | 77 (5.7%) |
| 25 to 29 Years | 102 (8.4%) | 63 (4.7%) |
| 30 to 34 Years | 62 (5.1%) | 76 (5.7%) |
| 35 to 39 Years | 75 (6.1%) | 66 (4.9%) |
| 40 to 44 Years | 49 (4.0%) | 29 (2.2%) |
| 45 to 49 Years | 55 (4.5%) | 45 (3.4%) |
| 50 to 54 Years | 50 (4.1%) | 66 (4.9%) |
| 55 to 59 Years | 63 (5.2%) | 88 (6.6%) |
| 60 to 64 Years | 53 (4.3%) | 66 (4.9%) |
| 65 to 69 Years | 106 (8.7%) | 61 (4.5%) |
| 70 to 74 Years | 37 (3.0%) | 62 (4.6%) |
| 75 to 79 Years | 22 (1.8%) | 70 (5.2%) |
| 80 to 84 Years | 55 (4.5%) | 26 (1.9%) |
| 85 Years and over | 20 (1.6%) | 72 (5.4%) |
| Total | 1,222 (100.0%) | 1,342 (100.0%) |
Families and Households in Sisseton
Median Family Size in Sisseton
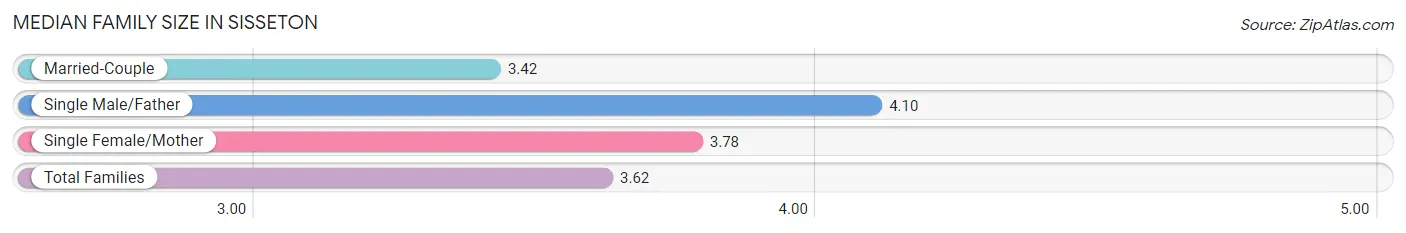
The median family size in Sisseton is 3.62 persons per family, with single male/father families (82 | 14.9%) accounting for the largest median family size of 4.1 persons per family. On the other hand, married-couple families (313 | 56.7%) represent the smallest median family size with 3.42 persons per family.
| Family Type | # Families | Family Size |
| Married-Couple | 313 (56.7%) | 3.42 |
| Single Male/Father | 82 (14.9%) | 4.10 |
| Single Female/Mother | 157 (28.4%) | 3.78 |
| Total Families | 552 (100.0%) | 3.62 |
Median Household Size in Sisseton
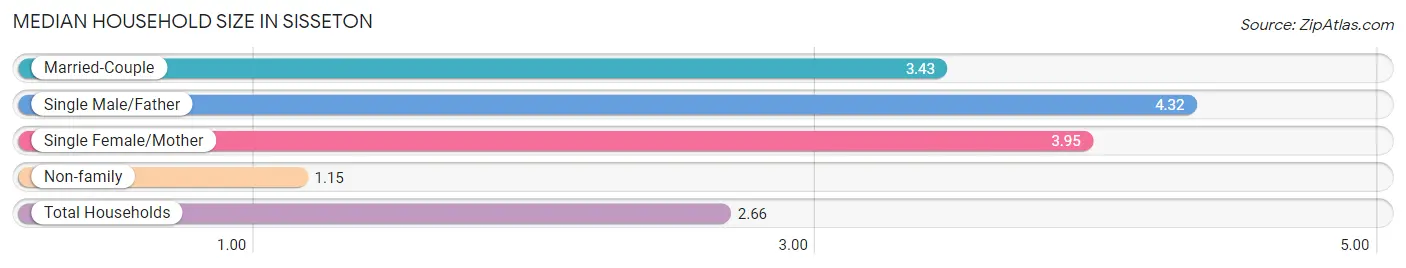
The median household size in Sisseton is 2.66 persons per household, with single male/father households (82 | 8.7%) accounting for the largest median household size of 4.32 persons per household. non-family households (388 | 41.3%) represent the smallest median household size with 1.15 persons per household.
| Household Type | # Households | Household Size |
| Married-Couple | 313 (33.3%) | 3.43 |
| Single Male/Father | 82 (8.7%) | 4.32 |
| Single Female/Mother | 157 (16.7%) | 3.95 |
| Non-family | 388 (41.3%) | 1.15 |
| Total Households | 940 (100.0%) | 2.66 |
Household Size by Marriage Status in Sisseton
Out of a total of 940 households in Sisseton, 552 (58.7%) are family households, while 388 (41.3%) are nonfamily households. The most numerous type of family households are 2-person households, comprising 202, and the most common type of nonfamily households are 1-person households, comprising 367.
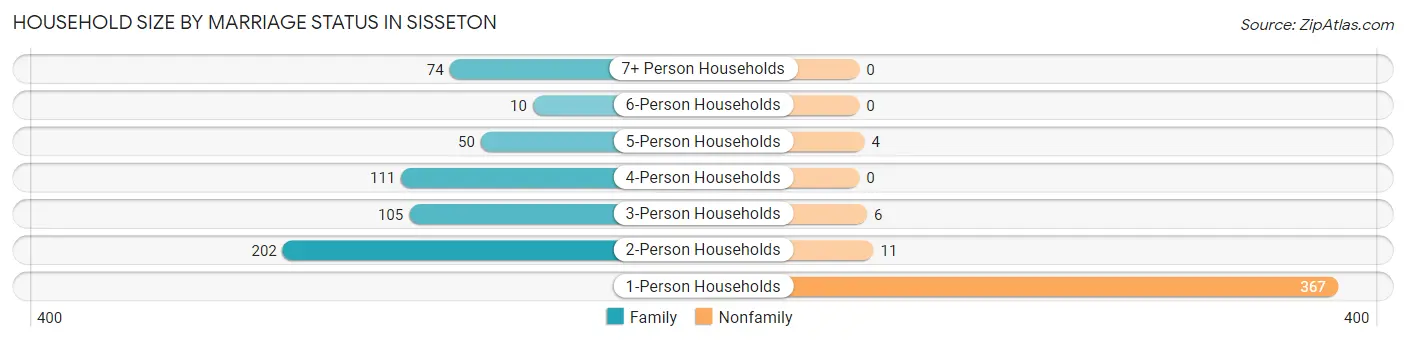
| Household Size | Family Households | Nonfamily Households |
| 1-Person Households | - | 367 (39.0%) |
| 2-Person Households | 202 (21.5%) | 11 (1.2%) |
| 3-Person Households | 105 (11.2%) | 6 (0.6%) |
| 4-Person Households | 111 (11.8%) | 0 (0.0%) |
| 5-Person Households | 50 (5.3%) | 4 (0.4%) |
| 6-Person Households | 10 (1.1%) | 0 (0.0%) |
| 7+ Person Households | 74 (7.9%) | 0 (0.0%) |
| Total | 552 (58.7%) | 388 (41.3%) |
Female Fertility in Sisseton
Fertility by Age in Sisseton
Average fertility rate in Sisseton is 54.0 births per 1,000 women. Women in the age bracket of 35 to 50 years have the highest fertility rate with 94.0 births per 1,000 women. Women in the age bracket of 35 to 50 years acount for 53.8% of all women with births.
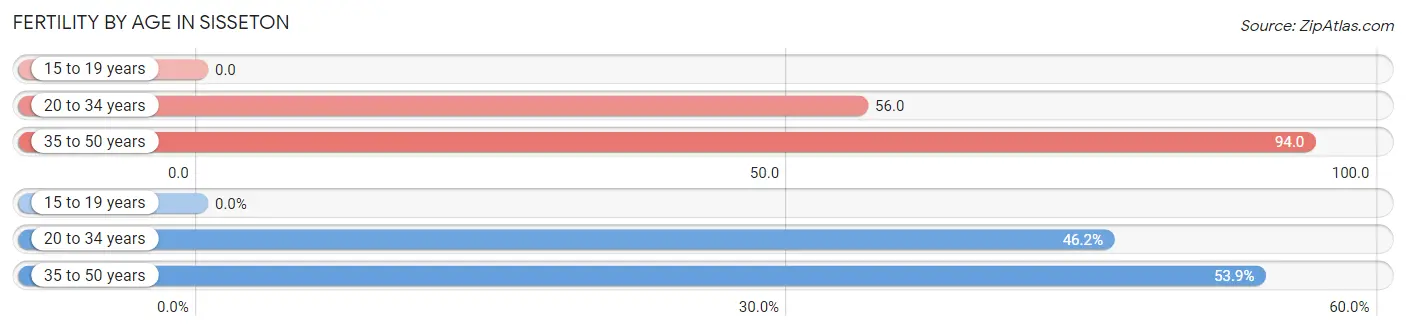
| Age Bracket | Women with Births | Births / 1,000 Women |
| 15 to 19 years | 0 (0.0%) | 0.0 |
| 20 to 34 years | 12 (46.2%) | 56.0 |
| 35 to 50 years | 14 (53.8%) | 94.0 |
| Total | 26 (100.0%) | 54.0 |
Fertility by Age by Marriage Status in Sisseton
53.8% of women with births (26) in Sisseton are married. The highest percentage of unmarried women with births falls into 35 to 50 years age bracket with 50.0% of them unmarried at the time of birth, while the lowest percentage of unmarried women with births belong to 20 to 34 years age bracket with 41.7% of them unmarried.
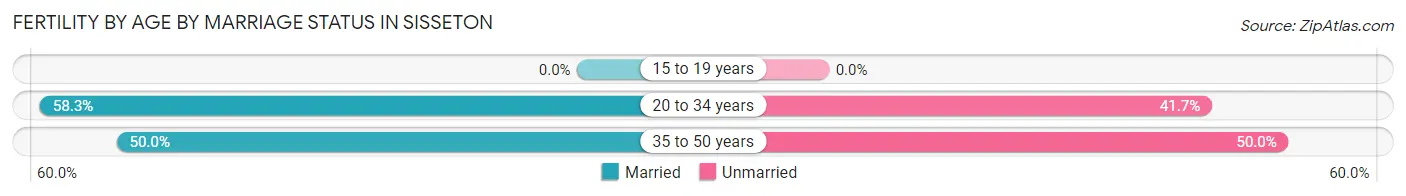
| Age Bracket | Married | Unmarried |
| 15 to 19 years | 0 (0.0%) | 0 (0.0%) |
| 20 to 34 years | 7 (58.3%) | 5 (41.7%) |
| 35 to 50 years | 7 (50.0%) | 7 (50.0%) |
| Total | 14 (53.8%) | 12 (46.2%) |
Fertility by Education in Sisseton
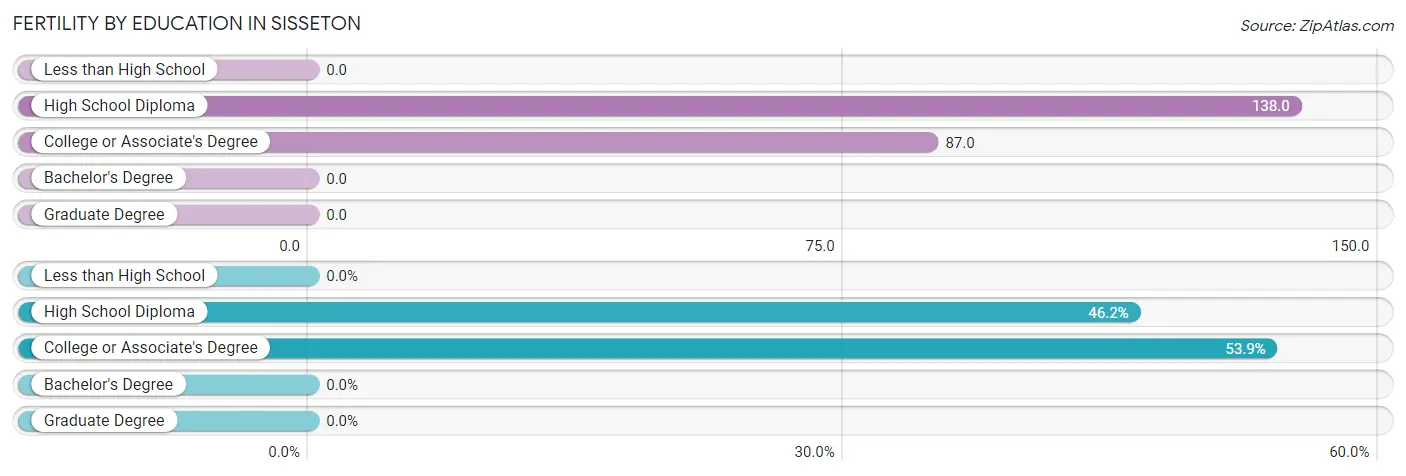
| Educational Attainment | Women with Births | Births / 1,000 Women |
| Less than High School | 0 (0.0%) | 0.0 |
| High School Diploma | 12 (46.2%) | 138.0 |
| College or Associate's Degree | 14 (53.8%) | 87.0 |
| Bachelor's Degree | 0 (0.0%) | 0.0 |
| Graduate Degree | 0 (0.0%) | 0.0 |
| Total | 26 (100.0%) | 54.0 |
Fertility by Education by Marriage Status in Sisseton
46.2% of women with births in Sisseton are unmarried. Women with the educational attainment of high school diploma are most likely to be married with 58.3% of them married at childbirth, while women with the educational attainment of college or associate's degree are least likely to be married with 50.0% of them unmarried at childbirth.
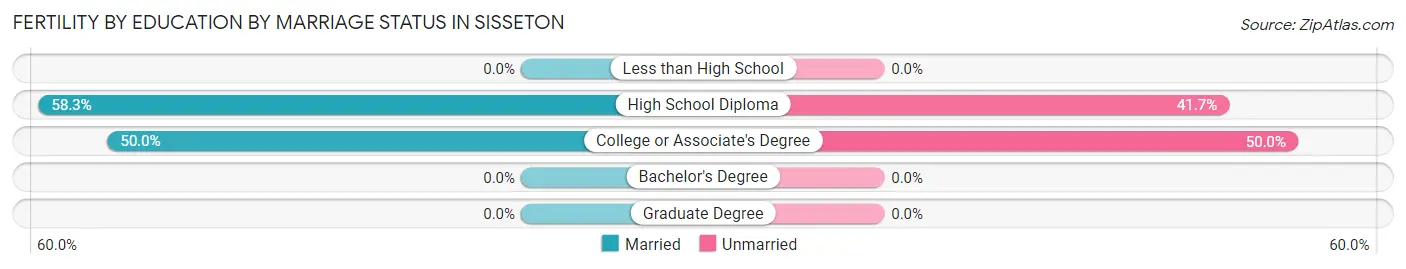
| Educational Attainment | Married | Unmarried |
| Less than High School | 0 (0.0%) | 0 (0.0%) |
| High School Diploma | 7 (58.3%) | 5 (41.7%) |
| College or Associate's Degree | 7 (50.0%) | 7 (50.0%) |
| Bachelor's Degree | 0 (0.0%) | 0 (0.0%) |
| Graduate Degree | 0 (0.0%) | 0 (0.0%) |
| Total | 14 (53.8%) | 12 (46.2%) |
Employment Characteristics in Sisseton
Employment by Class of Employer in Sisseton
Among the 982 employed individuals in Sisseton, private company employees (556 | 56.6%), local government employees (166 | 16.9%), and not-for-profit organizations (98 | 10.0%) make up the most common classes of employment.
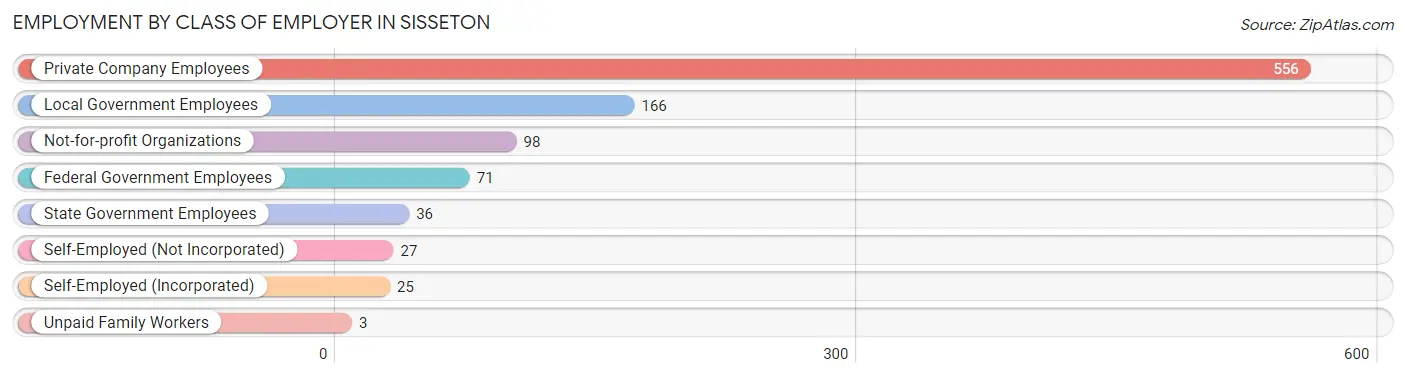
| Employer Class | # Employees | % Employees |
| Private Company Employees | 556 | 56.6% |
| Self-Employed (Incorporated) | 25 | 2.5% |
| Self-Employed (Not Incorporated) | 27 | 2.8% |
| Not-for-profit Organizations | 98 | 10.0% |
| Local Government Employees | 166 | 16.9% |
| State Government Employees | 36 | 3.7% |
| Federal Government Employees | 71 | 7.2% |
| Unpaid Family Workers | 3 | 0.3% |
| Total | 982 | 100.0% |
Employment Status by Age in Sisseton
According to the labor force statistics for Sisseton, out of the total population over 16 years of age (1,915), 58.4% or 1,118 individuals are in the labor force, with 7.2% or 80 of them unemployed. The age group with the highest labor force participation rate is 25 to 29 years, with 95.8% or 158 individuals in the labor force. Within the labor force, the 25 to 29 years age range has the highest percentage of unemployed individuals, with 17.7% or 28 of them being unemployed.
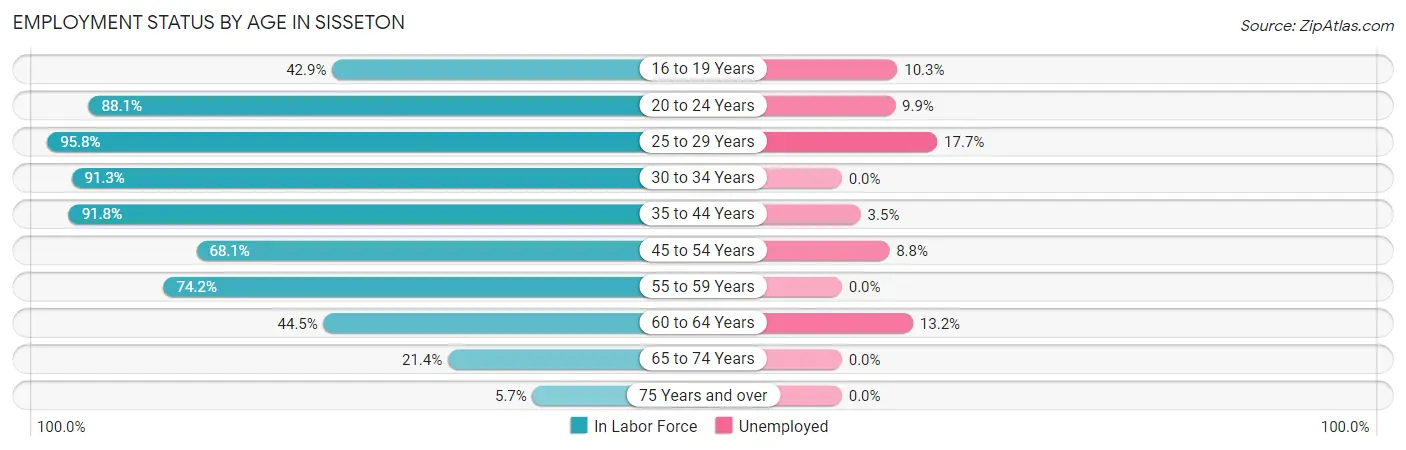
| Age Bracket | In Labor Force | Unemployed |
| 16 to 19 Years | 78 (42.9%) | 8 (10.3%) |
| 20 to 24 Years | 171 (88.1%) | 17 (9.9%) |
| 25 to 29 Years | 158 (95.8%) | 28 (17.7%) |
| 30 to 34 Years | 126 (91.3%) | 0 (0.0%) |
| 35 to 44 Years | 201 (91.8%) | 7 (3.5%) |
| 45 to 54 Years | 147 (68.1%) | 13 (8.8%) |
| 55 to 59 Years | 112 (74.2%) | 0 (0.0%) |
| 60 to 64 Years | 53 (44.5%) | 7 (13.2%) |
| 65 to 74 Years | 57 (21.4%) | 0 (0.0%) |
| 75 Years and over | 15 (5.7%) | 0 (0.0%) |
| Total | 1,118 (58.4%) | 80 (7.2%) |
Employment Status by Educational Attainment in Sisseton
According to labor force statistics for Sisseton, 79.1% of individuals (797) out of the total population between 25 and 64 years of age (1,008) are in the labor force, with 6.9% or 55 of them being unemployed. The group with the highest labor force participation rate are those with the educational attainment of college / associate degree, with 92.7% or 305 individuals in the labor force. Within the labor force, individuals with less than high school education have the highest percentage of unemployment, with 12.0% or 10 of them being unemployed.
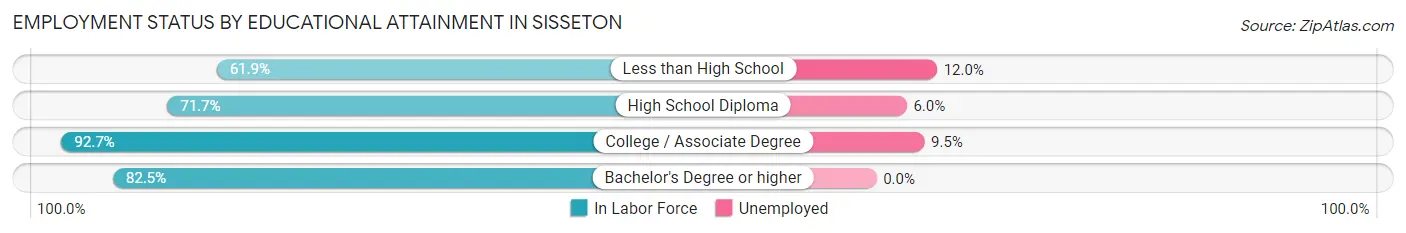
| Educational Attainment | In Labor Force | Unemployed |
| Less than High School | 83 (61.9%) | 16 (12.0%) |
| High School Diploma | 268 (71.7%) | 22 (6.0%) |
| College / Associate Degree | 305 (92.7%) | 31 (9.5%) |
| Bachelor's Degree or higher | 141 (82.5%) | 0 (0.0%) |
| Total | 797 (79.1%) | 70 (6.9%) |
Employment Occupations by Sex in Sisseton
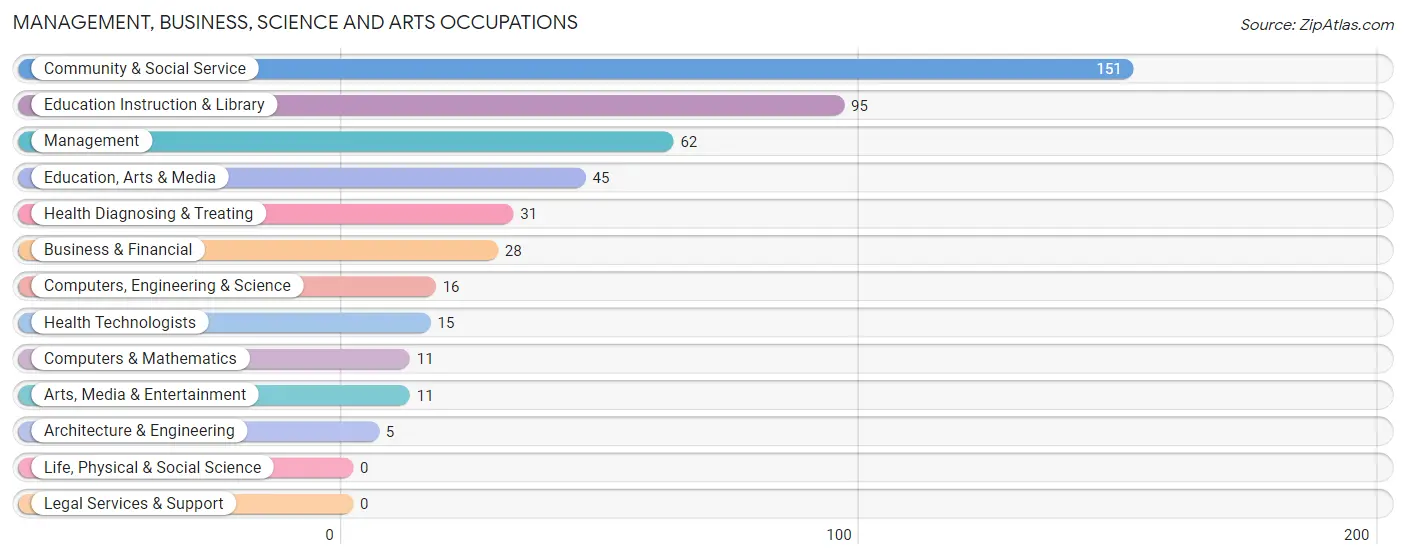
Management, Business, Science and Arts Occupations
The most common Management, Business, Science and Arts occupations in Sisseton are Community & Social Service (151 | 14.5%), Education Instruction & Library (95 | 9.1%), Management (62 | 6.0%), Education, Arts & Media (45 | 4.3%), and Health Diagnosing & Treating (31 | 3.0%).
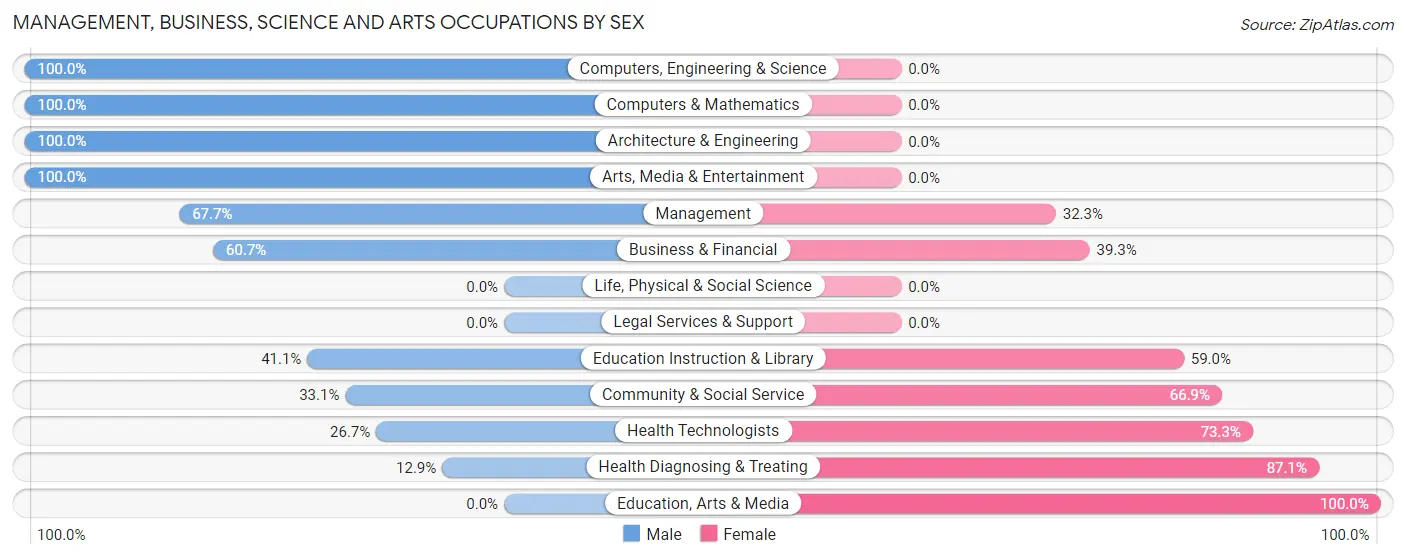
Management, Business, Science and Arts Occupations by Sex
Within the Management, Business, Science and Arts occupations in Sisseton, the most male-oriented occupations are Computers, Engineering & Science (100.0%), Computers & Mathematics (100.0%), and Architecture & Engineering (100.0%), while the most female-oriented occupations are Education, Arts & Media (100.0%), Health Diagnosing & Treating (87.1%), and Health Technologists (73.3%).
| Occupation | Male | Female |
| Management | 42 (67.7%) | 20 (32.3%) |
| Business & Financial | 17 (60.7%) | 11 (39.3%) |
| Computers, Engineering & Science | 16 (100.0%) | 0 (0.0%) |
| Computers & Mathematics | 11 (100.0%) | 0 (0.0%) |
| Architecture & Engineering | 5 (100.0%) | 0 (0.0%) |
| Life, Physical & Social Science | 0 (0.0%) | 0 (0.0%) |
| Community & Social Service | 50 (33.1%) | 101 (66.9%) |
| Education, Arts & Media | 0 (0.0%) | 45 (100.0%) |
| Legal Services & Support | 0 (0.0%) | 0 (0.0%) |
| Education Instruction & Library | 39 (41.0%) | 56 (59.0%) |
| Arts, Media & Entertainment | 11 (100.0%) | 0 (0.0%) |
| Health Diagnosing & Treating | 4 (12.9%) | 27 (87.1%) |
| Health Technologists | 4 (26.7%) | 11 (73.3%) |
| Total (Category) | 129 (44.8%) | 159 (55.2%) |
| Total (Overall) | 563 (54.2%) | 475 (45.8%) |
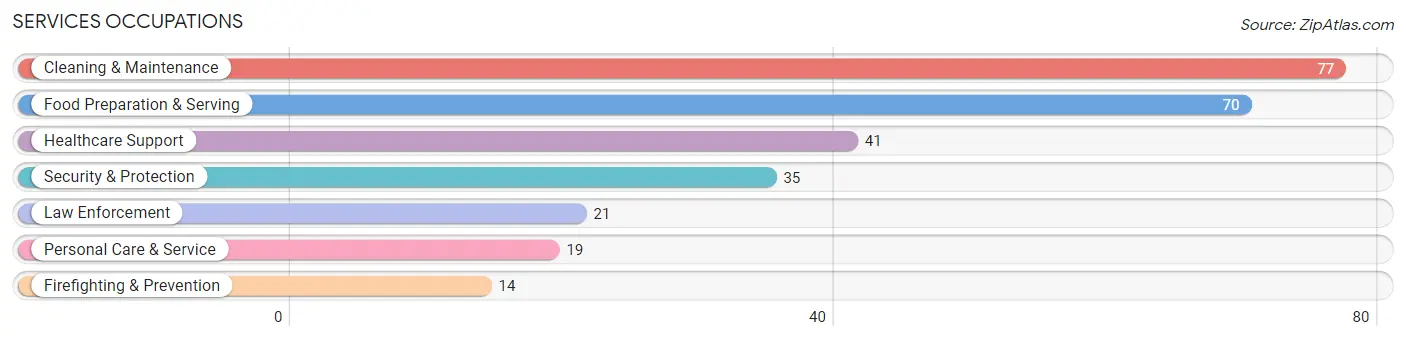
Services Occupations
The most common Services occupations in Sisseton are Cleaning & Maintenance (77 | 7.4%), Food Preparation & Serving (70 | 6.7%), Healthcare Support (41 | 4.0%), Security & Protection (35 | 3.4%), and Law Enforcement (21 | 2.0%).
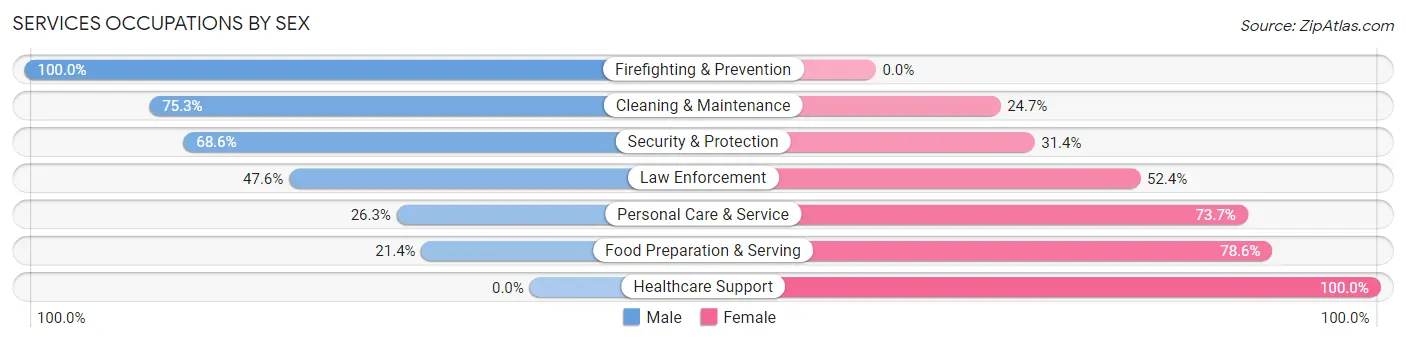
Services Occupations by Sex
Within the Services occupations in Sisseton, the most male-oriented occupations are Firefighting & Prevention (100.0%), Cleaning & Maintenance (75.3%), and Security & Protection (68.6%), while the most female-oriented occupations are Healthcare Support (100.0%), Food Preparation & Serving (78.6%), and Personal Care & Service (73.7%).
| Occupation | Male | Female |
| Healthcare Support | 0 (0.0%) | 41 (100.0%) |
| Security & Protection | 24 (68.6%) | 11 (31.4%) |
| Firefighting & Prevention | 14 (100.0%) | 0 (0.0%) |
| Law Enforcement | 10 (47.6%) | 11 (52.4%) |
| Food Preparation & Serving | 15 (21.4%) | 55 (78.6%) |
| Cleaning & Maintenance | 58 (75.3%) | 19 (24.7%) |
| Personal Care & Service | 5 (26.3%) | 14 (73.7%) |
| Total (Category) | 102 (42.1%) | 140 (57.9%) |
| Total (Overall) | 563 (54.2%) | 475 (45.8%) |
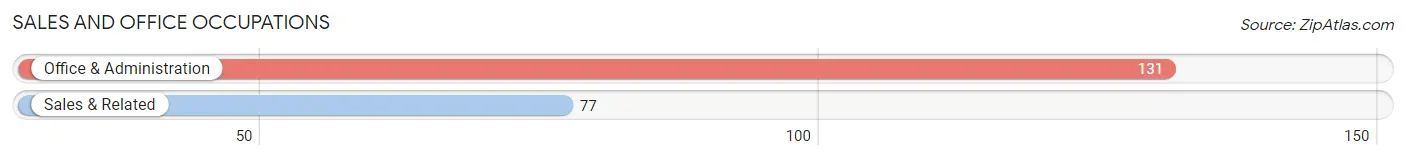
Sales and Office Occupations
The most common Sales and Office occupations in Sisseton are Office & Administration (131 | 12.6%), and Sales & Related (77 | 7.4%).
Sales and Office Occupations by Sex
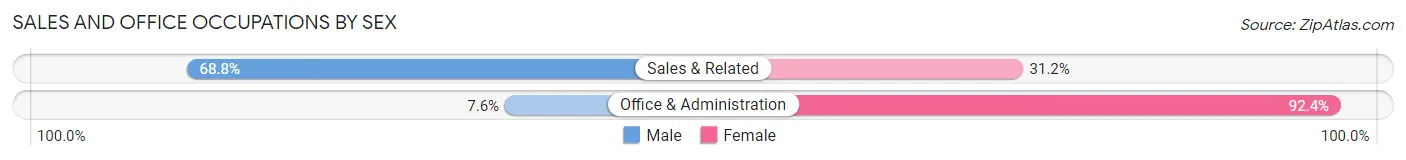
| Occupation | Male | Female |
| Sales & Related | 53 (68.8%) | 24 (31.2%) |
| Office & Administration | 10 (7.6%) | 121 (92.4%) |
| Total (Category) | 63 (30.3%) | 145 (69.7%) |
| Total (Overall) | 563 (54.2%) | 475 (45.8%) |
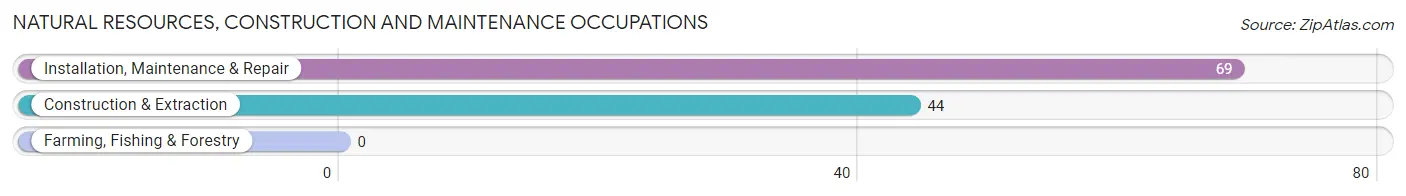
Natural Resources, Construction and Maintenance Occupations
The most common Natural Resources, Construction and Maintenance occupations in Sisseton are Installation, Maintenance & Repair (69 | 6.7%), and Construction & Extraction (44 | 4.2%).
Natural Resources, Construction and Maintenance Occupations by Sex
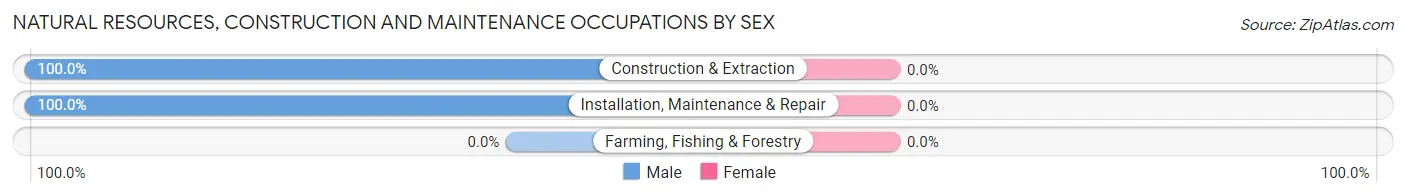
| Occupation | Male | Female |
| Farming, Fishing & Forestry | 0 (0.0%) | 0 (0.0%) |
| Construction & Extraction | 44 (100.0%) | 0 (0.0%) |
| Installation, Maintenance & Repair | 69 (100.0%) | 0 (0.0%) |
| Total (Category) | 113 (100.0%) | 0 (0.0%) |
| Total (Overall) | 563 (54.2%) | 475 (45.8%) |
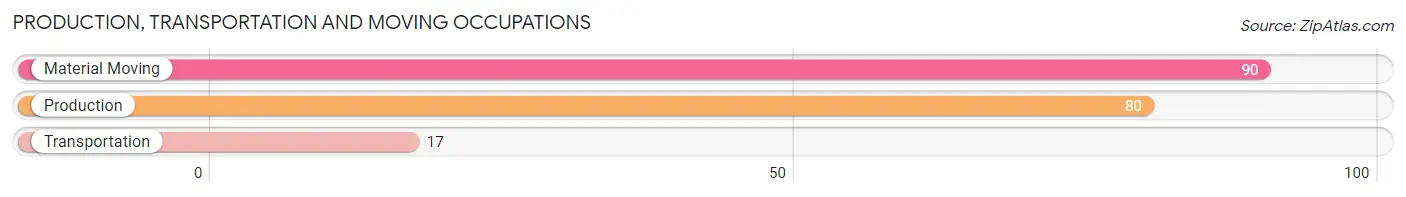
Production, Transportation and Moving Occupations
The most common Production, Transportation and Moving occupations in Sisseton are Material Moving (90 | 8.7%), Production (80 | 7.7%), and Transportation (17 | 1.6%).
Production, Transportation and Moving Occupations by Sex
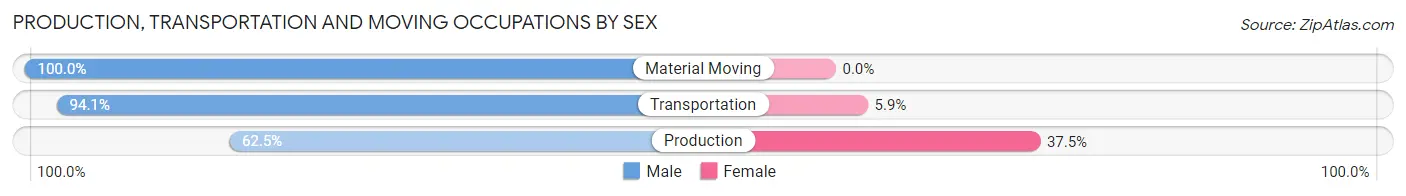
| Occupation | Male | Female |
| Production | 50 (62.5%) | 30 (37.5%) |
| Transportation | 16 (94.1%) | 1 (5.9%) |
| Material Moving | 90 (100.0%) | 0 (0.0%) |
| Total (Category) | 156 (83.4%) | 31 (16.6%) |
| Total (Overall) | 563 (54.2%) | 475 (45.8%) |
Employment Industries by Sex in Sisseton
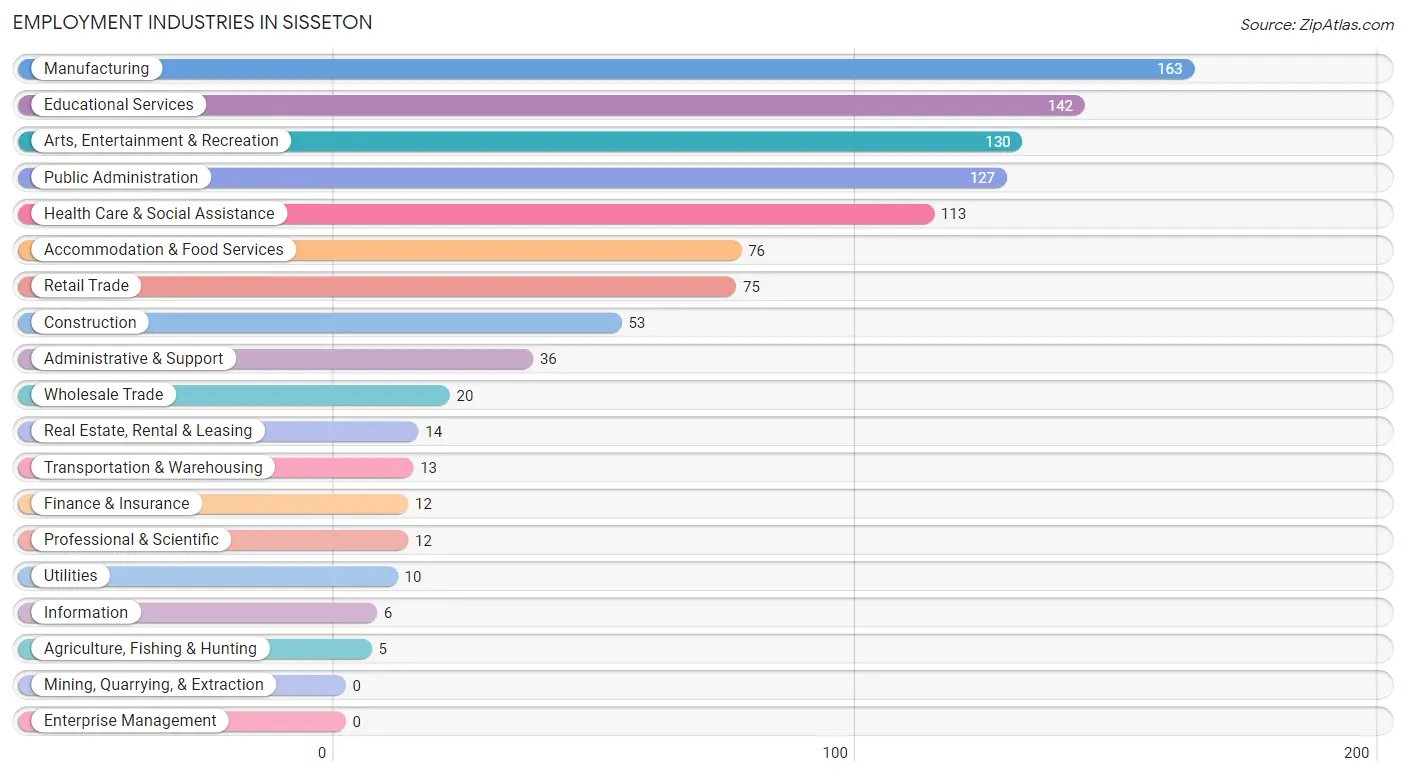
Employment Industries in Sisseton
The major employment industries in Sisseton include Manufacturing (163 | 15.7%), Educational Services (142 | 13.7%), Arts, Entertainment & Recreation (130 | 12.5%), Public Administration (127 | 12.2%), and Health Care & Social Assistance (113 | 10.9%).
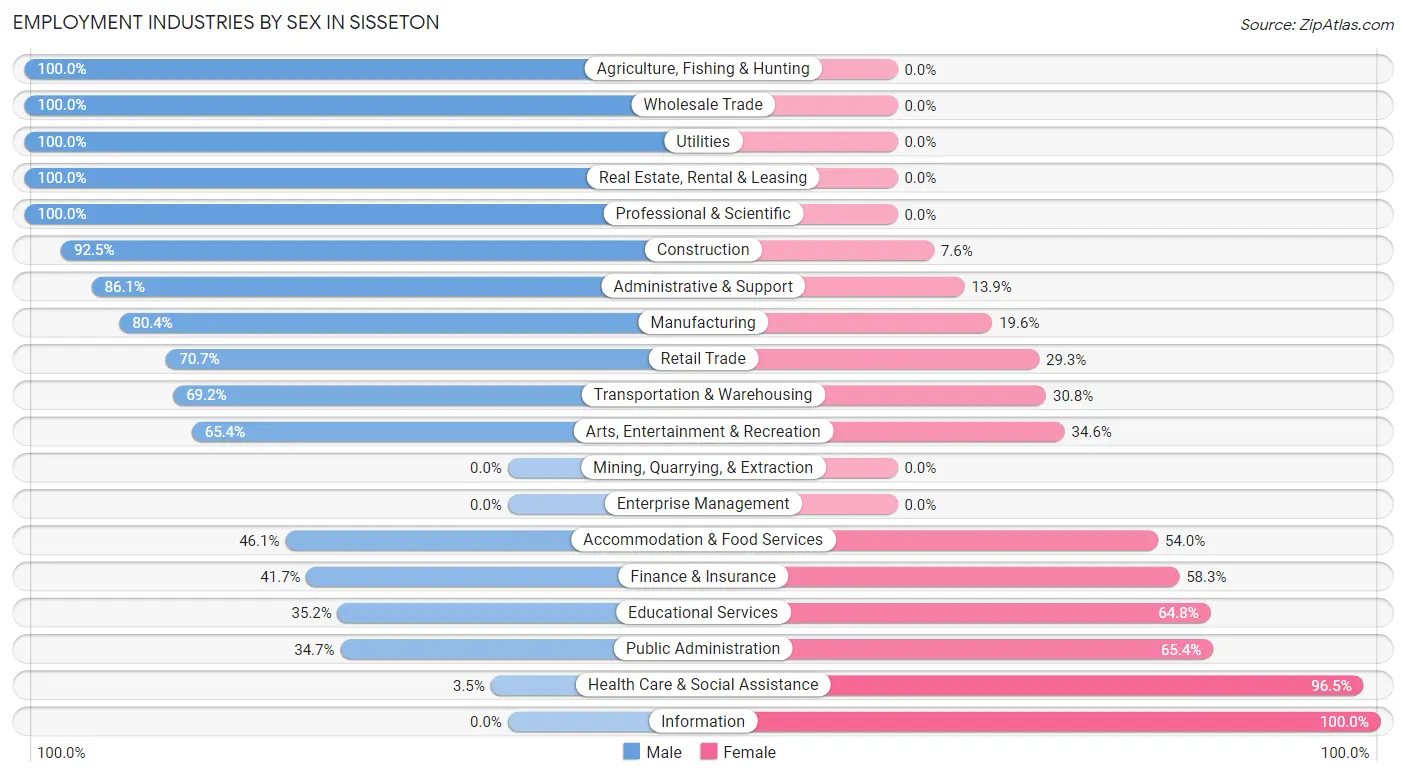
Employment Industries by Sex in Sisseton
The Sisseton industries that see more men than women are Agriculture, Fishing & Hunting (100.0%), Wholesale Trade (100.0%), and Utilities (100.0%), whereas the industries that tend to have a higher number of women are Information (100.0%), Health Care & Social Assistance (96.5%), and Public Administration (65.3%).
| Industry | Male | Female |
| Agriculture, Fishing & Hunting | 5 (100.0%) | 0 (0.0%) |
| Mining, Quarrying, & Extraction | 0 (0.0%) | 0 (0.0%) |
| Construction | 49 (92.4%) | 4 (7.5%) |
| Manufacturing | 131 (80.4%) | 32 (19.6%) |
| Wholesale Trade | 20 (100.0%) | 0 (0.0%) |
| Retail Trade | 53 (70.7%) | 22 (29.3%) |
| Transportation & Warehousing | 9 (69.2%) | 4 (30.8%) |
| Utilities | 10 (100.0%) | 0 (0.0%) |
| Information | 0 (0.0%) | 6 (100.0%) |
| Finance & Insurance | 5 (41.7%) | 7 (58.3%) |
| Real Estate, Rental & Leasing | 14 (100.0%) | 0 (0.0%) |
| Professional & Scientific | 12 (100.0%) | 0 (0.0%) |
| Enterprise Management | 0 (0.0%) | 0 (0.0%) |
| Administrative & Support | 31 (86.1%) | 5 (13.9%) |
| Educational Services | 50 (35.2%) | 92 (64.8%) |
| Health Care & Social Assistance | 4 (3.5%) | 109 (96.5%) |
| Arts, Entertainment & Recreation | 85 (65.4%) | 45 (34.6%) |
| Accommodation & Food Services | 35 (46.1%) | 41 (53.9%) |
| Public Administration | 44 (34.6%) | 83 (65.3%) |
| Total | 563 (54.2%) | 475 (45.8%) |
Education in Sisseton
School Enrollment in Sisseton
The most common levels of schooling among the 635 students in Sisseton are high school (188 | 29.6%), middle school (185 | 29.1%), and elementary school (102 | 16.1%).
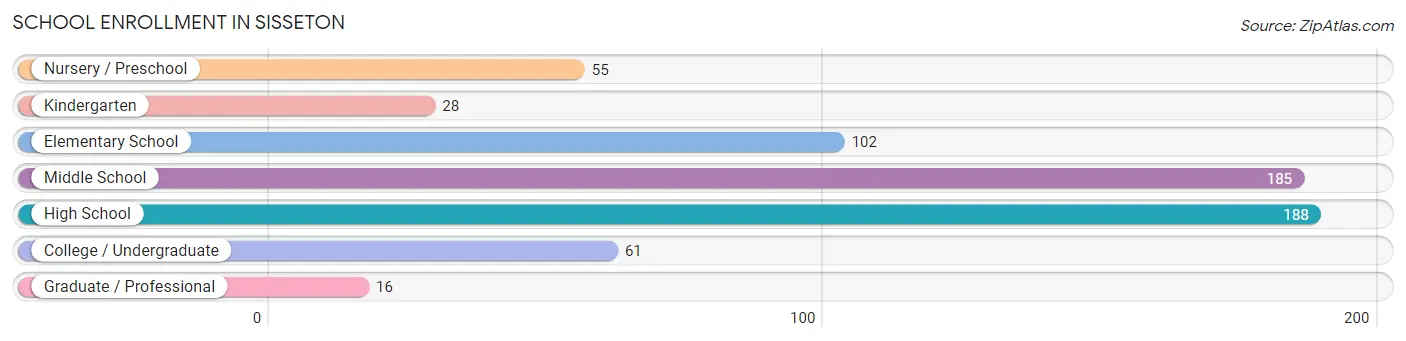
| School Level | # Students | % Students |
| Nursery / Preschool | 55 | 8.7% |
| Kindergarten | 28 | 4.4% |
| Elementary School | 102 | 16.1% |
| Middle School | 185 | 29.1% |
| High School | 188 | 29.6% |
| College / Undergraduate | 61 | 9.6% |
| Graduate / Professional | 16 | 2.5% |
| Total | 635 | 100.0% |
School Enrollment by Age by Funding Source in Sisseton
Out of a total of 635 students who are enrolled in schools in Sisseton, 27 (4.3%) attend a private institution, while the remaining 608 (95.7%) are enrolled in public schools. The age group of 20 to 24 year olds has the highest likelihood of being enrolled in private schools, with 7 (100.0% in the age bracket) enrolled. Conversely, the age group of 3 to 4 year olds has the lowest likelihood of being enrolled in a private school, with 48 (100.0% in the age bracket) attending a public institution.
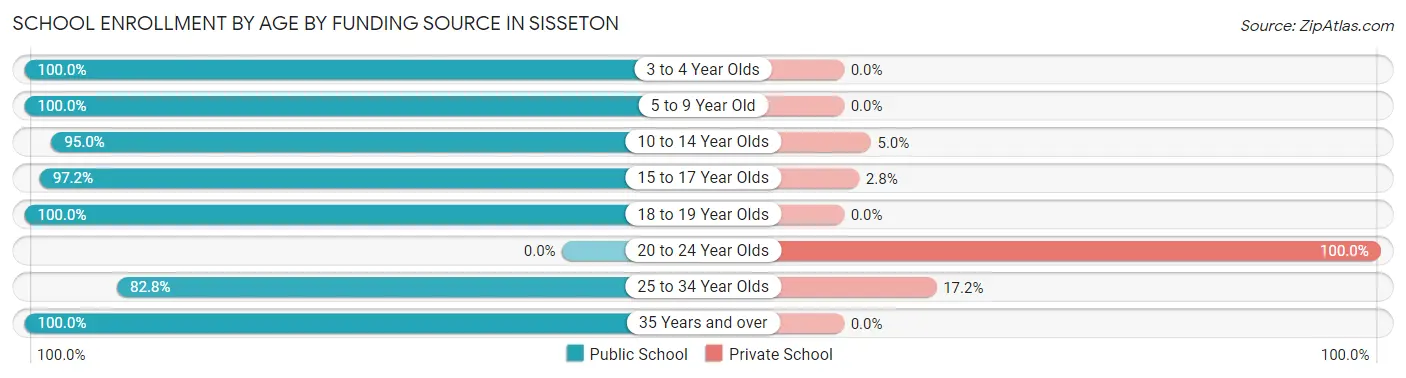
| Age Bracket | Public School | Private School |
| 3 to 4 Year Olds | 48 (100.0%) | 0 (0.0%) |
| 5 to 9 Year Old | 118 (100.0%) | 0 (0.0%) |
| 10 to 14 Year Olds | 209 (95.0%) | 11 (5.0%) |
| 15 to 17 Year Olds | 137 (97.2%) | 4 (2.8%) |
| 18 to 19 Year Olds | 61 (100.0%) | 0 (0.0%) |
| 20 to 24 Year Olds | 0 (0.0%) | 7 (100.0%) |
| 25 to 34 Year Olds | 24 (82.8%) | 5 (17.2%) |
| 35 Years and over | 11 (100.0%) | 0 (0.0%) |
| Total | 608 (95.7%) | 27 (4.3%) |
Educational Attainment by Field of Study in Sisseton
Education (104 | 37.8%), bio, nature & agricultural (31 | 11.3%), business (30 | 10.9%), literature & languages (22 | 8.0%), and visual & performing arts (16 | 5.8%) are the most common fields of study among 275 individuals in Sisseton who have obtained a bachelor's degree or higher.
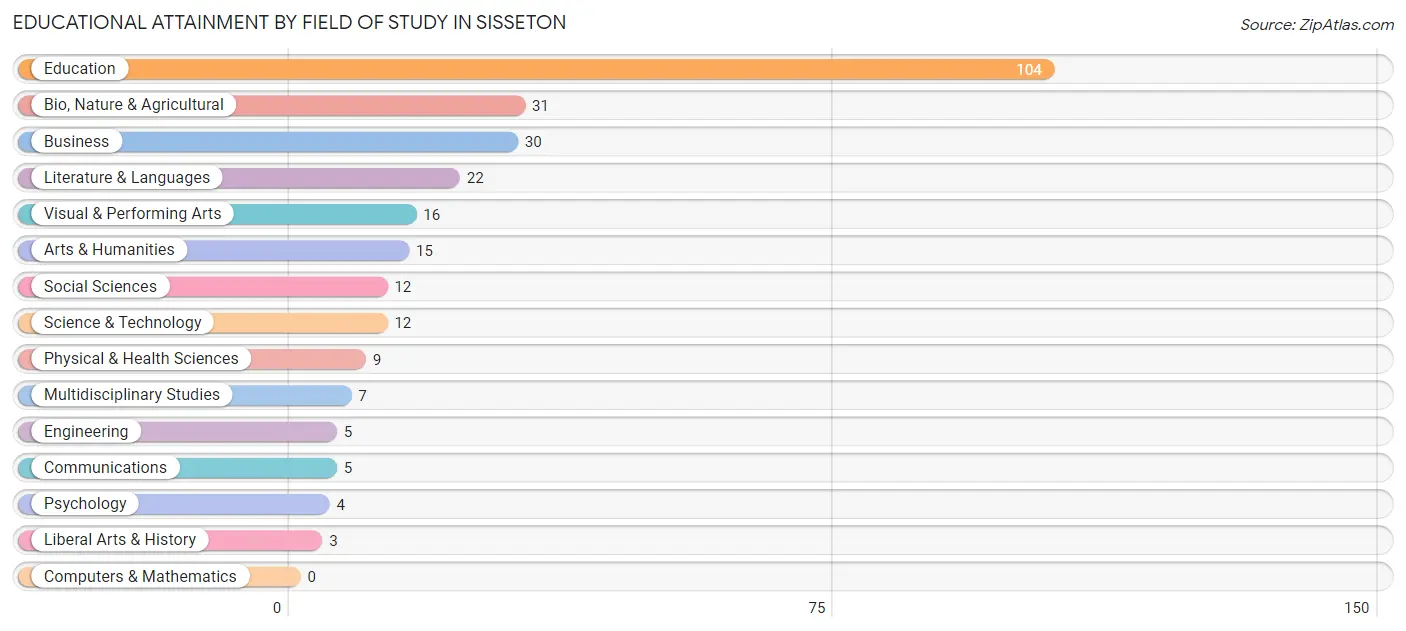
| Field of Study | # Graduates | % Graduates |
| Computers & Mathematics | 0 | 0.0% |
| Bio, Nature & Agricultural | 31 | 11.3% |
| Physical & Health Sciences | 9 | 3.3% |
| Psychology | 4 | 1.5% |
| Social Sciences | 12 | 4.4% |
| Engineering | 5 | 1.8% |
| Multidisciplinary Studies | 7 | 2.5% |
| Science & Technology | 12 | 4.4% |
| Business | 30 | 10.9% |
| Education | 104 | 37.8% |
| Literature & Languages | 22 | 8.0% |
| Liberal Arts & History | 3 | 1.1% |
| Visual & Performing Arts | 16 | 5.8% |
| Communications | 5 | 1.8% |
| Arts & Humanities | 15 | 5.4% |
| Total | 275 | 100.0% |
Transportation & Commute in Sisseton
Vehicle Availability by Sex in Sisseton
The most prevalent vehicle ownership categories in Sisseton are males with 2 vehicles (162, accounting for 30.4%) and females with 2 vehicles (120, making up 36.0%).

| Vehicles Available | Male | Female |
| No Vehicle | 69 (13.0%) | 5 (1.1%) |
| 1 Vehicle | 79 (14.8%) | 150 (33.3%) |
| 2 Vehicles | 162 (30.4%) | 120 (26.7%) |
| 3 Vehicles | 115 (21.6%) | 136 (30.2%) |
| 4 Vehicles | 17 (3.2%) | 14 (3.1%) |
| 5 or more Vehicles | 90 (16.9%) | 25 (5.6%) |
| Total | 532 (100.0%) | 450 (100.0%) |
Commute Time in Sisseton
The most frequently occuring commute durations in Sisseton are 5 to 9 minutes (398 commuters, 42.6%), 10 to 14 minutes (151 commuters, 16.2%), and less than 5 minutes (115 commuters, 12.3%).
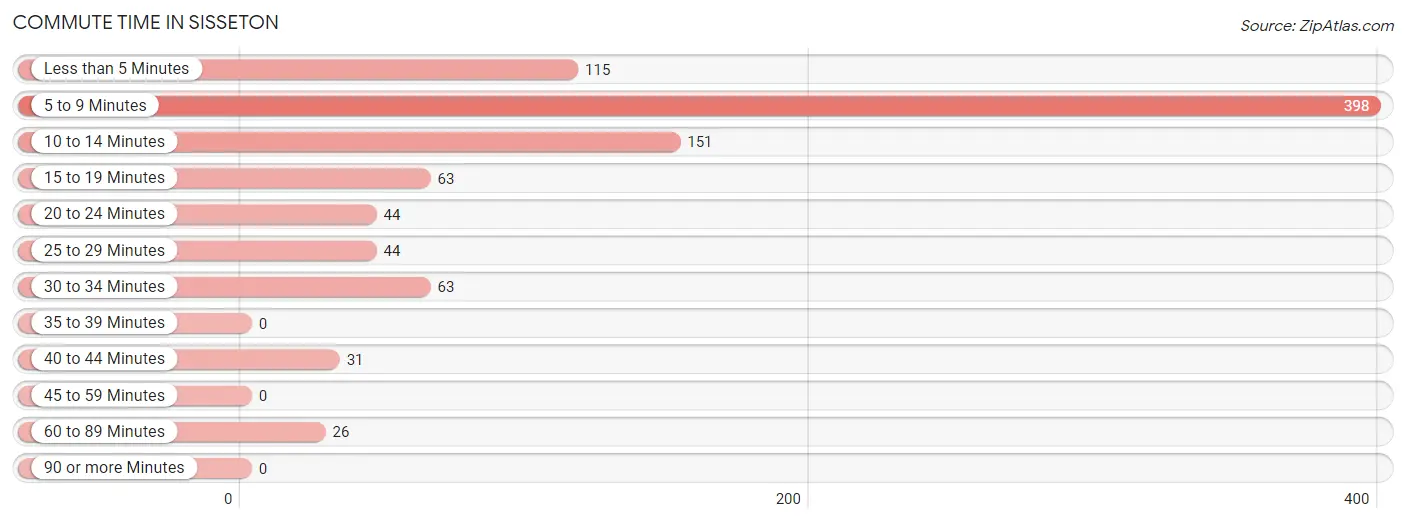
| Commute Time | # Commuters | % Commuters |
| Less than 5 Minutes | 115 | 12.3% |
| 5 to 9 Minutes | 398 | 42.6% |
| 10 to 14 Minutes | 151 | 16.2% |
| 15 to 19 Minutes | 63 | 6.7% |
| 20 to 24 Minutes | 44 | 4.7% |
| 25 to 29 Minutes | 44 | 4.7% |
| 30 to 34 Minutes | 63 | 6.7% |
| 35 to 39 Minutes | 0 | 0.0% |
| 40 to 44 Minutes | 31 | 3.3% |
| 45 to 59 Minutes | 0 | 0.0% |
| 60 to 89 Minutes | 26 | 2.8% |
| 90 or more Minutes | 0 | 0.0% |
Commute Time by Sex in Sisseton
The most common commute times in Sisseton are 5 to 9 minutes (251 commuters, 48.7%) for males and 5 to 9 minutes (147 commuters, 35.0%) for females.
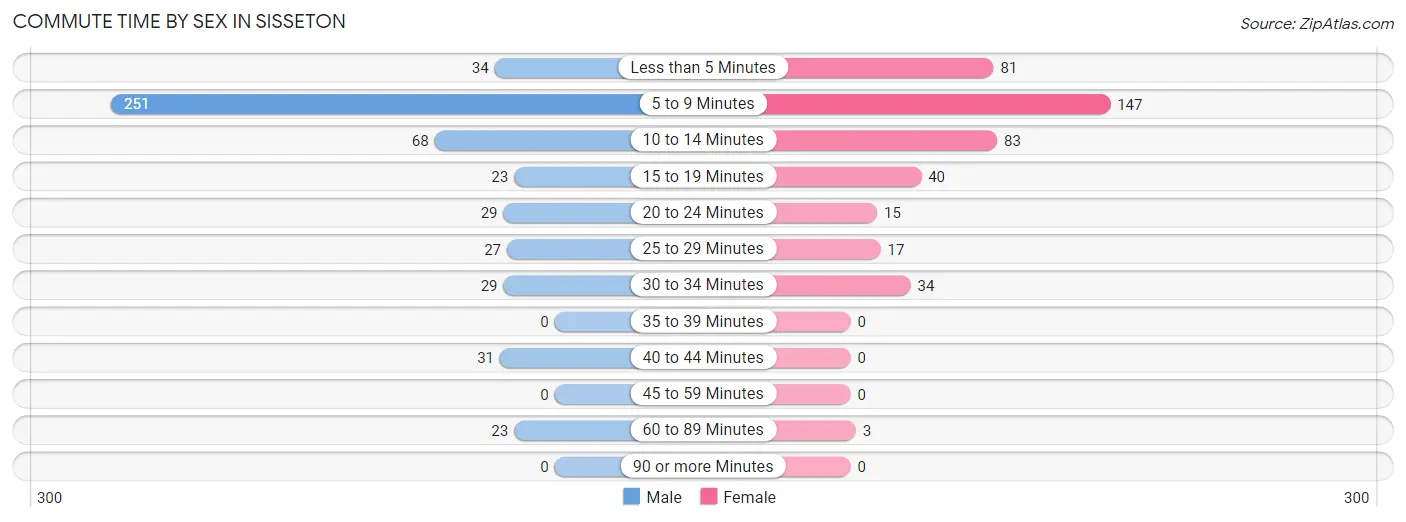
| Commute Time | Male | Female |
| Less than 5 Minutes | 34 (6.6%) | 81 (19.3%) |
| 5 to 9 Minutes | 251 (48.7%) | 147 (35.0%) |
| 10 to 14 Minutes | 68 (13.2%) | 83 (19.8%) |
| 15 to 19 Minutes | 23 (4.5%) | 40 (9.5%) |
| 20 to 24 Minutes | 29 (5.6%) | 15 (3.6%) |
| 25 to 29 Minutes | 27 (5.2%) | 17 (4.1%) |
| 30 to 34 Minutes | 29 (5.6%) | 34 (8.1%) |
| 35 to 39 Minutes | 0 (0.0%) | 0 (0.0%) |
| 40 to 44 Minutes | 31 (6.0%) | 0 (0.0%) |
| 45 to 59 Minutes | 0 (0.0%) | 0 (0.0%) |
| 60 to 89 Minutes | 23 (4.5%) | 3 (0.7%) |
| 90 or more Minutes | 0 (0.0%) | 0 (0.0%) |
Time of Departure to Work by Sex in Sisseton
The most frequent times of departure to work in Sisseton are 7:30 AM to 7:59 AM (120, 23.3%) for males and 7:30 AM to 7:59 AM (158, 37.6%) for females.
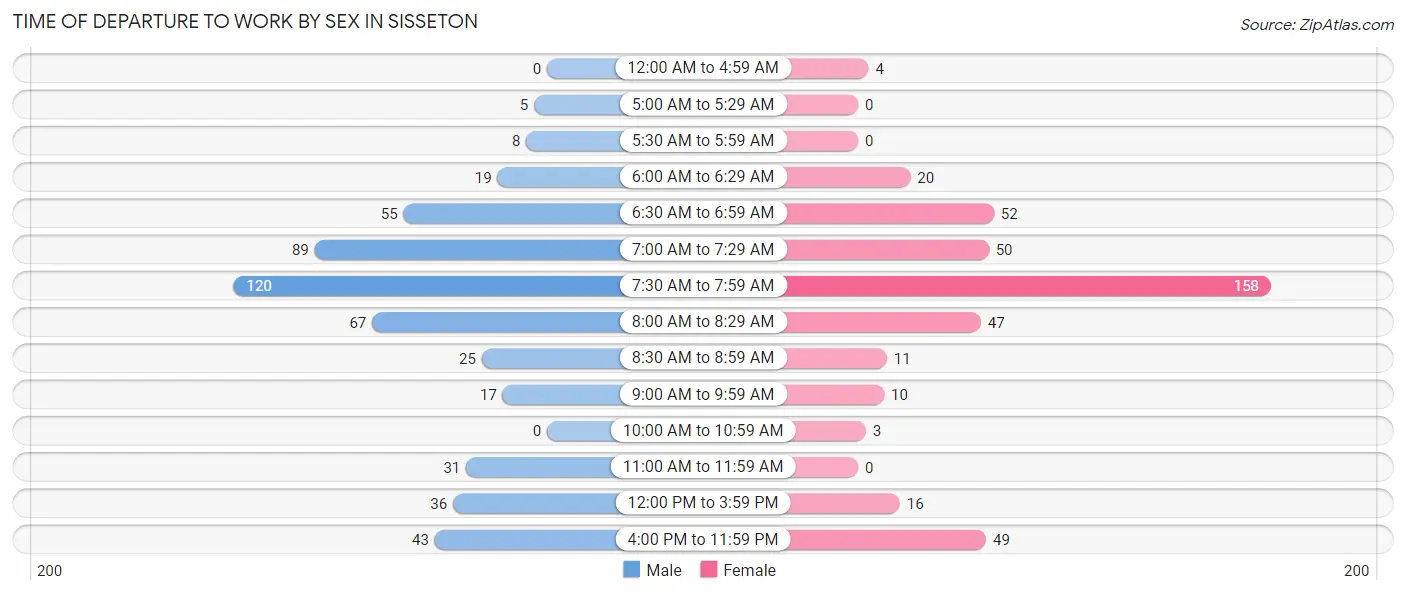
| Time of Departure | Male | Female |
| 12:00 AM to 4:59 AM | 0 (0.0%) | 4 (0.9%) |
| 5:00 AM to 5:29 AM | 5 (1.0%) | 0 (0.0%) |
| 5:30 AM to 5:59 AM | 8 (1.5%) | 0 (0.0%) |
| 6:00 AM to 6:29 AM | 19 (3.7%) | 20 (4.8%) |
| 6:30 AM to 6:59 AM | 55 (10.7%) | 52 (12.4%) |
| 7:00 AM to 7:29 AM | 89 (17.3%) | 50 (11.9%) |
| 7:30 AM to 7:59 AM | 120 (23.3%) | 158 (37.6%) |
| 8:00 AM to 8:29 AM | 67 (13.0%) | 47 (11.2%) |
| 8:30 AM to 8:59 AM | 25 (4.9%) | 11 (2.6%) |
| 9:00 AM to 9:59 AM | 17 (3.3%) | 10 (2.4%) |
| 10:00 AM to 10:59 AM | 0 (0.0%) | 3 (0.7%) |
| 11:00 AM to 11:59 AM | 31 (6.0%) | 0 (0.0%) |
| 12:00 PM to 3:59 PM | 36 (7.0%) | 16 (3.8%) |
| 4:00 PM to 11:59 PM | 43 (8.4%) | 49 (11.7%) |
| Total | 515 (100.0%) | 420 (100.0%) |
Housing Occupancy in Sisseton
Occupancy by Ownership in Sisseton
Of the total 940 dwellings in Sisseton, owner-occupied units account for 461 (49.0%), while renter-occupied units make up 479 (51.0%).
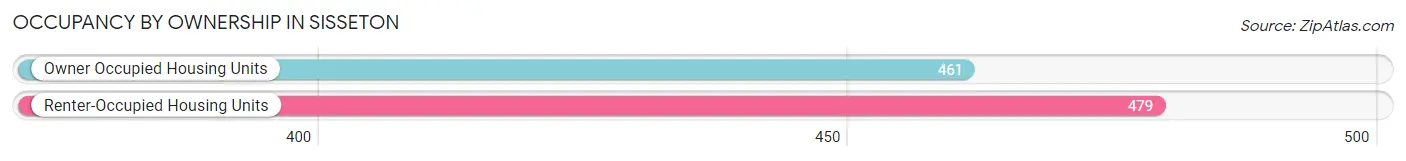
| Occupancy | # Housing Units | % Housing Units |
| Owner Occupied Housing Units | 461 | 49.0% |
| Renter-Occupied Housing Units | 479 | 51.0% |
| Total Occupied Housing Units | 940 | 100.0% |
Occupancy by Household Size in Sisseton
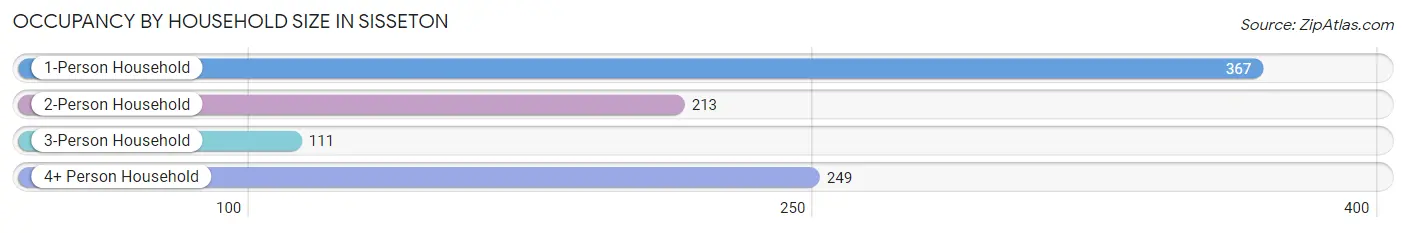
| Household Size | # Housing Units | % Housing Units |
| 1-Person Household | 367 | 39.0% |
| 2-Person Household | 213 | 22.7% |
| 3-Person Household | 111 | 11.8% |
| 4+ Person Household | 249 | 26.5% |
| Total Housing Units | 940 | 100.0% |
Occupancy by Ownership by Household Size in Sisseton
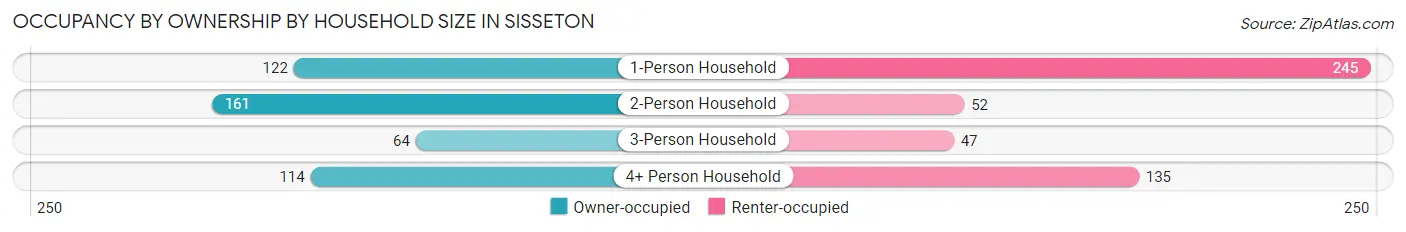
| Household Size | Owner-occupied | Renter-occupied |
| 1-Person Household | 122 (33.2%) | 245 (66.8%) |
| 2-Person Household | 161 (75.6%) | 52 (24.4%) |
| 3-Person Household | 64 (57.7%) | 47 (42.3%) |
| 4+ Person Household | 114 (45.8%) | 135 (54.2%) |
| Total Housing Units | 461 (49.0%) | 479 (51.0%) |
Occupancy by Educational Attainment in Sisseton
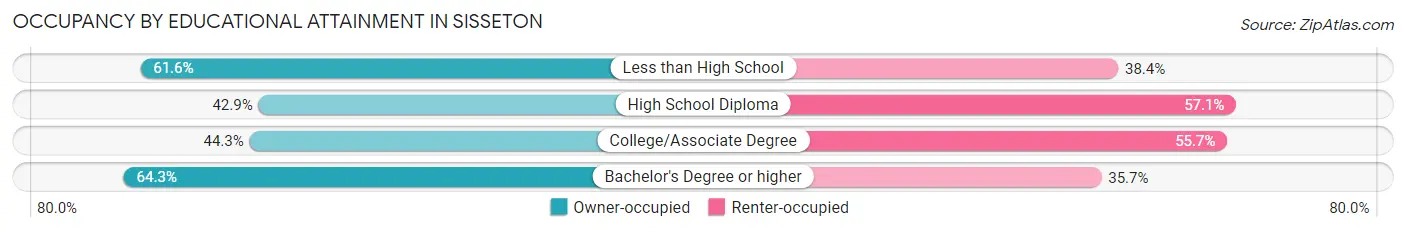
| Household Size | Owner-occupied | Renter-occupied |
| Less than High School | 45 (61.6%) | 28 (38.4%) |
| High School Diploma | 139 (42.9%) | 185 (57.1%) |
| College/Associate Degree | 160 (44.3%) | 201 (55.7%) |
| Bachelor's Degree or higher | 117 (64.3%) | 65 (35.7%) |
Occupancy by Age of Householder in Sisseton
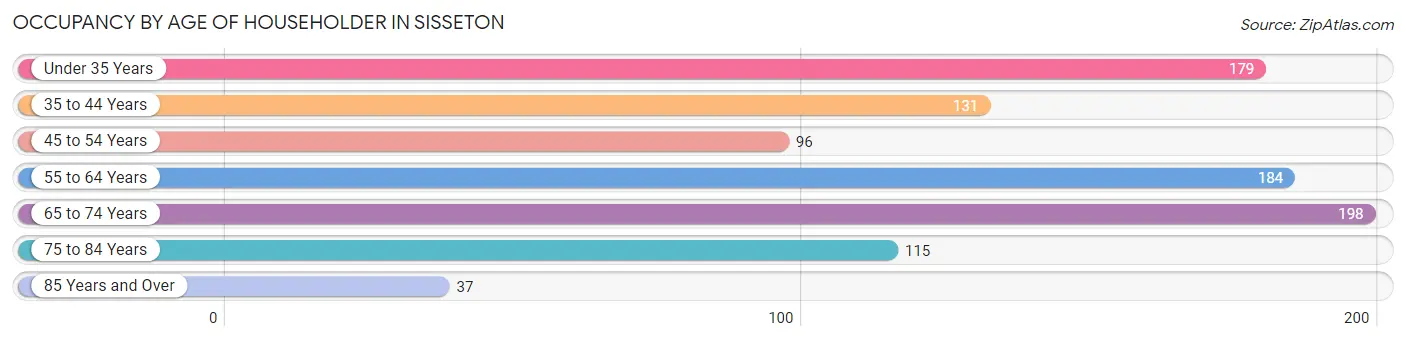
| Age Bracket | # Households | % Households |
| Under 35 Years | 179 | 19.0% |
| 35 to 44 Years | 131 | 13.9% |
| 45 to 54 Years | 96 | 10.2% |
| 55 to 64 Years | 184 | 19.6% |
| 65 to 74 Years | 198 | 21.1% |
| 75 to 84 Years | 115 | 12.2% |
| 85 Years and Over | 37 | 3.9% |
| Total | 940 | 100.0% |
Housing Finances in Sisseton
Median Income by Occupancy in Sisseton
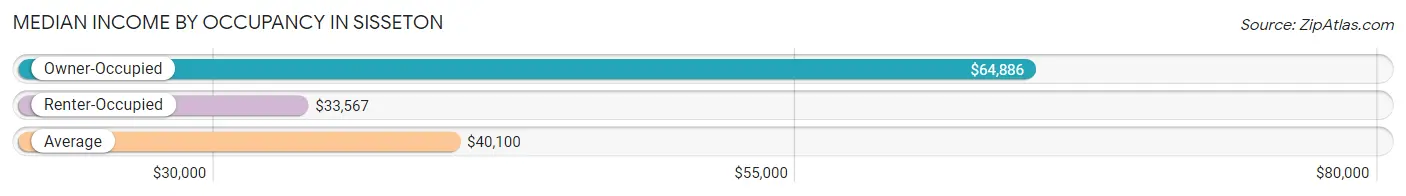
| Occupancy Type | # Households | Median Income |
| Owner-Occupied | 461 (49.0%) | $64,886 |
| Renter-Occupied | 479 (51.0%) | $33,567 |
| Average | 940 (100.0%) | $40,100 |
Occupancy by Householder Income Bracket in Sisseton
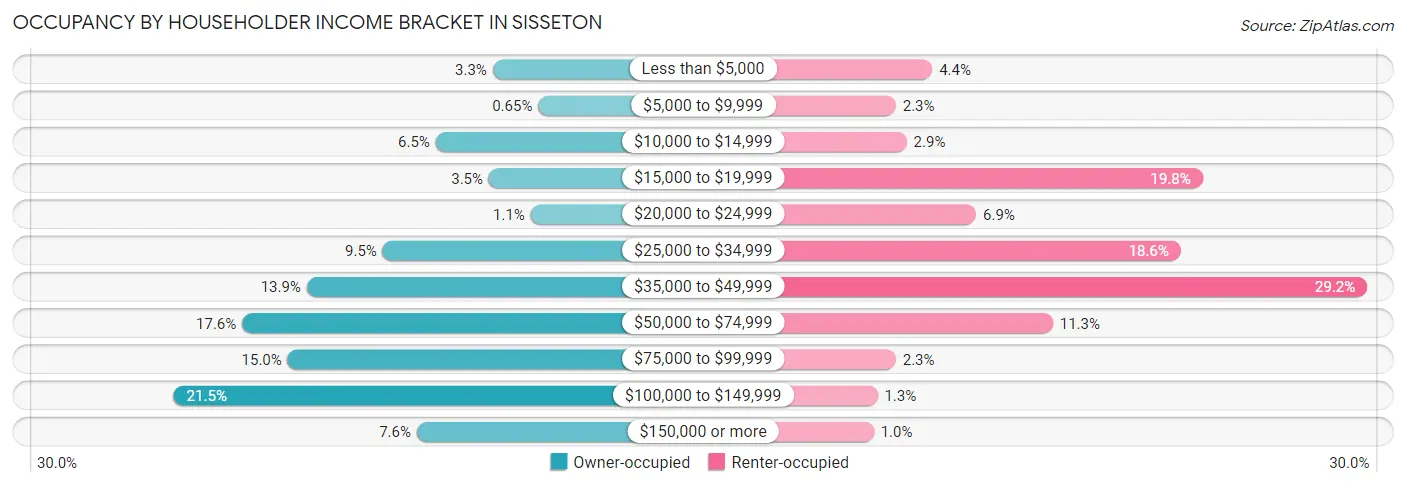
| Income Bracket | Owner-occupied | Renter-occupied |
| Less than $5,000 | 15 (3.3%) | 21 (4.4%) |
| $5,000 to $9,999 | 3 (0.6%) | 11 (2.3%) |
| $10,000 to $14,999 | 30 (6.5%) | 14 (2.9%) |
| $15,000 to $19,999 | 16 (3.5%) | 95 (19.8%) |
| $20,000 to $24,999 | 5 (1.1%) | 33 (6.9%) |
| $25,000 to $34,999 | 44 (9.5%) | 89 (18.6%) |
| $35,000 to $49,999 | 64 (13.9%) | 140 (29.2%) |
| $50,000 to $74,999 | 81 (17.6%) | 54 (11.3%) |
| $75,000 to $99,999 | 69 (15.0%) | 11 (2.3%) |
| $100,000 to $149,999 | 99 (21.5%) | 6 (1.3%) |
| $150,000 or more | 35 (7.6%) | 5 (1.0%) |
| Total | 461 (100.0%) | 479 (100.0%) |
Monthly Housing Cost Tiers in Sisseton
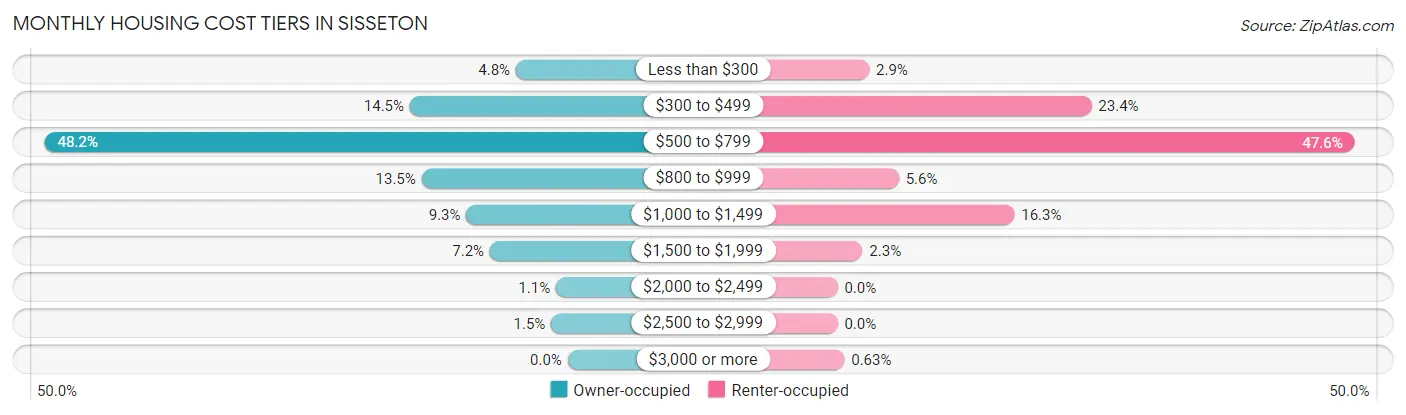
| Monthly Cost | Owner-occupied | Renter-occupied |
| Less than $300 | 22 (4.8%) | 14 (2.9%) |
| $300 to $499 | 67 (14.5%) | 112 (23.4%) |
| $500 to $799 | 222 (48.2%) | 228 (47.6%) |
| $800 to $999 | 62 (13.5%) | 27 (5.6%) |
| $1,000 to $1,499 | 43 (9.3%) | 78 (16.3%) |
| $1,500 to $1,999 | 33 (7.2%) | 11 (2.3%) |
| $2,000 to $2,499 | 5 (1.1%) | 0 (0.0%) |
| $2,500 to $2,999 | 7 (1.5%) | 0 (0.0%) |
| $3,000 or more | 0 (0.0%) | 3 (0.6%) |
| Total | 461 (100.0%) | 479 (100.0%) |
Physical Housing Characteristics in Sisseton
Housing Structures in Sisseton
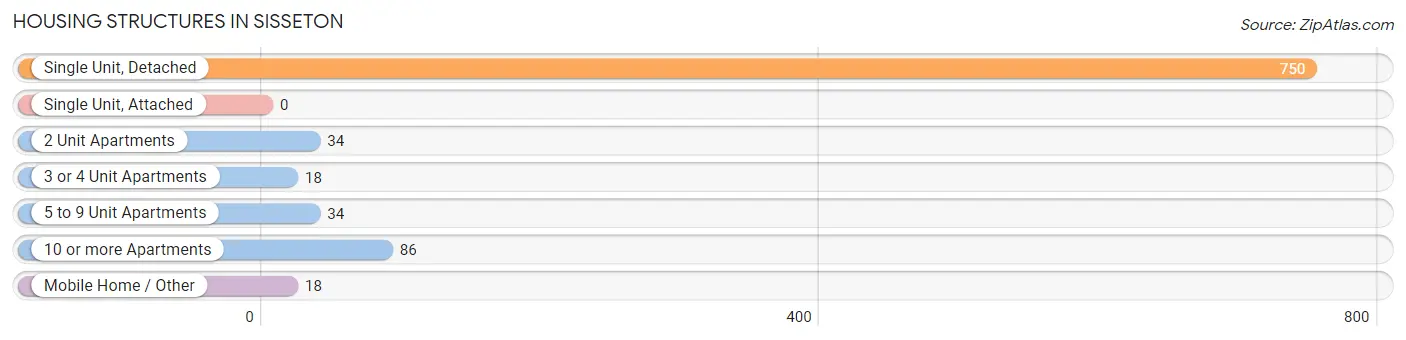
| Structure Type | # Housing Units | % Housing Units |
| Single Unit, Detached | 750 | 79.8% |
| Single Unit, Attached | 0 | 0.0% |
| 2 Unit Apartments | 34 | 3.6% |
| 3 or 4 Unit Apartments | 18 | 1.9% |
| 5 to 9 Unit Apartments | 34 | 3.6% |
| 10 or more Apartments | 86 | 9.1% |
| Mobile Home / Other | 18 | 1.9% |
| Total | 940 | 100.0% |
Housing Structures by Occupancy in Sisseton
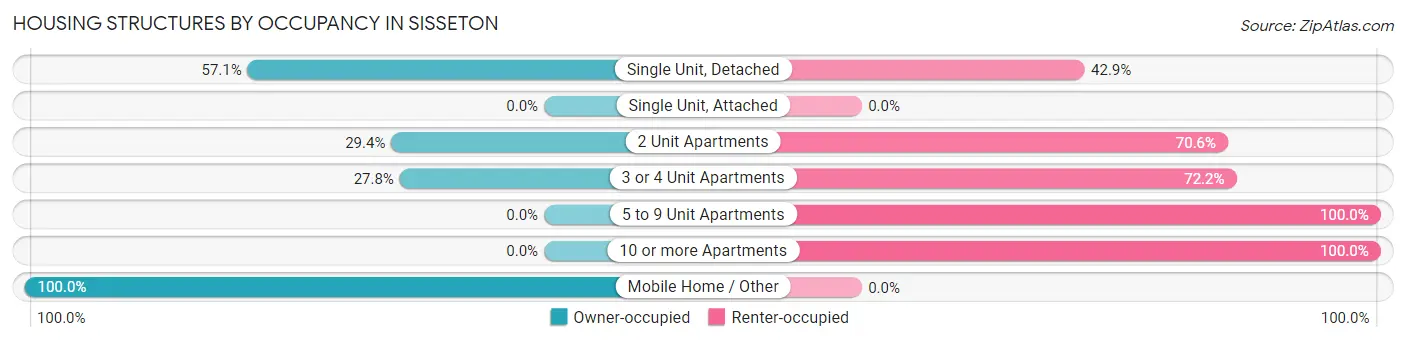
| Structure Type | Owner-occupied | Renter-occupied |
| Single Unit, Detached | 428 (57.1%) | 322 (42.9%) |
| Single Unit, Attached | 0 (0.0%) | 0 (0.0%) |
| 2 Unit Apartments | 10 (29.4%) | 24 (70.6%) |
| 3 or 4 Unit Apartments | 5 (27.8%) | 13 (72.2%) |
| 5 to 9 Unit Apartments | 0 (0.0%) | 34 (100.0%) |
| 10 or more Apartments | 0 (0.0%) | 86 (100.0%) |
| Mobile Home / Other | 18 (100.0%) | 0 (0.0%) |
| Total | 461 (49.0%) | 479 (51.0%) |
Housing Structures by Number of Rooms in Sisseton
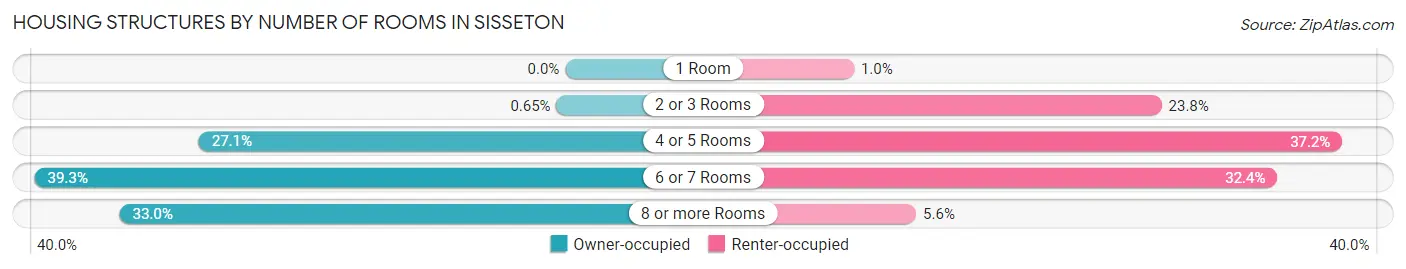
| Number of Rooms | Owner-occupied | Renter-occupied |
| 1 Room | 0 (0.0%) | 5 (1.0%) |
| 2 or 3 Rooms | 3 (0.6%) | 114 (23.8%) |
| 4 or 5 Rooms | 125 (27.1%) | 178 (37.2%) |
| 6 or 7 Rooms | 181 (39.3%) | 155 (32.4%) |
| 8 or more Rooms | 152 (33.0%) | 27 (5.6%) |
| Total | 461 (100.0%) | 479 (100.0%) |
Housing Structure by Heating Type in Sisseton
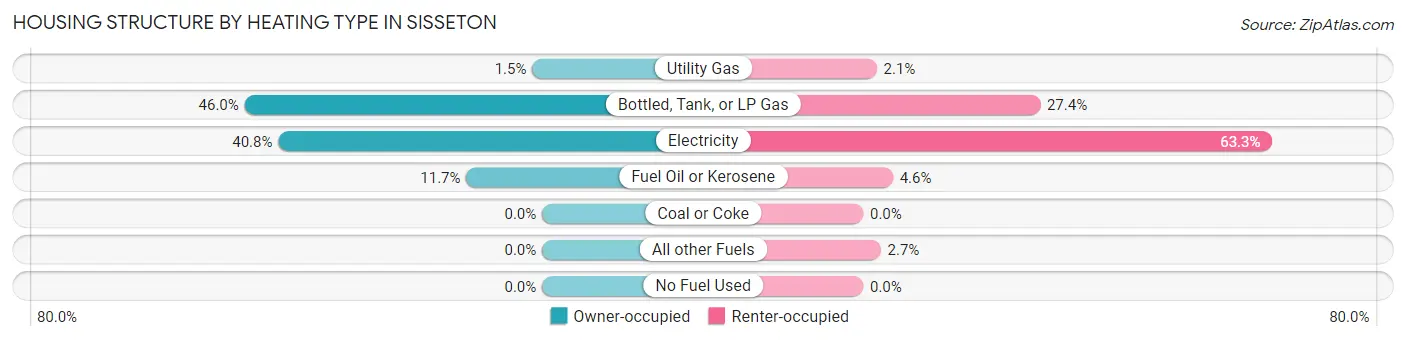
| Heating Type | Owner-occupied | Renter-occupied |
| Utility Gas | 7 (1.5%) | 10 (2.1%) |
| Bottled, Tank, or LP Gas | 212 (46.0%) | 131 (27.4%) |
| Electricity | 188 (40.8%) | 303 (63.3%) |
| Fuel Oil or Kerosene | 54 (11.7%) | 22 (4.6%) |
| Coal or Coke | 0 (0.0%) | 0 (0.0%) |
| All other Fuels | 0 (0.0%) | 13 (2.7%) |
| No Fuel Used | 0 (0.0%) | 0 (0.0%) |
| Total | 461 (100.0%) | 479 (100.0%) |
Household Vehicle Usage in Sisseton
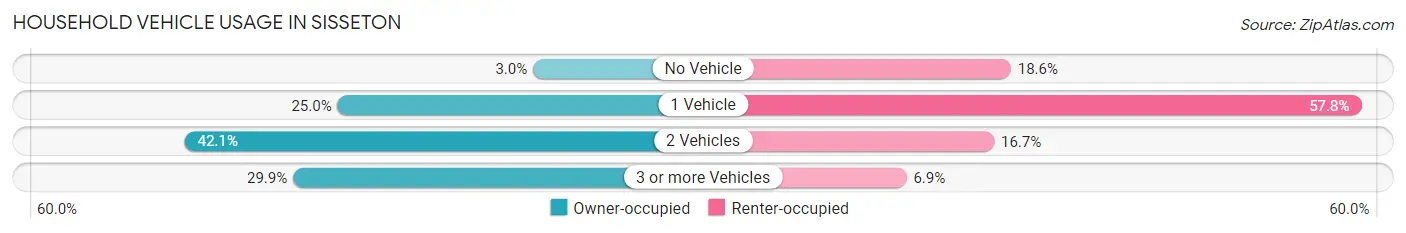
| Vehicles per Household | Owner-occupied | Renter-occupied |
| No Vehicle | 14 (3.0%) | 89 (18.6%) |
| 1 Vehicle | 115 (24.9%) | 277 (57.8%) |
| 2 Vehicles | 194 (42.1%) | 80 (16.7%) |
| 3 or more Vehicles | 138 (29.9%) | 33 (6.9%) |
| Total | 461 (100.0%) | 479 (100.0%) |
Real Estate & Mortgages in Sisseton
Real Estate and Mortgage Overview in Sisseton
| Characteristic | Without Mortgage | With Mortgage |
| Housing Units | 266 | 195 |
| Median Property Value | $100,000 | $104,200 |
| Median Household Income | $52,955 | $23 |
| Monthly Housing Costs | $573 | $0 |
| Real Estate Taxes | $1,467 | $0 |
Property Value by Mortgage Status in Sisseton
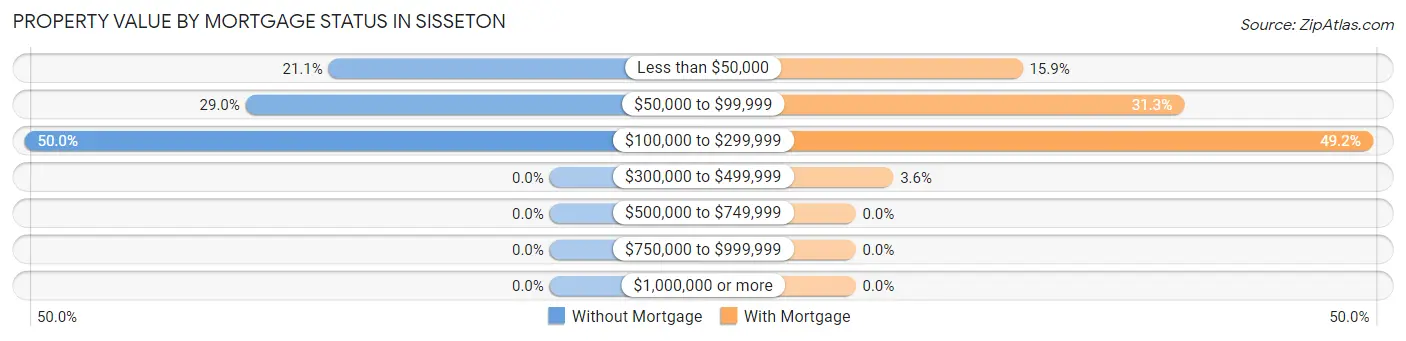
| Property Value | Without Mortgage | With Mortgage |
| Less than $50,000 | 56 (21.0%) | 31 (15.9%) |
| $50,000 to $99,999 | 77 (28.9%) | 61 (31.3%) |
| $100,000 to $299,999 | 133 (50.0%) | 96 (49.2%) |
| $300,000 to $499,999 | 0 (0.0%) | 7 (3.6%) |
| $500,000 to $749,999 | 0 (0.0%) | 0 (0.0%) |
| $750,000 to $999,999 | 0 (0.0%) | 0 (0.0%) |
| $1,000,000 or more | 0 (0.0%) | 0 (0.0%) |
| Total | 266 (100.0%) | 195 (100.0%) |
Household Income by Mortgage Status in Sisseton
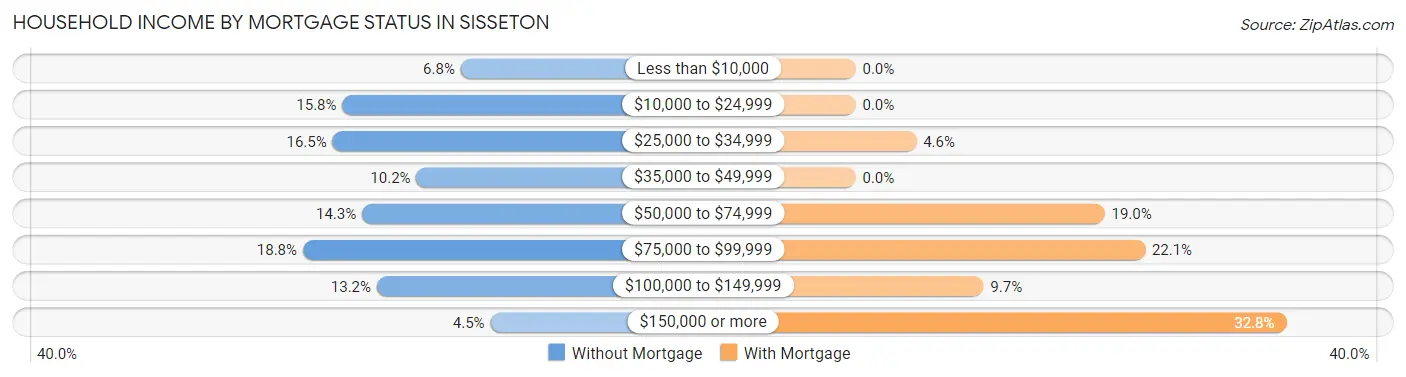
| Household Income | Without Mortgage | With Mortgage |
| Less than $10,000 | 18 (6.8%) | 0 (0.0%) |
| $10,000 to $24,999 | 42 (15.8%) | 0 (0.0%) |
| $25,000 to $34,999 | 44 (16.5%) | 9 (4.6%) |
| $35,000 to $49,999 | 27 (10.2%) | 0 (0.0%) |
| $50,000 to $74,999 | 38 (14.3%) | 37 (19.0%) |
| $75,000 to $99,999 | 50 (18.8%) | 43 (22.1%) |
| $100,000 to $149,999 | 35 (13.2%) | 19 (9.7%) |
| $150,000 or more | 12 (4.5%) | 64 (32.8%) |
| Total | 266 (100.0%) | 195 (100.0%) |
Property Value to Household Income Ratio in Sisseton
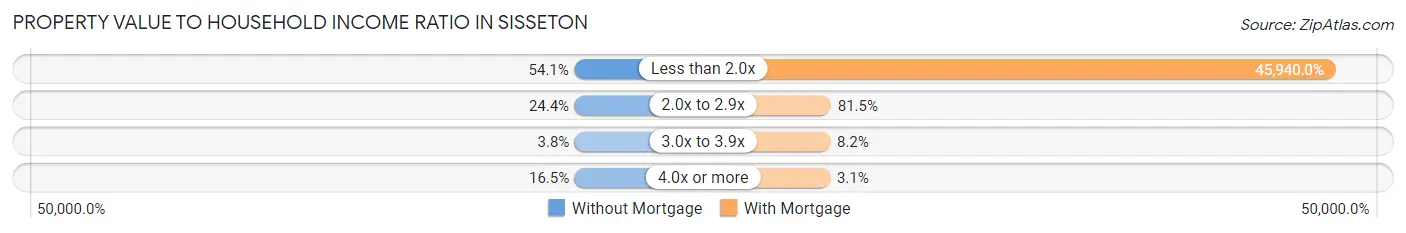
| Value-to-Income Ratio | Without Mortgage | With Mortgage |
| Less than 2.0x | 144 (54.1%) | 89,583 (45,940.0%) |
| 2.0x to 2.9x | 65 (24.4%) | 159 (81.5%) |
| 3.0x to 3.9x | 10 (3.8%) | 16 (8.2%) |
| 4.0x or more | 44 (16.5%) | 6 (3.1%) |
| Total | 266 (100.0%) | 195 (100.0%) |
Real Estate Taxes by Mortgage Status in Sisseton
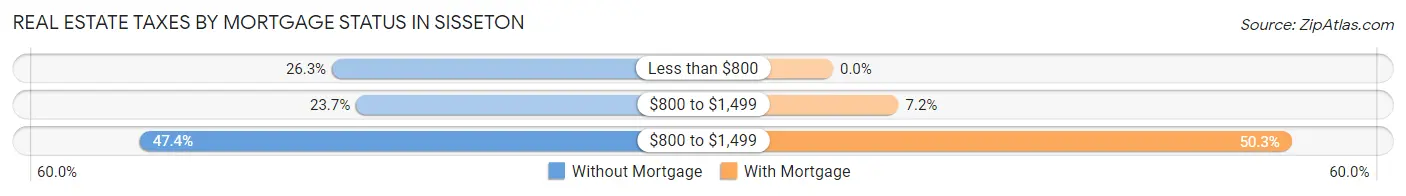
| Property Taxes | Without Mortgage | With Mortgage |
| Less than $800 | 70 (26.3%) | 0 (0.0%) |
| $800 to $1,499 | 63 (23.7%) | 14 (7.2%) |
| $800 to $1,499 | 126 (47.4%) | 98 (50.3%) |
| Total | 266 (100.0%) | 195 (100.0%) |
Health & Disability in Sisseton
Health Insurance Coverage by Age in Sisseton
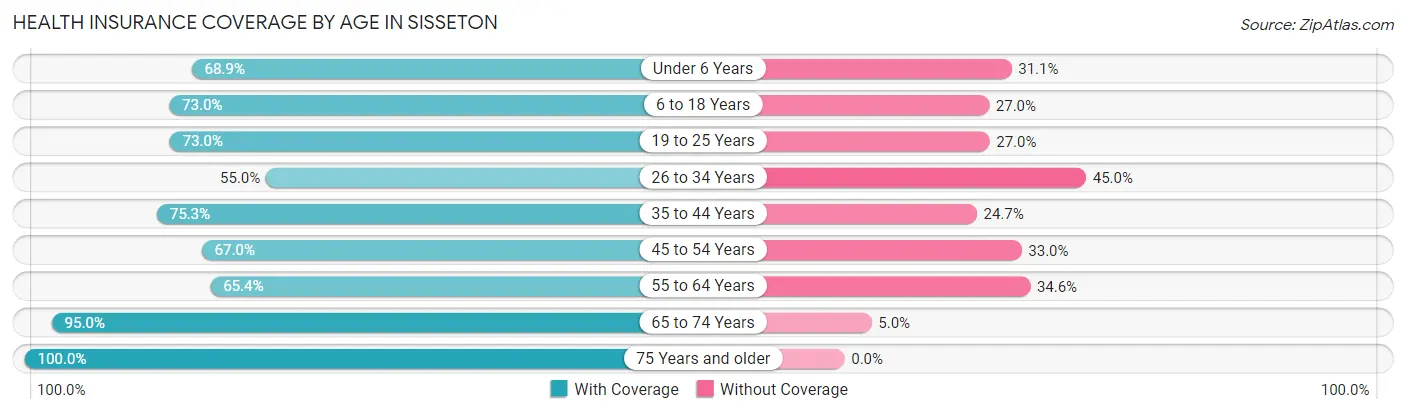
| Age Bracket | With Coverage | Without Coverage |
| Under 6 Years | 188 (68.9%) | 85 (31.1%) |
| 6 to 18 Years | 382 (73.0%) | 141 (27.0%) |
| 19 to 25 Years | 197 (73.0%) | 73 (27.0%) |
| 26 to 34 Years | 144 (55.0%) | 118 (45.0%) |
| 35 to 44 Years | 165 (75.3%) | 54 (24.7%) |
| 45 to 54 Years | 142 (67.0%) | 70 (33.0%) |
| 55 to 64 Years | 170 (65.4%) | 90 (34.6%) |
| 65 to 74 Years | 245 (95.0%) | 13 (5.0%) |
| 75 Years and older | 220 (100.0%) | 0 (0.0%) |
| Total | 1,853 (74.2%) | 644 (25.8%) |
Health Insurance Coverage by Citizenship Status in Sisseton
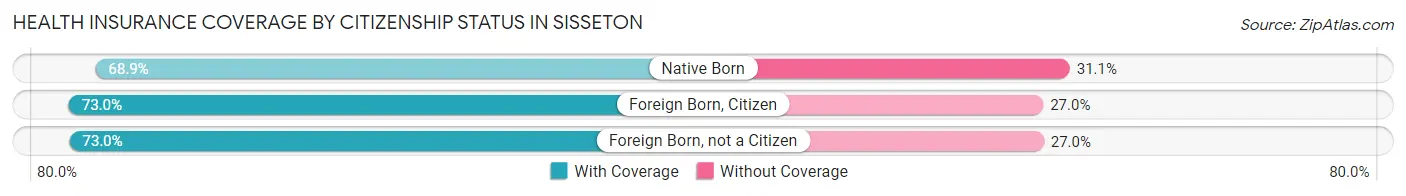
| Citizenship Status | With Coverage | Without Coverage |
| Native Born | 188 (68.9%) | 85 (31.1%) |
| Foreign Born, Citizen | 382 (73.0%) | 141 (27.0%) |
| Foreign Born, not a Citizen | 197 (73.0%) | 73 (27.0%) |
Health Insurance Coverage by Household Income in Sisseton
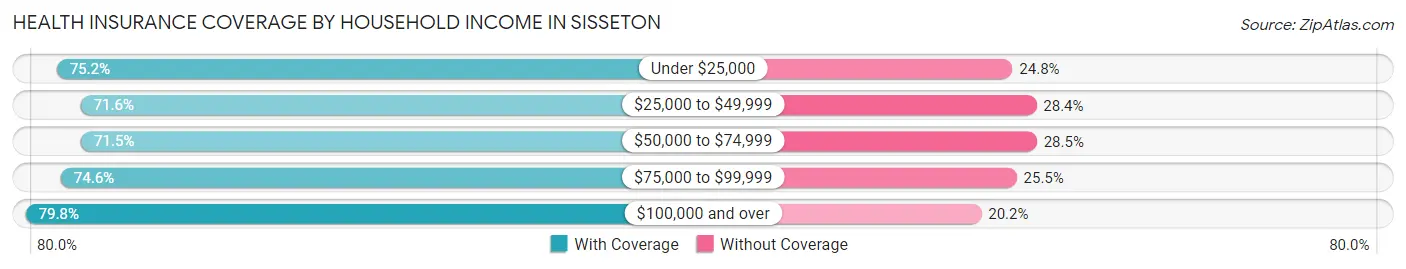
| Household Income | With Coverage | Without Coverage |
| Under $25,000 | 312 (75.2%) | 103 (24.8%) |
| $25,000 to $49,999 | 620 (71.6%) | 246 (28.4%) |
| $50,000 to $74,999 | 304 (71.5%) | 121 (28.5%) |
| $75,000 to $99,999 | 205 (74.6%) | 70 (25.5%) |
| $100,000 and over | 412 (79.8%) | 104 (20.2%) |
Public vs Private Health Insurance Coverage by Age in Sisseton
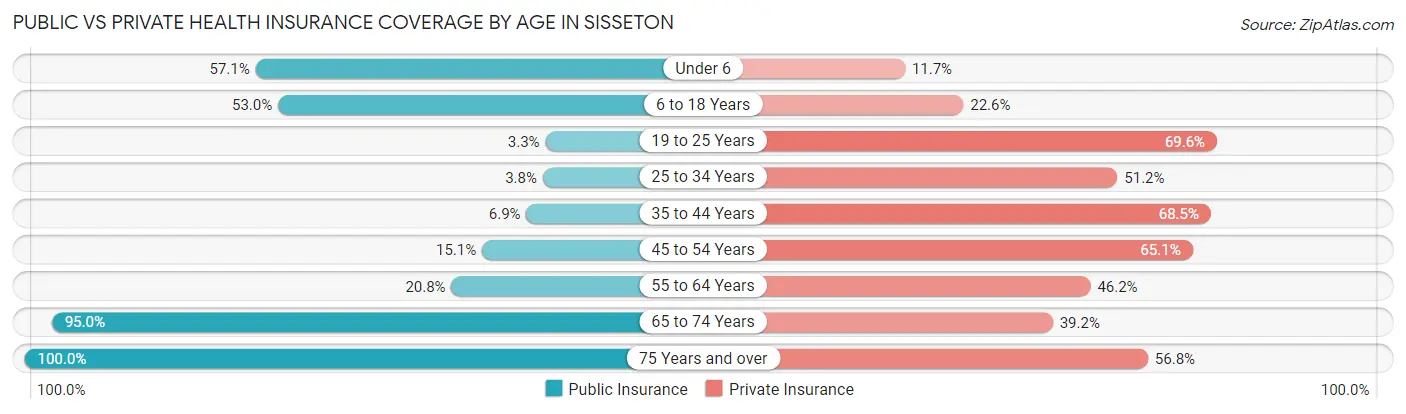
| Age Bracket | Public Insurance | Private Insurance |
| Under 6 | 156 (57.1%) | 32 (11.7%) |
| 6 to 18 Years | 277 (53.0%) | 118 (22.6%) |
| 19 to 25 Years | 9 (3.3%) | 188 (69.6%) |
| 25 to 34 Years | 10 (3.8%) | 134 (51.1%) |
| 35 to 44 Years | 15 (6.9%) | 150 (68.5%) |
| 45 to 54 Years | 32 (15.1%) | 138 (65.1%) |
| 55 to 64 Years | 54 (20.8%) | 120 (46.2%) |
| 65 to 74 Years | 245 (95.0%) | 101 (39.2%) |
| 75 Years and over | 220 (100.0%) | 125 (56.8%) |
| Total | 1,018 (40.8%) | 1,106 (44.3%) |
Disability Status by Sex by Age in Sisseton
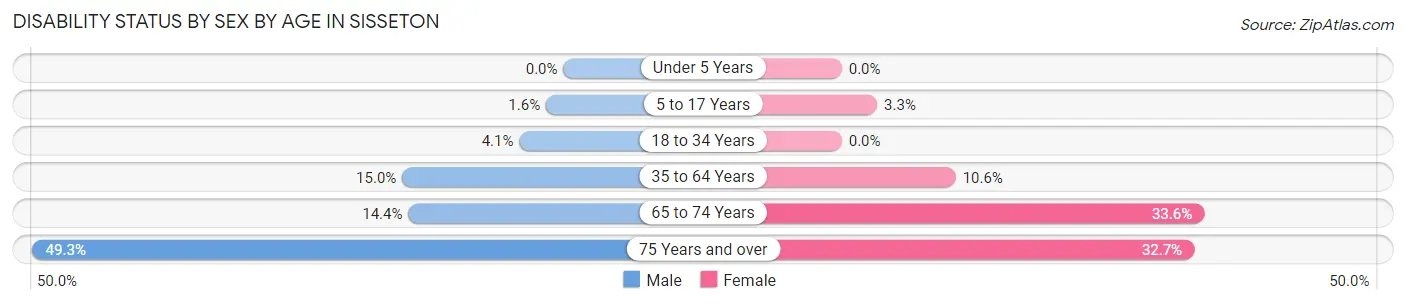
| Age Bracket | Male | Female |
| Under 5 Years | 0 (0.0%) | 0 (0.0%) |
| 5 to 17 Years | 4 (1.6%) | 9 (3.3%) |
| 18 to 34 Years | 13 (4.1%) | 0 (0.0%) |
| 35 to 64 Years | 51 (15.0%) | 37 (10.6%) |
| 65 to 74 Years | 20 (14.4%) | 40 (33.6%) |
| 75 Years and over | 33 (49.2%) | 50 (32.7%) |
Disability Class by Sex by Age in Sisseton
Disability Class: Hearing Difficulty
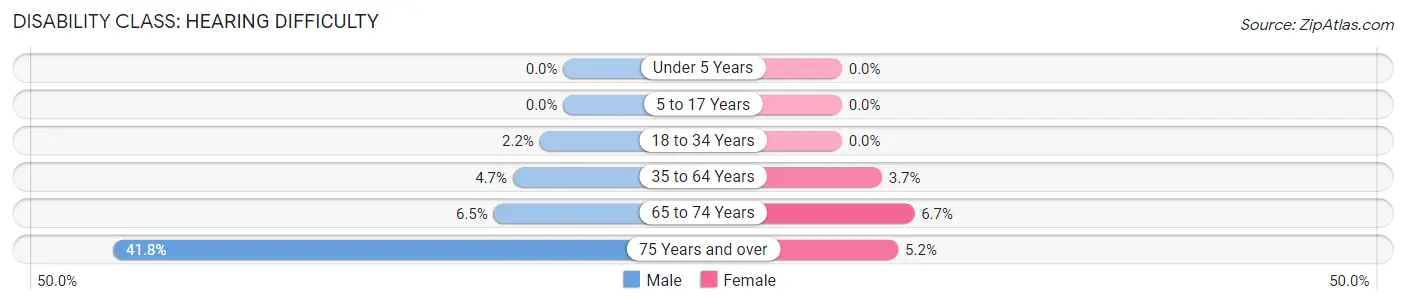
| Age Bracket | Male | Female |
| Under 5 Years | 0 (0.0%) | 0 (0.0%) |
| 5 to 17 Years | 0 (0.0%) | 0 (0.0%) |
| 18 to 34 Years | 7 (2.2%) | 0 (0.0%) |
| 35 to 64 Years | 16 (4.7%) | 13 (3.7%) |
| 65 to 74 Years | 9 (6.5%) | 8 (6.7%) |
| 75 Years and over | 28 (41.8%) | 8 (5.2%) |
Disability Class: Vision Difficulty
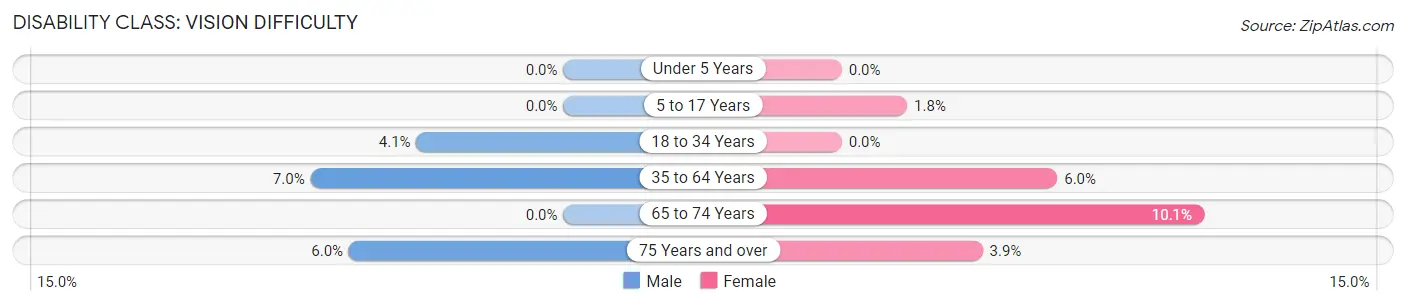
| Age Bracket | Male | Female |
| Under 5 Years | 0 (0.0%) | 0 (0.0%) |
| 5 to 17 Years | 0 (0.0%) | 5 (1.8%) |
| 18 to 34 Years | 13 (4.1%) | 0 (0.0%) |
| 35 to 64 Years | 24 (7.0%) | 21 (6.0%) |
| 65 to 74 Years | 0 (0.0%) | 12 (10.1%) |
| 75 Years and over | 4 (6.0%) | 6 (3.9%) |
Disability Class: Cognitive Difficulty
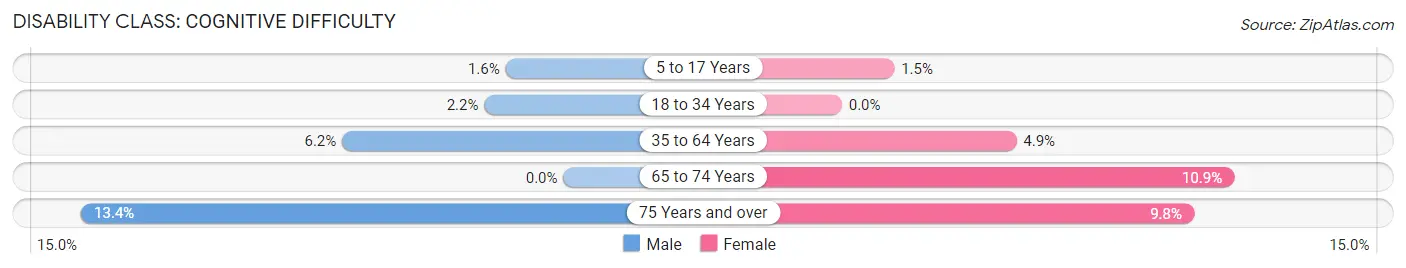
| Age Bracket | Male | Female |
| 5 to 17 Years | 4 (1.6%) | 4 (1.5%) |
| 18 to 34 Years | 7 (2.2%) | 0 (0.0%) |
| 35 to 64 Years | 21 (6.2%) | 17 (4.9%) |
| 65 to 74 Years | 0 (0.0%) | 13 (10.9%) |
| 75 Years and over | 9 (13.4%) | 15 (9.8%) |
Disability Class: Ambulatory Difficulty
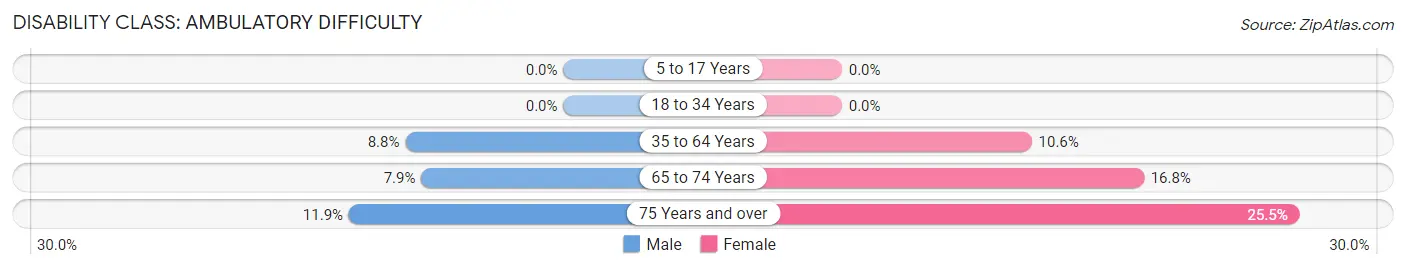
| Age Bracket | Male | Female |
| 5 to 17 Years | 0 (0.0%) | 0 (0.0%) |
| 18 to 34 Years | 0 (0.0%) | 0 (0.0%) |
| 35 to 64 Years | 30 (8.8%) | 37 (10.6%) |
| 65 to 74 Years | 11 (7.9%) | 20 (16.8%) |
| 75 Years and over | 8 (11.9%) | 39 (25.5%) |
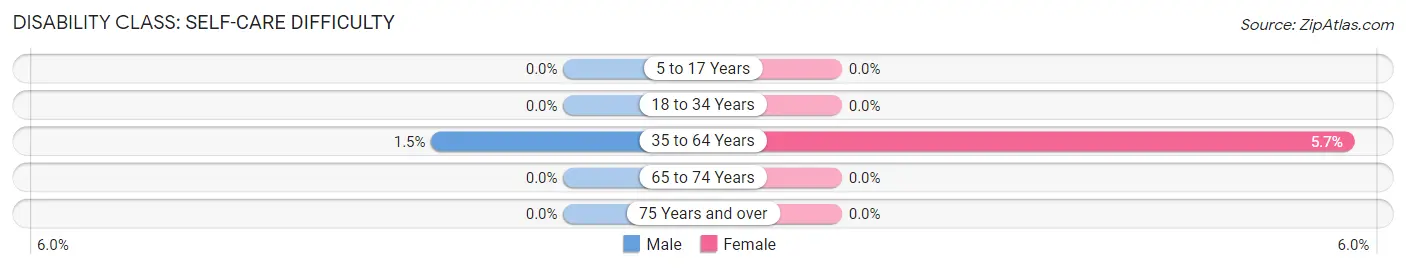
Disability Class: Self-Care Difficulty
| Age Bracket | Male | Female |
| 5 to 17 Years | 0 (0.0%) | 0 (0.0%) |
| 18 to 34 Years | 0 (0.0%) | 0 (0.0%) |
| 35 to 64 Years | 5 (1.5%) | 20 (5.7%) |
| 65 to 74 Years | 0 (0.0%) | 0 (0.0%) |
| 75 Years and over | 0 (0.0%) | 0 (0.0%) |
Technology Access in Sisseton
Computing Device Access in Sisseton
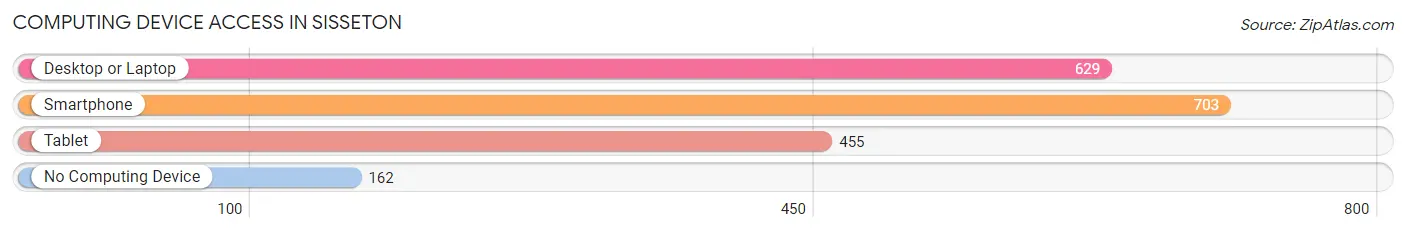
| Device Type | # Households | % Households |
| Desktop or Laptop | 629 | 66.9% |
| Smartphone | 703 | 74.8% |
| Tablet | 455 | 48.4% |
| No Computing Device | 162 | 17.2% |
| Total | 940 | 100.0% |
Internet Access in Sisseton
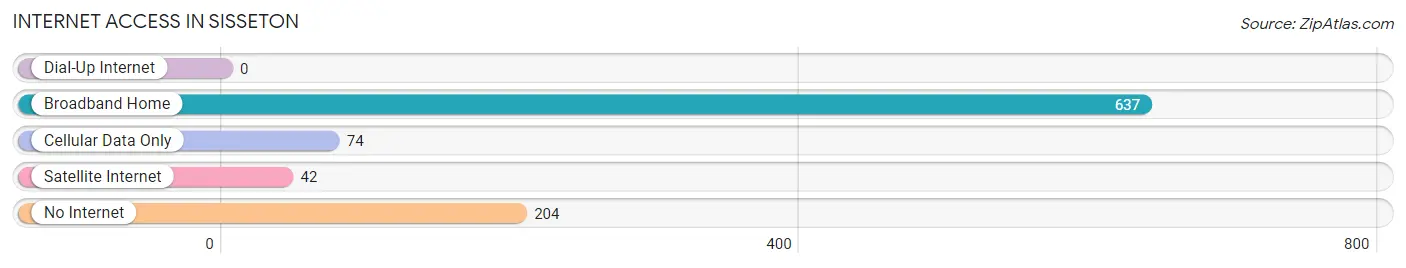
| Internet Type | # Households | % Households |
| Dial-Up Internet | 0 | 0.0% |
| Broadband Home | 637 | 67.8% |
| Cellular Data Only | 74 | 7.9% |
| Satellite Internet | 42 | 4.5% |
| No Internet | 204 | 21.7% |
| Total | 940 | 100.0% |
Sisseton Summary
Sisseton, South Dakota is a small city located in Roberts County in the northeastern corner of the state. It is the county seat and the largest city in the county. The city is situated on the banks of the Big Sioux River and is surrounded by rolling hills and prairies. The population of Sisseton was 2,541 at the 2010 census.
History
The area that is now Sisseton was first settled by the Dakota Sioux in the early 1800s. The city was founded in 1872 when the railroad was built through the area. The city was named after the Sisseton Sioux tribe, which had a large presence in the area.
The city was incorporated in 1883 and quickly became a center of commerce and industry. The city was home to several businesses, including a flour mill, a sawmill, a creamery, and a brickyard. The city also had a large agricultural presence, with many farmers growing wheat, oats, and other crops.
In the early 1900s, Sisseton became a popular tourist destination. The city was home to several resorts and hotels, as well as a popular amusement park. The city also had a large number of churches, including the First Presbyterian Church, which was founded in 1883.
Geography
Sisseton is located in the northeastern corner of South Dakota, in Roberts County. The city is situated on the banks of the Big Sioux River, which flows through the city. The city is surrounded by rolling hills and prairies. The city is located about 50 miles north of Sioux Falls and about 100 miles south of Fargo, North Dakota.
The climate in Sisseton is continental, with cold winters and hot summers. The average high temperature in July is 85 degrees Fahrenheit, and the average low temperature in January is 4 degrees Fahrenheit. The average annual precipitation is about 22 inches.
Economy
The economy of Sisseton is largely based on agriculture and tourism. The city is home to several large farms, which grow wheat, oats, and other crops. The city is also home to several tourist attractions, including the Sisseton-Wahpeton Oyate Cultural Center, which showcases the history and culture of the Dakota Sioux.
The city is also home to several businesses, including a grocery store, a hardware store, and a bank. The city is also home to several manufacturing companies, including a furniture factory and a plastics factory.
Demographics
As of the 2010 census, the population of Sisseton was 2,541. The racial makeup of the city was 94.3% White, 0.3% African American, 0.2% Native American, 0.2% Asian, 0.1% Pacific Islander, 3.2% from other races, and 1.9% from two or more races. Hispanic or Latino of any race were 5.2% of the population.
The median income for a household in Sisseton was $37,917, and the median income for a family was $45,938. The per capita income for the city was $17,945. About 11.2% of families and 14.2% of the population were below the poverty line, including 19.2% of those under age 18 and 8.2% of those age 65 or over.
Common Questions
What is Per Capita Income in Sisseton?
Per Capita income in Sisseton is $21,741.
What is the Median Family Income in Sisseton?
Median Family Income in Sisseton is $47,895.
What is the Median Household income in Sisseton?
Median Household Income in Sisseton is $40,100.
What is Income or Wage Gap in Sisseton?
Income or Wage Gap in Sisseton is 2.2%.
Women in Sisseton earn 97.8 cents for every dollar earned by a man.
What is Inequality or Gini Index in Sisseton?
Inequality or Gini Index in Sisseton is 0.42.
What is the Total Population of Sisseton?
Total Population of Sisseton is 2,564.
What is the Total Male Population of Sisseton?
Total Male Population of Sisseton is 1,222.
What is the Total Female Population of Sisseton?
Total Female Population of Sisseton is 1,342.
What is the Ratio of Males per 100 Females in Sisseton?
There are 91.06 Males per 100 Females in Sisseton.
What is the Ratio of Females per 100 Males in Sisseton?
There are 109.82 Females per 100 Males in Sisseton.
What is the Median Population Age in Sisseton?
Median Population Age in Sisseton is 34.1 Years.
What is the Average Family Size in Sisseton
Average Family Size in Sisseton is 3.6 People.
What is the Average Household Size in Sisseton
Average Household Size in Sisseton is 2.7 People.
How Large is the Labor Force in Sisseton?
There are 1,118 People in the Labor Forcein in Sisseton.
What is the Percentage of People in the Labor Force in Sisseton?
58.4% of People are in the Labor Force in Sisseton.
What is the Unemployment Rate in Sisseton?
Unemployment Rate in Sisseton is 7.2%.