Running Water, SD Map & Demographics
Running Water Map
Running Water Overview
$23,638
PER CAPITA INCOME
39.3%
WAGE / INCOME GAP [ % ]
60.7¢/ $1
WAGE / INCOME GAP [ $ ]
0.42
INEQUALITY / GINI INDEX
76
TOTAL POPULATION
41
MALE POPULATION
35
FEMALE POPULATION
117.14
MALES / 100 FEMALES
85.37
FEMALES / 100 MALES
76.4
MEDIAN AGE
1.6
AVG FAMILY SIZE
1.4
AVG HOUSEHOLD SIZE
25
LABOR FORCE [ PEOPLE ]
32.9%
PERCENT IN LABOR FORCE
Running Water Area Codes
Income in Running Water
Income Overview in Running Water
| Characteristic | Number | Measure |
| Per Capita Income | 76 | $23,638 |
| Median Family Income | 24 | $0 |
| Mean Family Income | 24 | $52,046 |
| Median Household Income | 53 | $0 |
| Mean Household Income | 53 | $42,213 |
| Income Deficit | 24 | $0 |
| Wage / Income Gap (%) | 76 | 39.30% |
| Wage / Income Gap ($) | 76 | 60.70¢ per $1 |
| Gini / Inequality Index | 76 | 0.42 |
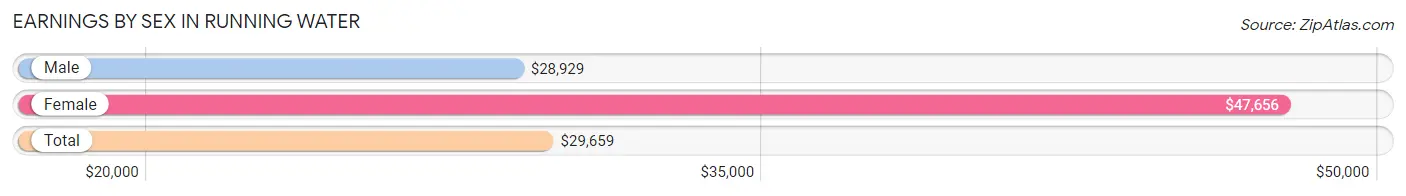
Earnings by Sex in Running Water
Average Earnings in Running Water are $29,659, $28,929 for men and $47,656 for women, a difference of 39.3%.
| Sex | Number | Average Earnings |
| Male | 10 (40.0%) | $28,929 |
| Female | 15 (60.0%) | $47,656 |
| Total | 25 (100.0%) | $29,659 |
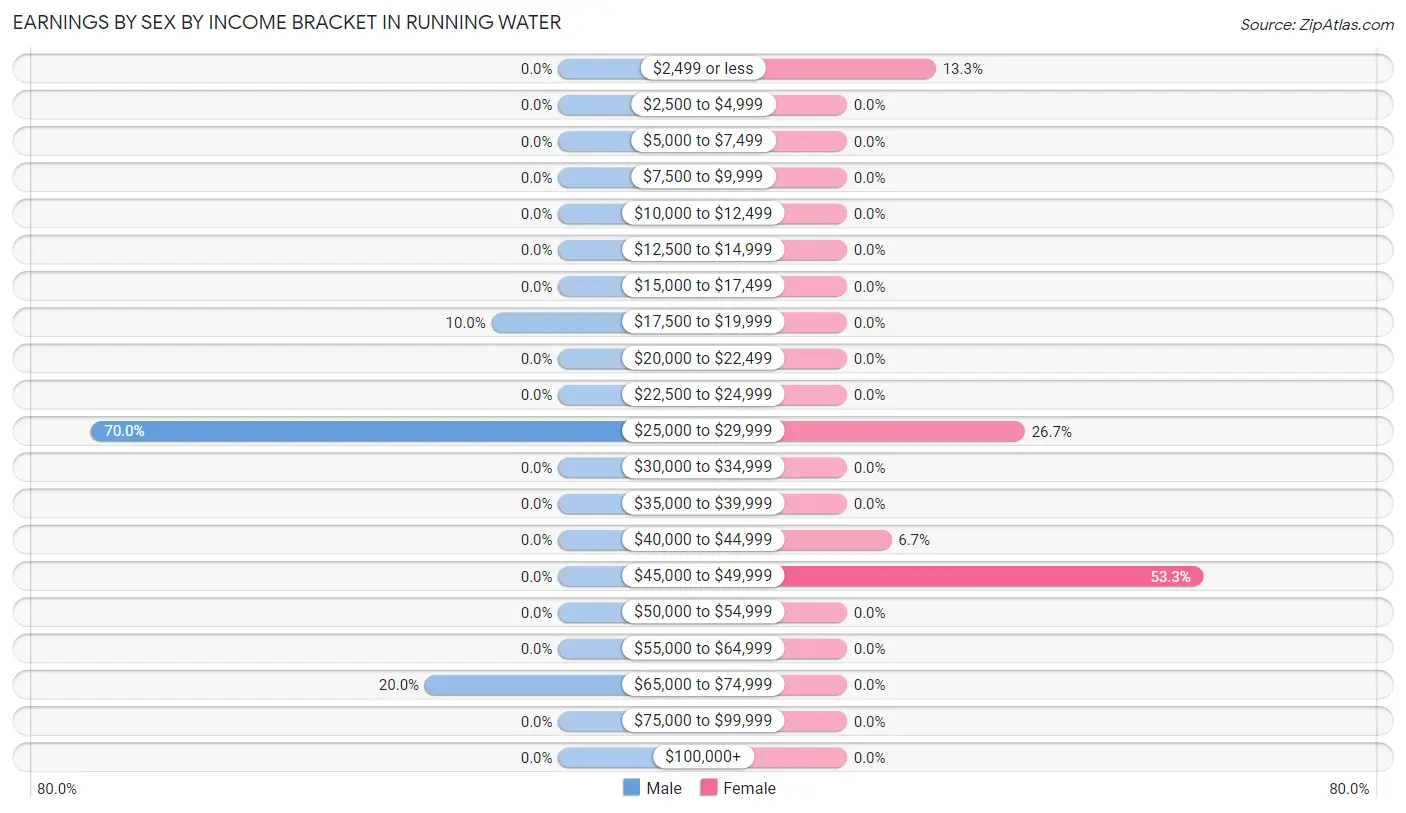
Earnings by Sex by Income Bracket in Running Water
The most common earnings brackets in Running Water are $25,000 to $29,999 for men (7 | 70.0%) and $45,000 to $49,999 for women (8 | 53.3%).
| Income | Male | Female |
| $2,499 or less | 0 (0.0%) | 2 (13.3%) |
| $2,500 to $4,999 | 0 (0.0%) | 0 (0.0%) |
| $5,000 to $7,499 | 0 (0.0%) | 0 (0.0%) |
| $7,500 to $9,999 | 0 (0.0%) | 0 (0.0%) |
| $10,000 to $12,499 | 0 (0.0%) | 0 (0.0%) |
| $12,500 to $14,999 | 0 (0.0%) | 0 (0.0%) |
| $15,000 to $17,499 | 0 (0.0%) | 0 (0.0%) |
| $17,500 to $19,999 | 1 (10.0%) | 0 (0.0%) |
| $20,000 to $22,499 | 0 (0.0%) | 0 (0.0%) |
| $22,500 to $24,999 | 0 (0.0%) | 0 (0.0%) |
| $25,000 to $29,999 | 7 (70.0%) | 4 (26.7%) |
| $30,000 to $34,999 | 0 (0.0%) | 0 (0.0%) |
| $35,000 to $39,999 | 0 (0.0%) | 0 (0.0%) |
| $40,000 to $44,999 | 0 (0.0%) | 1 (6.7%) |
| $45,000 to $49,999 | 0 (0.0%) | 8 (53.3%) |
| $50,000 to $54,999 | 0 (0.0%) | 0 (0.0%) |
| $55,000 to $64,999 | 0 (0.0%) | 0 (0.0%) |
| $65,000 to $74,999 | 2 (20.0%) | 0 (0.0%) |
| $75,000 to $99,999 | 0 (0.0%) | 0 (0.0%) |
| $100,000+ | 0 (0.0%) | 0 (0.0%) |
| Total | 10 (100.0%) | 15 (100.0%) |
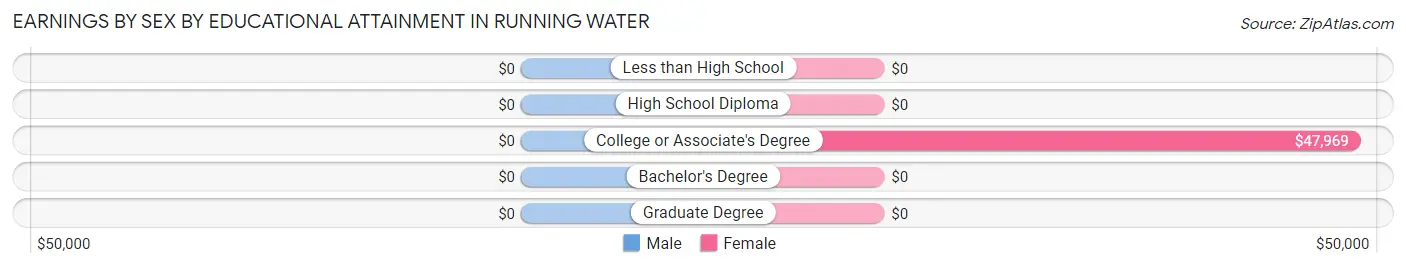
Earnings by Sex by Educational Attainment in Running Water
| Educational Attainment | Male Income | Female Income |
| Less than High School | - | - |
| High School Diploma | - | - |
| College or Associate's Degree | - | - |
| Bachelor's Degree | - | - |
| Graduate Degree | - | - |
| Total | $28,929 | $47,656 |
Family Income in Running Water
Family Income Brackets in Running Water
According to the Running Water family income data, there are 8 families falling into the $15,000 to $24,999 income range, which is the most common income bracket and makes up 33.3% of all families.
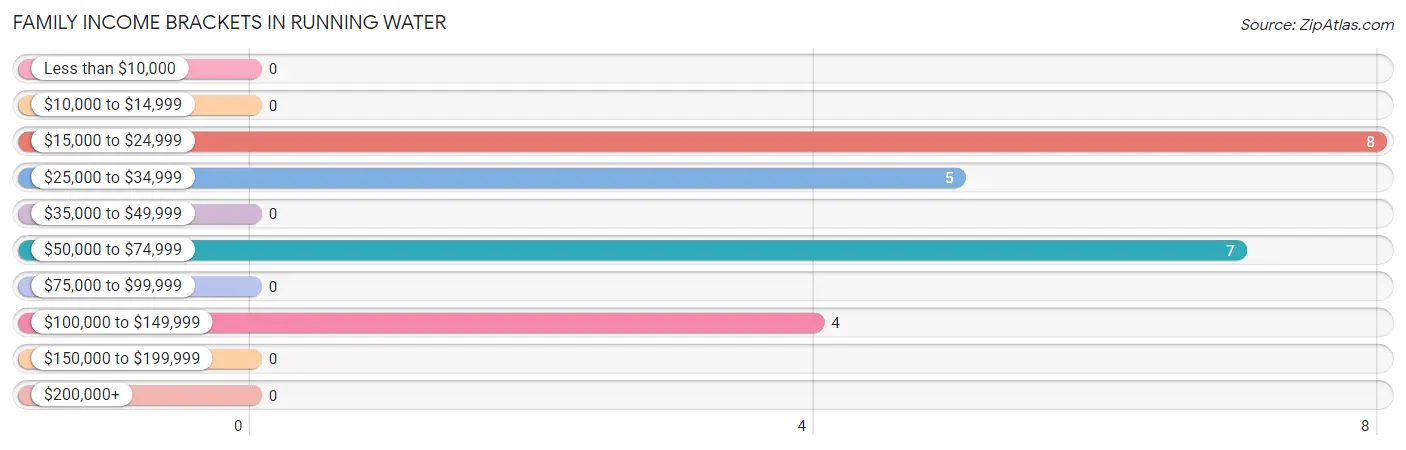
| Income Bracket | # Families | % Families |
| Less than $10,000 | 0 | 0.0% |
| $10,000 to $14,999 | 0 | 0.0% |
| $15,000 to $24,999 | 8 | 33.3% |
| $25,000 to $34,999 | 5 | 20.8% |
| $35,000 to $49,999 | 0 | 0.0% |
| $50,000 to $74,999 | 7 | 29.2% |
| $75,000 to $99,999 | 0 | 0.0% |
| $100,000 to $149,999 | 4 | 16.7% |
| $150,000 to $199,999 | 0 | 0.0% |
| $200,000+ | 0 | 0.0% |
Family Income by Famaliy Size in Running Water
| Income Bracket | # Families | Median Income |
| 2-Person Families | 19 (79.2%) | $0 |
| 3-Person Families | 5 (20.8%) | $0 |
| 4-Person Families | 0 (0.0%) | $0 |
| 5-Person Families | 0 (0.0%) | $0 |
| 6-Person Families | 0 (0.0%) | $0 |
| 7+ Person Families | 0 (0.0%) | $0 |
| Total | 24 (100.0%) | $0 |
Family Income by Number of Earners in Running Water
| Number of Earners | # Families | Median Income |
| No Earners | 8 (33.3%) | $0 |
| 1 Earner | 7 (29.2%) | $0 |
| 2 Earners | 9 (37.5%) | $0 |
| 3+ Earners | 0 (0.0%) | $0 |
| Total | 24 (100.0%) | $0 |
Household Income in Running Water
Household Income Brackets in Running Water
With 22 households falling in the category, the $10,000 to $14,999 income range is the most frequent in Running Water, accounting for 41.5% of all households.
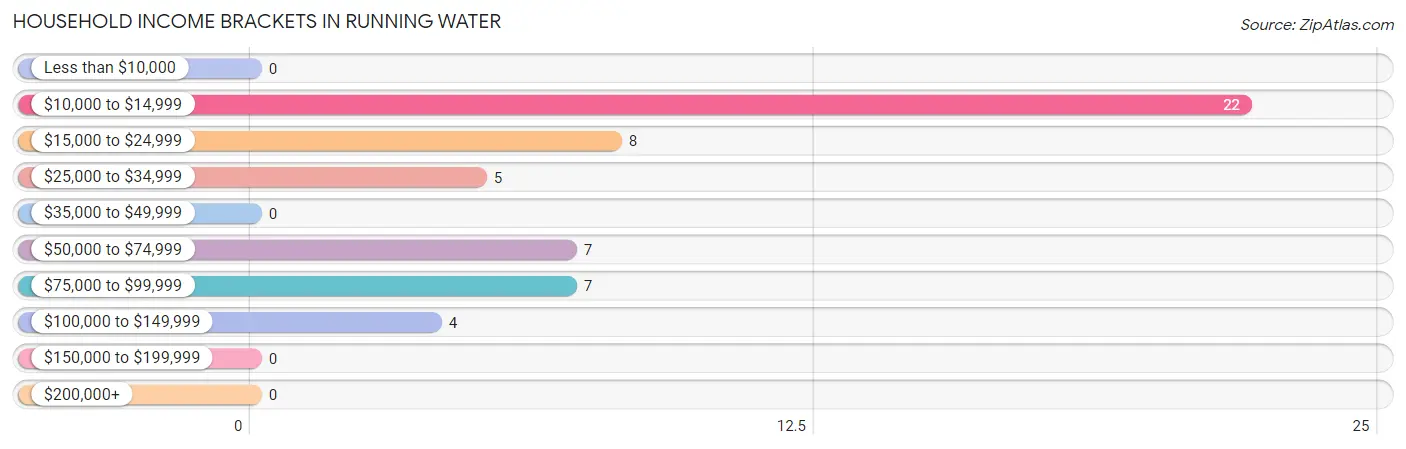
| Income Bracket | # Households | % Households |
| Less than $10,000 | 0 | 0.0% |
| $10,000 to $14,999 | 22 | 41.5% |
| $15,000 to $24,999 | 8 | 15.1% |
| $25,000 to $34,999 | 5 | 9.4% |
| $35,000 to $49,999 | 0 | 0.0% |
| $50,000 to $74,999 | 7 | 13.2% |
| $75,000 to $99,999 | 7 | 13.2% |
| $100,000 to $149,999 | 4 | 7.5% |
| $150,000 to $199,999 | 0 | 0.0% |
| $200,000+ | 0 | 0.0% |
Household Income by Householder Age in Running Water
The median household income in Running Water is $0, with the highest median household income of $14,602 found in the 65+ years age bracket for the primary householder. A total of 37 households (69.8%) fall into this category.
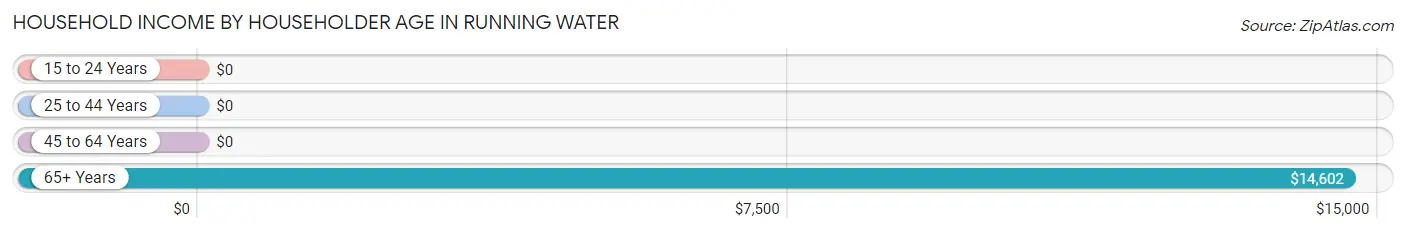
| Income Bracket | # Households | Median Income |
| 15 to 24 Years | 0 (0.0%) | $0 |
| 25 to 44 Years | 7 (13.2%) | $0 |
| 45 to 64 Years | 9 (17.0%) | $0 |
| 65+ Years | 37 (69.8%) | $14,602 |
| Total | 53 (100.0%) | $0 |
Poverty in Running Water
Income Below Poverty by Sex and Age in Running Water
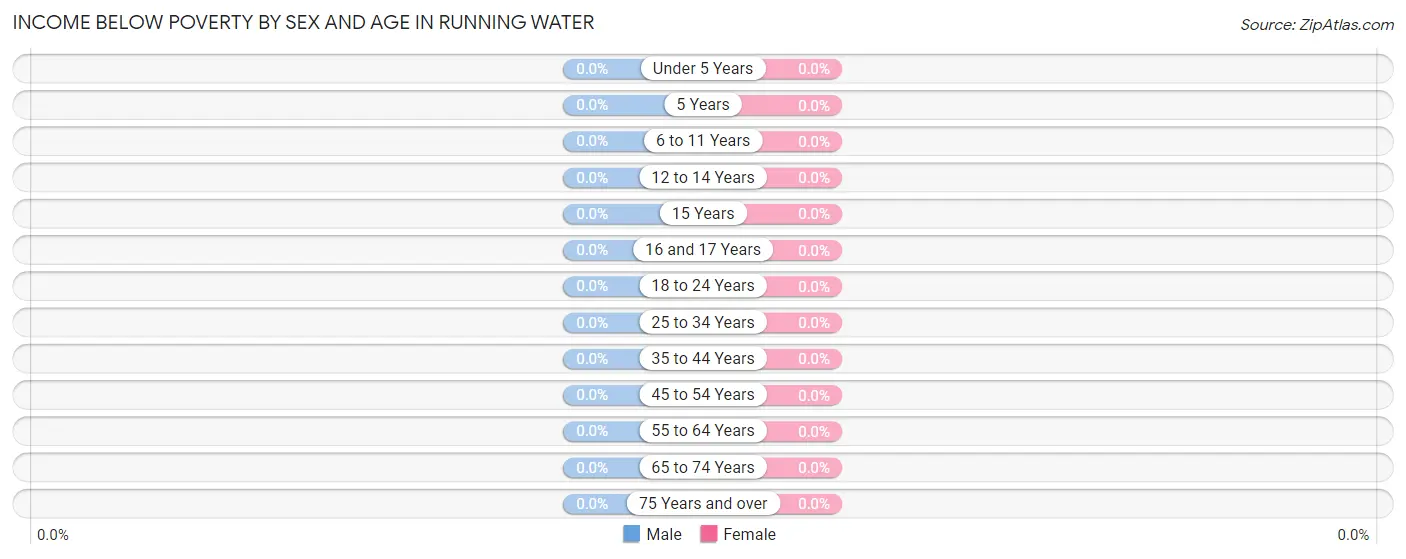
| Age Bracket | Male | Female |
| Under 5 Years | 0 (0.0%) | 0 (0.0%) |
| 5 Years | 0 (0.0%) | 0 (0.0%) |
| 6 to 11 Years | 0 (0.0%) | 0 (0.0%) |
| 12 to 14 Years | 0 (0.0%) | 0 (0.0%) |
| 15 Years | 0 (0.0%) | 0 (0.0%) |
| 16 and 17 Years | 0 (0.0%) | 0 (0.0%) |
| 18 to 24 Years | 0 (0.0%) | 0 (0.0%) |
| 25 to 34 Years | 0 (0.0%) | 0 (0.0%) |
| 35 to 44 Years | 0 (0.0%) | 0 (0.0%) |
| 45 to 54 Years | 0 (0.0%) | 0 (0.0%) |
| 55 to 64 Years | 0 (0.0%) | 0 (0.0%) |
| 65 to 74 Years | 0 (0.0%) | 0 (0.0%) |
| 75 Years and over | 0 (0.0%) | 0 (0.0%) |
| Total | 0 (0.0%) | 0 (0.0%) |
Income Above Poverty by Sex and Age in Running Water
According to the poverty statistics in Running Water, males aged 25 to 34 years and females aged 35 to 44 years are the age groups that are most secure financially, with 100.0% of males and 100.0% of females in these age groups living above the poverty line.
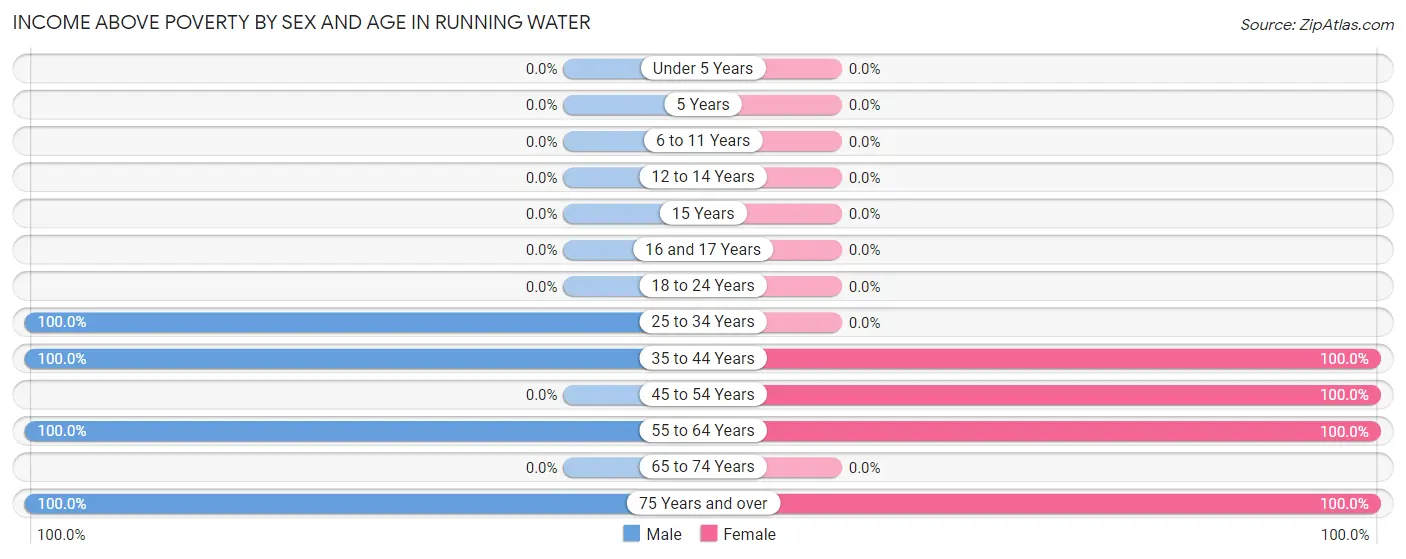
| Age Bracket | Male | Female |
| Under 5 Years | 0 (0.0%) | 0 (0.0%) |
| 5 Years | 0 (0.0%) | 0 (0.0%) |
| 6 to 11 Years | 0 (0.0%) | 0 (0.0%) |
| 12 to 14 Years | 0 (0.0%) | 0 (0.0%) |
| 15 Years | 0 (0.0%) | 0 (0.0%) |
| 16 and 17 Years | 0 (0.0%) | 0 (0.0%) |
| 18 to 24 Years | 0 (0.0%) | 0 (0.0%) |
| 25 to 34 Years | 1 (100.0%) | 0 (0.0%) |
| 35 to 44 Years | 7 (100.0%) | 8 (100.0%) |
| 45 to 54 Years | 0 (0.0%) | 6 (100.0%) |
| 55 to 64 Years | 2 (100.0%) | 6 (100.0%) |
| 65 to 74 Years | 0 (0.0%) | 0 (0.0%) |
| 75 Years and over | 31 (100.0%) | 15 (100.0%) |
| Total | 41 (100.0%) | 35 (100.0%) |
Income Below Poverty Among Married-Couple Families in Running Water
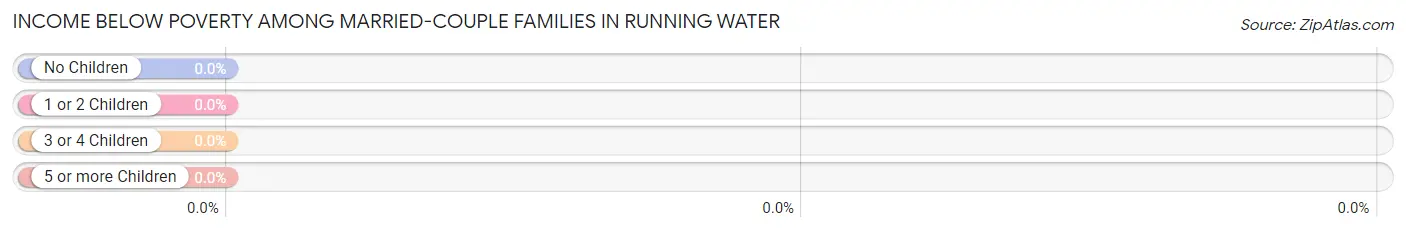
| Children | Above Poverty | Below Poverty |
| No Children | 12 (100.0%) | 0 (0.0%) |
| 1 or 2 Children | 0 (0.0%) | 0 (0.0%) |
| 3 or 4 Children | 0 (0.0%) | 0 (0.0%) |
| 5 or more Children | 0 (0.0%) | 0 (0.0%) |
| Total | 12 (100.0%) | 0 (0.0%) |
Income Below Poverty Among Single-Parent Households in Running Water
| Children | Single Father | Single Mother |
| No Children | 0 (0.0%) | 0 (0.0%) |
| 1 or 2 Children | 0 (0.0%) | 0 (0.0%) |
| 3 or 4 Children | 0 (0.0%) | 0 (0.0%) |
| 5 or more Children | 0 (0.0%) | 0 (0.0%) |
| Total | 0 (0.0%) | 0 (0.0%) |
Income Below Poverty Among Married-Couple vs Single-Parent Households in Running Water
| Children | Married-Couple Families | Single-Parent Households |
| No Children | 0 (0.0%) | 0 (0.0%) |
| 1 or 2 Children | 0 (0.0%) | 0 (0.0%) |
| 3 or 4 Children | 0 (0.0%) | 0 (0.0%) |
| 5 or more Children | 0 (0.0%) | 0 (0.0%) |
| Total | 0 (0.0%) | 0 (0.0%) |
Race in Running Water
The most populous races in Running Water are White / Caucasian (74 | 97.4%), and Two or more Races (2 | 2.6%).
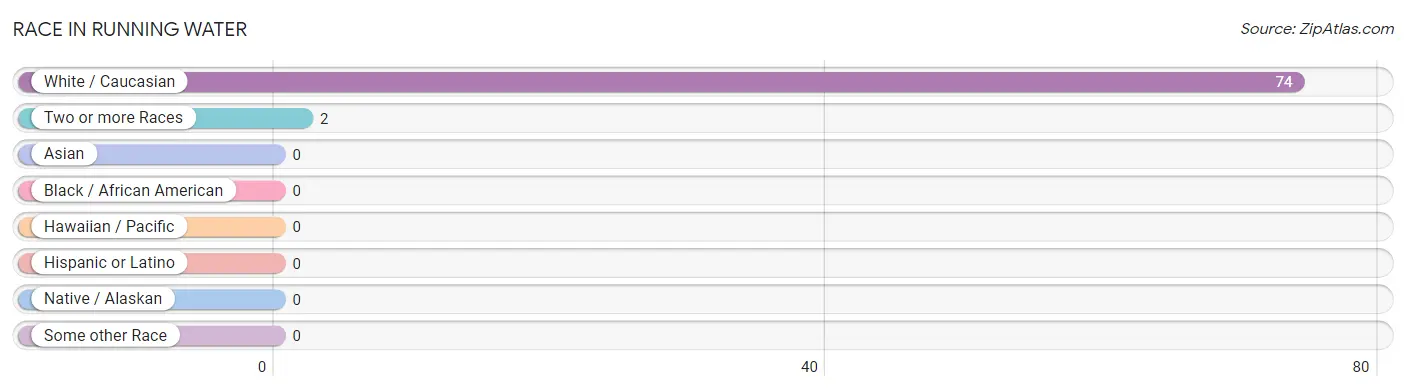
| Race | # Population | % Population |
| Asian | 0 | 0.0% |
| Black / African American | 0 | 0.0% |
| Hawaiian / Pacific | 0 | 0.0% |
| Hispanic or Latino | 0 | 0.0% |
| Native / Alaskan | 0 | 0.0% |
| White / Caucasian | 74 | 97.4% |
| Two or more Races | 2 | 2.6% |
| Some other Race | 0 | 0.0% |
| Total | 76 | 100.0% |
Ancestry in Running Water
The most populous ancestries reported in Running Water are German (50 | 65.8%), English (8 | 10.5%), Scottish (7 | 9.2%), Czech (4 | 5.3%), and Polish (4 | 5.3%), together accounting for 96.1% of all Running Water residents.
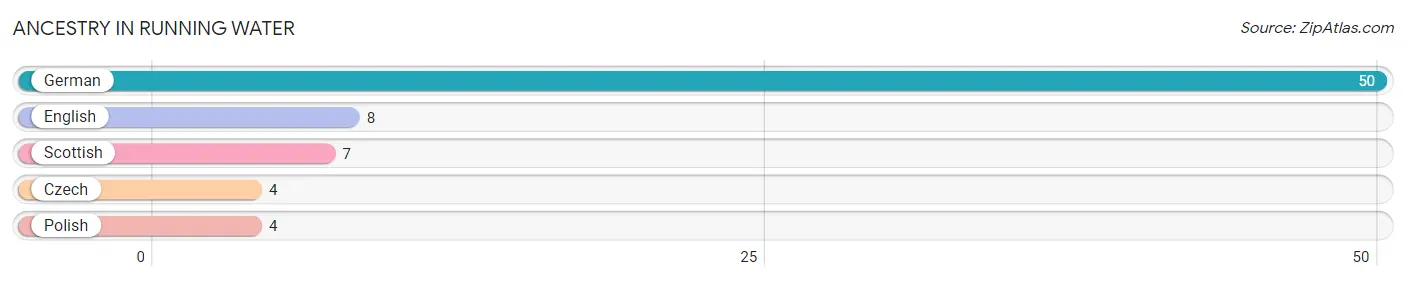
| Ancestry | # Population | % Population |
| Czech | 4 | 5.3% |
| English | 8 | 10.5% |
| German | 50 | 65.8% |
| Polish | 4 | 5.3% |
| Scottish | 7 | 9.2% | View All 5 Rows |
Immigrants in Running Water

| Immigration Origin | # Population | % Population | View All 0 Rows |
Sex and Age in Running Water
Sex and Age in Running Water
The most populous age groups in Running Water are 75 to 79 Years (22 | 53.7%) for men and 35 to 39 Years (8 | 22.9%) for women.
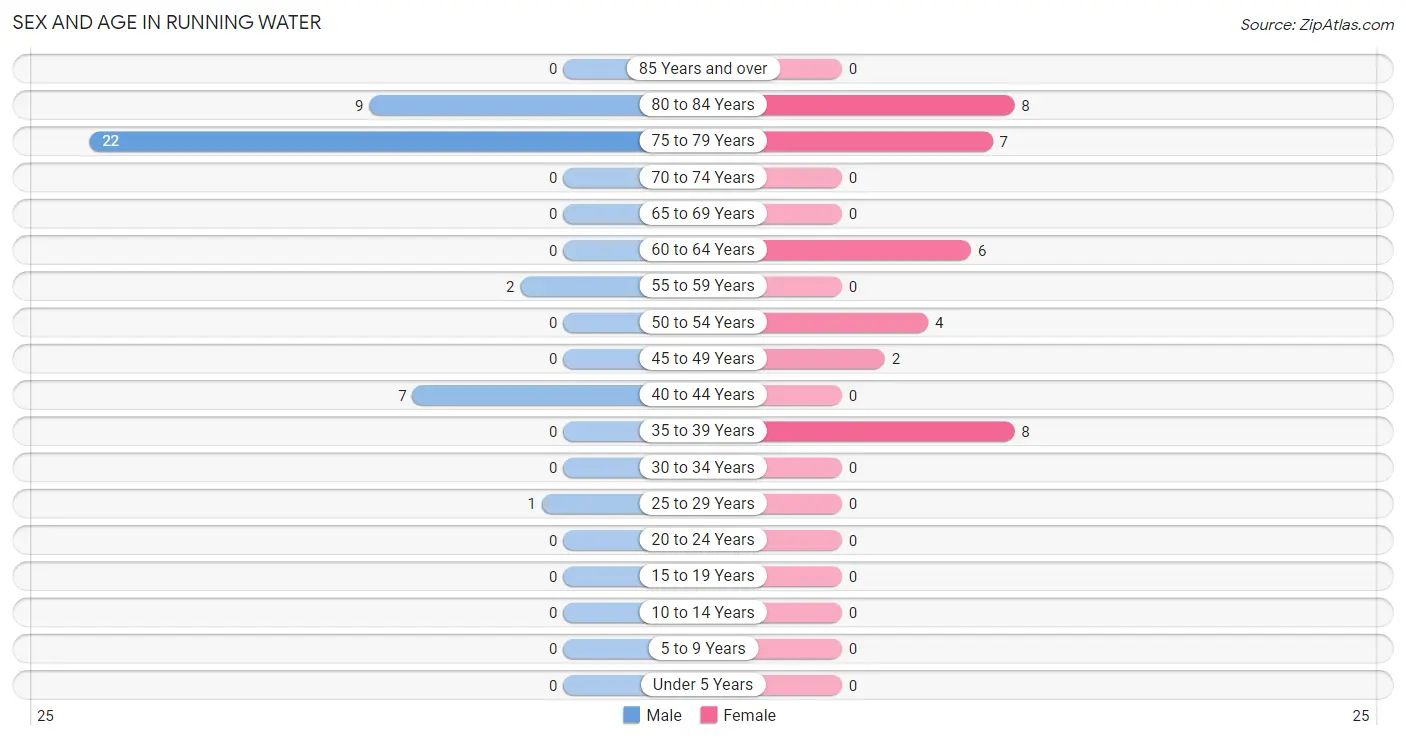
| Age Bracket | Male | Female |
| Under 5 Years | 0 (0.0%) | 0 (0.0%) |
| 5 to 9 Years | 0 (0.0%) | 0 (0.0%) |
| 10 to 14 Years | 0 (0.0%) | 0 (0.0%) |
| 15 to 19 Years | 0 (0.0%) | 0 (0.0%) |
| 20 to 24 Years | 0 (0.0%) | 0 (0.0%) |
| 25 to 29 Years | 1 (2.4%) | 0 (0.0%) |
| 30 to 34 Years | 0 (0.0%) | 0 (0.0%) |
| 35 to 39 Years | 0 (0.0%) | 8 (22.9%) |
| 40 to 44 Years | 7 (17.1%) | 0 (0.0%) |
| 45 to 49 Years | 0 (0.0%) | 2 (5.7%) |
| 50 to 54 Years | 0 (0.0%) | 4 (11.4%) |
| 55 to 59 Years | 2 (4.9%) | 0 (0.0%) |
| 60 to 64 Years | 0 (0.0%) | 6 (17.1%) |
| 65 to 69 Years | 0 (0.0%) | 0 (0.0%) |
| 70 to 74 Years | 0 (0.0%) | 0 (0.0%) |
| 75 to 79 Years | 22 (53.7%) | 7 (20.0%) |
| 80 to 84 Years | 9 (22.0%) | 8 (22.9%) |
| 85 Years and over | 0 (0.0%) | 0 (0.0%) |
| Total | 41 (100.0%) | 35 (100.0%) |
Families and Households in Running Water
Median Family Size in Running Water
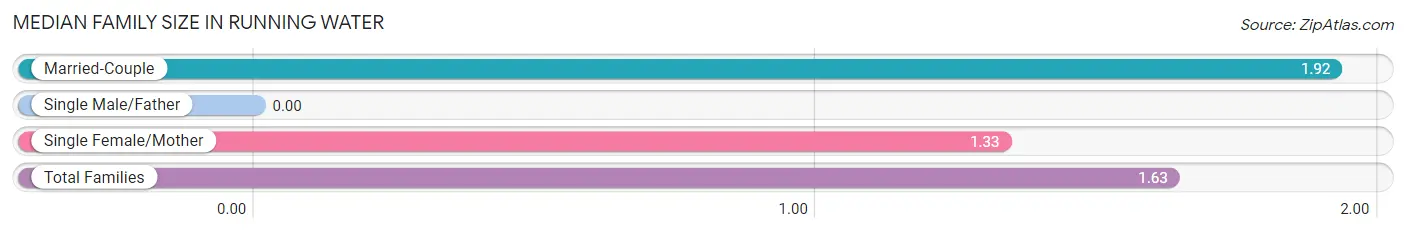
| Family Type | # Families | Family Size |
| Married-Couple | 12 (50.0%) | 1.92 |
| Single Male/Father | 0 (0.0%) | - |
| Single Female/Mother | 12 (50.0%) | 1.33 |
| Total Families | 24 (100.0%) | 1.63 |
Median Household Size in Running Water
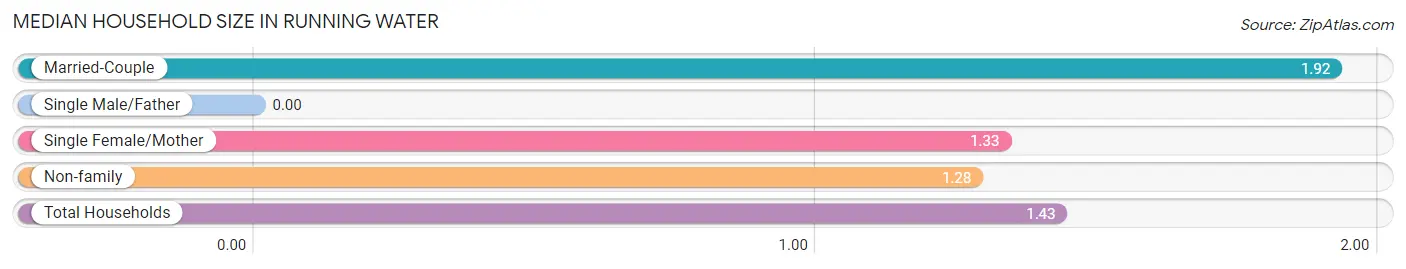
| Household Type | # Households | Household Size |
| Married-Couple | 12 (22.6%) | 1.92 |
| Single Male/Father | 0 (0.0%) | - |
| Single Female/Mother | 12 (22.6%) | 1.33 |
| Non-family | 29 (54.7%) | 1.28 |
| Total Households | 53 (100.0%) | 1.43 |
Household Size by Marriage Status in Running Water
Out of a total of 53 households in Running Water, 24 (45.3%) are family households, while 29 (54.7%) are nonfamily households. The most numerous type of family households are 2-person households, comprising 19, and the most common type of nonfamily households are 1-person households, comprising 22.
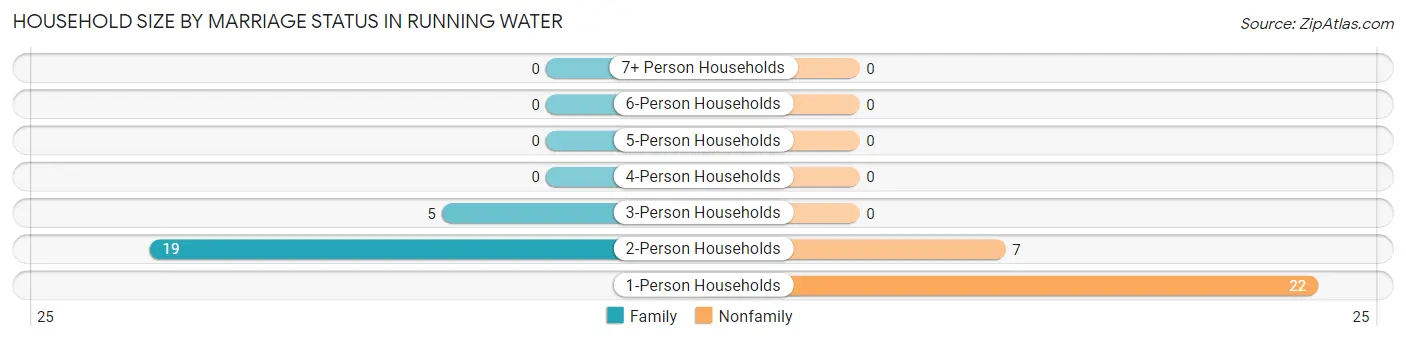
| Household Size | Family Households | Nonfamily Households |
| 1-Person Households | - | 22 (41.5%) |
| 2-Person Households | 19 (35.8%) | 7 (13.2%) |
| 3-Person Households | 5 (9.4%) | 0 (0.0%) |
| 4-Person Households | 0 (0.0%) | 0 (0.0%) |
| 5-Person Households | 0 (0.0%) | 0 (0.0%) |
| 6-Person Households | 0 (0.0%) | 0 (0.0%) |
| 7+ Person Households | 0 (0.0%) | 0 (0.0%) |
| Total | 24 (45.3%) | 29 (54.7%) |
Female Fertility in Running Water
Fertility by Age in Running Water
| Age Bracket | Women with Births | Births / 1,000 Women |
| 15 to 19 years | 0 (0.0%) | 0.0 |
| 20 to 34 years | 0 (0.0%) | 0.0 |
| 35 to 50 years | 0 (0.0%) | 0.0 |
| Total | 0 (0.0%) | 0.0 |
Fertility by Age by Marriage Status in Running Water
| Age Bracket | Married | Unmarried |
| 15 to 19 years | 0 (0.0%) | 0 (0.0%) |
| 20 to 34 years | 0 (0.0%) | 0 (0.0%) |
| 35 to 50 years | 0 (0.0%) | 0 (0.0%) |
| Total | 0 (0.0%) | 0 (0.0%) |
Fertility by Education in Running Water
| Educational Attainment | Women with Births | Births / 1,000 Women |
| Less than High School | 0 (0.0%) | 0.0 |
| High School Diploma | 0 (0.0%) | 0.0 |
| College or Associate's Degree | 0 (0.0%) | 0.0 |
| Bachelor's Degree | 0 (0.0%) | 0.0 |
| Graduate Degree | 0 (0.0%) | 0.0 |
| Total | 0 (0.0%) | 0.0 |
Fertility by Education by Marriage Status in Running Water
| Educational Attainment | Married | Unmarried |
| Less than High School | 0 (0.0%) | 0 (0.0%) |
| High School Diploma | 0 (0.0%) | 0 (0.0%) |
| College or Associate's Degree | 0 (0.0%) | 0 (0.0%) |
| Bachelor's Degree | 0 (0.0%) | 0 (0.0%) |
| Graduate Degree | 0 (0.0%) | 0 (0.0%) |
| Total | 0 (0.0%) | 0 (0.0%) |
Employment Characteristics in Running Water
Employment by Class of Employer in Running Water
Among the 25 employed individuals in Running Water, self-employed (not incorporated) (9 | 36.0%), state government employees (8 | 32.0%), and private company employees (7 | 28.0%) make up the most common classes of employment.
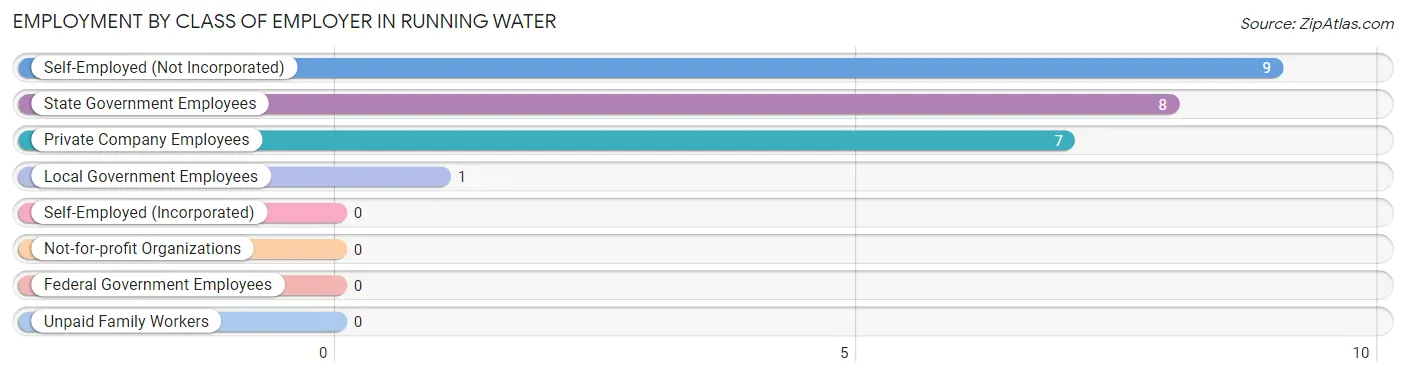
| Employer Class | # Employees | % Employees |
| Private Company Employees | 7 | 28.0% |
| Self-Employed (Incorporated) | 0 | 0.0% |
| Self-Employed (Not Incorporated) | 9 | 36.0% |
| Not-for-profit Organizations | 0 | 0.0% |
| Local Government Employees | 1 | 4.0% |
| State Government Employees | 8 | 32.0% |
| Federal Government Employees | 0 | 0.0% |
| Unpaid Family Workers | 0 | 0.0% |
| Total | 25 | 100.0% |
Employment Status by Age in Running Water
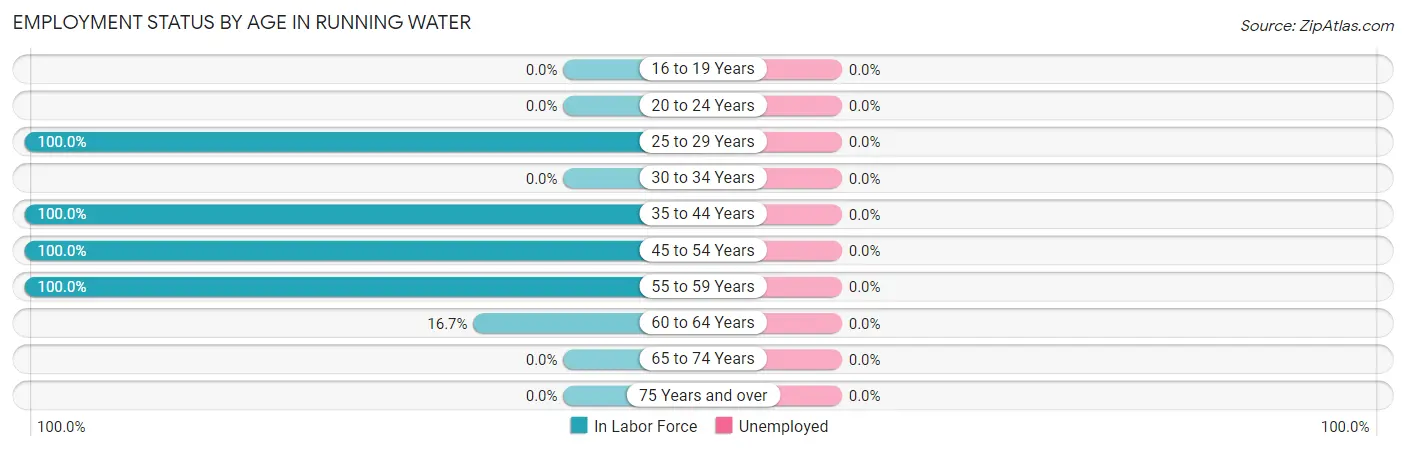
| Age Bracket | In Labor Force | Unemployed |
| 16 to 19 Years | 0 (0.0%) | 0 (0.0%) |
| 20 to 24 Years | 0 (0.0%) | 0 (0.0%) |
| 25 to 29 Years | 1 (100.0%) | 0 (0.0%) |
| 30 to 34 Years | 0 (0.0%) | 0 (0.0%) |
| 35 to 44 Years | 15 (100.0%) | 0 (0.0%) |
| 45 to 54 Years | 6 (100.0%) | 0 (0.0%) |
| 55 to 59 Years | 2 (100.0%) | 0 (0.0%) |
| 60 to 64 Years | 1 (16.7%) | 0 (0.0%) |
| 65 to 74 Years | 0 (0.0%) | 0 (0.0%) |
| 75 Years and over | 0 (0.0%) | 0 (0.0%) |
| Total | 25 (32.9%) | 0 (0.0%) |
Employment Status by Educational Attainment in Running Water
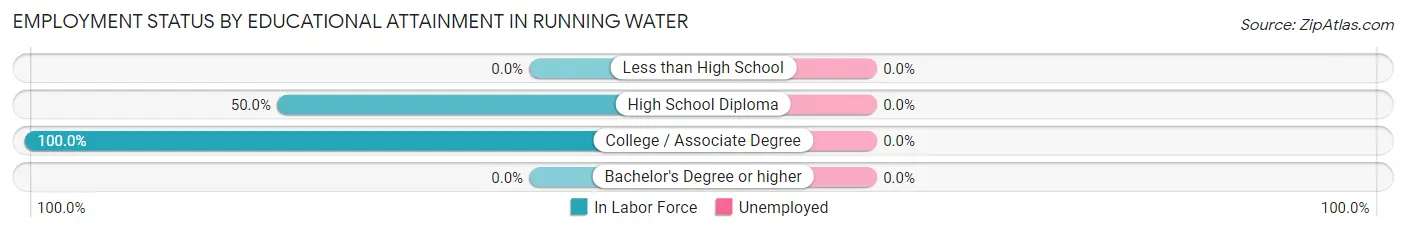
| Educational Attainment | In Labor Force | Unemployed |
| Less than High School | 0 (0.0%) | 0 (0.0%) |
| High School Diploma | 5 (50.0%) | 0 (0.0%) |
| College / Associate Degree | 20 (100.0%) | 0 (0.0%) |
| Bachelor's Degree or higher | 0 (0.0%) | 0 (0.0%) |
| Total | 25 (83.3%) | 0 (0.0%) |
Employment Occupations by Sex in Running Water
Management, Business, Science and Arts Occupations
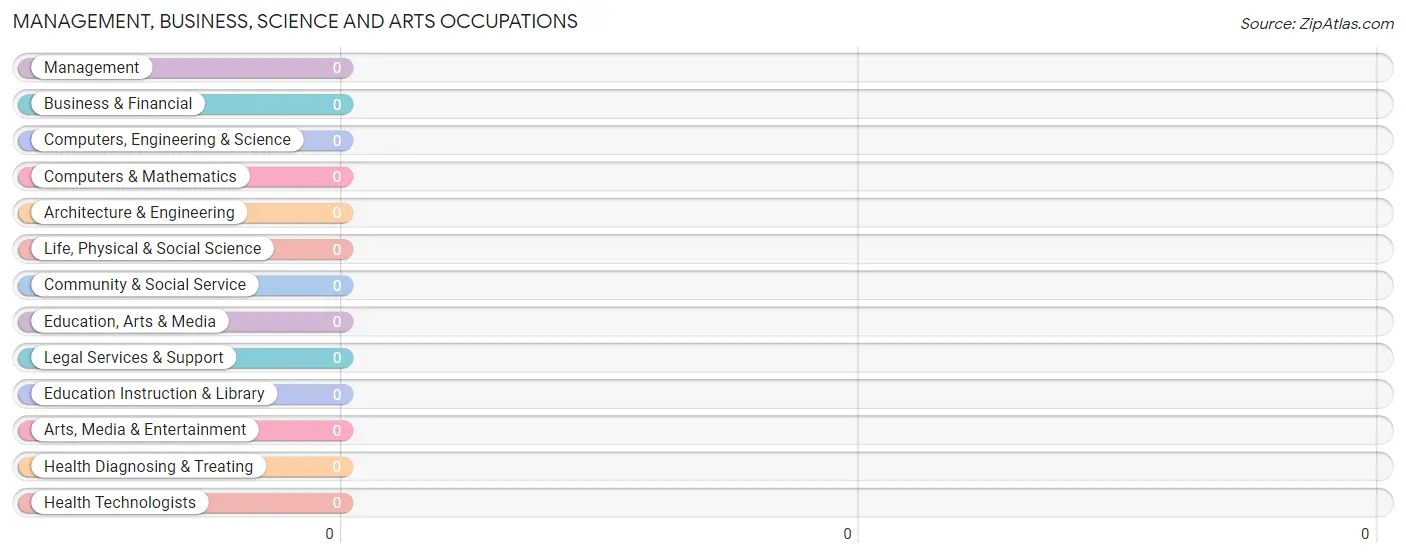
Management, Business, Science and Arts Occupations by Sex
| Occupation | Male | Female |
| Management | 0 (0.0%) | 0 (0.0%) |
| Business & Financial | 0 (0.0%) | 0 (0.0%) |
| Computers, Engineering & Science | 0 (0.0%) | 0 (0.0%) |
| Computers & Mathematics | 0 (0.0%) | 0 (0.0%) |
| Architecture & Engineering | 0 (0.0%) | 0 (0.0%) |
| Life, Physical & Social Science | 0 (0.0%) | 0 (0.0%) |
| Community & Social Service | 0 (0.0%) | 0 (0.0%) |
| Education, Arts & Media | 0 (0.0%) | 0 (0.0%) |
| Legal Services & Support | 0 (0.0%) | 0 (0.0%) |
| Education Instruction & Library | 0 (0.0%) | 0 (0.0%) |
| Arts, Media & Entertainment | 0 (0.0%) | 0 (0.0%) |
| Health Diagnosing & Treating | 0 (0.0%) | 0 (0.0%) |
| Health Technologists | 0 (0.0%) | 0 (0.0%) |
| Total (Category) | 0 (0.0%) | 0 (0.0%) |
| Total (Overall) | 10 (40.0%) | 15 (60.0%) |
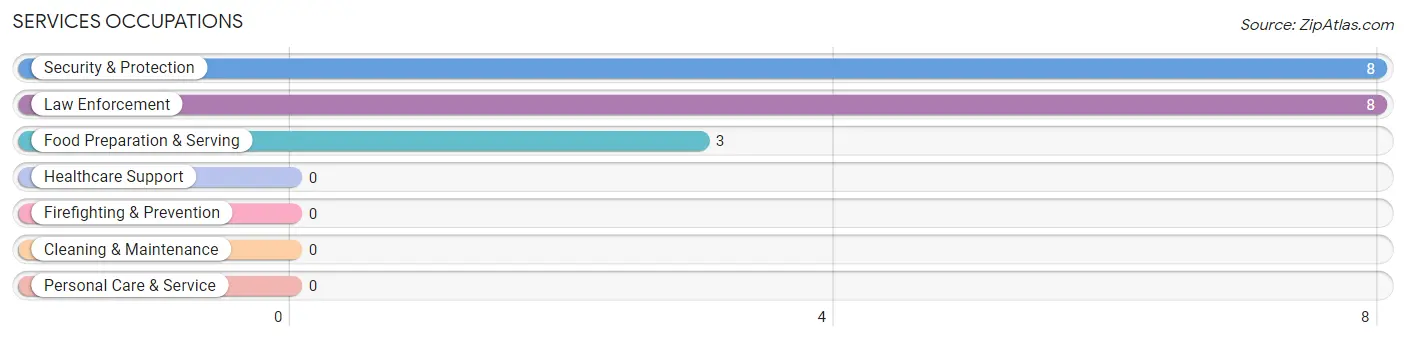
Services Occupations
The most common Services occupations in Running Water are Security & Protection (8 | 32.0%), Law Enforcement (8 | 32.0%), and Food Preparation & Serving (3 | 12.0%).
Services Occupations by Sex
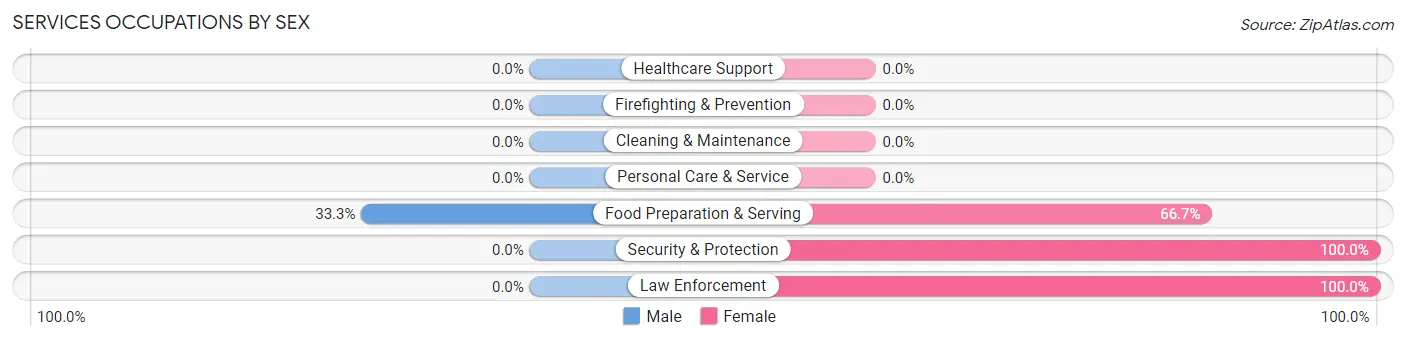
| Occupation | Male | Female |
| Healthcare Support | 0 (0.0%) | 0 (0.0%) |
| Security & Protection | 0 (0.0%) | 8 (100.0%) |
| Firefighting & Prevention | 0 (0.0%) | 0 (0.0%) |
| Law Enforcement | 0 (0.0%) | 8 (100.0%) |
| Food Preparation & Serving | 1 (33.3%) | 2 (66.7%) |
| Cleaning & Maintenance | 0 (0.0%) | 0 (0.0%) |
| Personal Care & Service | 0 (0.0%) | 0 (0.0%) |
| Total (Category) | 1 (9.1%) | 10 (90.9%) |
| Total (Overall) | 10 (40.0%) | 15 (60.0%) |
Sales and Office Occupations
The most common Sales and Office occupations in Running Water are , and Office & Administration (1 | 4.0%).
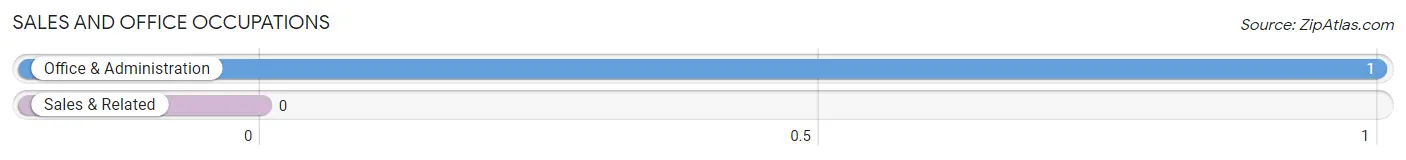
Sales and Office Occupations by Sex
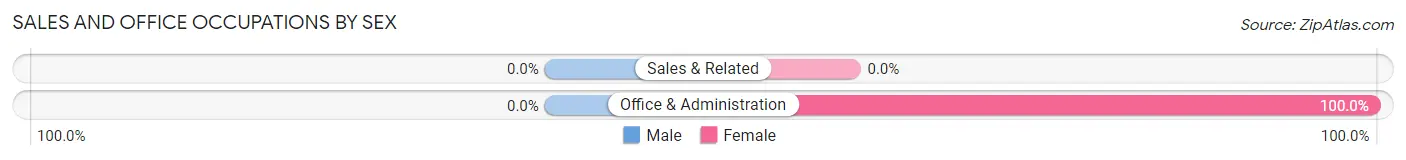
| Occupation | Male | Female |
| Sales & Related | 0 (0.0%) | 0 (0.0%) |
| Office & Administration | 0 (0.0%) | 1 (100.0%) |
| Total (Category) | 0 (0.0%) | 1 (100.0%) |
| Total (Overall) | 10 (40.0%) | 15 (60.0%) |
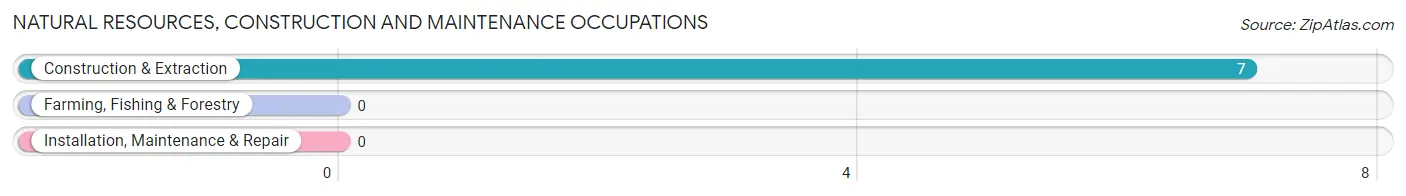
Natural Resources, Construction and Maintenance Occupations
The most common Natural Resources, Construction and Maintenance occupations in Running Water are , and Construction & Extraction (7 | 28.0%).
Natural Resources, Construction and Maintenance Occupations by Sex
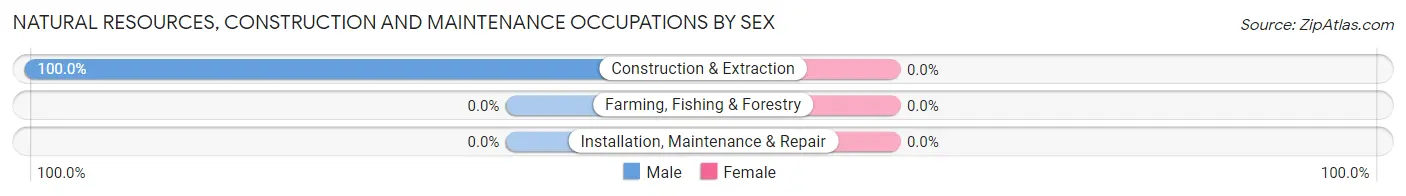
| Occupation | Male | Female |
| Farming, Fishing & Forestry | 0 (0.0%) | 0 (0.0%) |
| Construction & Extraction | 7 (100.0%) | 0 (0.0%) |
| Installation, Maintenance & Repair | 0 (0.0%) | 0 (0.0%) |
| Total (Category) | 7 (100.0%) | 0 (0.0%) |
| Total (Overall) | 10 (40.0%) | 15 (60.0%) |
Production, Transportation and Moving Occupations
The most common Production, Transportation and Moving occupations in Running Water are , and Production (6 | 24.0%).
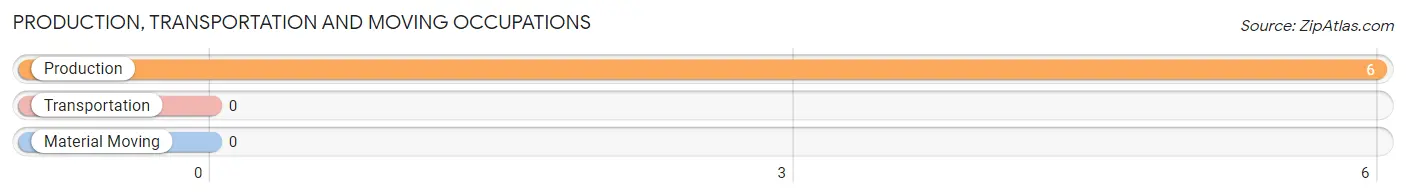
Production, Transportation and Moving Occupations by Sex
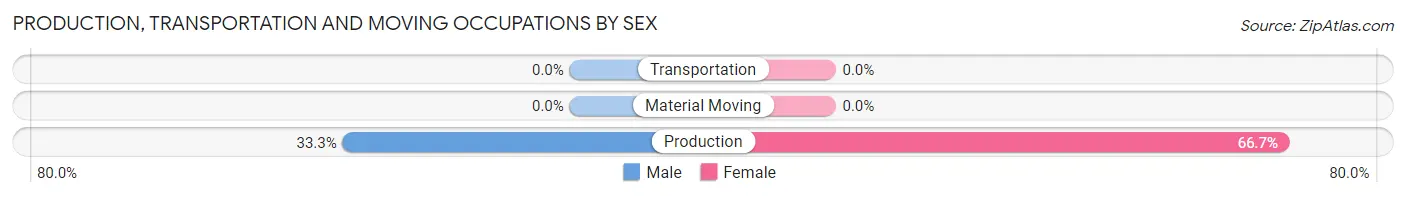
| Occupation | Male | Female |
| Production | 2 (33.3%) | 4 (66.7%) |
| Transportation | 0 (0.0%) | 0 (0.0%) |
| Material Moving | 0 (0.0%) | 0 (0.0%) |
| Total (Category) | 2 (33.3%) | 4 (66.7%) |
| Total (Overall) | 10 (40.0%) | 15 (60.0%) |
Employment Industries by Sex in Running Water
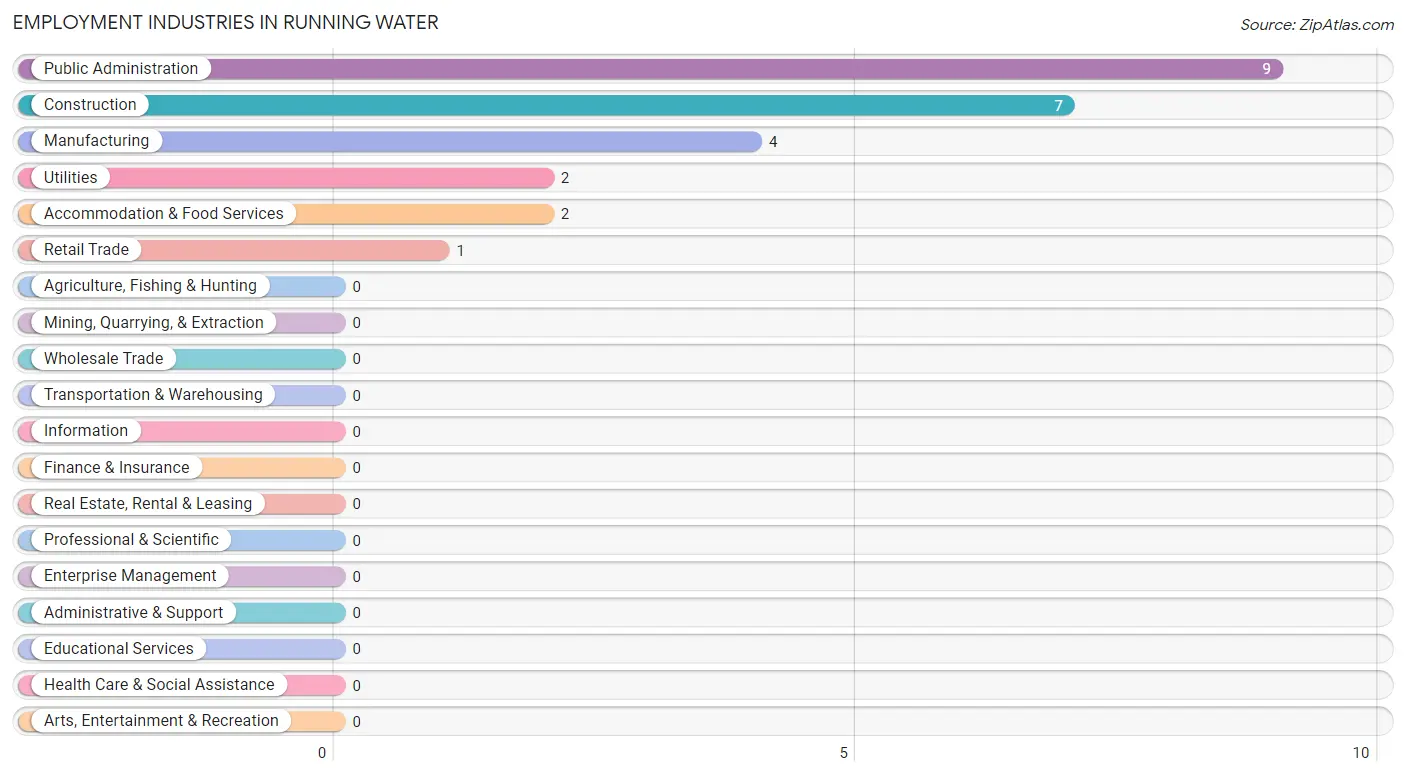
Employment Industries in Running Water
The major employment industries in Running Water include Public Administration (9 | 36.0%), Construction (7 | 28.0%), Manufacturing (4 | 16.0%), Utilities (2 | 8.0%), and Accommodation & Food Services (2 | 8.0%).
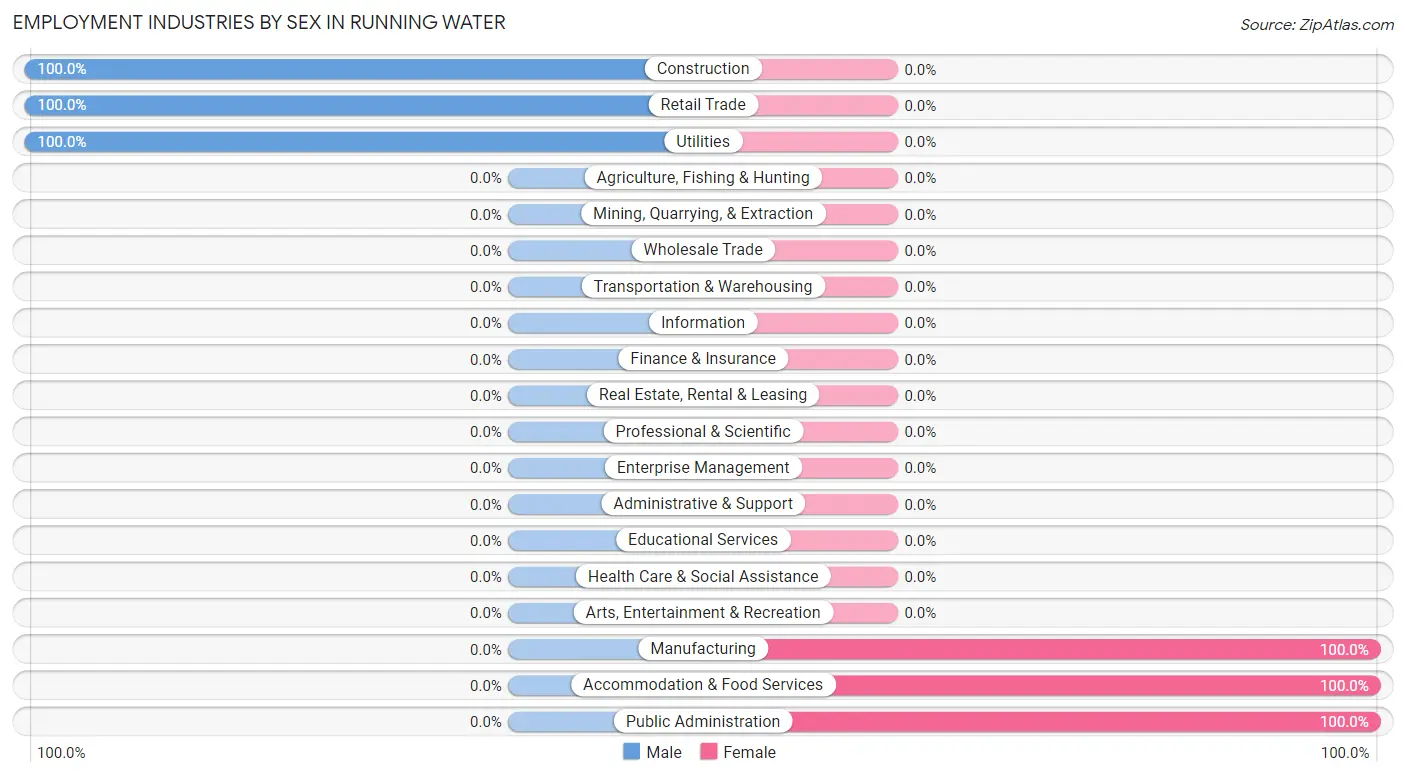
Employment Industries by Sex in Running Water
The Running Water industries that see more men than women are Construction (100.0%), Retail Trade (100.0%), and Utilities (100.0%), whereas the industries that tend to have a higher number of women are Manufacturing (100.0%), Accommodation & Food Services (100.0%), and Public Administration (100.0%).
| Industry | Male | Female |
| Agriculture, Fishing & Hunting | 0 (0.0%) | 0 (0.0%) |
| Mining, Quarrying, & Extraction | 0 (0.0%) | 0 (0.0%) |
| Construction | 7 (100.0%) | 0 (0.0%) |
| Manufacturing | 0 (0.0%) | 4 (100.0%) |
| Wholesale Trade | 0 (0.0%) | 0 (0.0%) |
| Retail Trade | 1 (100.0%) | 0 (0.0%) |
| Transportation & Warehousing | 0 (0.0%) | 0 (0.0%) |
| Utilities | 2 (100.0%) | 0 (0.0%) |
| Information | 0 (0.0%) | 0 (0.0%) |
| Finance & Insurance | 0 (0.0%) | 0 (0.0%) |
| Real Estate, Rental & Leasing | 0 (0.0%) | 0 (0.0%) |
| Professional & Scientific | 0 (0.0%) | 0 (0.0%) |
| Enterprise Management | 0 (0.0%) | 0 (0.0%) |
| Administrative & Support | 0 (0.0%) | 0 (0.0%) |
| Educational Services | 0 (0.0%) | 0 (0.0%) |
| Health Care & Social Assistance | 0 (0.0%) | 0 (0.0%) |
| Arts, Entertainment & Recreation | 0 (0.0%) | 0 (0.0%) |
| Accommodation & Food Services | 0 (0.0%) | 2 (100.0%) |
| Public Administration | 0 (0.0%) | 9 (100.0%) |
| Total | 10 (40.0%) | 15 (60.0%) |
Education in Running Water
School Enrollment in Running Water
| School Level | # Students | % Students |
| Nursery / Preschool | 0 | 0.0% |
| Kindergarten | 0 | 0.0% |
| Elementary School | 0 | 0.0% |
| Middle School | 0 | 0.0% |
| High School | 0 | 0.0% |
| College / Undergraduate | 0 | 0.0% |
| Graduate / Professional | 0 | 0.0% |
| Total | 0 | 0.0% |
School Enrollment by Age by Funding Source in Running Water
| Age Bracket | Public School | Private School |
| 3 to 4 Year Olds | 0 (0.0%) | 0 (0.0%) |
| 5 to 9 Year Old | 0 (0.0%) | 0 (0.0%) |
| 10 to 14 Year Olds | 0 (0.0%) | 0 (0.0%) |
| 15 to 17 Year Olds | 0 (0.0%) | 0 (0.0%) |
| 18 to 19 Year Olds | 0 (0.0%) | 0 (0.0%) |
| 20 to 24 Year Olds | 0 (0.0%) | 0 (0.0%) |
| 25 to 34 Year Olds | 0 (0.0%) | 0 (0.0%) |
| 35 Years and over | 0 (0.0%) | 0 (0.0%) |
| Total | 0 (0.0%) | 0 (0.0%) |
Educational Attainment by Field of Study in Running Water
, and business (22 | 100.0%) are the most common fields of study among 22 individuals in Running Water who have obtained a bachelor's degree or higher.
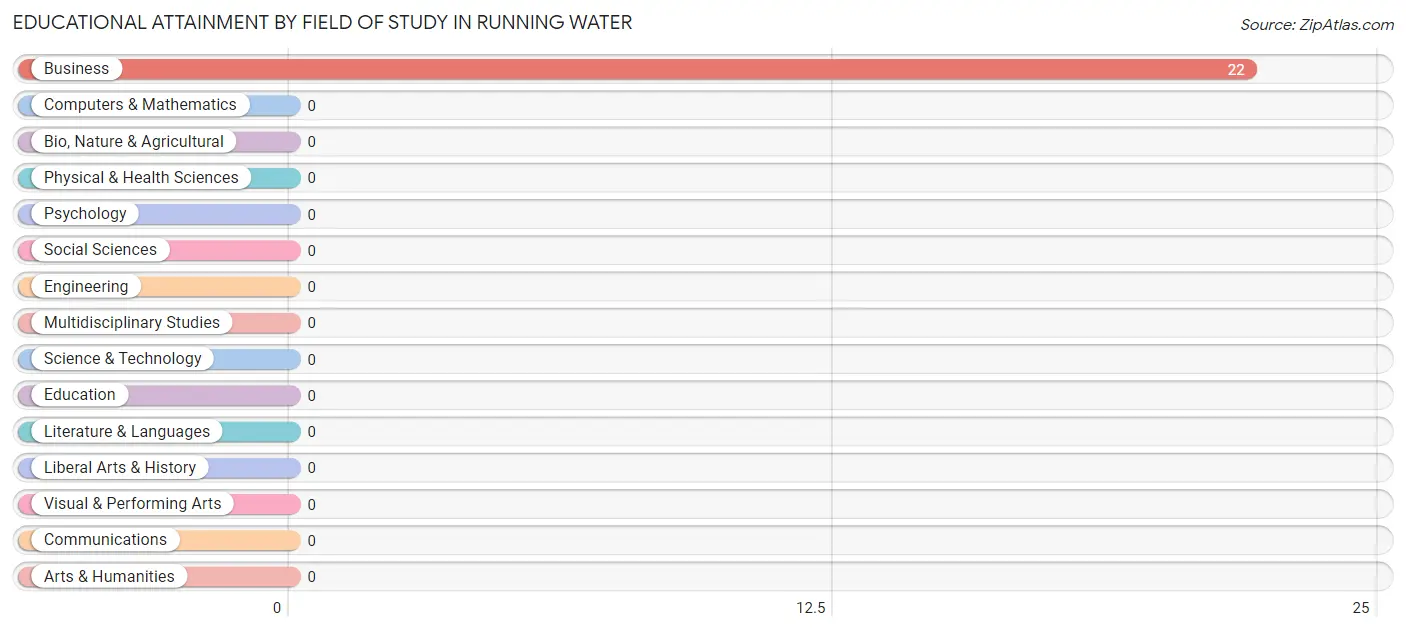
| Field of Study | # Graduates | % Graduates |
| Computers & Mathematics | 0 | 0.0% |
| Bio, Nature & Agricultural | 0 | 0.0% |
| Physical & Health Sciences | 0 | 0.0% |
| Psychology | 0 | 0.0% |
| Social Sciences | 0 | 0.0% |
| Engineering | 0 | 0.0% |
| Multidisciplinary Studies | 0 | 0.0% |
| Science & Technology | 0 | 0.0% |
| Business | 22 | 100.0% |
| Education | 0 | 0.0% |
| Literature & Languages | 0 | 0.0% |
| Liberal Arts & History | 0 | 0.0% |
| Visual & Performing Arts | 0 | 0.0% |
| Communications | 0 | 0.0% |
| Arts & Humanities | 0 | 0.0% |
| Total | 22 | 100.0% |
Transportation & Commute in Running Water
Vehicle Availability by Sex in Running Water
The most prevalent vehicle ownership categories in Running Water are males with 3 vehicles (7, accounting for 70.0%) and females with 3 vehicles (8, making up 46.7%).
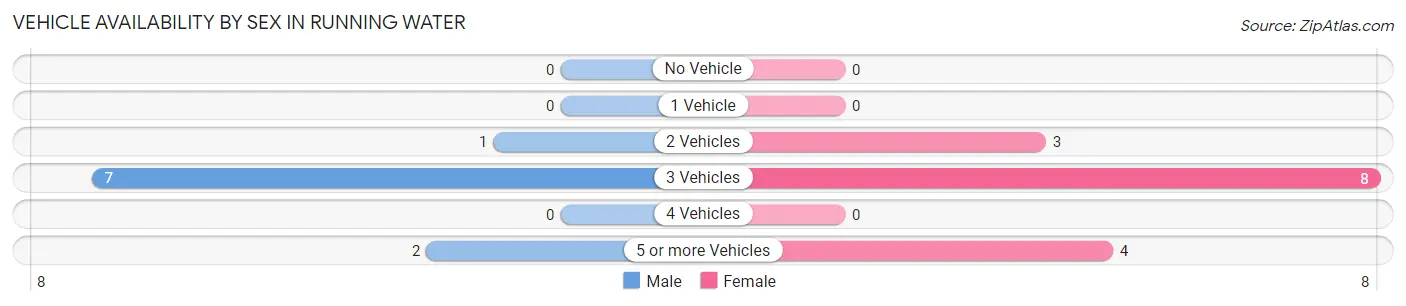
| Vehicles Available | Male | Female |
| No Vehicle | 0 (0.0%) | 0 (0.0%) |
| 1 Vehicle | 0 (0.0%) | 0 (0.0%) |
| 2 Vehicles | 1 (10.0%) | 3 (20.0%) |
| 3 Vehicles | 7 (70.0%) | 8 (53.3%) |
| 4 Vehicles | 0 (0.0%) | 0 (0.0%) |
| 5 or more Vehicles | 2 (20.0%) | 4 (26.7%) |
| Total | 10 (100.0%) | 15 (100.0%) |
Commute Time in Running Water
The most frequently occuring commute durations in Running Water are 15 to 19 minutes (12 commuters, 48.0%), less than 5 minutes (7 commuters, 28.0%), and 20 to 24 minutes (3 commuters, 12.0%).
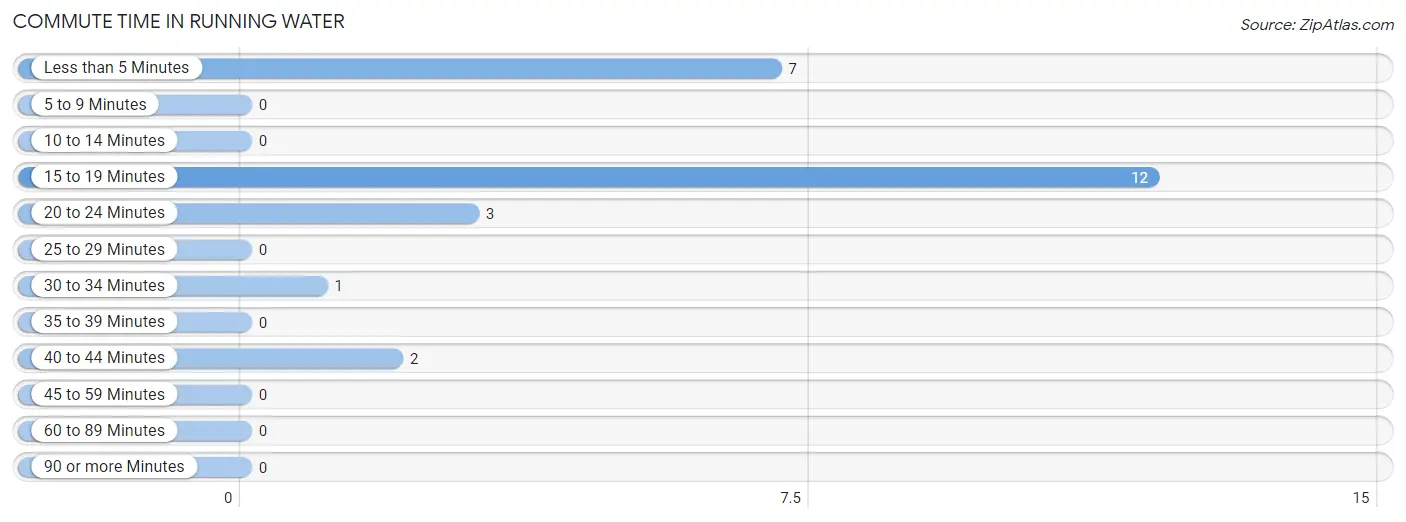
| Commute Time | # Commuters | % Commuters |
| Less than 5 Minutes | 7 | 28.0% |
| 5 to 9 Minutes | 0 | 0.0% |
| 10 to 14 Minutes | 0 | 0.0% |
| 15 to 19 Minutes | 12 | 48.0% |
| 20 to 24 Minutes | 3 | 12.0% |
| 25 to 29 Minutes | 0 | 0.0% |
| 30 to 34 Minutes | 1 | 4.0% |
| 35 to 39 Minutes | 0 | 0.0% |
| 40 to 44 Minutes | 2 | 8.0% |
| 45 to 59 Minutes | 0 | 0.0% |
| 60 to 89 Minutes | 0 | 0.0% |
| 90 or more Minutes | 0 | 0.0% |
Commute Time by Sex in Running Water
The most common commute times in Running Water are less than 5 minutes (7 commuters, 70.0%) for males and 15 to 19 minutes (12 commuters, 80.0%) for females.
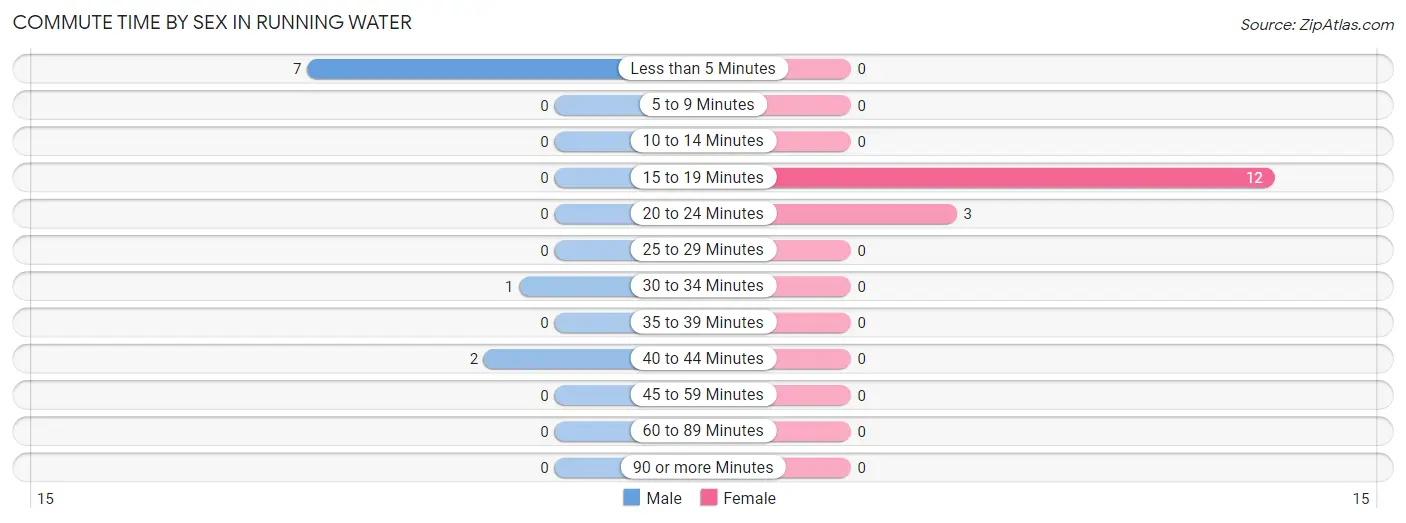
| Commute Time | Male | Female |
| Less than 5 Minutes | 7 (70.0%) | 0 (0.0%) |
| 5 to 9 Minutes | 0 (0.0%) | 0 (0.0%) |
| 10 to 14 Minutes | 0 (0.0%) | 0 (0.0%) |
| 15 to 19 Minutes | 0 (0.0%) | 12 (80.0%) |
| 20 to 24 Minutes | 0 (0.0%) | 3 (20.0%) |
| 25 to 29 Minutes | 0 (0.0%) | 0 (0.0%) |
| 30 to 34 Minutes | 1 (10.0%) | 0 (0.0%) |
| 35 to 39 Minutes | 0 (0.0%) | 0 (0.0%) |
| 40 to 44 Minutes | 2 (20.0%) | 0 (0.0%) |
| 45 to 59 Minutes | 0 (0.0%) | 0 (0.0%) |
| 60 to 89 Minutes | 0 (0.0%) | 0 (0.0%) |
| 90 or more Minutes | 0 (0.0%) | 0 (0.0%) |
Time of Departure to Work by Sex in Running Water
The most frequent times of departure to work in Running Water are 9:00 AM to 9:59 AM (7, 70.0%) for males and 5:30 AM to 5:59 AM (12, 80.0%) for females.
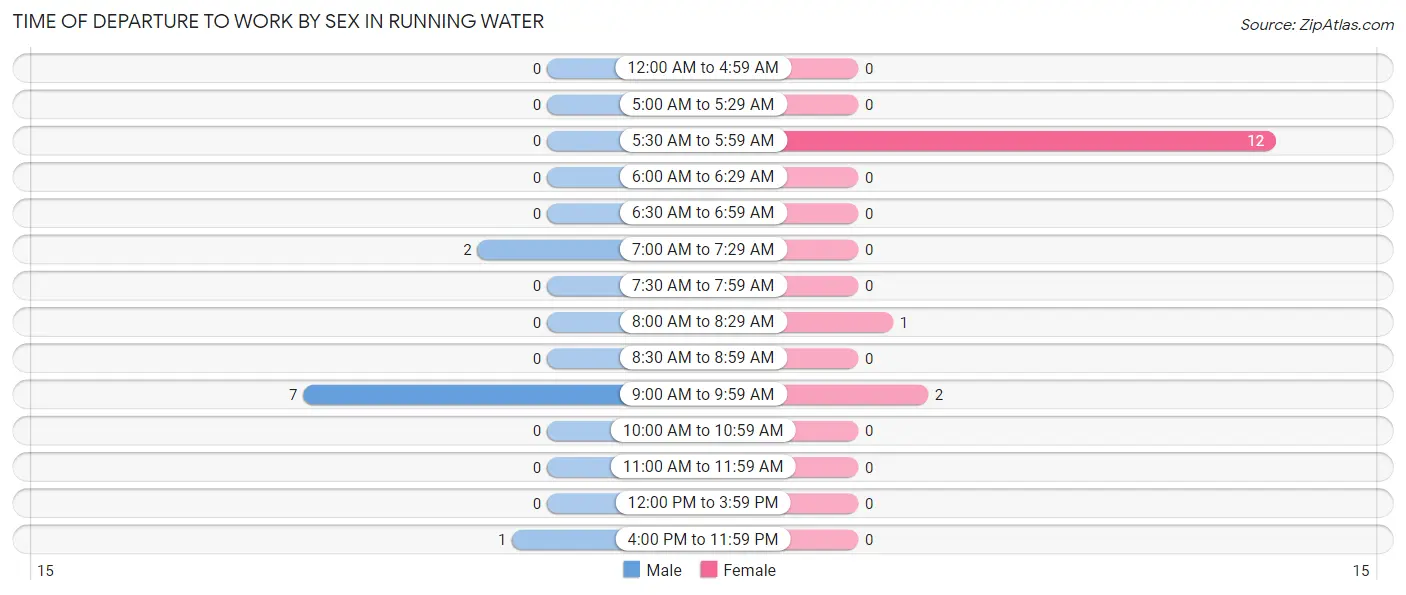
| Time of Departure | Male | Female |
| 12:00 AM to 4:59 AM | 0 (0.0%) | 0 (0.0%) |
| 5:00 AM to 5:29 AM | 0 (0.0%) | 0 (0.0%) |
| 5:30 AM to 5:59 AM | 0 (0.0%) | 12 (80.0%) |
| 6:00 AM to 6:29 AM | 0 (0.0%) | 0 (0.0%) |
| 6:30 AM to 6:59 AM | 0 (0.0%) | 0 (0.0%) |
| 7:00 AM to 7:29 AM | 2 (20.0%) | 0 (0.0%) |
| 7:30 AM to 7:59 AM | 0 (0.0%) | 0 (0.0%) |
| 8:00 AM to 8:29 AM | 0 (0.0%) | 1 (6.7%) |
| 8:30 AM to 8:59 AM | 0 (0.0%) | 0 (0.0%) |
| 9:00 AM to 9:59 AM | 7 (70.0%) | 2 (13.3%) |
| 10:00 AM to 10:59 AM | 0 (0.0%) | 0 (0.0%) |
| 11:00 AM to 11:59 AM | 0 (0.0%) | 0 (0.0%) |
| 12:00 PM to 3:59 PM | 0 (0.0%) | 0 (0.0%) |
| 4:00 PM to 11:59 PM | 1 (10.0%) | 0 (0.0%) |
| Total | 10 (100.0%) | 15 (100.0%) |
Housing Occupancy in Running Water
Occupancy by Ownership in Running Water
Of the total 53 dwellings in Running Water, owner-occupied units account for 48 (90.6%), while renter-occupied units make up 5 (9.4%).
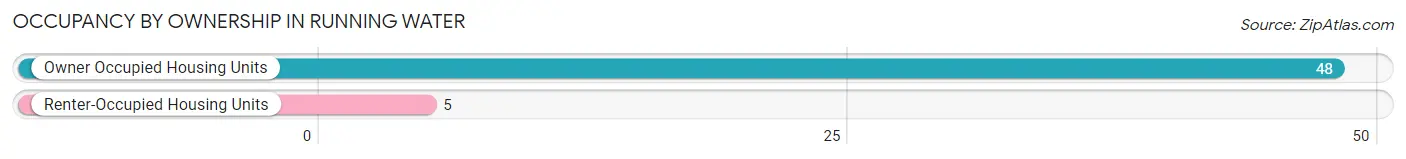
| Occupancy | # Housing Units | % Housing Units |
| Owner Occupied Housing Units | 48 | 90.6% |
| Renter-Occupied Housing Units | 5 | 9.4% |
| Total Occupied Housing Units | 53 | 100.0% |
Occupancy by Household Size in Running Water
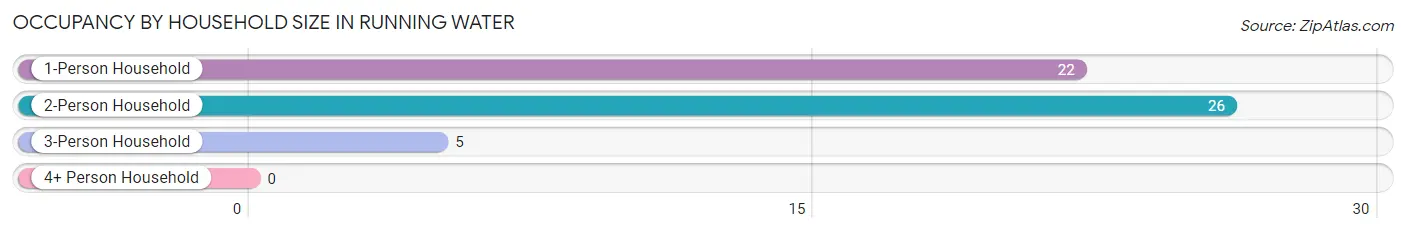
| Household Size | # Housing Units | % Housing Units |
| 1-Person Household | 22 | 41.5% |
| 2-Person Household | 26 | 49.1% |
| 3-Person Household | 5 | 9.4% |
| 4+ Person Household | 0 | 0.0% |
| Total Housing Units | 53 | 100.0% |
Occupancy by Ownership by Household Size in Running Water
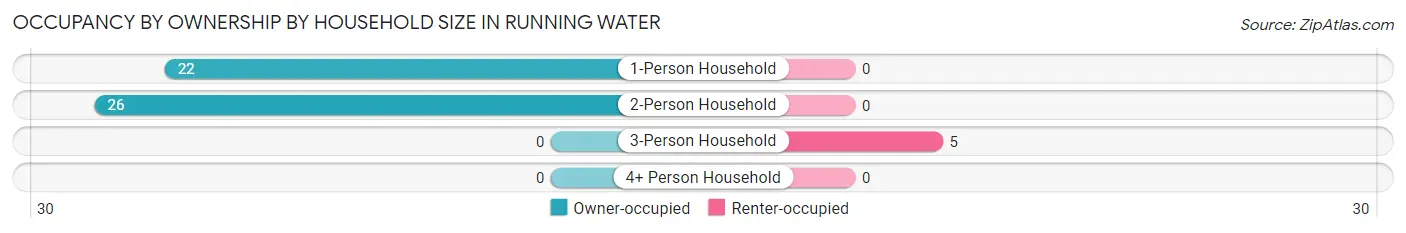
| Household Size | Owner-occupied | Renter-occupied |
| 1-Person Household | 22 (100.0%) | 0 (0.0%) |
| 2-Person Household | 26 (100.0%) | 0 (0.0%) |
| 3-Person Household | 0 (0.0%) | 5 (100.0%) |
| 4+ Person Household | 0 (0.0%) | 0 (0.0%) |
| Total Housing Units | 48 (90.6%) | 5 (9.4%) |
Occupancy by Educational Attainment in Running Water
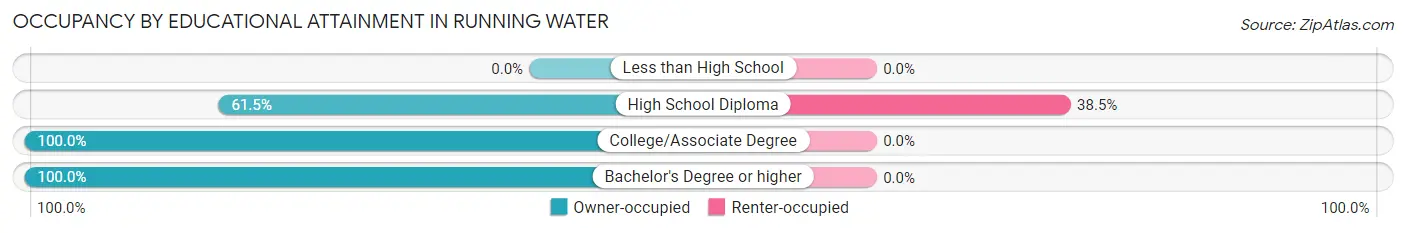
| Household Size | Owner-occupied | Renter-occupied |
| Less than High School | 0 (0.0%) | 0 (0.0%) |
| High School Diploma | 8 (61.5%) | 5 (38.5%) |
| College/Associate Degree | 18 (100.0%) | 0 (0.0%) |
| Bachelor's Degree or higher | 22 (100.0%) | 0 (0.0%) |
Occupancy by Age of Householder in Running Water
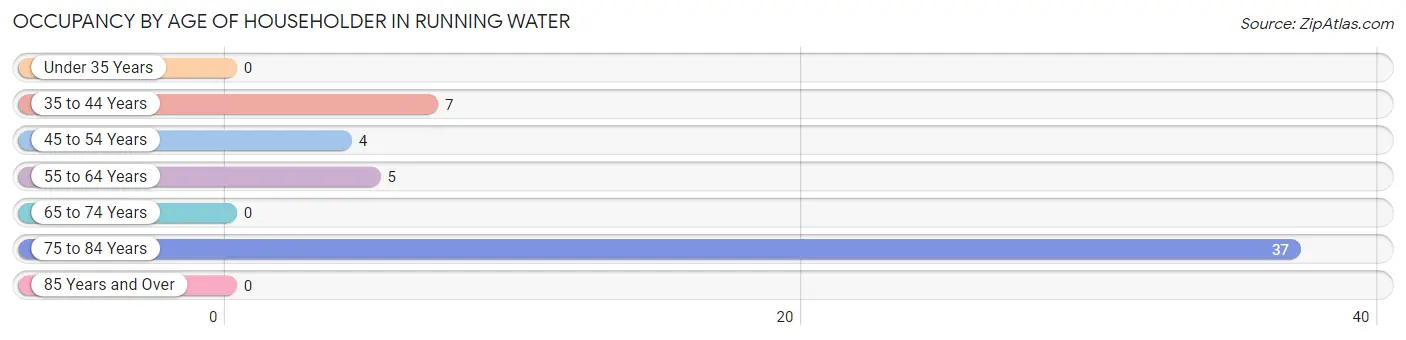
| Age Bracket | # Households | % Households |
| Under 35 Years | 0 | 0.0% |
| 35 to 44 Years | 7 | 13.2% |
| 45 to 54 Years | 4 | 7.5% |
| 55 to 64 Years | 5 | 9.4% |
| 65 to 74 Years | 0 | 0.0% |
| 75 to 84 Years | 37 | 69.8% |
| 85 Years and Over | 0 | 0.0% |
| Total | 53 | 100.0% |
Housing Finances in Running Water
Median Income by Occupancy in Running Water
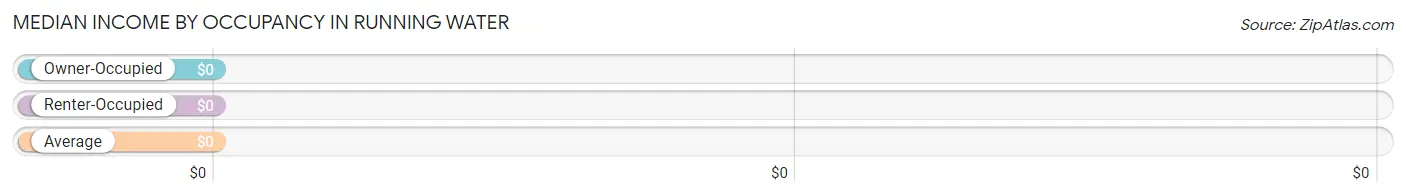
| Occupancy Type | # Households | Median Income |
| Owner-Occupied | 48 (90.6%) | $0 |
| Renter-Occupied | 5 (9.4%) | $0 |
| Average | 53 (100.0%) | $0 |
Occupancy by Householder Income Bracket in Running Water
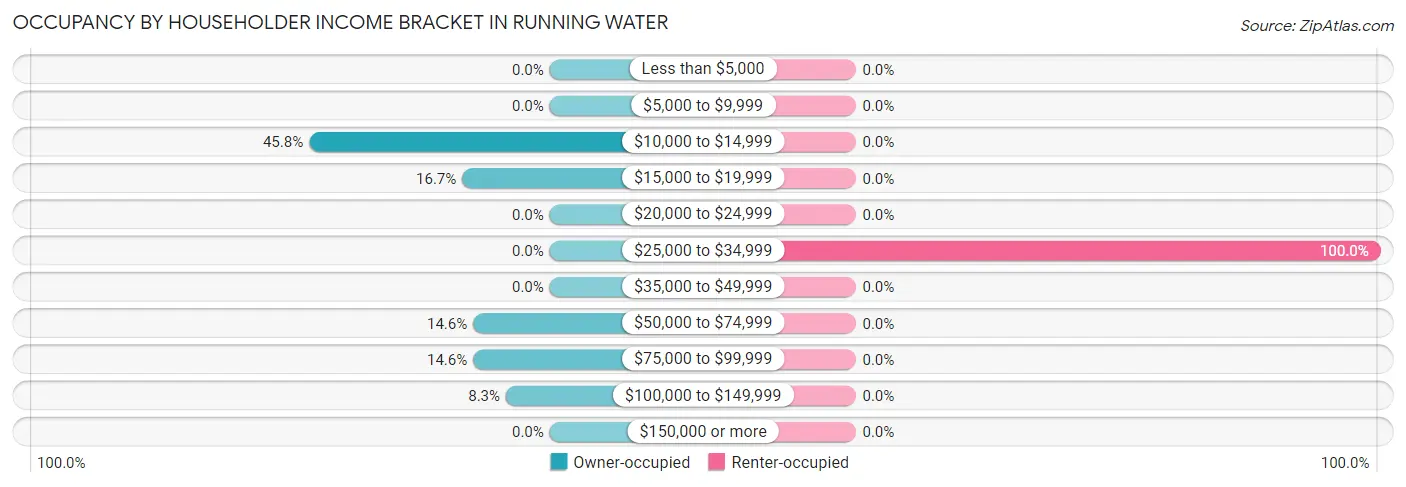
| Income Bracket | Owner-occupied | Renter-occupied |
| Less than $5,000 | 0 (0.0%) | 0 (0.0%) |
| $5,000 to $9,999 | 0 (0.0%) | 0 (0.0%) |
| $10,000 to $14,999 | 22 (45.8%) | 0 (0.0%) |
| $15,000 to $19,999 | 8 (16.7%) | 0 (0.0%) |
| $20,000 to $24,999 | 0 (0.0%) | 0 (0.0%) |
| $25,000 to $34,999 | 0 (0.0%) | 5 (100.0%) |
| $35,000 to $49,999 | 0 (0.0%) | 0 (0.0%) |
| $50,000 to $74,999 | 7 (14.6%) | 0 (0.0%) |
| $75,000 to $99,999 | 7 (14.6%) | 0 (0.0%) |
| $100,000 to $149,999 | 4 (8.3%) | 0 (0.0%) |
| $150,000 or more | 0 (0.0%) | 0 (0.0%) |
| Total | 48 (100.0%) | 5 (100.0%) |
Monthly Housing Cost Tiers in Running Water
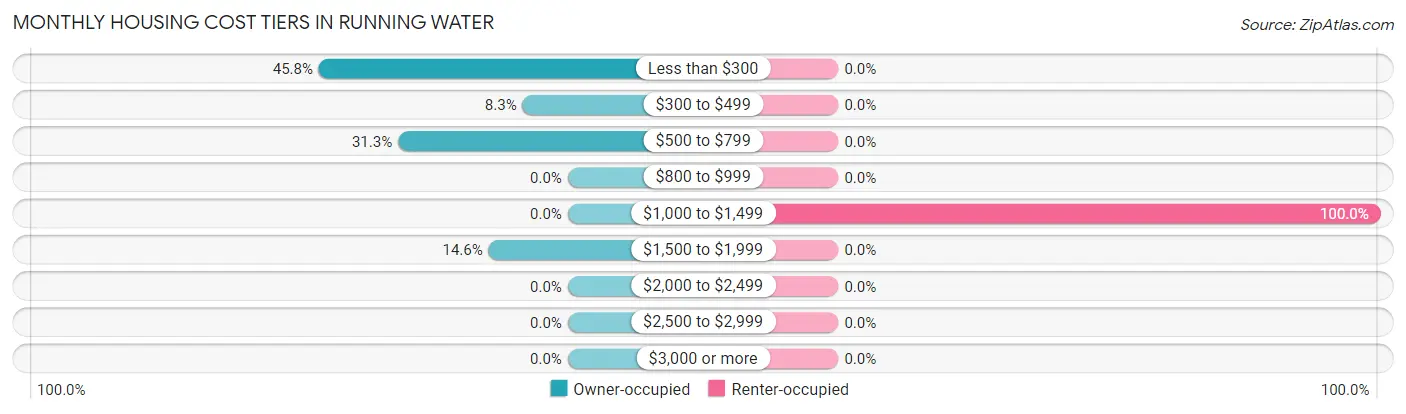
| Monthly Cost | Owner-occupied | Renter-occupied |
| Less than $300 | 22 (45.8%) | 0 (0.0%) |
| $300 to $499 | 4 (8.3%) | 0 (0.0%) |
| $500 to $799 | 15 (31.2%) | 0 (0.0%) |
| $800 to $999 | 0 (0.0%) | 0 (0.0%) |
| $1,000 to $1,499 | 0 (0.0%) | 5 (100.0%) |
| $1,500 to $1,999 | 7 (14.6%) | 0 (0.0%) |
| $2,000 to $2,499 | 0 (0.0%) | 0 (0.0%) |
| $2,500 to $2,999 | 0 (0.0%) | 0 (0.0%) |
| $3,000 or more | 0 (0.0%) | 0 (0.0%) |
| Total | 48 (100.0%) | 5 (100.0%) |
Physical Housing Characteristics in Running Water
Housing Structures in Running Water
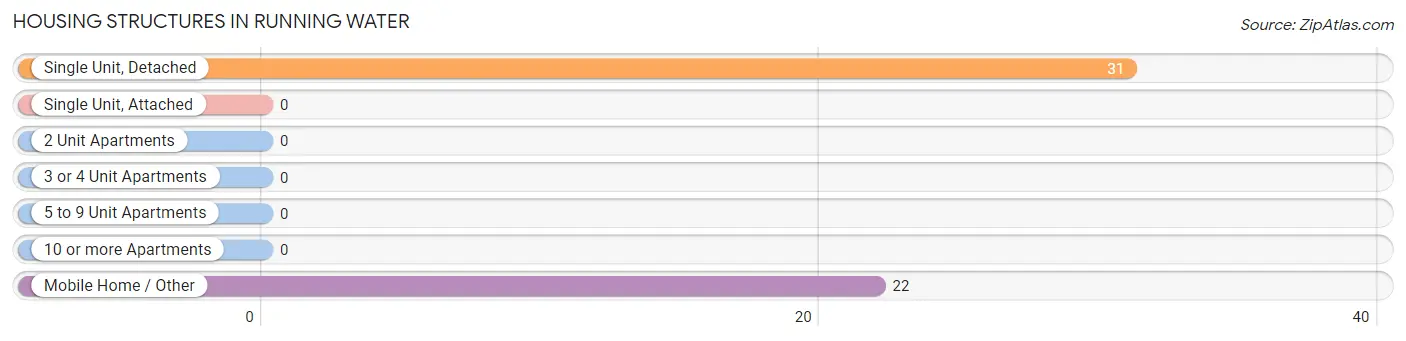
| Structure Type | # Housing Units | % Housing Units |
| Single Unit, Detached | 31 | 58.5% |
| Single Unit, Attached | 0 | 0.0% |
| 2 Unit Apartments | 0 | 0.0% |
| 3 or 4 Unit Apartments | 0 | 0.0% |
| 5 to 9 Unit Apartments | 0 | 0.0% |
| 10 or more Apartments | 0 | 0.0% |
| Mobile Home / Other | 22 | 41.5% |
| Total | 53 | 100.0% |
Housing Structures by Occupancy in Running Water
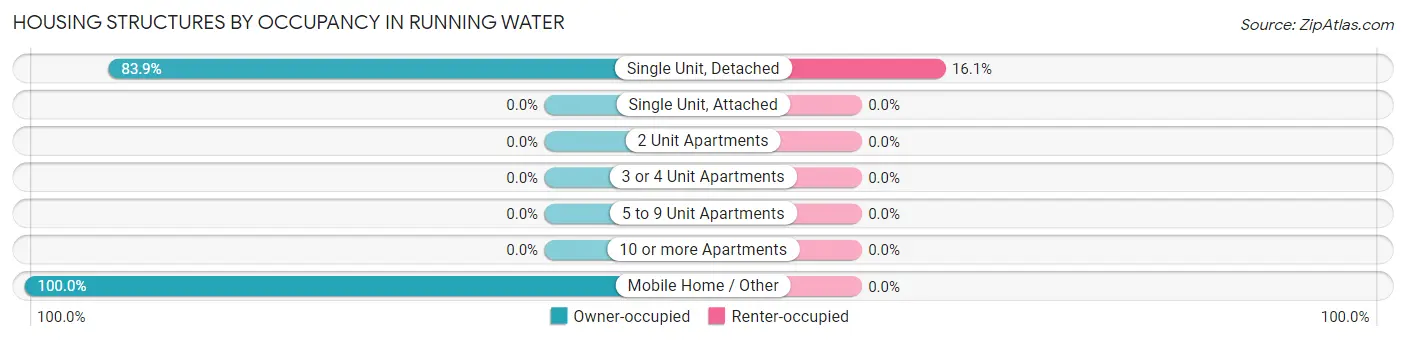
| Structure Type | Owner-occupied | Renter-occupied |
| Single Unit, Detached | 26 (83.9%) | 5 (16.1%) |
| Single Unit, Attached | 0 (0.0%) | 0 (0.0%) |
| 2 Unit Apartments | 0 (0.0%) | 0 (0.0%) |
| 3 or 4 Unit Apartments | 0 (0.0%) | 0 (0.0%) |
| 5 to 9 Unit Apartments | 0 (0.0%) | 0 (0.0%) |
| 10 or more Apartments | 0 (0.0%) | 0 (0.0%) |
| Mobile Home / Other | 22 (100.0%) | 0 (0.0%) |
| Total | 48 (90.6%) | 5 (9.4%) |
Housing Structures by Number of Rooms in Running Water
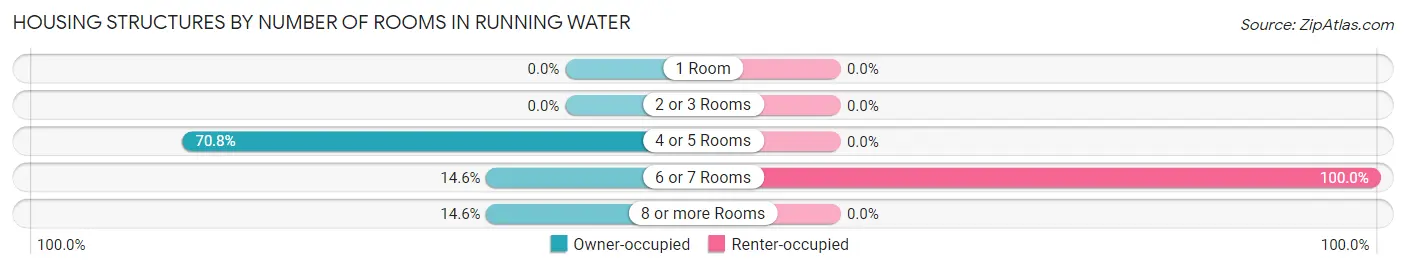
| Number of Rooms | Owner-occupied | Renter-occupied |
| 1 Room | 0 (0.0%) | 0 (0.0%) |
| 2 or 3 Rooms | 0 (0.0%) | 0 (0.0%) |
| 4 or 5 Rooms | 34 (70.8%) | 0 (0.0%) |
| 6 or 7 Rooms | 7 (14.6%) | 5 (100.0%) |
| 8 or more Rooms | 7 (14.6%) | 0 (0.0%) |
| Total | 48 (100.0%) | 5 (100.0%) |
Housing Structure by Heating Type in Running Water
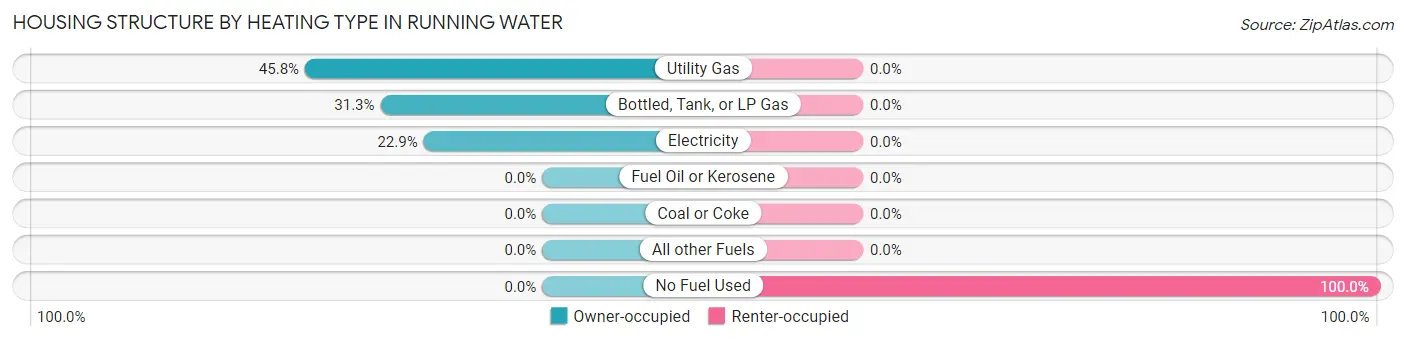
| Heating Type | Owner-occupied | Renter-occupied |
| Utility Gas | 22 (45.8%) | 0 (0.0%) |
| Bottled, Tank, or LP Gas | 15 (31.2%) | 0 (0.0%) |
| Electricity | 11 (22.9%) | 0 (0.0%) |
| Fuel Oil or Kerosene | 0 (0.0%) | 0 (0.0%) |
| Coal or Coke | 0 (0.0%) | 0 (0.0%) |
| All other Fuels | 0 (0.0%) | 0 (0.0%) |
| No Fuel Used | 0 (0.0%) | 5 (100.0%) |
| Total | 48 (100.0%) | 5 (100.0%) |
Household Vehicle Usage in Running Water
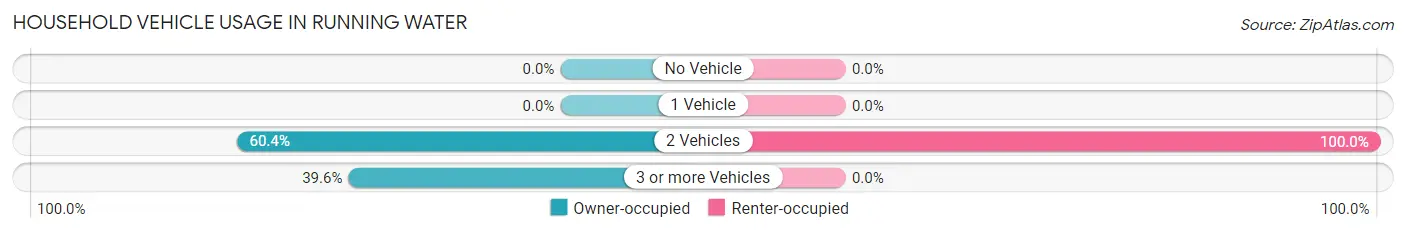
| Vehicles per Household | Owner-occupied | Renter-occupied |
| No Vehicle | 0 (0.0%) | 0 (0.0%) |
| 1 Vehicle | 0 (0.0%) | 0 (0.0%) |
| 2 Vehicles | 29 (60.4%) | 5 (100.0%) |
| 3 or more Vehicles | 19 (39.6%) | 0 (0.0%) |
| Total | 48 (100.0%) | 5 (100.0%) |
Real Estate & Mortgages in Running Water
Real Estate and Mortgage Overview in Running Water
| Characteristic | Without Mortgage | With Mortgage |
| Housing Units | 41 | 7 |
| Median Property Value | $9,999 | $0 |
| Median Household Income | - | - |
| Monthly Housing Costs | - | - |
| Real Estate Taxes | $199 | $0 |
Property Value by Mortgage Status in Running Water
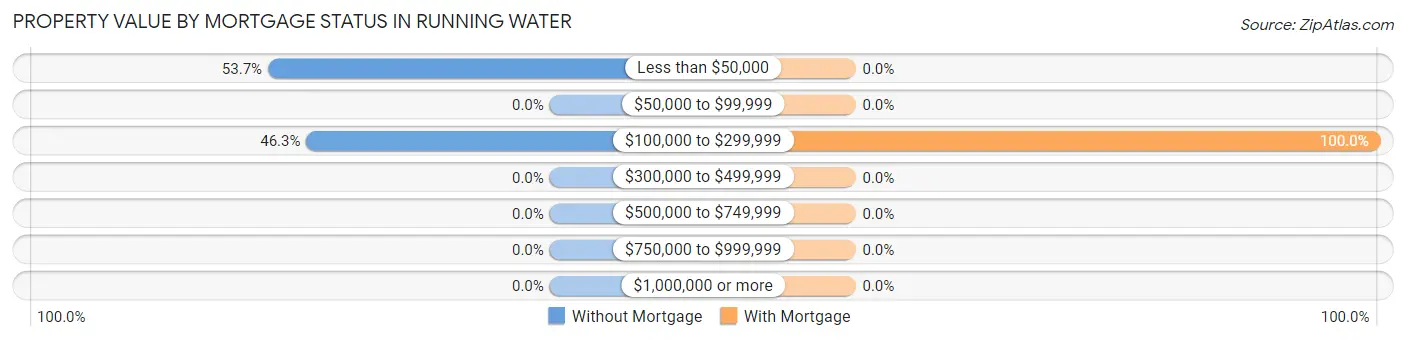
| Property Value | Without Mortgage | With Mortgage |
| Less than $50,000 | 22 (53.7%) | 0 (0.0%) |
| $50,000 to $99,999 | 0 (0.0%) | 0 (0.0%) |
| $100,000 to $299,999 | 19 (46.3%) | 7 (100.0%) |
| $300,000 to $499,999 | 0 (0.0%) | 0 (0.0%) |
| $500,000 to $749,999 | 0 (0.0%) | 0 (0.0%) |
| $750,000 to $999,999 | 0 (0.0%) | 0 (0.0%) |
| $1,000,000 or more | 0 (0.0%) | 0 (0.0%) |
| Total | 41 (100.0%) | 7 (100.0%) |
Household Income by Mortgage Status in Running Water
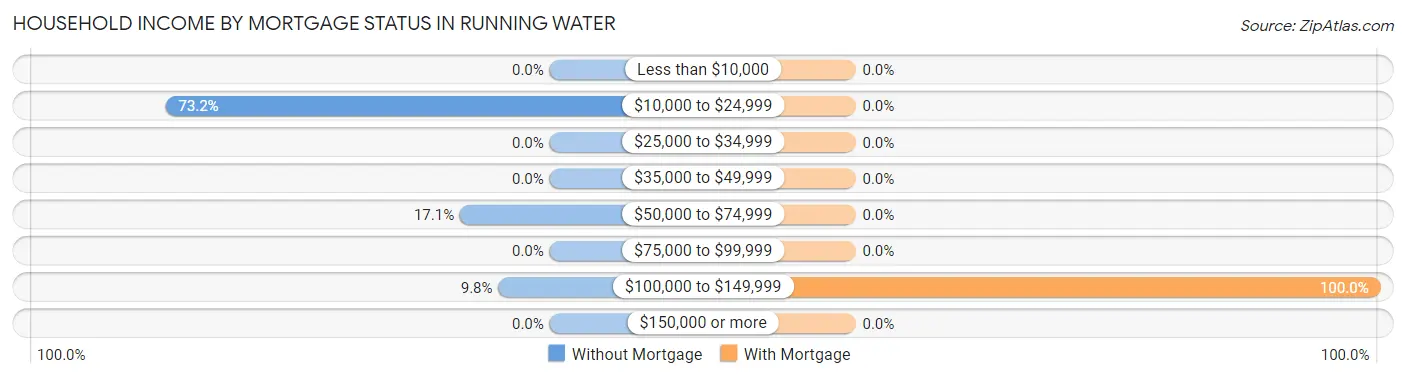
| Household Income | Without Mortgage | With Mortgage |
| Less than $10,000 | 0 (0.0%) | 0 (0.0%) |
| $10,000 to $24,999 | 30 (73.2%) | 0 (0.0%) |
| $25,000 to $34,999 | 0 (0.0%) | 0 (0.0%) |
| $35,000 to $49,999 | 0 (0.0%) | 0 (0.0%) |
| $50,000 to $74,999 | 7 (17.1%) | 0 (0.0%) |
| $75,000 to $99,999 | 0 (0.0%) | 0 (0.0%) |
| $100,000 to $149,999 | 4 (9.8%) | 7 (100.0%) |
| $150,000 or more | 0 (0.0%) | 0 (0.0%) |
| Total | 41 (100.0%) | 7 (100.0%) |
Property Value to Household Income Ratio in Running Water
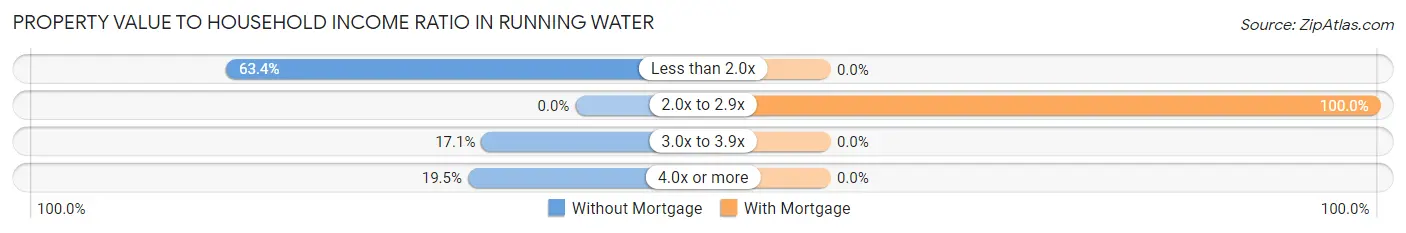
| Value-to-Income Ratio | Without Mortgage | With Mortgage |
| Less than 2.0x | 26 (63.4%) | 0 (0.0%) |
| 2.0x to 2.9x | 0 (0.0%) | 7 (100.0%) |
| 3.0x to 3.9x | 7 (17.1%) | 0 (0.0%) |
| 4.0x or more | 8 (19.5%) | 0 (0.0%) |
| Total | 41 (100.0%) | 7 (100.0%) |
Real Estate Taxes by Mortgage Status in Running Water
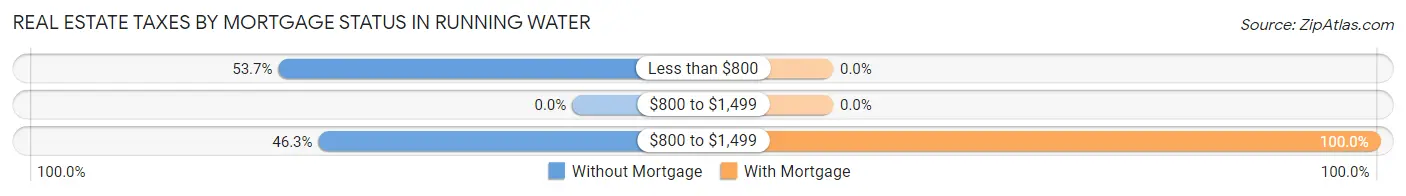
| Property Taxes | Without Mortgage | With Mortgage |
| Less than $800 | 22 (53.7%) | 0 (0.0%) |
| $800 to $1,499 | 0 (0.0%) | 0 (0.0%) |
| $800 to $1,499 | 19 (46.3%) | 7 (100.0%) |
| Total | 41 (100.0%) | 7 (100.0%) |
Health & Disability in Running Water
Health Insurance Coverage by Age in Running Water
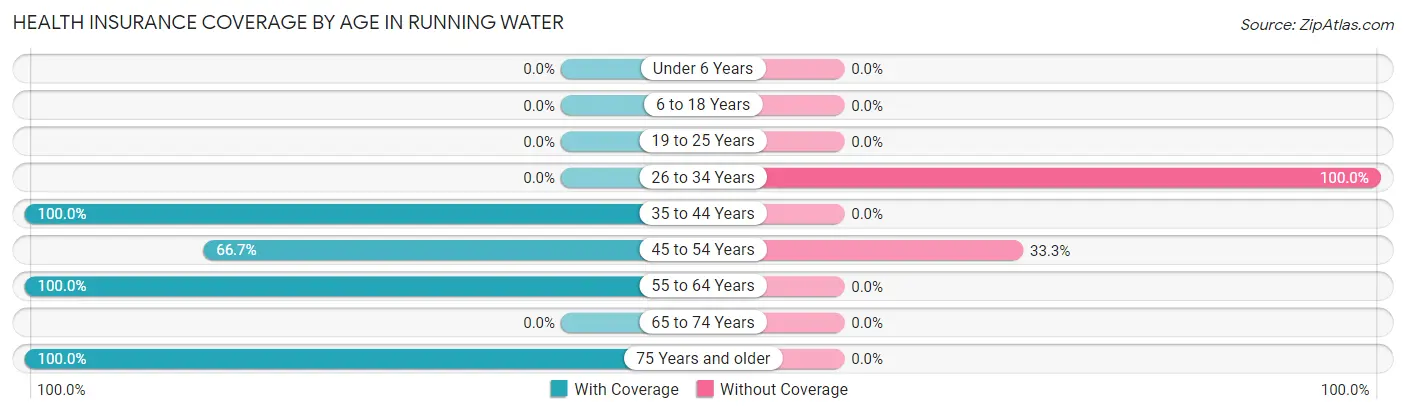
| Age Bracket | With Coverage | Without Coverage |
| Under 6 Years | 0 (0.0%) | 0 (0.0%) |
| 6 to 18 Years | 0 (0.0%) | 0 (0.0%) |
| 19 to 25 Years | 0 (0.0%) | 0 (0.0%) |
| 26 to 34 Years | 0 (0.0%) | 1 (100.0%) |
| 35 to 44 Years | 15 (100.0%) | 0 (0.0%) |
| 45 to 54 Years | 4 (66.7%) | 2 (33.3%) |
| 55 to 64 Years | 8 (100.0%) | 0 (0.0%) |
| 65 to 74 Years | 0 (0.0%) | 0 (0.0%) |
| 75 Years and older | 46 (100.0%) | 0 (0.0%) |
| Total | 73 (96.1%) | 3 (4.0%) |
Health Insurance Coverage by Citizenship Status in Running Water
| Citizenship Status | With Coverage | Without Coverage |
| Native Born | 0 (0.0%) | 0 (0.0%) |
| Foreign Born, Citizen | 0 (0.0%) | 0 (0.0%) |
| Foreign Born, not a Citizen | 0 (0.0%) | 0 (0.0%) |
Health Insurance Coverage by Household Income in Running Water
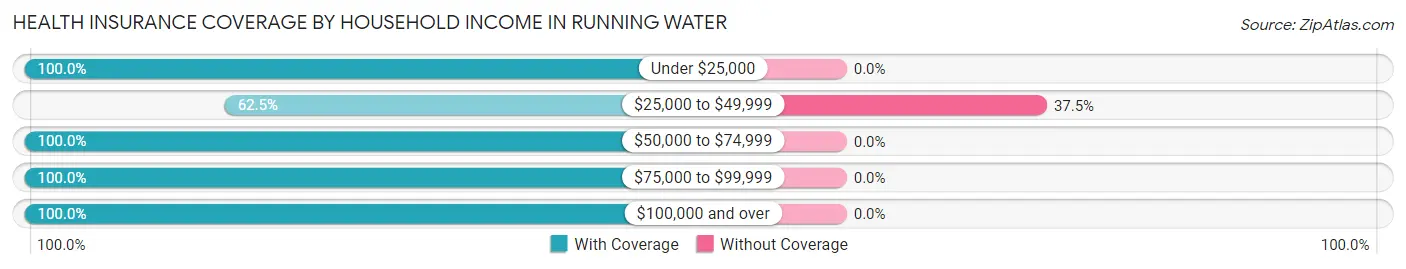
| Household Income | With Coverage | Without Coverage |
| Under $25,000 | 39 (100.0%) | 0 (0.0%) |
| $25,000 to $49,999 | 5 (62.5%) | 3 (37.5%) |
| $50,000 to $74,999 | 8 (100.0%) | 0 (0.0%) |
| $75,000 to $99,999 | 15 (100.0%) | 0 (0.0%) |
| $100,000 and over | 6 (100.0%) | 0 (0.0%) |
Public vs Private Health Insurance Coverage by Age in Running Water
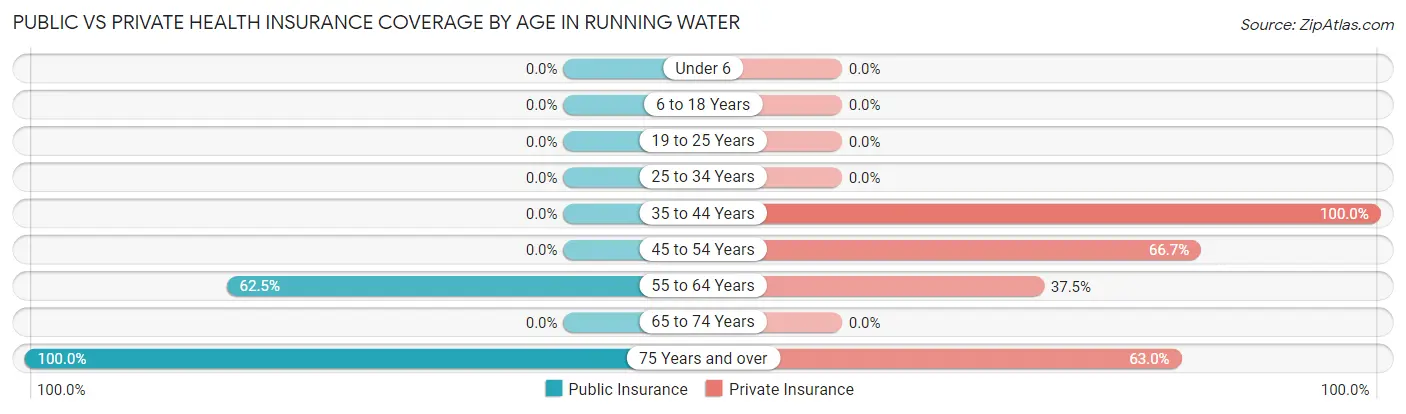
| Age Bracket | Public Insurance | Private Insurance |
| Under 6 | 0 (0.0%) | 0 (0.0%) |
| 6 to 18 Years | 0 (0.0%) | 0 (0.0%) |
| 19 to 25 Years | 0 (0.0%) | 0 (0.0%) |
| 25 to 34 Years | 0 (0.0%) | 0 (0.0%) |
| 35 to 44 Years | 0 (0.0%) | 15 (100.0%) |
| 45 to 54 Years | 0 (0.0%) | 4 (66.7%) |
| 55 to 64 Years | 5 (62.5%) | 3 (37.5%) |
| 65 to 74 Years | 0 (0.0%) | 0 (0.0%) |
| 75 Years and over | 46 (100.0%) | 29 (63.0%) |
| Total | 51 (67.1%) | 51 (67.1%) |
Disability Status by Sex by Age in Running Water
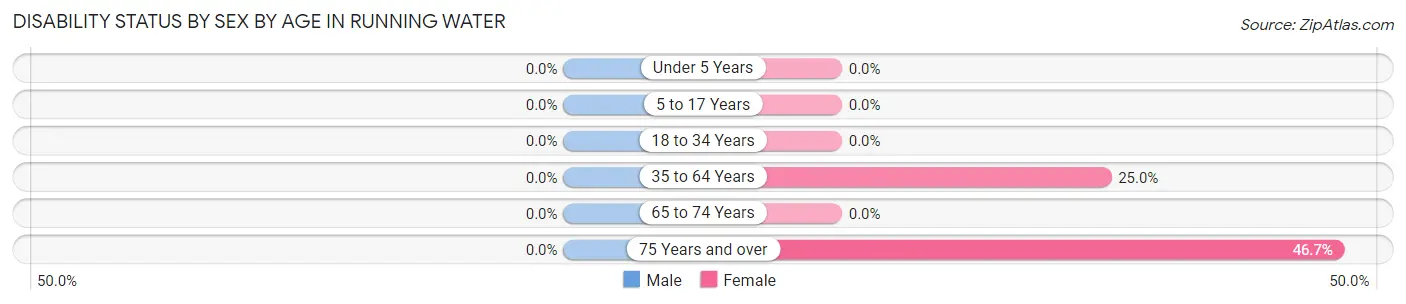
| Age Bracket | Male | Female |
| Under 5 Years | 0 (0.0%) | 0 (0.0%) |
| 5 to 17 Years | 0 (0.0%) | 0 (0.0%) |
| 18 to 34 Years | 0 (0.0%) | 0 (0.0%) |
| 35 to 64 Years | 0 (0.0%) | 5 (25.0%) |
| 65 to 74 Years | 0 (0.0%) | 0 (0.0%) |
| 75 Years and over | 0 (0.0%) | 7 (46.7%) |
Disability Class by Sex by Age in Running Water
Disability Class: Hearing Difficulty
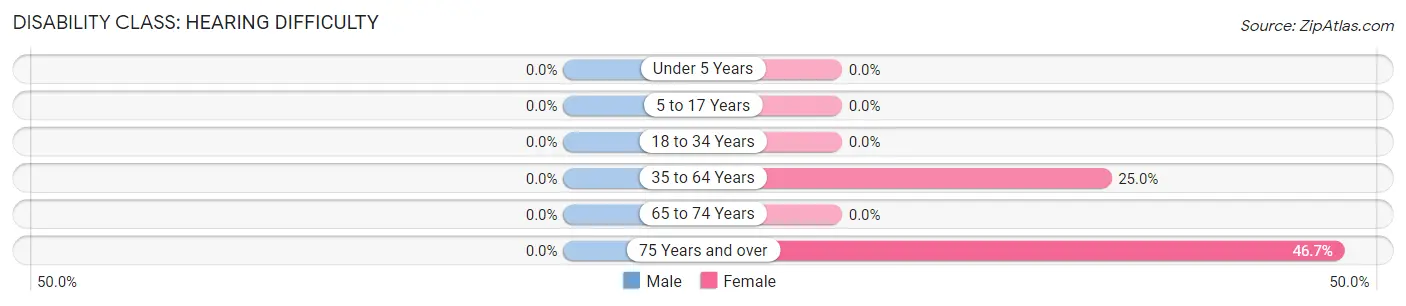
| Age Bracket | Male | Female |
| Under 5 Years | 0 (0.0%) | 0 (0.0%) |
| 5 to 17 Years | 0 (0.0%) | 0 (0.0%) |
| 18 to 34 Years | 0 (0.0%) | 0 (0.0%) |
| 35 to 64 Years | 0 (0.0%) | 5 (25.0%) |
| 65 to 74 Years | 0 (0.0%) | 0 (0.0%) |
| 75 Years and over | 0 (0.0%) | 7 (46.7%) |
Disability Class: Vision Difficulty
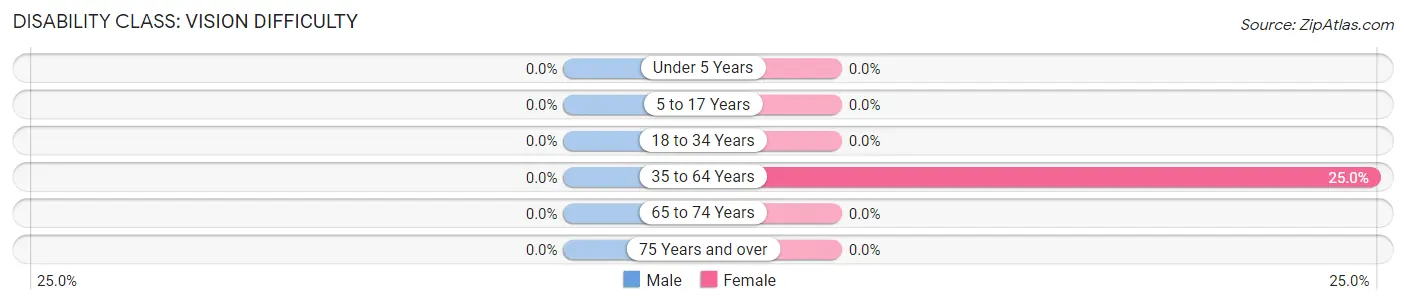
| Age Bracket | Male | Female |
| Under 5 Years | 0 (0.0%) | 0 (0.0%) |
| 5 to 17 Years | 0 (0.0%) | 0 (0.0%) |
| 18 to 34 Years | 0 (0.0%) | 0 (0.0%) |
| 35 to 64 Years | 0 (0.0%) | 5 (25.0%) |
| 65 to 74 Years | 0 (0.0%) | 0 (0.0%) |
| 75 Years and over | 0 (0.0%) | 0 (0.0%) |
Disability Class: Cognitive Difficulty
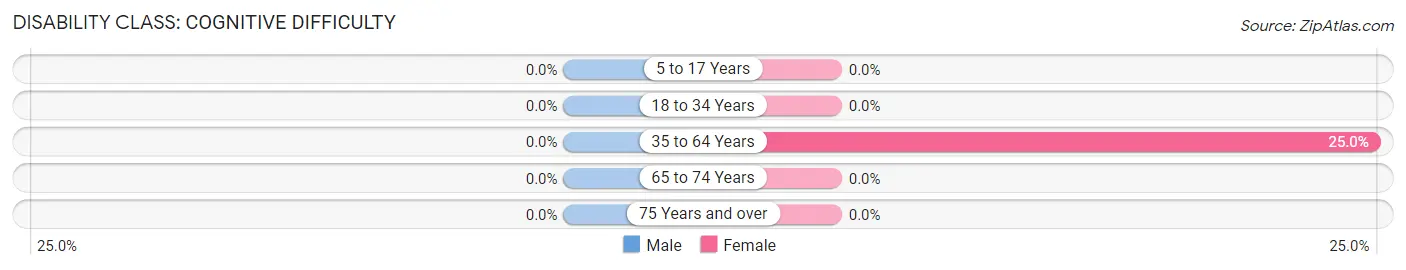
| Age Bracket | Male | Female |
| 5 to 17 Years | 0 (0.0%) | 0 (0.0%) |
| 18 to 34 Years | 0 (0.0%) | 0 (0.0%) |
| 35 to 64 Years | 0 (0.0%) | 5 (25.0%) |
| 65 to 74 Years | 0 (0.0%) | 0 (0.0%) |
| 75 Years and over | 0 (0.0%) | 0 (0.0%) |
Disability Class: Ambulatory Difficulty
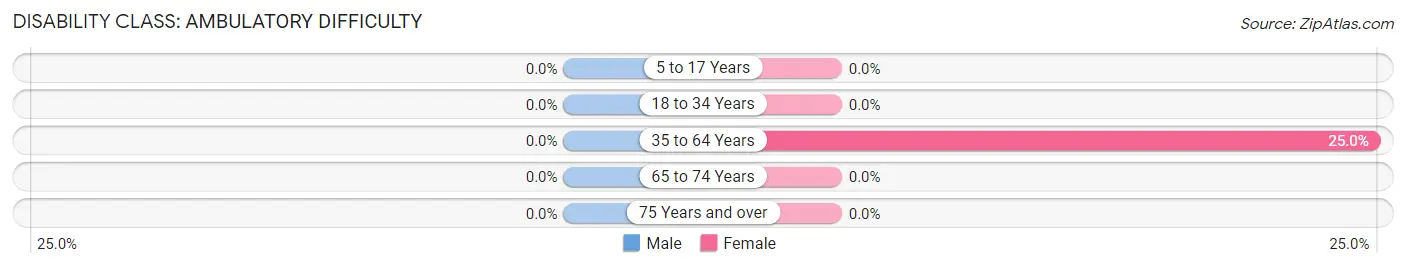
| Age Bracket | Male | Female |
| 5 to 17 Years | 0 (0.0%) | 0 (0.0%) |
| 18 to 34 Years | 0 (0.0%) | 0 (0.0%) |
| 35 to 64 Years | 0 (0.0%) | 5 (25.0%) |
| 65 to 74 Years | 0 (0.0%) | 0 (0.0%) |
| 75 Years and over | 0 (0.0%) | 0 (0.0%) |
Disability Class: Self-Care Difficulty
| Age Bracket | Male | Female |
| 5 to 17 Years | 0 (0.0%) | 0 (0.0%) |
| 18 to 34 Years | 0 (0.0%) | 0 (0.0%) |
| 35 to 64 Years | 0 (0.0%) | 0 (0.0%) |
| 65 to 74 Years | 0 (0.0%) | 0 (0.0%) |
| 75 Years and over | 0 (0.0%) | 0 (0.0%) |
Technology Access in Running Water
Computing Device Access in Running Water
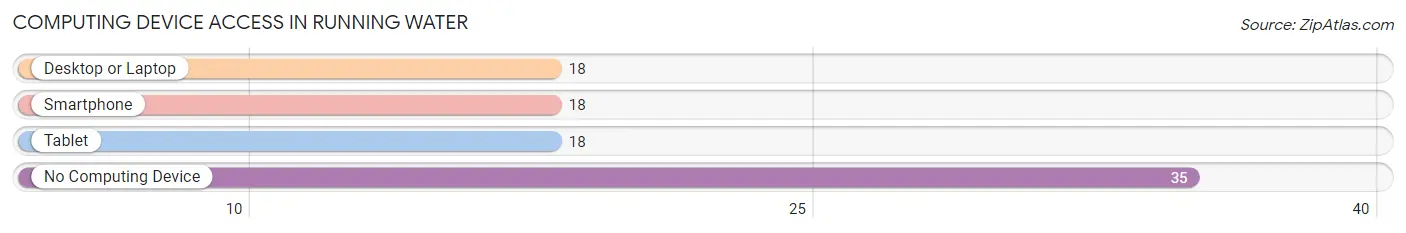
| Device Type | # Households | % Households |
| Desktop or Laptop | 18 | 34.0% |
| Smartphone | 18 | 34.0% |
| Tablet | 18 | 34.0% |
| No Computing Device | 35 | 66.0% |
| Total | 53 | 100.0% |
Internet Access in Running Water
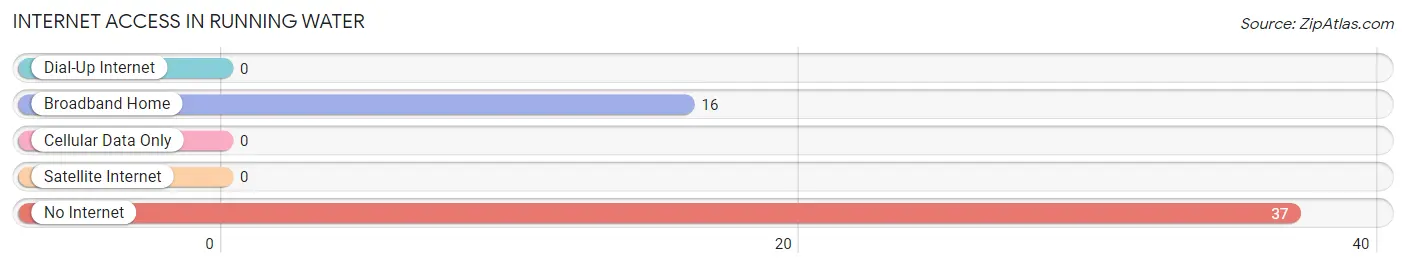
| Internet Type | # Households | % Households |
| Dial-Up Internet | 0 | 0.0% |
| Broadband Home | 16 | 30.2% |
| Cellular Data Only | 0 | 0.0% |
| Satellite Internet | 0 | 0.0% |
| No Internet | 37 | 69.8% |
| Total | 53 | 100.0% |
Running Water Summary
Running Water is a small town located in the state of South Dakota. It is situated in the southeastern corner of the state, near the border with Nebraska. The town has a population of just over 500 people, and is part of the Yankton Sioux Tribe.
History
Running Water was first established in 1868, when the Yankton Sioux Tribe was relocated to the area from Minnesota. The town was originally known as “Little Running Water”, and was a small settlement of just a few families. The town was officially incorporated in 1887, and the name was changed to “Running Water”.
The town was originally a trading post for the Yankton Sioux Tribe, and was a popular stop for travelers and traders. The town was also a popular destination for settlers, and the population began to grow. By the early 1900s, the town had grown to include a post office, a school, a church, and several businesses.
In the early 1900s, the town was also a popular destination for tourists, and the town began to attract more visitors. The town was also a popular destination for hunters, and the town began to attract more hunters.
Geography
Running Water is located in the southeastern corner of South Dakota, near the border with Nebraska. The town is situated on the banks of the Missouri River, and is surrounded by rolling hills and prairies. The town is located in the Yankton Sioux Reservation, and is part of the Yankton Sioux Tribe.
The town is located in the Central Plains region of the United States, and is part of the Great Plains region. The town is located in the Central Time Zone, and has a humid continental climate. The town has hot summers and cold winters, with temperatures ranging from the low 30s in the winter to the high 90s in the summer.
Economy
The economy of Running Water is largely based on agriculture and tourism. The town is home to several farms, and the town is a popular destination for hunters and tourists. The town is also home to several businesses, including a grocery store, a gas station, and a few restaurants.
The town is also home to several small businesses, including a hardware store, a lumber yard, and a few other small businesses. The town is also home to several small manufacturing businesses, including a furniture factory and a clothing factory.
Demographics
As of the 2010 census, the population of Running Water was 514 people. The town is predominantly white, with a population that is 97.3% white. The town is also home to a small Native American population, with a population that is 2.7% Native American.
The town has a median household income of $37,500, and a median family income of $41,250. The town has a poverty rate of 16.3%, and the unemployment rate is 5.3%. The town has a high school graduation rate of 87.3%, and the town has a college graduation rate of 11.3%.
Conclusion
Running Water is a small town located in the southeastern corner of South Dakota. The town has a population of just over 500 people, and is part of the Yankton Sioux Tribe. The town has a long history, and was originally a trading post for the Yankton Sioux Tribe. The town is situated on the banks of the Missouri River, and is surrounded by rolling hills and prairies. The economy of Running Water is largely based on agriculture and tourism, and the town is home to several small businesses. The town has a predominantly white population, with a small Native American population. The town has a median household income of $37,500, and a poverty rate of 16.3%.
Common Questions
What is Per Capita Income in Running Water?
Per Capita income in Running Water is $23,638.
What is Income or Wage Gap in Running Water?
Income or Wage Gap in Running Water is 39.3%.
Women in Running Water earn 60.7 cents for every dollar earned by a man.
What is Inequality or Gini Index in Running Water?
Inequality or Gini Index in Running Water is 0.42.
What is the Total Population of Running Water?
Total Population of Running Water is 76.
What is the Total Male Population of Running Water?
Total Male Population of Running Water is 41.
What is the Total Female Population of Running Water?
Total Female Population of Running Water is 35.
What is the Ratio of Males per 100 Females in Running Water?
There are 117.14 Males per 100 Females in Running Water.
What is the Ratio of Females per 100 Males in Running Water?
There are 85.37 Females per 100 Males in Running Water.
What is the Median Population Age in Running Water?
Median Population Age in Running Water is 76.4 Years.
What is the Average Family Size in Running Water
Average Family Size in Running Water is 1.6 People.
What is the Average Household Size in Running Water
Average Household Size in Running Water is 1.4 People.
How Large is the Labor Force in Running Water?
There are 25 People in the Labor Forcein in Running Water.
What is the Percentage of People in the Labor Force in Running Water?
32.9% of People are in the Labor Force in Running Water.