Dupree, SD Map & Demographics
Dupree Map
Dupree Overview
$20,203
PER CAPITA INCOME
$46,786
AVG FAMILY INCOME
$46,111
AVG HOUSEHOLD INCOME
16.2%
WAGE / INCOME GAP [ % ]
83.8¢/ $1
WAGE / INCOME GAP [ $ ]
0.39
INEQUALITY / GINI INDEX
470
TOTAL POPULATION
220
MALE POPULATION
250
FEMALE POPULATION
88.00
MALES / 100 FEMALES
113.64
FEMALES / 100 MALES
29.5
MEDIAN AGE
4.0
AVG FAMILY SIZE
3.2
AVG HOUSEHOLD SIZE
238
LABOR FORCE [ PEOPLE ]
66.5%
PERCENT IN LABOR FORCE
19.7%
UNEMPLOYMENT RATE
Dupree Zip Codes
Dupree Area Codes
Income in Dupree
Income Overview in Dupree
Per Capita Income in Dupree is $20,203, while median incomes of families and households are $46,786 and $46,111 respectively.
| Characteristic | Number | Measure |
| Per Capita Income | 470 | $20,203 |
| Median Family Income | 100 | $46,786 |
| Mean Family Income | 100 | $59,148 |
| Median Household Income | 146 | $46,111 |
| Mean Household Income | 146 | $55,158 |
| Income Deficit | 100 | $0 |
| Wage / Income Gap (%) | 470 | 16.15% |
| Wage / Income Gap ($) | 470 | 83.85¢ per $1 |
| Gini / Inequality Index | 470 | 0.39 |
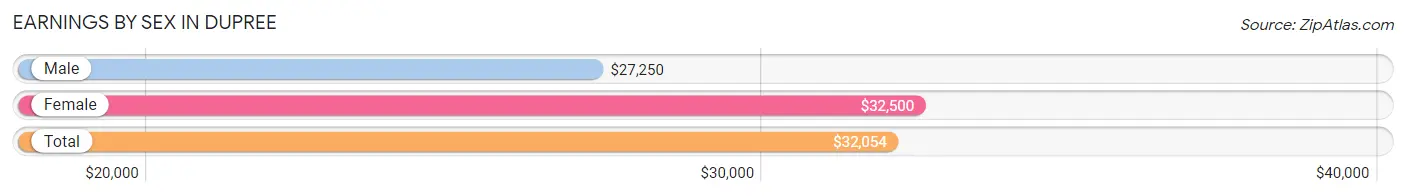
Earnings by Sex in Dupree
Average Earnings in Dupree are $32,054, $27,250 for men and $32,500 for women, a difference of 16.2%.
| Sex | Number | Average Earnings |
| Male | 103 (45.8%) | $27,250 |
| Female | 122 (54.2%) | $32,500 |
| Total | 225 (100.0%) | $32,054 |
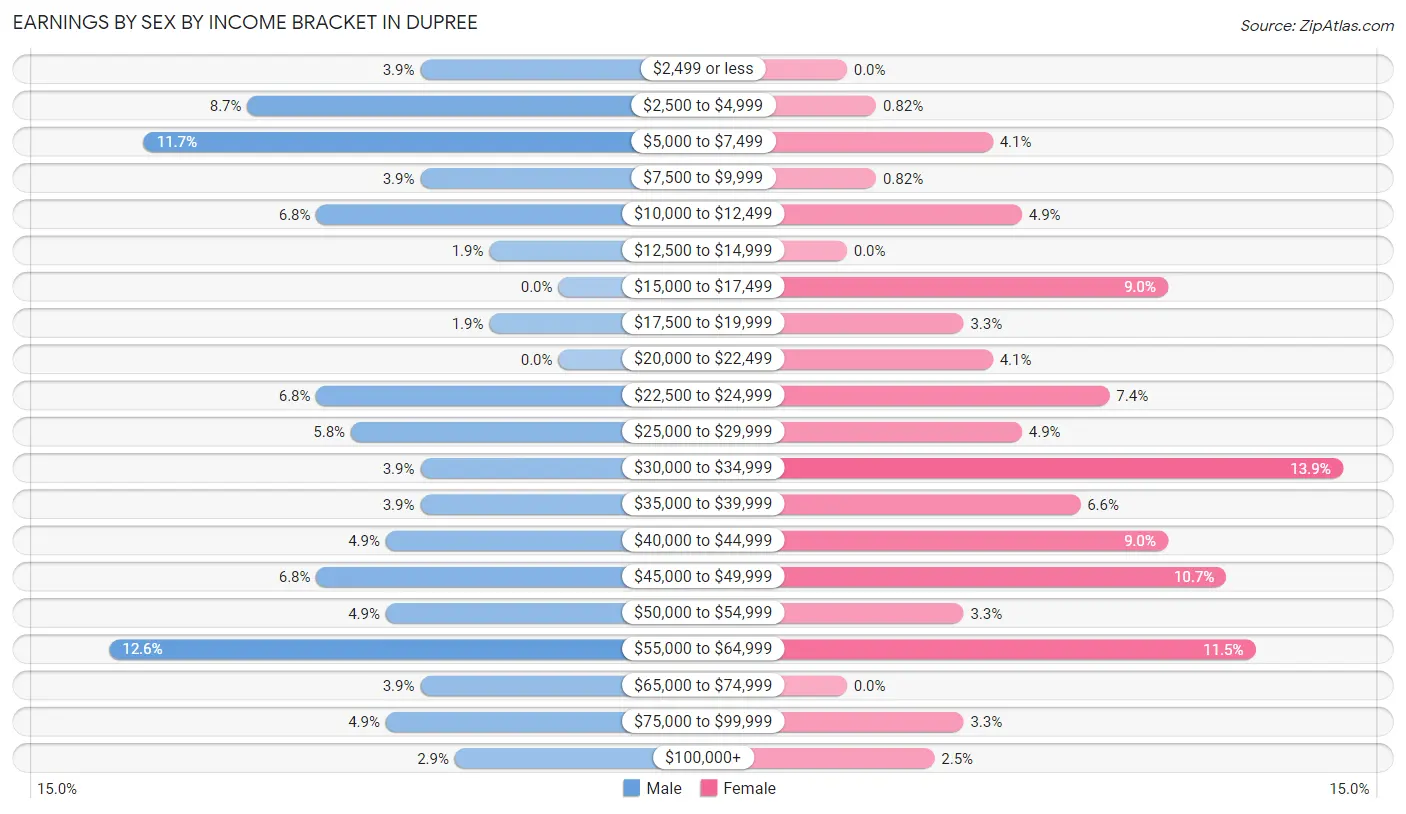
Earnings by Sex by Income Bracket in Dupree
The most common earnings brackets in Dupree are $55,000 to $64,999 for men (13 | 12.6%) and $30,000 to $34,999 for women (17 | 13.9%).
| Income | Male | Female |
| $2,499 or less | 4 (3.9%) | 0 (0.0%) |
| $2,500 to $4,999 | 9 (8.7%) | 1 (0.8%) |
| $5,000 to $7,499 | 12 (11.7%) | 5 (4.1%) |
| $7,500 to $9,999 | 4 (3.9%) | 1 (0.8%) |
| $10,000 to $12,499 | 7 (6.8%) | 6 (4.9%) |
| $12,500 to $14,999 | 2 (1.9%) | 0 (0.0%) |
| $15,000 to $17,499 | 0 (0.0%) | 11 (9.0%) |
| $17,500 to $19,999 | 2 (1.9%) | 4 (3.3%) |
| $20,000 to $22,499 | 0 (0.0%) | 5 (4.1%) |
| $22,500 to $24,999 | 7 (6.8%) | 9 (7.4%) |
| $25,000 to $29,999 | 6 (5.8%) | 6 (4.9%) |
| $30,000 to $34,999 | 4 (3.9%) | 17 (13.9%) |
| $35,000 to $39,999 | 4 (3.9%) | 8 (6.6%) |
| $40,000 to $44,999 | 5 (4.9%) | 11 (9.0%) |
| $45,000 to $49,999 | 7 (6.8%) | 13 (10.7%) |
| $50,000 to $54,999 | 5 (4.9%) | 4 (3.3%) |
| $55,000 to $64,999 | 13 (12.6%) | 14 (11.5%) |
| $65,000 to $74,999 | 4 (3.9%) | 0 (0.0%) |
| $75,000 to $99,999 | 5 (4.9%) | 4 (3.3%) |
| $100,000+ | 3 (2.9%) | 3 (2.5%) |
| Total | 103 (100.0%) | 122 (100.0%) |
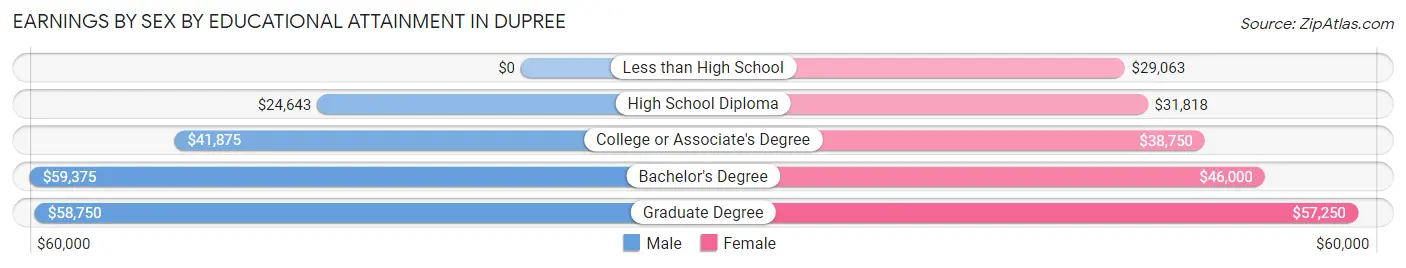
Earnings by Sex by Educational Attainment in Dupree
Average earnings in Dupree are $36,667 for men and $37,083 for women, a difference of 1.1%. Men with an educational attainment of bachelor's degree enjoy the highest average annual earnings of $59,375, while those with high school diploma education earn the least with $24,643. Women with an educational attainment of graduate degree earn the most with the average annual earnings of $57,250, while those with less than high school education have the smallest earnings of $29,063.
| Educational Attainment | Male Income | Female Income |
| Less than High School | - | - |
| High School Diploma | $24,643 | $31,818 |
| College or Associate's Degree | $41,875 | $38,750 |
| Bachelor's Degree | $59,375 | $46,000 |
| Graduate Degree | $58,750 | $57,250 |
| Total | $36,667 | $37,083 |
Family Income in Dupree
Family Income Brackets in Dupree
According to the Dupree family income data, there are 21 families falling into the $15,000 to $24,999 income range, which is the most common income bracket and makes up 21.0% of all families. Conversely, the $200,000+ income bracket is the least frequent group with only 2 families (2.0%) belonging to this category.
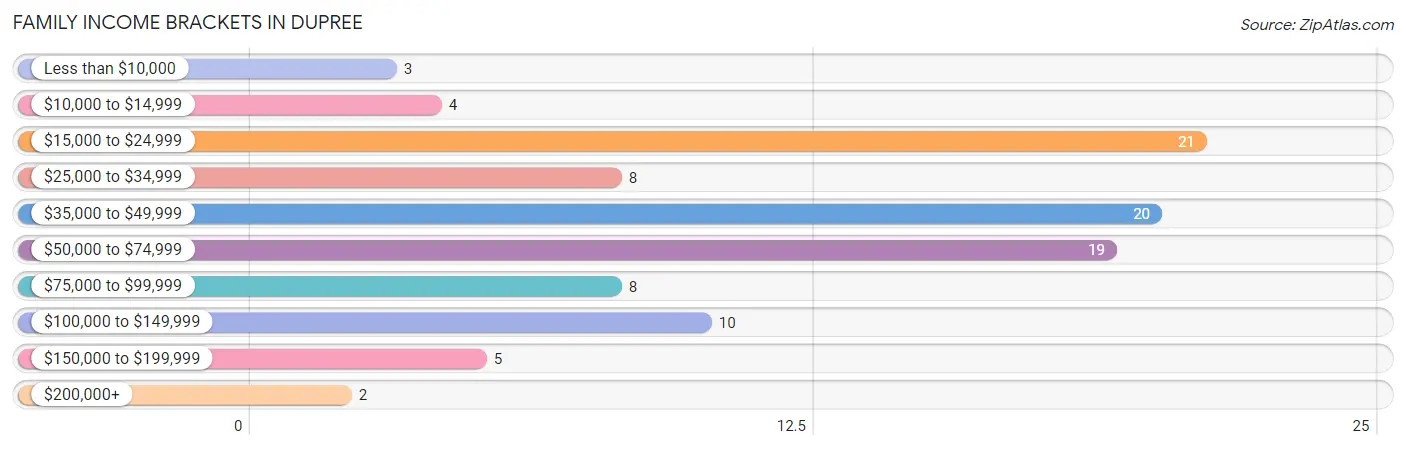
| Income Bracket | # Families | % Families |
| Less than $10,000 | 3 | 3.0% |
| $10,000 to $14,999 | 4 | 4.0% |
| $15,000 to $24,999 | 21 | 21.0% |
| $25,000 to $34,999 | 8 | 8.0% |
| $35,000 to $49,999 | 20 | 20.0% |
| $50,000 to $74,999 | 19 | 19.0% |
| $75,000 to $99,999 | 8 | 8.0% |
| $100,000 to $149,999 | 10 | 10.0% |
| $150,000 to $199,999 | 5 | 5.0% |
| $200,000+ | 2 | 2.0% |
Family Income by Famaliy Size in Dupree
2-person families (39 | 39.0%) account for the highest median family income in Dupree with $53,750 per family, while 2-person families (39 | 39.0%) have the highest median income of $26,875 per family member.
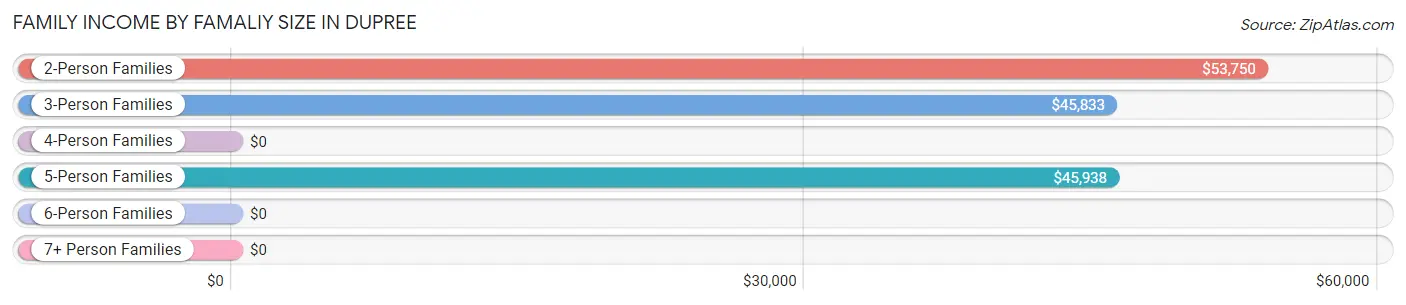
| Income Bracket | # Families | Median Income |
| 2-Person Families | 39 (39.0%) | $53,750 |
| 3-Person Families | 32 (32.0%) | $45,833 |
| 4-Person Families | 8 (8.0%) | $0 |
| 5-Person Families | 13 (13.0%) | $45,938 |
| 6-Person Families | 5 (5.0%) | $0 |
| 7+ Person Families | 3 (3.0%) | $0 |
| Total | 100 (100.0%) | $46,786 |
Family Income by Number of Earners in Dupree
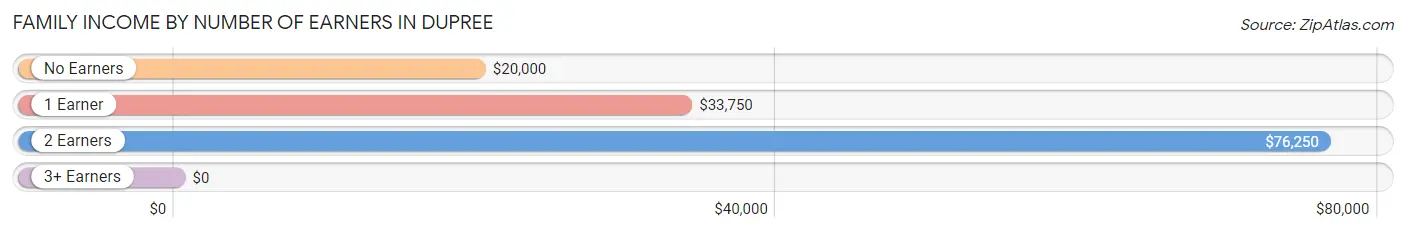
| Number of Earners | # Families | Median Income |
| No Earners | 14 (14.0%) | $20,000 |
| 1 Earner | 40 (40.0%) | $33,750 |
| 2 Earners | 41 (41.0%) | $76,250 |
| 3+ Earners | 5 (5.0%) | $0 |
| Total | 100 (100.0%) | $46,786 |
Household Income in Dupree
Household Income Brackets in Dupree
With 37 households falling in the category, the $35,000 to $49,999 income range is the most frequent in Dupree, accounting for 25.3% of all households.
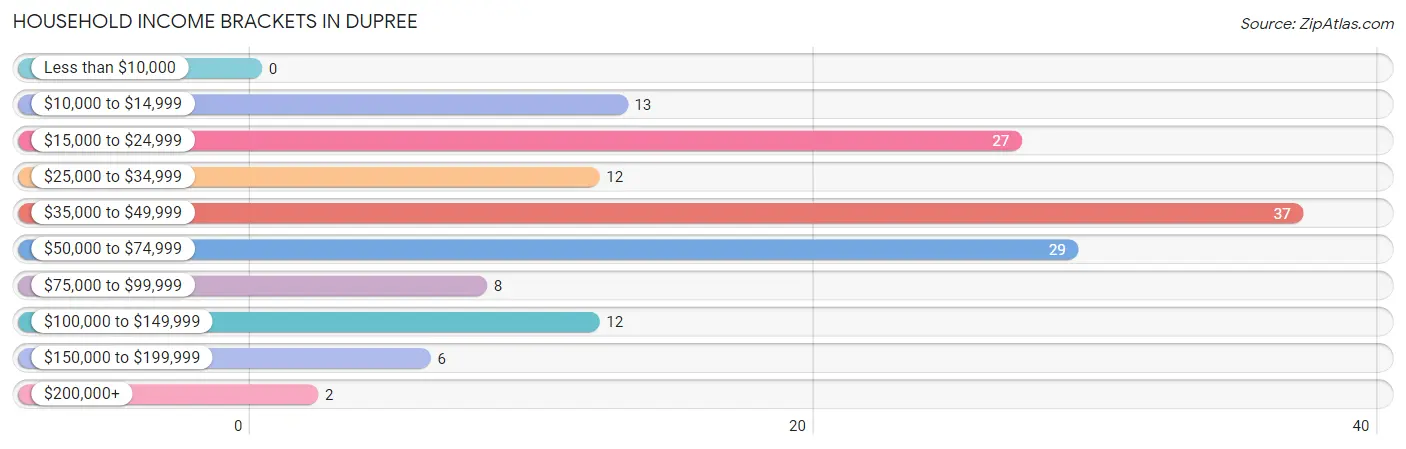
| Income Bracket | # Households | % Households |
| Less than $10,000 | 0 | 0.0% |
| $10,000 to $14,999 | 13 | 8.9% |
| $15,000 to $24,999 | 27 | 18.5% |
| $25,000 to $34,999 | 12 | 8.2% |
| $35,000 to $49,999 | 37 | 25.3% |
| $50,000 to $74,999 | 29 | 19.9% |
| $75,000 to $99,999 | 8 | 5.5% |
| $100,000 to $149,999 | 12 | 8.2% |
| $150,000 to $199,999 | 6 | 4.1% |
| $200,000+ | 2 | 1.4% |
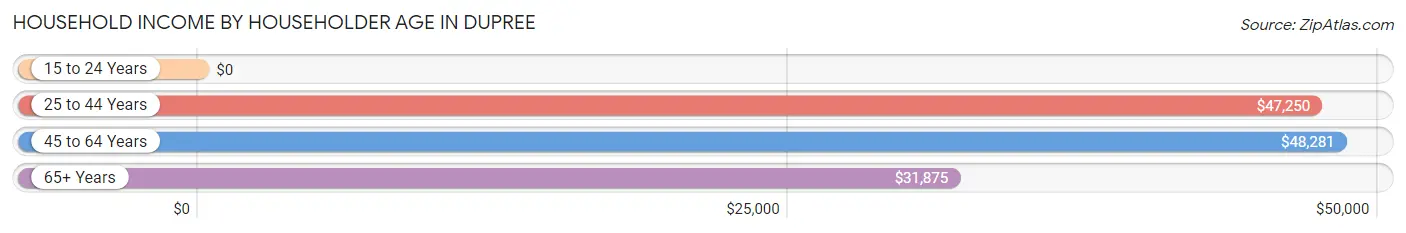
Household Income by Householder Age in Dupree
The median household income in Dupree is $46,111, with the highest median household income of $48,281 found in the 45 to 64 years age bracket for the primary householder. A total of 75 households (51.4%) fall into this category.
| Income Bracket | # Households | Median Income |
| 15 to 24 Years | 0 (0.0%) | $0 |
| 25 to 44 Years | 43 (29.4%) | $47,250 |
| 45 to 64 Years | 75 (51.4%) | $48,281 |
| 65+ Years | 28 (19.2%) | $31,875 |
| Total | 146 (100.0%) | $46,111 |
Poverty in Dupree
Income Below Poverty by Sex and Age in Dupree
With 38.6% poverty level for males and 31.2% for females among the residents of Dupree, 12 to 14 year old males and 5 year old females are the most vulnerable to poverty, with 6 males (85.7%) and 2 females (100.0%) in their respective age groups living below the poverty level.
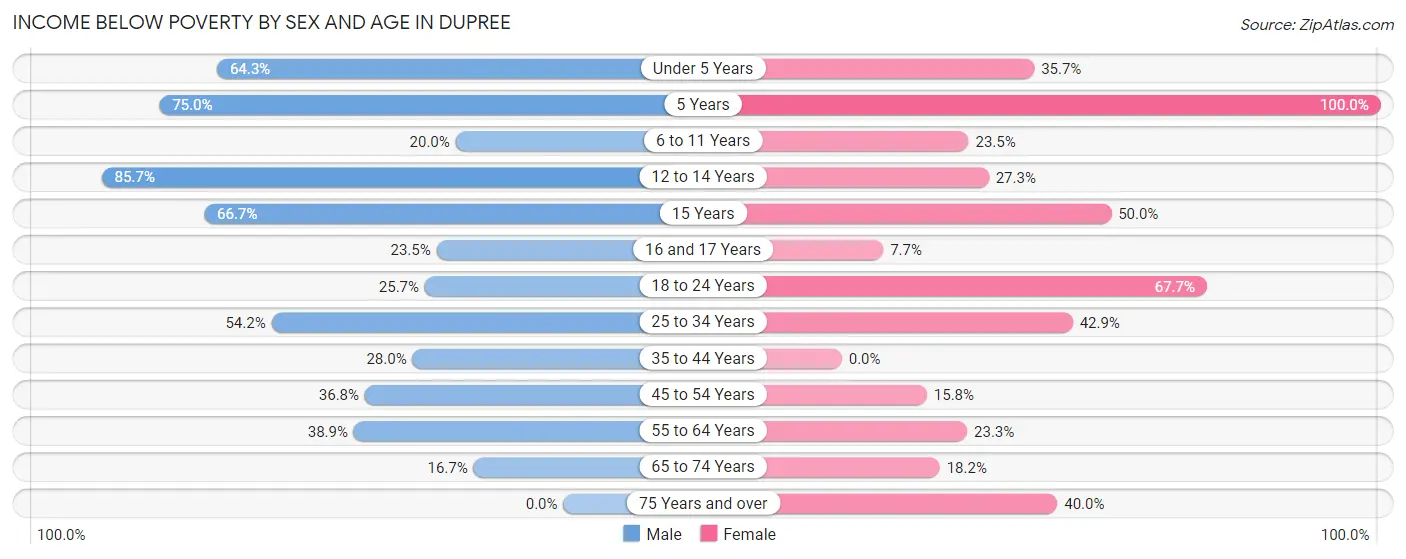
| Age Bracket | Male | Female |
| Under 5 Years | 9 (64.3%) | 5 (35.7%) |
| 5 Years | 3 (75.0%) | 2 (100.0%) |
| 6 to 11 Years | 3 (20.0%) | 4 (23.5%) |
| 12 to 14 Years | 6 (85.7%) | 3 (27.3%) |
| 15 Years | 8 (66.7%) | 8 (50.0%) |
| 16 and 17 Years | 4 (23.5%) | 1 (7.7%) |
| 18 to 24 Years | 9 (25.7%) | 21 (67.7%) |
| 25 to 34 Years | 13 (54.2%) | 15 (42.9%) |
| 35 to 44 Years | 7 (28.0%) | 0 (0.0%) |
| 45 to 54 Years | 7 (36.8%) | 3 (15.8%) |
| 55 to 64 Years | 14 (38.9%) | 10 (23.3%) |
| 65 to 74 Years | 2 (16.7%) | 2 (18.2%) |
| 75 Years and over | 0 (0.0%) | 4 (40.0%) |
| Total | 85 (38.6%) | 78 (31.2%) |
Income Above Poverty by Sex and Age in Dupree
According to the poverty statistics in Dupree, males aged 65 to 74 years and females aged 35 to 44 years are the age groups that are most secure financially, with 83.3% of males and 100.0% of females in these age groups living above the poverty line.
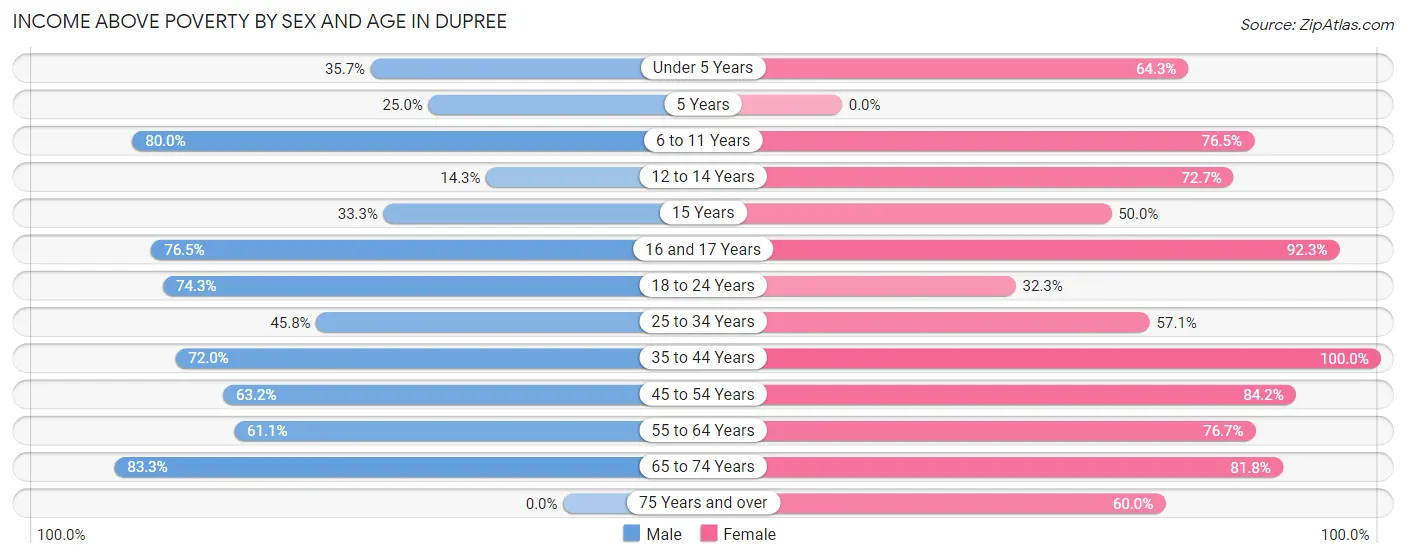
| Age Bracket | Male | Female |
| Under 5 Years | 5 (35.7%) | 9 (64.3%) |
| 5 Years | 1 (25.0%) | 0 (0.0%) |
| 6 to 11 Years | 12 (80.0%) | 13 (76.5%) |
| 12 to 14 Years | 1 (14.3%) | 8 (72.7%) |
| 15 Years | 4 (33.3%) | 8 (50.0%) |
| 16 and 17 Years | 13 (76.5%) | 12 (92.3%) |
| 18 to 24 Years | 26 (74.3%) | 10 (32.3%) |
| 25 to 34 Years | 11 (45.8%) | 20 (57.1%) |
| 35 to 44 Years | 18 (72.0%) | 28 (100.0%) |
| 45 to 54 Years | 12 (63.2%) | 16 (84.2%) |
| 55 to 64 Years | 22 (61.1%) | 33 (76.7%) |
| 65 to 74 Years | 10 (83.3%) | 9 (81.8%) |
| 75 Years and over | 0 (0.0%) | 6 (60.0%) |
| Total | 135 (61.4%) | 172 (68.8%) |
Income Below Poverty Among Married-Couple Families in Dupree
The poverty statistics for married-couple families in Dupree show that 2.6% or 1 of the total 39 families live below the poverty line. Families with 1 or 2 children have the highest poverty rate of 7.1%, comprising of 1 families. On the other hand, families with no children have the lowest poverty rate of 0.0%, which includes 0 families.
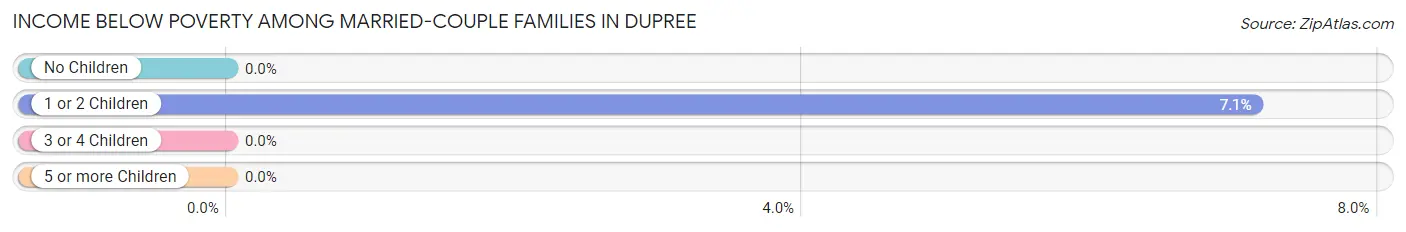
| Children | Above Poverty | Below Poverty |
| No Children | 20 (100.0%) | 0 (0.0%) |
| 1 or 2 Children | 13 (92.9%) | 1 (7.1%) |
| 3 or 4 Children | 5 (100.0%) | 0 (0.0%) |
| 5 or more Children | 0 (0.0%) | 0 (0.0%) |
| Total | 38 (97.4%) | 1 (2.6%) |
Income Below Poverty Among Single-Parent Households in Dupree
According to the poverty data in Dupree, 61.5% or 16 single-father households and 45.7% or 16 single-mother households are living below the poverty line. Among single-father households, those with no children have the highest poverty rate, with 11 households (68.8%) experiencing poverty. Likewise, among single-mother households, those with 3 or 4 children have the highest poverty rate, with 6 households (100.0%) falling below the poverty line.
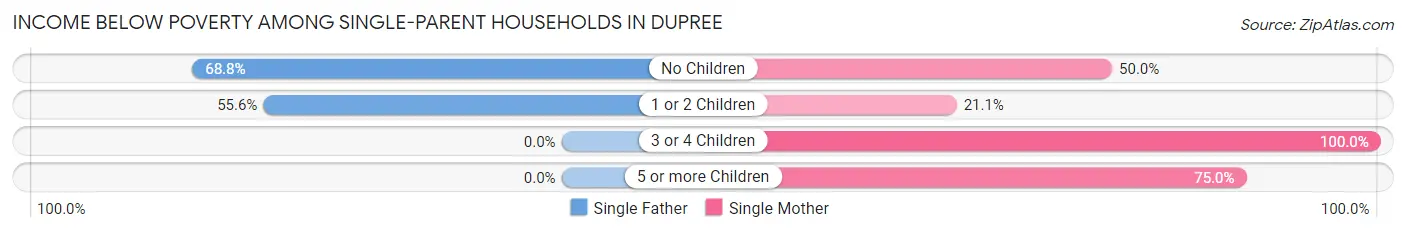
| Children | Single Father | Single Mother |
| No Children | 11 (68.8%) | 3 (50.0%) |
| 1 or 2 Children | 5 (55.6%) | 4 (21.0%) |
| 3 or 4 Children | 0 (0.0%) | 6 (100.0%) |
| 5 or more Children | 0 (0.0%) | 3 (75.0%) |
| Total | 16 (61.5%) | 16 (45.7%) |
Income Below Poverty Among Married-Couple vs Single-Parent Households in Dupree
The poverty data for Dupree shows that 1 of the married-couple family households (2.6%) and 32 of the single-parent households (52.5%) are living below the poverty level. Within the married-couple family households, those with 1 or 2 children have the highest poverty rate, with 1 households (7.1%) falling below the poverty line. Among the single-parent households, those with 3 or 4 children have the highest poverty rate, with 6 household (85.7%) living below poverty.
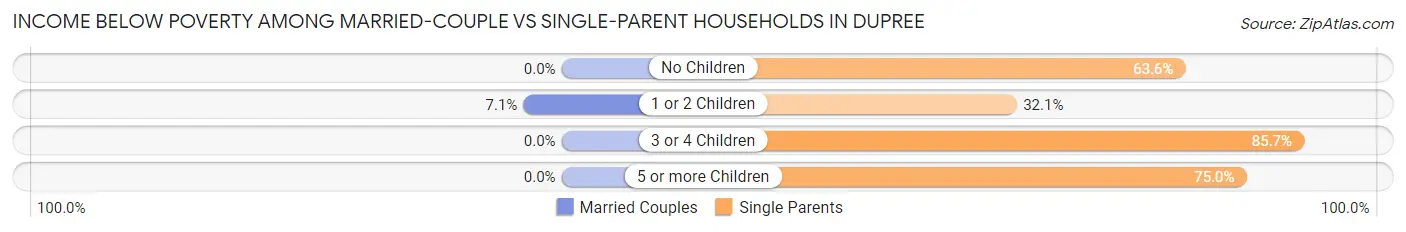
| Children | Married-Couple Families | Single-Parent Households |
| No Children | 0 (0.0%) | 14 (63.6%) |
| 1 or 2 Children | 1 (7.1%) | 9 (32.1%) |
| 3 or 4 Children | 0 (0.0%) | 6 (85.7%) |
| 5 or more Children | 0 (0.0%) | 3 (75.0%) |
| Total | 1 (2.6%) | 32 (52.5%) |
Race in Dupree
The most populous races in Dupree are Native / Alaskan (374 | 79.6%), White / Caucasian (81 | 17.2%), and Hispanic or Latino (24 | 5.1%).
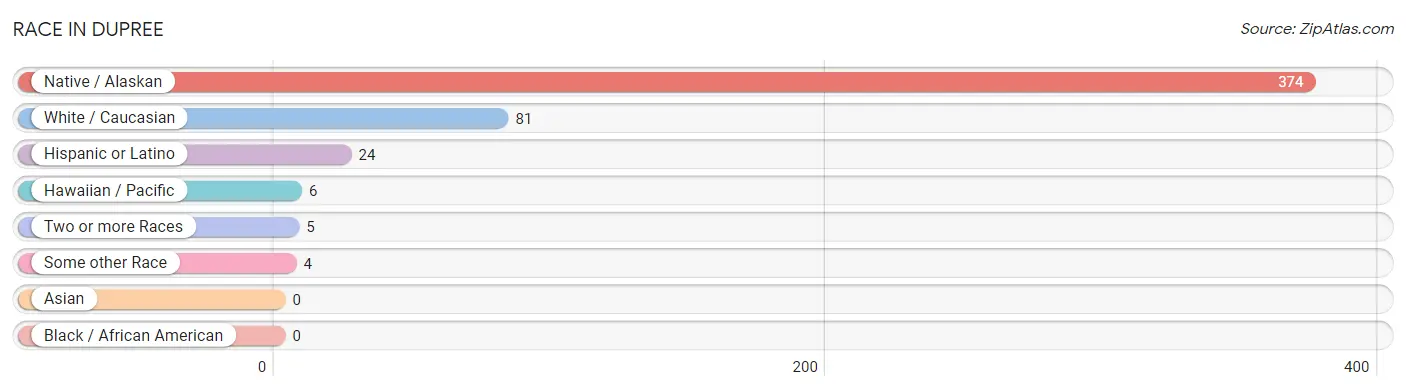
| Race | # Population | % Population |
| Asian | 0 | 0.0% |
| Black / African American | 0 | 0.0% |
| Hawaiian / Pacific | 6 | 1.3% |
| Hispanic or Latino | 24 | 5.1% |
| Native / Alaskan | 374 | 79.6% |
| White / Caucasian | 81 | 17.2% |
| Two or more Races | 5 | 1.1% |
| Some other Race | 4 | 0.9% |
| Total | 470 | 100.0% |
Ancestry in Dupree
The most populous ancestries reported in Dupree are Sioux (366 | 77.9%), German (33 | 7.0%), American (30 | 6.4%), Mexican (20 | 4.3%), and Irish (12 | 2.5%), together accounting for 98.1% of all Dupree residents.
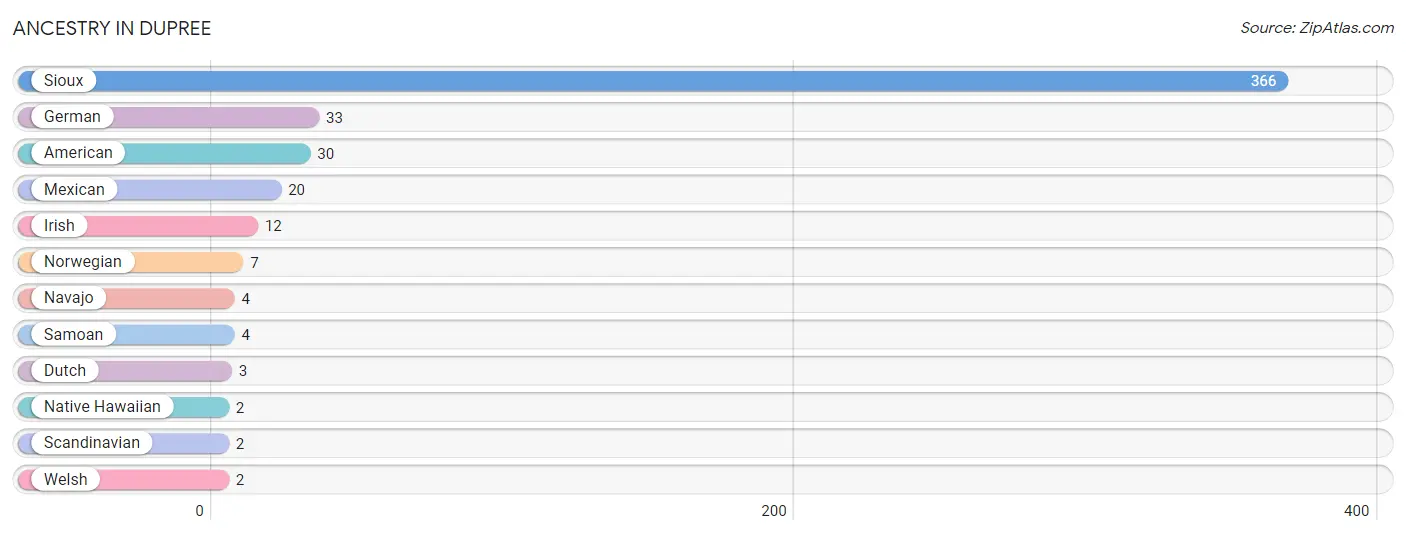
| Ancestry | # Population | % Population |
| American | 30 | 6.4% |
| Dutch | 3 | 0.6% |
| German | 33 | 7.0% |
| Irish | 12 | 2.5% |
| Mexican | 20 | 4.3% |
| Native Hawaiian | 2 | 0.4% |
| Navajo | 4 | 0.9% |
| Norwegian | 7 | 1.5% |
| Samoan | 4 | 0.9% |
| Scandinavian | 2 | 0.4% |
| Sioux | 366 | 77.9% |
| Welsh | 2 | 0.4% | View All 12 Rows |
Immigrants in Dupree
The most numerous immigrant groups reported in Dupree came from , and Oceania (3 | 0.6%), together accounting for 0.6% of all Dupree residents.

| Immigration Origin | # Population | % Population |
| Oceania | 3 | 0.6% | View All 1 Rows |
Sex and Age in Dupree
Sex and Age in Dupree
The most populous age groups in Dupree are 15 to 19 Years (36 | 16.4%) for men and 15 to 19 Years (42 | 16.8%) for women.
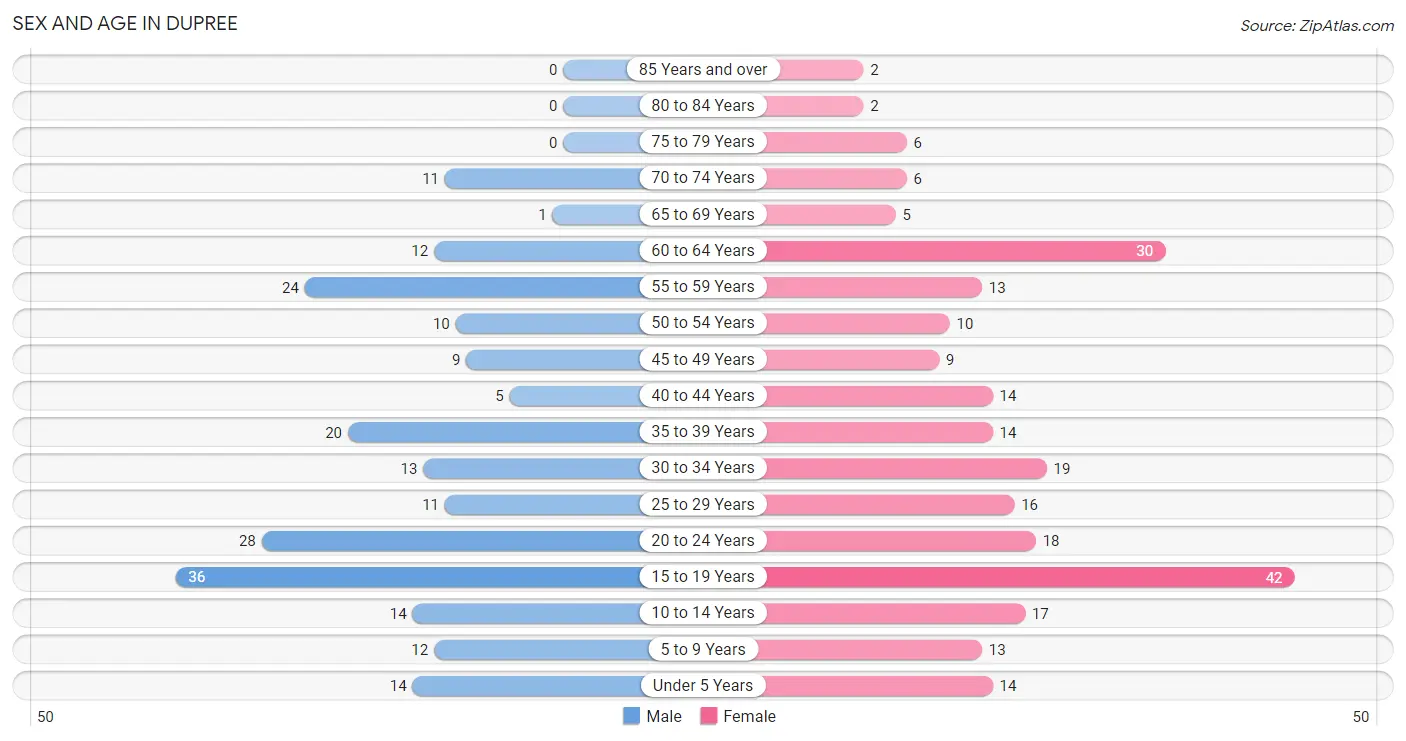
| Age Bracket | Male | Female |
| Under 5 Years | 14 (6.4%) | 14 (5.6%) |
| 5 to 9 Years | 12 (5.4%) | 13 (5.2%) |
| 10 to 14 Years | 14 (6.4%) | 17 (6.8%) |
| 15 to 19 Years | 36 (16.4%) | 42 (16.8%) |
| 20 to 24 Years | 28 (12.7%) | 18 (7.2%) |
| 25 to 29 Years | 11 (5.0%) | 16 (6.4%) |
| 30 to 34 Years | 13 (5.9%) | 19 (7.6%) |
| 35 to 39 Years | 20 (9.1%) | 14 (5.6%) |
| 40 to 44 Years | 5 (2.3%) | 14 (5.6%) |
| 45 to 49 Years | 9 (4.1%) | 9 (3.6%) |
| 50 to 54 Years | 10 (4.5%) | 10 (4.0%) |
| 55 to 59 Years | 24 (10.9%) | 13 (5.2%) |
| 60 to 64 Years | 12 (5.4%) | 30 (12.0%) |
| 65 to 69 Years | 1 (0.4%) | 5 (2.0%) |
| 70 to 74 Years | 11 (5.0%) | 6 (2.4%) |
| 75 to 79 Years | 0 (0.0%) | 6 (2.4%) |
| 80 to 84 Years | 0 (0.0%) | 2 (0.8%) |
| 85 Years and over | 0 (0.0%) | 2 (0.8%) |
| Total | 220 (100.0%) | 250 (100.0%) |
Families and Households in Dupree
Median Family Size in Dupree
The median family size in Dupree is 3.99 persons per family, with single female/mother families (35 | 35.0%) accounting for the largest median family size of 4.6 persons per family. On the other hand, single male/father families (26 | 26.0%) represent the smallest median family size with 3.46 persons per family.
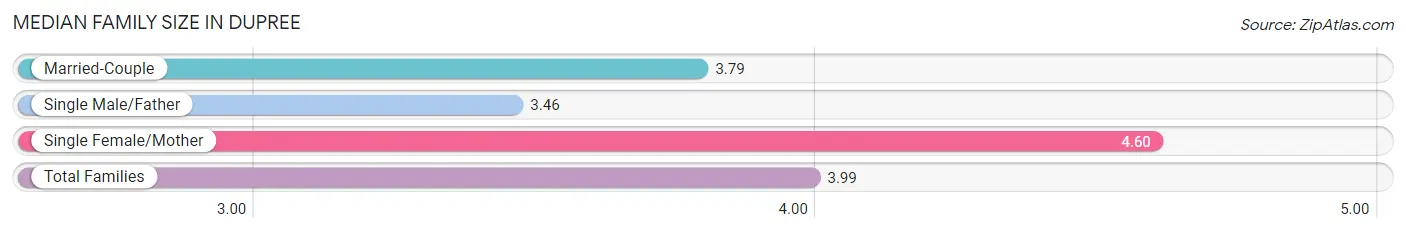
| Family Type | # Families | Family Size |
| Married-Couple | 39 (39.0%) | 3.79 |
| Single Male/Father | 26 (26.0%) | 3.46 |
| Single Female/Mother | 35 (35.0%) | 4.60 |
| Total Families | 100 (100.0%) | 3.99 |
Median Household Size in Dupree
The median household size in Dupree is 3.22 persons per household, with single female/mother households (35 | 24.0%) accounting for the largest median household size of 5.11 persons per household. non-family households (46 | 31.5%) represent the smallest median household size with 1.13 persons per household.
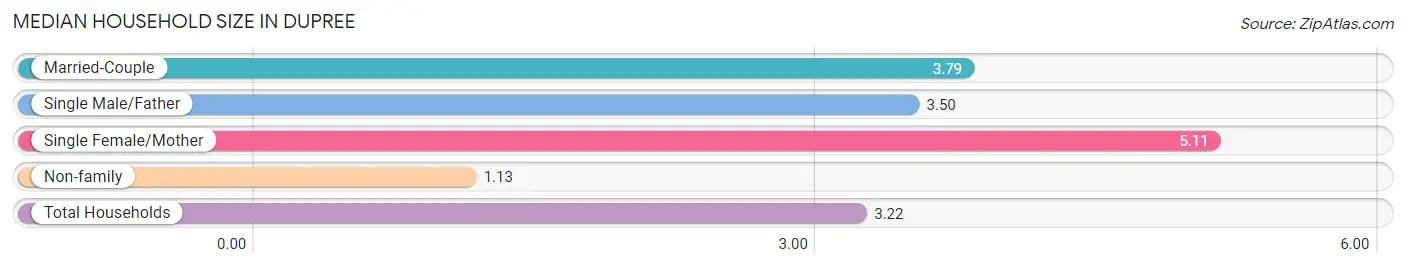
| Household Type | # Households | Household Size |
| Married-Couple | 39 (26.7%) | 3.79 |
| Single Male/Father | 26 (17.8%) | 3.50 |
| Single Female/Mother | 35 (24.0%) | 5.11 |
| Non-family | 46 (31.5%) | 1.13 |
| Total Households | 146 (100.0%) | 3.22 |
Household Size by Marriage Status in Dupree
Out of a total of 146 households in Dupree, 100 (68.5%) are family households, while 46 (31.5%) are nonfamily households. The most numerous type of family households are 3-person households, comprising 38, and the most common type of nonfamily households are 1-person households, comprising 42.
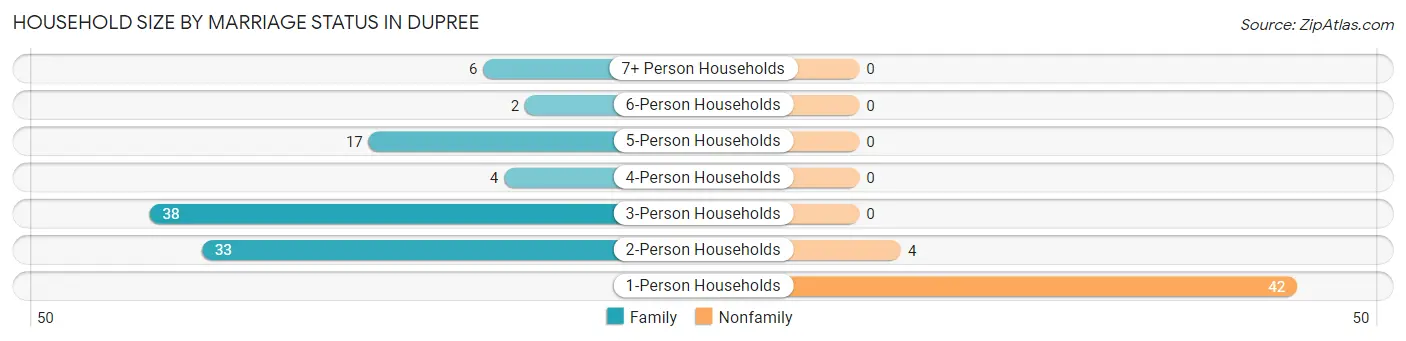
| Household Size | Family Households | Nonfamily Households |
| 1-Person Households | - | 42 (28.8%) |
| 2-Person Households | 33 (22.6%) | 4 (2.7%) |
| 3-Person Households | 38 (26.0%) | 0 (0.0%) |
| 4-Person Households | 4 (2.7%) | 0 (0.0%) |
| 5-Person Households | 17 (11.6%) | 0 (0.0%) |
| 6-Person Households | 2 (1.4%) | 0 (0.0%) |
| 7+ Person Households | 6 (4.1%) | 0 (0.0%) |
| Total | 100 (68.5%) | 46 (31.5%) |
Female Fertility in Dupree
Fertility by Age in Dupree
Average fertility rate in Dupree is 51.0 births per 1,000 women. Women in the age bracket of 20 to 34 years have the highest fertility rate with 132.0 births per 1,000 women. Women in the age bracket of 20 to 34 years acount for 100.0% of all women with births.
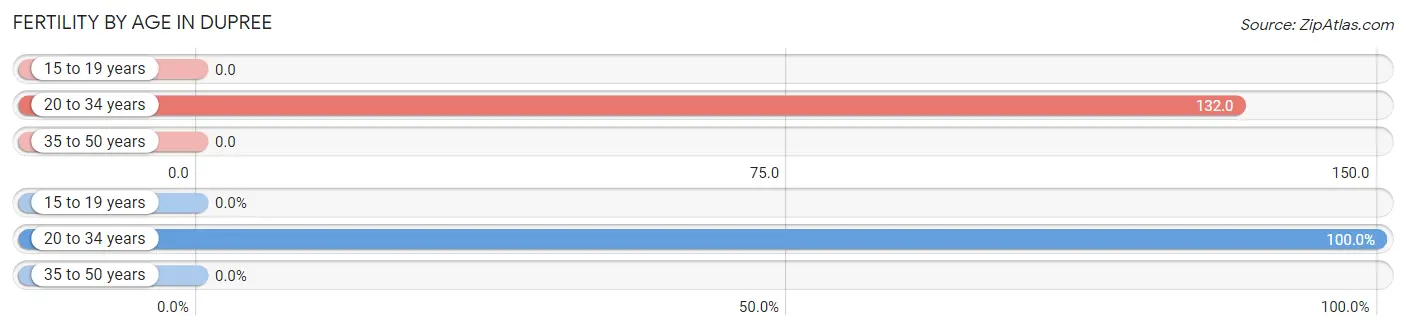
| Age Bracket | Women with Births | Births / 1,000 Women |
| 15 to 19 years | 0 (0.0%) | 0.0 |
| 20 to 34 years | 7 (100.0%) | 132.0 |
| 35 to 50 years | 0 (0.0%) | 0.0 |
| Total | 7 (100.0%) | 51.0 |
Fertility by Age by Marriage Status in Dupree
85.7% of women with births (7) in Dupree are married. The highest percentage of unmarried women with births falls into 20 to 34 years age bracket with 14.3% of them unmarried at the time of birth, while the lowest percentage of unmarried women with births belong to 20 to 34 years age bracket with 14.3% of them unmarried.
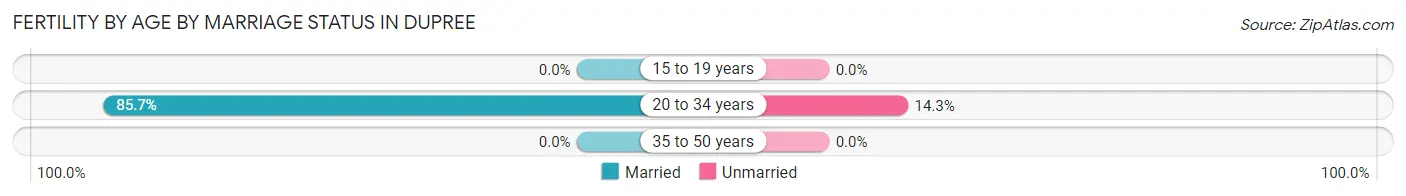
| Age Bracket | Married | Unmarried |
| 15 to 19 years | 0 (0.0%) | 0 (0.0%) |
| 20 to 34 years | 6 (85.7%) | 1 (14.3%) |
| 35 to 50 years | 0 (0.0%) | 0 (0.0%) |
| Total | 6 (85.7%) | 1 (14.3%) |
Fertility by Education in Dupree
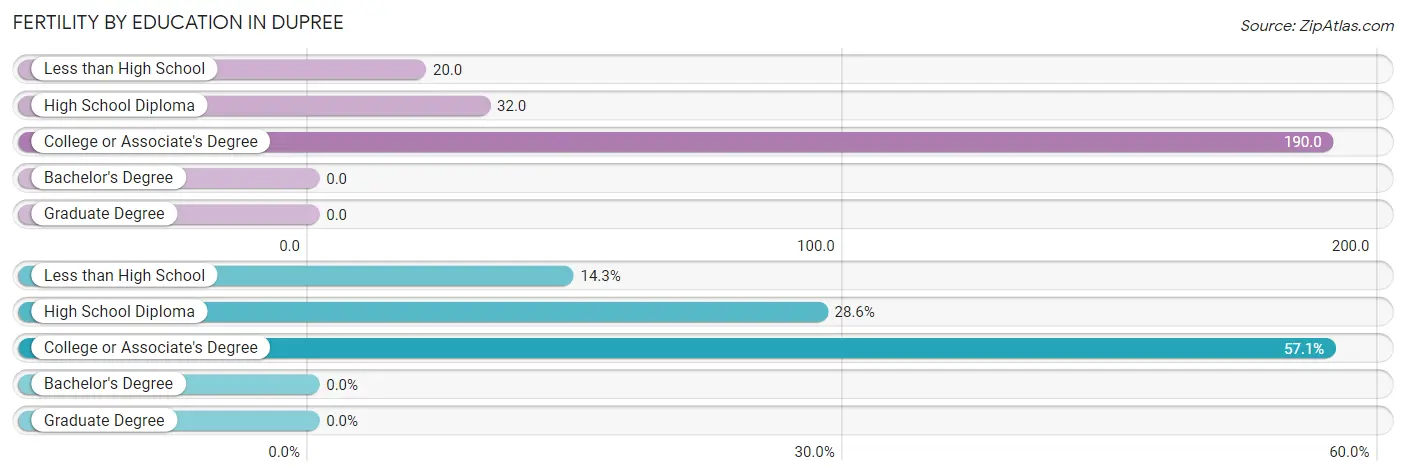
| Educational Attainment | Women with Births | Births / 1,000 Women |
| Less than High School | 1 (14.3%) | 20.0 |
| High School Diploma | 2 (28.6%) | 32.0 |
| College or Associate's Degree | 4 (57.1%) | 190.0 |
| Bachelor's Degree | 0 (0.0%) | 0.0 |
| Graduate Degree | 0 (0.0%) | 0.0 |
| Total | 7 (100.0%) | 51.0 |
Fertility by Education by Marriage Status in Dupree
14.3% of women with births in Dupree are unmarried. Women with the educational attainment of less than high school are most likely to be married with 100.0% of them married at childbirth, while women with the educational attainment of college or associate's degree are least likely to be married with 25.0% of them unmarried at childbirth.
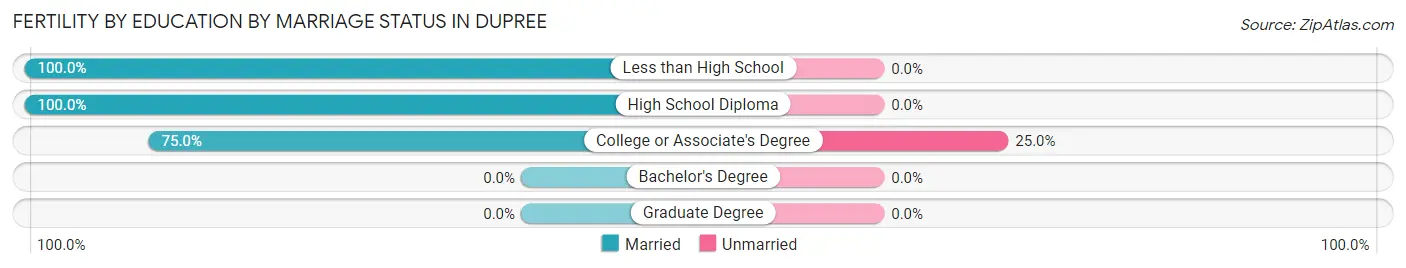
| Educational Attainment | Married | Unmarried |
| Less than High School | 1 (100.0%) | 0 (0.0%) |
| High School Diploma | 2 (100.0%) | 0 (0.0%) |
| College or Associate's Degree | 3 (75.0%) | 1 (25.0%) |
| Bachelor's Degree | 0 (0.0%) | 0 (0.0%) |
| Graduate Degree | 0 (0.0%) | 0 (0.0%) |
| Total | 6 (85.7%) | 1 (14.3%) |
Employment Characteristics in Dupree
Employment by Class of Employer in Dupree
Among the 186 employed individuals in Dupree, local government employees (107 | 57.5%), private company employees (27 | 14.5%), and federal government employees (21 | 11.3%) make up the most common classes of employment.
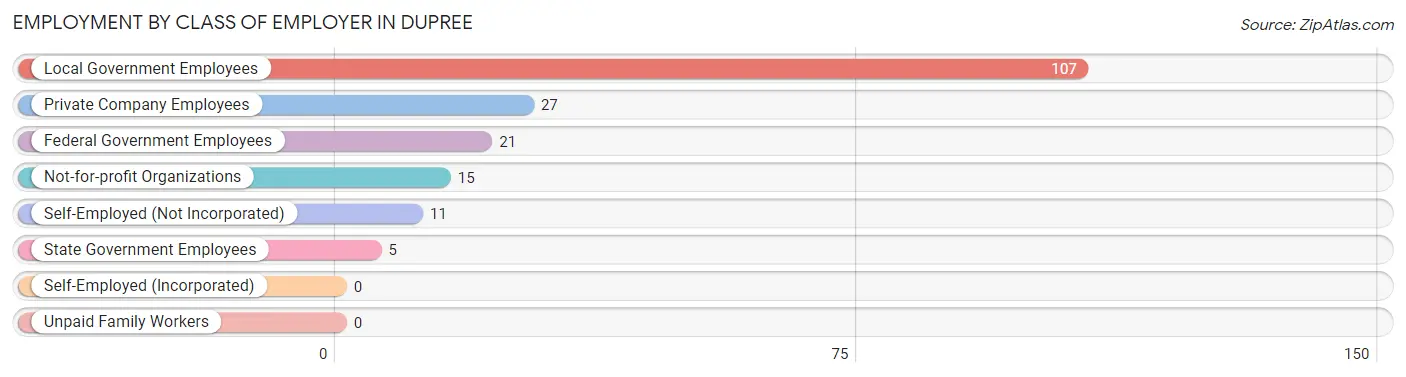
| Employer Class | # Employees | % Employees |
| Private Company Employees | 27 | 14.5% |
| Self-Employed (Incorporated) | 0 | 0.0% |
| Self-Employed (Not Incorporated) | 11 | 5.9% |
| Not-for-profit Organizations | 15 | 8.1% |
| Local Government Employees | 107 | 57.5% |
| State Government Employees | 5 | 2.7% |
| Federal Government Employees | 21 | 11.3% |
| Unpaid Family Workers | 0 | 0.0% |
| Total | 186 | 100.0% |
Employment Status by Age in Dupree
According to the labor force statistics for Dupree, out of the total population over 16 years of age (358), 66.5% or 238 individuals are in the labor force, with 19.7% or 47 of them unemployed. The age group with the highest labor force participation rate is 35 to 44 years, with 98.1% or 52 individuals in the labor force. Within the labor force, the 16 to 19 years age range has the highest percentage of unemployed individuals, with 75.0% or 6 of them being unemployed.
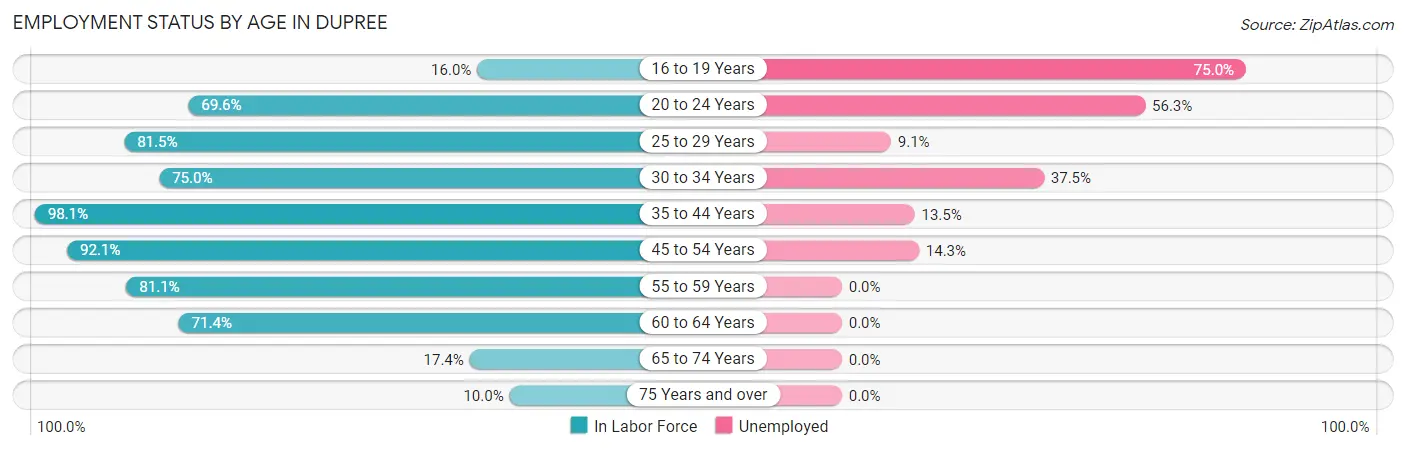
| Age Bracket | In Labor Force | Unemployed |
| 16 to 19 Years | 8 (16.0%) | 6 (75.0%) |
| 20 to 24 Years | 32 (69.6%) | 18 (56.3%) |
| 25 to 29 Years | 22 (81.5%) | 2 (9.1%) |
| 30 to 34 Years | 24 (75.0%) | 9 (37.5%) |
| 35 to 44 Years | 52 (98.1%) | 7 (13.5%) |
| 45 to 54 Years | 35 (92.1%) | 5 (14.3%) |
| 55 to 59 Years | 30 (81.1%) | 0 (0.0%) |
| 60 to 64 Years | 30 (71.4%) | 0 (0.0%) |
| 65 to 74 Years | 4 (17.4%) | 0 (0.0%) |
| 75 Years and over | 1 (10.0%) | 0 (0.0%) |
| Total | 238 (66.5%) | 47 (19.7%) |
Employment Status by Educational Attainment in Dupree
According to labor force statistics for Dupree, 84.3% of individuals (193) out of the total population between 25 and 64 years of age (229) are in the labor force, with 11.9% or 23 of them being unemployed. The group with the highest labor force participation rate are those with the educational attainment of bachelor's degree or higher, with 97.6% or 40 individuals in the labor force. Within the labor force, individuals with less than high school education have the highest percentage of unemployment, with 40.0% or 10 of them being unemployed.
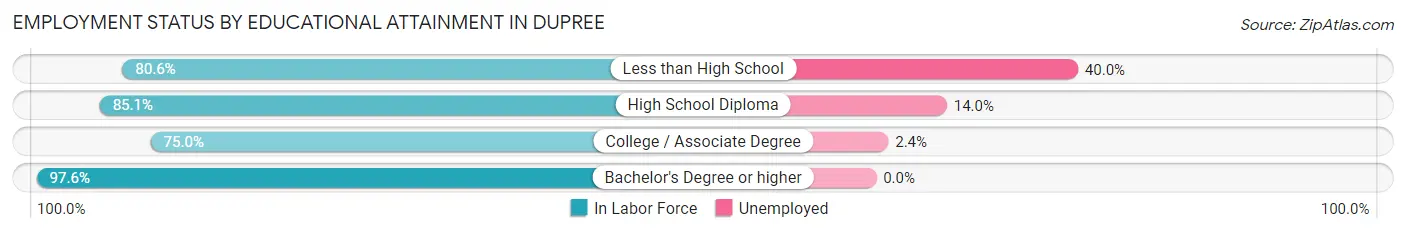
| Educational Attainment | In Labor Force | Unemployed |
| Less than High School | 25 (80.6%) | 12 (40.0%) |
| High School Diploma | 86 (85.1%) | 14 (14.0%) |
| College / Associate Degree | 42 (75.0%) | 1 (2.4%) |
| Bachelor's Degree or higher | 40 (97.6%) | 0 (0.0%) |
| Total | 193 (84.3%) | 27 (11.9%) |
Employment Occupations by Sex in Dupree
Management, Business, Science and Arts Occupations
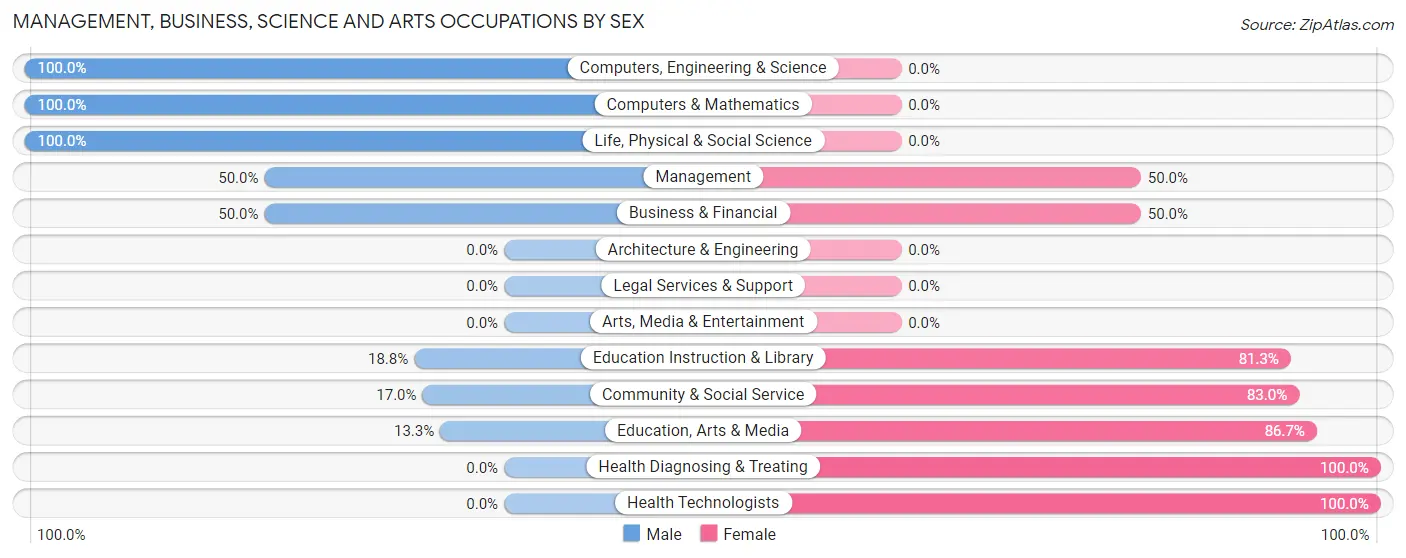
The most common Management, Business, Science and Arts occupations in Dupree are Community & Social Service (47 | 24.6%), Education Instruction & Library (32 | 16.8%), Education, Arts & Media (15 | 7.9%), Management (10 | 5.2%), and Business & Financial (4 | 2.1%).
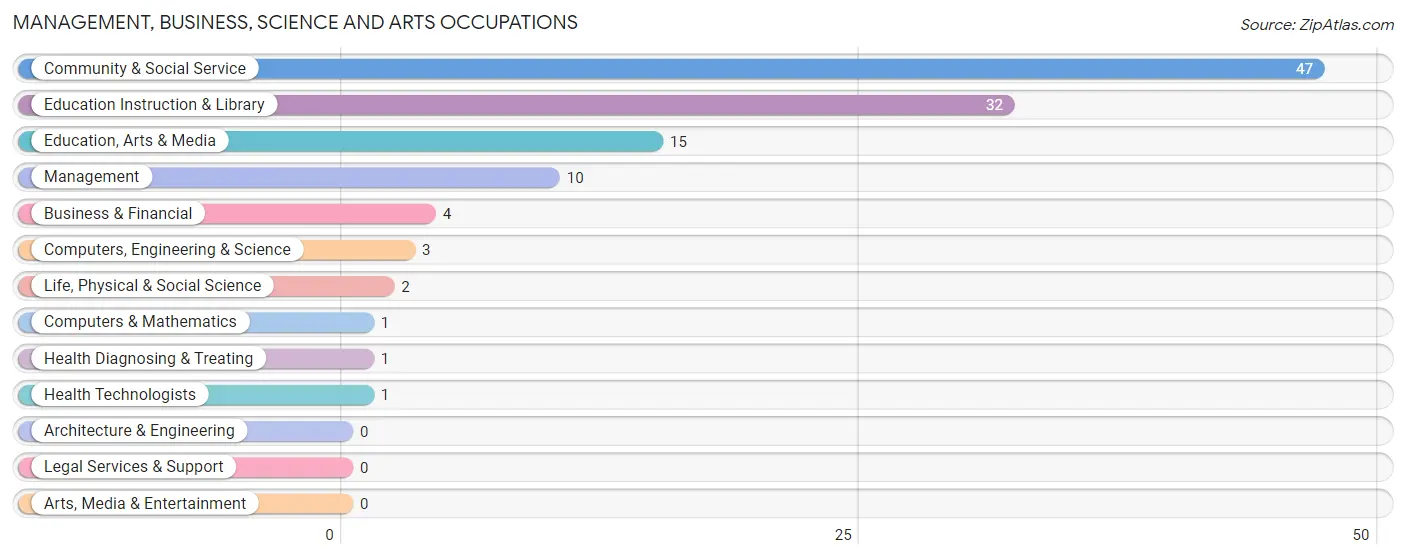
Management, Business, Science and Arts Occupations by Sex
Within the Management, Business, Science and Arts occupations in Dupree, the most male-oriented occupations are Computers, Engineering & Science (100.0%), Computers & Mathematics (100.0%), and Life, Physical & Social Science (100.0%), while the most female-oriented occupations are Health Diagnosing & Treating (100.0%), Health Technologists (100.0%), and Education, Arts & Media (86.7%).
| Occupation | Male | Female |
| Management | 5 (50.0%) | 5 (50.0%) |
| Business & Financial | 2 (50.0%) | 2 (50.0%) |
| Computers, Engineering & Science | 3 (100.0%) | 0 (0.0%) |
| Computers & Mathematics | 1 (100.0%) | 0 (0.0%) |
| Architecture & Engineering | 0 (0.0%) | 0 (0.0%) |
| Life, Physical & Social Science | 2 (100.0%) | 0 (0.0%) |
| Community & Social Service | 8 (17.0%) | 39 (83.0%) |
| Education, Arts & Media | 2 (13.3%) | 13 (86.7%) |
| Legal Services & Support | 0 (0.0%) | 0 (0.0%) |
| Education Instruction & Library | 6 (18.8%) | 26 (81.2%) |
| Arts, Media & Entertainment | 0 (0.0%) | 0 (0.0%) |
| Health Diagnosing & Treating | 0 (0.0%) | 1 (100.0%) |
| Health Technologists | 0 (0.0%) | 1 (100.0%) |
| Total (Category) | 18 (27.7%) | 47 (72.3%) |
| Total (Overall) | 78 (40.8%) | 113 (59.2%) |
Services Occupations
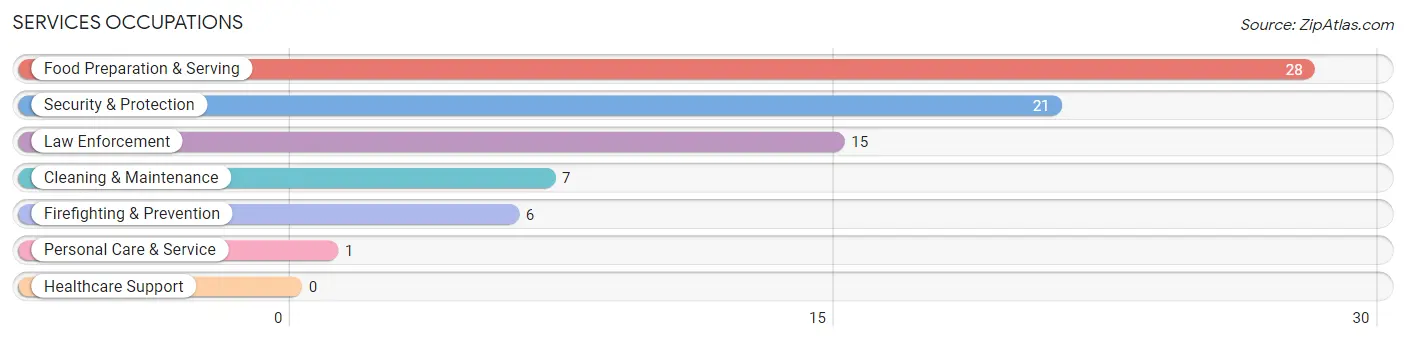
The most common Services occupations in Dupree are Food Preparation & Serving (28 | 14.7%), Security & Protection (21 | 11.0%), Law Enforcement (15 | 7.9%), Cleaning & Maintenance (7 | 3.7%), and Firefighting & Prevention (6 | 3.1%).
Services Occupations by Sex
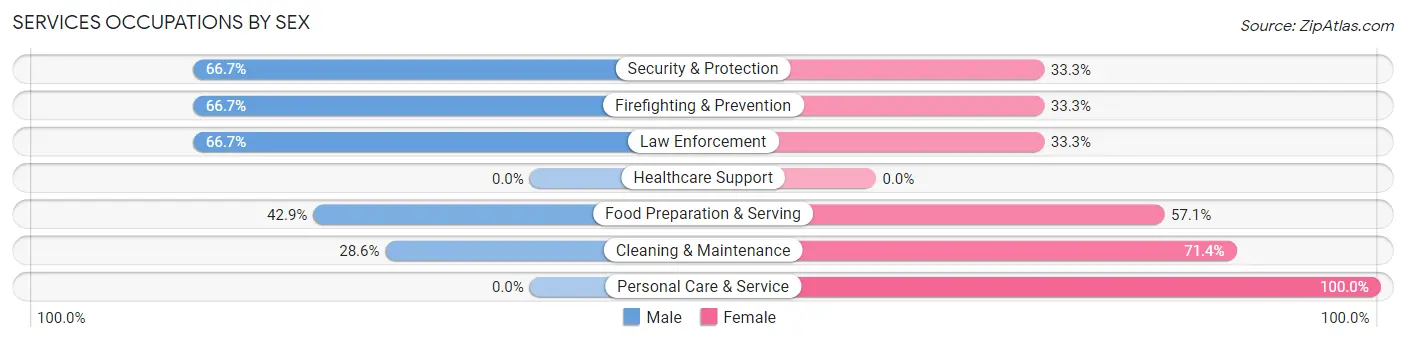
Within the Services occupations in Dupree, the most male-oriented occupations are Security & Protection (66.7%), Firefighting & Prevention (66.7%), and Law Enforcement (66.7%), while the most female-oriented occupations are Personal Care & Service (100.0%), Cleaning & Maintenance (71.4%), and Food Preparation & Serving (57.1%).
| Occupation | Male | Female |
| Healthcare Support | 0 (0.0%) | 0 (0.0%) |
| Security & Protection | 14 (66.7%) | 7 (33.3%) |
| Firefighting & Prevention | 4 (66.7%) | 2 (33.3%) |
| Law Enforcement | 10 (66.7%) | 5 (33.3%) |
| Food Preparation & Serving | 12 (42.9%) | 16 (57.1%) |
| Cleaning & Maintenance | 2 (28.6%) | 5 (71.4%) |
| Personal Care & Service | 0 (0.0%) | 1 (100.0%) |
| Total (Category) | 28 (49.1%) | 29 (50.9%) |
| Total (Overall) | 78 (40.8%) | 113 (59.2%) |
Sales and Office Occupations
The most common Sales and Office occupations in Dupree are Office & Administration (26 | 13.6%), and Sales & Related (12 | 6.3%).

Sales and Office Occupations by Sex

| Occupation | Male | Female |
| Sales & Related | 5 (41.7%) | 7 (58.3%) |
| Office & Administration | 2 (7.7%) | 24 (92.3%) |
| Total (Category) | 7 (18.4%) | 31 (81.6%) |
| Total (Overall) | 78 (40.8%) | 113 (59.2%) |
Natural Resources, Construction and Maintenance Occupations
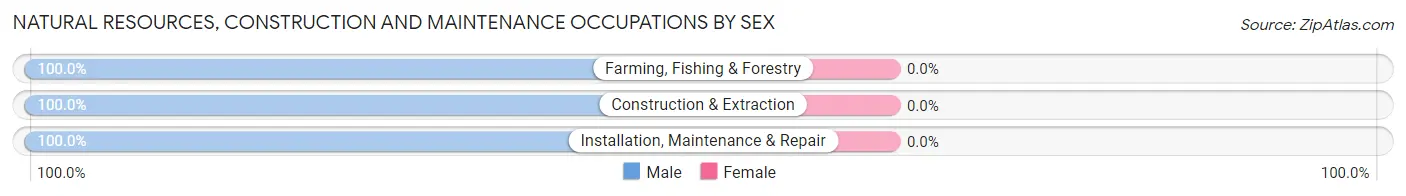
The most common Natural Resources, Construction and Maintenance occupations in Dupree are Installation, Maintenance & Repair (7 | 3.7%), Construction & Extraction (3 | 1.6%), and Farming, Fishing & Forestry (1 | 0.5%).

Natural Resources, Construction and Maintenance Occupations by Sex
| Occupation | Male | Female |
| Farming, Fishing & Forestry | 1 (100.0%) | 0 (0.0%) |
| Construction & Extraction | 3 (100.0%) | 0 (0.0%) |
| Installation, Maintenance & Repair | 7 (100.0%) | 0 (0.0%) |
| Total (Category) | 11 (100.0%) | 0 (0.0%) |
| Total (Overall) | 78 (40.8%) | 113 (59.2%) |
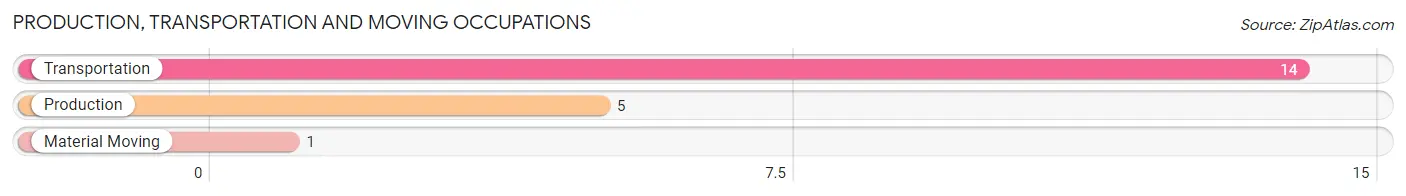
Production, Transportation and Moving Occupations
The most common Production, Transportation and Moving occupations in Dupree are Transportation (14 | 7.3%), Production (5 | 2.6%), and Material Moving (1 | 0.5%).
Production, Transportation and Moving Occupations by Sex
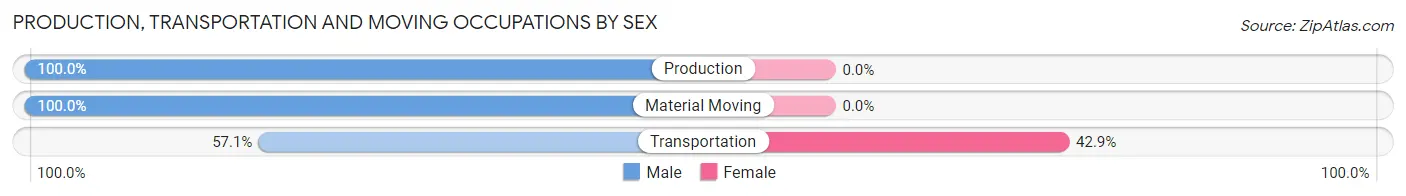
| Occupation | Male | Female |
| Production | 5 (100.0%) | 0 (0.0%) |
| Transportation | 8 (57.1%) | 6 (42.9%) |
| Material Moving | 1 (100.0%) | 0 (0.0%) |
| Total (Category) | 14 (70.0%) | 6 (30.0%) |
| Total (Overall) | 78 (40.8%) | 113 (59.2%) |
Employment Industries by Sex in Dupree
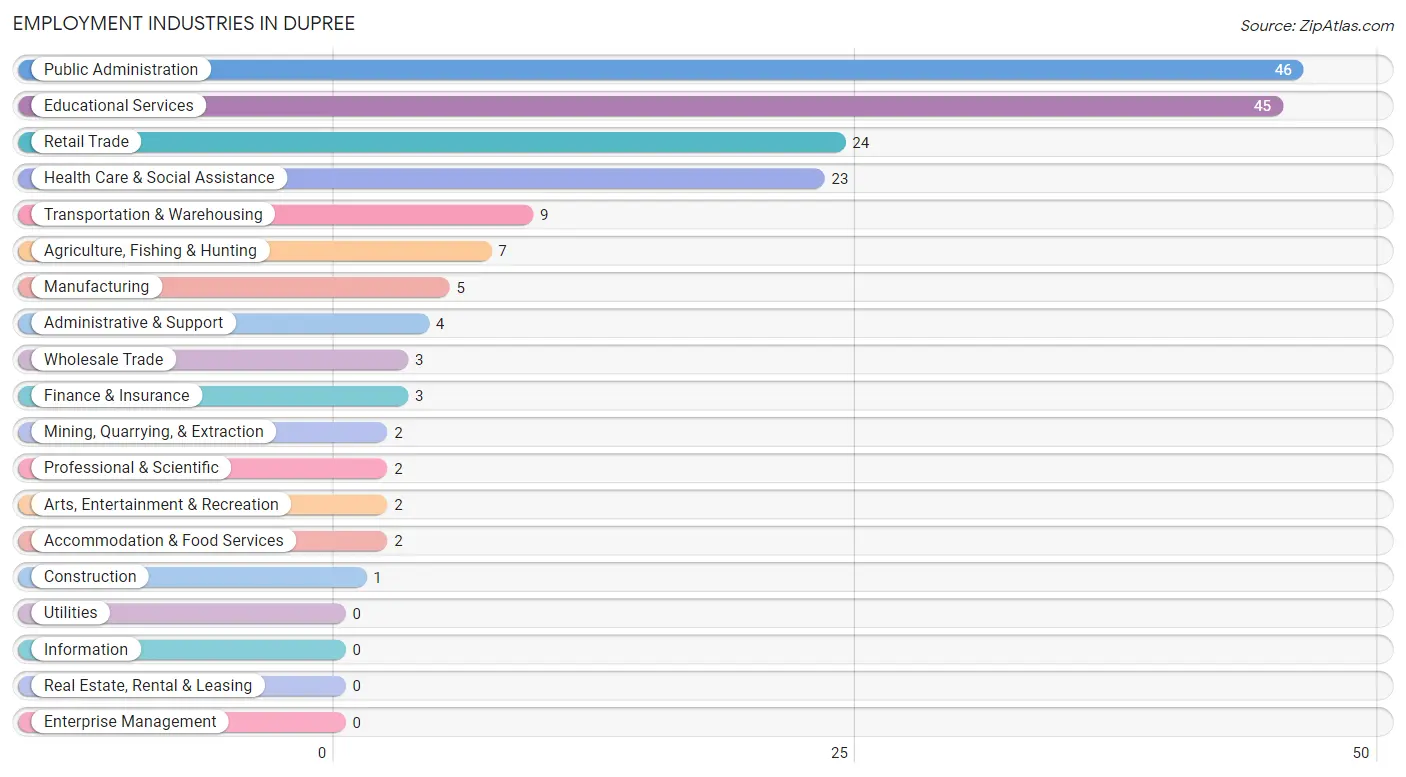
Employment Industries in Dupree
The major employment industries in Dupree include Public Administration (46 | 24.1%), Educational Services (45 | 23.6%), Retail Trade (24 | 12.6%), Health Care & Social Assistance (23 | 12.0%), and Transportation & Warehousing (9 | 4.7%).
Employment Industries by Sex in Dupree
The Dupree industries that see more men than women are Mining, Quarrying, & Extraction (100.0%), Construction (100.0%), and Manufacturing (100.0%), whereas the industries that tend to have a higher number of women are Wholesale Trade (100.0%), Arts, Entertainment & Recreation (100.0%), and Educational Services (80.0%).
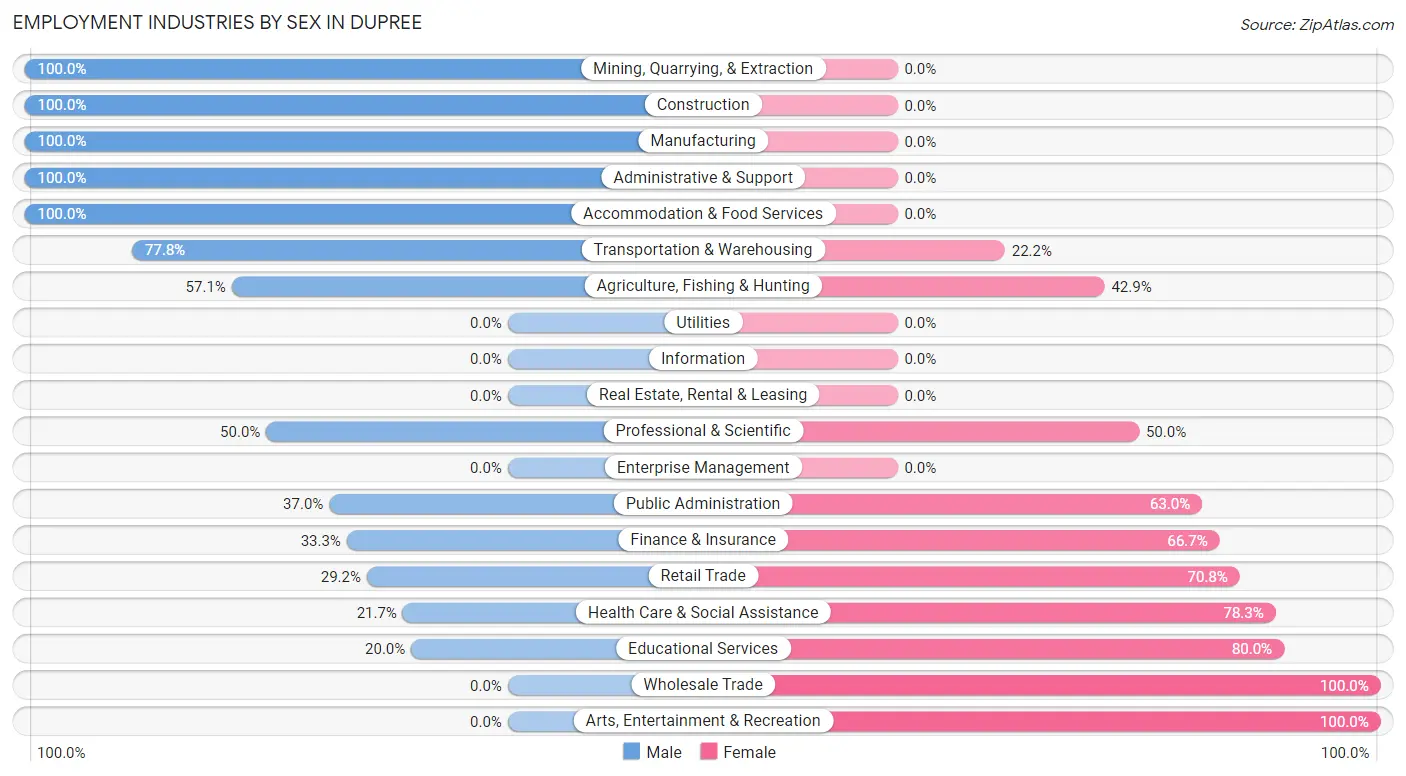
| Industry | Male | Female |
| Agriculture, Fishing & Hunting | 4 (57.1%) | 3 (42.9%) |
| Mining, Quarrying, & Extraction | 2 (100.0%) | 0 (0.0%) |
| Construction | 1 (100.0%) | 0 (0.0%) |
| Manufacturing | 5 (100.0%) | 0 (0.0%) |
| Wholesale Trade | 0 (0.0%) | 3 (100.0%) |
| Retail Trade | 7 (29.2%) | 17 (70.8%) |
| Transportation & Warehousing | 7 (77.8%) | 2 (22.2%) |
| Utilities | 0 (0.0%) | 0 (0.0%) |
| Information | 0 (0.0%) | 0 (0.0%) |
| Finance & Insurance | 1 (33.3%) | 2 (66.7%) |
| Real Estate, Rental & Leasing | 0 (0.0%) | 0 (0.0%) |
| Professional & Scientific | 1 (50.0%) | 1 (50.0%) |
| Enterprise Management | 0 (0.0%) | 0 (0.0%) |
| Administrative & Support | 4 (100.0%) | 0 (0.0%) |
| Educational Services | 9 (20.0%) | 36 (80.0%) |
| Health Care & Social Assistance | 5 (21.7%) | 18 (78.3%) |
| Arts, Entertainment & Recreation | 0 (0.0%) | 2 (100.0%) |
| Accommodation & Food Services | 2 (100.0%) | 0 (0.0%) |
| Public Administration | 17 (37.0%) | 29 (63.0%) |
| Total | 78 (40.8%) | 113 (59.2%) |
Education in Dupree
School Enrollment in Dupree
The most common levels of schooling among the 136 students in Dupree are high school (68 | 50.0%), middle school (28 | 20.6%), and elementary school (21 | 15.4%).
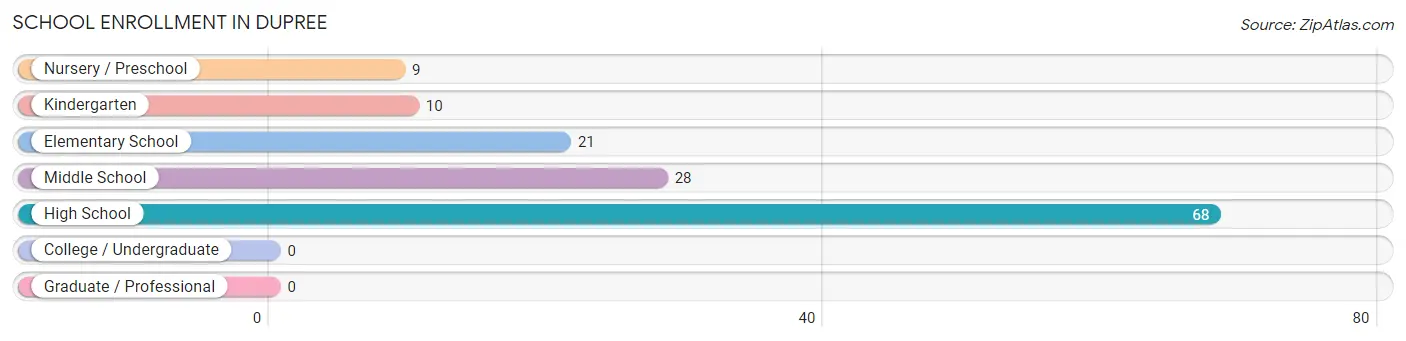
| School Level | # Students | % Students |
| Nursery / Preschool | 9 | 6.6% |
| Kindergarten | 10 | 7.3% |
| Elementary School | 21 | 15.4% |
| Middle School | 28 | 20.6% |
| High School | 68 | 50.0% |
| College / Undergraduate | 0 | 0.0% |
| Graduate / Professional | 0 | 0.0% |
| Total | 136 | 100.0% |
School Enrollment by Age by Funding Source in Dupree
Out of a total of 136 students who are enrolled in schools in Dupree, 7 (5.1%) attend a private institution, while the remaining 129 (94.9%) are enrolled in public schools. The age group of 18 to 19 year olds has the highest likelihood of being enrolled in private schools, with 6 (42.9% in the age bracket) enrolled. Conversely, the age group of 3 to 4 year olds has the lowest likelihood of being enrolled in a private school, with 6 (100.0% in the age bracket) attending a public institution.
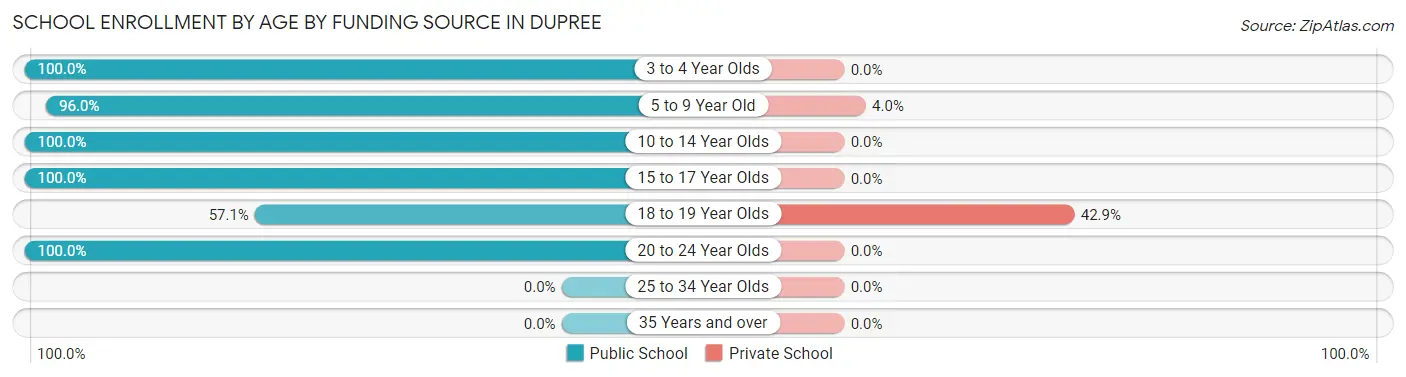
| Age Bracket | Public School | Private School |
| 3 to 4 Year Olds | 6 (100.0%) | 0 (0.0%) |
| 5 to 9 Year Old | 24 (96.0%) | 1 (4.0%) |
| 10 to 14 Year Olds | 31 (100.0%) | 0 (0.0%) |
| 15 to 17 Year Olds | 53 (100.0%) | 0 (0.0%) |
| 18 to 19 Year Olds | 8 (57.1%) | 6 (42.9%) |
| 20 to 24 Year Olds | 7 (100.0%) | 0 (0.0%) |
| 25 to 34 Year Olds | 0 (0.0%) | 0 (0.0%) |
| 35 Years and over | 0 (0.0%) | 0 (0.0%) |
| Total | 129 (94.9%) | 7 (5.1%) |
Educational Attainment by Field of Study in Dupree
Education (20 | 42.5%), arts & humanities (9 | 19.2%), business (7 | 14.9%), liberal arts & history (4 | 8.5%), and bio, nature & agricultural (3 | 6.4%) are the most common fields of study among 47 individuals in Dupree who have obtained a bachelor's degree or higher.
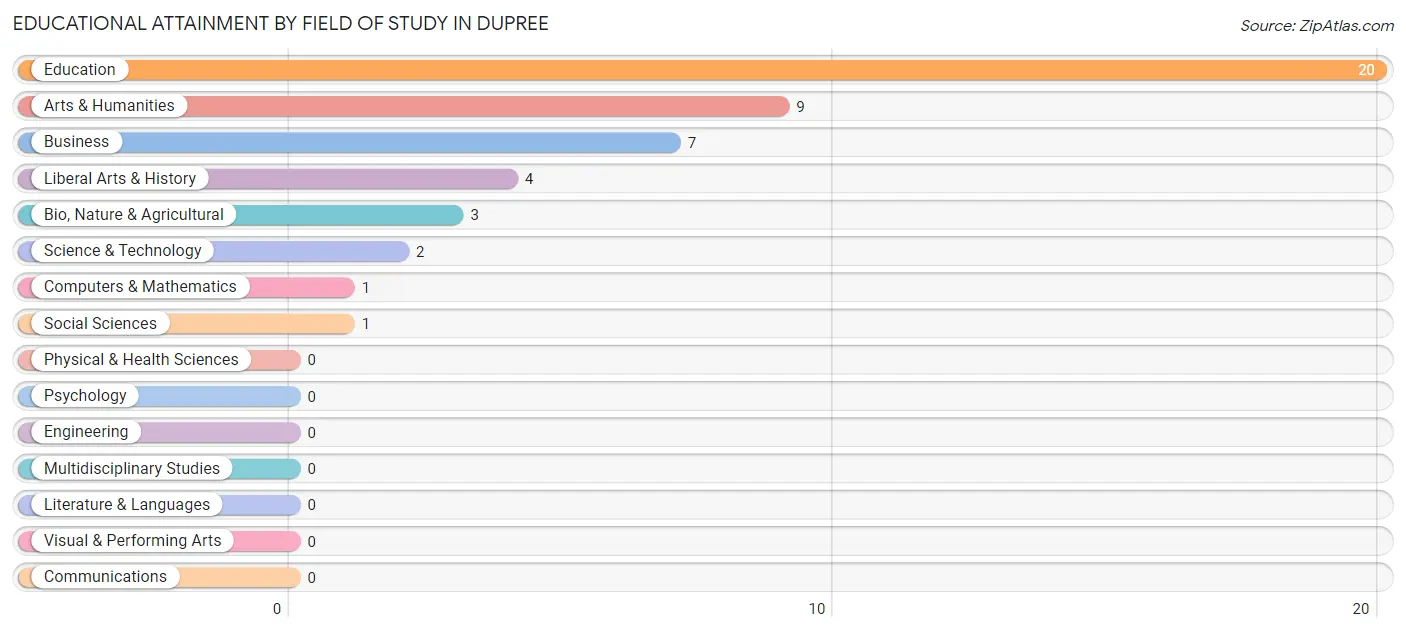
| Field of Study | # Graduates | % Graduates |
| Computers & Mathematics | 1 | 2.1% |
| Bio, Nature & Agricultural | 3 | 6.4% |
| Physical & Health Sciences | 0 | 0.0% |
| Psychology | 0 | 0.0% |
| Social Sciences | 1 | 2.1% |
| Engineering | 0 | 0.0% |
| Multidisciplinary Studies | 0 | 0.0% |
| Science & Technology | 2 | 4.3% |
| Business | 7 | 14.9% |
| Education | 20 | 42.5% |
| Literature & Languages | 0 | 0.0% |
| Liberal Arts & History | 4 | 8.5% |
| Visual & Performing Arts | 0 | 0.0% |
| Communications | 0 | 0.0% |
| Arts & Humanities | 9 | 19.2% |
| Total | 47 | 100.0% |
Transportation & Commute in Dupree
Vehicle Availability by Sex in Dupree
The most prevalent vehicle ownership categories in Dupree are males with 2 vehicles (36, accounting for 46.2%) and females with 2 vehicles (51, making up 33.3%).
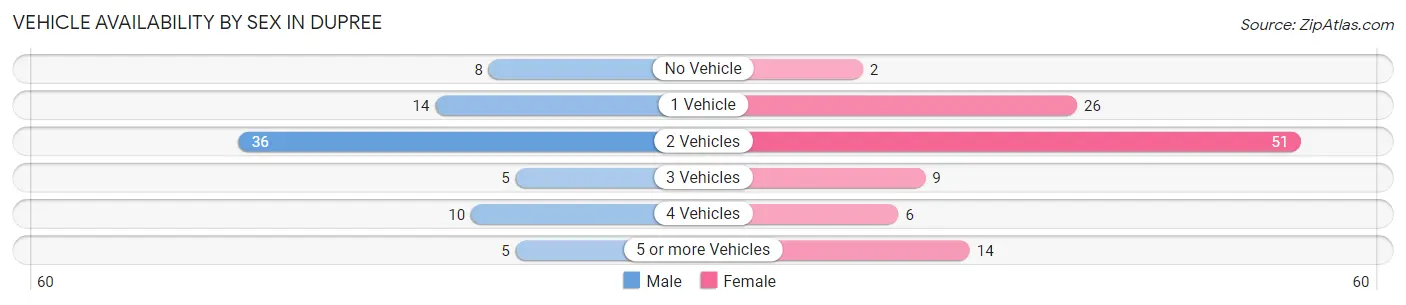
| Vehicles Available | Male | Female |
| No Vehicle | 8 (10.3%) | 2 (1.8%) |
| 1 Vehicle | 14 (17.9%) | 26 (24.1%) |
| 2 Vehicles | 36 (46.2%) | 51 (47.2%) |
| 3 Vehicles | 5 (6.4%) | 9 (8.3%) |
| 4 Vehicles | 10 (12.8%) | 6 (5.6%) |
| 5 or more Vehicles | 5 (6.4%) | 14 (13.0%) |
| Total | 78 (100.0%) | 108 (100.0%) |
Commute Time in Dupree
The most frequently occuring commute durations in Dupree are 25 to 29 minutes (64 commuters, 35.7%), 10 to 14 minutes (41 commuters, 22.9%), and 5 to 9 minutes (28 commuters, 15.6%).
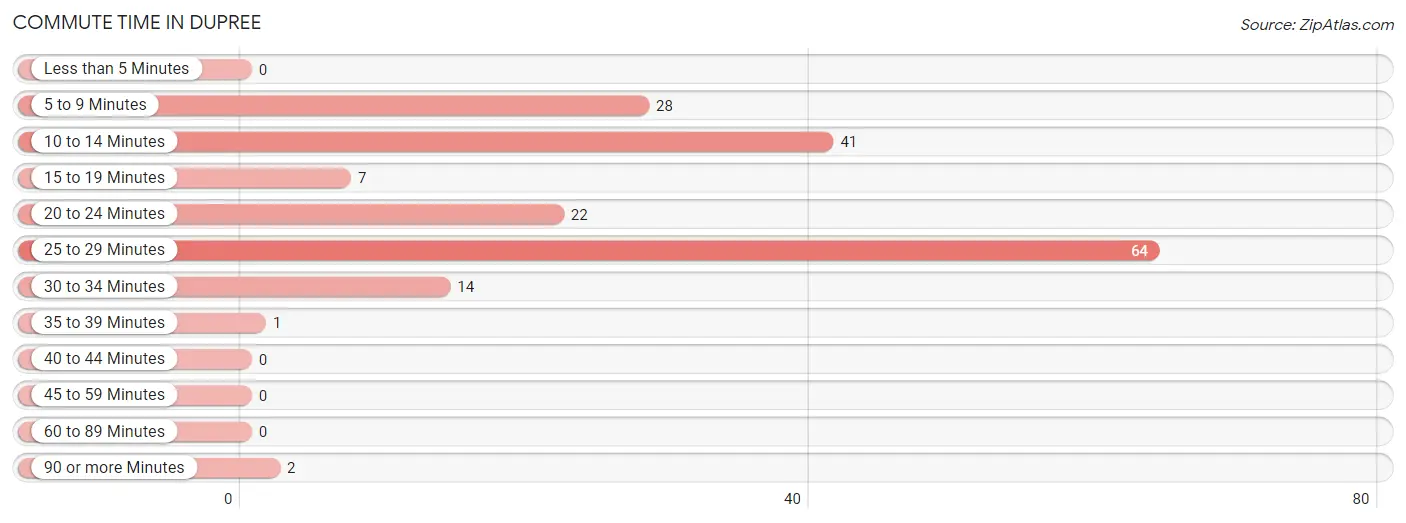
| Commute Time | # Commuters | % Commuters |
| Less than 5 Minutes | 0 | 0.0% |
| 5 to 9 Minutes | 28 | 15.6% |
| 10 to 14 Minutes | 41 | 22.9% |
| 15 to 19 Minutes | 7 | 3.9% |
| 20 to 24 Minutes | 22 | 12.3% |
| 25 to 29 Minutes | 64 | 35.7% |
| 30 to 34 Minutes | 14 | 7.8% |
| 35 to 39 Minutes | 1 | 0.6% |
| 40 to 44 Minutes | 0 | 0.0% |
| 45 to 59 Minutes | 0 | 0.0% |
| 60 to 89 Minutes | 0 | 0.0% |
| 90 or more Minutes | 2 | 1.1% |
Commute Time by Sex in Dupree
The most common commute times in Dupree are 25 to 29 minutes (21 commuters, 29.6%) for males and 25 to 29 minutes (43 commuters, 39.8%) for females.
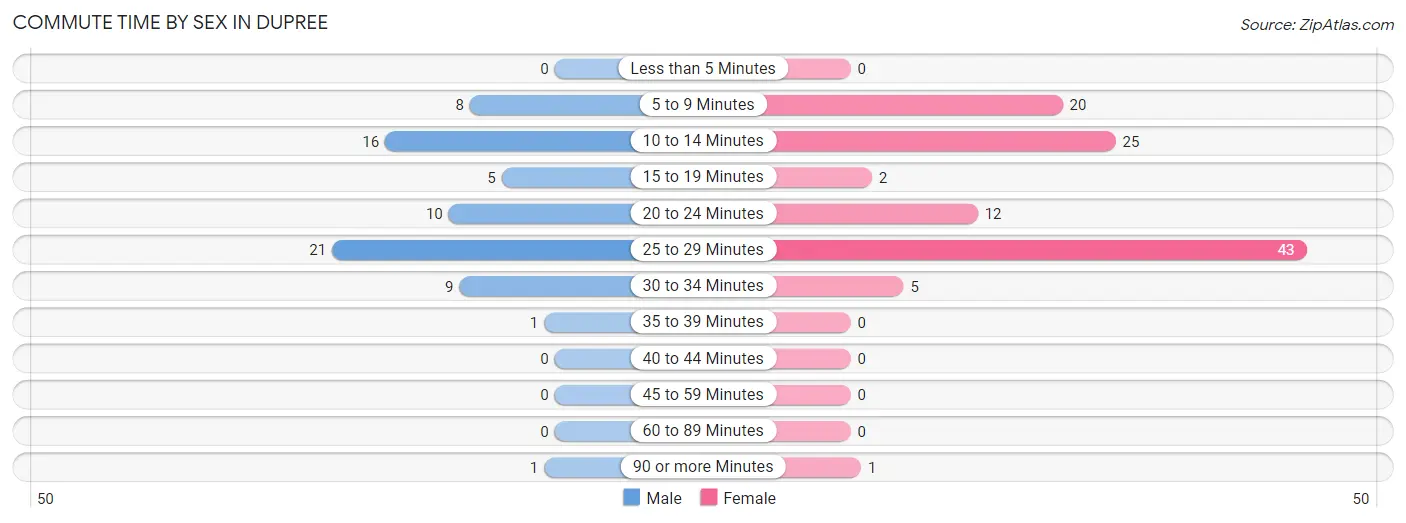
| Commute Time | Male | Female |
| Less than 5 Minutes | 0 (0.0%) | 0 (0.0%) |
| 5 to 9 Minutes | 8 (11.3%) | 20 (18.5%) |
| 10 to 14 Minutes | 16 (22.5%) | 25 (23.2%) |
| 15 to 19 Minutes | 5 (7.0%) | 2 (1.8%) |
| 20 to 24 Minutes | 10 (14.1%) | 12 (11.1%) |
| 25 to 29 Minutes | 21 (29.6%) | 43 (39.8%) |
| 30 to 34 Minutes | 9 (12.7%) | 5 (4.6%) |
| 35 to 39 Minutes | 1 (1.4%) | 0 (0.0%) |
| 40 to 44 Minutes | 0 (0.0%) | 0 (0.0%) |
| 45 to 59 Minutes | 0 (0.0%) | 0 (0.0%) |
| 60 to 89 Minutes | 0 (0.0%) | 0 (0.0%) |
| 90 or more Minutes | 1 (1.4%) | 1 (0.9%) |
Time of Departure to Work by Sex in Dupree
The most frequent times of departure to work in Dupree are 7:30 AM to 7:59 AM (30, 42.2%) for males and 7:30 AM to 7:59 AM (62, 57.4%) for females.
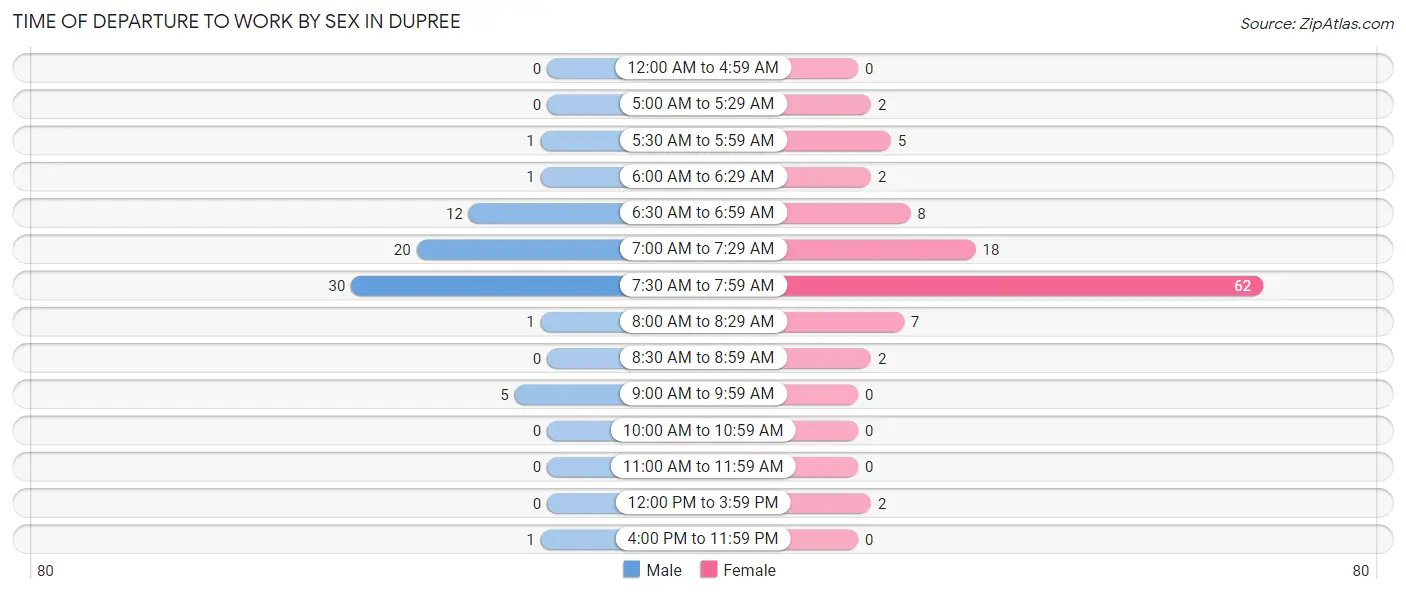
| Time of Departure | Male | Female |
| 12:00 AM to 4:59 AM | 0 (0.0%) | 0 (0.0%) |
| 5:00 AM to 5:29 AM | 0 (0.0%) | 2 (1.8%) |
| 5:30 AM to 5:59 AM | 1 (1.4%) | 5 (4.6%) |
| 6:00 AM to 6:29 AM | 1 (1.4%) | 2 (1.8%) |
| 6:30 AM to 6:59 AM | 12 (16.9%) | 8 (7.4%) |
| 7:00 AM to 7:29 AM | 20 (28.2%) | 18 (16.7%) |
| 7:30 AM to 7:59 AM | 30 (42.2%) | 62 (57.4%) |
| 8:00 AM to 8:29 AM | 1 (1.4%) | 7 (6.5%) |
| 8:30 AM to 8:59 AM | 0 (0.0%) | 2 (1.8%) |
| 9:00 AM to 9:59 AM | 5 (7.0%) | 0 (0.0%) |
| 10:00 AM to 10:59 AM | 0 (0.0%) | 0 (0.0%) |
| 11:00 AM to 11:59 AM | 0 (0.0%) | 0 (0.0%) |
| 12:00 PM to 3:59 PM | 0 (0.0%) | 2 (1.8%) |
| 4:00 PM to 11:59 PM | 1 (1.4%) | 0 (0.0%) |
| Total | 71 (100.0%) | 108 (100.0%) |
Housing Occupancy in Dupree
Occupancy by Ownership in Dupree
Of the total 146 dwellings in Dupree, owner-occupied units account for 77 (52.7%), while renter-occupied units make up 69 (47.3%).
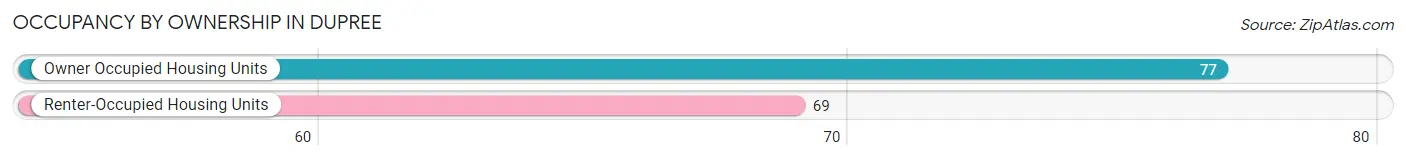
| Occupancy | # Housing Units | % Housing Units |
| Owner Occupied Housing Units | 77 | 52.7% |
| Renter-Occupied Housing Units | 69 | 47.3% |
| Total Occupied Housing Units | 146 | 100.0% |
Occupancy by Household Size in Dupree
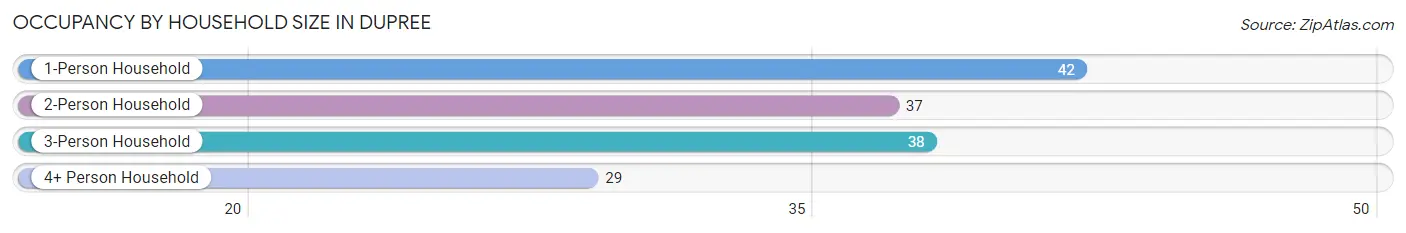
| Household Size | # Housing Units | % Housing Units |
| 1-Person Household | 42 | 28.8% |
| 2-Person Household | 37 | 25.3% |
| 3-Person Household | 38 | 26.0% |
| 4+ Person Household | 29 | 19.9% |
| Total Housing Units | 146 | 100.0% |
Occupancy by Ownership by Household Size in Dupree
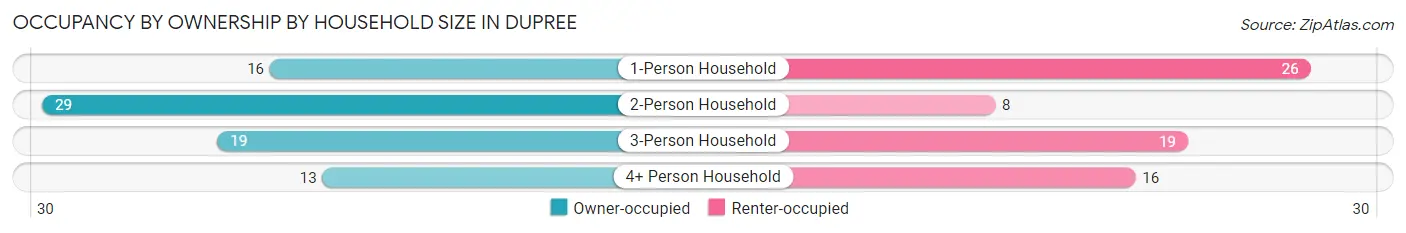
| Household Size | Owner-occupied | Renter-occupied |
| 1-Person Household | 16 (38.1%) | 26 (61.9%) |
| 2-Person Household | 29 (78.4%) | 8 (21.6%) |
| 3-Person Household | 19 (50.0%) | 19 (50.0%) |
| 4+ Person Household | 13 (44.8%) | 16 (55.2%) |
| Total Housing Units | 77 (52.7%) | 69 (47.3%) |
Occupancy by Educational Attainment in Dupree
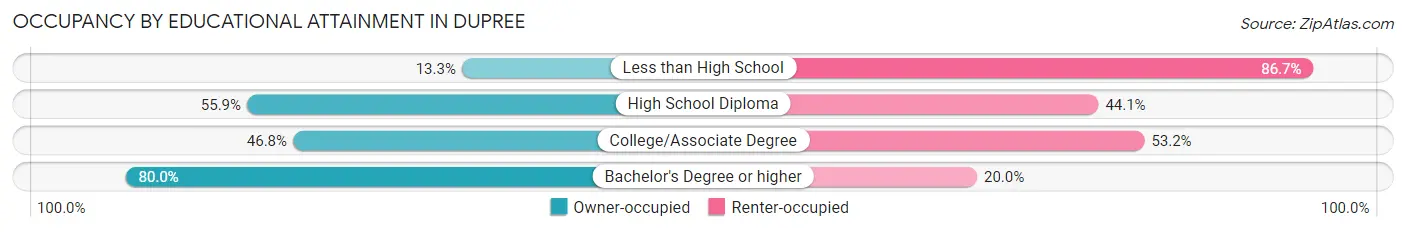
| Household Size | Owner-occupied | Renter-occupied |
| Less than High School | 2 (13.3%) | 13 (86.7%) |
| High School Diploma | 33 (55.9%) | 26 (44.1%) |
| College/Associate Degree | 22 (46.8%) | 25 (53.2%) |
| Bachelor's Degree or higher | 20 (80.0%) | 5 (20.0%) |
Occupancy by Age of Householder in Dupree
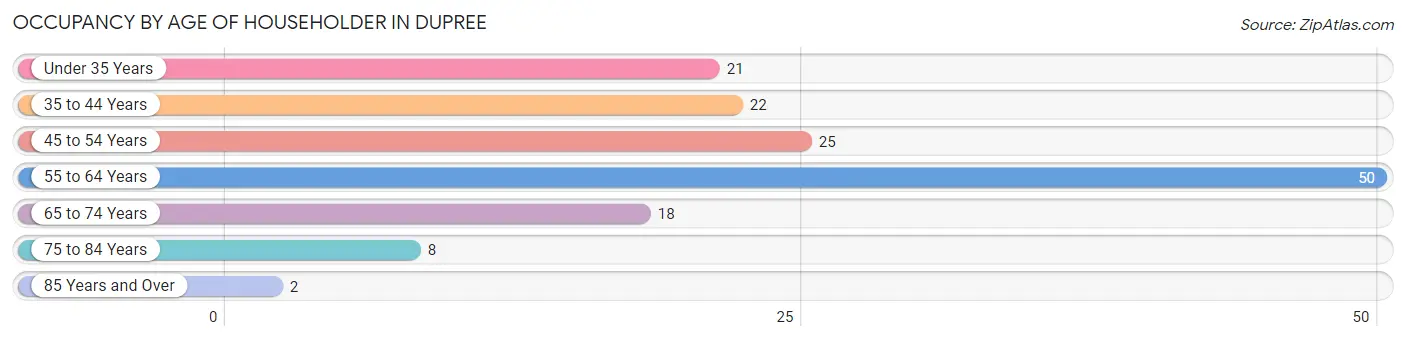
| Age Bracket | # Households | % Households |
| Under 35 Years | 21 | 14.4% |
| 35 to 44 Years | 22 | 15.1% |
| 45 to 54 Years | 25 | 17.1% |
| 55 to 64 Years | 50 | 34.3% |
| 65 to 74 Years | 18 | 12.3% |
| 75 to 84 Years | 8 | 5.5% |
| 85 Years and Over | 2 | 1.4% |
| Total | 146 | 100.0% |
Housing Finances in Dupree
Median Income by Occupancy in Dupree
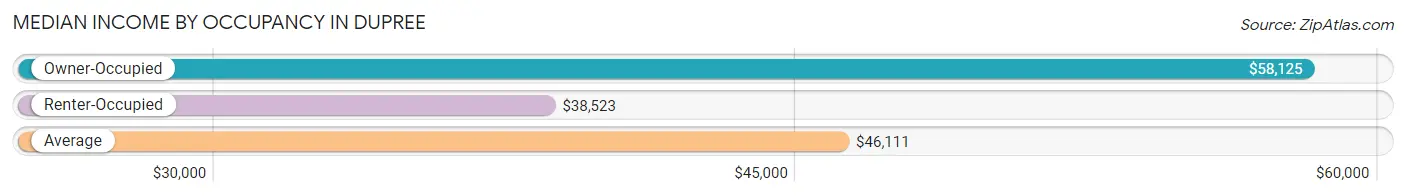
| Occupancy Type | # Households | Median Income |
| Owner-Occupied | 77 (52.7%) | $58,125 |
| Renter-Occupied | 69 (47.3%) | $38,523 |
| Average | 146 (100.0%) | $46,111 |
Occupancy by Householder Income Bracket in Dupree
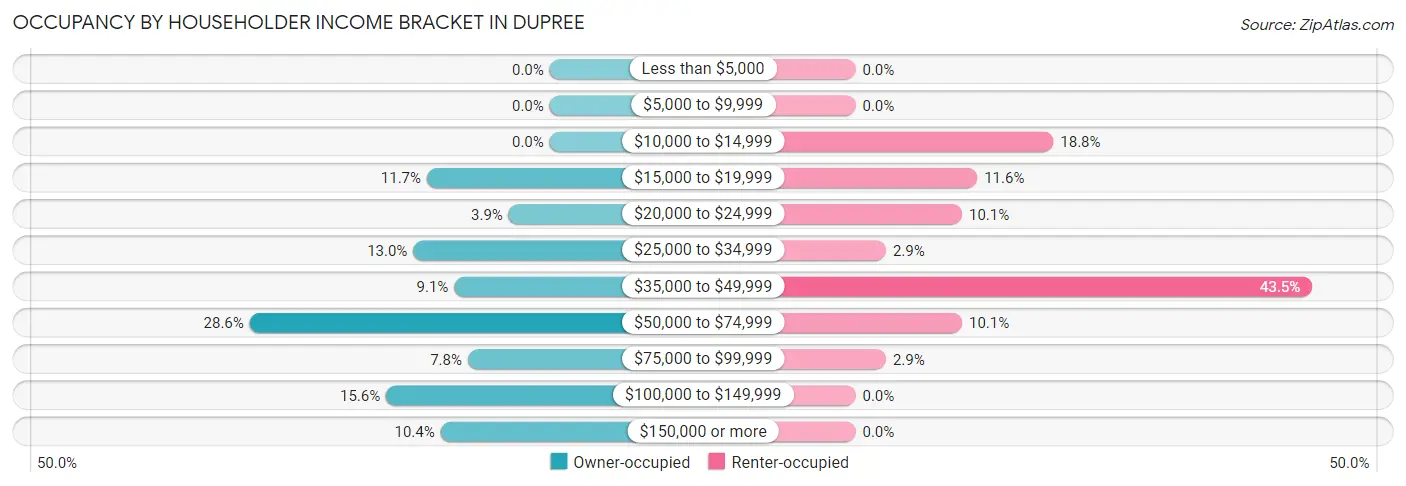
| Income Bracket | Owner-occupied | Renter-occupied |
| Less than $5,000 | 0 (0.0%) | 0 (0.0%) |
| $5,000 to $9,999 | 0 (0.0%) | 0 (0.0%) |
| $10,000 to $14,999 | 0 (0.0%) | 13 (18.8%) |
| $15,000 to $19,999 | 9 (11.7%) | 8 (11.6%) |
| $20,000 to $24,999 | 3 (3.9%) | 7 (10.1%) |
| $25,000 to $34,999 | 10 (13.0%) | 2 (2.9%) |
| $35,000 to $49,999 | 7 (9.1%) | 30 (43.5%) |
| $50,000 to $74,999 | 22 (28.6%) | 7 (10.1%) |
| $75,000 to $99,999 | 6 (7.8%) | 2 (2.9%) |
| $100,000 to $149,999 | 12 (15.6%) | 0 (0.0%) |
| $150,000 or more | 8 (10.4%) | 0 (0.0%) |
| Total | 77 (100.0%) | 69 (100.0%) |
Monthly Housing Cost Tiers in Dupree
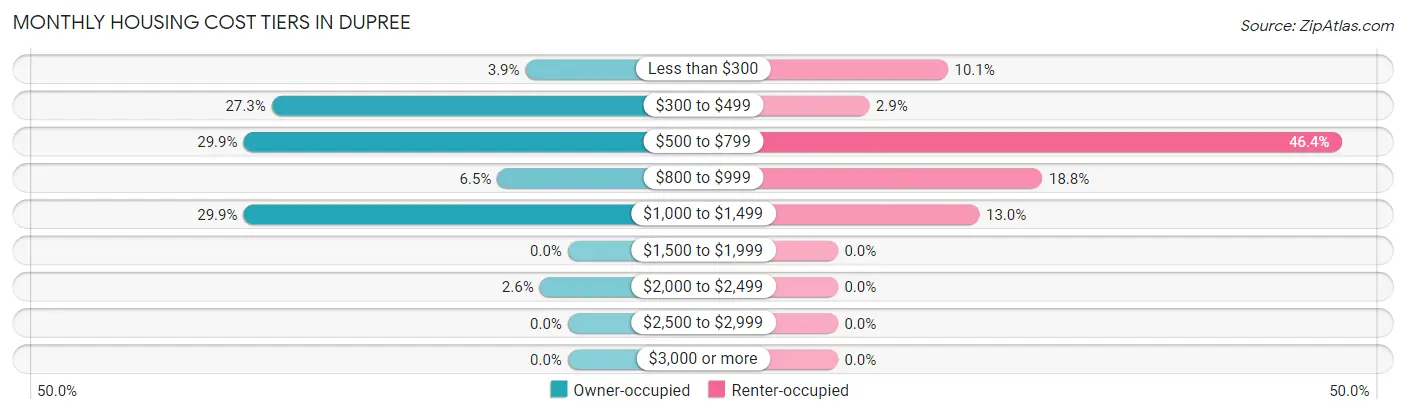
| Monthly Cost | Owner-occupied | Renter-occupied |
| Less than $300 | 3 (3.9%) | 7 (10.1%) |
| $300 to $499 | 21 (27.3%) | 2 (2.9%) |
| $500 to $799 | 23 (29.9%) | 32 (46.4%) |
| $800 to $999 | 5 (6.5%) | 13 (18.8%) |
| $1,000 to $1,499 | 23 (29.9%) | 9 (13.0%) |
| $1,500 to $1,999 | 0 (0.0%) | 0 (0.0%) |
| $2,000 to $2,499 | 2 (2.6%) | 0 (0.0%) |
| $2,500 to $2,999 | 0 (0.0%) | 0 (0.0%) |
| $3,000 or more | 0 (0.0%) | 0 (0.0%) |
| Total | 77 (100.0%) | 69 (100.0%) |
Physical Housing Characteristics in Dupree
Housing Structures in Dupree
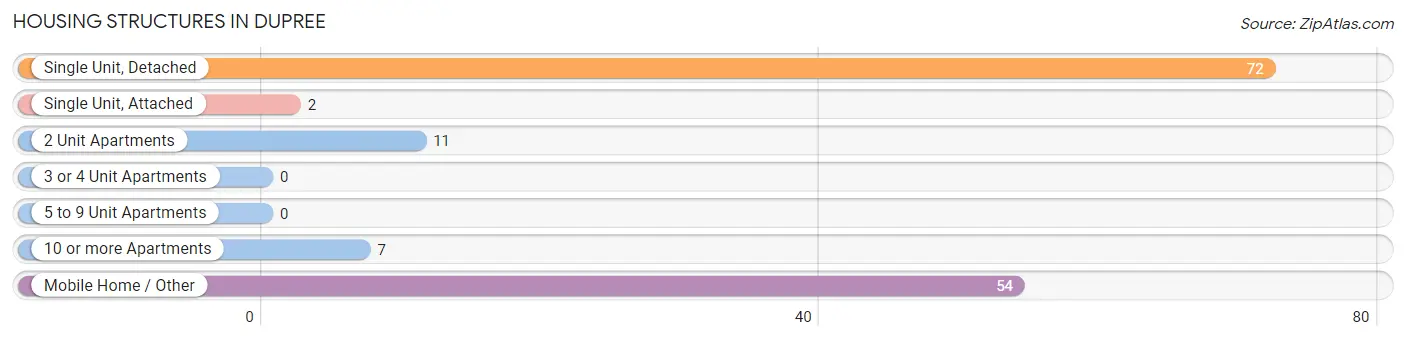
| Structure Type | # Housing Units | % Housing Units |
| Single Unit, Detached | 72 | 49.3% |
| Single Unit, Attached | 2 | 1.4% |
| 2 Unit Apartments | 11 | 7.5% |
| 3 or 4 Unit Apartments | 0 | 0.0% |
| 5 to 9 Unit Apartments | 0 | 0.0% |
| 10 or more Apartments | 7 | 4.8% |
| Mobile Home / Other | 54 | 37.0% |
| Total | 146 | 100.0% |
Housing Structures by Occupancy in Dupree
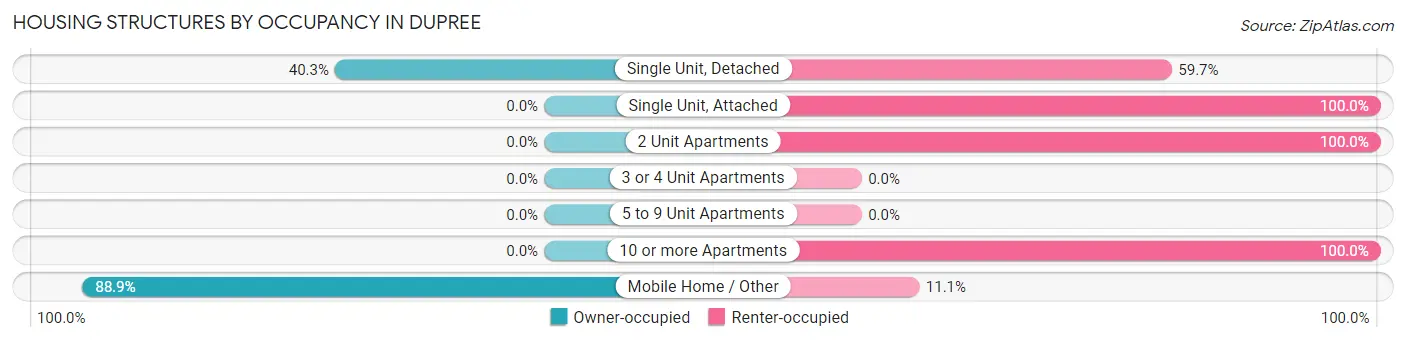
| Structure Type | Owner-occupied | Renter-occupied |
| Single Unit, Detached | 29 (40.3%) | 43 (59.7%) |
| Single Unit, Attached | 0 (0.0%) | 2 (100.0%) |
| 2 Unit Apartments | 0 (0.0%) | 11 (100.0%) |
| 3 or 4 Unit Apartments | 0 (0.0%) | 0 (0.0%) |
| 5 to 9 Unit Apartments | 0 (0.0%) | 0 (0.0%) |
| 10 or more Apartments | 0 (0.0%) | 7 (100.0%) |
| Mobile Home / Other | 48 (88.9%) | 6 (11.1%) |
| Total | 77 (52.7%) | 69 (47.3%) |
Housing Structures by Number of Rooms in Dupree
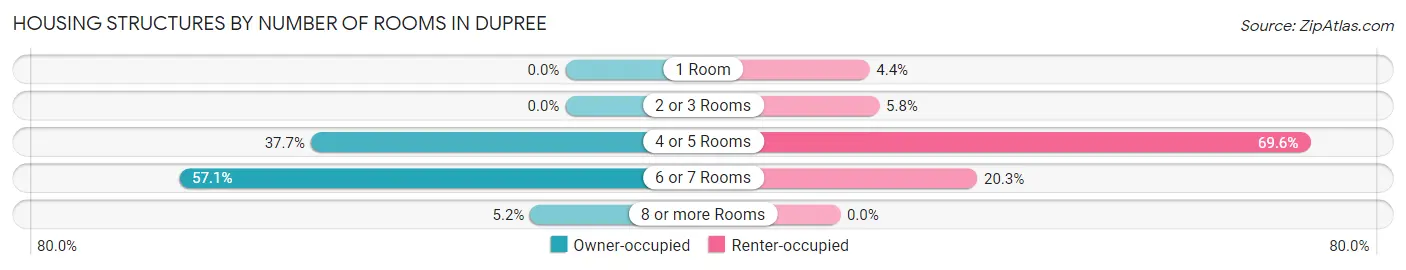
| Number of Rooms | Owner-occupied | Renter-occupied |
| 1 Room | 0 (0.0%) | 3 (4.3%) |
| 2 or 3 Rooms | 0 (0.0%) | 4 (5.8%) |
| 4 or 5 Rooms | 29 (37.7%) | 48 (69.6%) |
| 6 or 7 Rooms | 44 (57.1%) | 14 (20.3%) |
| 8 or more Rooms | 4 (5.2%) | 0 (0.0%) |
| Total | 77 (100.0%) | 69 (100.0%) |
Housing Structure by Heating Type in Dupree
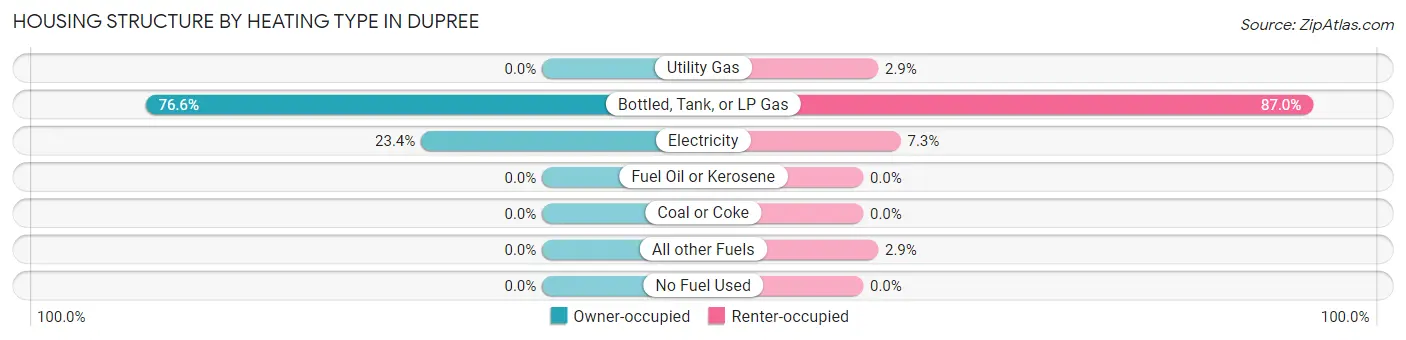
| Heating Type | Owner-occupied | Renter-occupied |
| Utility Gas | 0 (0.0%) | 2 (2.9%) |
| Bottled, Tank, or LP Gas | 59 (76.6%) | 60 (87.0%) |
| Electricity | 18 (23.4%) | 5 (7.2%) |
| Fuel Oil or Kerosene | 0 (0.0%) | 0 (0.0%) |
| Coal or Coke | 0 (0.0%) | 0 (0.0%) |
| All other Fuels | 0 (0.0%) | 2 (2.9%) |
| No Fuel Used | 0 (0.0%) | 0 (0.0%) |
| Total | 77 (100.0%) | 69 (100.0%) |
Household Vehicle Usage in Dupree
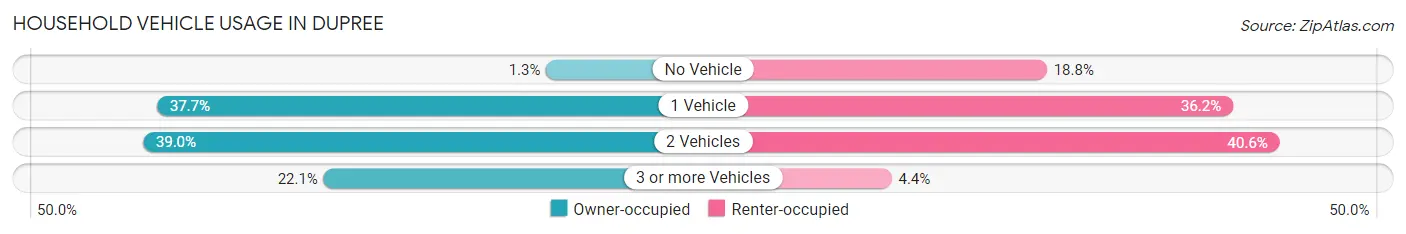
| Vehicles per Household | Owner-occupied | Renter-occupied |
| No Vehicle | 1 (1.3%) | 13 (18.8%) |
| 1 Vehicle | 29 (37.7%) | 25 (36.2%) |
| 2 Vehicles | 30 (39.0%) | 28 (40.6%) |
| 3 or more Vehicles | 17 (22.1%) | 3 (4.3%) |
| Total | 77 (100.0%) | 69 (100.0%) |
Real Estate & Mortgages in Dupree
Real Estate and Mortgage Overview in Dupree
| Characteristic | Without Mortgage | With Mortgage |
| Housing Units | 49 | 28 |
| Median Property Value | - | - |
| Median Household Income | $60,417 | $3 |
| Monthly Housing Costs | $504 | $0 |
| Real Estate Taxes | $475 | $13 |
Property Value by Mortgage Status in Dupree
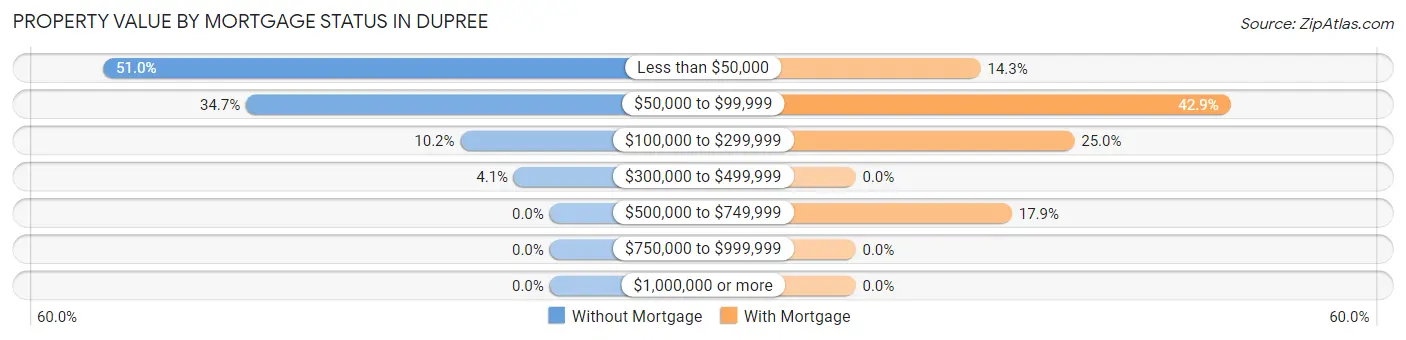
| Property Value | Without Mortgage | With Mortgage |
| Less than $50,000 | 25 (51.0%) | 4 (14.3%) |
| $50,000 to $99,999 | 17 (34.7%) | 12 (42.9%) |
| $100,000 to $299,999 | 5 (10.2%) | 7 (25.0%) |
| $300,000 to $499,999 | 2 (4.1%) | 0 (0.0%) |
| $500,000 to $749,999 | 0 (0.0%) | 5 (17.9%) |
| $750,000 to $999,999 | 0 (0.0%) | 0 (0.0%) |
| $1,000,000 or more | 0 (0.0%) | 0 (0.0%) |
| Total | 49 (100.0%) | 28 (100.0%) |
Household Income by Mortgage Status in Dupree
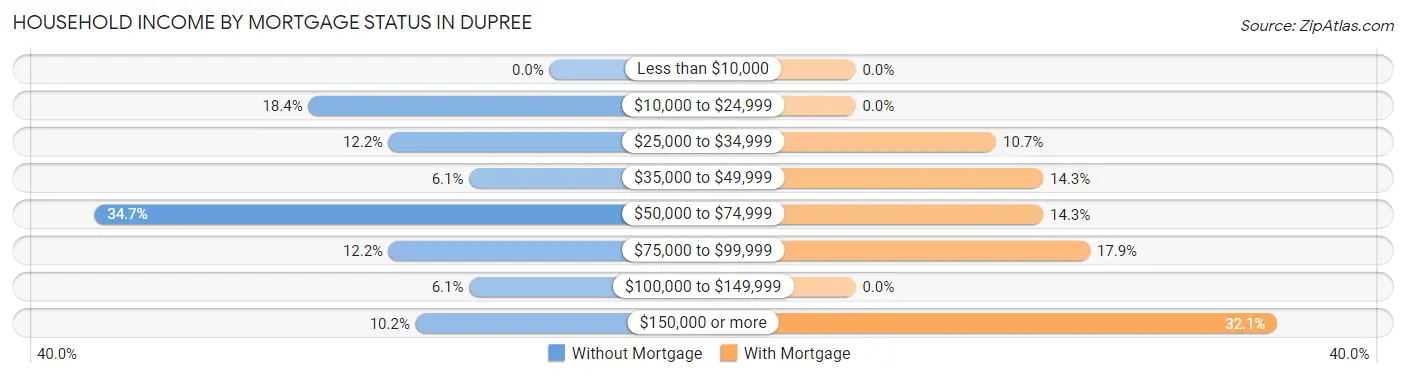
| Household Income | Without Mortgage | With Mortgage |
| Less than $10,000 | 0 (0.0%) | 0 (0.0%) |
| $10,000 to $24,999 | 9 (18.4%) | 0 (0.0%) |
| $25,000 to $34,999 | 6 (12.2%) | 3 (10.7%) |
| $35,000 to $49,999 | 3 (6.1%) | 4 (14.3%) |
| $50,000 to $74,999 | 17 (34.7%) | 4 (14.3%) |
| $75,000 to $99,999 | 6 (12.2%) | 5 (17.9%) |
| $100,000 to $149,999 | 3 (6.1%) | 0 (0.0%) |
| $150,000 or more | 5 (10.2%) | 9 (32.1%) |
| Total | 49 (100.0%) | 28 (100.0%) |
Property Value to Household Income Ratio in Dupree
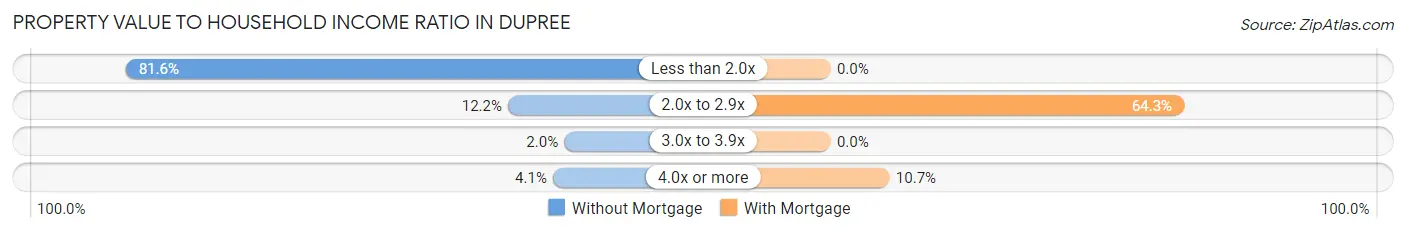
| Value-to-Income Ratio | Without Mortgage | With Mortgage |
| Less than 2.0x | 40 (81.6%) | 0 (0.0%) |
| 2.0x to 2.9x | 6 (12.2%) | 18 (64.3%) |
| 3.0x to 3.9x | 1 (2.0%) | 0 (0.0%) |
| 4.0x or more | 2 (4.1%) | 3 (10.7%) |
| Total | 49 (100.0%) | 28 (100.0%) |
Real Estate Taxes by Mortgage Status in Dupree
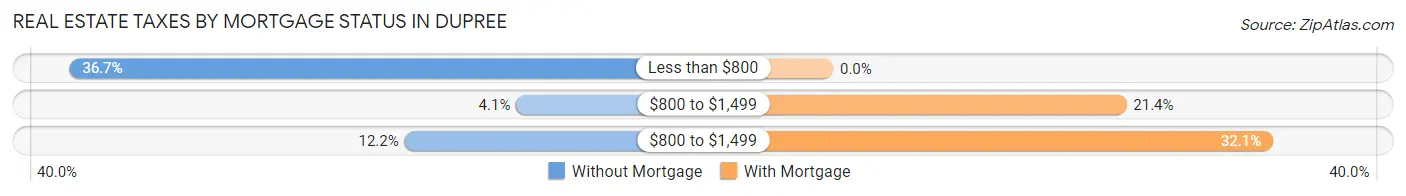
| Property Taxes | Without Mortgage | With Mortgage |
| Less than $800 | 18 (36.7%) | 0 (0.0%) |
| $800 to $1,499 | 2 (4.1%) | 6 (21.4%) |
| $800 to $1,499 | 6 (12.2%) | 9 (32.1%) |
| Total | 49 (100.0%) | 28 (100.0%) |
Health & Disability in Dupree
Health Insurance Coverage by Age in Dupree
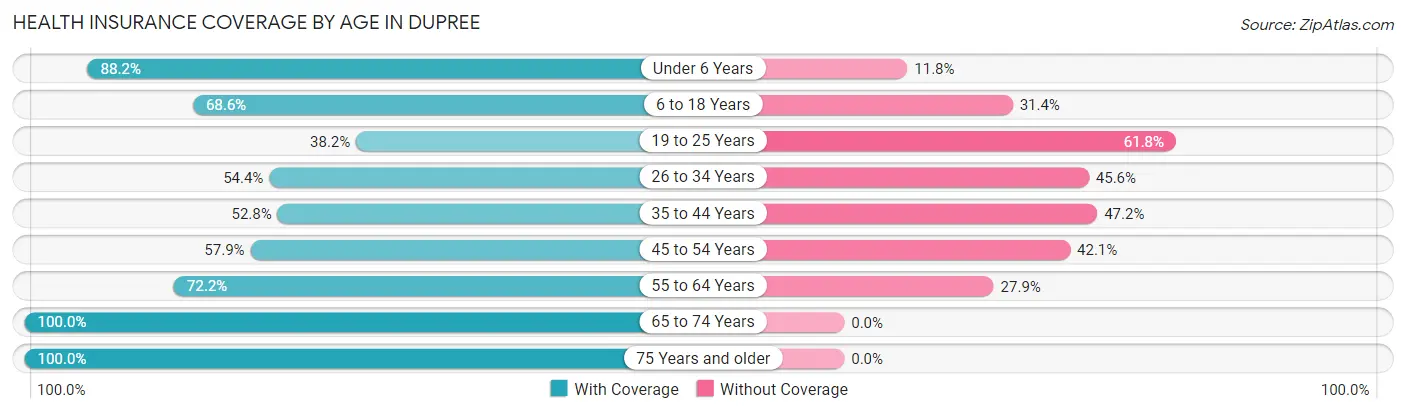
| Age Bracket | With Coverage | Without Coverage |
| Under 6 Years | 30 (88.2%) | 4 (11.8%) |
| 6 to 18 Years | 83 (68.6%) | 38 (31.4%) |
| 19 to 25 Years | 21 (38.2%) | 34 (61.8%) |
| 26 to 34 Years | 31 (54.4%) | 26 (45.6%) |
| 35 to 44 Years | 28 (52.8%) | 25 (47.2%) |
| 45 to 54 Years | 22 (57.9%) | 16 (42.1%) |
| 55 to 64 Years | 57 (72.2%) | 22 (27.9%) |
| 65 to 74 Years | 23 (100.0%) | 0 (0.0%) |
| 75 Years and older | 10 (100.0%) | 0 (0.0%) |
| Total | 305 (64.9%) | 165 (35.1%) |
Health Insurance Coverage by Citizenship Status in Dupree

| Citizenship Status | With Coverage | Without Coverage |
| Native Born | 30 (88.2%) | 4 (11.8%) |
| Foreign Born, Citizen | 83 (68.6%) | 38 (31.4%) |
| Foreign Born, not a Citizen | 21 (38.2%) | 34 (61.8%) |
Health Insurance Coverage by Household Income in Dupree
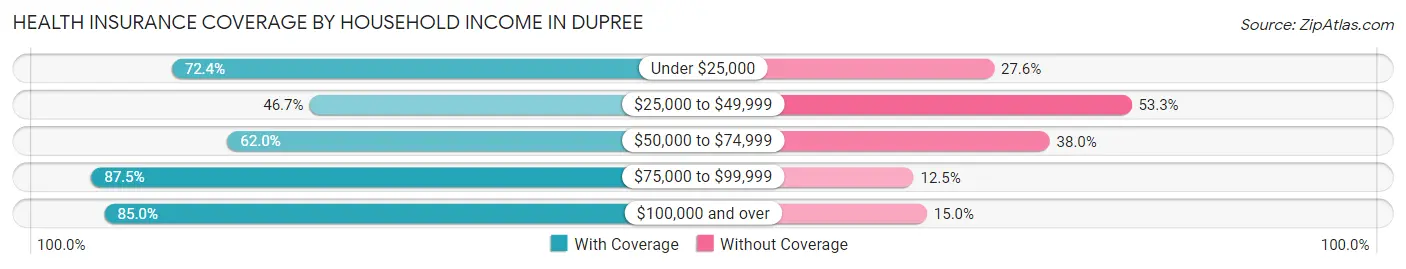
| Household Income | With Coverage | Without Coverage |
| Under $25,000 | 84 (72.4%) | 32 (27.6%) |
| $25,000 to $49,999 | 70 (46.7%) | 80 (53.3%) |
| $50,000 to $74,999 | 62 (62.0%) | 38 (38.0%) |
| $75,000 to $99,999 | 21 (87.5%) | 3 (12.5%) |
| $100,000 and over | 68 (85.0%) | 12 (15.0%) |
Public vs Private Health Insurance Coverage by Age in Dupree
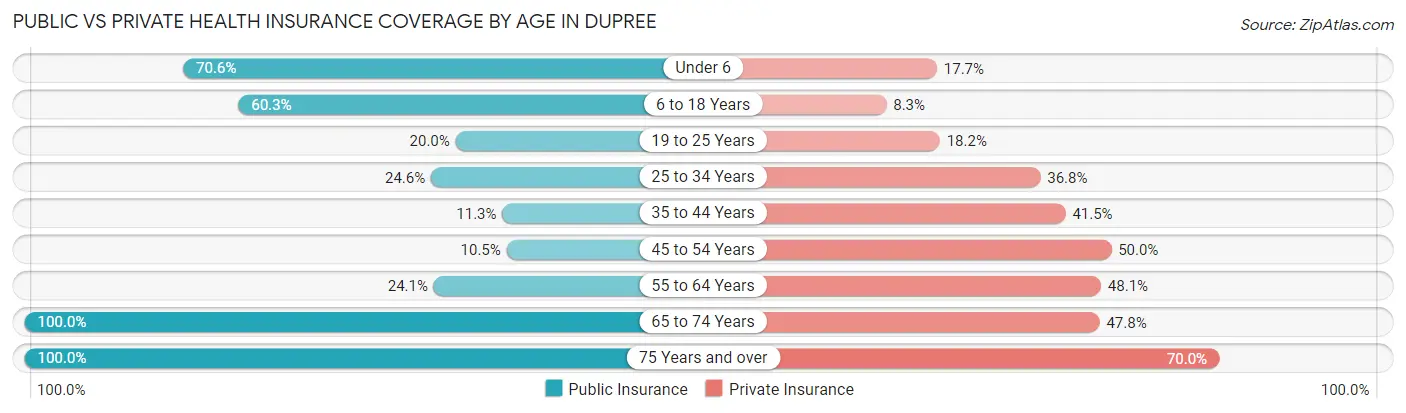
| Age Bracket | Public Insurance | Private Insurance |
| Under 6 | 24 (70.6%) | 6 (17.6%) |
| 6 to 18 Years | 73 (60.3%) | 10 (8.3%) |
| 19 to 25 Years | 11 (20.0%) | 10 (18.2%) |
| 25 to 34 Years | 14 (24.6%) | 21 (36.8%) |
| 35 to 44 Years | 6 (11.3%) | 22 (41.5%) |
| 45 to 54 Years | 4 (10.5%) | 19 (50.0%) |
| 55 to 64 Years | 19 (24.0%) | 38 (48.1%) |
| 65 to 74 Years | 23 (100.0%) | 11 (47.8%) |
| 75 Years and over | 10 (100.0%) | 7 (70.0%) |
| Total | 184 (39.2%) | 144 (30.6%) |
Disability Status by Sex by Age in Dupree
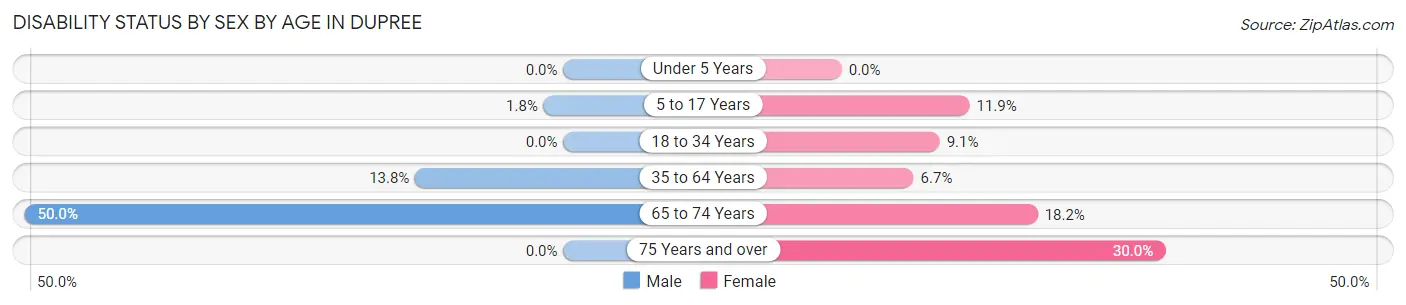
| Age Bracket | Male | Female |
| Under 5 Years | 0 (0.0%) | 0 (0.0%) |
| 5 to 17 Years | 1 (1.8%) | 7 (11.9%) |
| 18 to 34 Years | 0 (0.0%) | 6 (9.1%) |
| 35 to 64 Years | 11 (13.8%) | 6 (6.7%) |
| 65 to 74 Years | 6 (50.0%) | 2 (18.2%) |
| 75 Years and over | 0 (0.0%) | 3 (30.0%) |
Disability Class by Sex by Age in Dupree
Disability Class: Hearing Difficulty
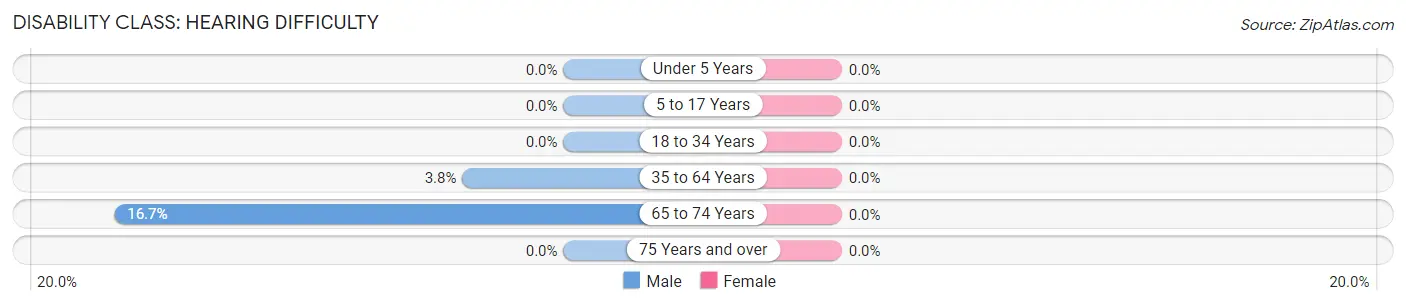
| Age Bracket | Male | Female |
| Under 5 Years | 0 (0.0%) | 0 (0.0%) |
| 5 to 17 Years | 0 (0.0%) | 0 (0.0%) |
| 18 to 34 Years | 0 (0.0%) | 0 (0.0%) |
| 35 to 64 Years | 3 (3.7%) | 0 (0.0%) |
| 65 to 74 Years | 2 (16.7%) | 0 (0.0%) |
| 75 Years and over | 0 (0.0%) | 0 (0.0%) |
Disability Class: Vision Difficulty
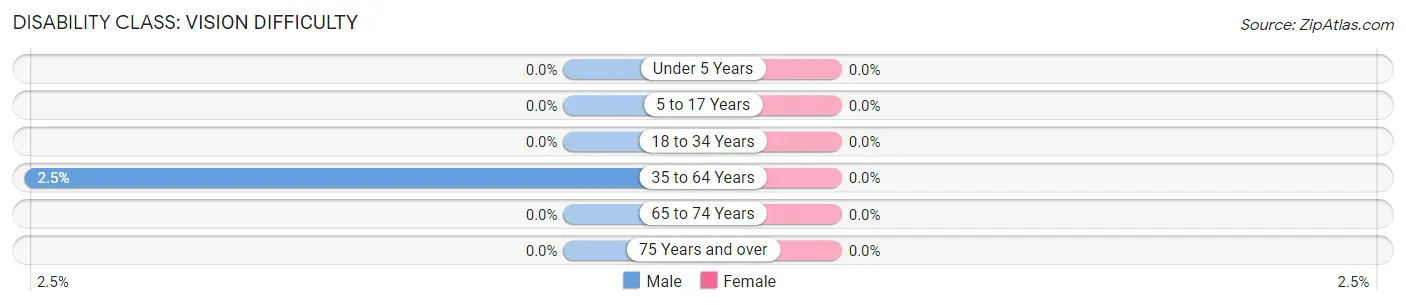
| Age Bracket | Male | Female |
| Under 5 Years | 0 (0.0%) | 0 (0.0%) |
| 5 to 17 Years | 0 (0.0%) | 0 (0.0%) |
| 18 to 34 Years | 0 (0.0%) | 0 (0.0%) |
| 35 to 64 Years | 2 (2.5%) | 0 (0.0%) |
| 65 to 74 Years | 0 (0.0%) | 0 (0.0%) |
| 75 Years and over | 0 (0.0%) | 0 (0.0%) |
Disability Class: Cognitive Difficulty
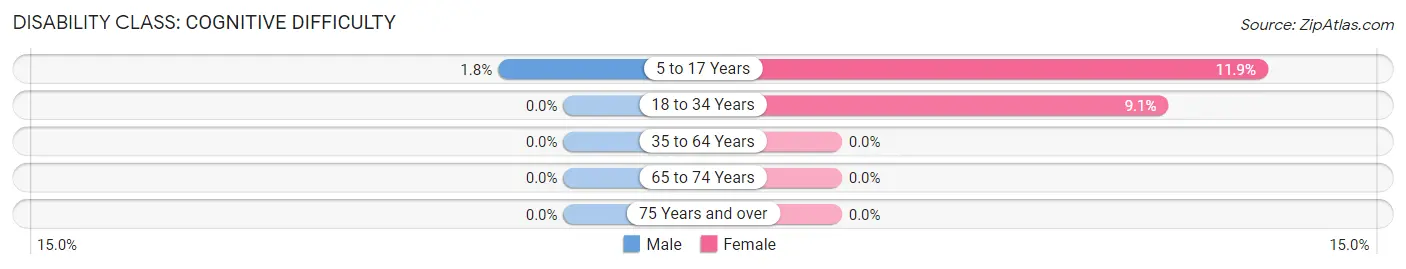
| Age Bracket | Male | Female |
| 5 to 17 Years | 1 (1.8%) | 7 (11.9%) |
| 18 to 34 Years | 0 (0.0%) | 6 (9.1%) |
| 35 to 64 Years | 0 (0.0%) | 0 (0.0%) |
| 65 to 74 Years | 0 (0.0%) | 0 (0.0%) |
| 75 Years and over | 0 (0.0%) | 0 (0.0%) |
Disability Class: Ambulatory Difficulty
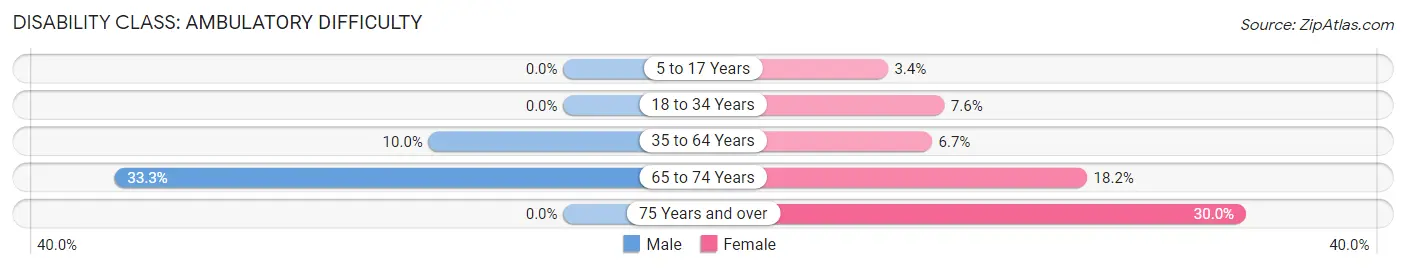
| Age Bracket | Male | Female |
| 5 to 17 Years | 0 (0.0%) | 2 (3.4%) |
| 18 to 34 Years | 0 (0.0%) | 5 (7.6%) |
| 35 to 64 Years | 8 (10.0%) | 6 (6.7%) |
| 65 to 74 Years | 4 (33.3%) | 2 (18.2%) |
| 75 Years and over | 0 (0.0%) | 3 (30.0%) |
Disability Class: Self-Care Difficulty
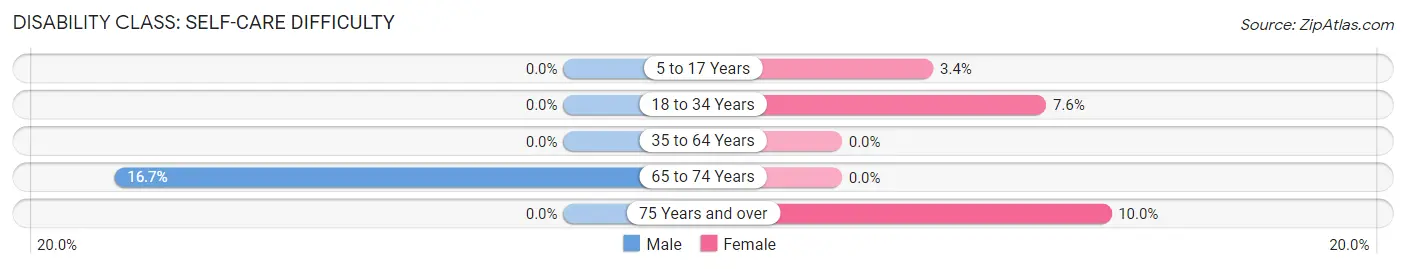
| Age Bracket | Male | Female |
| 5 to 17 Years | 0 (0.0%) | 2 (3.4%) |
| 18 to 34 Years | 0 (0.0%) | 5 (7.6%) |
| 35 to 64 Years | 0 (0.0%) | 0 (0.0%) |
| 65 to 74 Years | 2 (16.7%) | 0 (0.0%) |
| 75 Years and over | 0 (0.0%) | 1 (10.0%) |
Technology Access in Dupree
Computing Device Access in Dupree
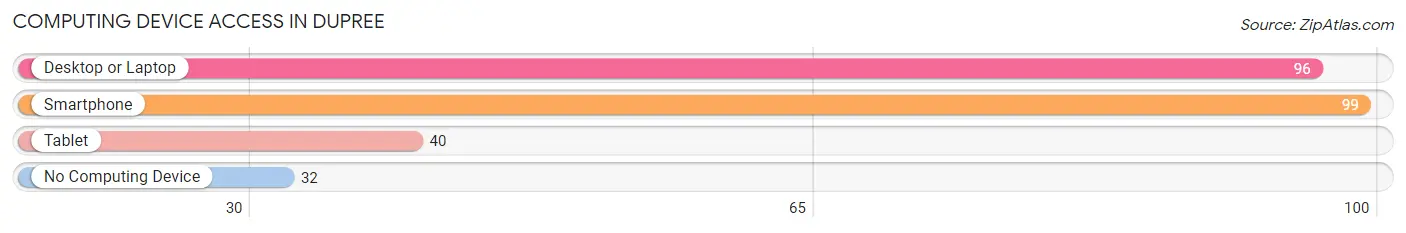
| Device Type | # Households | % Households |
| Desktop or Laptop | 96 | 65.7% |
| Smartphone | 99 | 67.8% |
| Tablet | 40 | 27.4% |
| No Computing Device | 32 | 21.9% |
| Total | 146 | 100.0% |
Internet Access in Dupree
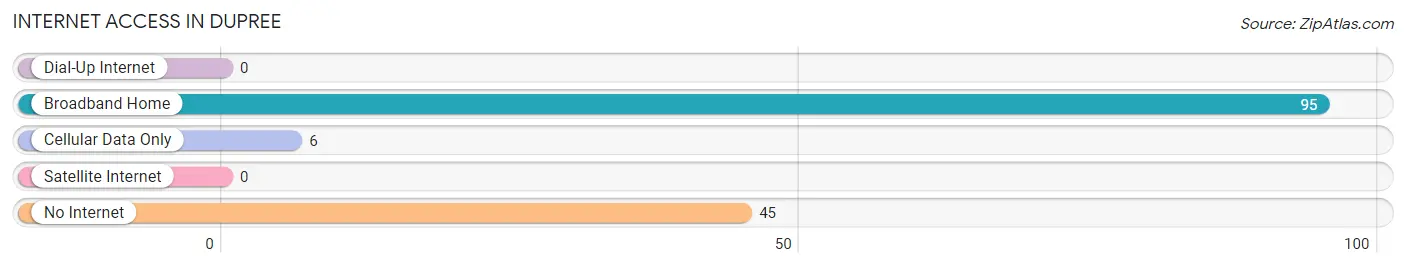
| Internet Type | # Households | % Households |
| Dial-Up Internet | 0 | 0.0% |
| Broadband Home | 95 | 65.1% |
| Cellular Data Only | 6 | 4.1% |
| Satellite Internet | 0 | 0.0% |
| No Internet | 45 | 30.8% |
| Total | 146 | 100.0% |
Dupree Summary
Dupree, South Dakota is a small town located in Ziebach County in the northwestern part of the state. The town was founded in 1909 and is named after the first postmaster, William Dupree. The population of Dupree was 545 at the 2010 census.
Geography
Dupree is located at 45°25'25" North, 101°25'25" West (45.423, -101.423). The town is situated in the northwestern part of South Dakota, in Ziebach County. It is located on the Cheyenne River Indian Reservation, and is the county seat of Ziebach County. The town is located on the edge of the Great Plains, and is surrounded by rolling hills and prairies. The town is located approximately 30 miles from the Montana border.
Economy
Dupree’s economy is largely based on agriculture and tourism. The town is home to a number of small businesses, including a grocery store, a hardware store, a gas station, and a few restaurants. The town also has a small airport, which is used for recreational and business purposes. The town is also home to a number of ranches and farms, which produce a variety of crops, including wheat, corn, and hay.
Demographics
As of the 2010 census, the population of Dupree was 545. The racial makeup of the town was 95.3% White, 0.2% African American, 0.7% Native American, 0.2% Asian, 0.2% Pacific Islander, 0.7% from other races, and 2.7% from two or more races. Hispanic or Latino of any race were 1.3% of the population.
The median income for a household in Dupree was $30,000, and the median income for a family was $35,000. The per capita income for the town was $14,000. About 16.7% of families and 19.2% of the population were below the poverty line, including 25.0% of those under age 18 and 10.7% of those age 65 or over.
History
Dupree was founded in 1909 and was named after the first postmaster, William Dupree. The town was originally a trading post for the Cheyenne River Indian Reservation. The town was incorporated in 1910 and has remained a small, rural community ever since. The town was the site of a major battle between the U.S. Army and the Sioux in 1876, known as the Battle of the Little Bighorn.
Dupree has a rich history of Native American culture and is home to the Cheyenne River Sioux Tribe. The tribe has a long history of living in the area and has a strong presence in the town. The tribe is active in the community and is involved in many local events and activities.
Conclusion
Dupree, South Dakota is a small town located in Ziebach County in the northwestern part of the state. The town was founded in 1909 and is named after the first postmaster, William Dupree. The population of Dupree was 545 at the 2010 census. The town’s economy is largely based on agriculture and tourism, and the town is home to a number of small businesses. The town also has a rich history of Native American culture and is home to the Cheyenne River Sioux Tribe. Dupree is a small, rural community with a unique history and culture.
Common Questions
What is Per Capita Income in Dupree?
Per Capita income in Dupree is $20,203.
What is the Median Family Income in Dupree?
Median Family Income in Dupree is $46,786.
What is the Median Household income in Dupree?
Median Household Income in Dupree is $46,111.
What is Income or Wage Gap in Dupree?
Income or Wage Gap in Dupree is 16.2%.
Women in Dupree earn 83.8 cents for every dollar earned by a man.
What is Inequality or Gini Index in Dupree?
Inequality or Gini Index in Dupree is 0.39.
What is the Total Population of Dupree?
Total Population of Dupree is 470.
What is the Total Male Population of Dupree?
Total Male Population of Dupree is 220.
What is the Total Female Population of Dupree?
Total Female Population of Dupree is 250.
What is the Ratio of Males per 100 Females in Dupree?
There are 88.00 Males per 100 Females in Dupree.
What is the Ratio of Females per 100 Males in Dupree?
There are 113.64 Females per 100 Males in Dupree.
What is the Median Population Age in Dupree?
Median Population Age in Dupree is 29.5 Years.
What is the Average Family Size in Dupree
Average Family Size in Dupree is 4.0 People.
What is the Average Household Size in Dupree
Average Household Size in Dupree is 3.2 People.
How Large is the Labor Force in Dupree?
There are 238 People in the Labor Forcein in Dupree.
What is the Percentage of People in the Labor Force in Dupree?
66.5% of People are in the Labor Force in Dupree.
What is the Unemployment Rate in Dupree?
Unemployment Rate in Dupree is 19.7%.