Mobridge, SD Map & Demographics
Mobridge Map
Mobridge Overview
$34,232
PER CAPITA INCOME
$75,000
AVG FAMILY INCOME
$54,868
AVG HOUSEHOLD INCOME
21.4%
WAGE / INCOME GAP [ % ]
78.6¢/ $1
WAGE / INCOME GAP [ $ ]
$9,945
FAMILY INCOME DEFICIT
0.37
INEQUALITY / GINI INDEX
3,130
TOTAL POPULATION
1,533
MALE POPULATION
1,597
FEMALE POPULATION
95.99
MALES / 100 FEMALES
104.17
FEMALES / 100 MALES
42.4
MEDIAN AGE
2.5
AVG FAMILY SIZE
2.0
AVG HOUSEHOLD SIZE
1,686
LABOR FORCE [ PEOPLE ]
67.0%
PERCENT IN LABOR FORCE
1.4%
UNEMPLOYMENT RATE
Mobridge Zip Codes
Mobridge Area Codes
Income in Mobridge
Income Overview in Mobridge
Per Capita Income in Mobridge is $34,232, while median incomes of families and households are $75,000 and $54,868 respectively.
| Characteristic | Number | Measure |
| Per Capita Income | 3,130 | $34,232 |
| Median Family Income | 912 | $75,000 |
| Mean Family Income | 912 | $80,222 |
| Median Household Income | 1,502 | $54,868 |
| Mean Household Income | 1,502 | $70,348 |
| Income Deficit | 912 | $9,945 |
| Wage / Income Gap (%) | 3,130 | 21.39% |
| Wage / Income Gap ($) | 3,130 | 78.61¢ per $1 |
| Gini / Inequality Index | 3,130 | 0.37 |
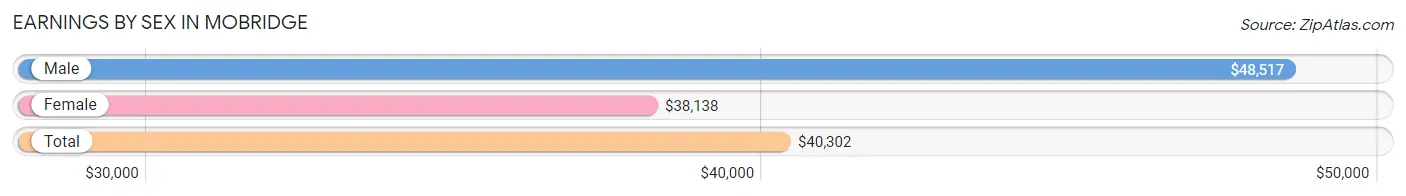
Earnings by Sex in Mobridge
Average Earnings in Mobridge are $40,302, $48,517 for men and $38,138 for women, a difference of 21.4%.
| Sex | Number | Average Earnings |
| Male | 1,040 (57.2%) | $48,517 |
| Female | 777 (42.8%) | $38,138 |
| Total | 1,817 (100.0%) | $40,302 |
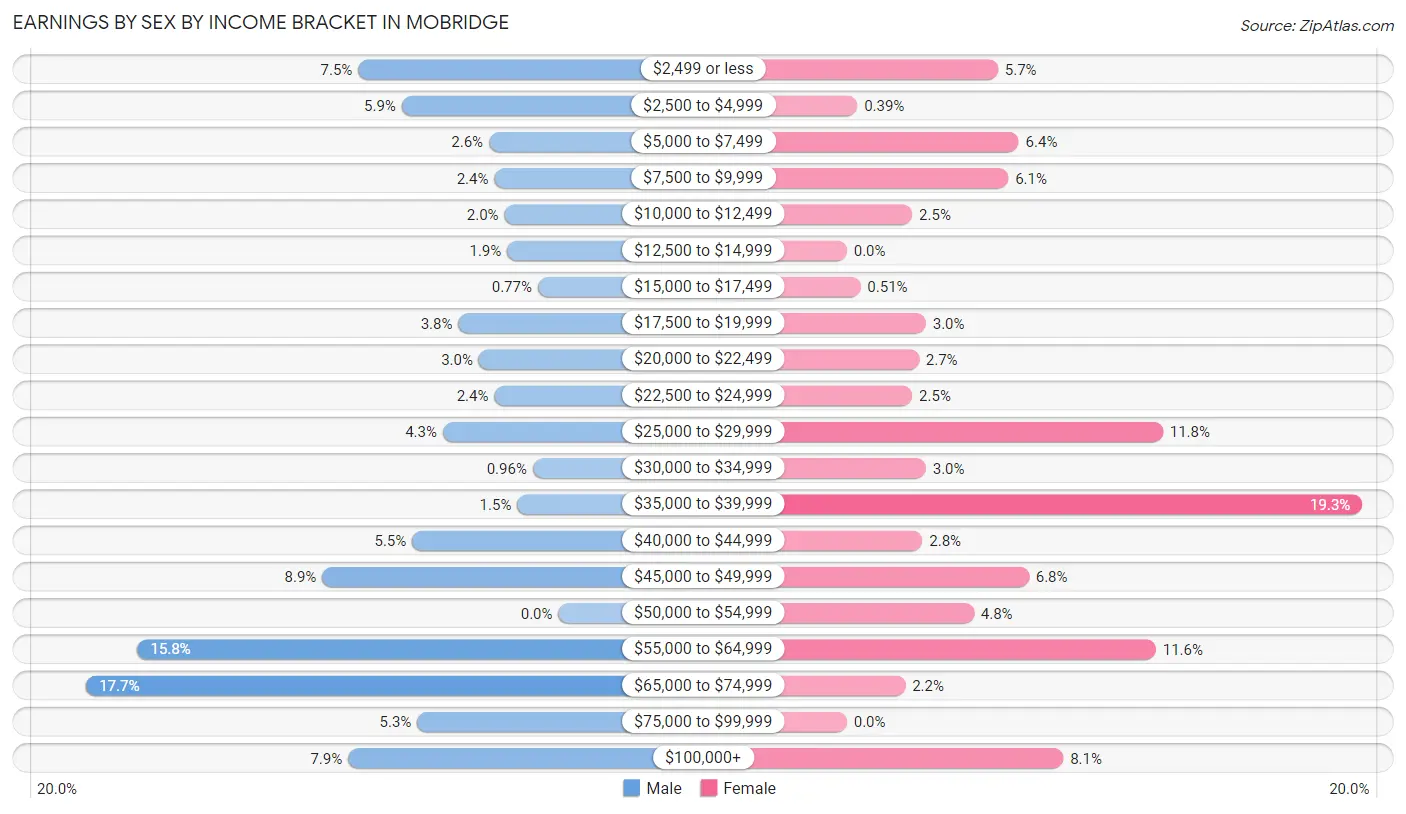
Earnings by Sex by Income Bracket in Mobridge
The most common earnings brackets in Mobridge are $65,000 to $74,999 for men (184 | 17.7%) and $35,000 to $39,999 for women (150 | 19.3%).
| Income | Male | Female |
| $2,499 or less | 78 (7.5%) | 44 (5.7%) |
| $2,500 to $4,999 | 61 (5.9%) | 3 (0.4%) |
| $5,000 to $7,499 | 27 (2.6%) | 50 (6.4%) |
| $7,500 to $9,999 | 25 (2.4%) | 47 (6.0%) |
| $10,000 to $12,499 | 21 (2.0%) | 19 (2.5%) |
| $12,500 to $14,999 | 20 (1.9%) | 0 (0.0%) |
| $15,000 to $17,499 | 8 (0.8%) | 4 (0.5%) |
| $17,500 to $19,999 | 39 (3.7%) | 23 (3.0%) |
| $20,000 to $22,499 | 31 (3.0%) | 21 (2.7%) |
| $22,500 to $24,999 | 25 (2.4%) | 19 (2.5%) |
| $25,000 to $29,999 | 45 (4.3%) | 92 (11.8%) |
| $30,000 to $34,999 | 10 (1.0%) | 23 (3.0%) |
| $35,000 to $39,999 | 16 (1.5%) | 150 (19.3%) |
| $40,000 to $44,999 | 57 (5.5%) | 22 (2.8%) |
| $45,000 to $49,999 | 92 (8.8%) | 53 (6.8%) |
| $50,000 to $54,999 | 0 (0.0%) | 37 (4.8%) |
| $55,000 to $64,999 | 164 (15.8%) | 90 (11.6%) |
| $65,000 to $74,999 | 184 (17.7%) | 17 (2.2%) |
| $75,000 to $99,999 | 55 (5.3%) | 0 (0.0%) |
| $100,000+ | 82 (7.9%) | 63 (8.1%) |
| Total | 1,040 (100.0%) | 777 (100.0%) |
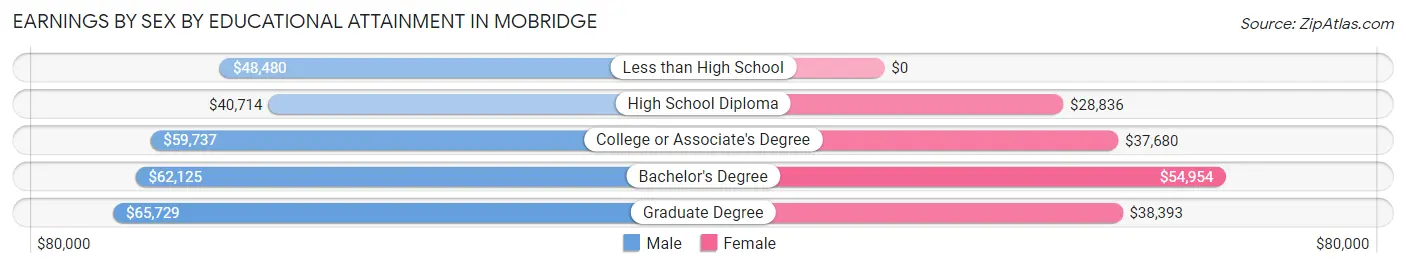
Earnings by Sex by Educational Attainment in Mobridge
Average earnings in Mobridge are $58,284 for men and $38,217 for women, a difference of 34.4%. Men with an educational attainment of graduate degree enjoy the highest average annual earnings of $65,729, while those with high school diploma education earn the least with $40,714. Women with an educational attainment of bachelor's degree earn the most with the average annual earnings of $54,954, while those with high school diploma education have the smallest earnings of $28,836.
| Educational Attainment | Male Income | Female Income |
| Less than High School | $48,480 | $0 |
| High School Diploma | $40,714 | $28,836 |
| College or Associate's Degree | $59,737 | $37,680 |
| Bachelor's Degree | $62,125 | $54,954 |
| Graduate Degree | $65,729 | $38,393 |
| Total | $58,284 | $38,217 |
Family Income in Mobridge
Family Income Brackets in Mobridge
According to the Mobridge family income data, there are 189 families falling into the $100,000 to $149,999 income range, which is the most common income bracket and makes up 20.7% of all families. Conversely, the $10,000 to $14,999 income bracket is the least frequent group with only 9 families (1.0%) belonging to this category.
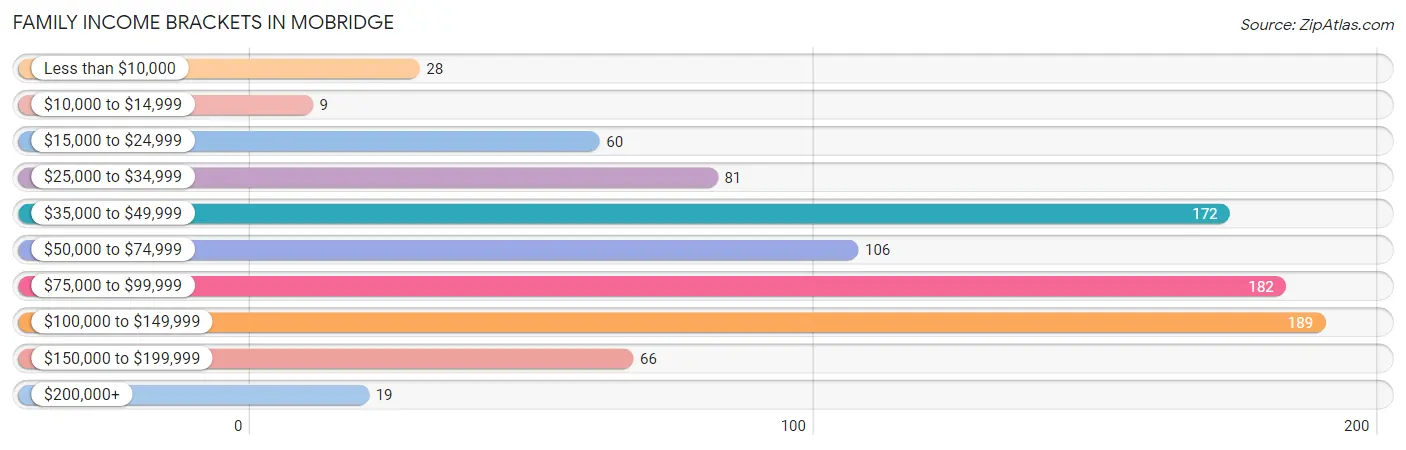
| Income Bracket | # Families | % Families |
| Less than $10,000 | 28 | 3.1% |
| $10,000 to $14,999 | 9 | 1.0% |
| $15,000 to $24,999 | 60 | 6.6% |
| $25,000 to $34,999 | 81 | 8.9% |
| $35,000 to $49,999 | 172 | 18.9% |
| $50,000 to $74,999 | 106 | 11.6% |
| $75,000 to $99,999 | 182 | 20.0% |
| $100,000 to $149,999 | 189 | 20.7% |
| $150,000 to $199,999 | 66 | 7.2% |
| $200,000+ | 19 | 2.1% |
Family Income by Famaliy Size in Mobridge
4-person families (91 | 10.0%) account for the highest median family income in Mobridge with $122,679 per family, while 2-person families (616 | 67.5%) have the highest median income of $37,674 per family member.
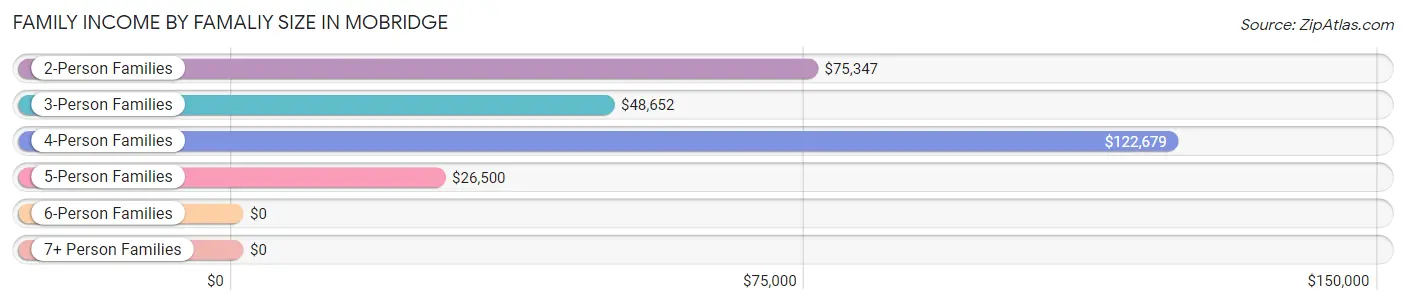
| Income Bracket | # Families | Median Income |
| 2-Person Families | 616 (67.5%) | $75,347 |
| 3-Person Families | 107 (11.7%) | $48,652 |
| 4-Person Families | 91 (10.0%) | $122,679 |
| 5-Person Families | 46 (5.0%) | $26,500 |
| 6-Person Families | 32 (3.5%) | $0 |
| 7+ Person Families | 20 (2.2%) | $0 |
| Total | 912 (100.0%) | $75,000 |
Family Income by Number of Earners in Mobridge
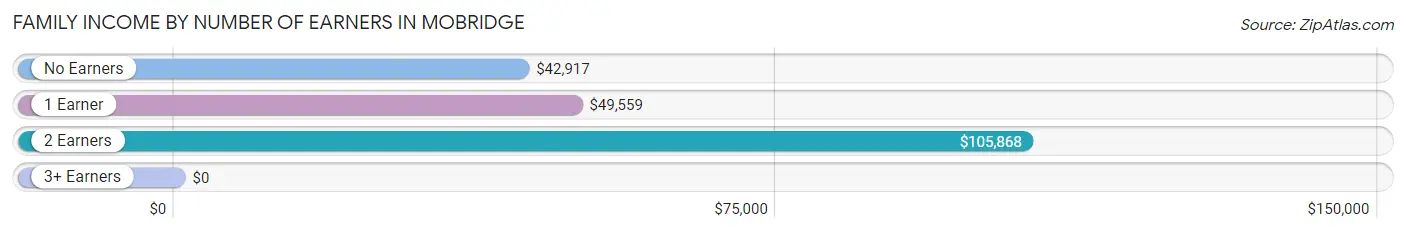
| Number of Earners | # Families | Median Income |
| No Earners | 155 (17.0%) | $42,917 |
| 1 Earner | 332 (36.4%) | $49,559 |
| 2 Earners | 415 (45.5%) | $105,868 |
| 3+ Earners | 10 (1.1%) | $0 |
| Total | 912 (100.0%) | $75,000 |
Household Income in Mobridge
Household Income Brackets in Mobridge
With 357 households falling in the category, the $35,000 to $49,999 income range is the most frequent in Mobridge, accounting for 23.8% of all households. In contrast, only 20 households (1.3%) fall into the $200,000+ income bracket, making it the least populous group.
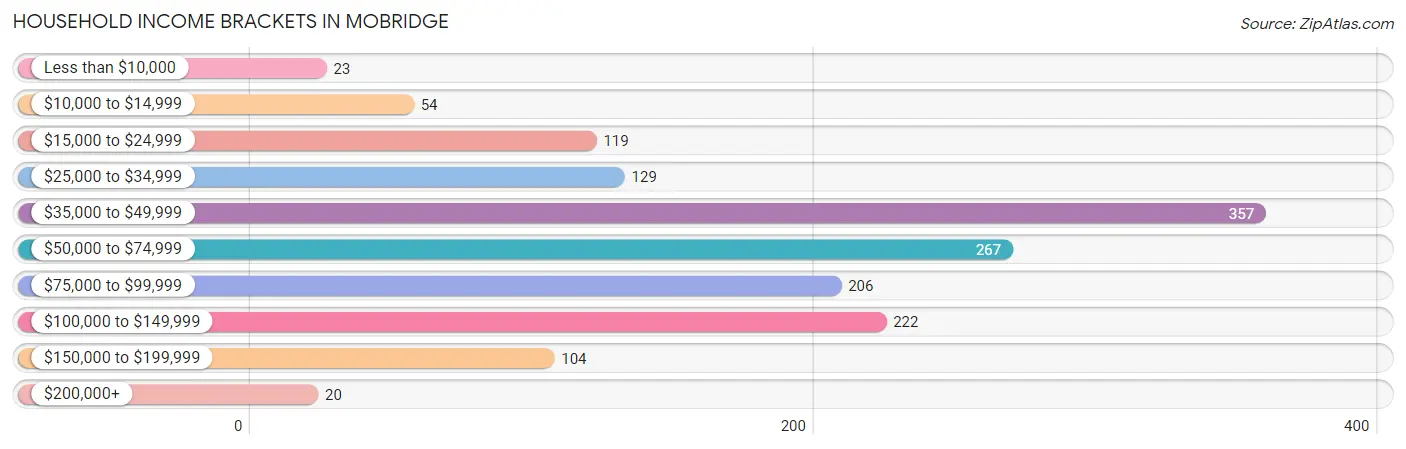
| Income Bracket | # Households | % Households |
| Less than $10,000 | 23 | 1.5% |
| $10,000 to $14,999 | 54 | 3.6% |
| $15,000 to $24,999 | 119 | 7.9% |
| $25,000 to $34,999 | 129 | 8.6% |
| $35,000 to $49,999 | 357 | 23.8% |
| $50,000 to $74,999 | 267 | 17.8% |
| $75,000 to $99,999 | 206 | 13.7% |
| $100,000 to $149,999 | 222 | 14.8% |
| $150,000 to $199,999 | 104 | 6.9% |
| $200,000+ | 20 | 1.3% |
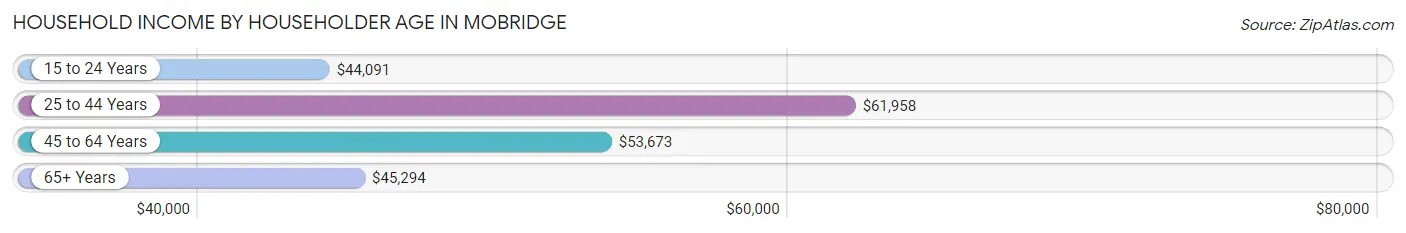
Household Income by Householder Age in Mobridge
The median household income in Mobridge is $54,868, with the highest median household income of $61,958 found in the 25 to 44 years age bracket for the primary householder. A total of 494 households (32.9%) fall into this category. Meanwhile, the 15 to 24 years age bracket for the primary householder has the lowest median household income of $44,091, with 60 households (4.0%) in this group.
| Income Bracket | # Households | Median Income |
| 15 to 24 Years | 60 (4.0%) | $44,091 |
| 25 to 44 Years | 494 (32.9%) | $61,958 |
| 45 to 64 Years | 492 (32.8%) | $53,673 |
| 65+ Years | 456 (30.4%) | $45,294 |
| Total | 1,502 (100.0%) | $54,868 |
Poverty in Mobridge
Income Below Poverty by Sex and Age in Mobridge
With 15.3% poverty level for males and 17.7% for females among the residents of Mobridge, 5 year old males and 18 to 24 year old females are the most vulnerable to poverty, with 13 males (100.0%) and 34 females (61.8%) in their respective age groups living below the poverty level.
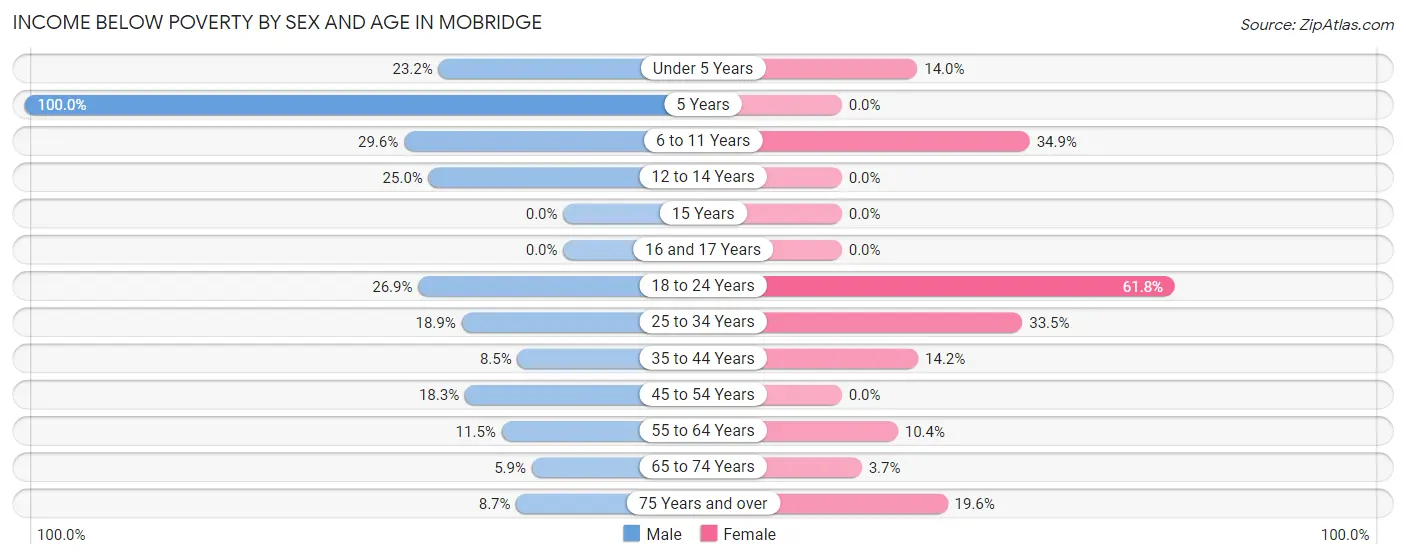
| Age Bracket | Male | Female |
| Under 5 Years | 19 (23.2%) | 15 (14.0%) |
| 5 Years | 13 (100.0%) | 0 (0.0%) |
| 6 to 11 Years | 34 (29.6%) | 60 (34.9%) |
| 12 to 14 Years | 13 (25.0%) | 0 (0.0%) |
| 15 Years | 0 (0.0%) | 0 (0.0%) |
| 16 and 17 Years | 0 (0.0%) | 0 (0.0%) |
| 18 to 24 Years | 28 (26.9%) | 34 (61.8%) |
| 25 to 34 Years | 31 (18.9%) | 67 (33.5%) |
| 35 to 44 Years | 21 (8.5%) | 36 (14.2%) |
| 45 to 54 Years | 21 (18.3%) | 0 (0.0%) |
| 55 to 64 Years | 30 (11.5%) | 26 (10.4%) |
| 65 to 74 Years | 11 (5.9%) | 7 (3.7%) |
| 75 Years and over | 13 (8.7%) | 33 (19.6%) |
| Total | 234 (15.3%) | 278 (17.7%) |
Income Above Poverty by Sex and Age in Mobridge
According to the poverty statistics in Mobridge, males aged 16 and 17 years and females aged 5 years are the age groups that are most secure financially, with 100.0% of males and 100.0% of females in these age groups living above the poverty line.
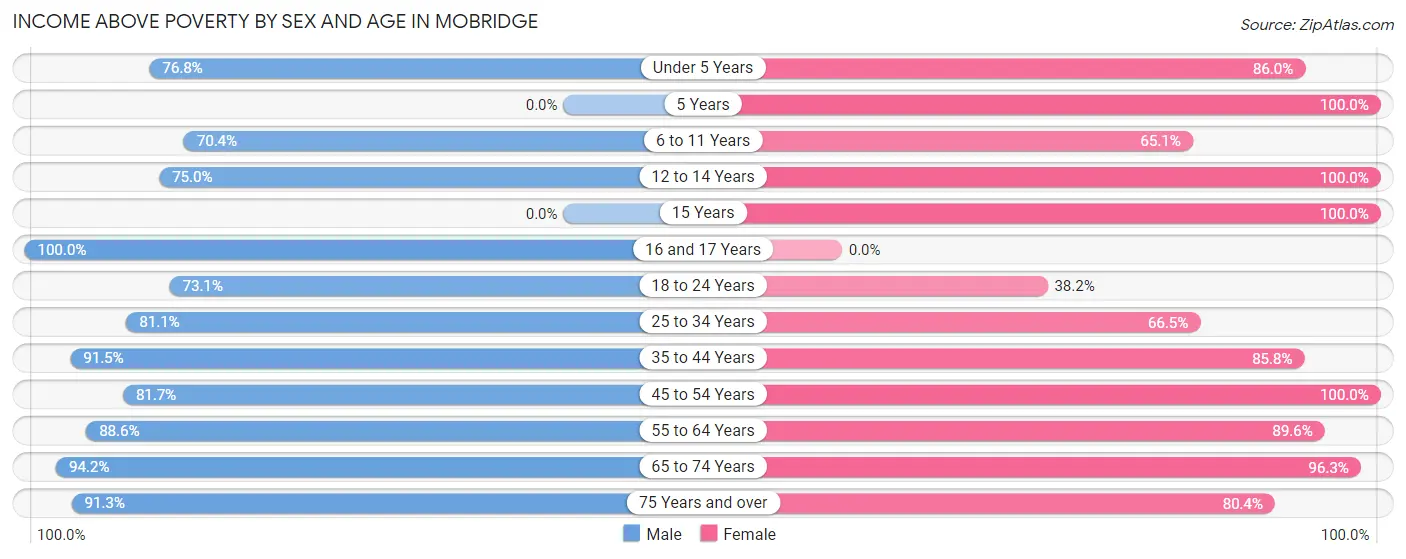
| Age Bracket | Male | Female |
| Under 5 Years | 63 (76.8%) | 92 (86.0%) |
| 5 Years | 0 (0.0%) | 49 (100.0%) |
| 6 to 11 Years | 81 (70.4%) | 112 (65.1%) |
| 12 to 14 Years | 39 (75.0%) | 14 (100.0%) |
| 15 Years | 0 (0.0%) | 7 (100.0%) |
| 16 and 17 Years | 40 (100.0%) | 0 (0.0%) |
| 18 to 24 Years | 76 (73.1%) | 21 (38.2%) |
| 25 to 34 Years | 133 (81.1%) | 133 (66.5%) |
| 35 to 44 Years | 226 (91.5%) | 218 (85.8%) |
| 45 to 54 Years | 94 (81.7%) | 108 (100.0%) |
| 55 to 64 Years | 232 (88.5%) | 224 (89.6%) |
| 65 to 74 Years | 177 (94.2%) | 182 (96.3%) |
| 75 Years and over | 136 (91.3%) | 135 (80.4%) |
| Total | 1,297 (84.7%) | 1,295 (82.3%) |
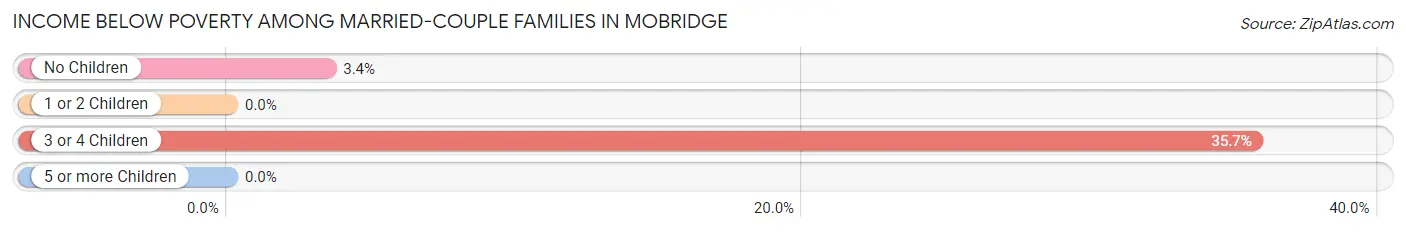
Income Below Poverty Among Married-Couple Families in Mobridge
The poverty statistics for married-couple families in Mobridge show that 6.7% or 40 of the total 599 families live below the poverty line. Families with 3 or 4 children have the highest poverty rate of 35.7%, comprising of 25 families. On the other hand, families with 1 or 2 children have the lowest poverty rate of 0.0%, which includes 0 families.
| Children | Above Poverty | Below Poverty |
| No Children | 424 (96.6%) | 15 (3.4%) |
| 1 or 2 Children | 70 (100.0%) | 0 (0.0%) |
| 3 or 4 Children | 45 (64.3%) | 25 (35.7%) |
| 5 or more Children | 20 (100.0%) | 0 (0.0%) |
| Total | 559 (93.3%) | 40 (6.7%) |
Income Below Poverty Among Single-Parent Households in Mobridge
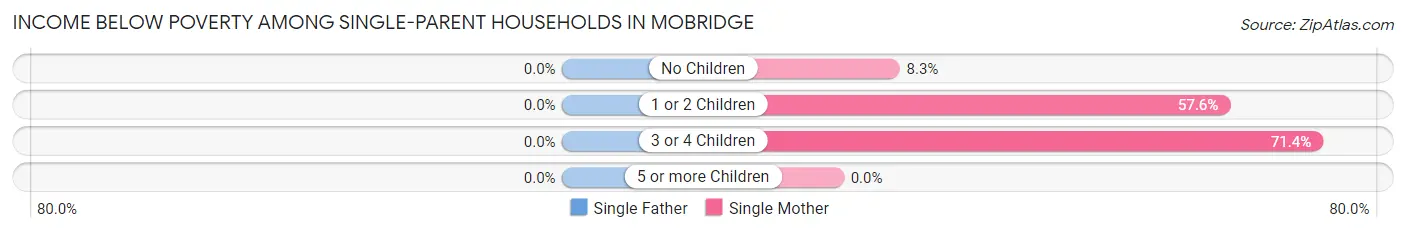
| Children | Single Father | Single Mother |
| No Children | 0 (0.0%) | 9 (8.3%) |
| 1 or 2 Children | 0 (0.0%) | 38 (57.6%) |
| 3 or 4 Children | 0 (0.0%) | 15 (71.4%) |
| 5 or more Children | 0 (0.0%) | 0 (0.0%) |
| Total | 0 (0.0%) | 62 (31.8%) |
Income Below Poverty Among Married-Couple vs Single-Parent Households in Mobridge
The poverty data for Mobridge shows that 40 of the married-couple family households (6.7%) and 62 of the single-parent households (19.8%) are living below the poverty level. Within the married-couple family households, those with 3 or 4 children have the highest poverty rate, with 25 households (35.7%) falling below the poverty line. Among the single-parent households, those with 3 or 4 children have the highest poverty rate, with 15 household (71.4%) living below poverty.
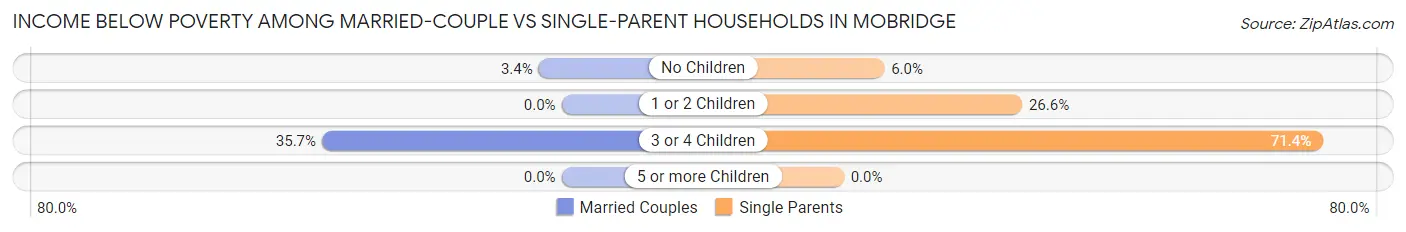
| Children | Married-Couple Families | Single-Parent Households |
| No Children | 15 (3.4%) | 9 (6.0%) |
| 1 or 2 Children | 0 (0.0%) | 38 (26.6%) |
| 3 or 4 Children | 25 (35.7%) | 15 (71.4%) |
| 5 or more Children | 0 (0.0%) | 0 (0.0%) |
| Total | 40 (6.7%) | 62 (19.8%) |
Race in Mobridge
The most populous races in Mobridge are White / Caucasian (2,235 | 71.4%), Native / Alaskan (506 | 16.2%), and Two or more Races (280 | 8.9%).
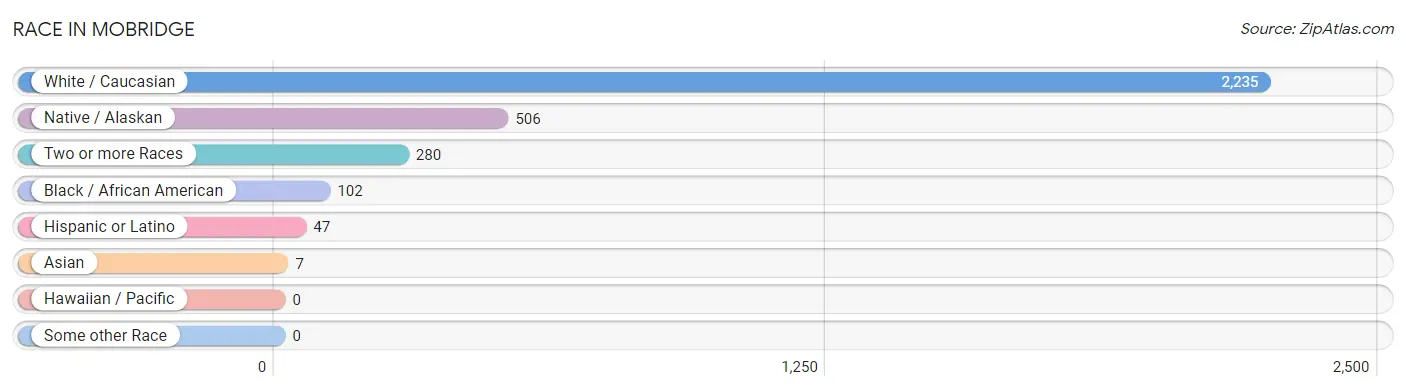
| Race | # Population | % Population |
| Asian | 7 | 0.2% |
| Black / African American | 102 | 3.3% |
| Hawaiian / Pacific | 0 | 0.0% |
| Hispanic or Latino | 47 | 1.5% |
| Native / Alaskan | 506 | 16.2% |
| White / Caucasian | 2,235 | 71.4% |
| Two or more Races | 280 | 8.9% |
| Some other Race | 0 | 0.0% |
| Total | 3,130 | 100.0% |
Ancestry in Mobridge
The most populous ancestries reported in Mobridge are German (1,441 | 46.0%), Sioux (359 | 11.5%), Norwegian (352 | 11.3%), American (168 | 5.4%), and English (160 | 5.1%), together accounting for 79.2% of all Mobridge residents.
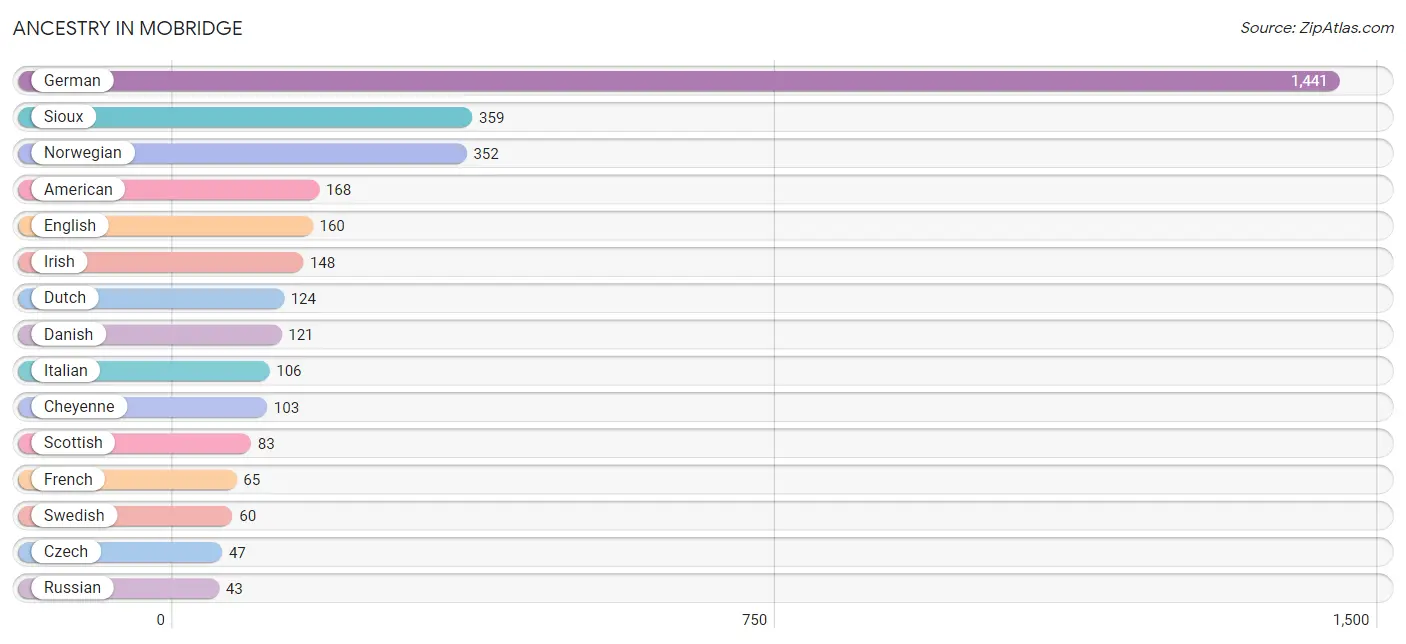
| Ancestry | # Population | % Population |
| American | 168 | 5.4% |
| Central American | 11 | 0.4% |
| Cheyenne | 103 | 3.3% |
| Cree | 8 | 0.3% |
| Czech | 47 | 1.5% |
| Danish | 121 | 3.9% |
| Dutch | 124 | 4.0% |
| English | 160 | 5.1% |
| Finnish | 16 | 0.5% |
| French | 65 | 2.1% |
| French Canadian | 8 | 0.3% |
| German | 1,441 | 46.0% |
| Honduran | 11 | 0.4% |
| Icelander | 28 | 0.9% |
| Indian (Asian) | 7 | 0.2% |
| Irish | 148 | 4.7% |
| Italian | 106 | 3.4% |
| Mexican | 21 | 0.7% |
| Norwegian | 352 | 11.3% |
| Polish | 5 | 0.2% |
| Russian | 43 | 1.4% |
| Scotch-Irish | 27 | 0.9% |
| Scottish | 83 | 2.6% |
| Sioux | 359 | 11.5% |
| Spaniard | 15 | 0.5% |
| Swedish | 60 | 1.9% |
| Swiss | 34 | 1.1% |
| Ukrainian | 10 | 0.3% |
| Welsh | 8 | 0.3% | View All 29 Rows |
Immigrants in Mobridge
The most numerous immigrant groups reported in Mobridge came from Europe (15 | 0.5%), Southern Europe (15 | 0.5%), Spain (15 | 0.5%), Asia (7 | 0.2%), and China (7 | 0.2%), together accounting for 1.9% of all Mobridge residents.
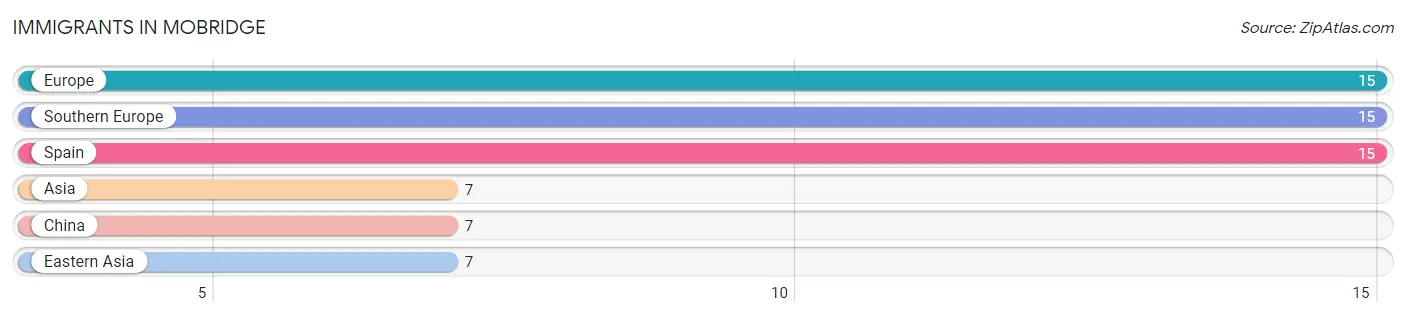
| Immigration Origin | # Population | % Population |
| Asia | 7 | 0.2% |
| China | 7 | 0.2% |
| Eastern Asia | 7 | 0.2% |
| Europe | 15 | 0.5% |
| Southern Europe | 15 | 0.5% |
| Spain | 15 | 0.5% | View All 6 Rows |
Sex and Age in Mobridge
Sex and Age in Mobridge
The most populous age groups in Mobridge are 35 to 39 Years (209 | 13.6%) for men and 60 to 64 Years (199 | 12.5%) for women.
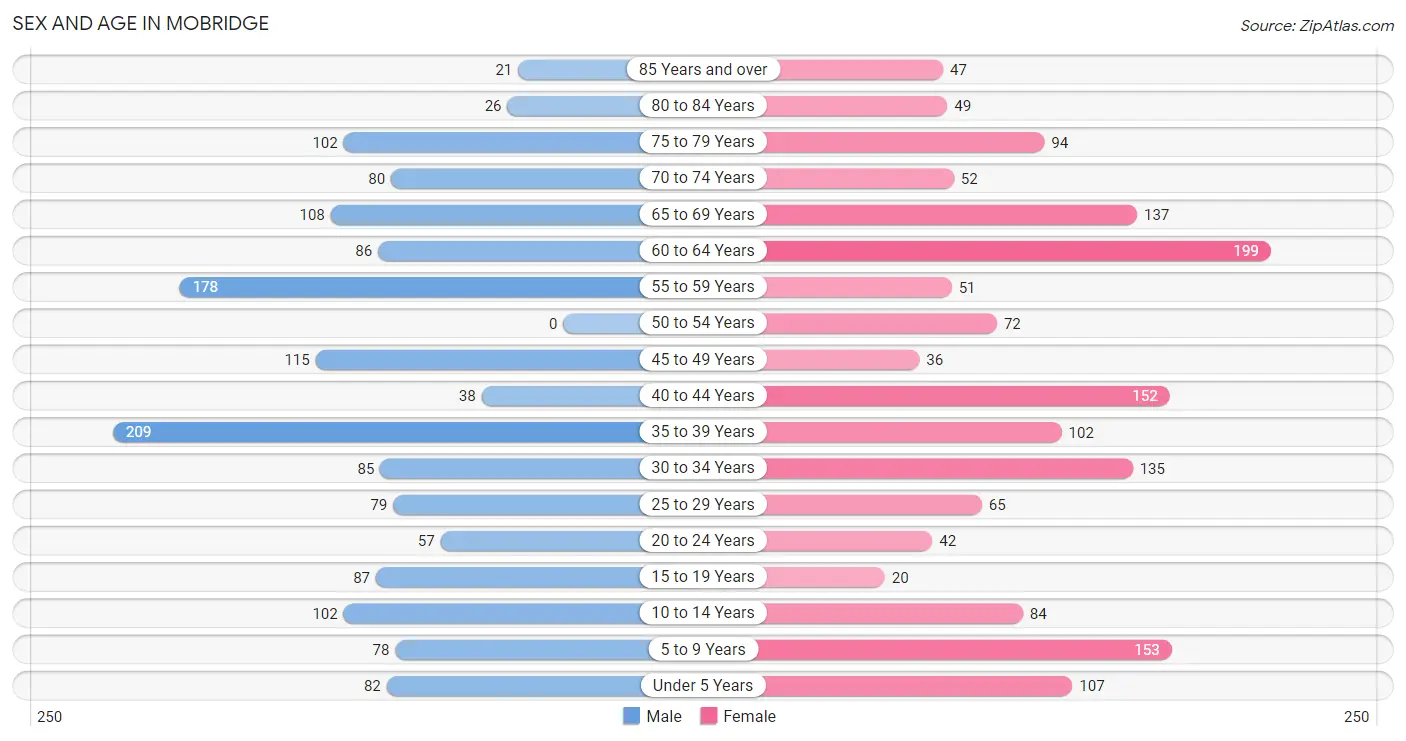
| Age Bracket | Male | Female |
| Under 5 Years | 82 (5.3%) | 107 (6.7%) |
| 5 to 9 Years | 78 (5.1%) | 153 (9.6%) |
| 10 to 14 Years | 102 (6.7%) | 84 (5.3%) |
| 15 to 19 Years | 87 (5.7%) | 20 (1.3%) |
| 20 to 24 Years | 57 (3.7%) | 42 (2.6%) |
| 25 to 29 Years | 79 (5.1%) | 65 (4.1%) |
| 30 to 34 Years | 85 (5.5%) | 135 (8.5%) |
| 35 to 39 Years | 209 (13.6%) | 102 (6.4%) |
| 40 to 44 Years | 38 (2.5%) | 152 (9.5%) |
| 45 to 49 Years | 115 (7.5%) | 36 (2.2%) |
| 50 to 54 Years | 0 (0.0%) | 72 (4.5%) |
| 55 to 59 Years | 178 (11.6%) | 51 (3.2%) |
| 60 to 64 Years | 86 (5.6%) | 199 (12.5%) |
| 65 to 69 Years | 108 (7.0%) | 137 (8.6%) |
| 70 to 74 Years | 80 (5.2%) | 52 (3.3%) |
| 75 to 79 Years | 102 (6.7%) | 94 (5.9%) |
| 80 to 84 Years | 26 (1.7%) | 49 (3.1%) |
| 85 Years and over | 21 (1.4%) | 47 (2.9%) |
| Total | 1,533 (100.0%) | 1,597 (100.0%) |
Families and Households in Mobridge
Median Family Size in Mobridge
The median family size in Mobridge is 2.49 persons per family, with married-couple families (599 | 65.7%) accounting for the largest median family size of 2.7 persons per family. On the other hand, single male/father families (118 | 12.9%) represent the smallest median family size with 1.86 persons per family.
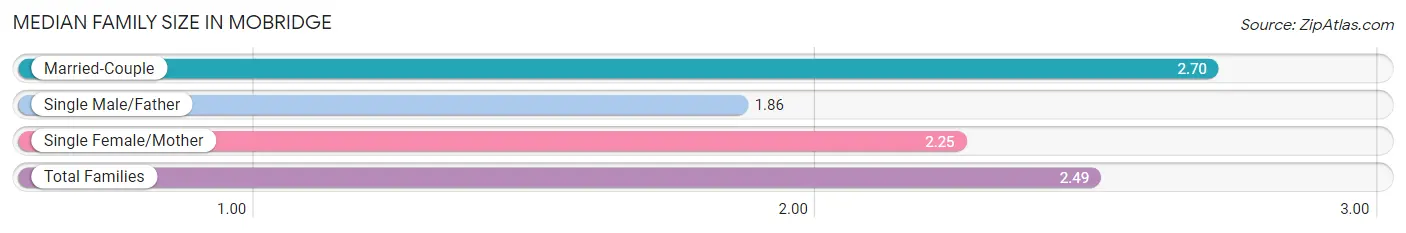
| Family Type | # Families | Family Size |
| Married-Couple | 599 (65.7%) | 2.70 |
| Single Male/Father | 118 (12.9%) | 1.86 |
| Single Female/Mother | 195 (21.4%) | 2.25 |
| Total Families | 912 (100.0%) | 2.49 |
Median Household Size in Mobridge
The median household size in Mobridge is 1.98 persons per household, with married-couple households (599 | 39.9%) accounting for the largest median household size of 2.73 persons per household. non-family households (590 | 39.3%) represent the smallest median household size with 1.04 persons per household.
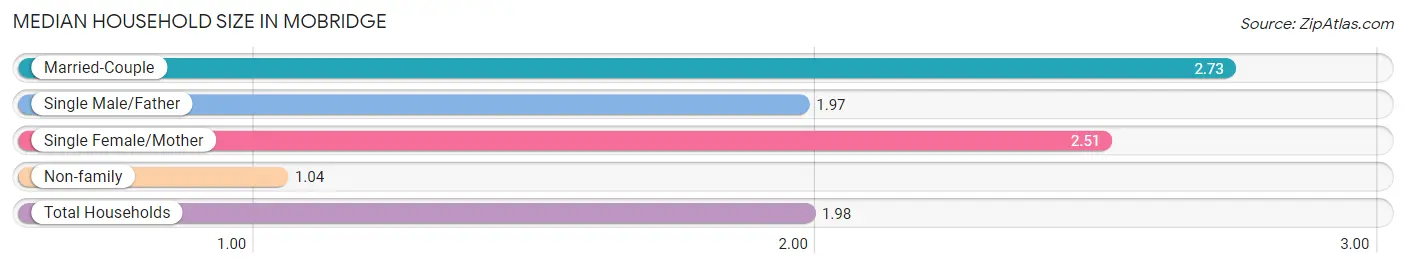
| Household Type | # Households | Household Size |
| Married-Couple | 599 (39.9%) | 2.73 |
| Single Male/Father | 118 (7.9%) | 1.97 |
| Single Female/Mother | 195 (13.0%) | 2.51 |
| Non-family | 590 (39.3%) | 1.04 |
| Total Households | 1,502 (100.0%) | 1.98 |
Household Size by Marriage Status in Mobridge
Out of a total of 1,502 households in Mobridge, 912 (60.7%) are family households, while 590 (39.3%) are nonfamily households. The most numerous type of family households are 2-person households, comprising 578, and the most common type of nonfamily households are 1-person households, comprising 561.
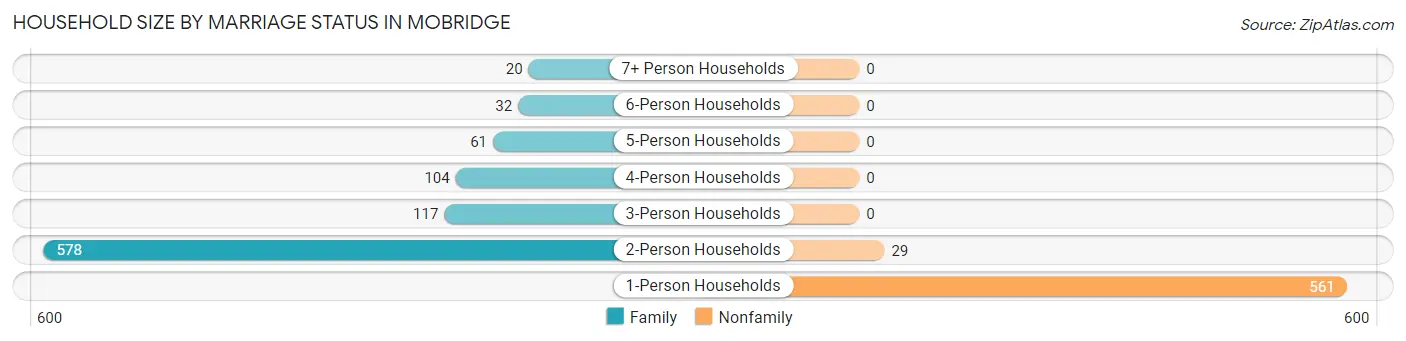
| Household Size | Family Households | Nonfamily Households |
| 1-Person Households | - | 561 (37.3%) |
| 2-Person Households | 578 (38.5%) | 29 (1.9%) |
| 3-Person Households | 117 (7.8%) | 0 (0.0%) |
| 4-Person Households | 104 (6.9%) | 0 (0.0%) |
| 5-Person Households | 61 (4.1%) | 0 (0.0%) |
| 6-Person Households | 32 (2.1%) | 0 (0.0%) |
| 7+ Person Households | 20 (1.3%) | 0 (0.0%) |
| Total | 912 (60.7%) | 590 (39.3%) |
Female Fertility in Mobridge
Fertility by Age in Mobridge
Average fertility rate in Mobridge is 112.0 births per 1,000 women. Women in the age bracket of 20 to 34 years have the highest fertility rate with 260.0 births per 1,000 women. Women in the age bracket of 20 to 34 years acount for 100.0% of all women with births.
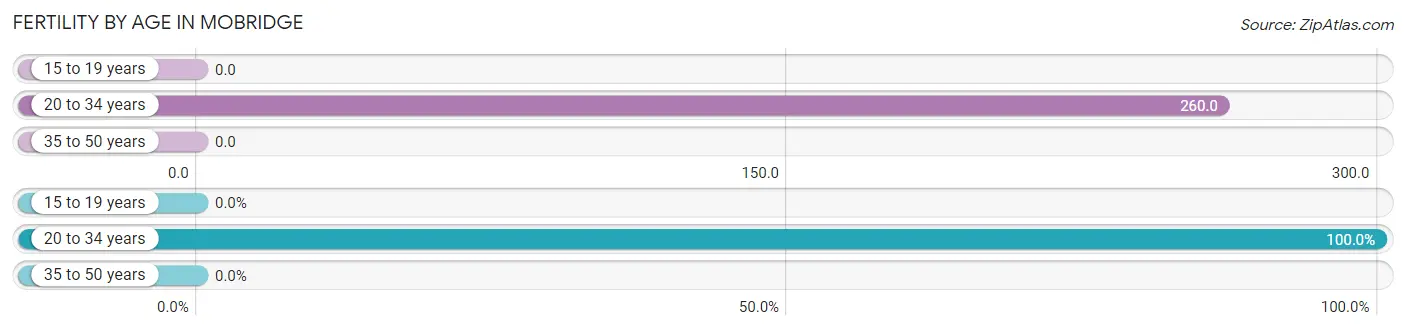
| Age Bracket | Women with Births | Births / 1,000 Women |
| 15 to 19 years | 0 (0.0%) | 0.0 |
| 20 to 34 years | 63 (100.0%) | 260.0 |
| 35 to 50 years | 0 (0.0%) | 0.0 |
| Total | 63 (100.0%) | 112.0 |
Fertility by Age by Marriage Status in Mobridge
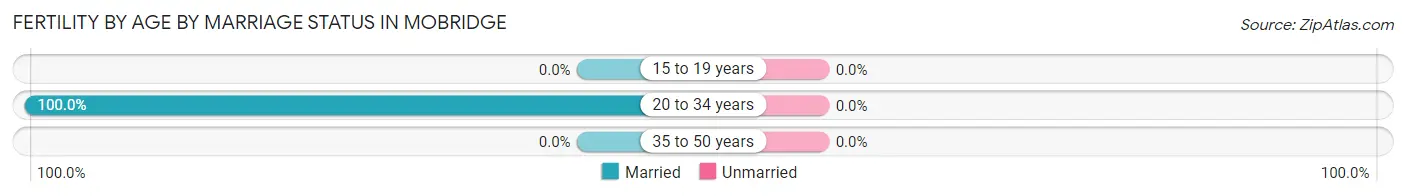
| Age Bracket | Married | Unmarried |
| 15 to 19 years | 0 (0.0%) | 0 (0.0%) |
| 20 to 34 years | 63 (100.0%) | 0 (0.0%) |
| 35 to 50 years | 0 (0.0%) | 0 (0.0%) |
| Total | 63 (100.0%) | 0 (0.0%) |
Fertility by Education in Mobridge
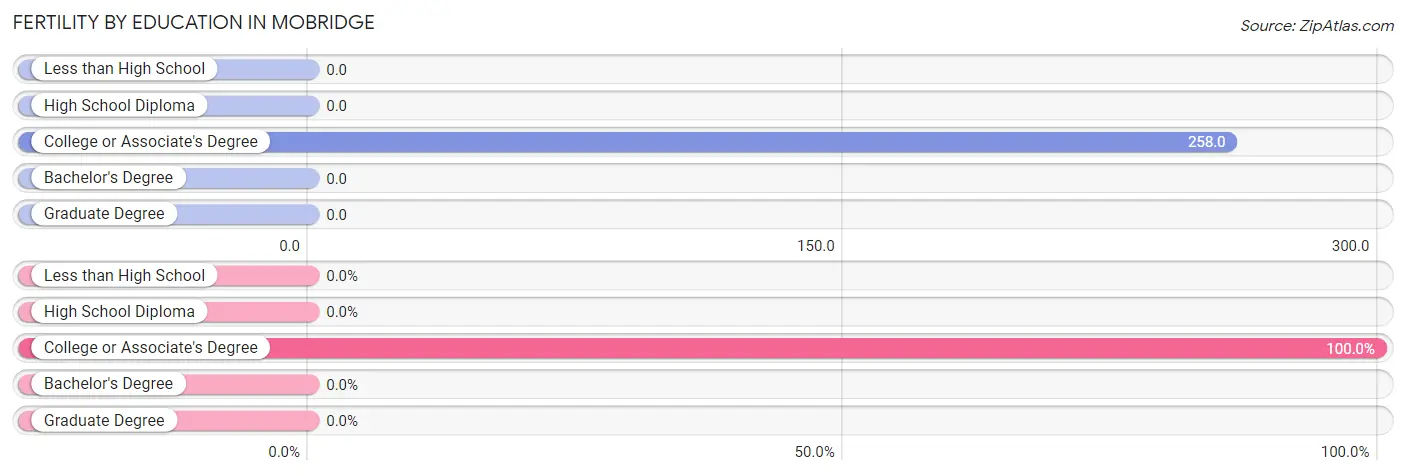
| Educational Attainment | Women with Births | Births / 1,000 Women |
| Less than High School | 0 (0.0%) | 0.0 |
| High School Diploma | 0 (0.0%) | 0.0 |
| College or Associate's Degree | 63 (100.0%) | 258.0 |
| Bachelor's Degree | 0 (0.0%) | 0.0 |
| Graduate Degree | 0 (0.0%) | 0.0 |
| Total | 63 (100.0%) | 112.0 |
Fertility by Education by Marriage Status in Mobridge
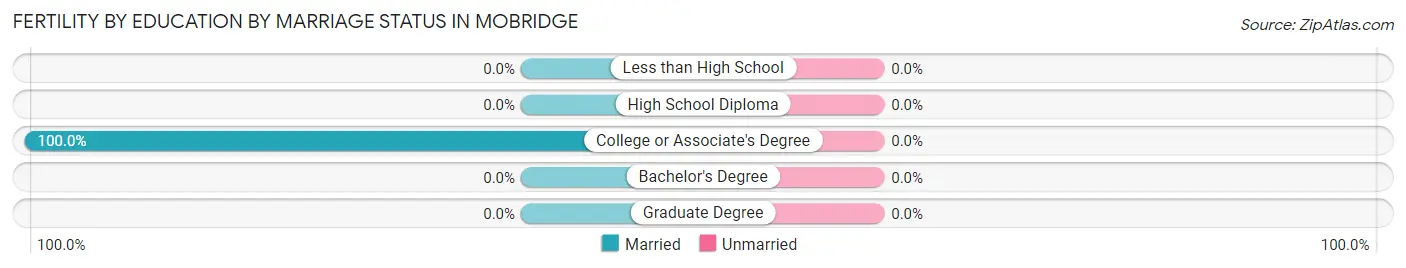
| Educational Attainment | Married | Unmarried |
| Less than High School | 0 (0.0%) | 0 (0.0%) |
| High School Diploma | 0 (0.0%) | 0 (0.0%) |
| College or Associate's Degree | 63 (100.0%) | 0 (0.0%) |
| Bachelor's Degree | 0 (0.0%) | 0 (0.0%) |
| Graduate Degree | 0 (0.0%) | 0 (0.0%) |
| Total | 63 (100.0%) | 0 (0.0%) |
Employment Characteristics in Mobridge
Employment by Class of Employer in Mobridge
Among the 1,609 employed individuals in Mobridge, private company employees (1,017 | 63.2%), not-for-profit organizations (197 | 12.2%), and local government employees (109 | 6.8%) make up the most common classes of employment.
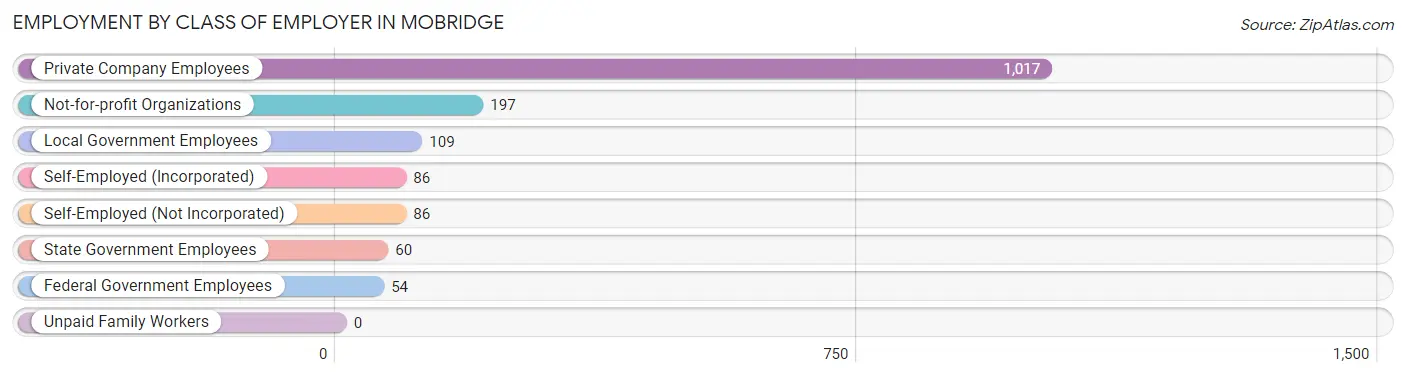
| Employer Class | # Employees | % Employees |
| Private Company Employees | 1,017 | 63.2% |
| Self-Employed (Incorporated) | 86 | 5.3% |
| Self-Employed (Not Incorporated) | 86 | 5.3% |
| Not-for-profit Organizations | 197 | 12.2% |
| Local Government Employees | 109 | 6.8% |
| State Government Employees | 60 | 3.7% |
| Federal Government Employees | 54 | 3.4% |
| Unpaid Family Workers | 0 | 0.0% |
| Total | 1,609 | 100.0% |
Employment Status by Age in Mobridge
According to the labor force statistics for Mobridge, out of the total population over 16 years of age (2,517), 67.0% or 1,686 individuals are in the labor force, with 1.4% or 24 of them unemployed. The age group with the highest labor force participation rate is 45 to 54 years, with 100.0% or 223 individuals in the labor force. Within the labor force, the 16 to 19 years age range has the highest percentage of unemployed individuals, with 20.0% or 14 of them being unemployed.
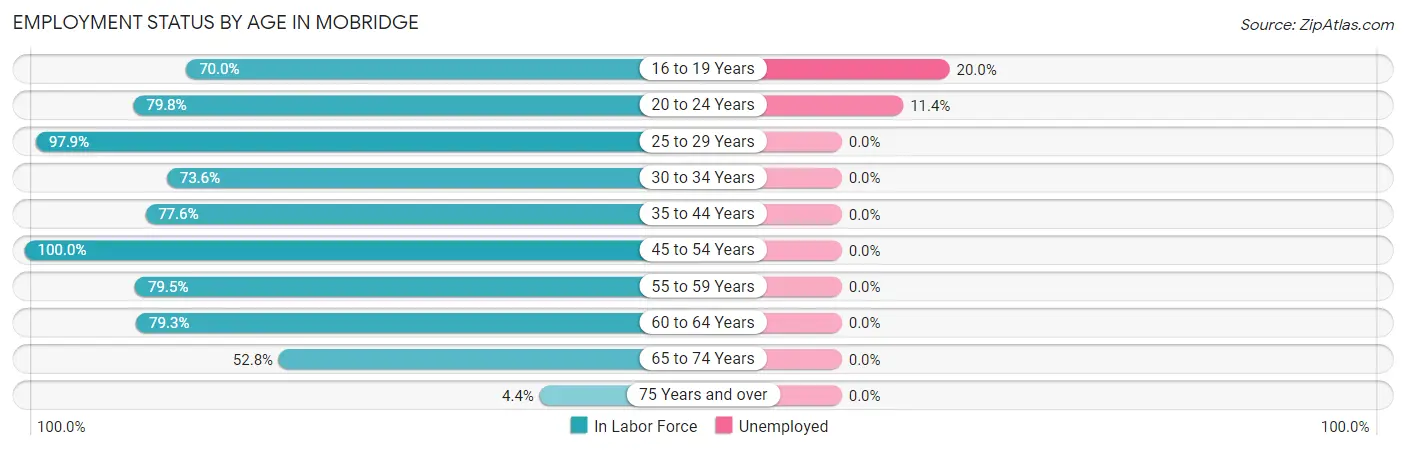
| Age Bracket | In Labor Force | Unemployed |
| 16 to 19 Years | 70 (70.0%) | 14 (20.0%) |
| 20 to 24 Years | 79 (79.8%) | 9 (11.4%) |
| 25 to 29 Years | 141 (97.9%) | 0 (0.0%) |
| 30 to 34 Years | 162 (73.6%) | 0 (0.0%) |
| 35 to 44 Years | 389 (77.6%) | 0 (0.0%) |
| 45 to 54 Years | 223 (100.0%) | 0 (0.0%) |
| 55 to 59 Years | 182 (79.5%) | 0 (0.0%) |
| 60 to 64 Years | 226 (79.3%) | 0 (0.0%) |
| 65 to 74 Years | 199 (52.8%) | 0 (0.0%) |
| 75 Years and over | 15 (4.4%) | 0 (0.0%) |
| Total | 1,686 (67.0%) | 24 (1.4%) |
Employment Status by Educational Attainment in Mobridge
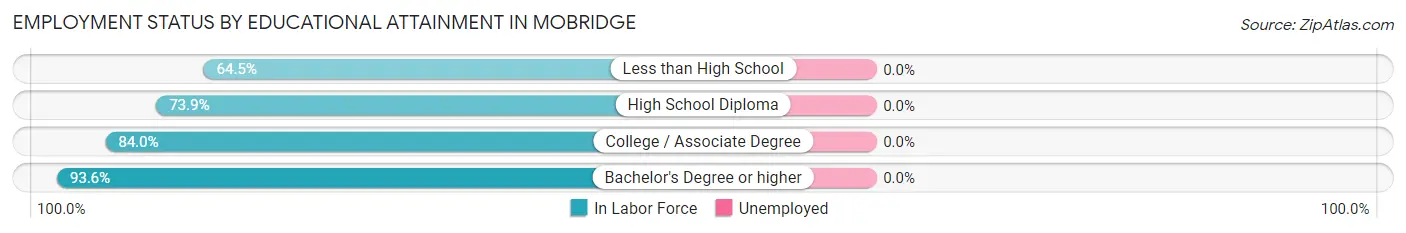
| Educational Attainment | In Labor Force | Unemployed |
| Less than High School | 71 (64.5%) | 0 (0.0%) |
| High School Diploma | 348 (73.9%) | 0 (0.0%) |
| College / Associate Degree | 450 (84.0%) | 0 (0.0%) |
| Bachelor's Degree or higher | 454 (93.6%) | 0 (0.0%) |
| Total | 1,323 (82.6%) | 0 (0.0%) |
Employment Occupations by Sex in Mobridge
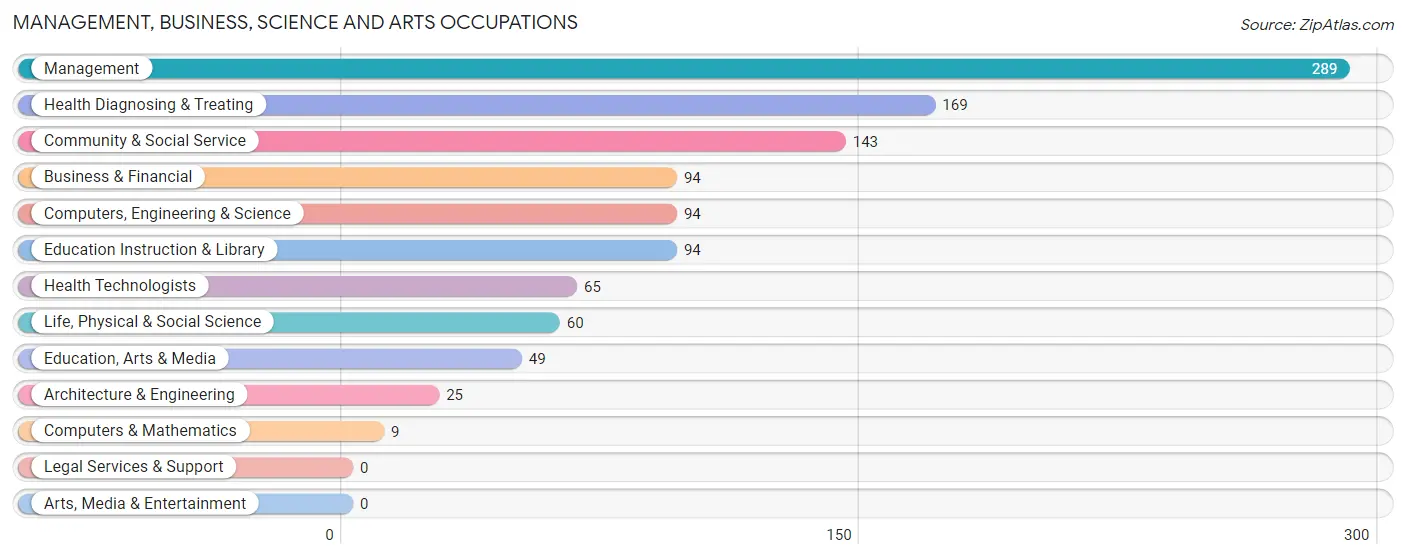
Management, Business, Science and Arts Occupations
The most common Management, Business, Science and Arts occupations in Mobridge are Management (289 | 17.6%), Health Diagnosing & Treating (169 | 10.3%), Community & Social Service (143 | 8.7%), Business & Financial (94 | 5.7%), and Computers, Engineering & Science (94 | 5.7%).
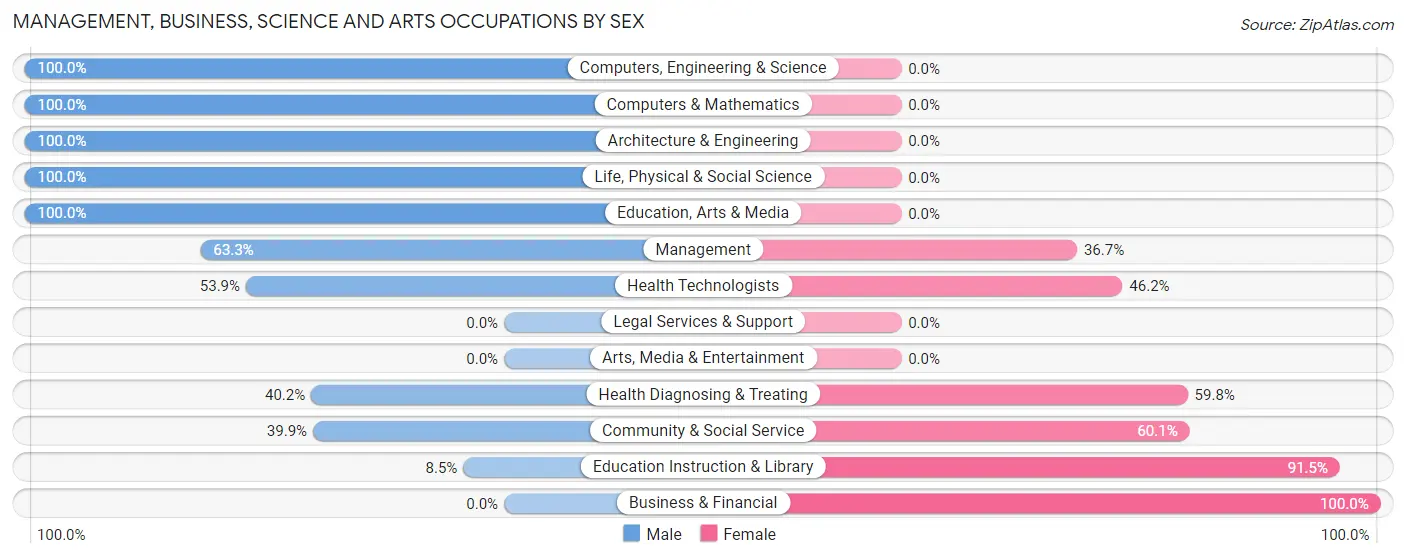
Management, Business, Science and Arts Occupations by Sex
Within the Management, Business, Science and Arts occupations in Mobridge, the most male-oriented occupations are Computers, Engineering & Science (100.0%), Computers & Mathematics (100.0%), and Architecture & Engineering (100.0%), while the most female-oriented occupations are Business & Financial (100.0%), Education Instruction & Library (91.5%), and Community & Social Service (60.1%).
| Occupation | Male | Female |
| Management | 183 (63.3%) | 106 (36.7%) |
| Business & Financial | 0 (0.0%) | 94 (100.0%) |
| Computers, Engineering & Science | 94 (100.0%) | 0 (0.0%) |
| Computers & Mathematics | 9 (100.0%) | 0 (0.0%) |
| Architecture & Engineering | 25 (100.0%) | 0 (0.0%) |
| Life, Physical & Social Science | 60 (100.0%) | 0 (0.0%) |
| Community & Social Service | 57 (39.9%) | 86 (60.1%) |
| Education, Arts & Media | 49 (100.0%) | 0 (0.0%) |
| Legal Services & Support | 0 (0.0%) | 0 (0.0%) |
| Education Instruction & Library | 8 (8.5%) | 86 (91.5%) |
| Arts, Media & Entertainment | 0 (0.0%) | 0 (0.0%) |
| Health Diagnosing & Treating | 68 (40.2%) | 101 (59.8%) |
| Health Technologists | 35 (53.8%) | 30 (46.2%) |
| Total (Category) | 402 (50.9%) | 387 (49.0%) |
| Total (Overall) | 928 (56.5%) | 716 (43.5%) |
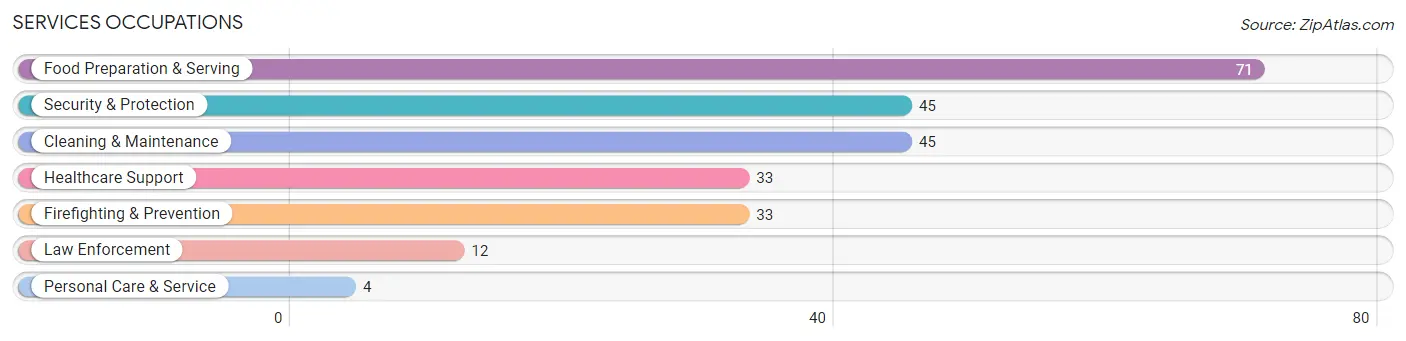
Services Occupations
The most common Services occupations in Mobridge are Food Preparation & Serving (71 | 4.3%), Security & Protection (45 | 2.7%), Cleaning & Maintenance (45 | 2.7%), Healthcare Support (33 | 2.0%), and Firefighting & Prevention (33 | 2.0%).
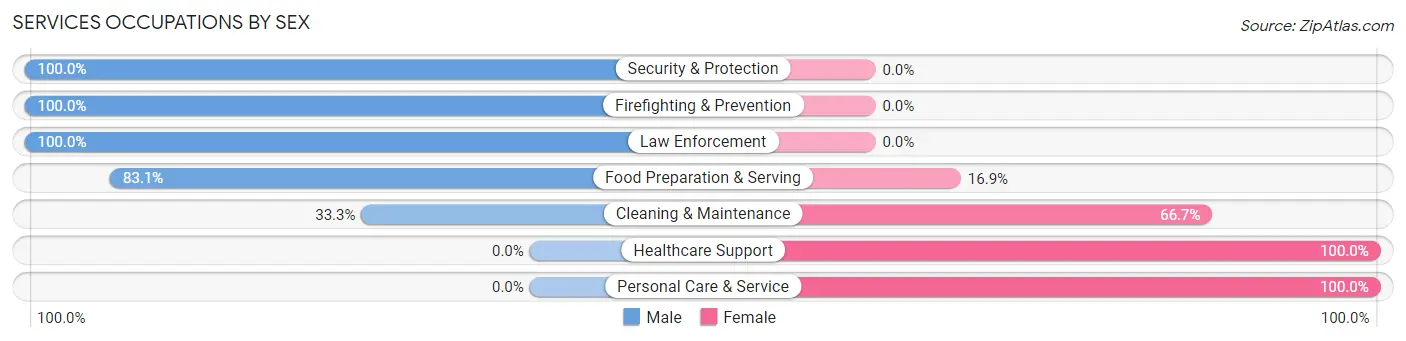
Services Occupations by Sex
Within the Services occupations in Mobridge, the most male-oriented occupations are Security & Protection (100.0%), Firefighting & Prevention (100.0%), and Law Enforcement (100.0%), while the most female-oriented occupations are Healthcare Support (100.0%), Personal Care & Service (100.0%), and Cleaning & Maintenance (66.7%).
| Occupation | Male | Female |
| Healthcare Support | 0 (0.0%) | 33 (100.0%) |
| Security & Protection | 45 (100.0%) | 0 (0.0%) |
| Firefighting & Prevention | 33 (100.0%) | 0 (0.0%) |
| Law Enforcement | 12 (100.0%) | 0 (0.0%) |
| Food Preparation & Serving | 59 (83.1%) | 12 (16.9%) |
| Cleaning & Maintenance | 15 (33.3%) | 30 (66.7%) |
| Personal Care & Service | 0 (0.0%) | 4 (100.0%) |
| Total (Category) | 119 (60.1%) | 79 (39.9%) |
| Total (Overall) | 928 (56.5%) | 716 (43.5%) |
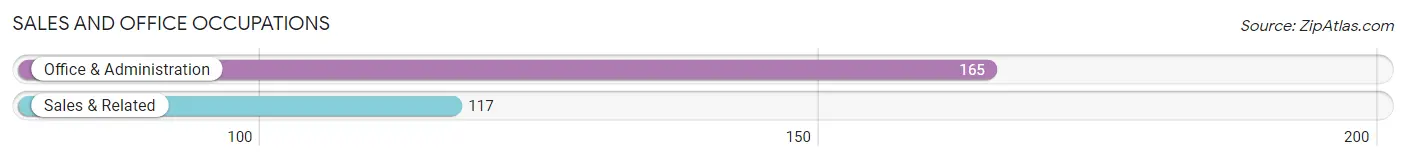
Sales and Office Occupations
The most common Sales and Office occupations in Mobridge are Office & Administration (165 | 10.0%), and Sales & Related (117 | 7.1%).
Sales and Office Occupations by Sex
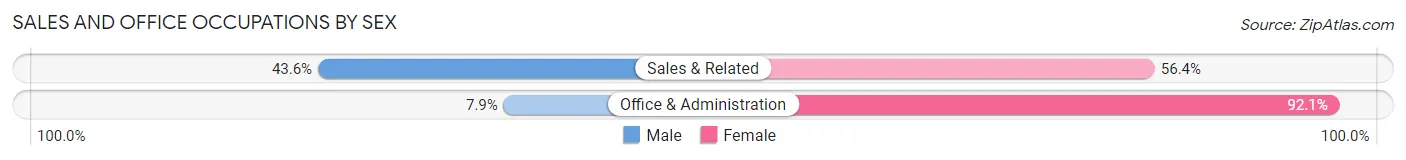
| Occupation | Male | Female |
| Sales & Related | 51 (43.6%) | 66 (56.4%) |
| Office & Administration | 13 (7.9%) | 152 (92.1%) |
| Total (Category) | 64 (22.7%) | 218 (77.3%) |
| Total (Overall) | 928 (56.5%) | 716 (43.5%) |
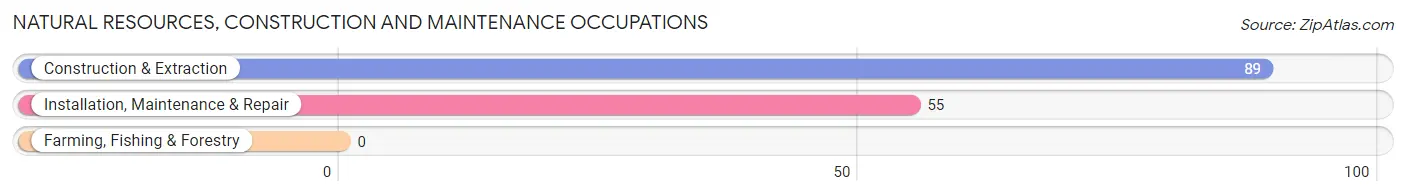
Natural Resources, Construction and Maintenance Occupations
The most common Natural Resources, Construction and Maintenance occupations in Mobridge are Construction & Extraction (89 | 5.4%), and Installation, Maintenance & Repair (55 | 3.4%).
Natural Resources, Construction and Maintenance Occupations by Sex
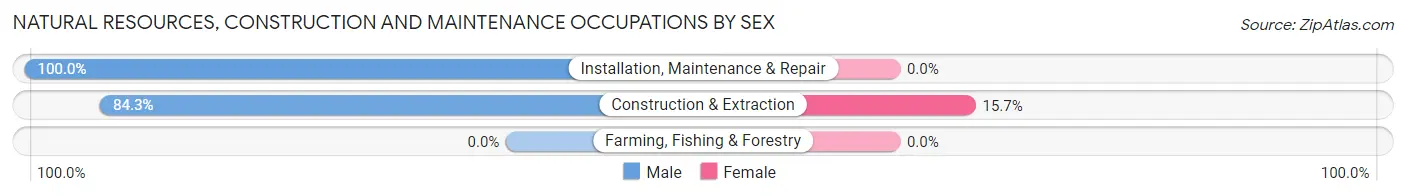
| Occupation | Male | Female |
| Farming, Fishing & Forestry | 0 (0.0%) | 0 (0.0%) |
| Construction & Extraction | 75 (84.3%) | 14 (15.7%) |
| Installation, Maintenance & Repair | 55 (100.0%) | 0 (0.0%) |
| Total (Category) | 130 (90.3%) | 14 (9.7%) |
| Total (Overall) | 928 (56.5%) | 716 (43.5%) |
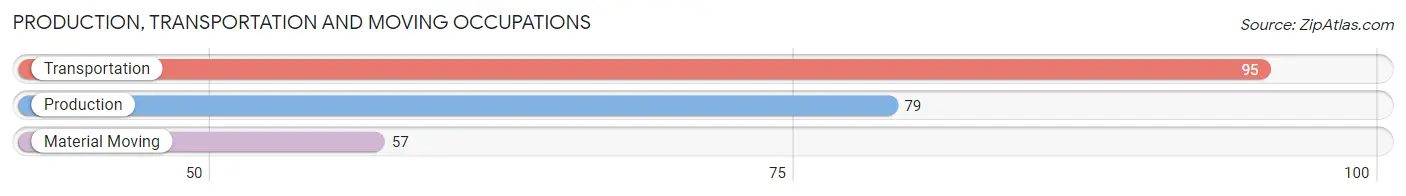
Production, Transportation and Moving Occupations
The most common Production, Transportation and Moving occupations in Mobridge are Transportation (95 | 5.8%), Production (79 | 4.8%), and Material Moving (57 | 3.5%).
Production, Transportation and Moving Occupations by Sex
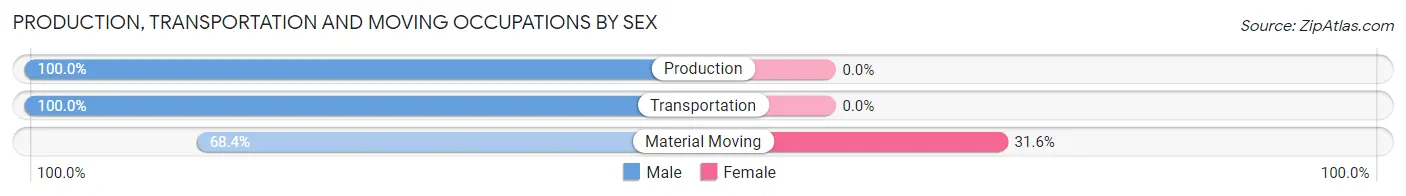
| Occupation | Male | Female |
| Production | 79 (100.0%) | 0 (0.0%) |
| Transportation | 95 (100.0%) | 0 (0.0%) |
| Material Moving | 39 (68.4%) | 18 (31.6%) |
| Total (Category) | 213 (92.2%) | 18 (7.8%) |
| Total (Overall) | 928 (56.5%) | 716 (43.5%) |
Employment Industries by Sex in Mobridge
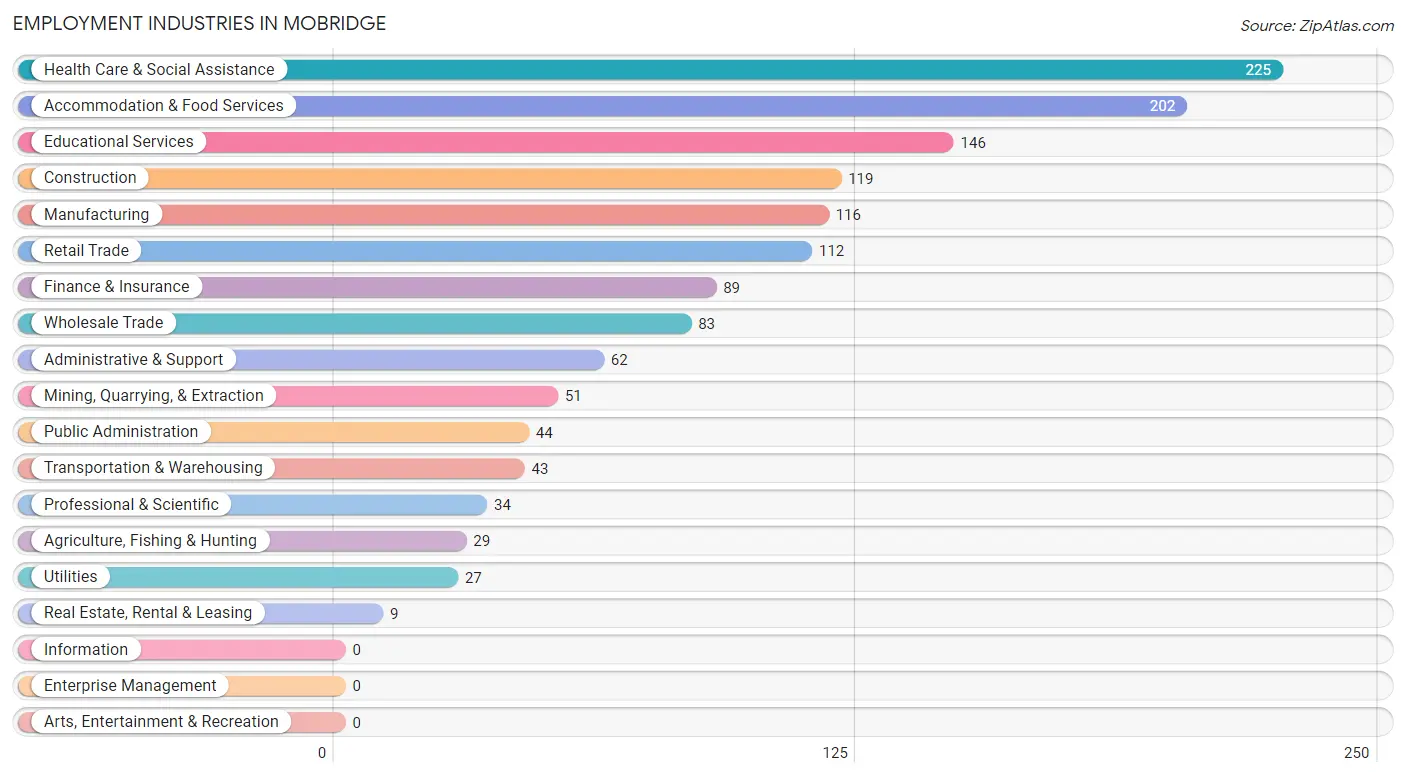
Employment Industries in Mobridge
The major employment industries in Mobridge include Health Care & Social Assistance (225 | 13.7%), Accommodation & Food Services (202 | 12.3%), Educational Services (146 | 8.9%), Construction (119 | 7.2%), and Manufacturing (116 | 7.1%).
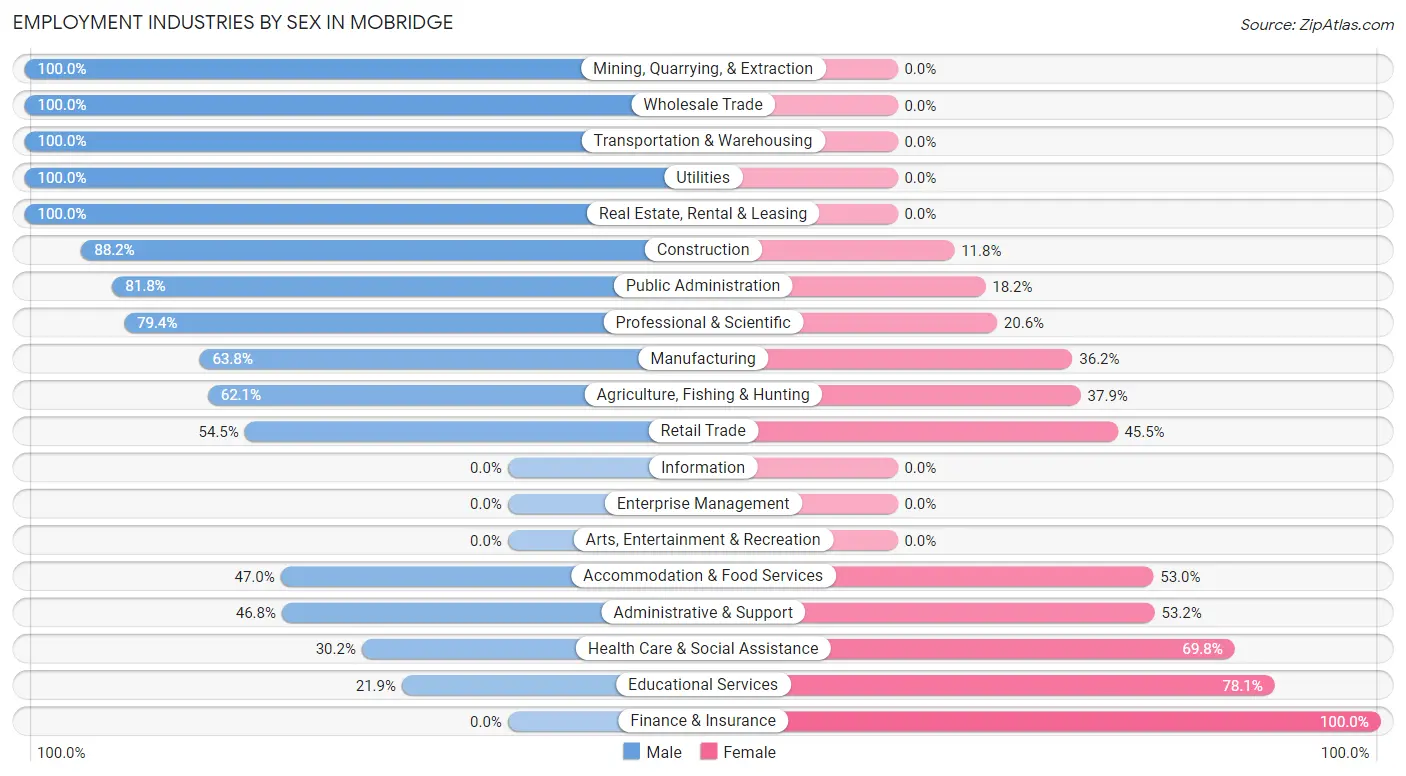
Employment Industries by Sex in Mobridge
The Mobridge industries that see more men than women are Mining, Quarrying, & Extraction (100.0%), Wholesale Trade (100.0%), and Transportation & Warehousing (100.0%), whereas the industries that tend to have a higher number of women are Finance & Insurance (100.0%), Educational Services (78.1%), and Health Care & Social Assistance (69.8%).
| Industry | Male | Female |
| Agriculture, Fishing & Hunting | 18 (62.1%) | 11 (37.9%) |
| Mining, Quarrying, & Extraction | 51 (100.0%) | 0 (0.0%) |
| Construction | 105 (88.2%) | 14 (11.8%) |
| Manufacturing | 74 (63.8%) | 42 (36.2%) |
| Wholesale Trade | 83 (100.0%) | 0 (0.0%) |
| Retail Trade | 61 (54.5%) | 51 (45.5%) |
| Transportation & Warehousing | 43 (100.0%) | 0 (0.0%) |
| Utilities | 27 (100.0%) | 0 (0.0%) |
| Information | 0 (0.0%) | 0 (0.0%) |
| Finance & Insurance | 0 (0.0%) | 89 (100.0%) |
| Real Estate, Rental & Leasing | 9 (100.0%) | 0 (0.0%) |
| Professional & Scientific | 27 (79.4%) | 7 (20.6%) |
| Enterprise Management | 0 (0.0%) | 0 (0.0%) |
| Administrative & Support | 29 (46.8%) | 33 (53.2%) |
| Educational Services | 32 (21.9%) | 114 (78.1%) |
| Health Care & Social Assistance | 68 (30.2%) | 157 (69.8%) |
| Arts, Entertainment & Recreation | 0 (0.0%) | 0 (0.0%) |
| Accommodation & Food Services | 95 (47.0%) | 107 (53.0%) |
| Public Administration | 36 (81.8%) | 8 (18.2%) |
| Total | 928 (56.5%) | 716 (43.5%) |
Education in Mobridge
School Enrollment in Mobridge
The most common levels of schooling among the 547 students in Mobridge are elementary school (199 | 36.4%), middle school (143 | 26.1%), and kindergarten (61 | 11.2%).
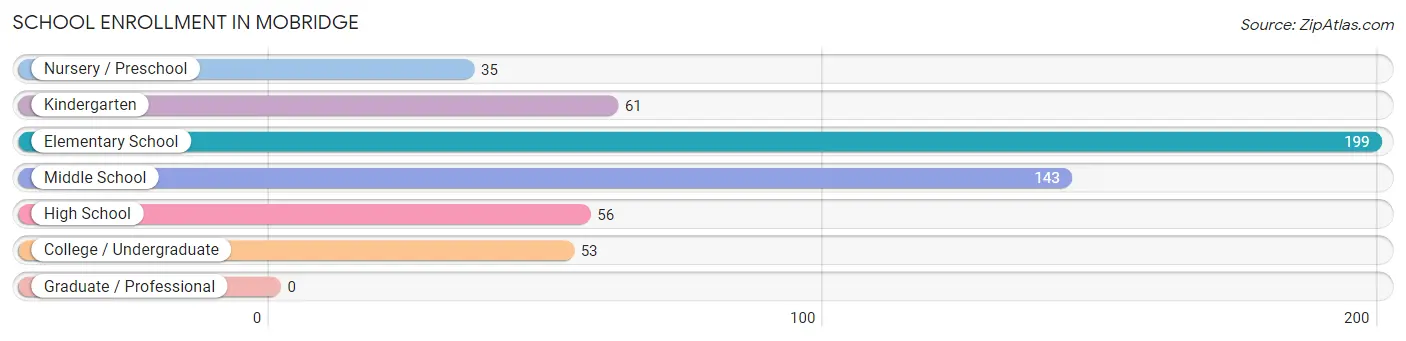
| School Level | # Students | % Students |
| Nursery / Preschool | 35 | 6.4% |
| Kindergarten | 61 | 11.2% |
| Elementary School | 199 | 36.4% |
| Middle School | 143 | 26.1% |
| High School | 56 | 10.2% |
| College / Undergraduate | 53 | 9.7% |
| Graduate / Professional | 0 | 0.0% |
| Total | 547 | 100.0% |
School Enrollment by Age by Funding Source in Mobridge
Out of a total of 547 students who are enrolled in schools in Mobridge, 48 (8.8%) attend a private institution, while the remaining 499 (91.2%) are enrolled in public schools. The age group of 3 to 4 year olds has the highest likelihood of being enrolled in private schools, with 22 (100.0% in the age bracket) enrolled. Conversely, the age group of 5 to 9 year old has the lowest likelihood of being enrolled in a private school, with 231 (100.0% in the age bracket) attending a public institution.
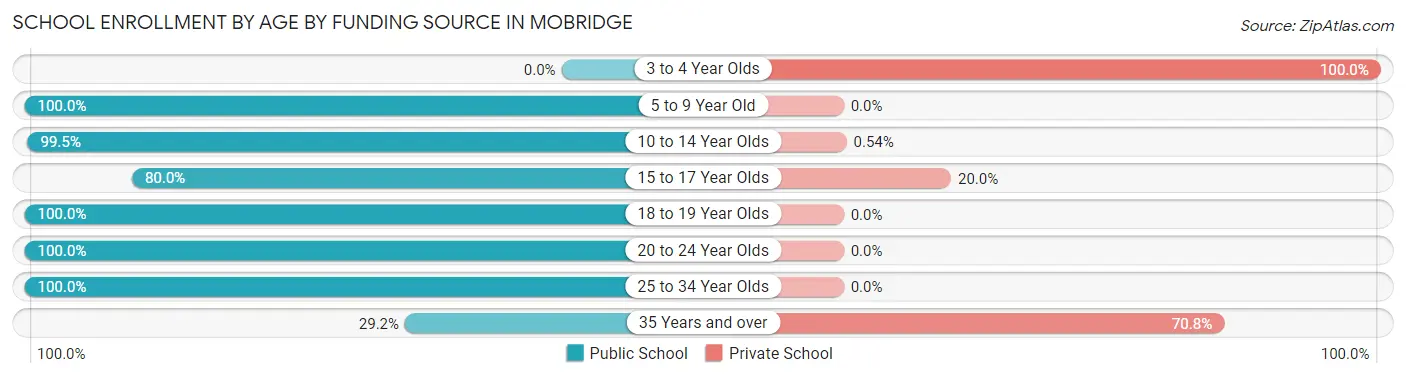
| Age Bracket | Public School | Private School |
| 3 to 4 Year Olds | 0 (0.0%) | 22 (100.0%) |
| 5 to 9 Year Old | 231 (100.0%) | 0 (0.0%) |
| 10 to 14 Year Olds | 185 (99.5%) | 1 (0.5%) |
| 15 to 17 Year Olds | 32 (80.0%) | 8 (20.0%) |
| 18 to 19 Year Olds | 19 (100.0%) | 0 (0.0%) |
| 20 to 24 Year Olds | 9 (100.0%) | 0 (0.0%) |
| 25 to 34 Year Olds | 16 (100.0%) | 0 (0.0%) |
| 35 Years and over | 7 (29.2%) | 17 (70.8%) |
| Total | 499 (91.2%) | 48 (8.8%) |
Educational Attainment by Field of Study in Mobridge
Bio, nature & agricultural (107 | 15.4%), business (107 | 15.4%), education (102 | 14.7%), engineering (78 | 11.2%), and science & technology (74 | 10.6%) are the most common fields of study among 696 individuals in Mobridge who have obtained a bachelor's degree or higher.
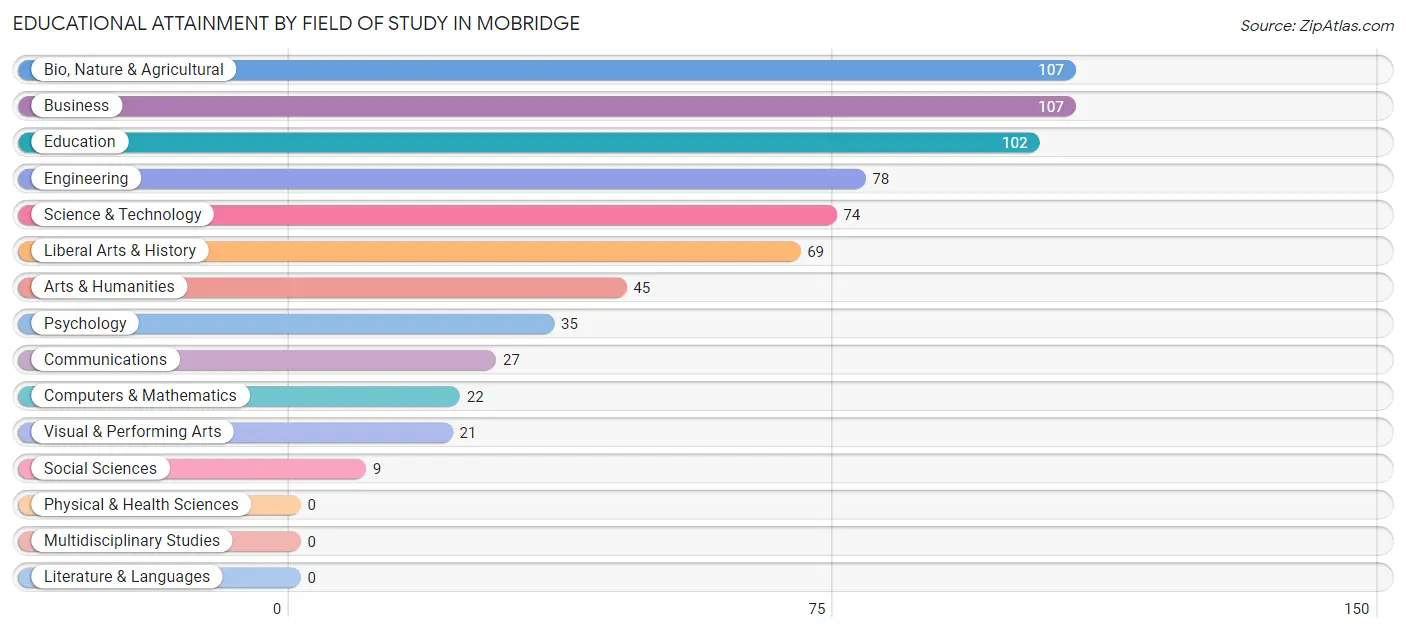
| Field of Study | # Graduates | % Graduates |
| Computers & Mathematics | 22 | 3.2% |
| Bio, Nature & Agricultural | 107 | 15.4% |
| Physical & Health Sciences | 0 | 0.0% |
| Psychology | 35 | 5.0% |
| Social Sciences | 9 | 1.3% |
| Engineering | 78 | 11.2% |
| Multidisciplinary Studies | 0 | 0.0% |
| Science & Technology | 74 | 10.6% |
| Business | 107 | 15.4% |
| Education | 102 | 14.7% |
| Literature & Languages | 0 | 0.0% |
| Liberal Arts & History | 69 | 9.9% |
| Visual & Performing Arts | 21 | 3.0% |
| Communications | 27 | 3.9% |
| Arts & Humanities | 45 | 6.5% |
| Total | 696 | 100.0% |
Transportation & Commute in Mobridge
Vehicle Availability by Sex in Mobridge
The most prevalent vehicle ownership categories in Mobridge are males with 2 vehicles (356, accounting for 41.4%) and females with 2 vehicles (281, making up 50.3%).
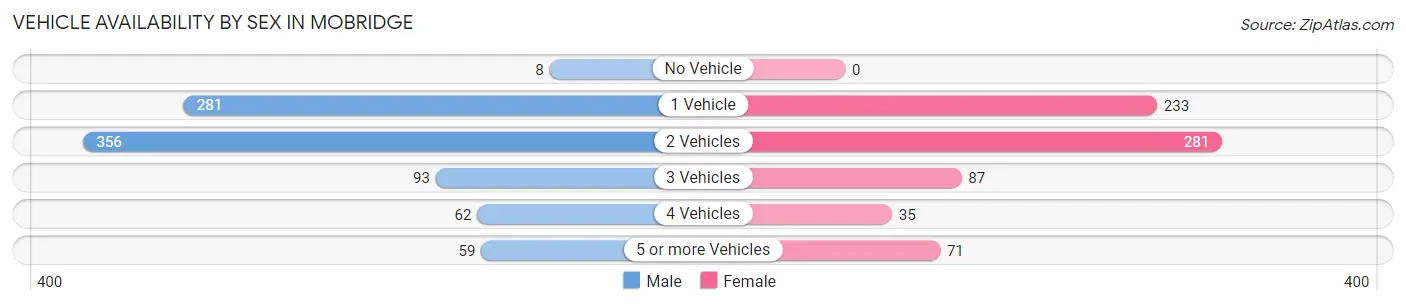
| Vehicles Available | Male | Female |
| No Vehicle | 8 (0.9%) | 0 (0.0%) |
| 1 Vehicle | 281 (32.7%) | 233 (33.0%) |
| 2 Vehicles | 356 (41.4%) | 281 (39.8%) |
| 3 Vehicles | 93 (10.8%) | 87 (12.3%) |
| 4 Vehicles | 62 (7.2%) | 35 (5.0%) |
| 5 or more Vehicles | 59 (6.9%) | 71 (10.0%) |
| Total | 859 (100.0%) | 707 (100.0%) |
Commute Time in Mobridge
The most frequently occuring commute durations in Mobridge are 5 to 9 minutes (672 commuters, 43.2%), 15 to 19 minutes (254 commuters, 16.3%), and 10 to 14 minutes (205 commuters, 13.2%).
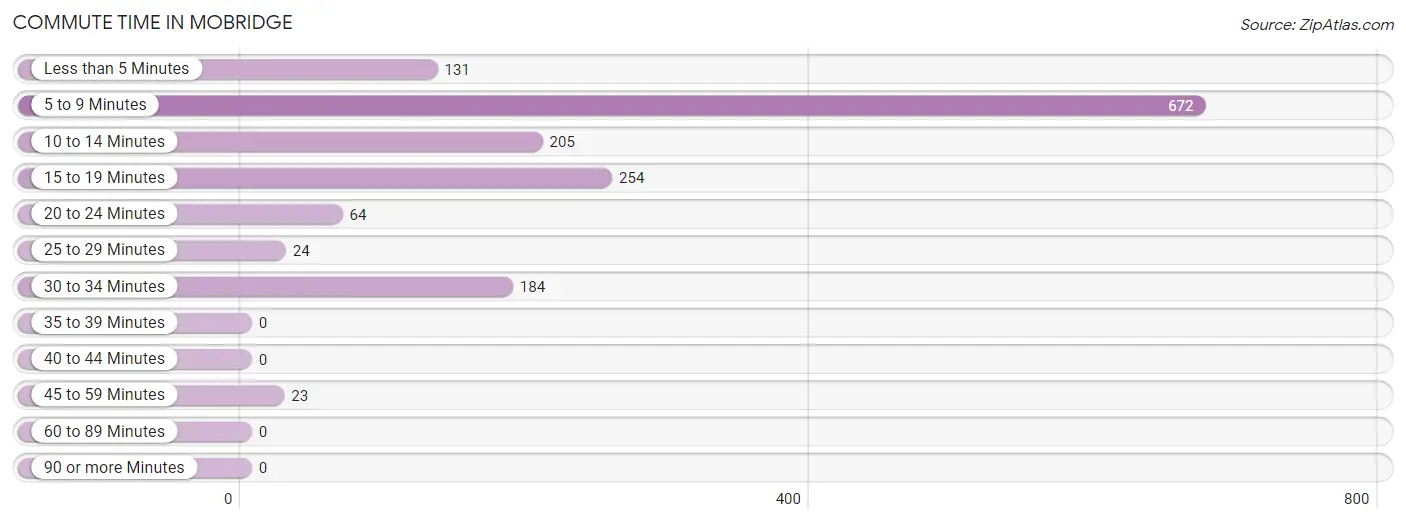
| Commute Time | # Commuters | % Commuters |
| Less than 5 Minutes | 131 | 8.4% |
| 5 to 9 Minutes | 672 | 43.2% |
| 10 to 14 Minutes | 205 | 13.2% |
| 15 to 19 Minutes | 254 | 16.3% |
| 20 to 24 Minutes | 64 | 4.1% |
| 25 to 29 Minutes | 24 | 1.5% |
| 30 to 34 Minutes | 184 | 11.8% |
| 35 to 39 Minutes | 0 | 0.0% |
| 40 to 44 Minutes | 0 | 0.0% |
| 45 to 59 Minutes | 23 | 1.5% |
| 60 to 89 Minutes | 0 | 0.0% |
| 90 or more Minutes | 0 | 0.0% |
Commute Time by Sex in Mobridge
The most common commute times in Mobridge are 5 to 9 minutes (356 commuters, 40.2%) for males and 5 to 9 minutes (316 commuters, 47.0%) for females.
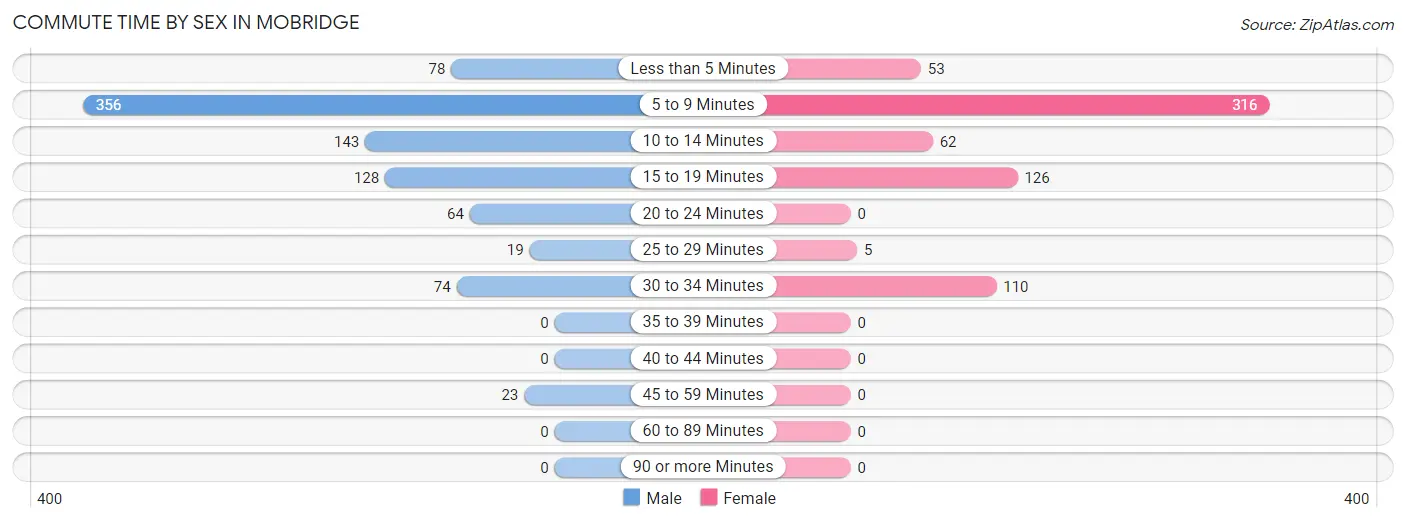
| Commute Time | Male | Female |
| Less than 5 Minutes | 78 (8.8%) | 53 (7.9%) |
| 5 to 9 Minutes | 356 (40.2%) | 316 (47.0%) |
| 10 to 14 Minutes | 143 (16.2%) | 62 (9.2%) |
| 15 to 19 Minutes | 128 (14.5%) | 126 (18.8%) |
| 20 to 24 Minutes | 64 (7.2%) | 0 (0.0%) |
| 25 to 29 Minutes | 19 (2.1%) | 5 (0.7%) |
| 30 to 34 Minutes | 74 (8.4%) | 110 (16.4%) |
| 35 to 39 Minutes | 0 (0.0%) | 0 (0.0%) |
| 40 to 44 Minutes | 0 (0.0%) | 0 (0.0%) |
| 45 to 59 Minutes | 23 (2.6%) | 0 (0.0%) |
| 60 to 89 Minutes | 0 (0.0%) | 0 (0.0%) |
| 90 or more Minutes | 0 (0.0%) | 0 (0.0%) |
Time of Departure to Work by Sex in Mobridge
The most frequent times of departure to work in Mobridge are 7:30 AM to 7:59 AM (157, 17.7%) for males and 7:30 AM to 7:59 AM (193, 28.7%) for females.
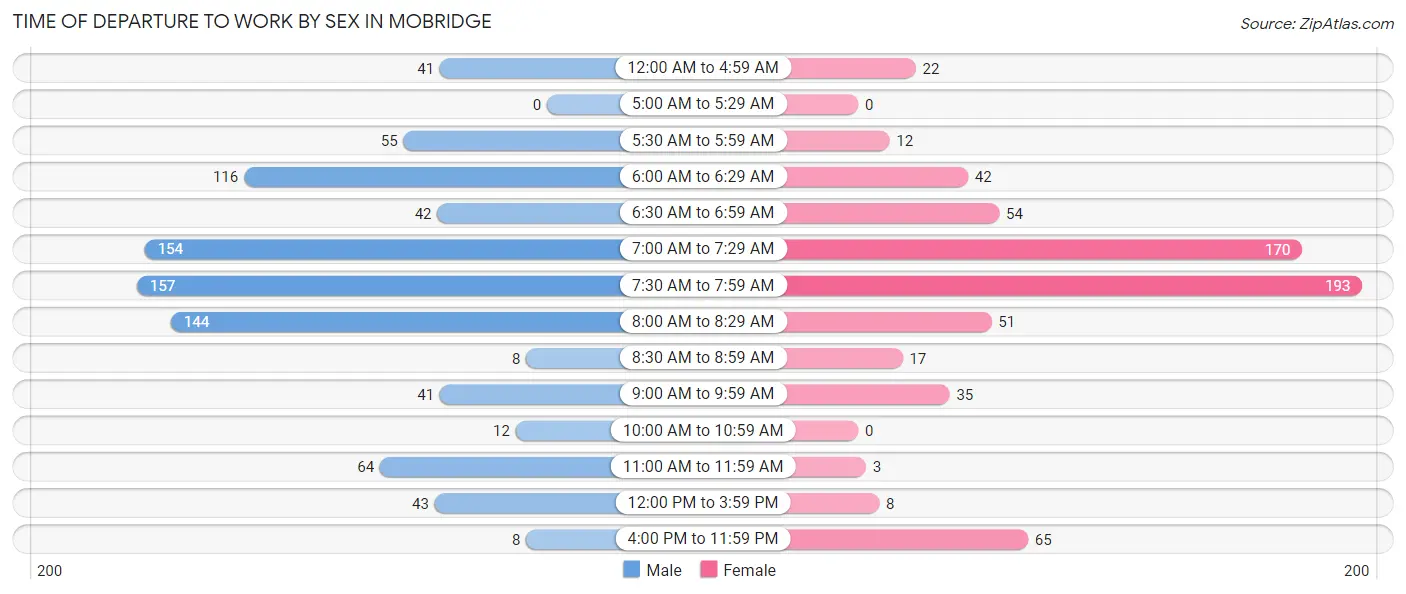
| Time of Departure | Male | Female |
| 12:00 AM to 4:59 AM | 41 (4.6%) | 22 (3.3%) |
| 5:00 AM to 5:29 AM | 0 (0.0%) | 0 (0.0%) |
| 5:30 AM to 5:59 AM | 55 (6.2%) | 12 (1.8%) |
| 6:00 AM to 6:29 AM | 116 (13.1%) | 42 (6.2%) |
| 6:30 AM to 6:59 AM | 42 (4.8%) | 54 (8.0%) |
| 7:00 AM to 7:29 AM | 154 (17.4%) | 170 (25.3%) |
| 7:30 AM to 7:59 AM | 157 (17.7%) | 193 (28.7%) |
| 8:00 AM to 8:29 AM | 144 (16.3%) | 51 (7.6%) |
| 8:30 AM to 8:59 AM | 8 (0.9%) | 17 (2.5%) |
| 9:00 AM to 9:59 AM | 41 (4.6%) | 35 (5.2%) |
| 10:00 AM to 10:59 AM | 12 (1.4%) | 0 (0.0%) |
| 11:00 AM to 11:59 AM | 64 (7.2%) | 3 (0.4%) |
| 12:00 PM to 3:59 PM | 43 (4.9%) | 8 (1.2%) |
| 4:00 PM to 11:59 PM | 8 (0.9%) | 65 (9.7%) |
| Total | 885 (100.0%) | 672 (100.0%) |
Housing Occupancy in Mobridge
Occupancy by Ownership in Mobridge
Of the total 1,502 dwellings in Mobridge, owner-occupied units account for 969 (64.5%), while renter-occupied units make up 533 (35.5%).
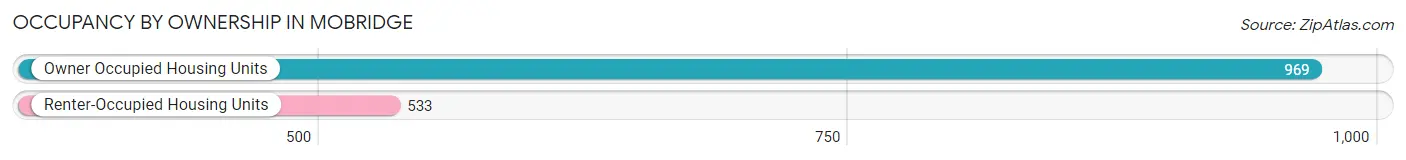
| Occupancy | # Housing Units | % Housing Units |
| Owner Occupied Housing Units | 969 | 64.5% |
| Renter-Occupied Housing Units | 533 | 35.5% |
| Total Occupied Housing Units | 1,502 | 100.0% |
Occupancy by Household Size in Mobridge
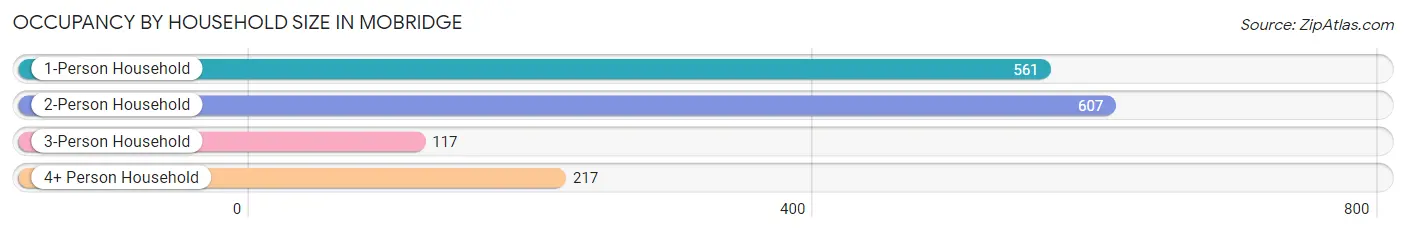
| Household Size | # Housing Units | % Housing Units |
| 1-Person Household | 561 | 37.3% |
| 2-Person Household | 607 | 40.4% |
| 3-Person Household | 117 | 7.8% |
| 4+ Person Household | 217 | 14.4% |
| Total Housing Units | 1,502 | 100.0% |
Occupancy by Ownership by Household Size in Mobridge
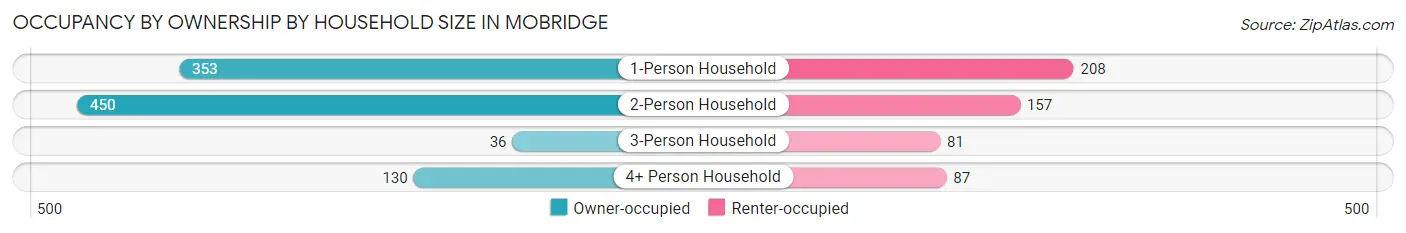
| Household Size | Owner-occupied | Renter-occupied |
| 1-Person Household | 353 (62.9%) | 208 (37.1%) |
| 2-Person Household | 450 (74.1%) | 157 (25.9%) |
| 3-Person Household | 36 (30.8%) | 81 (69.2%) |
| 4+ Person Household | 130 (59.9%) | 87 (40.1%) |
| Total Housing Units | 969 (64.5%) | 533 (35.5%) |
Occupancy by Educational Attainment in Mobridge
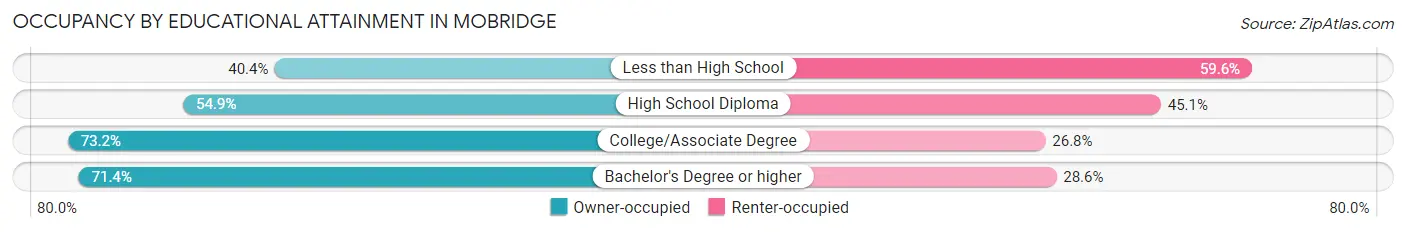
| Household Size | Owner-occupied | Renter-occupied |
| Less than High School | 40 (40.4%) | 59 (59.6%) |
| High School Diploma | 271 (54.9%) | 223 (45.1%) |
| College/Associate Degree | 368 (73.2%) | 135 (26.8%) |
| Bachelor's Degree or higher | 290 (71.4%) | 116 (28.6%) |
Occupancy by Age of Householder in Mobridge
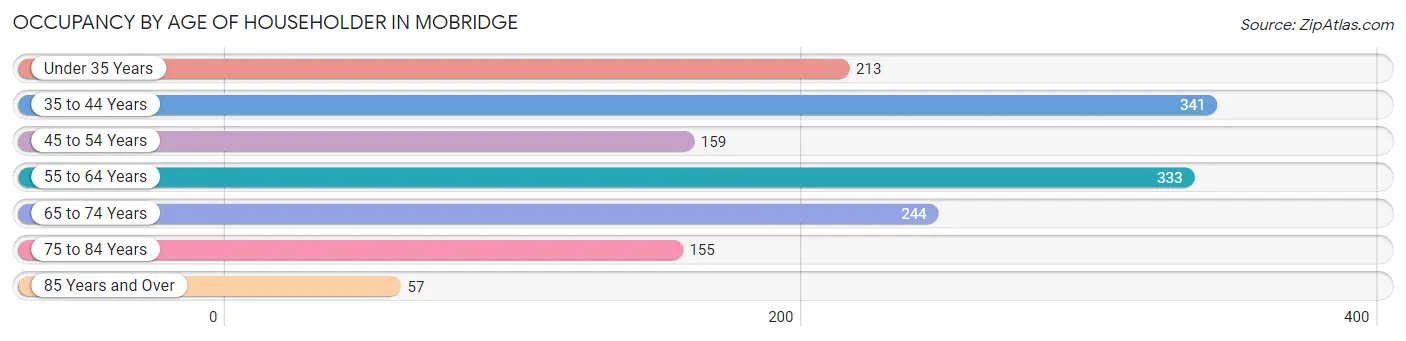
| Age Bracket | # Households | % Households |
| Under 35 Years | 213 | 14.2% |
| 35 to 44 Years | 341 | 22.7% |
| 45 to 54 Years | 159 | 10.6% |
| 55 to 64 Years | 333 | 22.2% |
| 65 to 74 Years | 244 | 16.3% |
| 75 to 84 Years | 155 | 10.3% |
| 85 Years and Over | 57 | 3.8% |
| Total | 1,502 | 100.0% |
Housing Finances in Mobridge
Median Income by Occupancy in Mobridge
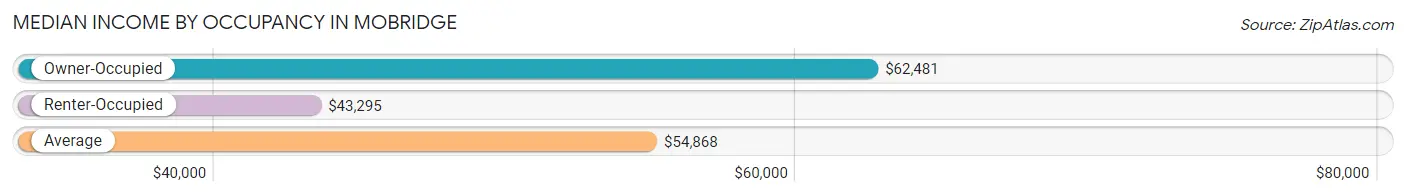
| Occupancy Type | # Households | Median Income |
| Owner-Occupied | 969 (64.5%) | $62,481 |
| Renter-Occupied | 533 (35.5%) | $43,295 |
| Average | 1,502 (100.0%) | $54,868 |
Occupancy by Householder Income Bracket in Mobridge
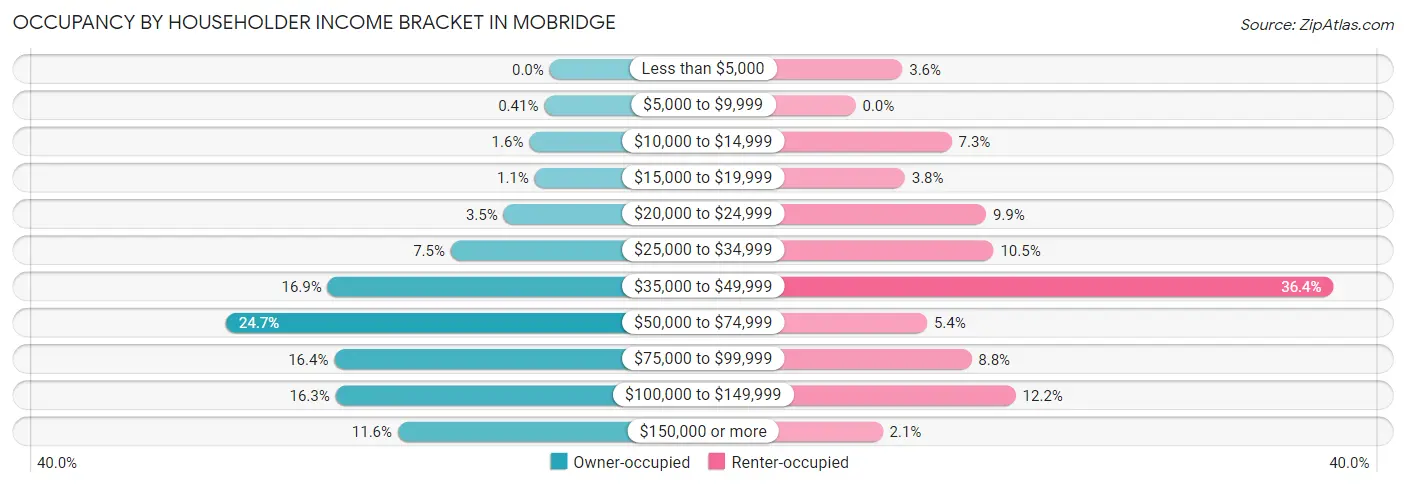
| Income Bracket | Owner-occupied | Renter-occupied |
| Less than $5,000 | 0 (0.0%) | 19 (3.6%) |
| $5,000 to $9,999 | 4 (0.4%) | 0 (0.0%) |
| $10,000 to $14,999 | 15 (1.5%) | 39 (7.3%) |
| $15,000 to $19,999 | 11 (1.1%) | 20 (3.7%) |
| $20,000 to $24,999 | 34 (3.5%) | 53 (9.9%) |
| $25,000 to $34,999 | 73 (7.5%) | 56 (10.5%) |
| $35,000 to $49,999 | 164 (16.9%) | 194 (36.4%) |
| $50,000 to $74,999 | 239 (24.7%) | 29 (5.4%) |
| $75,000 to $99,999 | 159 (16.4%) | 47 (8.8%) |
| $100,000 to $149,999 | 158 (16.3%) | 65 (12.2%) |
| $150,000 or more | 112 (11.6%) | 11 (2.1%) |
| Total | 969 (100.0%) | 533 (100.0%) |
Monthly Housing Cost Tiers in Mobridge
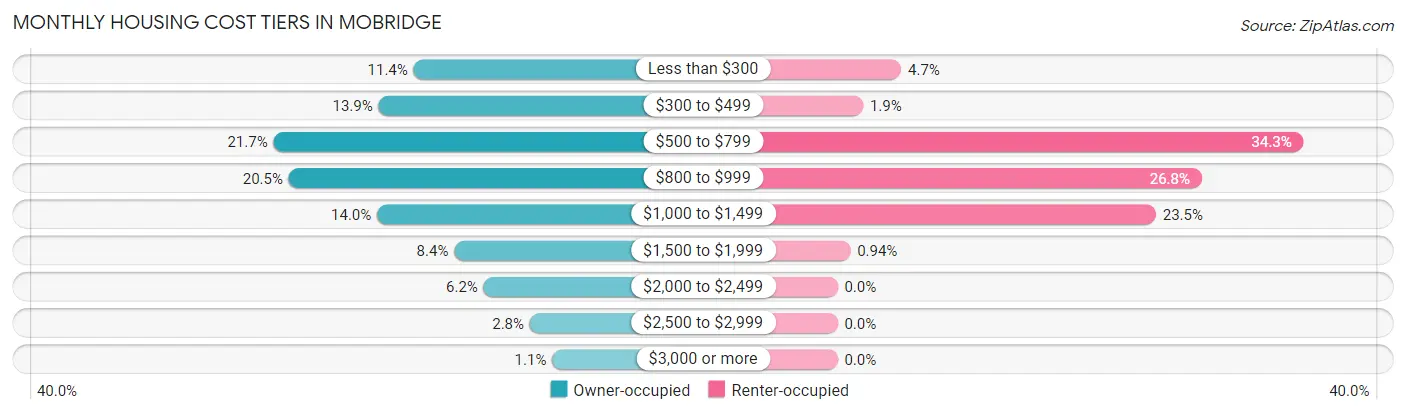
| Monthly Cost | Owner-occupied | Renter-occupied |
| Less than $300 | 110 (11.4%) | 25 (4.7%) |
| $300 to $499 | 135 (13.9%) | 10 (1.9%) |
| $500 to $799 | 210 (21.7%) | 183 (34.3%) |
| $800 to $999 | 199 (20.5%) | 143 (26.8%) |
| $1,000 to $1,499 | 136 (14.0%) | 125 (23.4%) |
| $1,500 to $1,999 | 81 (8.4%) | 5 (0.9%) |
| $2,000 to $2,499 | 60 (6.2%) | 0 (0.0%) |
| $2,500 to $2,999 | 27 (2.8%) | 0 (0.0%) |
| $3,000 or more | 11 (1.1%) | 0 (0.0%) |
| Total | 969 (100.0%) | 533 (100.0%) |
Physical Housing Characteristics in Mobridge
Housing Structures in Mobridge
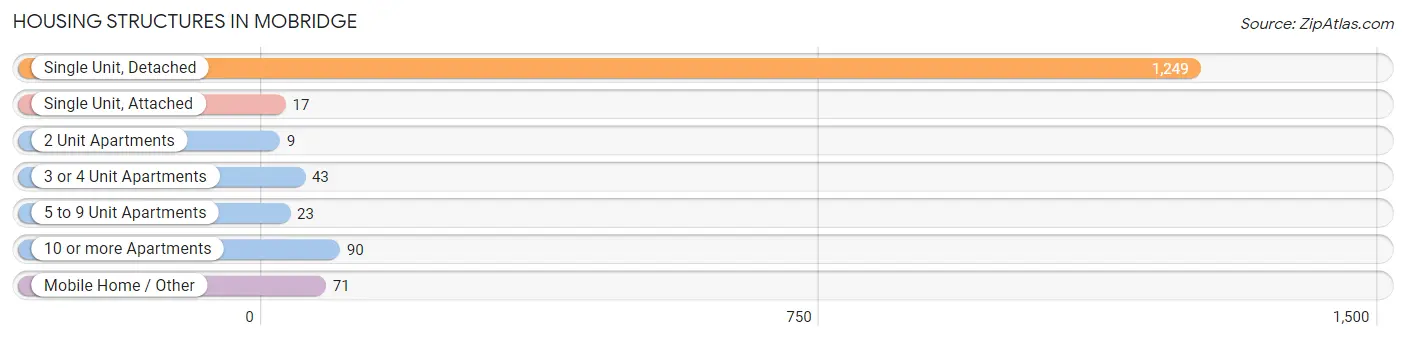
| Structure Type | # Housing Units | % Housing Units |
| Single Unit, Detached | 1,249 | 83.2% |
| Single Unit, Attached | 17 | 1.1% |
| 2 Unit Apartments | 9 | 0.6% |
| 3 or 4 Unit Apartments | 43 | 2.9% |
| 5 to 9 Unit Apartments | 23 | 1.5% |
| 10 or more Apartments | 90 | 6.0% |
| Mobile Home / Other | 71 | 4.7% |
| Total | 1,502 | 100.0% |
Housing Structures by Occupancy in Mobridge
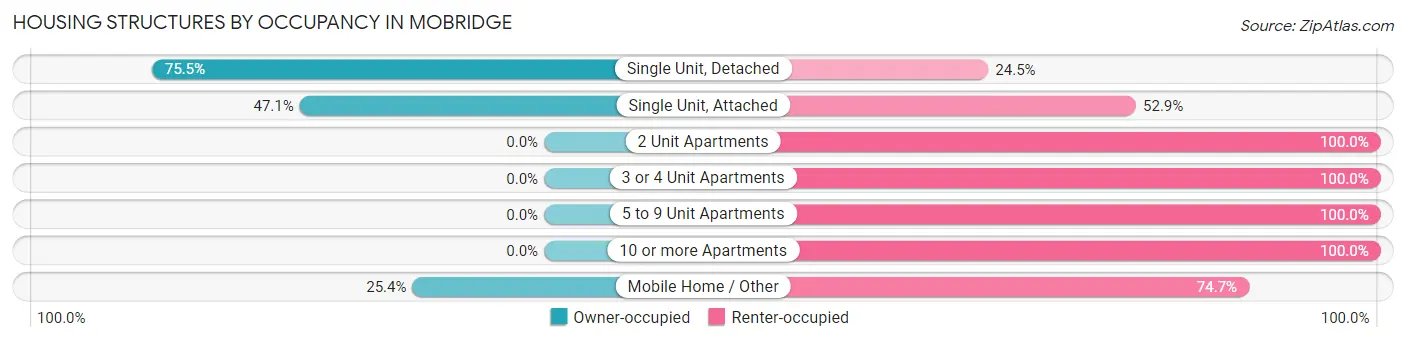
| Structure Type | Owner-occupied | Renter-occupied |
| Single Unit, Detached | 943 (75.5%) | 306 (24.5%) |
| Single Unit, Attached | 8 (47.1%) | 9 (52.9%) |
| 2 Unit Apartments | 0 (0.0%) | 9 (100.0%) |
| 3 or 4 Unit Apartments | 0 (0.0%) | 43 (100.0%) |
| 5 to 9 Unit Apartments | 0 (0.0%) | 23 (100.0%) |
| 10 or more Apartments | 0 (0.0%) | 90 (100.0%) |
| Mobile Home / Other | 18 (25.4%) | 53 (74.7%) |
| Total | 969 (64.5%) | 533 (35.5%) |
Housing Structures by Number of Rooms in Mobridge
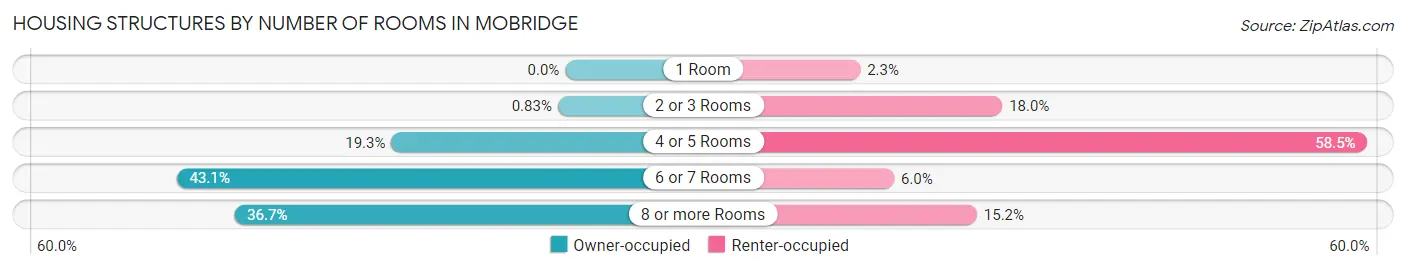
| Number of Rooms | Owner-occupied | Renter-occupied |
| 1 Room | 0 (0.0%) | 12 (2.2%) |
| 2 or 3 Rooms | 8 (0.8%) | 96 (18.0%) |
| 4 or 5 Rooms | 187 (19.3%) | 312 (58.5%) |
| 6 or 7 Rooms | 418 (43.1%) | 32 (6.0%) |
| 8 or more Rooms | 356 (36.7%) | 81 (15.2%) |
| Total | 969 (100.0%) | 533 (100.0%) |
Housing Structure by Heating Type in Mobridge
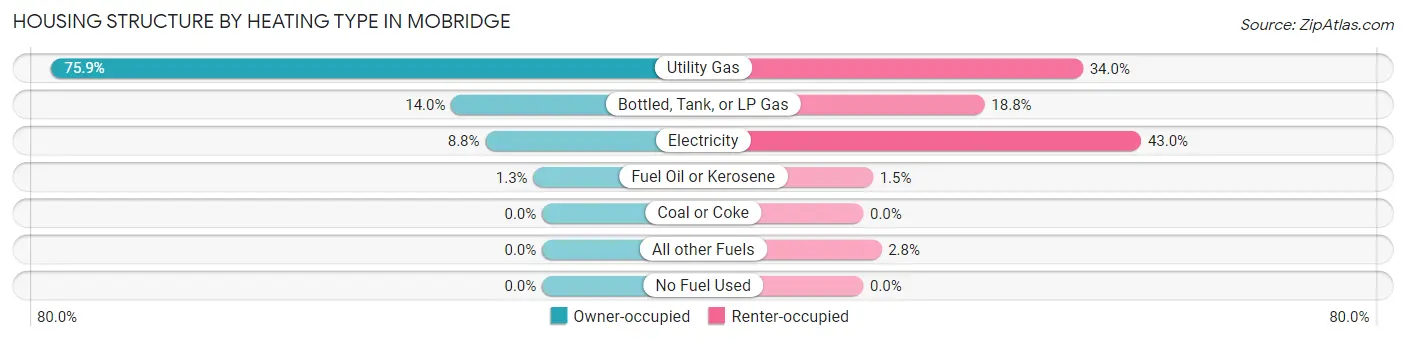
| Heating Type | Owner-occupied | Renter-occupied |
| Utility Gas | 735 (75.8%) | 181 (34.0%) |
| Bottled, Tank, or LP Gas | 136 (14.0%) | 100 (18.8%) |
| Electricity | 85 (8.8%) | 229 (43.0%) |
| Fuel Oil or Kerosene | 13 (1.3%) | 8 (1.5%) |
| Coal or Coke | 0 (0.0%) | 0 (0.0%) |
| All other Fuels | 0 (0.0%) | 15 (2.8%) |
| No Fuel Used | 0 (0.0%) | 0 (0.0%) |
| Total | 969 (100.0%) | 533 (100.0%) |
Household Vehicle Usage in Mobridge
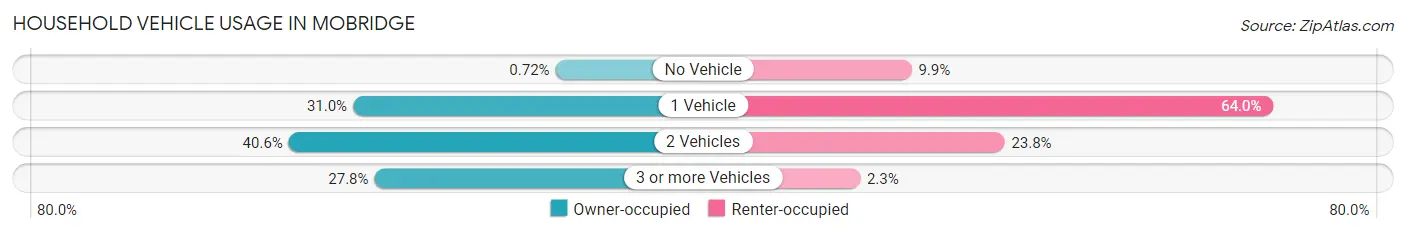
| Vehicles per Household | Owner-occupied | Renter-occupied |
| No Vehicle | 7 (0.7%) | 53 (9.9%) |
| 1 Vehicle | 300 (31.0%) | 341 (64.0%) |
| 2 Vehicles | 393 (40.6%) | 127 (23.8%) |
| 3 or more Vehicles | 269 (27.8%) | 12 (2.2%) |
| Total | 969 (100.0%) | 533 (100.0%) |
Real Estate & Mortgages in Mobridge
Real Estate and Mortgage Overview in Mobridge
| Characteristic | Without Mortgage | With Mortgage |
| Housing Units | 451 | 518 |
| Median Property Value | $96,100 | $139,800 |
| Median Household Income | $54,715 | $56 |
| Monthly Housing Costs | $486 | $11 |
| Real Estate Taxes | $1,806 | $0 |
Property Value by Mortgage Status in Mobridge
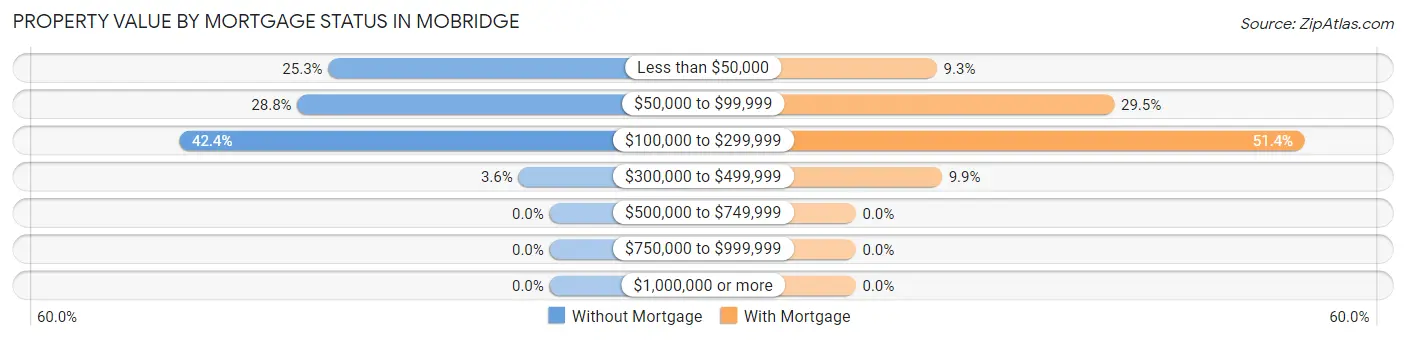
| Property Value | Without Mortgage | With Mortgage |
| Less than $50,000 | 114 (25.3%) | 48 (9.3%) |
| $50,000 to $99,999 | 130 (28.8%) | 153 (29.5%) |
| $100,000 to $299,999 | 191 (42.3%) | 266 (51.3%) |
| $300,000 to $499,999 | 16 (3.5%) | 51 (9.9%) |
| $500,000 to $749,999 | 0 (0.0%) | 0 (0.0%) |
| $750,000 to $999,999 | 0 (0.0%) | 0 (0.0%) |
| $1,000,000 or more | 0 (0.0%) | 0 (0.0%) |
| Total | 451 (100.0%) | 518 (100.0%) |
Household Income by Mortgage Status in Mobridge
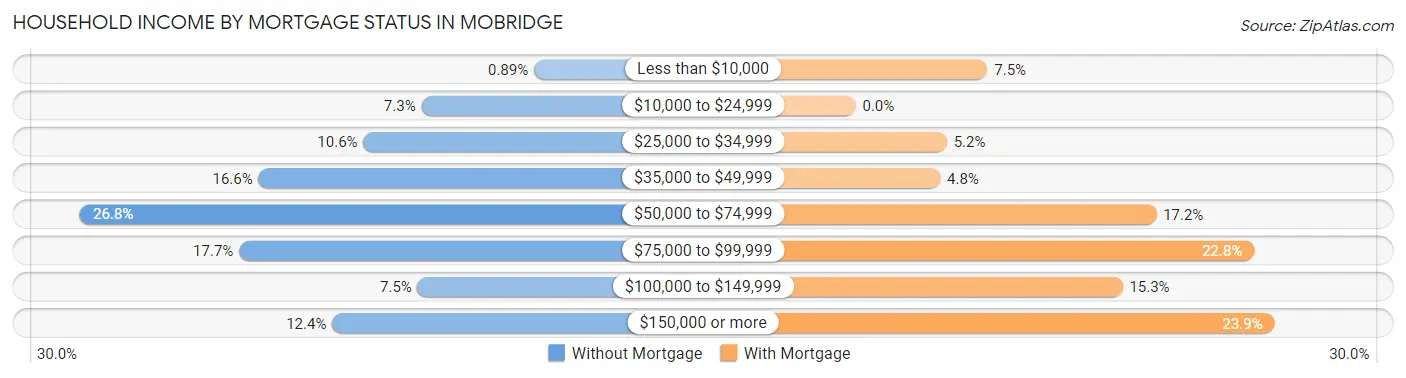
| Household Income | Without Mortgage | With Mortgage |
| Less than $10,000 | 4 (0.9%) | 39 (7.5%) |
| $10,000 to $24,999 | 33 (7.3%) | 0 (0.0%) |
| $25,000 to $34,999 | 48 (10.6%) | 27 (5.2%) |
| $35,000 to $49,999 | 75 (16.6%) | 25 (4.8%) |
| $50,000 to $74,999 | 121 (26.8%) | 89 (17.2%) |
| $75,000 to $99,999 | 80 (17.7%) | 118 (22.8%) |
| $100,000 to $149,999 | 34 (7.5%) | 79 (15.2%) |
| $150,000 or more | 56 (12.4%) | 124 (23.9%) |
| Total | 451 (100.0%) | 518 (100.0%) |
Property Value to Household Income Ratio in Mobridge
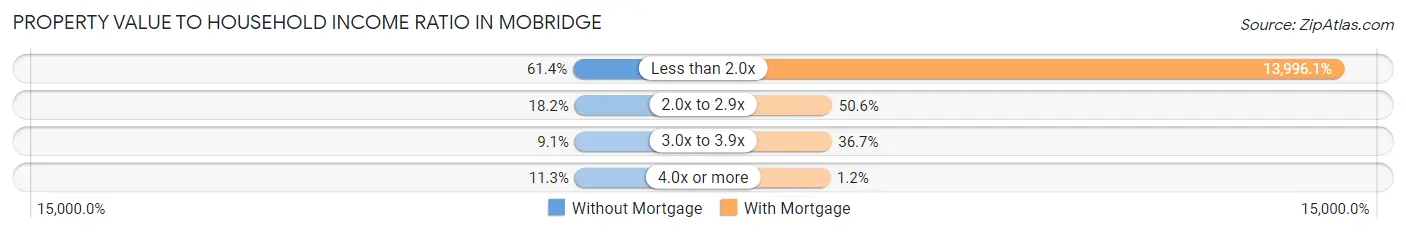
| Value-to-Income Ratio | Without Mortgage | With Mortgage |
| Less than 2.0x | 277 (61.4%) | 72,500 (13,996.1%) |
| 2.0x to 2.9x | 82 (18.2%) | 262 (50.6%) |
| 3.0x to 3.9x | 41 (9.1%) | 190 (36.7%) |
| 4.0x or more | 51 (11.3%) | 6 (1.2%) |
| Total | 451 (100.0%) | 518 (100.0%) |
Real Estate Taxes by Mortgage Status in Mobridge
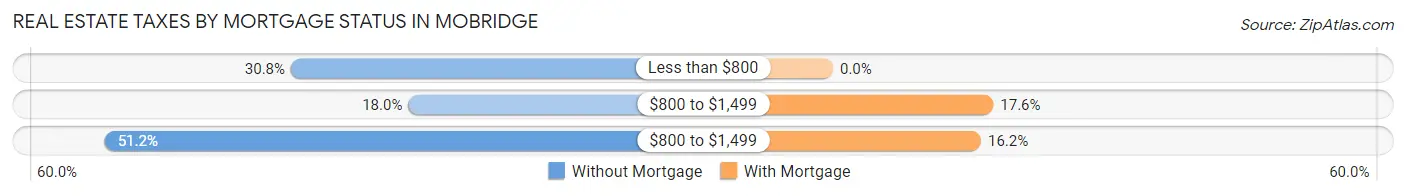
| Property Taxes | Without Mortgage | With Mortgage |
| Less than $800 | 139 (30.8%) | 0 (0.0%) |
| $800 to $1,499 | 81 (18.0%) | 91 (17.6%) |
| $800 to $1,499 | 231 (51.2%) | 84 (16.2%) |
| Total | 451 (100.0%) | 518 (100.0%) |
Health & Disability in Mobridge
Health Insurance Coverage by Age in Mobridge
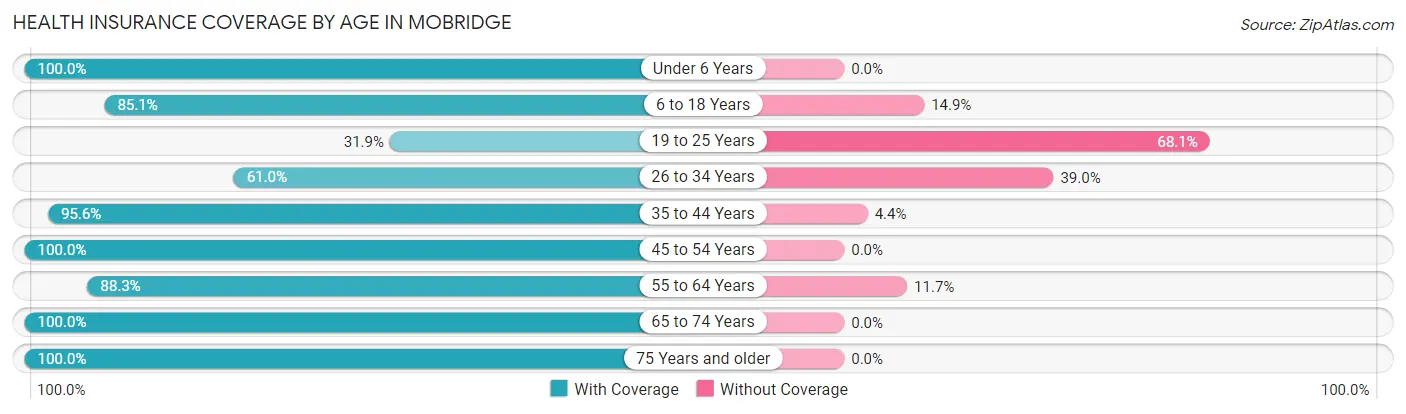
| Age Bracket | With Coverage | Without Coverage |
| Under 6 Years | 251 (100.0%) | 0 (0.0%) |
| 6 to 18 Years | 377 (85.1%) | 66 (14.9%) |
| 19 to 25 Years | 37 (31.9%) | 79 (68.1%) |
| 26 to 34 Years | 222 (61.0%) | 142 (39.0%) |
| 35 to 44 Years | 461 (95.6%) | 21 (4.4%) |
| 45 to 54 Years | 223 (100.0%) | 0 (0.0%) |
| 55 to 64 Years | 452 (88.3%) | 60 (11.7%) |
| 65 to 74 Years | 377 (100.0%) | 0 (0.0%) |
| 75 Years and older | 317 (100.0%) | 0 (0.0%) |
| Total | 2,717 (88.1%) | 368 (11.9%) |
Health Insurance Coverage by Citizenship Status in Mobridge
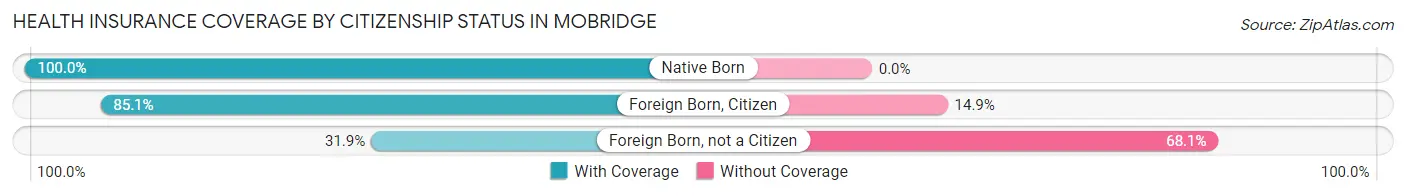
| Citizenship Status | With Coverage | Without Coverage |
| Native Born | 251 (100.0%) | 0 (0.0%) |
| Foreign Born, Citizen | 377 (85.1%) | 66 (14.9%) |
| Foreign Born, not a Citizen | 37 (31.9%) | 79 (68.1%) |
Health Insurance Coverage by Household Income in Mobridge
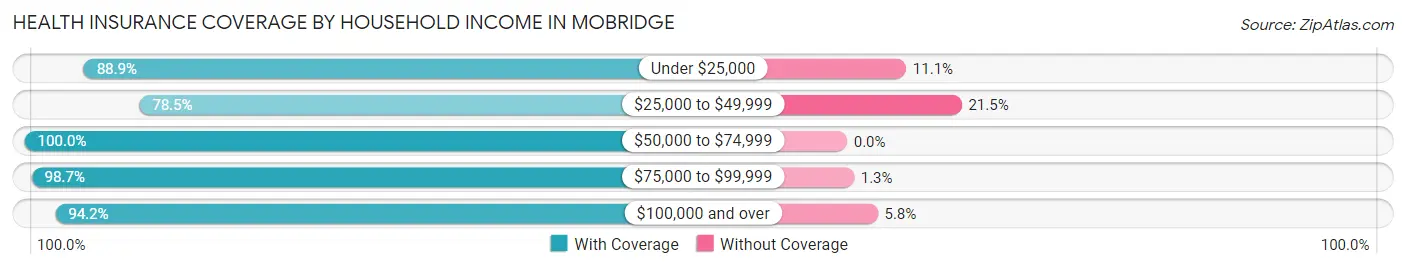
| Household Income | With Coverage | Without Coverage |
| Under $25,000 | 281 (88.9%) | 35 (11.1%) |
| $25,000 to $49,999 | 621 (78.5%) | 170 (21.5%) |
| $50,000 to $74,999 | 405 (100.0%) | 0 (0.0%) |
| $75,000 to $99,999 | 603 (98.7%) | 8 (1.3%) |
| $100,000 and over | 786 (94.2%) | 48 (5.8%) |
Public vs Private Health Insurance Coverage by Age in Mobridge
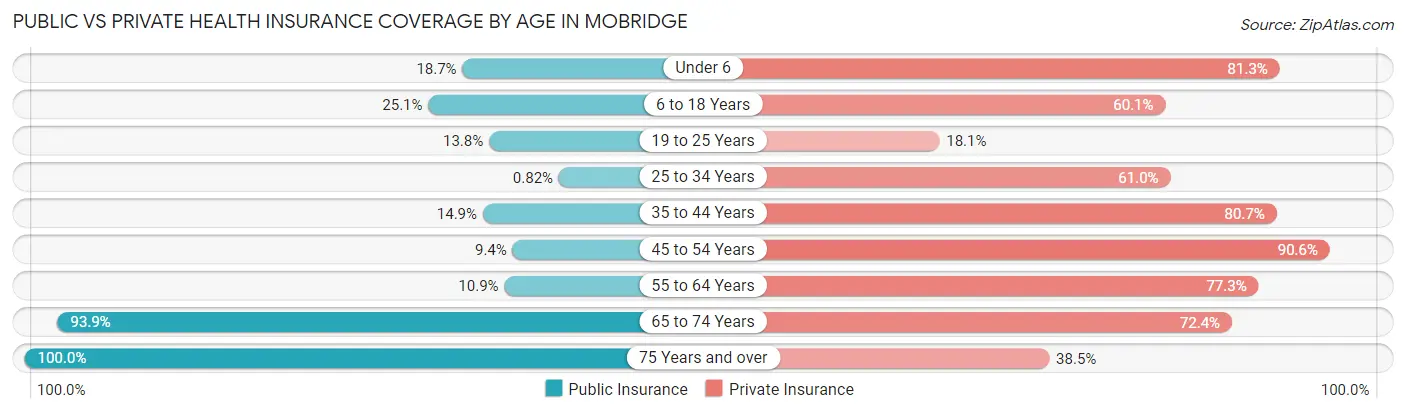
| Age Bracket | Public Insurance | Private Insurance |
| Under 6 | 47 (18.7%) | 204 (81.3%) |
| 6 to 18 Years | 111 (25.1%) | 266 (60.1%) |
| 19 to 25 Years | 16 (13.8%) | 21 (18.1%) |
| 25 to 34 Years | 3 (0.8%) | 222 (61.0%) |
| 35 to 44 Years | 72 (14.9%) | 389 (80.7%) |
| 45 to 54 Years | 21 (9.4%) | 202 (90.6%) |
| 55 to 64 Years | 56 (10.9%) | 396 (77.3%) |
| 65 to 74 Years | 354 (93.9%) | 273 (72.4%) |
| 75 Years and over | 317 (100.0%) | 122 (38.5%) |
| Total | 997 (32.3%) | 2,095 (67.9%) |
Disability Status by Sex by Age in Mobridge
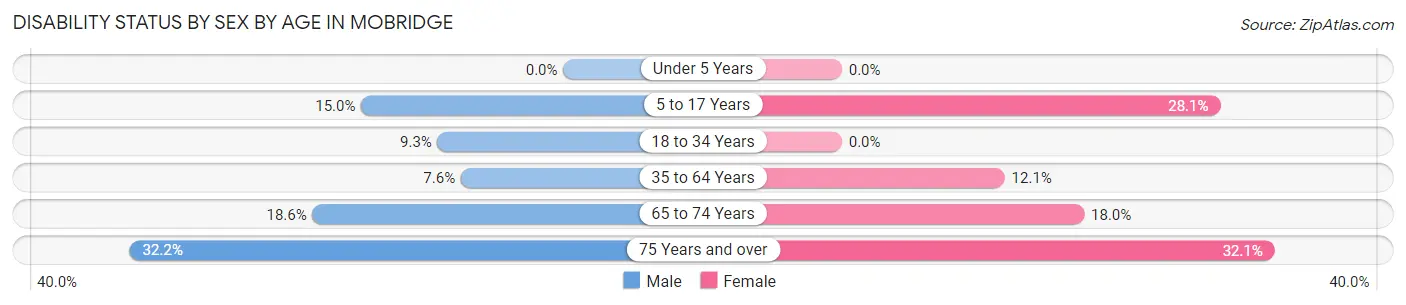
| Age Bracket | Male | Female |
| Under 5 Years | 0 (0.0%) | 0 (0.0%) |
| 5 to 17 Years | 33 (15.0%) | 68 (28.1%) |
| 18 to 34 Years | 25 (9.3%) | 0 (0.0%) |
| 35 to 64 Years | 46 (7.6%) | 74 (12.1%) |
| 65 to 74 Years | 35 (18.6%) | 34 (18.0%) |
| 75 Years and over | 48 (32.2%) | 54 (32.1%) |
Disability Class by Sex by Age in Mobridge
Disability Class: Hearing Difficulty
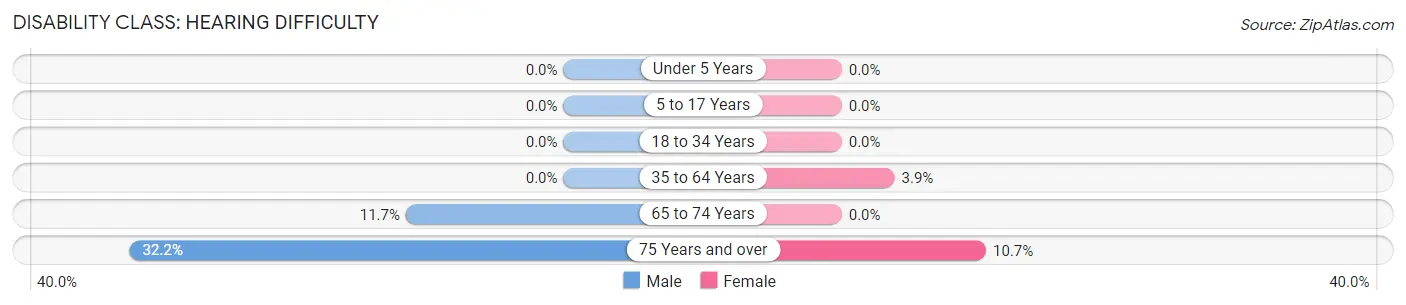
| Age Bracket | Male | Female |
| Under 5 Years | 0 (0.0%) | 0 (0.0%) |
| 5 to 17 Years | 0 (0.0%) | 0 (0.0%) |
| 18 to 34 Years | 0 (0.0%) | 0 (0.0%) |
| 35 to 64 Years | 0 (0.0%) | 24 (3.9%) |
| 65 to 74 Years | 22 (11.7%) | 0 (0.0%) |
| 75 Years and over | 48 (32.2%) | 18 (10.7%) |
Disability Class: Vision Difficulty
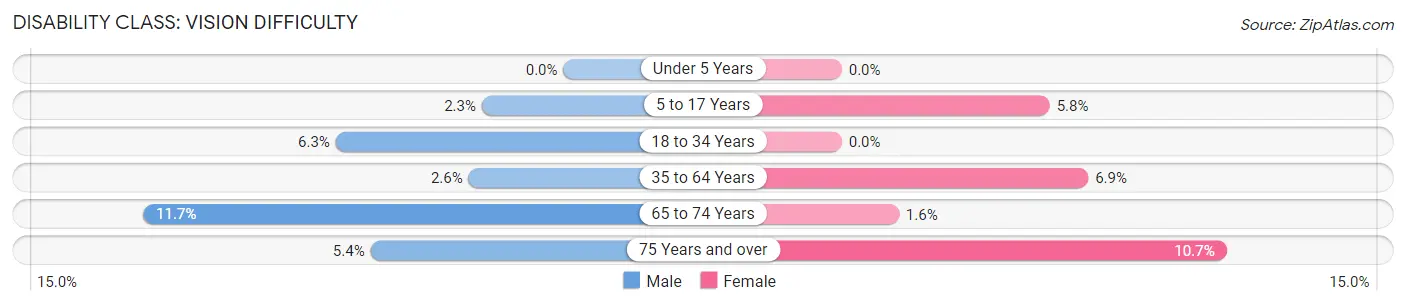
| Age Bracket | Male | Female |
| Under 5 Years | 0 (0.0%) | 0 (0.0%) |
| 5 to 17 Years | 5 (2.3%) | 14 (5.8%) |
| 18 to 34 Years | 17 (6.3%) | 0 (0.0%) |
| 35 to 64 Years | 16 (2.6%) | 42 (6.9%) |
| 65 to 74 Years | 22 (11.7%) | 3 (1.6%) |
| 75 Years and over | 8 (5.4%) | 18 (10.7%) |
Disability Class: Cognitive Difficulty
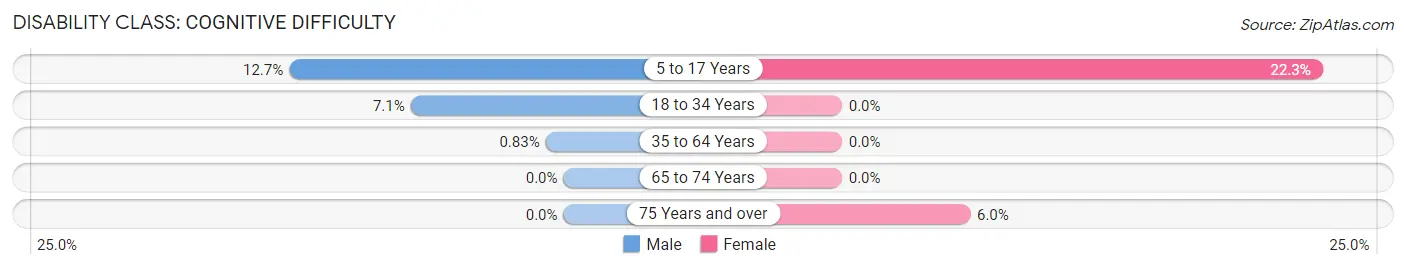
| Age Bracket | Male | Female |
| 5 to 17 Years | 28 (12.7%) | 54 (22.3%) |
| 18 to 34 Years | 19 (7.1%) | 0 (0.0%) |
| 35 to 64 Years | 5 (0.8%) | 0 (0.0%) |
| 65 to 74 Years | 0 (0.0%) | 0 (0.0%) |
| 75 Years and over | 0 (0.0%) | 10 (5.9%) |
Disability Class: Ambulatory Difficulty
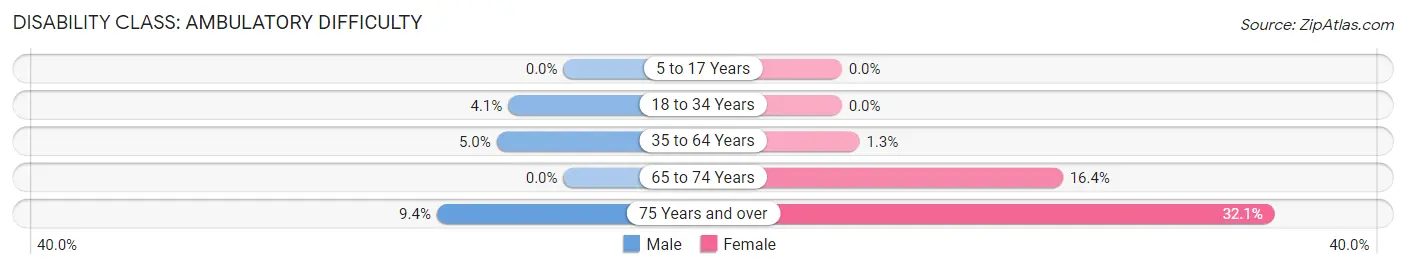
| Age Bracket | Male | Female |
| 5 to 17 Years | 0 (0.0%) | 0 (0.0%) |
| 18 to 34 Years | 11 (4.1%) | 0 (0.0%) |
| 35 to 64 Years | 30 (5.0%) | 8 (1.3%) |
| 65 to 74 Years | 0 (0.0%) | 31 (16.4%) |
| 75 Years and over | 14 (9.4%) | 54 (32.1%) |
Disability Class: Self-Care Difficulty
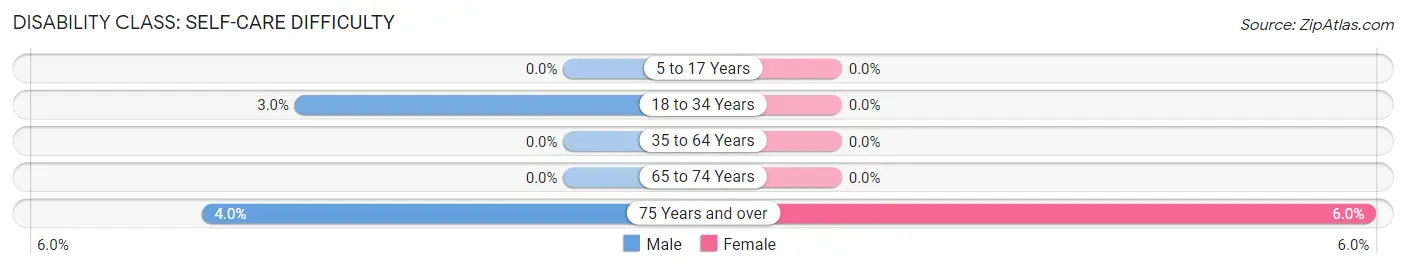
| Age Bracket | Male | Female |
| 5 to 17 Years | 0 (0.0%) | 0 (0.0%) |
| 18 to 34 Years | 8 (3.0%) | 0 (0.0%) |
| 35 to 64 Years | 0 (0.0%) | 0 (0.0%) |
| 65 to 74 Years | 0 (0.0%) | 0 (0.0%) |
| 75 Years and over | 6 (4.0%) | 10 (5.9%) |
Technology Access in Mobridge
Computing Device Access in Mobridge
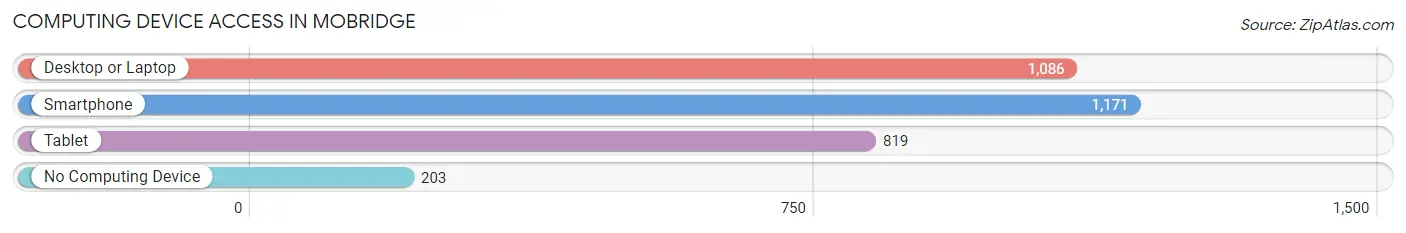
| Device Type | # Households | % Households |
| Desktop or Laptop | 1,086 | 72.3% |
| Smartphone | 1,171 | 78.0% |
| Tablet | 819 | 54.5% |
| No Computing Device | 203 | 13.5% |
| Total | 1,502 | 100.0% |
Internet Access in Mobridge
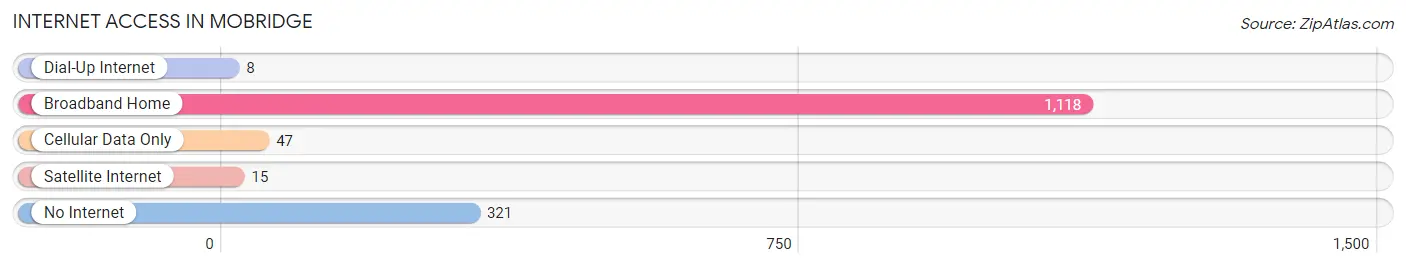
| Internet Type | # Households | % Households |
| Dial-Up Internet | 8 | 0.5% |
| Broadband Home | 1,118 | 74.4% |
| Cellular Data Only | 47 | 3.1% |
| Satellite Internet | 15 | 1.0% |
| No Internet | 321 | 21.4% |
| Total | 1,502 | 100.0% |
Mobridge Summary
History
The city of Mobridge, South Dakota is located in the north-central part of the state, along the Missouri River. It is the county seat of Walworth County and is the largest city in the county. The city was founded in 1881 and was named after the Native American chief, Mobridge. The city was originally a trading post for the Sioux and Cheyenne tribes, and was later a major stop on the Great Northern Railroad.
The city of Mobridge has a rich history of Native American culture and has been home to many different tribes over the years. The Sioux, Cheyenne, and Arapaho tribes all had a presence in the area. The city was also home to the Mobridge Indian School, which was established in 1884 and served as a boarding school for Native American children.
The city of Mobridge has also been home to many different industries over the years. The city was a major stop on the Great Northern Railroad, and the railroad was a major employer in the area. The city also had a large agricultural industry, with many farmers and ranchers in the area. The city also had a large lumber industry, with many sawmills in the area.
Geography
Mobridge is located in the north-central part of South Dakota, along the Missouri River. The city is located in Walworth County and is the largest city in the county. The city is located at an elevation of 1,845 feet above sea level. The city has a total area of 4.2 square miles, with 0.2 square miles of water.
The city of Mobridge is located in a semi-arid climate, with hot summers and cold winters. The average temperature in the summer is around 80 degrees Fahrenheit, and the average temperature in the winter is around 20 degrees Fahrenheit. The city receives an average of 16 inches of precipitation per year.
Economy
The economy of Mobridge is largely based on agriculture and tourism. The city is home to many farms and ranches, and the agricultural industry is a major employer in the area. The city also has a large tourism industry, with many visitors coming to the area to enjoy the natural beauty of the Missouri River.
The city also has a large manufacturing industry, with many factories in the area. The city is home to several large companies, including Mobridge Manufacturing, which produces a variety of products, including furniture, clothing, and automotive parts. The city also has a large retail industry, with many stores and restaurants in the area.
Demographics
As of the 2010 census, the city of Mobridge had a population of 3,465. The population is made up of a variety of ethnicities, with the largest being Native American (45.3%), White (37.2%), and Hispanic (7.2%). The median household income in the city is $37,917, and the median home value is $90,000. The city has a poverty rate of 17.3%.
The city of Mobridge is served by the Mobridge-Pollock School District, which includes two elementary schools, one middle school, and one high school. The city also has a public library, a hospital, and several parks. The city is also home to several churches, including the First United Methodist Church, the First Presbyterian Church, and the First Baptist Church.
Common Questions
What is Per Capita Income in Mobridge?
Per Capita income in Mobridge is $34,232.
What is the Median Family Income in Mobridge?
Median Family Income in Mobridge is $75,000.
What is the Median Household income in Mobridge?
Median Household Income in Mobridge is $54,868.
What is Income or Wage Gap in Mobridge?
Income or Wage Gap in Mobridge is 21.4%.
Women in Mobridge earn 78.6 cents for every dollar earned by a man.
What is Family Income Deficit in Mobridge?
Family Income Deficit in Mobridge is $9,945.
Families that are below poverty line in Mobridge earn $9,945 less on average than the poverty threshold level.
What is Inequality or Gini Index in Mobridge?
Inequality or Gini Index in Mobridge is 0.37.
What is the Total Population of Mobridge?
Total Population of Mobridge is 3,130.
What is the Total Male Population of Mobridge?
Total Male Population of Mobridge is 1,533.
What is the Total Female Population of Mobridge?
Total Female Population of Mobridge is 1,597.
What is the Ratio of Males per 100 Females in Mobridge?
There are 95.99 Males per 100 Females in Mobridge.
What is the Ratio of Females per 100 Males in Mobridge?
There are 104.17 Females per 100 Males in Mobridge.
What is the Median Population Age in Mobridge?
Median Population Age in Mobridge is 42.4 Years.
What is the Average Family Size in Mobridge
Average Family Size in Mobridge is 2.5 People.
What is the Average Household Size in Mobridge
Average Household Size in Mobridge is 2.0 People.
How Large is the Labor Force in Mobridge?
There are 1,686 People in the Labor Forcein in Mobridge.
What is the Percentage of People in the Labor Force in Mobridge?
67.0% of People are in the Labor Force in Mobridge.
What is the Unemployment Rate in Mobridge?
Unemployment Rate in Mobridge is 1.4%.