Cities with the Largest French Community in South Dakota
RELATED REPORTS & OPTIONS
French
South Dakota
Compare Cities
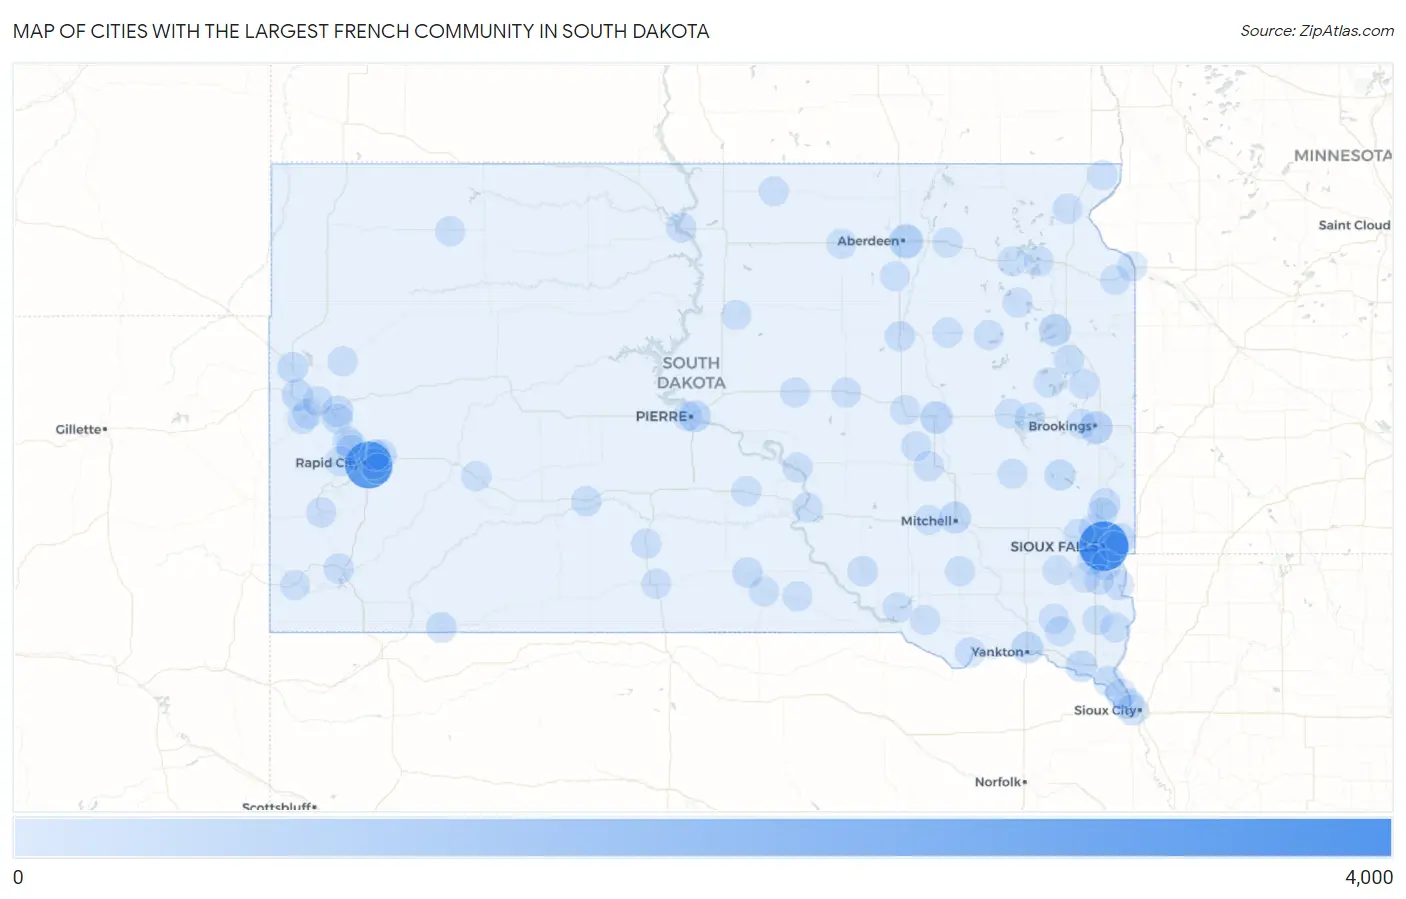
Map of Cities with the Largest French Community in South Dakota
0
4,000
Cities with the Largest French Community in South Dakota
| City | French | vs State | vs National | |
| 1. | Sioux Falls | 3,350 | 17,454(19.19%)#1 | 6,841,915(0.05%)#157 |
| 2. | Rapid City | 2,893 | 17,454(16.57%)#2 | 6,841,915(0.04%)#202 |
| 3. | Aberdeen | 642 | 17,454(3.68%)#3 | 6,841,915(0.01%)#1,501 |
| 4. | Brookings | 469 | 17,454(2.69%)#4 | 6,841,915(0.01%)#2,053 |
| 5. | Huron | 375 | 17,454(2.15%)#5 | 6,841,915(0.01%)#2,497 |
| 6. | Watertown | 343 | 17,454(1.97%)#6 | 6,841,915(0.01%)#2,709 |
| 7. | Mitchell | 297 | 17,454(1.70%)#7 | 6,841,915(0.00%)#3,054 |
| 8. | Yankton | 279 | 17,454(1.60%)#8 | 6,841,915(0.00%)#3,229 |
| 9. | Pierre | 265 | 17,454(1.52%)#9 | 6,841,915(0.00%)#3,361 |
| 10. | Vermillion | 250 | 17,454(1.43%)#10 | 6,841,915(0.00%)#3,507 |
| 11. | Sturgis | 243 | 17,454(1.39%)#11 | 6,841,915(0.00%)#3,604 |
| 12. | Spearfish | 216 | 17,454(1.24%)#12 | 6,841,915(0.00%)#3,947 |
| 13. | Madison | 171 | 17,454(0.98%)#13 | 6,841,915(0.00%)#4,640 |
| 14. | Box Elder | 169 | 17,454(0.97%)#14 | 6,841,915(0.00%)#4,668 |
| 15. | Brandon | 165 | 17,454(0.95%)#15 | 6,841,915(0.00%)#4,746 |
| 16. | Dakota Dunes | 164 | 17,454(0.94%)#16 | 6,841,915(0.00%)#4,782 |
| 17. | Belle Fourche | 163 | 17,454(0.93%)#17 | 6,841,915(0.00%)#4,791 |
| 18. | Rapid Valley | 156 | 17,454(0.89%)#18 | 6,841,915(0.00%)#4,935 |
| 19. | Ashland Heights | 152 | 17,454(0.87%)#19 | 6,841,915(0.00%)#5,047 |
| 20. | Dell Rapids | 142 | 17,454(0.81%)#20 | 6,841,915(0.00%)#5,276 |
| 21. | Pine Ridge | 108 | 17,454(0.62%)#21 | 6,841,915(0.00%)#6,197 |
| 22. | Harrisburg | 101 | 17,454(0.58%)#22 | 6,841,915(0.00%)#6,432 |
| 23. | Winner | 99 | 17,454(0.57%)#23 | 6,841,915(0.00%)#6,529 |
| 24. | North Sioux City | 98 | 17,454(0.56%)#24 | 6,841,915(0.00%)#6,573 |
| 25. | Platte | 82 | 17,454(0.47%)#25 | 6,841,915(0.00%)#7,282 |
| 26. | Redfield | 77 | 17,454(0.44%)#26 | 6,841,915(0.00%)#7,506 |
| 27. | Canton | 73 | 17,454(0.42%)#27 | 6,841,915(0.00%)#7,708 |
| 28. | Hot Springs | 71 | 17,454(0.41%)#28 | 6,841,915(0.00%)#7,826 |
| 29. | Mountain Plains | 67 | 17,454(0.38%)#29 | 6,841,915(0.00%)#8,120 |
| 30. | Mobridge | 65 | 17,454(0.37%)#30 | 6,841,915(0.00%)#8,202 |
| 31. | Blucksberg Mountain | 65 | 17,454(0.37%)#31 | 6,841,915(0.00%)#8,238 |
| 32. | Elk Point | 52 | 17,454(0.30%)#32 | 6,841,915(0.00%)#9,169 |
| 33. | Jefferson | 51 | 17,454(0.29%)#33 | 6,841,915(0.00%)#9,297 |
| 34. | Springfield | 50 | 17,454(0.29%)#34 | 6,841,915(0.00%)#9,347 |
| 35. | Green Valley | 47 | 17,454(0.27%)#35 | 6,841,915(0.00%)#9,639 |
| 36. | Hartford | 45 | 17,454(0.26%)#36 | 6,841,915(0.00%)#9,785 |
| 37. | Belvidere | 45 | 17,454(0.26%)#37 | 6,841,915(0.00%)#9,869 |
| 38. | Lead | 44 | 17,454(0.25%)#38 | 6,841,915(0.00%)#9,904 |
| 39. | Castlewood | 44 | 17,454(0.25%)#39 | 6,841,915(0.00%)#9,973 |
| 40. | Custer | 41 | 17,454(0.23%)#40 | 6,841,915(0.00%)#10,260 |
| 41. | Woonsocket | 40 | 17,454(0.23%)#41 | 6,841,915(0.00%)#10,415 |
| 42. | Tea | 39 | 17,454(0.22%)#42 | 6,841,915(0.00%)#10,439 |
| 43. | Gregory | 38 | 17,454(0.22%)#43 | 6,841,915(0.00%)#10,621 |
| 44. | Crooks | 35 | 17,454(0.20%)#44 | 6,841,915(0.00%)#10,968 |
| 45. | Pine Lakes Addition | 34 | 17,454(0.19%)#45 | 6,841,915(0.00%)#11,150 |
| 46. | Edgemont | 33 | 17,454(0.19%)#46 | 6,841,915(0.00%)#11,276 |
| 47. | Summerset | 32 | 17,454(0.18%)#47 | 6,841,915(0.00%)#11,355 |
| 48. | Webster | 32 | 17,454(0.18%)#48 | 6,841,915(0.00%)#11,389 |
| 49. | Sisseton | 31 | 17,454(0.18%)#49 | 6,841,915(0.00%)#11,526 |
| 50. | Fort Pierre | 31 | 17,454(0.18%)#50 | 6,841,915(0.00%)#11,529 |
| 51. | Clark | 31 | 17,454(0.18%)#51 | 6,841,915(0.00%)#11,579 |
| 52. | Piedmont | 31 | 17,454(0.18%)#52 | 6,841,915(0.00%)#11,581 |
| 53. | Doland | 30 | 17,454(0.17%)#53 | 6,841,915(0.00%)#11,780 |
| 54. | Johnson Siding | 29 | 17,454(0.17%)#54 | 6,841,915(0.00%)#11,923 |
| 55. | Wolsey | 28 | 17,454(0.16%)#55 | 6,841,915(0.00%)#12,104 |
| 56. | Alpena | 27 | 17,454(0.15%)#56 | 6,841,915(0.00%)#12,292 |
| 57. | Lennox | 26 | 17,454(0.15%)#57 | 6,841,915(0.00%)#12,328 |
| 58. | Miller | 26 | 17,454(0.15%)#58 | 6,841,915(0.00%)#12,389 |
| 59. | Lake Andes | 26 | 17,454(0.15%)#59 | 6,841,915(0.00%)#12,410 |
| 60. | Baltic | 25 | 17,454(0.14%)#60 | 6,841,915(0.00%)#12,571 |
| 61. | Wall | 25 | 17,454(0.14%)#61 | 6,841,915(0.00%)#12,634 |
| 62. | Parkston | 24 | 17,454(0.14%)#62 | 6,841,915(0.00%)#12,750 |
| 63. | Estelline | 24 | 17,454(0.14%)#63 | 6,841,915(0.00%)#12,810 |
| 64. | Irene | 23 | 17,454(0.13%)#64 | 6,841,915(0.00%)#13,042 |
| 65. | Bison | 23 | 17,454(0.13%)#65 | 6,841,915(0.00%)#13,056 |
| 66. | Wakonda | 23 | 17,454(0.13%)#66 | 6,841,915(0.00%)#13,060 |
| 67. | Rosholt | 23 | 17,454(0.13%)#67 | 6,841,915(0.00%)#13,062 |
| 68. | Beresford | 22 | 17,454(0.13%)#68 | 6,841,915(0.00%)#13,130 |
| 69. | Volga | 22 | 17,454(0.13%)#69 | 6,841,915(0.00%)#13,144 |
| 70. | Deadwood | 22 | 17,454(0.13%)#70 | 6,841,915(0.00%)#13,171 |
| 71. | Gettysburg | 20 | 17,454(0.11%)#71 | 6,841,915(0.00%)#13,609 |
| 72. | Ipswich | 20 | 17,454(0.11%)#72 | 6,841,915(0.00%)#13,627 |
| 73. | Alcester | 20 | 17,454(0.11%)#73 | 6,841,915(0.00%)#13,647 |
| 74. | Howard | 20 | 17,454(0.11%)#74 | 6,841,915(0.00%)#13,650 |
| 75. | Big Stone City | 20 | 17,454(0.11%)#75 | 6,841,915(0.00%)#13,667 |
| 76. | Mansfield | 20 | 17,454(0.11%)#76 | 6,841,915(0.00%)#13,741 |
| 77. | Worthing | 19 | 17,454(0.11%)#77 | 6,841,915(0.00%)#13,902 |
| 78. | Lake Norden | 19 | 17,454(0.11%)#78 | 6,841,915(0.00%)#13,934 |
| 79. | Wallace | 19 | 17,454(0.11%)#79 | 6,841,915(0.00%)#14,011 |
| 80. | Highmore | 18 | 17,454(0.10%)#80 | 6,841,915(0.00%)#14,167 |
| 81. | Colome | 18 | 17,454(0.10%)#81 | 6,841,915(0.00%)#14,220 |
| 82. | Chamberlain | 17 | 17,454(0.10%)#82 | 6,841,915(0.00%)#14,296 |
| 83. | Eureka | 17 | 17,454(0.10%)#83 | 6,841,915(0.00%)#14,408 |
| 84. | Wagner | 16 | 17,454(0.09%)#84 | 6,841,915(0.00%)#14,601 |
| 85. | Parker | 16 | 17,454(0.09%)#85 | 6,841,915(0.00%)#14,639 |
| 86. | Whitewood | 16 | 17,454(0.09%)#86 | 6,841,915(0.00%)#14,672 |
| 87. | Boulder Canyon | 16 | 17,454(0.09%)#87 | 6,841,915(0.00%)#14,720 |
| 88. | Newell | 16 | 17,454(0.09%)#88 | 6,841,915(0.00%)#14,731 |
| 89. | Mount Vernon | 16 | 17,454(0.09%)#89 | 6,841,915(0.00%)#14,732 |
| 90. | Blackhawk | 15 | 17,454(0.09%)#90 | 6,841,915(0.00%)#14,833 |
| 91. | De Smet | 15 | 17,454(0.09%)#91 | 6,841,915(0.00%)#14,944 |
| 92. | White River | 15 | 17,454(0.09%)#92 | 6,841,915(0.00%)#14,993 |
| 93. | Lake Preston | 15 | 17,454(0.09%)#93 | 6,841,915(0.00%)#15,015 |
| 94. | Milbank | 14 | 17,454(0.08%)#94 | 6,841,915(0.00%)#15,124 |
| 95. | Mission | 14 | 17,454(0.08%)#95 | 6,841,915(0.00%)#15,202 |
| 96. | Fort Thompson | 14 | 17,454(0.08%)#96 | 6,841,915(0.00%)#15,217 |
| 97. | Waubay | 14 | 17,454(0.08%)#97 | 6,841,915(0.00%)#15,343 |
| 98. | Oahe Acres | 14 | 17,454(0.08%)#98 | 6,841,915(0.00%)#15,345 |
| 99. | Kennebec | 14 | 17,454(0.08%)#99 | 6,841,915(0.00%)#15,351 |
| 100. | Groton | 13 | 17,454(0.07%)#100 | 6,841,915(0.00%)#15,499 |
Common Questions
What are the Top 10 Cities with the Largest French Community in South Dakota?
Top 10 Cities with the Largest French Community in South Dakota are:
#1
3,350
#2
2,893
#3
642
#4
469
#5
375
#6
343
#7
297
#8
279
#9
265
#10
250
What city has the Largest French Community in South Dakota?
Sioux Falls has the Largest French Community in South Dakota with 3,350.
What is the Total French Population in the State of South Dakota?
Total French Population in South Dakota is 17,454.
What is the Total French Population in the United States?
Total French Population in the United States is 6,841,915.