Mission, SD Map & Demographics
Mission Map
Mission Overview
$14,568
PER CAPITA INCOME
$34,375
AVG FAMILY INCOME
$36,607
AVG HOUSEHOLD INCOME
22.7%
WAGE / INCOME GAP [ % ]
77.3¢/ $1
WAGE / INCOME GAP [ $ ]
$16,980
FAMILY INCOME DEFICIT
0.48
INEQUALITY / GINI INDEX
1,256
TOTAL POPULATION
595
MALE POPULATION
661
FEMALE POPULATION
90.02
MALES / 100 FEMALES
111.09
FEMALES / 100 MALES
22.1
MEDIAN AGE
4.1
AVG FAMILY SIZE
3.3
AVG HOUSEHOLD SIZE
437
LABOR FORCE [ PEOPLE ]
58.0%
PERCENT IN LABOR FORCE
17.4%
UNEMPLOYMENT RATE
Mission Zip Codes
Mission Area Codes
Income in Mission
Income Overview in Mission
Per Capita Income in Mission is $14,568, while median incomes of families and households are $34,375 and $36,607 respectively.
| Characteristic | Number | Measure |
| Per Capita Income | 1,256 | $14,568 |
| Median Family Income | 257 | $34,375 |
| Mean Family Income | 257 | $42,570 |
| Median Household Income | 375 | $36,607 |
| Mean Household Income | 375 | $43,367 |
| Income Deficit | 257 | $16,980 |
| Wage / Income Gap (%) | 1,256 | 22.72% |
| Wage / Income Gap ($) | 1,256 | 77.28¢ per $1 |
| Gini / Inequality Index | 1,256 | 0.48 |
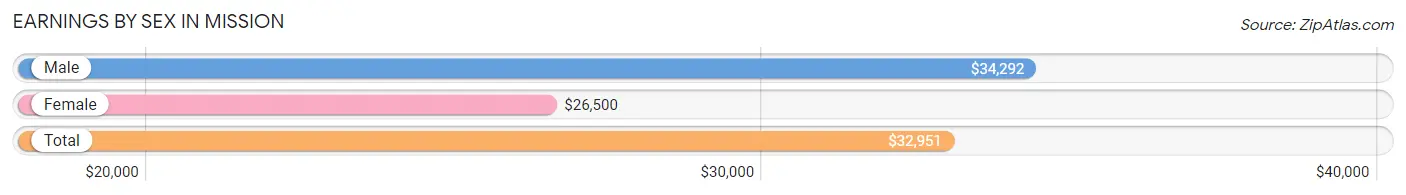
Earnings by Sex in Mission
Average Earnings in Mission are $32,951, $34,292 for men and $26,500 for women, a difference of 22.7%.
| Sex | Number | Average Earnings |
| Male | 219 (50.1%) | $34,292 |
| Female | 218 (49.9%) | $26,500 |
| Total | 437 (100.0%) | $32,951 |
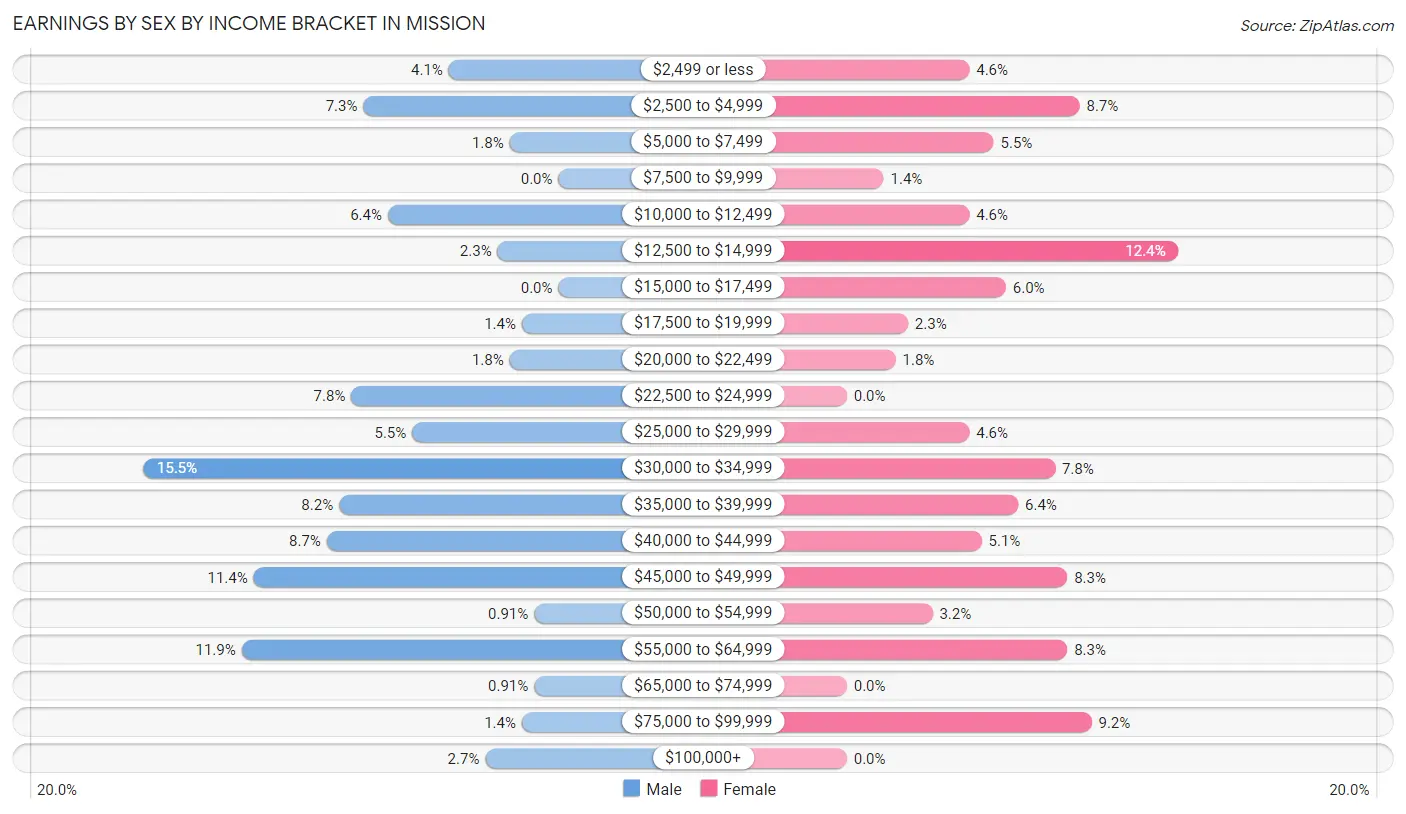
Earnings by Sex by Income Bracket in Mission
The most common earnings brackets in Mission are $30,000 to $34,999 for men (34 | 15.5%) and $12,500 to $14,999 for women (27 | 12.4%).
| Income | Male | Female |
| $2,499 or less | 9 (4.1%) | 10 (4.6%) |
| $2,500 to $4,999 | 16 (7.3%) | 19 (8.7%) |
| $5,000 to $7,499 | 4 (1.8%) | 12 (5.5%) |
| $7,500 to $9,999 | 0 (0.0%) | 3 (1.4%) |
| $10,000 to $12,499 | 14 (6.4%) | 10 (4.6%) |
| $12,500 to $14,999 | 5 (2.3%) | 27 (12.4%) |
| $15,000 to $17,499 | 0 (0.0%) | 13 (6.0%) |
| $17,500 to $19,999 | 3 (1.4%) | 5 (2.3%) |
| $20,000 to $22,499 | 4 (1.8%) | 4 (1.8%) |
| $22,500 to $24,999 | 17 (7.8%) | 0 (0.0%) |
| $25,000 to $29,999 | 12 (5.5%) | 10 (4.6%) |
| $30,000 to $34,999 | 34 (15.5%) | 17 (7.8%) |
| $35,000 to $39,999 | 18 (8.2%) | 14 (6.4%) |
| $40,000 to $44,999 | 19 (8.7%) | 11 (5.1%) |
| $45,000 to $49,999 | 25 (11.4%) | 18 (8.3%) |
| $50,000 to $54,999 | 2 (0.9%) | 7 (3.2%) |
| $55,000 to $64,999 | 26 (11.9%) | 18 (8.3%) |
| $65,000 to $74,999 | 2 (0.9%) | 0 (0.0%) |
| $75,000 to $99,999 | 3 (1.4%) | 20 (9.2%) |
| $100,000+ | 6 (2.7%) | 0 (0.0%) |
| Total | 219 (100.0%) | 218 (100.0%) |
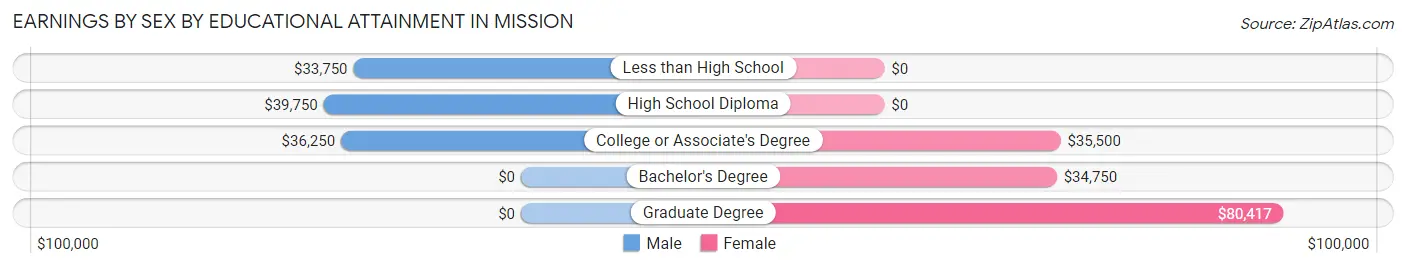
Earnings by Sex by Educational Attainment in Mission
Average earnings in Mission are $38,583 for men and $30,795 for women, a difference of 20.2%. Men with an educational attainment of high school diploma enjoy the highest average annual earnings of $39,750, while those with less than high school education earn the least with $33,750. Women with an educational attainment of graduate degree earn the most with the average annual earnings of $80,417, while those with bachelor's degree education have the smallest earnings of $34,750.
| Educational Attainment | Male Income | Female Income |
| Less than High School | $33,750 | $0 |
| High School Diploma | $39,750 | $0 |
| College or Associate's Degree | $36,250 | $35,500 |
| Bachelor's Degree | - | - |
| Graduate Degree | - | - |
| Total | $38,583 | $30,795 |
Family Income in Mission
Family Income Brackets in Mission
According to the Mission family income data, there are 67 families falling into the less than $10,000 income range, which is the most common income bracket and makes up 26.1% of all families.
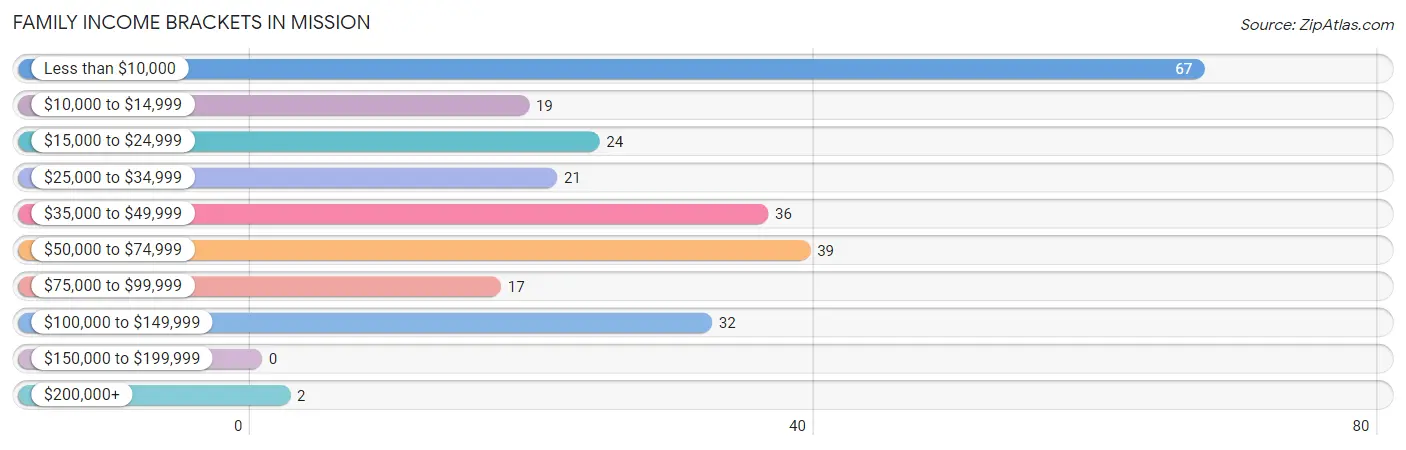
| Income Bracket | # Families | % Families |
| Less than $10,000 | 67 | 26.1% |
| $10,000 to $14,999 | 19 | 7.4% |
| $15,000 to $24,999 | 24 | 9.3% |
| $25,000 to $34,999 | 21 | 8.2% |
| $35,000 to $49,999 | 36 | 14.0% |
| $50,000 to $74,999 | 39 | 15.2% |
| $75,000 to $99,999 | 17 | 6.6% |
| $100,000 to $149,999 | 32 | 12.5% |
| $150,000 to $199,999 | 0 | 0.0% |
| $200,000+ | 2 | 0.8% |
Family Income by Famaliy Size in Mission
2-person families (86 | 33.5%) account for the highest median family income in Mission with $36,000 per family, while 2-person families (86 | 33.5%) have the highest median income of $18,000 per family member.
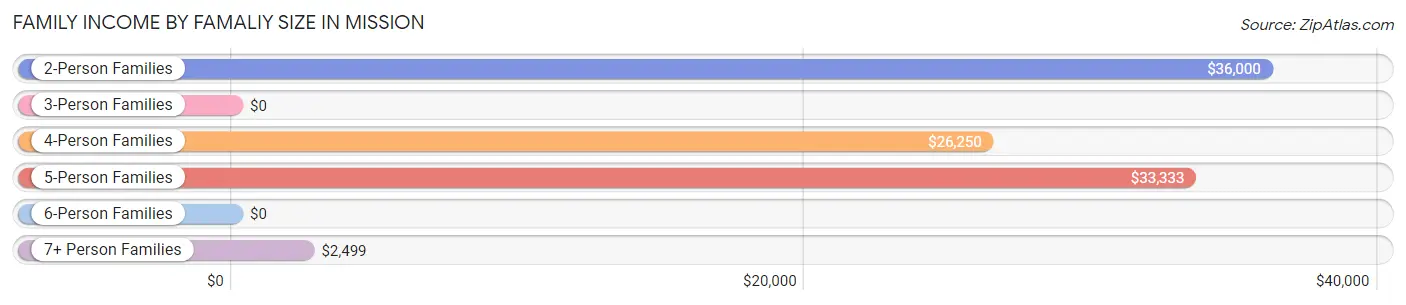
| Income Bracket | # Families | Median Income |
| 2-Person Families | 86 (33.5%) | $36,000 |
| 3-Person Families | 57 (22.2%) | $0 |
| 4-Person Families | 49 (19.1%) | $26,250 |
| 5-Person Families | 30 (11.7%) | $33,333 |
| 6-Person Families | 26 (10.1%) | $0 |
| 7+ Person Families | 9 (3.5%) | $2,499 |
| Total | 257 (100.0%) | $34,375 |
Family Income by Number of Earners in Mission
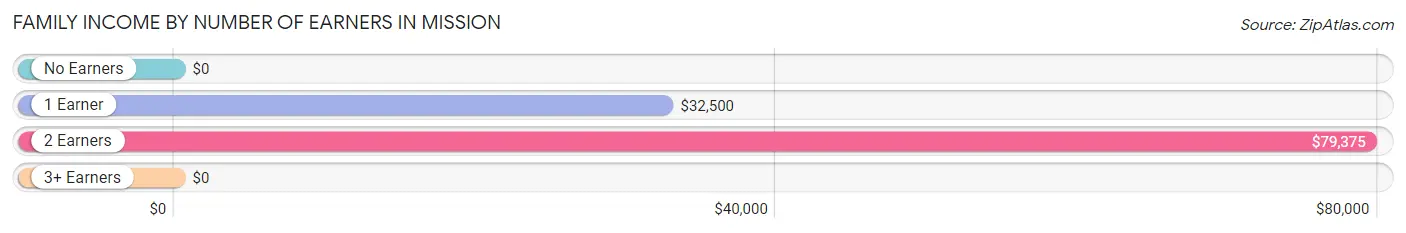
| Number of Earners | # Families | Median Income |
| No Earners | 64 (24.9%) | $0 |
| 1 Earner | 112 (43.6%) | $32,500 |
| 2 Earners | 77 (30.0%) | $79,375 |
| 3+ Earners | 4 (1.6%) | $0 |
| Total | 257 (100.0%) | $34,375 |
Household Income in Mission
Household Income Brackets in Mission
With 73 households falling in the category, the less than $10,000 income range is the most frequent in Mission, accounting for 19.5% of all households. In contrast, only 4 households (1.1%) fall into the $150,000 to $199,999 income bracket, making it the least populous group.
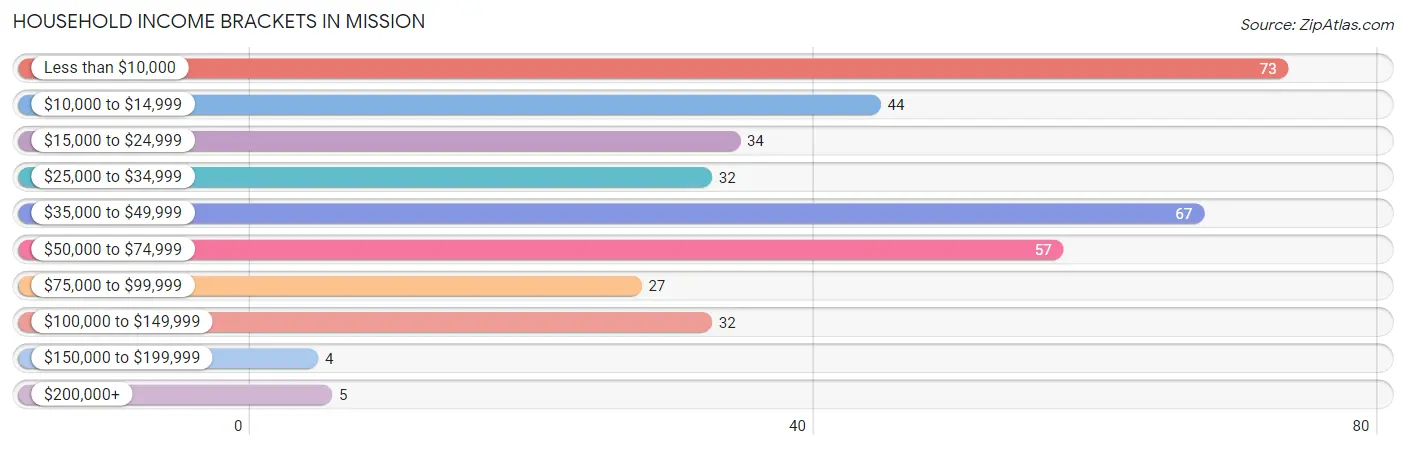
| Income Bracket | # Households | % Households |
| Less than $10,000 | 73 | 19.5% |
| $10,000 to $14,999 | 44 | 11.7% |
| $15,000 to $24,999 | 34 | 9.1% |
| $25,000 to $34,999 | 32 | 8.5% |
| $35,000 to $49,999 | 67 | 17.9% |
| $50,000 to $74,999 | 57 | 15.2% |
| $75,000 to $99,999 | 27 | 7.2% |
| $100,000 to $149,999 | 32 | 8.5% |
| $150,000 to $199,999 | 4 | 1.1% |
| $200,000+ | 5 | 1.3% |
Household Income by Householder Age in Mission
The median household income in Mission is $36,607, with the highest median household income of $42,554 found in the 25 to 44 years age bracket for the primary householder. A total of 175 households (46.7%) fall into this category. Meanwhile, the 15 to 24 years age bracket for the primary householder has the lowest median household income of $0, with 27 households (7.2%) in this group.
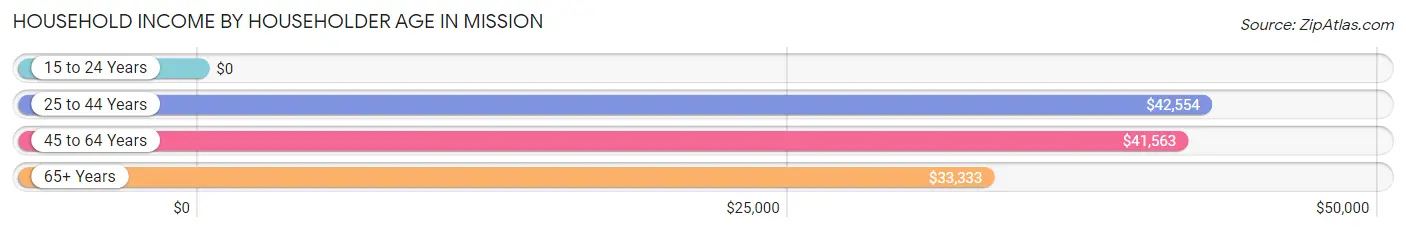
| Income Bracket | # Households | Median Income |
| 15 to 24 Years | 27 (7.2%) | $0 |
| 25 to 44 Years | 175 (46.7%) | $42,554 |
| 45 to 64 Years | 111 (29.6%) | $41,563 |
| 65+ Years | 62 (16.5%) | $33,333 |
| Total | 375 (100.0%) | $36,607 |
Poverty in Mission
Income Below Poverty by Sex and Age in Mission
With 39.2% poverty level for males and 57.1% for females among the residents of Mission, under 5 year old males and under 5 year old females are the most vulnerable to poverty, with 70 males (64.8%) and 84 females (79.2%) in their respective age groups living below the poverty level.
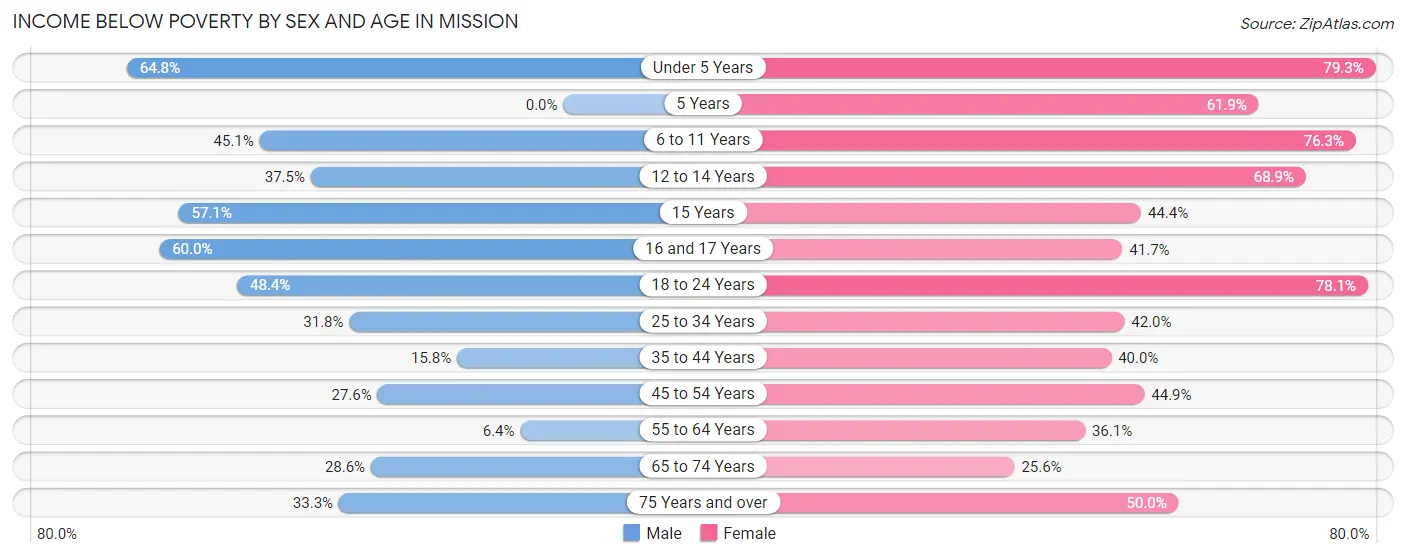
| Age Bracket | Male | Female |
| Under 5 Years | 70 (64.8%) | 84 (79.2%) |
| 5 Years | 0 (0.0%) | 13 (61.9%) |
| 6 to 11 Years | 46 (45.1%) | 58 (76.3%) |
| 12 to 14 Years | 6 (37.5%) | 31 (68.9%) |
| 15 Years | 4 (57.1%) | 4 (44.4%) |
| 16 and 17 Years | 12 (60.0%) | 5 (41.7%) |
| 18 to 24 Years | 31 (48.4%) | 50 (78.1%) |
| 25 to 34 Years | 34 (31.8%) | 47 (42.0%) |
| 35 to 44 Years | 9 (15.8%) | 22 (40.0%) |
| 45 to 54 Years | 8 (27.6%) | 31 (44.9%) |
| 55 to 64 Years | 3 (6.4%) | 13 (36.1%) |
| 65 to 74 Years | 8 (28.6%) | 10 (25.6%) |
| 75 Years and over | 2 (33.3%) | 4 (50.0%) |
| Total | 233 (39.2%) | 372 (57.1%) |
Income Above Poverty by Sex and Age in Mission
According to the poverty statistics in Mission, males aged 5 years and females aged 65 to 74 years are the age groups that are most secure financially, with 100.0% of males and 74.4% of females in these age groups living above the poverty line.
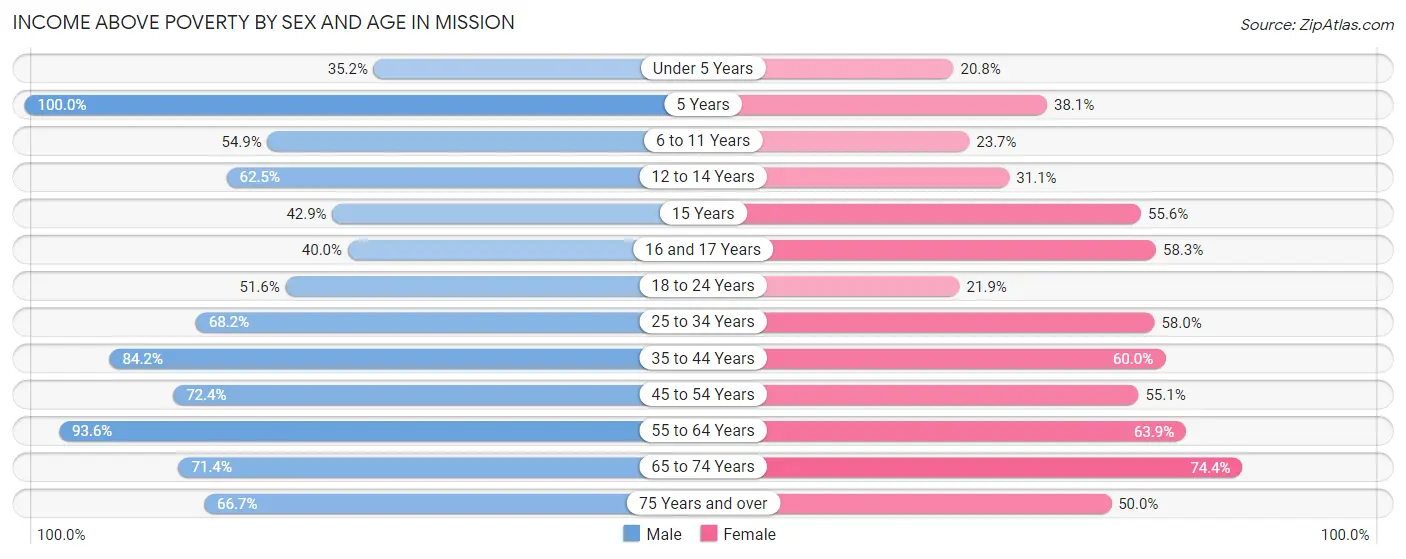
| Age Bracket | Male | Female |
| Under 5 Years | 38 (35.2%) | 22 (20.7%) |
| 5 Years | 4 (100.0%) | 8 (38.1%) |
| 6 to 11 Years | 56 (54.9%) | 18 (23.7%) |
| 12 to 14 Years | 10 (62.5%) | 14 (31.1%) |
| 15 Years | 3 (42.9%) | 5 (55.6%) |
| 16 and 17 Years | 8 (40.0%) | 7 (58.3%) |
| 18 to 24 Years | 33 (51.6%) | 14 (21.9%) |
| 25 to 34 Years | 73 (68.2%) | 65 (58.0%) |
| 35 to 44 Years | 48 (84.2%) | 33 (60.0%) |
| 45 to 54 Years | 21 (72.4%) | 38 (55.1%) |
| 55 to 64 Years | 44 (93.6%) | 23 (63.9%) |
| 65 to 74 Years | 20 (71.4%) | 29 (74.4%) |
| 75 Years and over | 4 (66.7%) | 4 (50.0%) |
| Total | 362 (60.8%) | 280 (42.9%) |
Income Below Poverty Among Married-Couple Families in Mission
The poverty statistics for married-couple families in Mission show that 14.8% or 12 of the total 81 families live below the poverty line. Families with 3 or 4 children have the highest poverty rate of 20.0%, comprising of 3 families. On the other hand, families with 5 or more children have the lowest poverty rate of 0.0%, which includes 0 families.
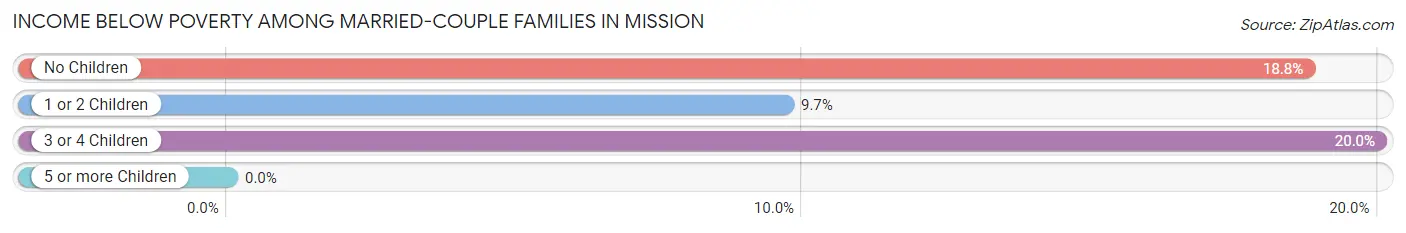
| Children | Above Poverty | Below Poverty |
| No Children | 26 (81.2%) | 6 (18.8%) |
| 1 or 2 Children | 28 (90.3%) | 3 (9.7%) |
| 3 or 4 Children | 12 (80.0%) | 3 (20.0%) |
| 5 or more Children | 3 (100.0%) | 0 (0.0%) |
| Total | 69 (85.2%) | 12 (14.8%) |
Income Below Poverty Among Single-Parent Households in Mission
According to the poverty data in Mission, 48.5% or 16 single-father households and 60.8% or 87 single-mother households are living below the poverty line. Among single-father households, those with 3 or 4 children have the highest poverty rate, with 5 households (62.5%) experiencing poverty. Likewise, among single-mother households, those with 5 or more children have the highest poverty rate, with 10 households (100.0%) falling below the poverty line.
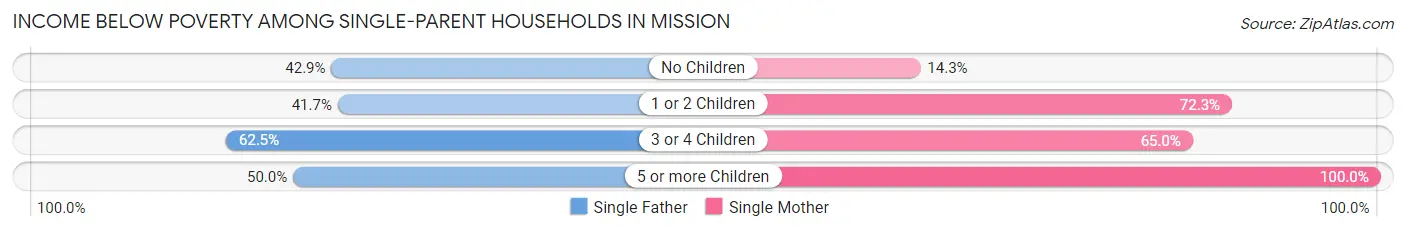
| Children | Single Father | Single Mother |
| No Children | 3 (42.9%) | 4 (14.3%) |
| 1 or 2 Children | 5 (41.7%) | 47 (72.3%) |
| 3 or 4 Children | 5 (62.5%) | 26 (65.0%) |
| 5 or more Children | 3 (50.0%) | 10 (100.0%) |
| Total | 16 (48.5%) | 87 (60.8%) |
Income Below Poverty Among Married-Couple vs Single-Parent Households in Mission
The poverty data for Mission shows that 12 of the married-couple family households (14.8%) and 103 of the single-parent households (58.5%) are living below the poverty level. Within the married-couple family households, those with 3 or 4 children have the highest poverty rate, with 3 households (20.0%) falling below the poverty line. Among the single-parent households, those with 5 or more children have the highest poverty rate, with 13 household (81.2%) living below poverty.
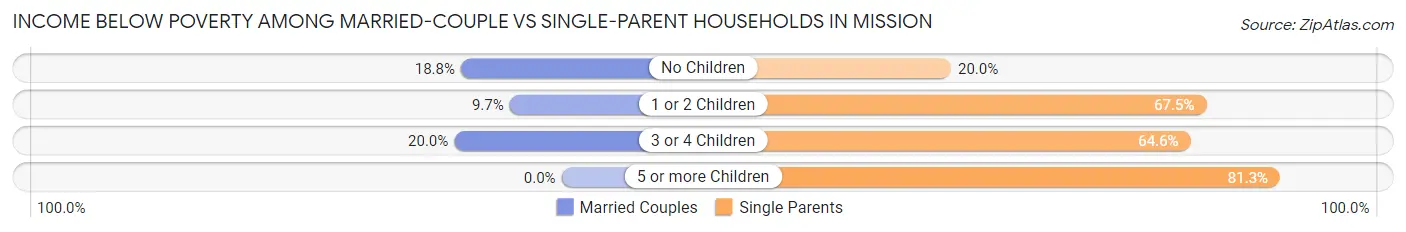
| Children | Married-Couple Families | Single-Parent Households |
| No Children | 6 (18.8%) | 7 (20.0%) |
| 1 or 2 Children | 3 (9.7%) | 52 (67.5%) |
| 3 or 4 Children | 3 (20.0%) | 31 (64.6%) |
| 5 or more Children | 0 (0.0%) | 13 (81.2%) |
| Total | 12 (14.8%) | 103 (58.5%) |
Race in Mission
The most populous races in Mission are Native / Alaskan (966 | 76.9%), White / Caucasian (181 | 14.4%), and Two or more Races (80 | 6.4%).
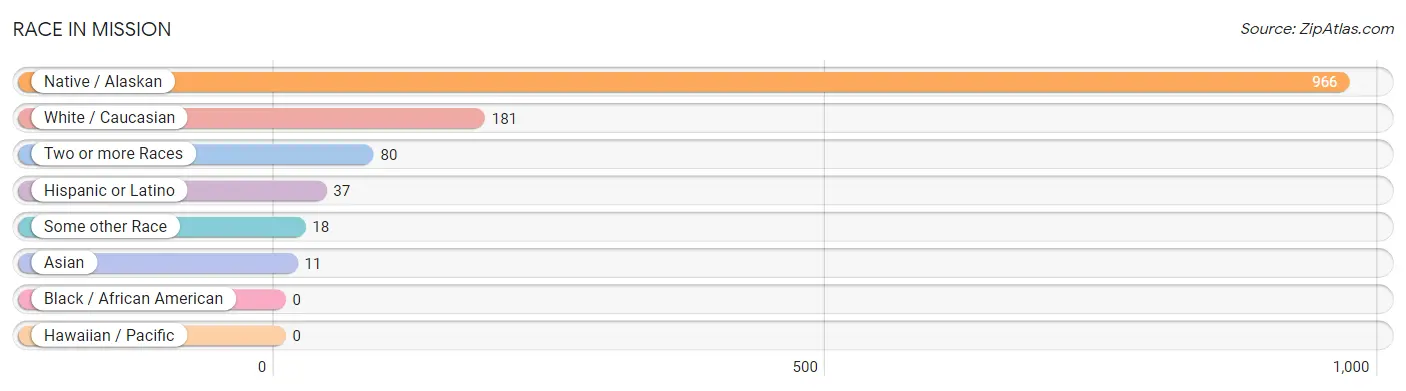
| Race | # Population | % Population |
| Asian | 11 | 0.9% |
| Black / African American | 0 | 0.0% |
| Hawaiian / Pacific | 0 | 0.0% |
| Hispanic or Latino | 37 | 2.9% |
| Native / Alaskan | 966 | 76.9% |
| White / Caucasian | 181 | 14.4% |
| Two or more Races | 80 | 6.4% |
| Some other Race | 18 | 1.4% |
| Total | 1,256 | 100.0% |
Ancestry in Mission
The most populous ancestries reported in Mission are Sioux (878 | 69.9%), German (102 | 8.1%), Mexican (31 | 2.5%), English (23 | 1.8%), and European (17 | 1.3%), together accounting for 83.7% of all Mission residents.
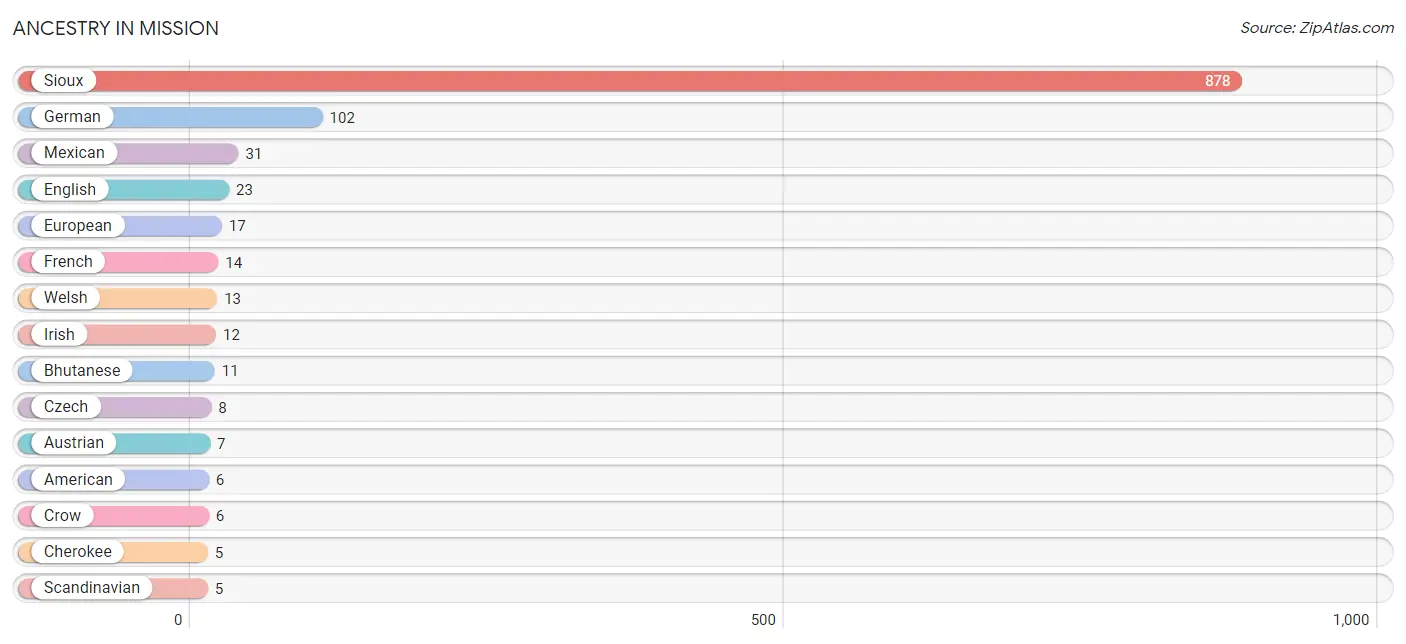
| Ancestry | # Population | % Population |
| American | 6 | 0.5% |
| Arab | 3 | 0.2% |
| Austrian | 7 | 0.6% |
| Bhutanese | 11 | 0.9% |
| Cherokee | 5 | 0.4% |
| Crow | 6 | 0.5% |
| Czech | 8 | 0.6% |
| Egyptian | 3 | 0.2% |
| English | 23 | 1.8% |
| European | 17 | 1.3% |
| French | 14 | 1.1% |
| German | 102 | 8.1% |
| Irish | 12 | 1.0% |
| Mexican | 31 | 2.5% |
| Polish | 4 | 0.3% |
| Scandinavian | 5 | 0.4% |
| Scottish | 4 | 0.3% |
| Sioux | 878 | 69.9% |
| Slavic | 5 | 0.4% |
| Swiss | 3 | 0.2% |
| Welsh | 13 | 1.0% | View All 21 Rows |
Immigrants in Mission
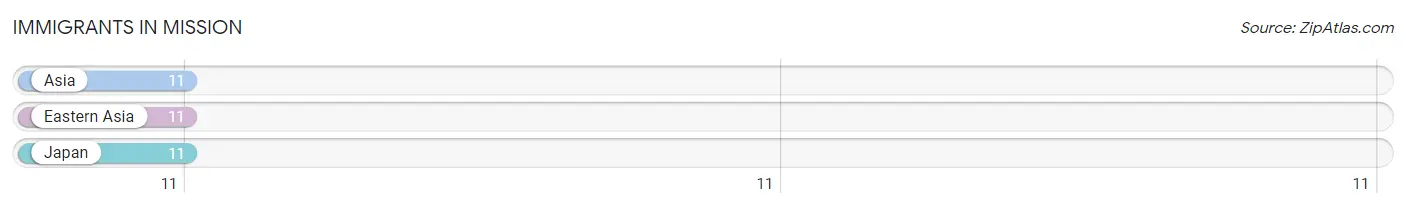
The most numerous immigrant groups reported in Mission came from Asia (11 | 0.9%), Eastern Asia (11 | 0.9%), and Japan (11 | 0.9%), together accounting for 2.6% of all Mission residents.
| Immigration Origin | # Population | % Population |
| Asia | 11 | 0.9% |
| Eastern Asia | 11 | 0.9% |
| Japan | 11 | 0.9% | View All 3 Rows |
Sex and Age in Mission
Sex and Age in Mission
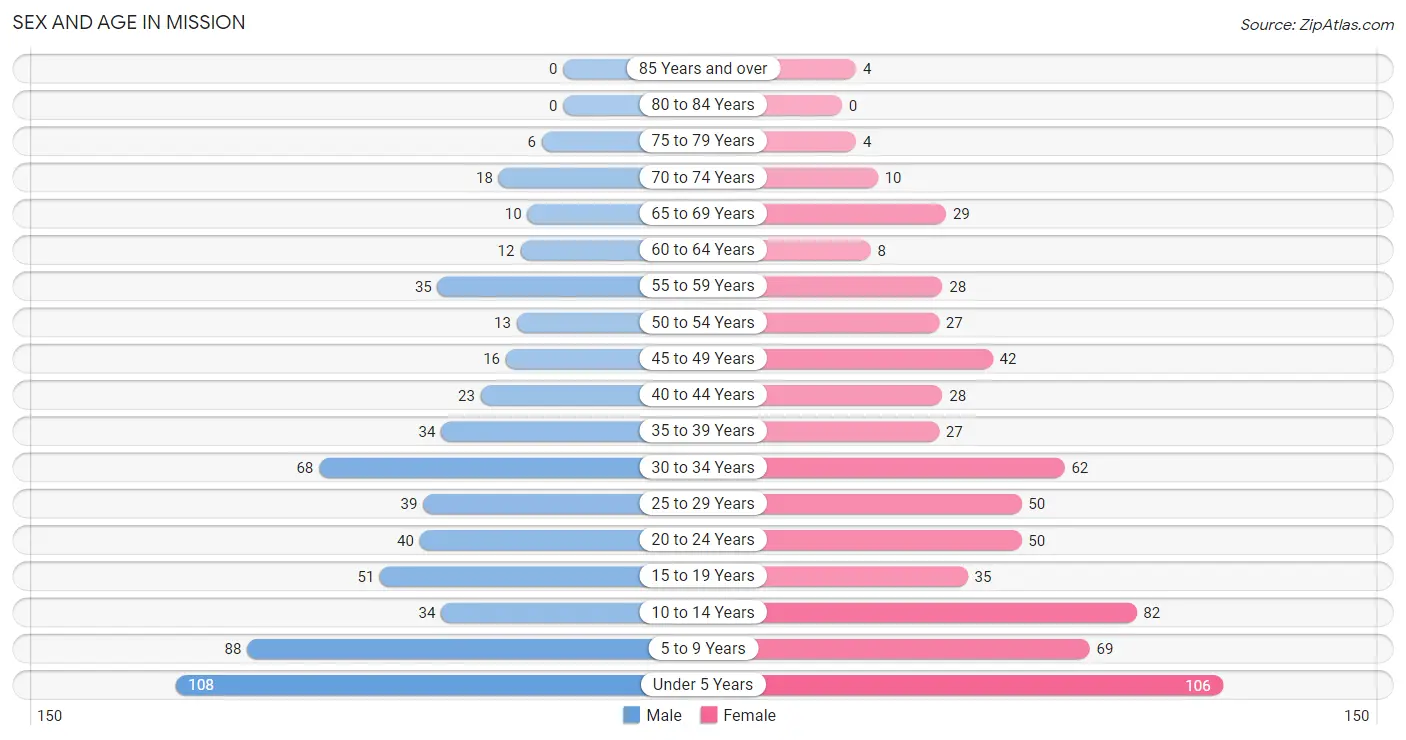
The most populous age groups in Mission are Under 5 Years (108 | 18.1%) for men and Under 5 Years (106 | 16.0%) for women.
| Age Bracket | Male | Female |
| Under 5 Years | 108 (18.1%) | 106 (16.0%) |
| 5 to 9 Years | 88 (14.8%) | 69 (10.4%) |
| 10 to 14 Years | 34 (5.7%) | 82 (12.4%) |
| 15 to 19 Years | 51 (8.6%) | 35 (5.3%) |
| 20 to 24 Years | 40 (6.7%) | 50 (7.6%) |
| 25 to 29 Years | 39 (6.6%) | 50 (7.6%) |
| 30 to 34 Years | 68 (11.4%) | 62 (9.4%) |
| 35 to 39 Years | 34 (5.7%) | 27 (4.1%) |
| 40 to 44 Years | 23 (3.9%) | 28 (4.2%) |
| 45 to 49 Years | 16 (2.7%) | 42 (6.4%) |
| 50 to 54 Years | 13 (2.2%) | 27 (4.1%) |
| 55 to 59 Years | 35 (5.9%) | 28 (4.2%) |
| 60 to 64 Years | 12 (2.0%) | 8 (1.2%) |
| 65 to 69 Years | 10 (1.7%) | 29 (4.4%) |
| 70 to 74 Years | 18 (3.0%) | 10 (1.5%) |
| 75 to 79 Years | 6 (1.0%) | 4 (0.6%) |
| 80 to 84 Years | 0 (0.0%) | 0 (0.0%) |
| 85 Years and over | 0 (0.0%) | 4 (0.6%) |
| Total | 595 (100.0%) | 661 (100.0%) |
Families and Households in Mission
Median Family Size in Mission
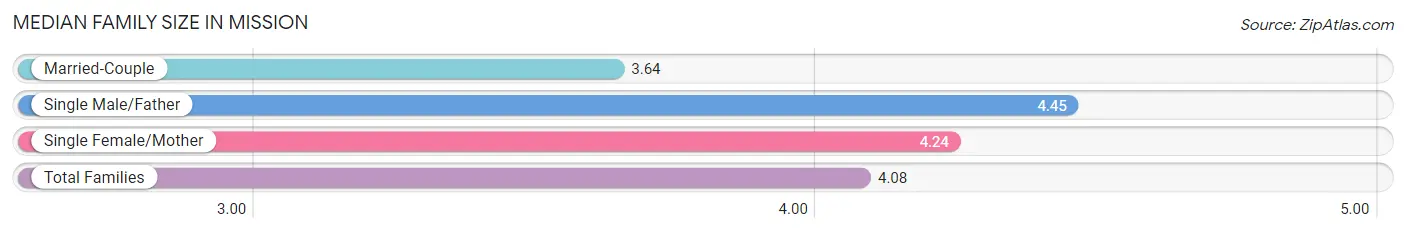
The median family size in Mission is 4.08 persons per family, with single male/father families (33 | 12.8%) accounting for the largest median family size of 4.45 persons per family. On the other hand, married-couple families (81 | 31.5%) represent the smallest median family size with 3.64 persons per family.
| Family Type | # Families | Family Size |
| Married-Couple | 81 (31.5%) | 3.64 |
| Single Male/Father | 33 (12.8%) | 4.45 |
| Single Female/Mother | 143 (55.6%) | 4.24 |
| Total Families | 257 (100.0%) | 4.08 |
Median Household Size in Mission
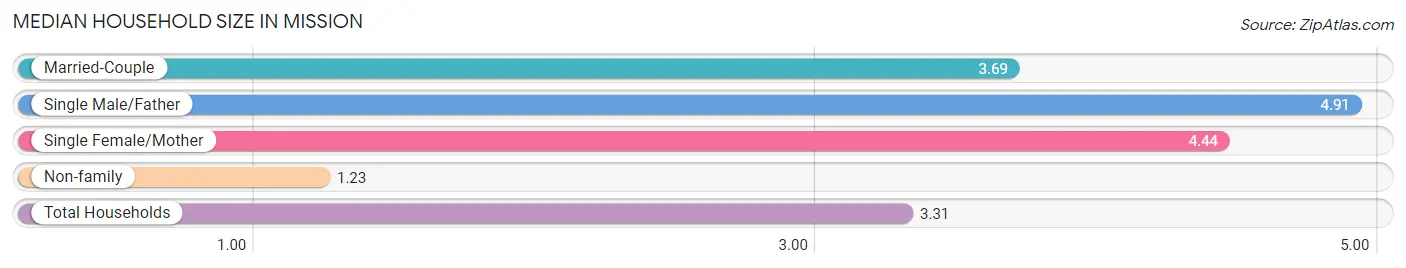
The median household size in Mission is 3.31 persons per household, with single male/father households (33 | 8.8%) accounting for the largest median household size of 4.91 persons per household. non-family households (118 | 31.5%) represent the smallest median household size with 1.23 persons per household.
| Household Type | # Households | Household Size |
| Married-Couple | 81 (21.6%) | 3.69 |
| Single Male/Father | 33 (8.8%) | 4.91 |
| Single Female/Mother | 143 (38.1%) | 4.44 |
| Non-family | 118 (31.5%) | 1.23 |
| Total Households | 375 (100.0%) | 3.31 |
Household Size by Marriage Status in Mission
Out of a total of 375 households in Mission, 257 (68.5%) are family households, while 118 (31.5%) are nonfamily households. The most numerous type of family households are 3-person households, comprising 73, and the most common type of nonfamily households are 1-person households, comprising 108.
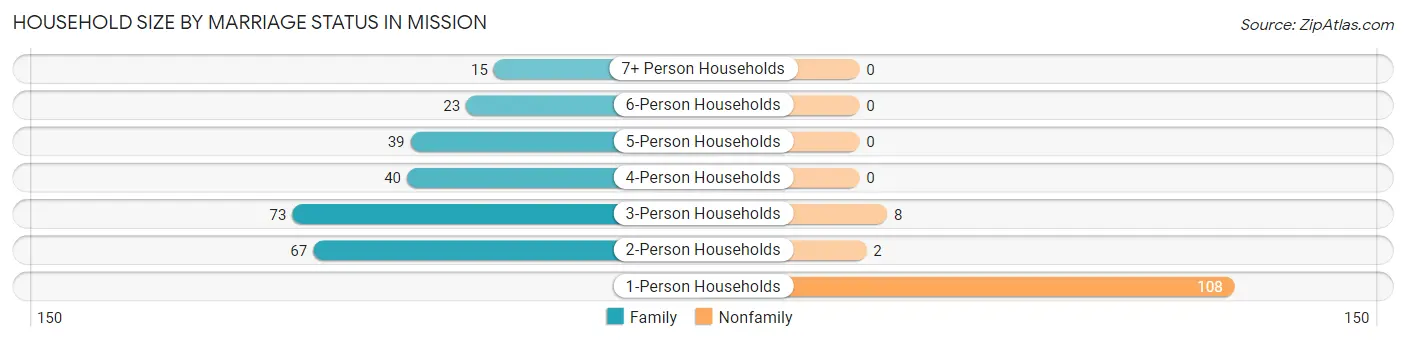
| Household Size | Family Households | Nonfamily Households |
| 1-Person Households | - | 108 (28.8%) |
| 2-Person Households | 67 (17.9%) | 2 (0.5%) |
| 3-Person Households | 73 (19.5%) | 8 (2.1%) |
| 4-Person Households | 40 (10.7%) | 0 (0.0%) |
| 5-Person Households | 39 (10.4%) | 0 (0.0%) |
| 6-Person Households | 23 (6.1%) | 0 (0.0%) |
| 7+ Person Households | 15 (4.0%) | 0 (0.0%) |
| Total | 257 (68.5%) | 118 (31.5%) |
Female Fertility in Mission
Fertility by Age in Mission
Average fertility rate in Mission is 168.0 births per 1,000 women. Women in the age bracket of 20 to 34 years have the highest fertility rate with 284.0 births per 1,000 women. Women in the age bracket of 20 to 34 years acount for 92.0% of all women with births.
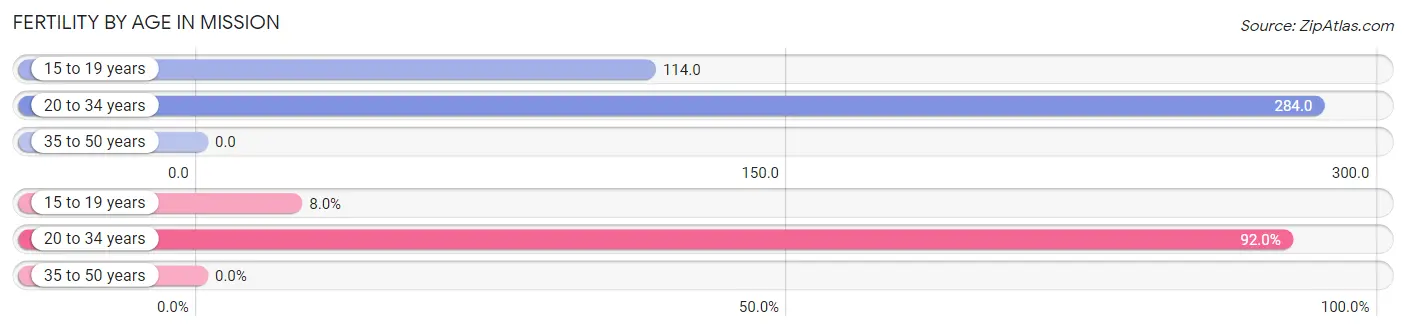
| Age Bracket | Women with Births | Births / 1,000 Women |
| 15 to 19 years | 4 (8.0%) | 114.0 |
| 20 to 34 years | 46 (92.0%) | 284.0 |
| 35 to 50 years | 0 (0.0%) | 0.0 |
| Total | 50 (100.0%) | 168.0 |
Fertility by Age by Marriage Status in Mission
18.0% of women with births (50) in Mission are married. The highest percentage of unmarried women with births falls into 15 to 19 years age bracket with 100.0% of them unmarried at the time of birth, while the lowest percentage of unmarried women with births belong to 20 to 34 years age bracket with 80.4% of them unmarried.
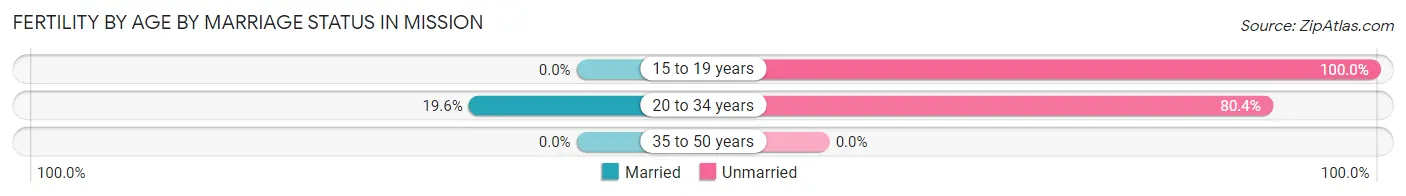
| Age Bracket | Married | Unmarried |
| 15 to 19 years | 0 (0.0%) | 4 (100.0%) |
| 20 to 34 years | 9 (19.6%) | 37 (80.4%) |
| 35 to 50 years | 0 (0.0%) | 0 (0.0%) |
| Total | 9 (18.0%) | 41 (82.0%) |
Fertility by Education in Mission
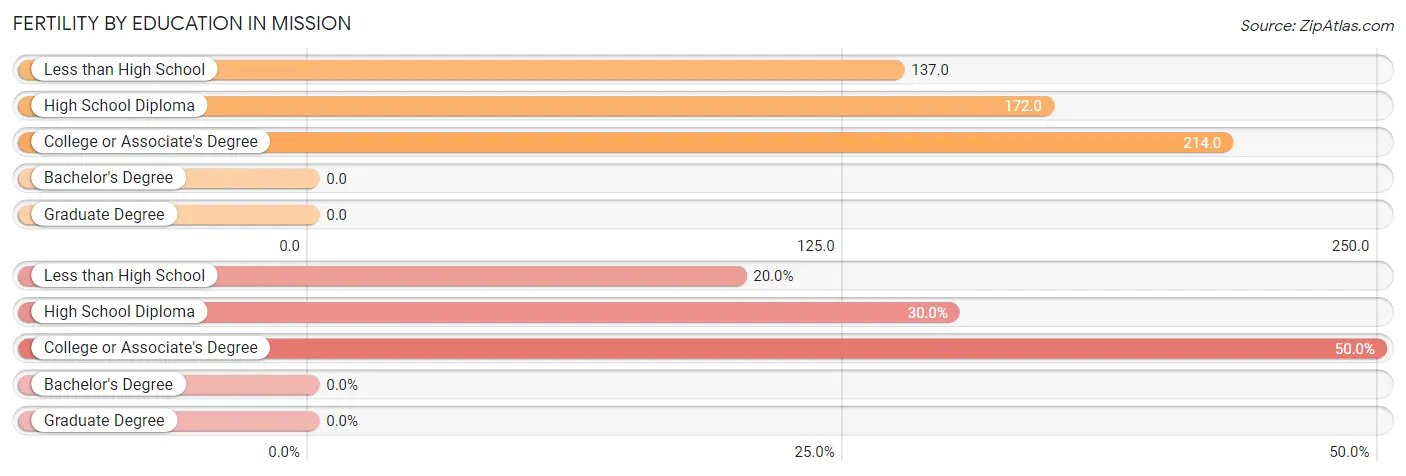
| Educational Attainment | Women with Births | Births / 1,000 Women |
| Less than High School | 10 (20.0%) | 137.0 |
| High School Diploma | 15 (30.0%) | 172.0 |
| College or Associate's Degree | 25 (50.0%) | 214.0 |
| Bachelor's Degree | 0 (0.0%) | 0.0 |
| Graduate Degree | 0 (0.0%) | 0.0 |
| Total | 50 (100.0%) | 168.0 |
Fertility by Education by Marriage Status in Mission
82.0% of women with births in Mission are unmarried. Women with the educational attainment of high school diploma are most likely to be married with 26.7% of them married at childbirth, while women with the educational attainment of less than high school are least likely to be married with 100.0% of them unmarried at childbirth.
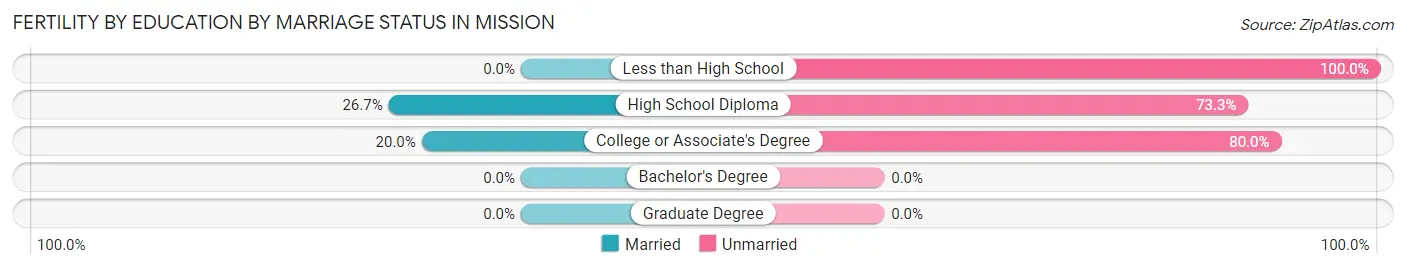
| Educational Attainment | Married | Unmarried |
| Less than High School | 0 (0.0%) | 10 (100.0%) |
| High School Diploma | 4 (26.7%) | 11 (73.3%) |
| College or Associate's Degree | 5 (20.0%) | 20 (80.0%) |
| Bachelor's Degree | 0 (0.0%) | 0 (0.0%) |
| Graduate Degree | 0 (0.0%) | 0 (0.0%) |
| Total | 9 (18.0%) | 41 (82.0%) |
Employment Characteristics in Mission
Employment by Class of Employer in Mission
Among the 356 employed individuals in Mission, private company employees (130 | 36.5%), not-for-profit organizations (71 | 19.9%), and state government employees (64 | 18.0%) make up the most common classes of employment.
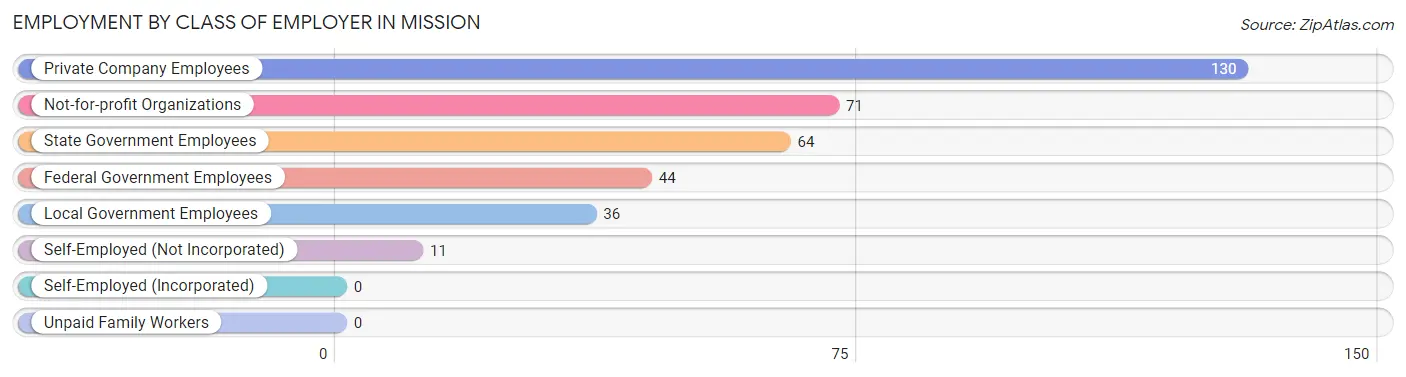
| Employer Class | # Employees | % Employees |
| Private Company Employees | 130 | 36.5% |
| Self-Employed (Incorporated) | 0 | 0.0% |
| Self-Employed (Not Incorporated) | 11 | 3.1% |
| Not-for-profit Organizations | 71 | 19.9% |
| Local Government Employees | 36 | 10.1% |
| State Government Employees | 64 | 18.0% |
| Federal Government Employees | 44 | 12.4% |
| Unpaid Family Workers | 0 | 0.0% |
| Total | 356 | 100.0% |
Employment Status by Age in Mission
According to the labor force statistics for Mission, out of the total population over 16 years of age (753), 58.0% or 437 individuals are in the labor force, with 17.4% or 76 of them unemployed. The age group with the highest labor force participation rate is 35 to 44 years, with 89.3% or 100 individuals in the labor force. Within the labor force, the 25 to 29 years age range has the highest percentage of unemployed individuals, with 32.6% or 18 of them being unemployed.
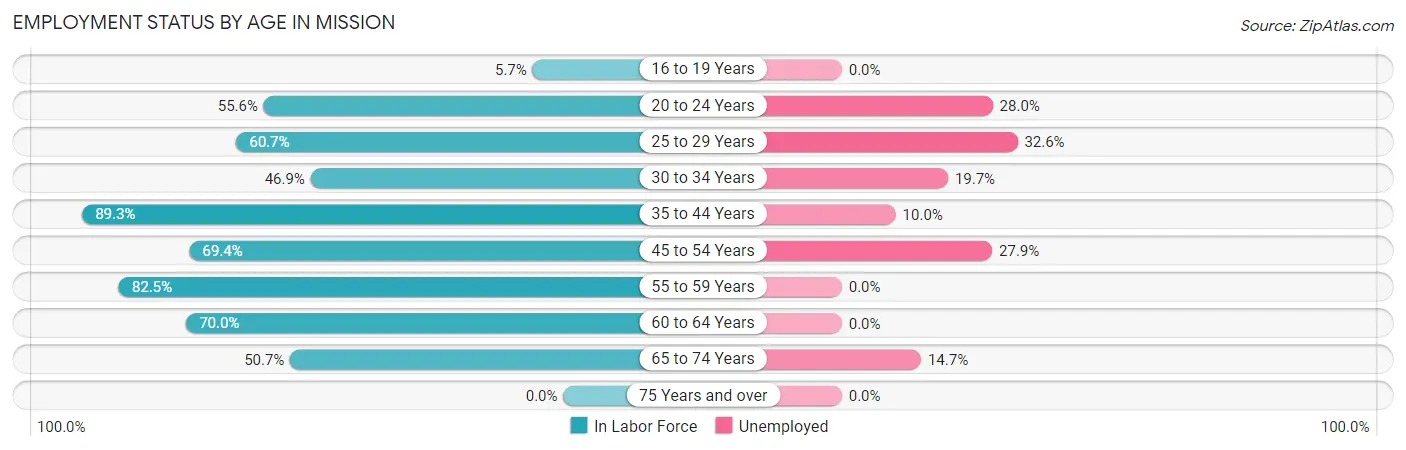
| Age Bracket | In Labor Force | Unemployed |
| 16 to 19 Years | 4 (5.7%) | 0 (0.0%) |
| 20 to 24 Years | 50 (55.6%) | 14 (28.0%) |
| 25 to 29 Years | 54 (60.7%) | 18 (32.6%) |
| 30 to 34 Years | 61 (46.9%) | 12 (19.7%) |
| 35 to 44 Years | 100 (89.3%) | 10 (10.0%) |
| 45 to 54 Years | 68 (69.4%) | 19 (27.9%) |
| 55 to 59 Years | 52 (82.5%) | 0 (0.0%) |
| 60 to 64 Years | 14 (70.0%) | 0 (0.0%) |
| 65 to 74 Years | 34 (50.7%) | 5 (14.7%) |
| 75 Years and over | 0 (0.0%) | 0 (0.0%) |
| Total | 437 (58.0%) | 76 (17.4%) |
Employment Status by Educational Attainment in Mission
According to labor force statistics for Mission, 68.2% of individuals (349) out of the total population between 25 and 64 years of age (512) are in the labor force, with 16.3% or 57 of them being unemployed. The group with the highest labor force participation rate are those with the educational attainment of bachelor's degree or higher, with 86.8% or 46 individuals in the labor force. Within the labor force, individuals with less than high school education have the highest percentage of unemployment, with 29.4% or 15 of them being unemployed.
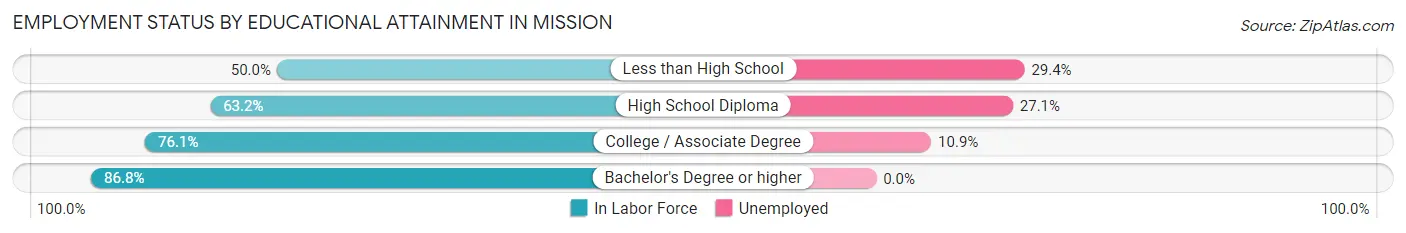
| Educational Attainment | In Labor Force | Unemployed |
| Less than High School | 51 (50.0%) | 30 (29.4%) |
| High School Diploma | 96 (63.2%) | 41 (27.1%) |
| College / Associate Degree | 156 (76.1%) | 22 (10.9%) |
| Bachelor's Degree or higher | 46 (86.8%) | 0 (0.0%) |
| Total | 349 (68.2%) | 83 (16.3%) |
Employment Occupations by Sex in Mission
Management, Business, Science and Arts Occupations
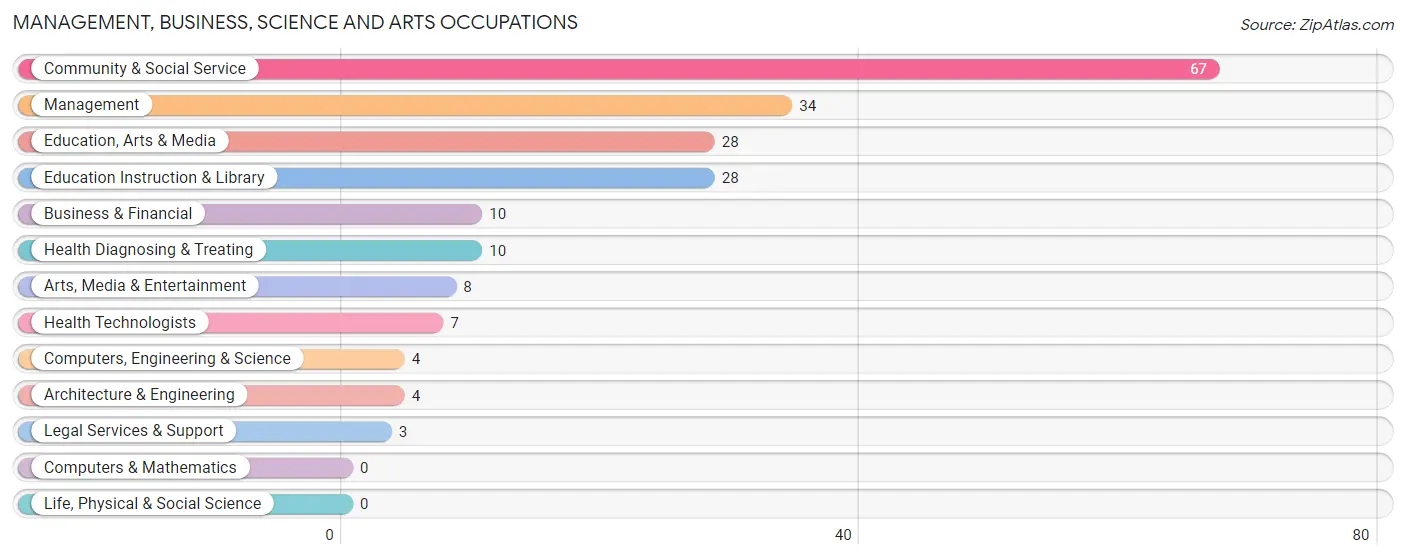
The most common Management, Business, Science and Arts occupations in Mission are Community & Social Service (67 | 19.0%), Management (34 | 9.7%), Education, Arts & Media (28 | 8.0%), Education Instruction & Library (28 | 8.0%), and Business & Financial (10 | 2.8%).
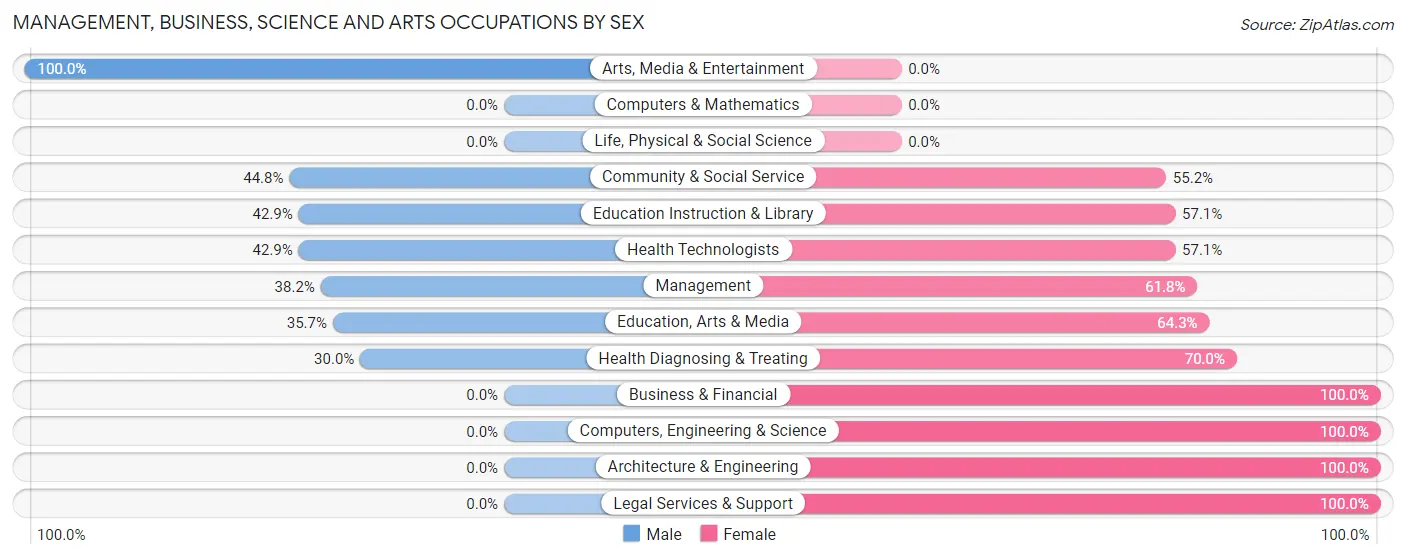
Management, Business, Science and Arts Occupations by Sex
Within the Management, Business, Science and Arts occupations in Mission, the most male-oriented occupations are Arts, Media & Entertainment (100.0%), Community & Social Service (44.8%), and Education Instruction & Library (42.9%), while the most female-oriented occupations are Business & Financial (100.0%), Computers, Engineering & Science (100.0%), and Architecture & Engineering (100.0%).
| Occupation | Male | Female |
| Management | 13 (38.2%) | 21 (61.8%) |
| Business & Financial | 0 (0.0%) | 10 (100.0%) |
| Computers, Engineering & Science | 0 (0.0%) | 4 (100.0%) |
| Computers & Mathematics | 0 (0.0%) | 0 (0.0%) |
| Architecture & Engineering | 0 (0.0%) | 4 (100.0%) |
| Life, Physical & Social Science | 0 (0.0%) | 0 (0.0%) |
| Community & Social Service | 30 (44.8%) | 37 (55.2%) |
| Education, Arts & Media | 10 (35.7%) | 18 (64.3%) |
| Legal Services & Support | 0 (0.0%) | 3 (100.0%) |
| Education Instruction & Library | 12 (42.9%) | 16 (57.1%) |
| Arts, Media & Entertainment | 8 (100.0%) | 0 (0.0%) |
| Health Diagnosing & Treating | 3 (30.0%) | 7 (70.0%) |
| Health Technologists | 3 (42.9%) | 4 (57.1%) |
| Total (Category) | 46 (36.8%) | 79 (63.2%) |
| Total (Overall) | 181 (51.4%) | 171 (48.6%) |
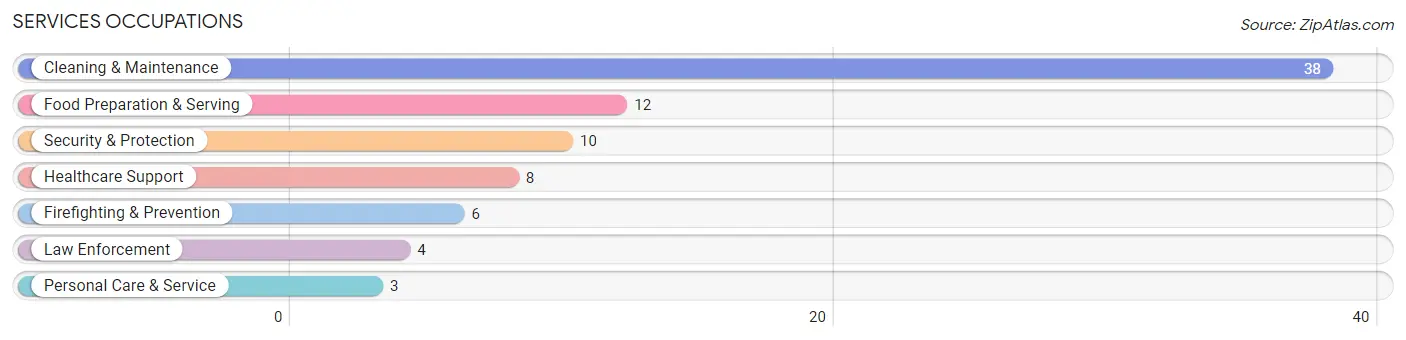
Services Occupations
The most common Services occupations in Mission are Cleaning & Maintenance (38 | 10.8%), Food Preparation & Serving (12 | 3.4%), Security & Protection (10 | 2.8%), Healthcare Support (8 | 2.3%), and Firefighting & Prevention (6 | 1.7%).
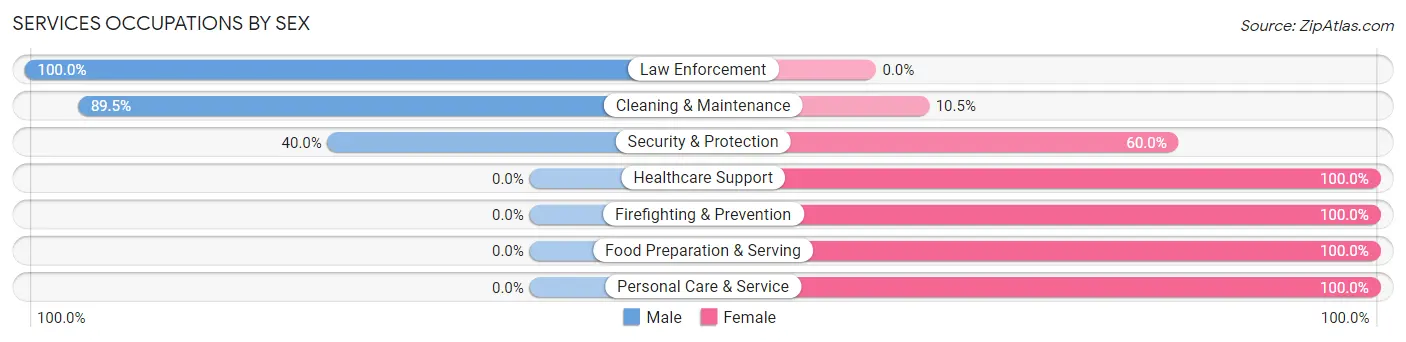
Services Occupations by Sex
Within the Services occupations in Mission, the most male-oriented occupations are Law Enforcement (100.0%), Cleaning & Maintenance (89.5%), and Security & Protection (40.0%), while the most female-oriented occupations are Healthcare Support (100.0%), Firefighting & Prevention (100.0%), and Food Preparation & Serving (100.0%).
| Occupation | Male | Female |
| Healthcare Support | 0 (0.0%) | 8 (100.0%) |
| Security & Protection | 4 (40.0%) | 6 (60.0%) |
| Firefighting & Prevention | 0 (0.0%) | 6 (100.0%) |
| Law Enforcement | 4 (100.0%) | 0 (0.0%) |
| Food Preparation & Serving | 0 (0.0%) | 12 (100.0%) |
| Cleaning & Maintenance | 34 (89.5%) | 4 (10.5%) |
| Personal Care & Service | 0 (0.0%) | 3 (100.0%) |
| Total (Category) | 38 (53.5%) | 33 (46.5%) |
| Total (Overall) | 181 (51.4%) | 171 (48.6%) |
Sales and Office Occupations
The most common Sales and Office occupations in Mission are Office & Administration (35 | 9.9%), and Sales & Related (28 | 8.0%).
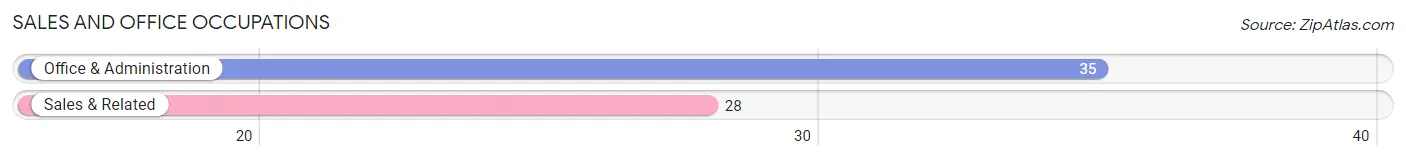
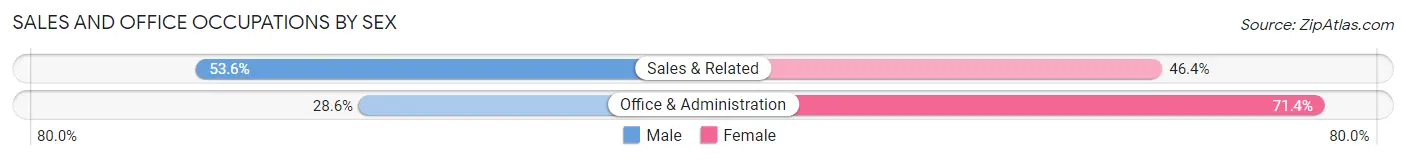
Sales and Office Occupations by Sex
| Occupation | Male | Female |
| Sales & Related | 15 (53.6%) | 13 (46.4%) |
| Office & Administration | 10 (28.6%) | 25 (71.4%) |
| Total (Category) | 25 (39.7%) | 38 (60.3%) |
| Total (Overall) | 181 (51.4%) | 171 (48.6%) |
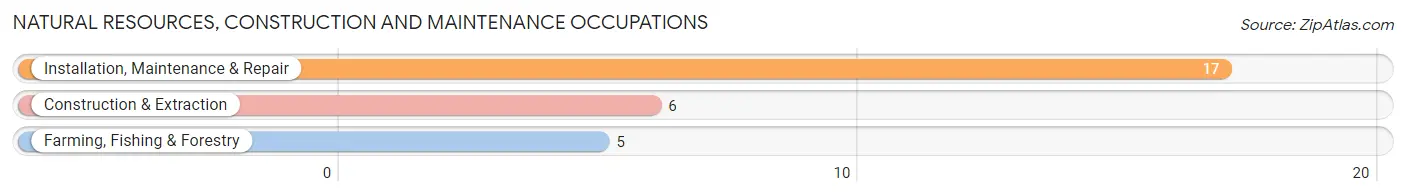
Natural Resources, Construction and Maintenance Occupations
The most common Natural Resources, Construction and Maintenance occupations in Mission are Installation, Maintenance & Repair (17 | 4.8%), Construction & Extraction (6 | 1.7%), and Farming, Fishing & Forestry (5 | 1.4%).
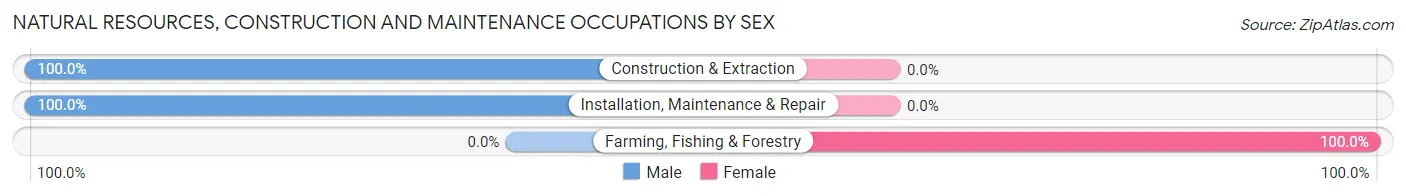
Natural Resources, Construction and Maintenance Occupations by Sex
| Occupation | Male | Female |
| Farming, Fishing & Forestry | 0 (0.0%) | 5 (100.0%) |
| Construction & Extraction | 6 (100.0%) | 0 (0.0%) |
| Installation, Maintenance & Repair | 17 (100.0%) | 0 (0.0%) |
| Total (Category) | 23 (82.1%) | 5 (17.9%) |
| Total (Overall) | 181 (51.4%) | 171 (48.6%) |
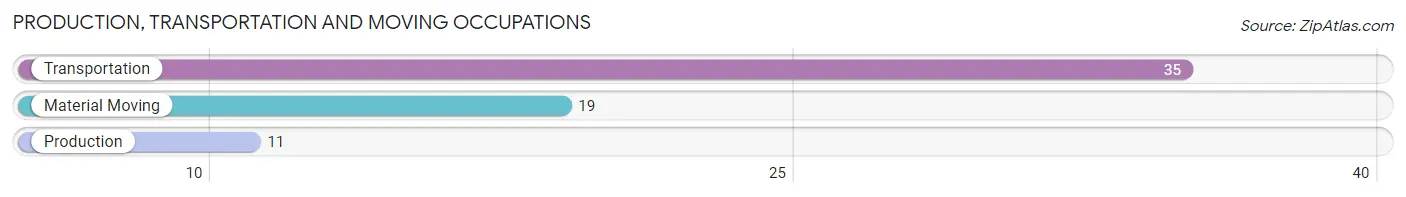
Production, Transportation and Moving Occupations
The most common Production, Transportation and Moving occupations in Mission are Transportation (35 | 9.9%), Material Moving (19 | 5.4%), and Production (11 | 3.1%).
Production, Transportation and Moving Occupations by Sex
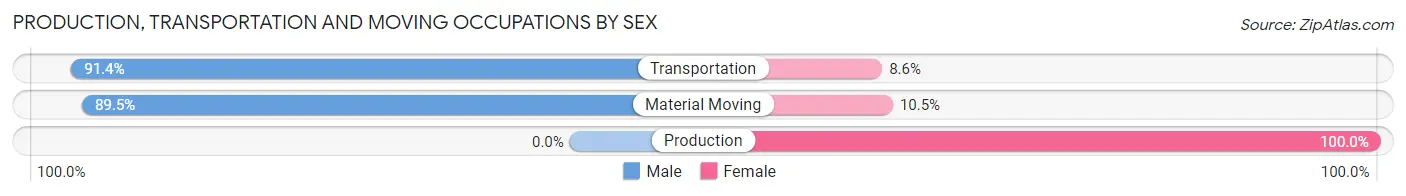
| Occupation | Male | Female |
| Production | 0 (0.0%) | 11 (100.0%) |
| Transportation | 32 (91.4%) | 3 (8.6%) |
| Material Moving | 17 (89.5%) | 2 (10.5%) |
| Total (Category) | 49 (75.4%) | 16 (24.6%) |
| Total (Overall) | 181 (51.4%) | 171 (48.6%) |
Employment Industries by Sex in Mission
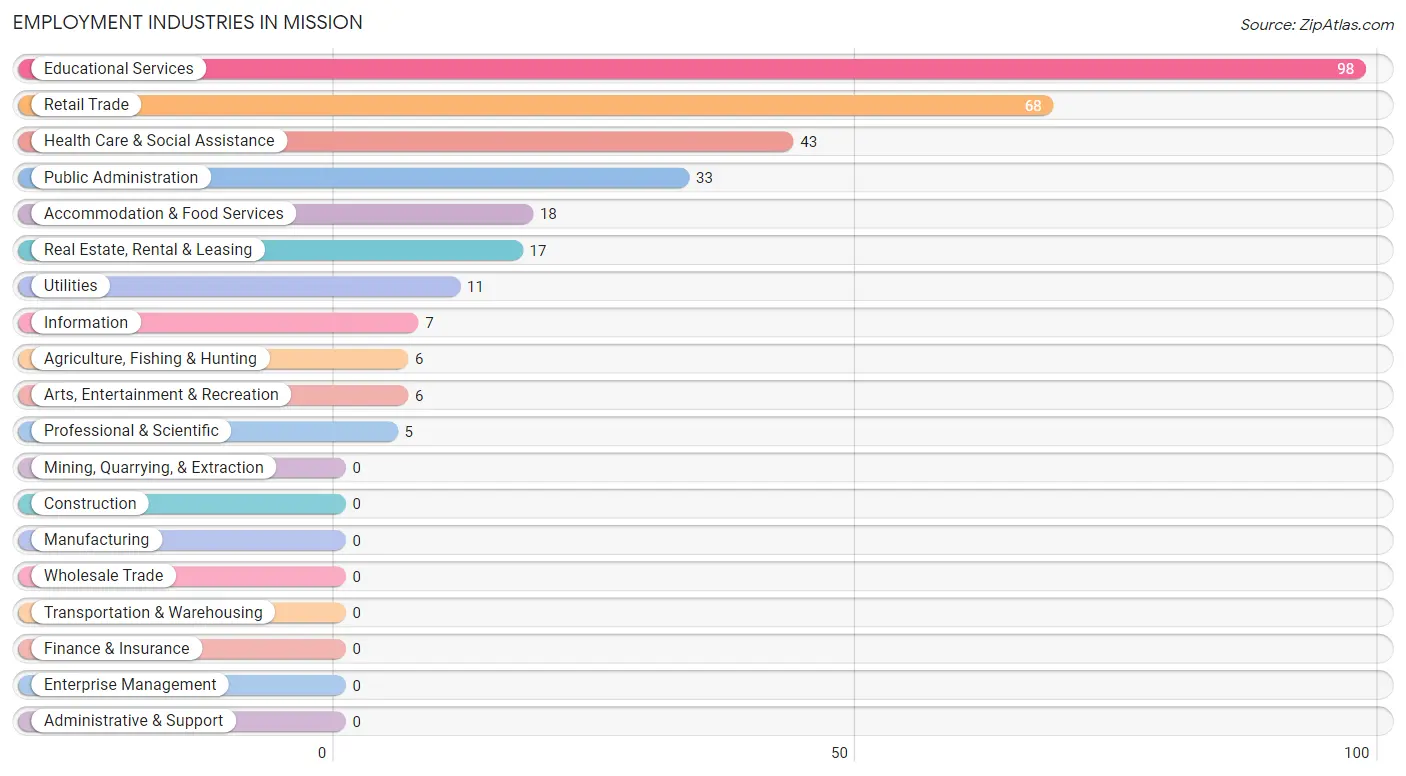
Employment Industries in Mission
The major employment industries in Mission include Educational Services (98 | 27.8%), Retail Trade (68 | 19.3%), Health Care & Social Assistance (43 | 12.2%), Public Administration (33 | 9.4%), and Accommodation & Food Services (18 | 5.1%).
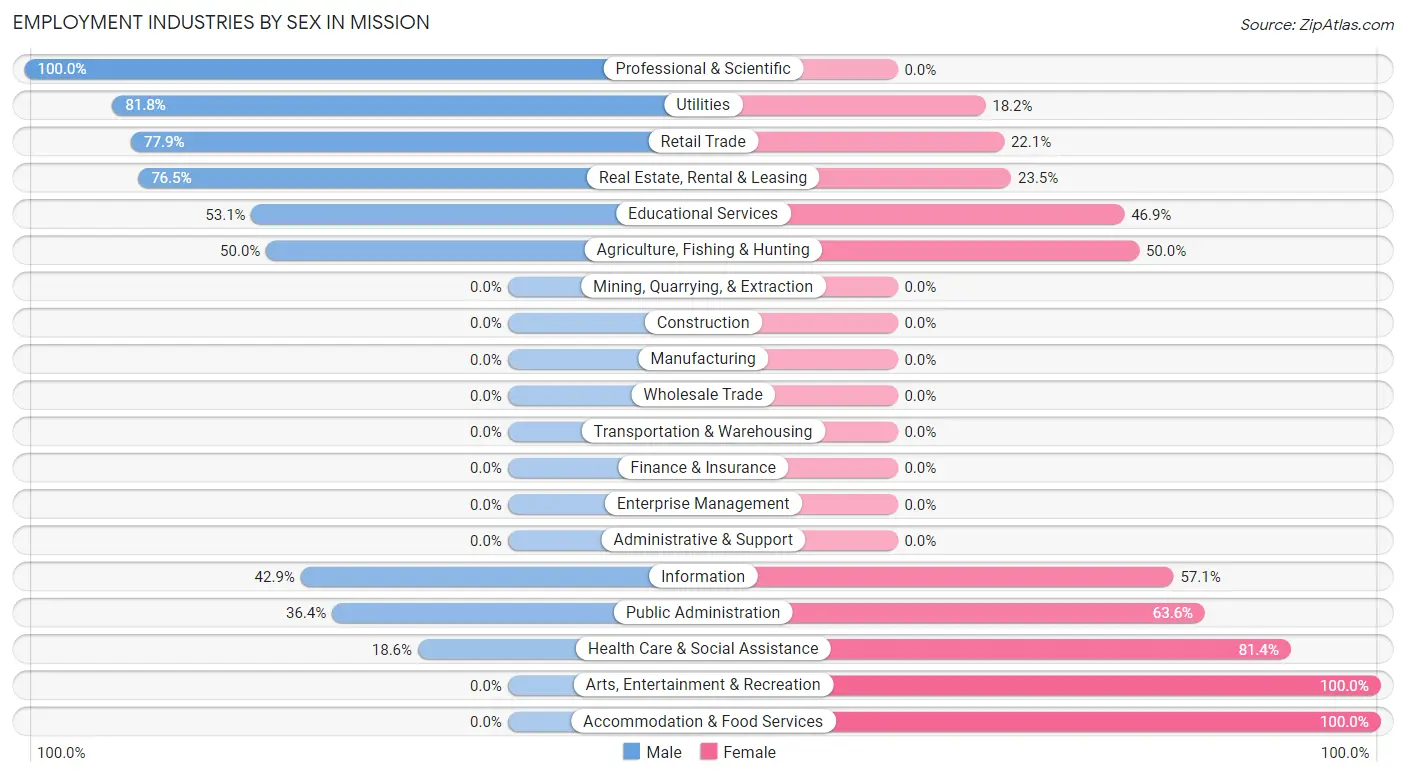
Employment Industries by Sex in Mission
The Mission industries that see more men than women are Professional & Scientific (100.0%), Utilities (81.8%), and Retail Trade (77.9%), whereas the industries that tend to have a higher number of women are Arts, Entertainment & Recreation (100.0%), Accommodation & Food Services (100.0%), and Health Care & Social Assistance (81.4%).
| Industry | Male | Female |
| Agriculture, Fishing & Hunting | 3 (50.0%) | 3 (50.0%) |
| Mining, Quarrying, & Extraction | 0 (0.0%) | 0 (0.0%) |
| Construction | 0 (0.0%) | 0 (0.0%) |
| Manufacturing | 0 (0.0%) | 0 (0.0%) |
| Wholesale Trade | 0 (0.0%) | 0 (0.0%) |
| Retail Trade | 53 (77.9%) | 15 (22.1%) |
| Transportation & Warehousing | 0 (0.0%) | 0 (0.0%) |
| Utilities | 9 (81.8%) | 2 (18.2%) |
| Information | 3 (42.9%) | 4 (57.1%) |
| Finance & Insurance | 0 (0.0%) | 0 (0.0%) |
| Real Estate, Rental & Leasing | 13 (76.5%) | 4 (23.5%) |
| Professional & Scientific | 5 (100.0%) | 0 (0.0%) |
| Enterprise Management | 0 (0.0%) | 0 (0.0%) |
| Administrative & Support | 0 (0.0%) | 0 (0.0%) |
| Educational Services | 52 (53.1%) | 46 (46.9%) |
| Health Care & Social Assistance | 8 (18.6%) | 35 (81.4%) |
| Arts, Entertainment & Recreation | 0 (0.0%) | 6 (100.0%) |
| Accommodation & Food Services | 0 (0.0%) | 18 (100.0%) |
| Public Administration | 12 (36.4%) | 21 (63.6%) |
| Total | 181 (51.4%) | 171 (48.6%) |
Education in Mission
School Enrollment in Mission
The most common levels of schooling among the 378 students in Mission are elementary school (117 | 30.9%), middle school (91 | 24.1%), and high school (66 | 17.5%).
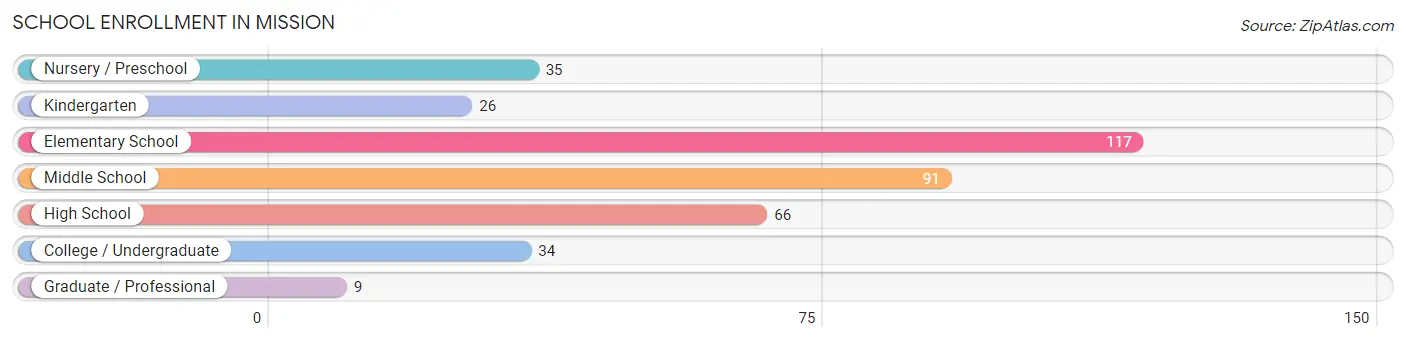
| School Level | # Students | % Students |
| Nursery / Preschool | 35 | 9.3% |
| Kindergarten | 26 | 6.9% |
| Elementary School | 117 | 30.9% |
| Middle School | 91 | 24.1% |
| High School | 66 | 17.5% |
| College / Undergraduate | 34 | 9.0% |
| Graduate / Professional | 9 | 2.4% |
| Total | 378 | 100.0% |
School Enrollment by Age by Funding Source in Mission
Out of a total of 378 students who are enrolled in schools in Mission, 18 (4.8%) attend a private institution, while the remaining 360 (95.2%) are enrolled in public schools. The age group of 25 to 34 year olds has the highest likelihood of being enrolled in private schools, with 2 (16.7% in the age bracket) enrolled. Conversely, the age group of 3 to 4 year olds has the lowest likelihood of being enrolled in a private school, with 22 (100.0% in the age bracket) attending a public institution.
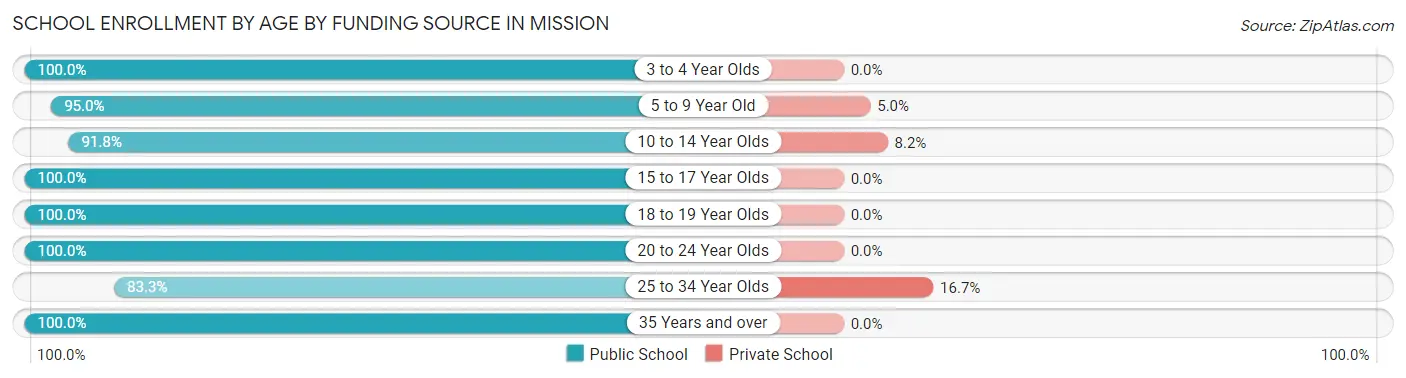
| Age Bracket | Public School | Private School |
| 3 to 4 Year Olds | 22 (100.0%) | 0 (0.0%) |
| 5 to 9 Year Old | 134 (95.0%) | 7 (5.0%) |
| 10 to 14 Year Olds | 101 (91.8%) | 9 (8.2%) |
| 15 to 17 Year Olds | 44 (100.0%) | 0 (0.0%) |
| 18 to 19 Year Olds | 30 (100.0%) | 0 (0.0%) |
| 20 to 24 Year Olds | 7 (100.0%) | 0 (0.0%) |
| 25 to 34 Year Olds | 10 (83.3%) | 2 (16.7%) |
| 35 Years and over | 12 (100.0%) | 0 (0.0%) |
| Total | 360 (95.2%) | 18 (4.8%) |
Educational Attainment by Field of Study in Mission
Education (18 | 22.2%), arts & humanities (15 | 18.5%), science & technology (14 | 17.3%), liberal arts & history (10 | 12.3%), and business (7 | 8.6%) are the most common fields of study among 81 individuals in Mission who have obtained a bachelor's degree or higher.
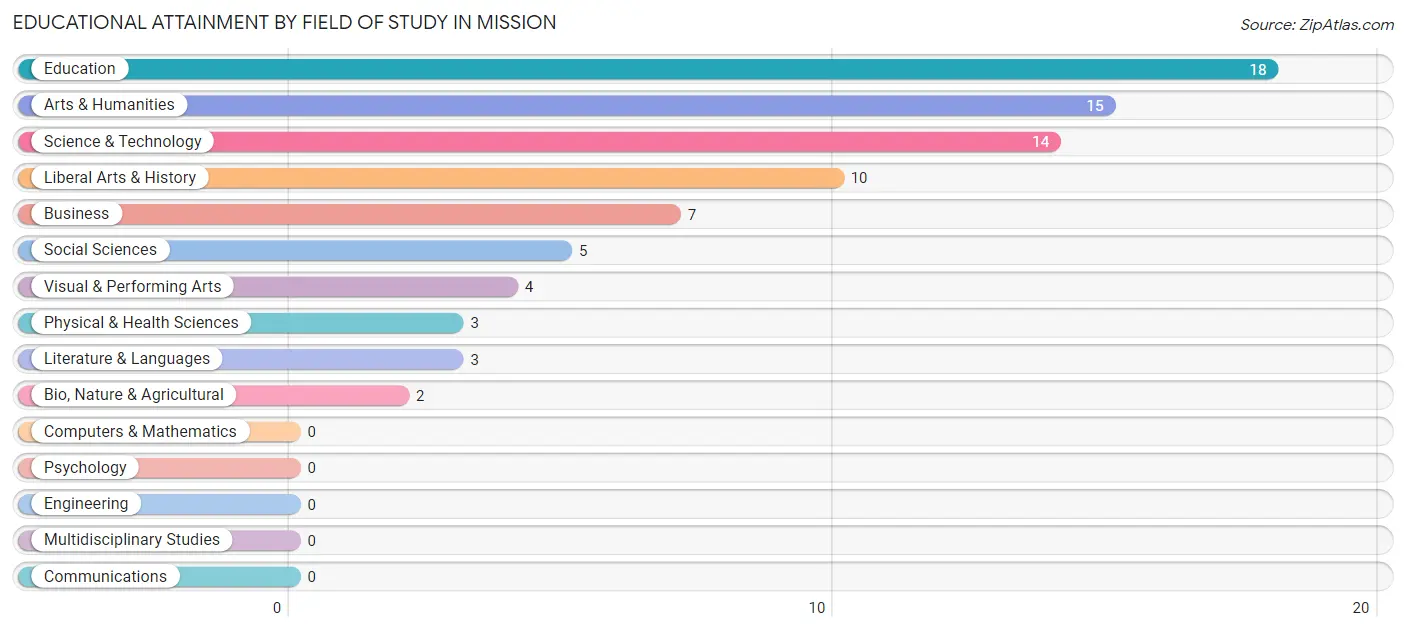
| Field of Study | # Graduates | % Graduates |
| Computers & Mathematics | 0 | 0.0% |
| Bio, Nature & Agricultural | 2 | 2.5% |
| Physical & Health Sciences | 3 | 3.7% |
| Psychology | 0 | 0.0% |
| Social Sciences | 5 | 6.2% |
| Engineering | 0 | 0.0% |
| Multidisciplinary Studies | 0 | 0.0% |
| Science & Technology | 14 | 17.3% |
| Business | 7 | 8.6% |
| Education | 18 | 22.2% |
| Literature & Languages | 3 | 3.7% |
| Liberal Arts & History | 10 | 12.3% |
| Visual & Performing Arts | 4 | 4.9% |
| Communications | 0 | 0.0% |
| Arts & Humanities | 15 | 18.5% |
| Total | 81 | 100.0% |
Transportation & Commute in Mission
Vehicle Availability by Sex in Mission
The most prevalent vehicle ownership categories in Mission are males with 2 vehicles (112, accounting for 61.5%) and females with 2 vehicles (85, making up 70.4%).
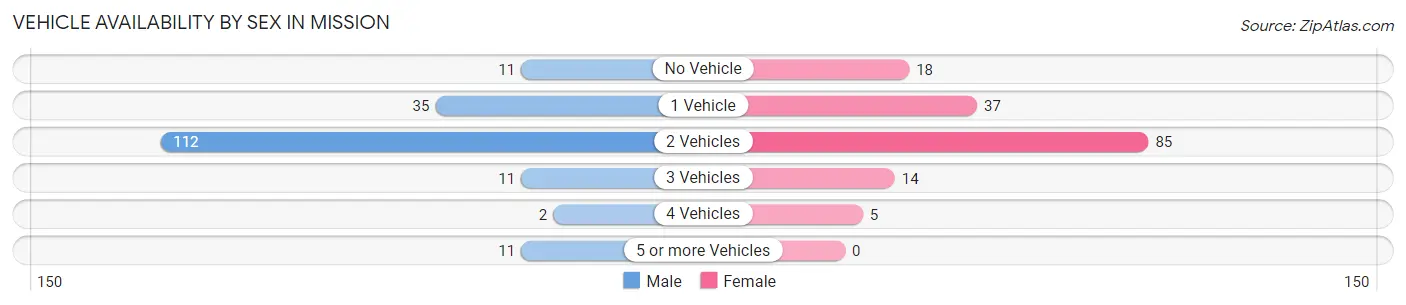
| Vehicles Available | Male | Female |
| No Vehicle | 11 (6.0%) | 18 (11.3%) |
| 1 Vehicle | 35 (19.2%) | 37 (23.3%) |
| 2 Vehicles | 112 (61.5%) | 85 (53.5%) |
| 3 Vehicles | 11 (6.0%) | 14 (8.8%) |
| 4 Vehicles | 2 (1.1%) | 5 (3.1%) |
| 5 or more Vehicles | 11 (6.0%) | 0 (0.0%) |
| Total | 182 (100.0%) | 159 (100.0%) |
Commute Time in Mission
The most frequently occuring commute durations in Mission are 10 to 14 minutes (121 commuters, 34.3%), 5 to 9 minutes (98 commuters, 27.8%), and 20 to 24 minutes (29 commuters, 8.2%).
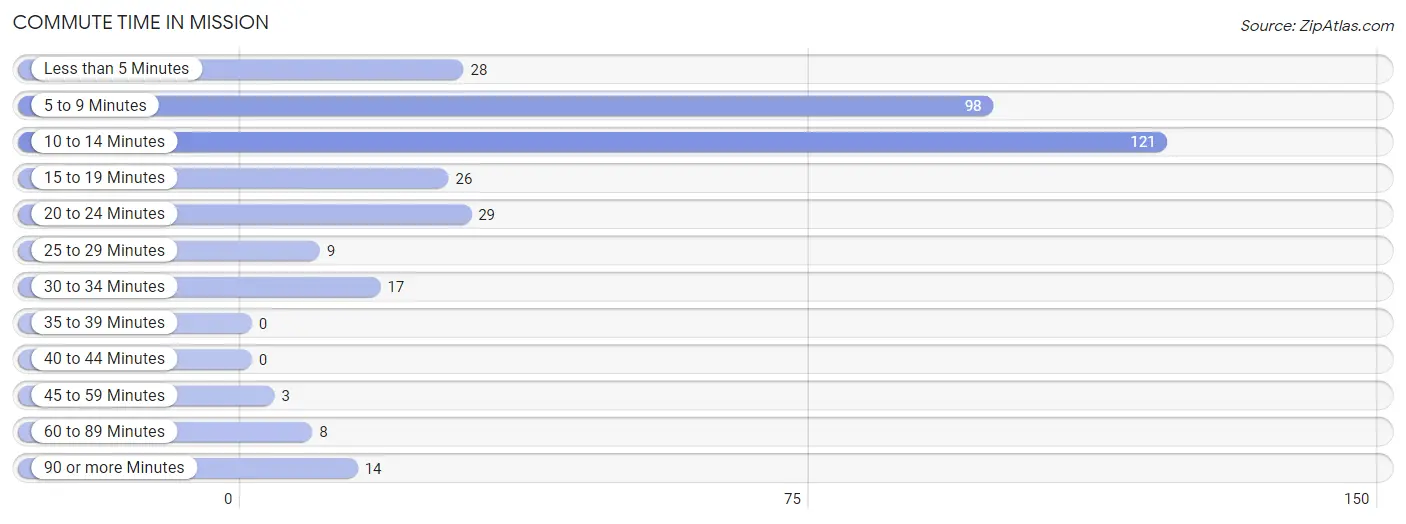
| Commute Time | # Commuters | % Commuters |
| Less than 5 Minutes | 28 | 7.9% |
| 5 to 9 Minutes | 98 | 27.8% |
| 10 to 14 Minutes | 121 | 34.3% |
| 15 to 19 Minutes | 26 | 7.4% |
| 20 to 24 Minutes | 29 | 8.2% |
| 25 to 29 Minutes | 9 | 2.5% |
| 30 to 34 Minutes | 17 | 4.8% |
| 35 to 39 Minutes | 0 | 0.0% |
| 40 to 44 Minutes | 0 | 0.0% |
| 45 to 59 Minutes | 3 | 0.9% |
| 60 to 89 Minutes | 8 | 2.3% |
| 90 or more Minutes | 14 | 4.0% |
Commute Time by Sex in Mission
The most common commute times in Mission are 5 to 9 minutes (73 commuters, 38.6%) for males and 10 to 14 minutes (62 commuters, 37.8%) for females.
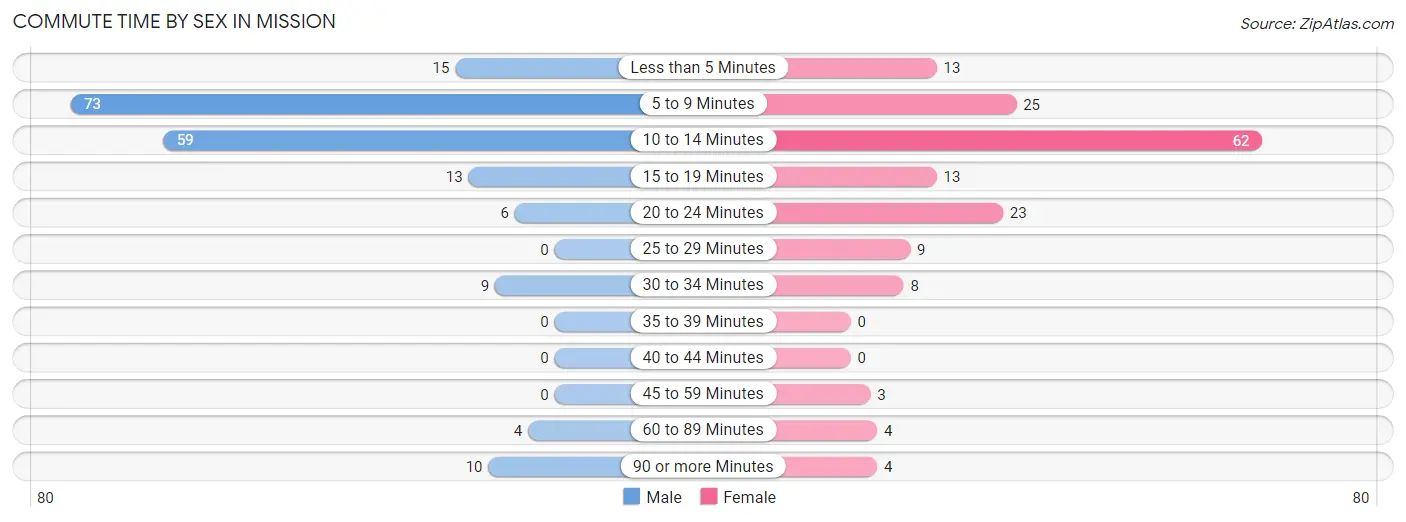
| Commute Time | Male | Female |
| Less than 5 Minutes | 15 (7.9%) | 13 (7.9%) |
| 5 to 9 Minutes | 73 (38.6%) | 25 (15.2%) |
| 10 to 14 Minutes | 59 (31.2%) | 62 (37.8%) |
| 15 to 19 Minutes | 13 (6.9%) | 13 (7.9%) |
| 20 to 24 Minutes | 6 (3.2%) | 23 (14.0%) |
| 25 to 29 Minutes | 0 (0.0%) | 9 (5.5%) |
| 30 to 34 Minutes | 9 (4.8%) | 8 (4.9%) |
| 35 to 39 Minutes | 0 (0.0%) | 0 (0.0%) |
| 40 to 44 Minutes | 0 (0.0%) | 0 (0.0%) |
| 45 to 59 Minutes | 0 (0.0%) | 3 (1.8%) |
| 60 to 89 Minutes | 4 (2.1%) | 4 (2.4%) |
| 90 or more Minutes | 10 (5.3%) | 4 (2.4%) |
Time of Departure to Work by Sex in Mission
The most frequent times of departure to work in Mission are 7:30 AM to 7:59 AM (67, 35.4%) for males and 7:30 AM to 7:59 AM (98, 59.8%) for females.
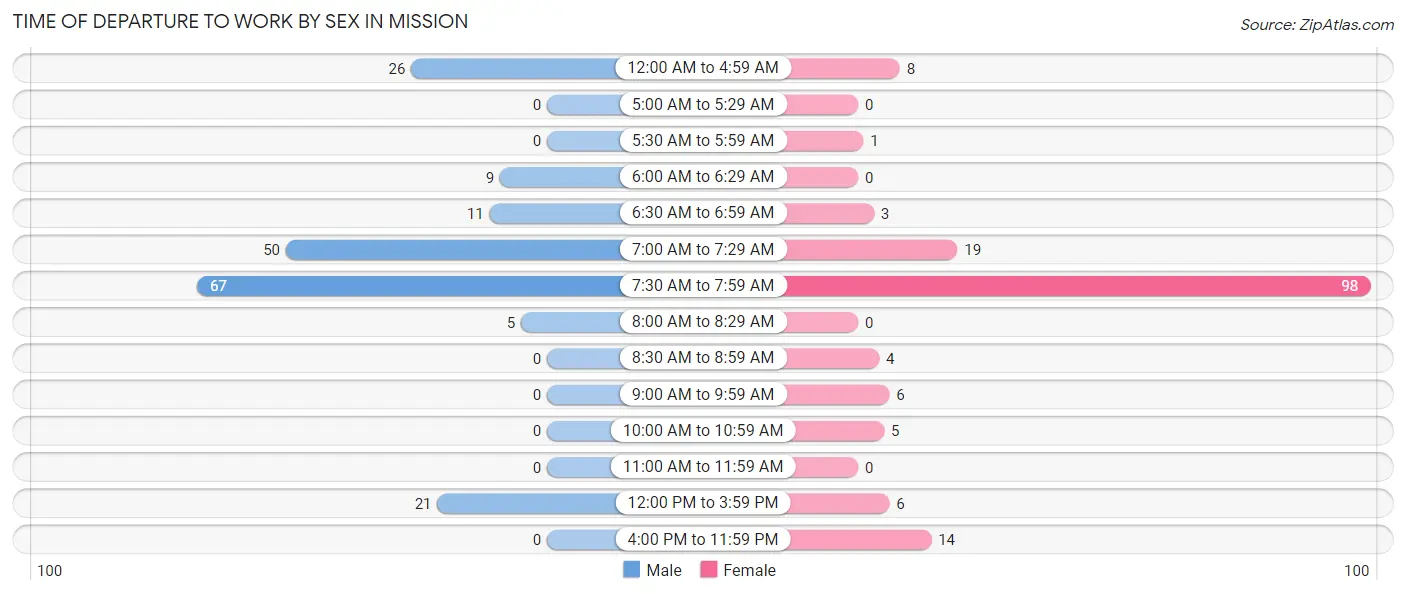
| Time of Departure | Male | Female |
| 12:00 AM to 4:59 AM | 26 (13.8%) | 8 (4.9%) |
| 5:00 AM to 5:29 AM | 0 (0.0%) | 0 (0.0%) |
| 5:30 AM to 5:59 AM | 0 (0.0%) | 1 (0.6%) |
| 6:00 AM to 6:29 AM | 9 (4.8%) | 0 (0.0%) |
| 6:30 AM to 6:59 AM | 11 (5.8%) | 3 (1.8%) |
| 7:00 AM to 7:29 AM | 50 (26.5%) | 19 (11.6%) |
| 7:30 AM to 7:59 AM | 67 (35.4%) | 98 (59.8%) |
| 8:00 AM to 8:29 AM | 5 (2.6%) | 0 (0.0%) |
| 8:30 AM to 8:59 AM | 0 (0.0%) | 4 (2.4%) |
| 9:00 AM to 9:59 AM | 0 (0.0%) | 6 (3.7%) |
| 10:00 AM to 10:59 AM | 0 (0.0%) | 5 (3.0%) |
| 11:00 AM to 11:59 AM | 0 (0.0%) | 0 (0.0%) |
| 12:00 PM to 3:59 PM | 21 (11.1%) | 6 (3.7%) |
| 4:00 PM to 11:59 PM | 0 (0.0%) | 14 (8.5%) |
| Total | 189 (100.0%) | 164 (100.0%) |
Housing Occupancy in Mission
Occupancy by Ownership in Mission
Of the total 375 dwellings in Mission, owner-occupied units account for 180 (48.0%), while renter-occupied units make up 195 (52.0%).
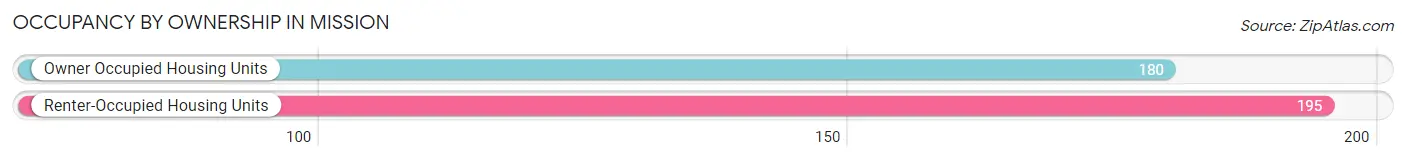
| Occupancy | # Housing Units | % Housing Units |
| Owner Occupied Housing Units | 180 | 48.0% |
| Renter-Occupied Housing Units | 195 | 52.0% |
| Total Occupied Housing Units | 375 | 100.0% |
Occupancy by Household Size in Mission
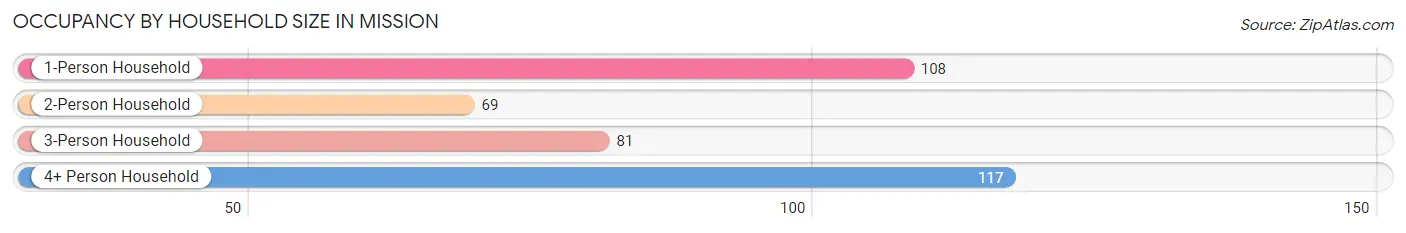
| Household Size | # Housing Units | % Housing Units |
| 1-Person Household | 108 | 28.8% |
| 2-Person Household | 69 | 18.4% |
| 3-Person Household | 81 | 21.6% |
| 4+ Person Household | 117 | 31.2% |
| Total Housing Units | 375 | 100.0% |
Occupancy by Ownership by Household Size in Mission
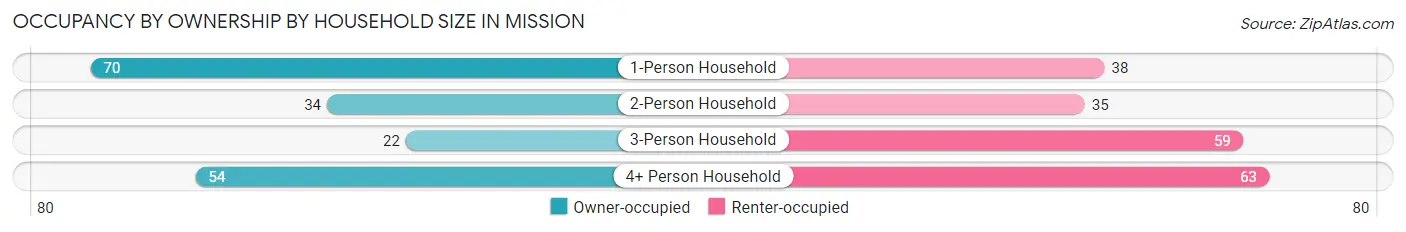
| Household Size | Owner-occupied | Renter-occupied |
| 1-Person Household | 70 (64.8%) | 38 (35.2%) |
| 2-Person Household | 34 (49.3%) | 35 (50.7%) |
| 3-Person Household | 22 (27.2%) | 59 (72.8%) |
| 4+ Person Household | 54 (46.2%) | 63 (53.8%) |
| Total Housing Units | 180 (48.0%) | 195 (52.0%) |
Occupancy by Educational Attainment in Mission
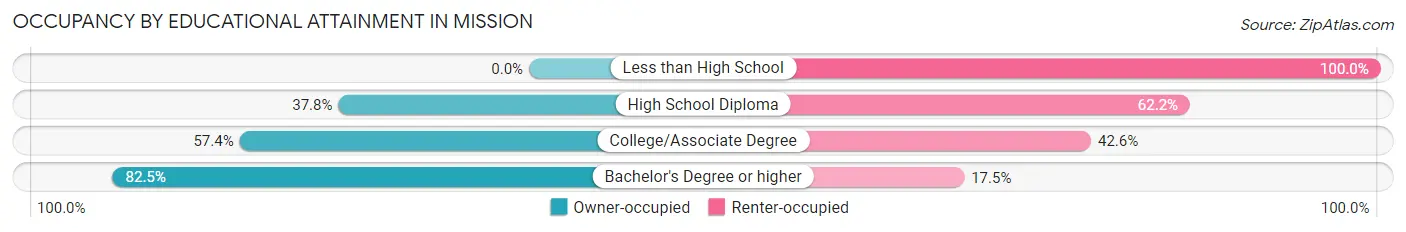
| Household Size | Owner-occupied | Renter-occupied |
| Less than High School | 0 (0.0%) | 61 (100.0%) |
| High School Diploma | 31 (37.8%) | 51 (62.2%) |
| College/Associate Degree | 97 (57.4%) | 72 (42.6%) |
| Bachelor's Degree or higher | 52 (82.5%) | 11 (17.5%) |
Occupancy by Age of Householder in Mission
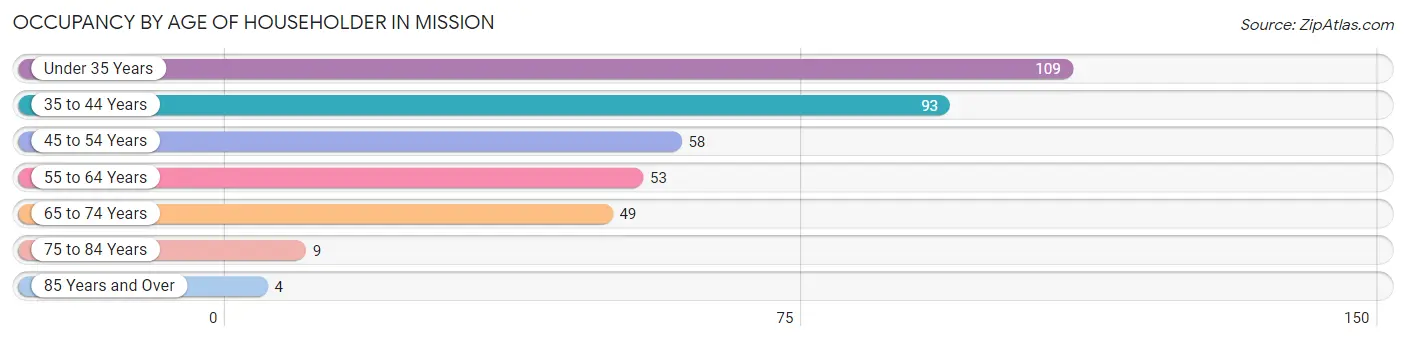
| Age Bracket | # Households | % Households |
| Under 35 Years | 109 | 29.1% |
| 35 to 44 Years | 93 | 24.8% |
| 45 to 54 Years | 58 | 15.5% |
| 55 to 64 Years | 53 | 14.1% |
| 65 to 74 Years | 49 | 13.1% |
| 75 to 84 Years | 9 | 2.4% |
| 85 Years and Over | 4 | 1.1% |
| Total | 375 | 100.0% |
Housing Finances in Mission
Median Income by Occupancy in Mission
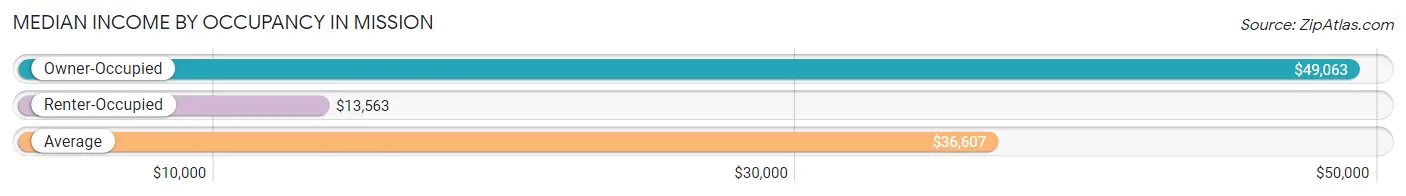
| Occupancy Type | # Households | Median Income |
| Owner-Occupied | 180 (48.0%) | $49,063 |
| Renter-Occupied | 195 (52.0%) | $13,563 |
| Average | 375 (100.0%) | $36,607 |
Occupancy by Householder Income Bracket in Mission
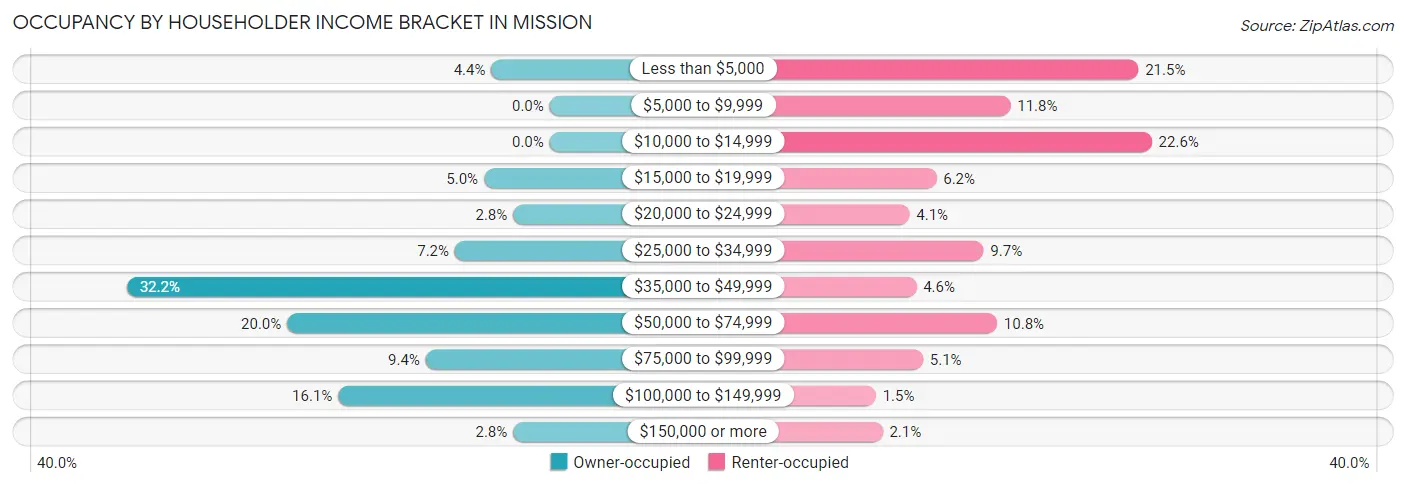
| Income Bracket | Owner-occupied | Renter-occupied |
| Less than $5,000 | 8 (4.4%) | 42 (21.5%) |
| $5,000 to $9,999 | 0 (0.0%) | 23 (11.8%) |
| $10,000 to $14,999 | 0 (0.0%) | 44 (22.6%) |
| $15,000 to $19,999 | 9 (5.0%) | 12 (6.1%) |
| $20,000 to $24,999 | 5 (2.8%) | 8 (4.1%) |
| $25,000 to $34,999 | 13 (7.2%) | 19 (9.7%) |
| $35,000 to $49,999 | 58 (32.2%) | 9 (4.6%) |
| $50,000 to $74,999 | 36 (20.0%) | 21 (10.8%) |
| $75,000 to $99,999 | 17 (9.4%) | 10 (5.1%) |
| $100,000 to $149,999 | 29 (16.1%) | 3 (1.5%) |
| $150,000 or more | 5 (2.8%) | 4 (2.1%) |
| Total | 180 (100.0%) | 195 (100.0%) |
Monthly Housing Cost Tiers in Mission
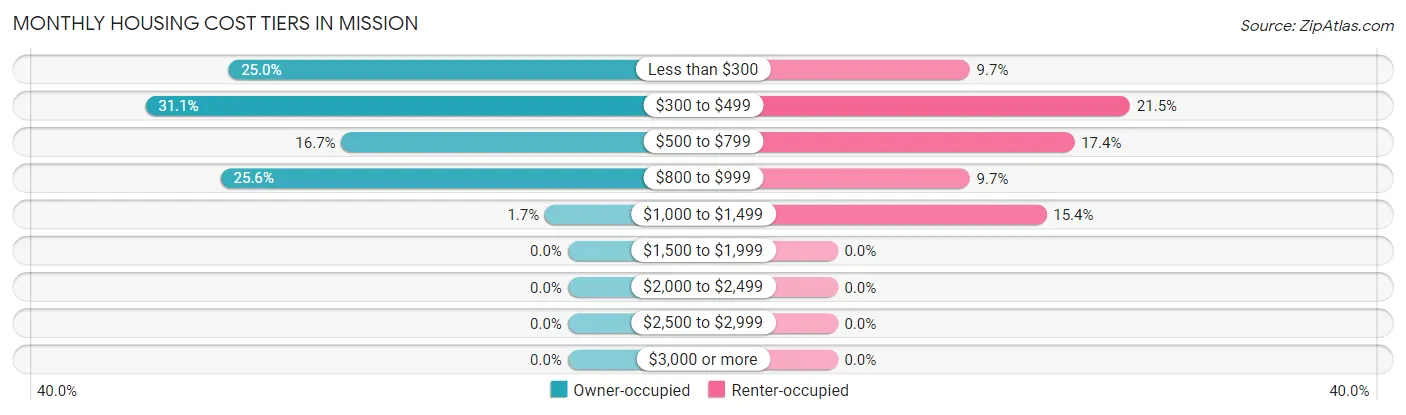
| Monthly Cost | Owner-occupied | Renter-occupied |
| Less than $300 | 45 (25.0%) | 19 (9.7%) |
| $300 to $499 | 56 (31.1%) | 42 (21.5%) |
| $500 to $799 | 30 (16.7%) | 34 (17.4%) |
| $800 to $999 | 46 (25.6%) | 19 (9.7%) |
| $1,000 to $1,499 | 3 (1.7%) | 30 (15.4%) |
| $1,500 to $1,999 | 0 (0.0%) | 0 (0.0%) |
| $2,000 to $2,499 | 0 (0.0%) | 0 (0.0%) |
| $2,500 to $2,999 | 0 (0.0%) | 0 (0.0%) |
| $3,000 or more | 0 (0.0%) | 0 (0.0%) |
| Total | 180 (100.0%) | 195 (100.0%) |
Physical Housing Characteristics in Mission
Housing Structures in Mission
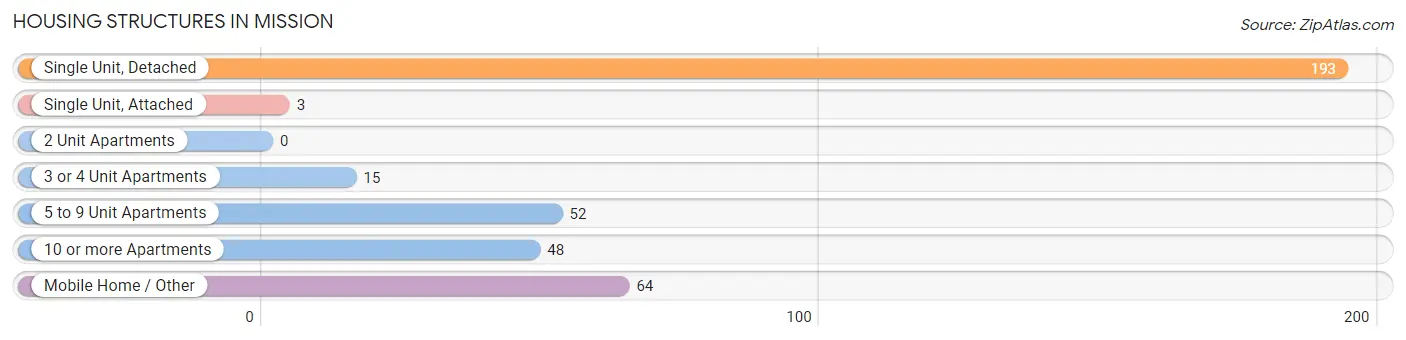
| Structure Type | # Housing Units | % Housing Units |
| Single Unit, Detached | 193 | 51.5% |
| Single Unit, Attached | 3 | 0.8% |
| 2 Unit Apartments | 0 | 0.0% |
| 3 or 4 Unit Apartments | 15 | 4.0% |
| 5 to 9 Unit Apartments | 52 | 13.9% |
| 10 or more Apartments | 48 | 12.8% |
| Mobile Home / Other | 64 | 17.1% |
| Total | 375 | 100.0% |
Housing Structures by Occupancy in Mission
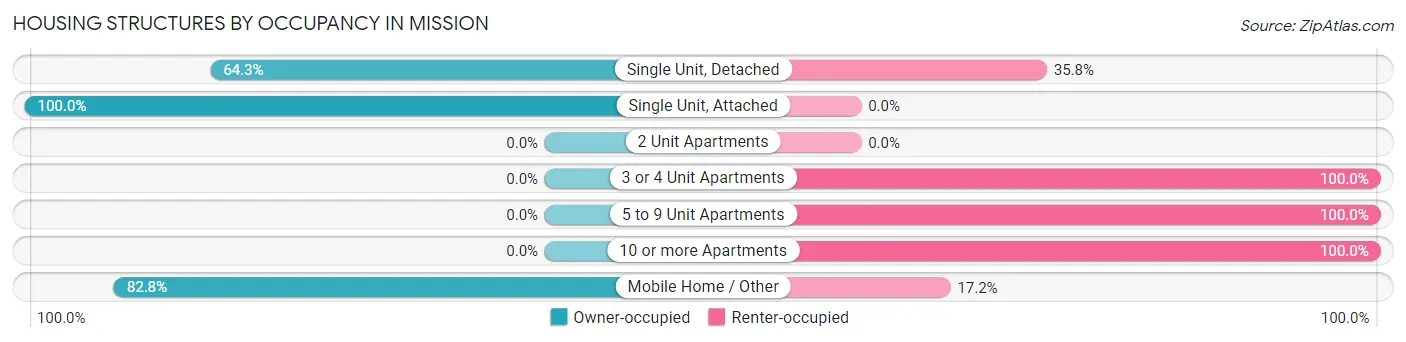
| Structure Type | Owner-occupied | Renter-occupied |
| Single Unit, Detached | 124 (64.2%) | 69 (35.7%) |
| Single Unit, Attached | 3 (100.0%) | 0 (0.0%) |
| 2 Unit Apartments | 0 (0.0%) | 0 (0.0%) |
| 3 or 4 Unit Apartments | 0 (0.0%) | 15 (100.0%) |
| 5 to 9 Unit Apartments | 0 (0.0%) | 52 (100.0%) |
| 10 or more Apartments | 0 (0.0%) | 48 (100.0%) |
| Mobile Home / Other | 53 (82.8%) | 11 (17.2%) |
| Total | 180 (48.0%) | 195 (52.0%) |
Housing Structures by Number of Rooms in Mission
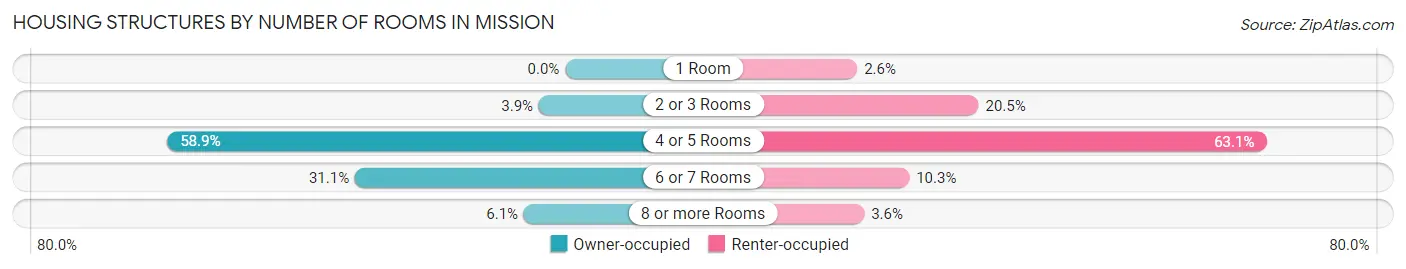
| Number of Rooms | Owner-occupied | Renter-occupied |
| 1 Room | 0 (0.0%) | 5 (2.6%) |
| 2 or 3 Rooms | 7 (3.9%) | 40 (20.5%) |
| 4 or 5 Rooms | 106 (58.9%) | 123 (63.1%) |
| 6 or 7 Rooms | 56 (31.1%) | 20 (10.3%) |
| 8 or more Rooms | 11 (6.1%) | 7 (3.6%) |
| Total | 180 (100.0%) | 195 (100.0%) |
Housing Structure by Heating Type in Mission
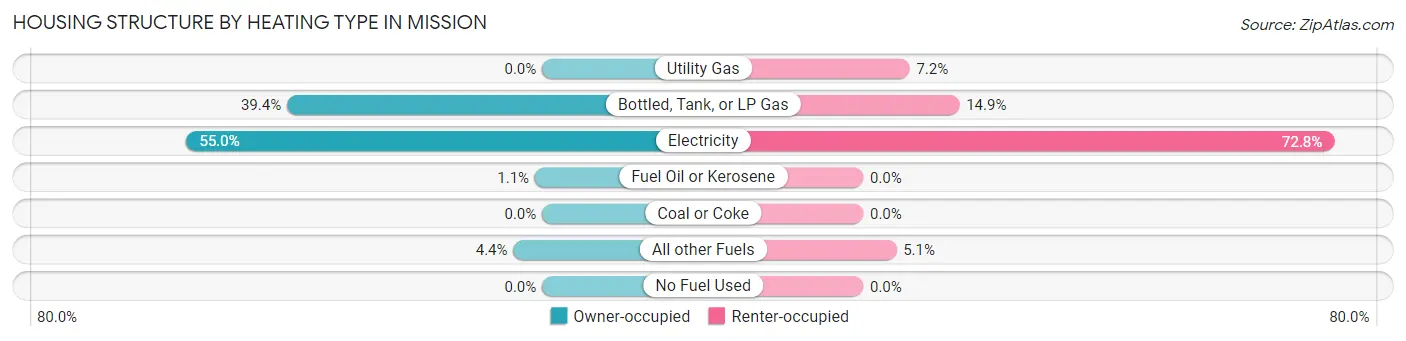
| Heating Type | Owner-occupied | Renter-occupied |
| Utility Gas | 0 (0.0%) | 14 (7.2%) |
| Bottled, Tank, or LP Gas | 71 (39.4%) | 29 (14.9%) |
| Electricity | 99 (55.0%) | 142 (72.8%) |
| Fuel Oil or Kerosene | 2 (1.1%) | 0 (0.0%) |
| Coal or Coke | 0 (0.0%) | 0 (0.0%) |
| All other Fuels | 8 (4.4%) | 10 (5.1%) |
| No Fuel Used | 0 (0.0%) | 0 (0.0%) |
| Total | 180 (100.0%) | 195 (100.0%) |
Household Vehicle Usage in Mission
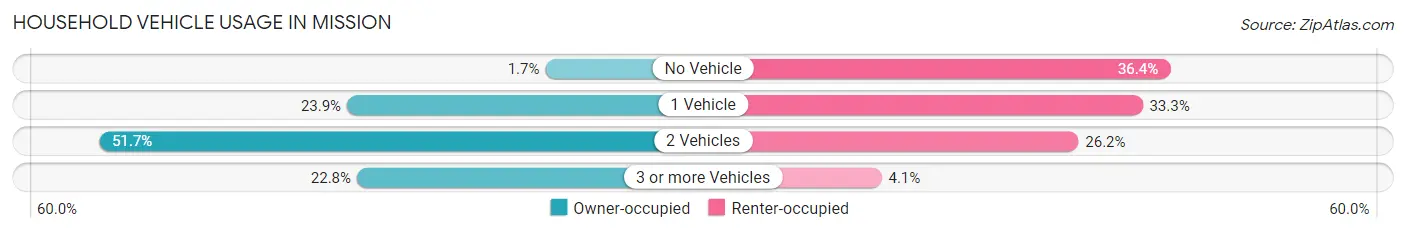
| Vehicles per Household | Owner-occupied | Renter-occupied |
| No Vehicle | 3 (1.7%) | 71 (36.4%) |
| 1 Vehicle | 43 (23.9%) | 65 (33.3%) |
| 2 Vehicles | 93 (51.7%) | 51 (26.2%) |
| 3 or more Vehicles | 41 (22.8%) | 8 (4.1%) |
| Total | 180 (100.0%) | 195 (100.0%) |
Real Estate & Mortgages in Mission
Real Estate and Mortgage Overview in Mission
| Characteristic | Without Mortgage | With Mortgage |
| Housing Units | 137 | 43 |
| Median Property Value | $54,400 | $54,200 |
| Median Household Income | $44,676 | $0 |
| Monthly Housing Costs | $349 | $0 |
| Real Estate Taxes | $959 | $9 |
Property Value by Mortgage Status in Mission
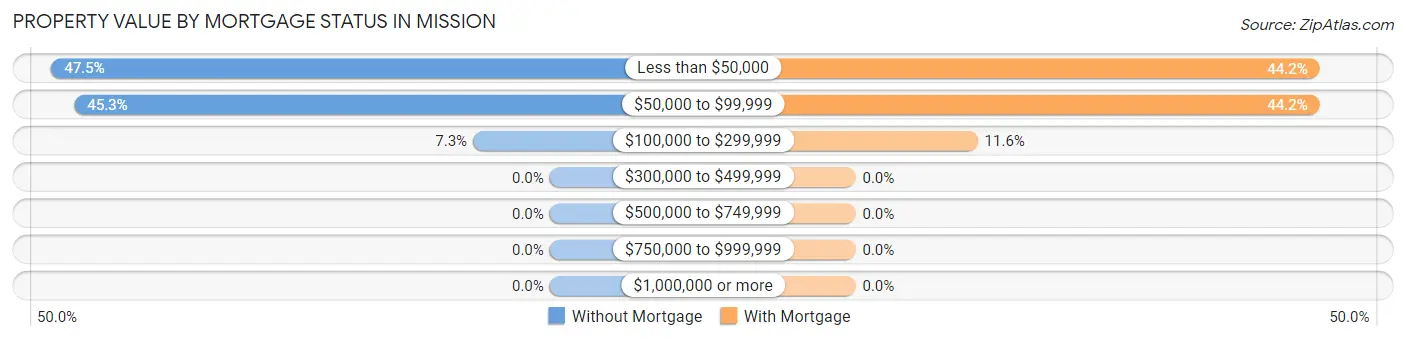
| Property Value | Without Mortgage | With Mortgage |
| Less than $50,000 | 65 (47.4%) | 19 (44.2%) |
| $50,000 to $99,999 | 62 (45.3%) | 19 (44.2%) |
| $100,000 to $299,999 | 10 (7.3%) | 5 (11.6%) |
| $300,000 to $499,999 | 0 (0.0%) | 0 (0.0%) |
| $500,000 to $749,999 | 0 (0.0%) | 0 (0.0%) |
| $750,000 to $999,999 | 0 (0.0%) | 0 (0.0%) |
| $1,000,000 or more | 0 (0.0%) | 0 (0.0%) |
| Total | 137 (100.0%) | 43 (100.0%) |
Household Income by Mortgage Status in Mission
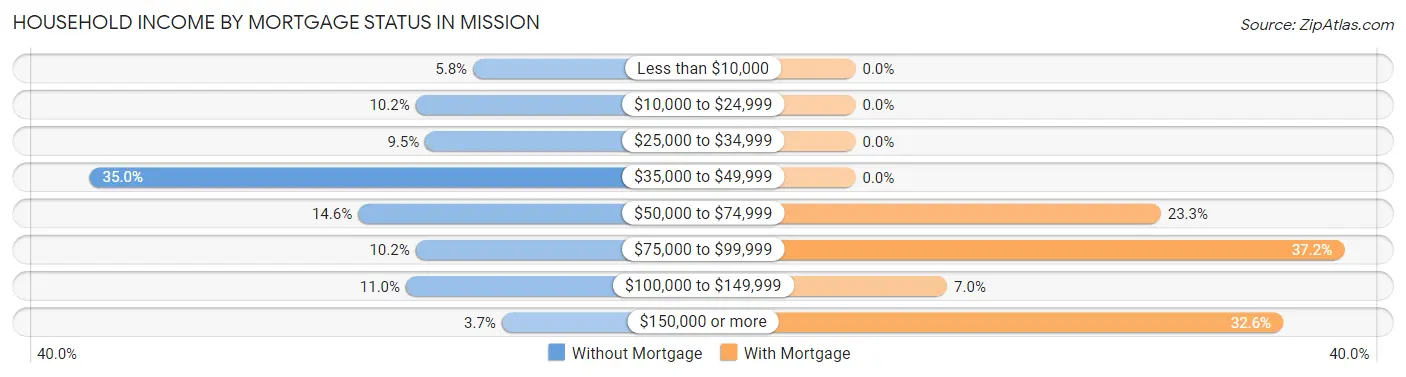
| Household Income | Without Mortgage | With Mortgage |
| Less than $10,000 | 8 (5.8%) | 0 (0.0%) |
| $10,000 to $24,999 | 14 (10.2%) | 0 (0.0%) |
| $25,000 to $34,999 | 13 (9.5%) | 0 (0.0%) |
| $35,000 to $49,999 | 48 (35.0%) | 0 (0.0%) |
| $50,000 to $74,999 | 20 (14.6%) | 10 (23.3%) |
| $75,000 to $99,999 | 14 (10.2%) | 16 (37.2%) |
| $100,000 to $149,999 | 15 (11.0%) | 3 (7.0%) |
| $150,000 or more | 5 (3.6%) | 14 (32.6%) |
| Total | 137 (100.0%) | 43 (100.0%) |
Property Value to Household Income Ratio in Mission
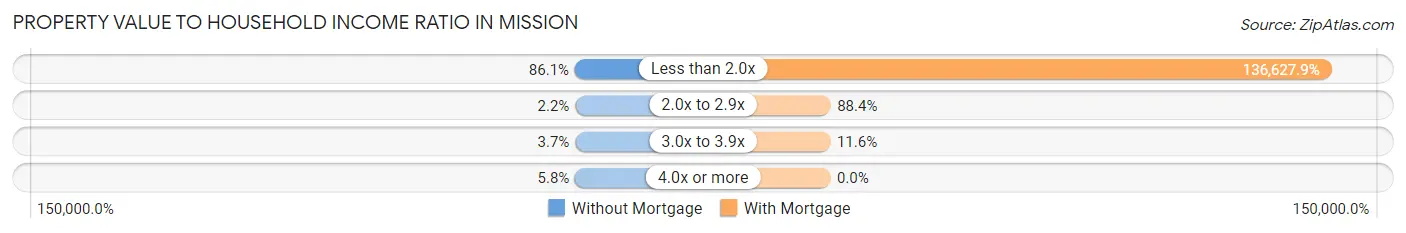
| Value-to-Income Ratio | Without Mortgage | With Mortgage |
| Less than 2.0x | 118 (86.1%) | 58,750 (136,627.9%) |
| 2.0x to 2.9x | 3 (2.2%) | 38 (88.4%) |
| 3.0x to 3.9x | 5 (3.6%) | 5 (11.6%) |
| 4.0x or more | 8 (5.8%) | 0 (0.0%) |
| Total | 137 (100.0%) | 43 (100.0%) |
Real Estate Taxes by Mortgage Status in Mission
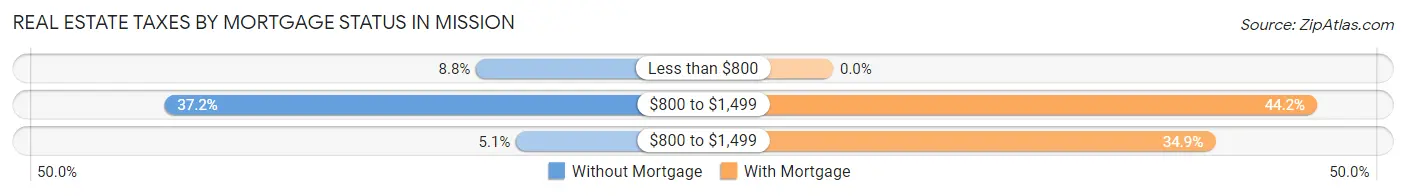
| Property Taxes | Without Mortgage | With Mortgage |
| Less than $800 | 12 (8.8%) | 0 (0.0%) |
| $800 to $1,499 | 51 (37.2%) | 19 (44.2%) |
| $800 to $1,499 | 7 (5.1%) | 15 (34.9%) |
| Total | 137 (100.0%) | 43 (100.0%) |
Health & Disability in Mission
Health Insurance Coverage by Age in Mission
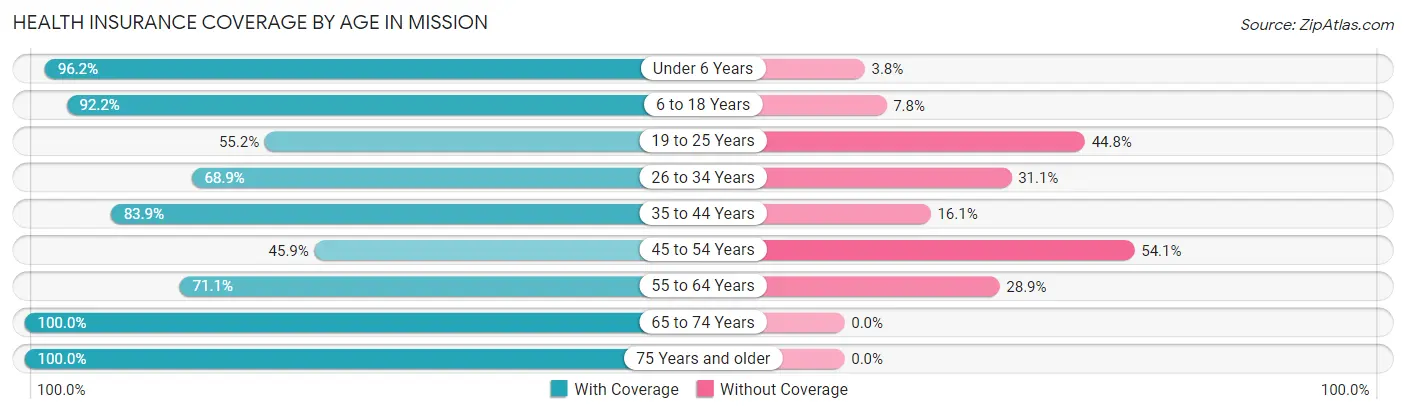
| Age Bracket | With Coverage | Without Coverage |
| Under 6 Years | 230 (96.2%) | 9 (3.8%) |
| 6 to 18 Years | 295 (92.2%) | 25 (7.8%) |
| 19 to 25 Years | 64 (55.2%) | 52 (44.8%) |
| 26 to 34 Years | 135 (68.9%) | 61 (31.1%) |
| 35 to 44 Years | 94 (83.9%) | 18 (16.1%) |
| 45 to 54 Years | 45 (45.9%) | 53 (54.1%) |
| 55 to 64 Years | 59 (71.1%) | 24 (28.9%) |
| 65 to 74 Years | 67 (100.0%) | 0 (0.0%) |
| 75 Years and older | 14 (100.0%) | 0 (0.0%) |
| Total | 1,003 (80.6%) | 242 (19.4%) |
Health Insurance Coverage by Citizenship Status in Mission
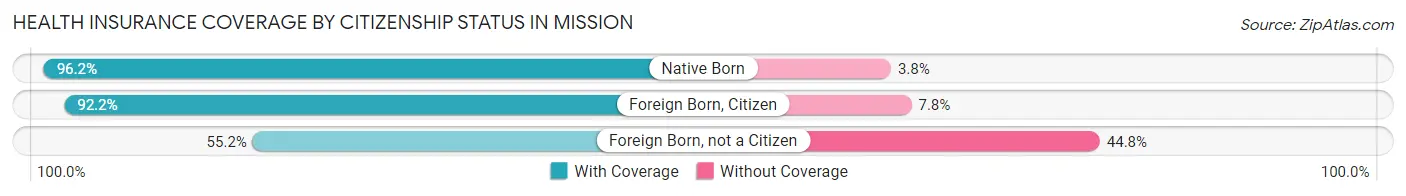
| Citizenship Status | With Coverage | Without Coverage |
| Native Born | 230 (96.2%) | 9 (3.8%) |
| Foreign Born, Citizen | 295 (92.2%) | 25 (7.8%) |
| Foreign Born, not a Citizen | 64 (55.2%) | 52 (44.8%) |
Health Insurance Coverage by Household Income in Mission
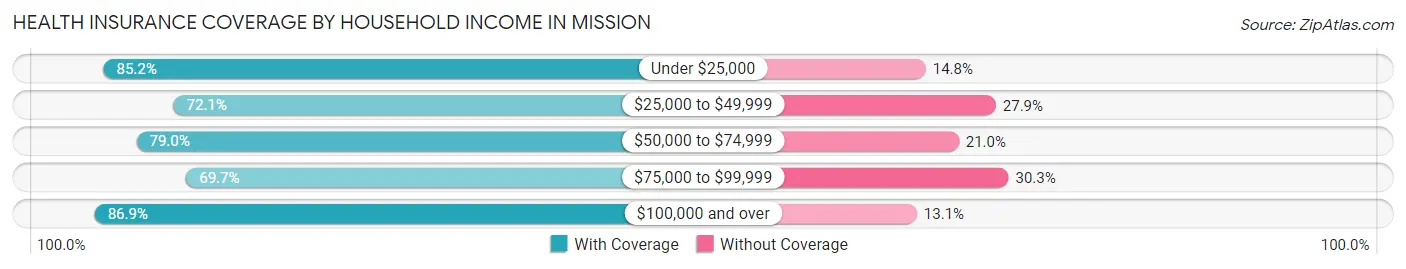
| Household Income | With Coverage | Without Coverage |
| Under $25,000 | 478 (85.2%) | 83 (14.8%) |
| $25,000 to $49,999 | 209 (72.1%) | 81 (27.9%) |
| $50,000 to $74,999 | 113 (79.0%) | 30 (21.0%) |
| $75,000 to $99,999 | 69 (69.7%) | 30 (30.3%) |
| $100,000 and over | 119 (86.9%) | 18 (13.1%) |
Public vs Private Health Insurance Coverage by Age in Mission
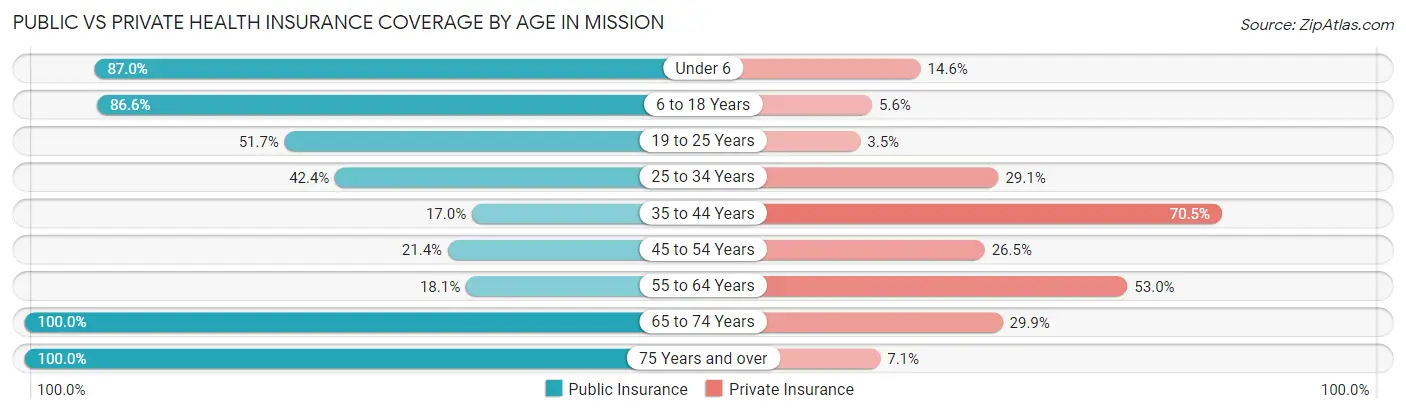
| Age Bracket | Public Insurance | Private Insurance |
| Under 6 | 208 (87.0%) | 35 (14.6%) |
| 6 to 18 Years | 277 (86.6%) | 18 (5.6%) |
| 19 to 25 Years | 60 (51.7%) | 4 (3.5%) |
| 25 to 34 Years | 83 (42.3%) | 57 (29.1%) |
| 35 to 44 Years | 19 (17.0%) | 79 (70.5%) |
| 45 to 54 Years | 21 (21.4%) | 26 (26.5%) |
| 55 to 64 Years | 15 (18.1%) | 44 (53.0%) |
| 65 to 74 Years | 67 (100.0%) | 20 (29.8%) |
| 75 Years and over | 14 (100.0%) | 1 (7.1%) |
| Total | 764 (61.4%) | 284 (22.8%) |
Disability Status by Sex by Age in Mission
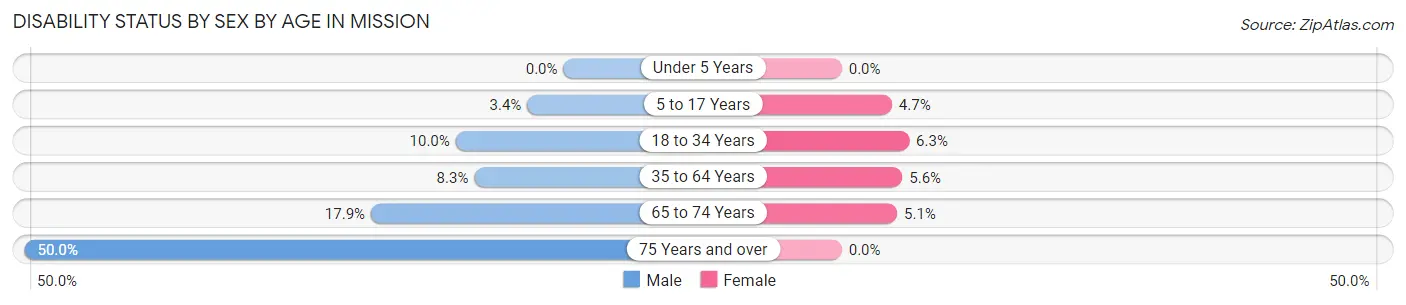
| Age Bracket | Male | Female |
| Under 5 Years | 0 (0.0%) | 0 (0.0%) |
| 5 to 17 Years | 5 (3.4%) | 8 (4.6%) |
| 18 to 34 Years | 16 (10.0%) | 11 (6.2%) |
| 35 to 64 Years | 11 (8.3%) | 9 (5.6%) |
| 65 to 74 Years | 5 (17.9%) | 2 (5.1%) |
| 75 Years and over | 3 (50.0%) | 0 (0.0%) |
Disability Class by Sex by Age in Mission
Disability Class: Hearing Difficulty
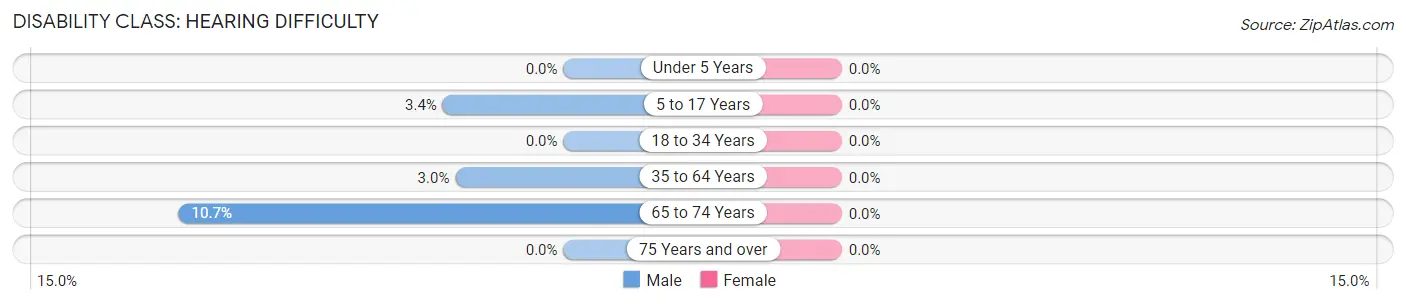
| Age Bracket | Male | Female |
| Under 5 Years | 0 (0.0%) | 0 (0.0%) |
| 5 to 17 Years | 5 (3.4%) | 0 (0.0%) |
| 18 to 34 Years | 0 (0.0%) | 0 (0.0%) |
| 35 to 64 Years | 4 (3.0%) | 0 (0.0%) |
| 65 to 74 Years | 3 (10.7%) | 0 (0.0%) |
| 75 Years and over | 0 (0.0%) | 0 (0.0%) |
Disability Class: Vision Difficulty
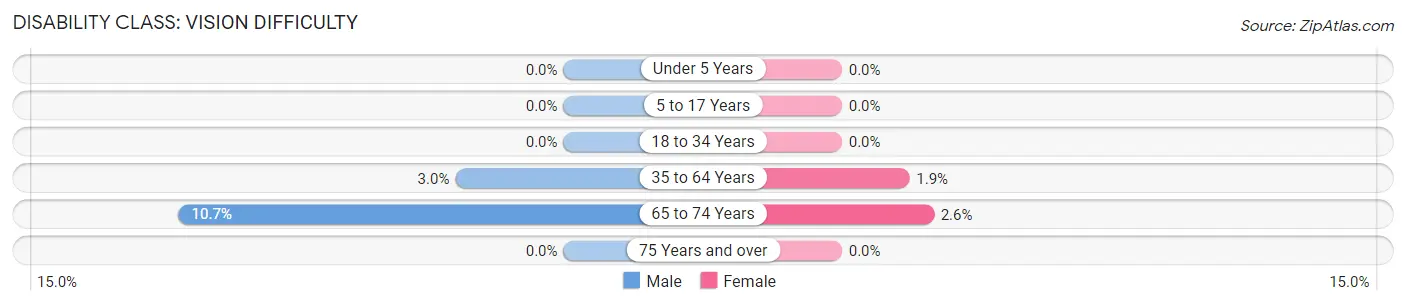
| Age Bracket | Male | Female |
| Under 5 Years | 0 (0.0%) | 0 (0.0%) |
| 5 to 17 Years | 0 (0.0%) | 0 (0.0%) |
| 18 to 34 Years | 0 (0.0%) | 0 (0.0%) |
| 35 to 64 Years | 4 (3.0%) | 3 (1.9%) |
| 65 to 74 Years | 3 (10.7%) | 1 (2.6%) |
| 75 Years and over | 0 (0.0%) | 0 (0.0%) |
Disability Class: Cognitive Difficulty
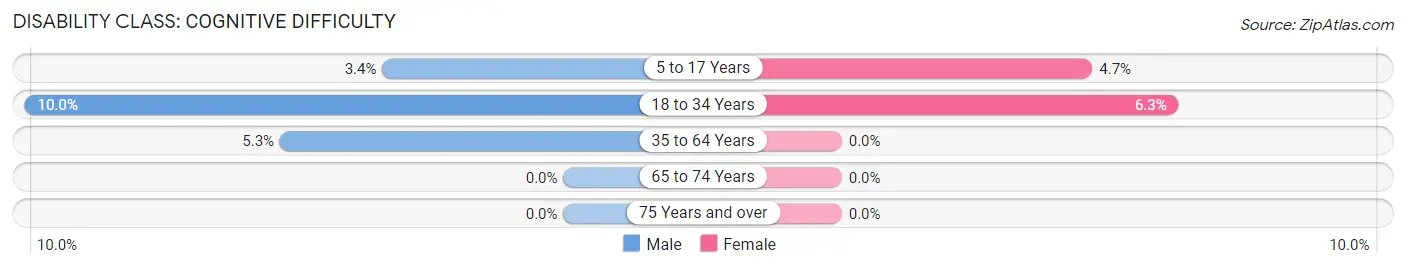
| Age Bracket | Male | Female |
| 5 to 17 Years | 5 (3.4%) | 8 (4.6%) |
| 18 to 34 Years | 16 (10.0%) | 11 (6.2%) |
| 35 to 64 Years | 7 (5.3%) | 0 (0.0%) |
| 65 to 74 Years | 0 (0.0%) | 0 (0.0%) |
| 75 Years and over | 0 (0.0%) | 0 (0.0%) |
Disability Class: Ambulatory Difficulty
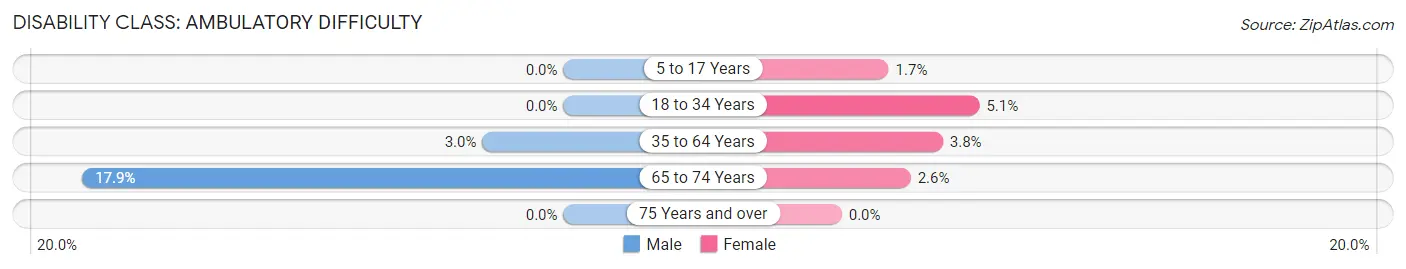
| Age Bracket | Male | Female |
| 5 to 17 Years | 0 (0.0%) | 3 (1.7%) |
| 18 to 34 Years | 0 (0.0%) | 9 (5.1%) |
| 35 to 64 Years | 4 (3.0%) | 6 (3.7%) |
| 65 to 74 Years | 5 (17.9%) | 1 (2.6%) |
| 75 Years and over | 0 (0.0%) | 0 (0.0%) |
Disability Class: Self-Care Difficulty
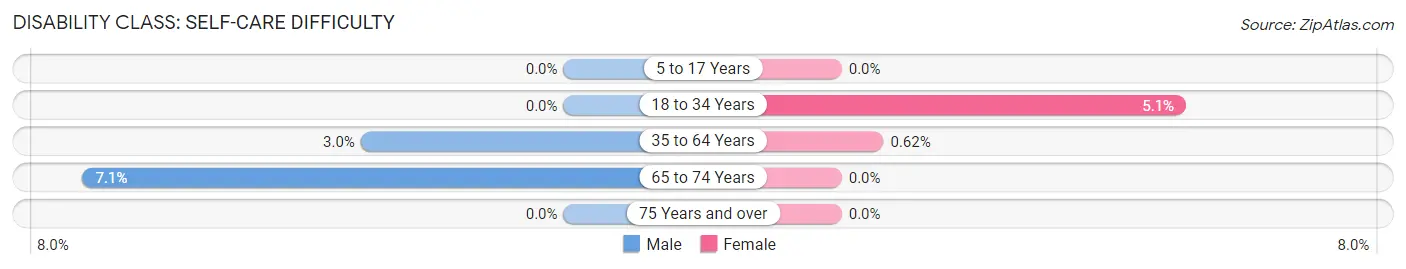
| Age Bracket | Male | Female |
| 5 to 17 Years | 0 (0.0%) | 0 (0.0%) |
| 18 to 34 Years | 0 (0.0%) | 9 (5.1%) |
| 35 to 64 Years | 4 (3.0%) | 1 (0.6%) |
| 65 to 74 Years | 2 (7.1%) | 0 (0.0%) |
| 75 Years and over | 0 (0.0%) | 0 (0.0%) |
Technology Access in Mission
Computing Device Access in Mission
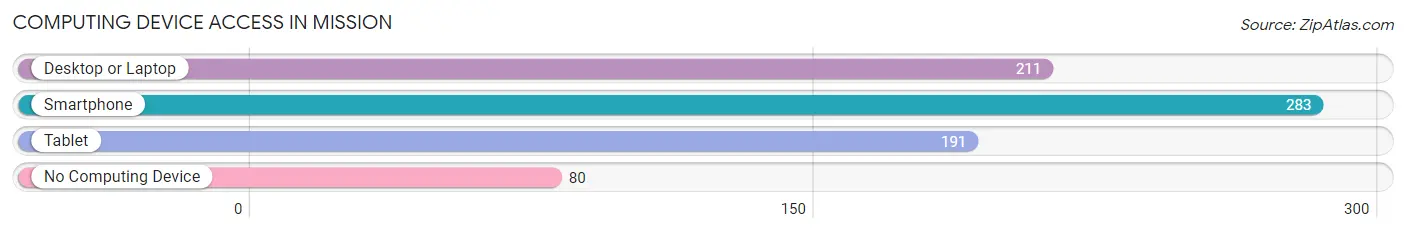
| Device Type | # Households | % Households |
| Desktop or Laptop | 211 | 56.3% |
| Smartphone | 283 | 75.5% |
| Tablet | 191 | 50.9% |
| No Computing Device | 80 | 21.3% |
| Total | 375 | 100.0% |
Internet Access in Mission
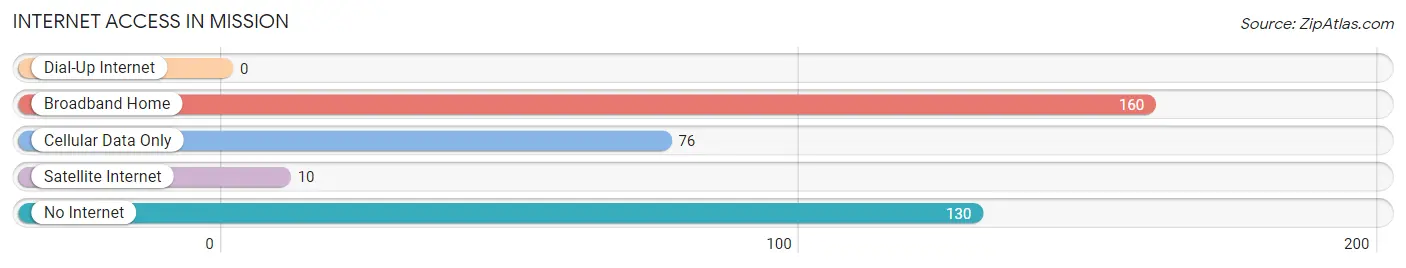
| Internet Type | # Households | % Households |
| Dial-Up Internet | 0 | 0.0% |
| Broadband Home | 160 | 42.7% |
| Cellular Data Only | 76 | 20.3% |
| Satellite Internet | 10 | 2.7% |
| No Internet | 130 | 34.7% |
| Total | 375 | 100.0% |
Mission Summary
Mission is a city located in Hidalgo County, Texas, United States. It is one of the oldest cities in the Rio Grande Valley and is the largest city in Hidalgo County. The population was estimated to be 81,542 in 2019.
Geography
Mission is located in the Rio Grande Valley of South Texas, approximately 20 miles (32 km) west of the city of McAllen. It is situated on the north bank of the Rio Grande, across from the Mexican city of Reynosa, Tamaulipas. Mission is part of the McAllen–Edinburg–Mission metropolitan area, which is one of the fastest-growing metropolitan areas in the United States.
The city is located in the Rio Grande Plains, a subregion of the South Texas Plains. The terrain is generally flat, with some rolling hills. The climate is subtropical and semi-arid, with hot summers and mild winters. The average annual precipitation is 22.7 inches (578 mm).
Economy
Mission is a major economic center in the Rio Grande Valley. The city is home to several large employers, including Mission Regional Medical Center, Mission Consolidated Independent School District, and Mission Foods. The city is also home to several industrial parks, including the Mission Industrial Park, which is home to several manufacturing and distribution companies.
The city is also a major retail center, with several shopping centers and retail outlets. The city is home to the La Plaza Mall, which is the largest shopping mall in the Rio Grande Valley.
Demographics
As of the 2010 census, Mission had a population of 77,058. The racial makeup of the city was 77.2% White, 0.7% African American, 0.5% Native American, 0.7% Asian, 0.1% Pacific Islander, 19.2% from other races, and 2.1% from two or more races. Hispanic or Latino of any race were 97.2% of the population.
The median income for a household in the city was $30,845, and the median income for a family was $35,845. The per capita income for the city was $14,845. About 22.2% of families and 25.7% of the population were below the poverty line, including 33.3% of those under age 18 and 18.2% of those age 65 or over.
Mission is a culturally diverse city, with a large Hispanic population. The city is home to a variety of cultural events, including the annual Mission Fiesta, which celebrates the city's Mexican heritage. The city is also home to several museums, including the Museum of South Texas History and the World Birding Center.
Common Questions
What is Per Capita Income in Mission?
Per Capita income in Mission is $14,568.
What is the Median Family Income in Mission?
Median Family Income in Mission is $34,375.
What is the Median Household income in Mission?
Median Household Income in Mission is $36,607.
What is Income or Wage Gap in Mission?
Income or Wage Gap in Mission is 22.7%.
Women in Mission earn 77.3 cents for every dollar earned by a man.
What is Family Income Deficit in Mission?
Family Income Deficit in Mission is $16,980.
Families that are below poverty line in Mission earn $16,980 less on average than the poverty threshold level.
What is Inequality or Gini Index in Mission?
Inequality or Gini Index in Mission is 0.48.
What is the Total Population of Mission?
Total Population of Mission is 1,256.
What is the Total Male Population of Mission?
Total Male Population of Mission is 595.
What is the Total Female Population of Mission?
Total Female Population of Mission is 661.
What is the Ratio of Males per 100 Females in Mission?
There are 90.02 Males per 100 Females in Mission.
What is the Ratio of Females per 100 Males in Mission?
There are 111.09 Females per 100 Males in Mission.
What is the Median Population Age in Mission?
Median Population Age in Mission is 22.1 Years.
What is the Average Family Size in Mission
Average Family Size in Mission is 4.1 People.
What is the Average Household Size in Mission
Average Household Size in Mission is 3.3 People.
How Large is the Labor Force in Mission?
There are 437 People in the Labor Forcein in Mission.
What is the Percentage of People in the Labor Force in Mission?
58.0% of People are in the Labor Force in Mission.
What is the Unemployment Rate in Mission?
Unemployment Rate in Mission is 17.4%.