Pierre, SD Map & Demographics
Pierre Map
Pierre Overview
$37,285
PER CAPITA INCOME
$89,803
AVG FAMILY INCOME
$80,473
AVG HOUSEHOLD INCOME
22.0%
WAGE / INCOME GAP [ % ]
78.0¢/ $1
WAGE / INCOME GAP [ $ ]
0.39
INEQUALITY / GINI INDEX
14,105
TOTAL POPULATION
6,751
MALE POPULATION
7,354
FEMALE POPULATION
91.80
MALES / 100 FEMALES
108.93
FEMALES / 100 MALES
39.6
MEDIAN AGE
2.6
AVG FAMILY SIZE
2.1
AVG HOUSEHOLD SIZE
7,350
LABOR FORCE [ PEOPLE ]
65.0%
PERCENT IN LABOR FORCE
0.5%
UNEMPLOYMENT RATE
Pierre Zip Codes
Pierre Area Codes
Income in Pierre
Income Overview in Pierre
Per Capita Income in Pierre is $37,285, while median incomes of families and households are $89,803 and $80,473 respectively.
| Characteristic | Number | Measure |
| Per Capita Income | 14,105 | $37,285 |
| Median Family Income | 3,622 | $89,803 |
| Mean Family Income | 3,622 | $102,244 |
| Median Household Income | 6,092 | $80,473 |
| Mean Household Income | 6,092 | $85,479 |
| Income Deficit | 3,622 | $0 |
| Wage / Income Gap (%) | 14,105 | 22.02% |
| Wage / Income Gap ($) | 14,105 | 77.98¢ per $1 |
| Gini / Inequality Index | 14,105 | 0.39 |
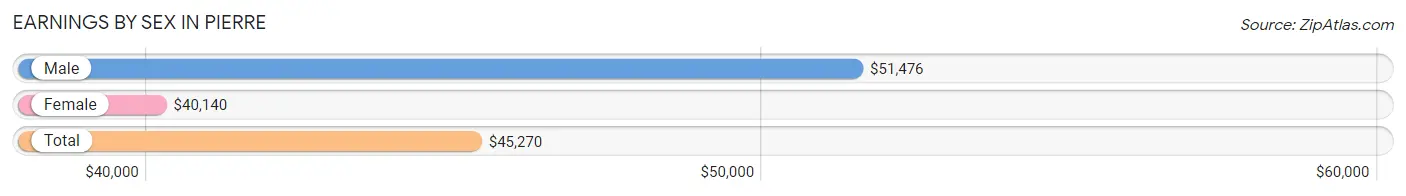
Earnings by Sex in Pierre
Average Earnings in Pierre are $45,270, $51,476 for men and $40,140 for women, a difference of 22.0%.
| Sex | Number | Average Earnings |
| Male | 4,140 (50.1%) | $51,476 |
| Female | 4,115 (49.8%) | $40,140 |
| Total | 8,255 (100.0%) | $45,270 |
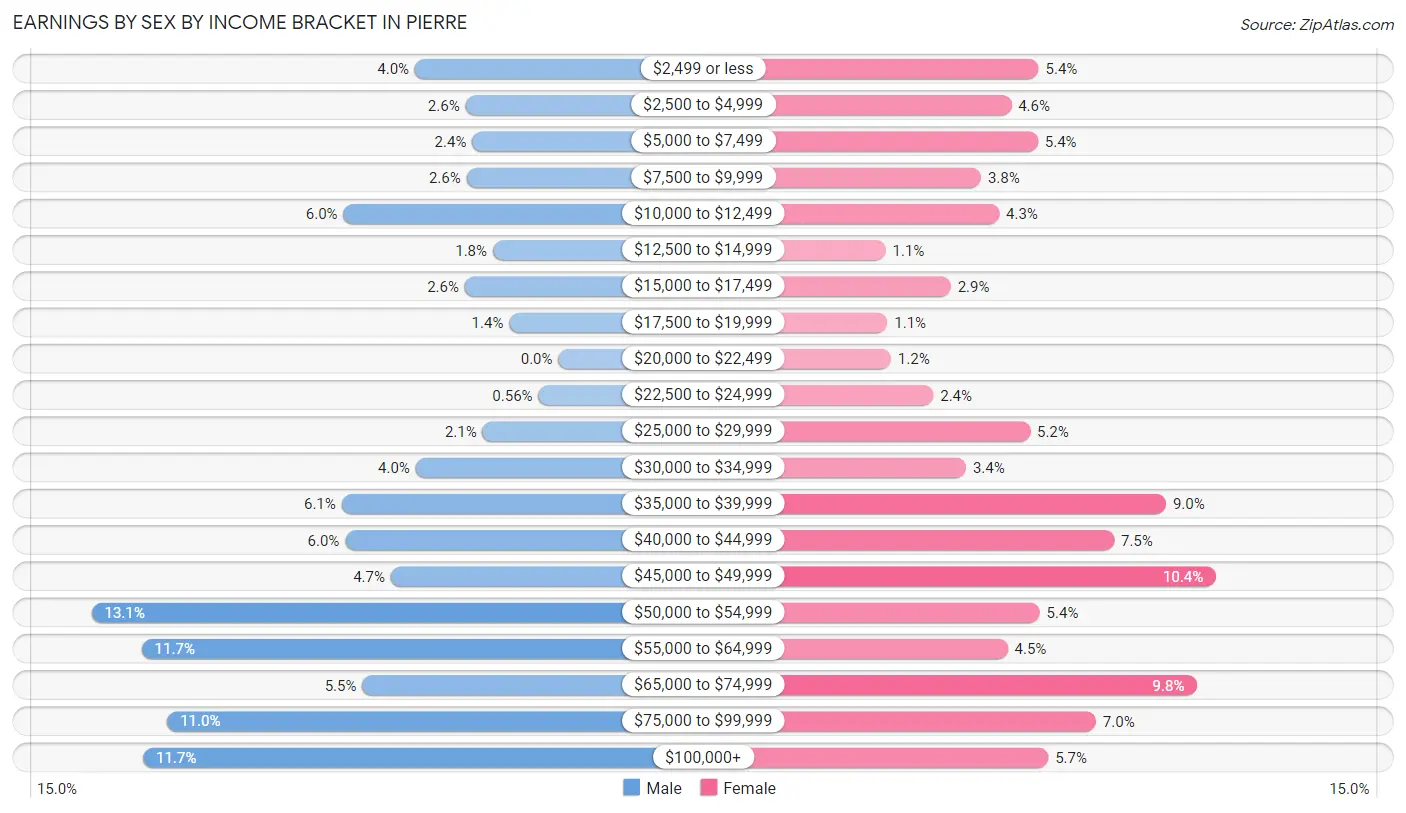
Earnings by Sex by Income Bracket in Pierre
The most common earnings brackets in Pierre are $50,000 to $54,999 for men (543 | 13.1%) and $45,000 to $49,999 for women (426 | 10.3%).
| Income | Male | Female |
| $2,499 or less | 167 (4.0%) | 222 (5.4%) |
| $2,500 to $4,999 | 108 (2.6%) | 190 (4.6%) |
| $5,000 to $7,499 | 100 (2.4%) | 221 (5.4%) |
| $7,500 to $9,999 | 107 (2.6%) | 155 (3.8%) |
| $10,000 to $12,499 | 250 (6.0%) | 176 (4.3%) |
| $12,500 to $14,999 | 76 (1.8%) | 45 (1.1%) |
| $15,000 to $17,499 | 109 (2.6%) | 120 (2.9%) |
| $17,500 to $19,999 | 57 (1.4%) | 47 (1.1%) |
| $20,000 to $22,499 | 0 (0.0%) | 51 (1.2%) |
| $22,500 to $24,999 | 23 (0.6%) | 100 (2.4%) |
| $25,000 to $29,999 | 88 (2.1%) | 212 (5.1%) |
| $30,000 to $34,999 | 166 (4.0%) | 138 (3.4%) |
| $35,000 to $39,999 | 252 (6.1%) | 369 (9.0%) |
| $40,000 to $44,999 | 248 (6.0%) | 309 (7.5%) |
| $45,000 to $49,999 | 195 (4.7%) | 426 (10.3%) |
| $50,000 to $54,999 | 543 (13.1%) | 223 (5.4%) |
| $55,000 to $64,999 | 485 (11.7%) | 186 (4.5%) |
| $65,000 to $74,999 | 228 (5.5%) | 404 (9.8%) |
| $75,000 to $99,999 | 455 (11.0%) | 288 (7.0%) |
| $100,000+ | 483 (11.7%) | 233 (5.7%) |
| Total | 4,140 (100.0%) | 4,115 (100.0%) |
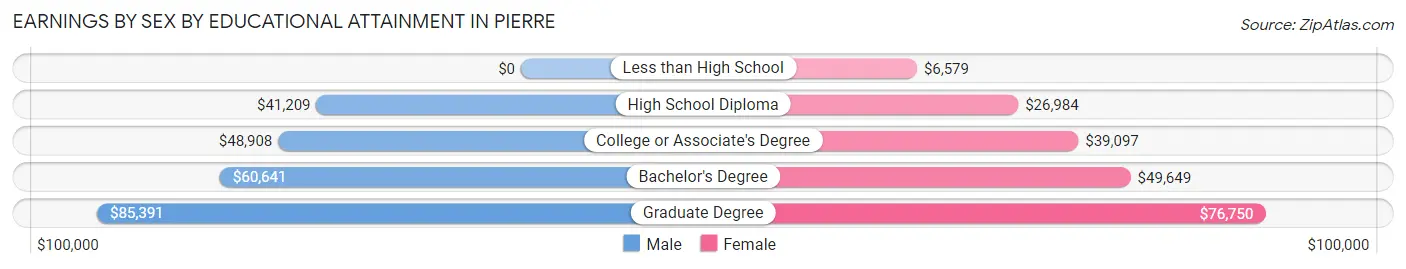
Earnings by Sex by Educational Attainment in Pierre
Average earnings in Pierre are $53,487 for men and $43,197 for women, a difference of 19.2%. Men with an educational attainment of graduate degree enjoy the highest average annual earnings of $85,391, while those with high school diploma education earn the least with $41,209. Women with an educational attainment of graduate degree earn the most with the average annual earnings of $76,750, while those with less than high school education have the smallest earnings of $6,579.
| Educational Attainment | Male Income | Female Income |
| Less than High School | - | - |
| High School Diploma | $41,209 | $26,984 |
| College or Associate's Degree | $48,908 | $39,097 |
| Bachelor's Degree | $60,641 | $49,649 |
| Graduate Degree | $85,391 | $76,750 |
| Total | $53,487 | $43,197 |
Family Income in Pierre
Family Income Brackets in Pierre
According to the Pierre family income data, there are 768 families falling into the $100,000 to $149,999 income range, which is the most common income bracket and makes up 21.2% of all families. Conversely, the $10,000 to $14,999 income bracket is the least frequent group with only 43 families (1.2%) belonging to this category.
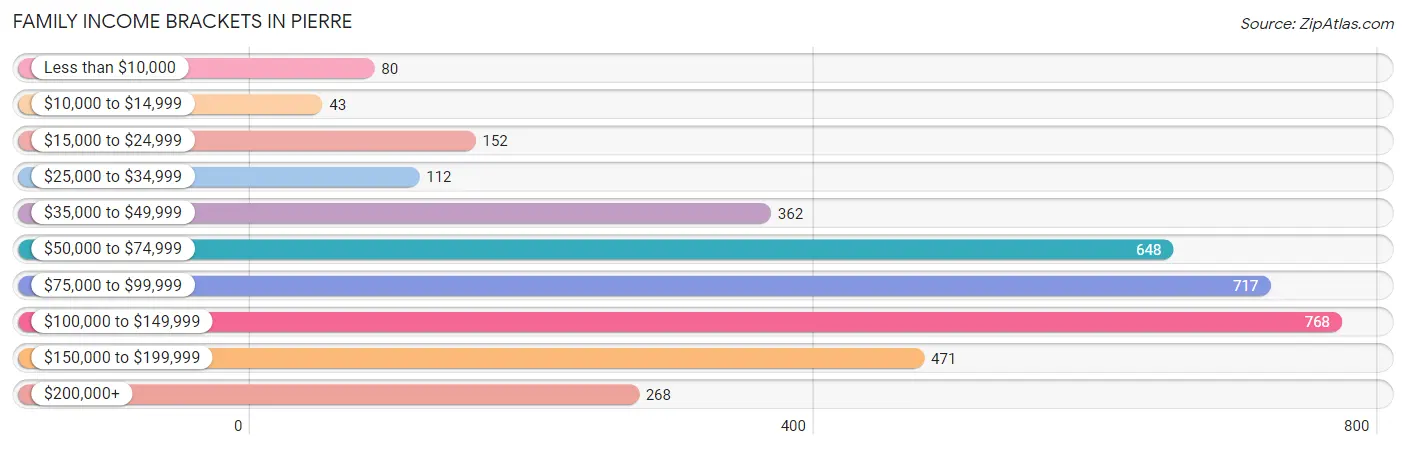
| Income Bracket | # Families | % Families |
| Less than $10,000 | 80 | 2.2% |
| $10,000 to $14,999 | 43 | 1.2% |
| $15,000 to $24,999 | 152 | 4.2% |
| $25,000 to $34,999 | 112 | 3.1% |
| $35,000 to $49,999 | 362 | 10.0% |
| $50,000 to $74,999 | 648 | 17.9% |
| $75,000 to $99,999 | 717 | 19.8% |
| $100,000 to $149,999 | 768 | 21.2% |
| $150,000 to $199,999 | 471 | 13.0% |
| $200,000+ | 268 | 7.4% |
Family Income by Famaliy Size in Pierre
4-person families (562 | 15.5%) account for the highest median family income in Pierre with $107,256 per family, while 2-person families (2,265 | 62.5%) have the highest median income of $41,466 per family member.
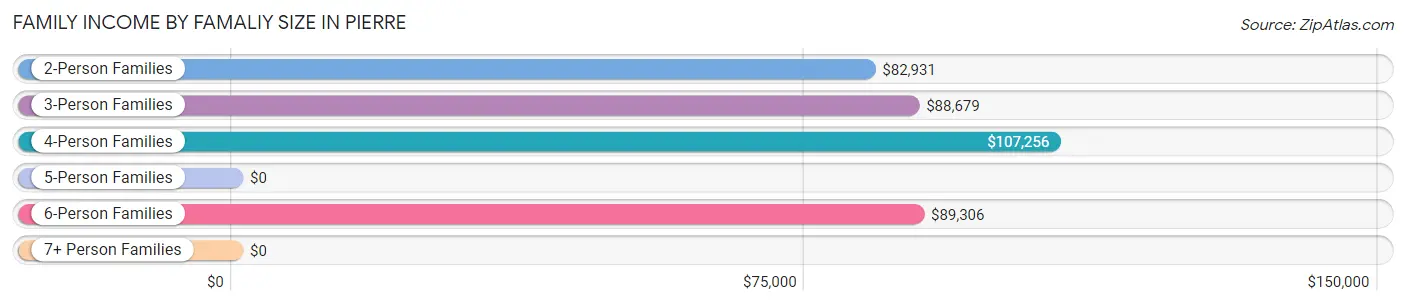
| Income Bracket | # Families | Median Income |
| 2-Person Families | 2,265 (62.5%) | $82,931 |
| 3-Person Families | 611 (16.9%) | $88,679 |
| 4-Person Families | 562 (15.5%) | $107,256 |
| 5-Person Families | 109 (3.0%) | $0 |
| 6-Person Families | 39 (1.1%) | $89,306 |
| 7+ Person Families | 36 (1.0%) | $0 |
| Total | 3,622 (100.0%) | $89,803 |
Family Income by Number of Earners in Pierre
The median family income in Pierre is $89,803, with families comprising 3+ earners (350) having the highest median family income of $165,682, while families with 1 earner (1,356) have the lowest median family income of $54,611, accounting for 9.7% and 37.4% of families, respectively.
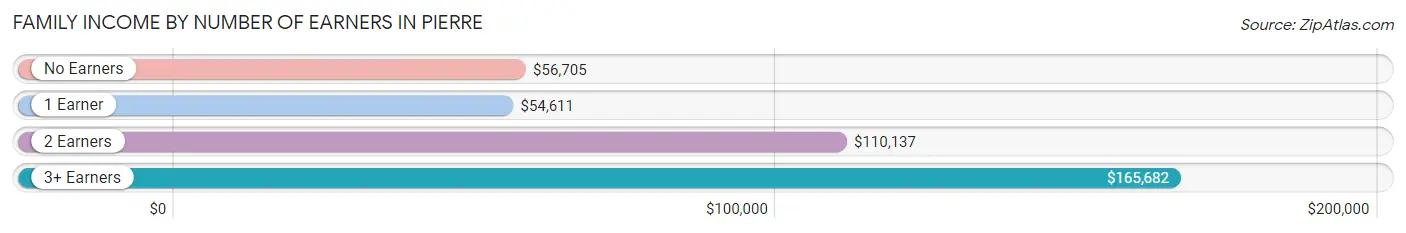
| Number of Earners | # Families | Median Income |
| No Earners | 396 (10.9%) | $56,705 |
| 1 Earner | 1,356 (37.4%) | $54,611 |
| 2 Earners | 1,520 (42.0%) | $110,137 |
| 3+ Earners | 350 (9.7%) | $165,682 |
| Total | 3,622 (100.0%) | $89,803 |
Household Income in Pierre
Household Income Brackets in Pierre
With 1,267 households falling in the category, the $75,000 to $99,999 income range is the most frequent in Pierre, accounting for 20.8% of all households. In contrast, only 201 households (3.3%) fall into the $10,000 to $14,999 income bracket, making it the least populous group.
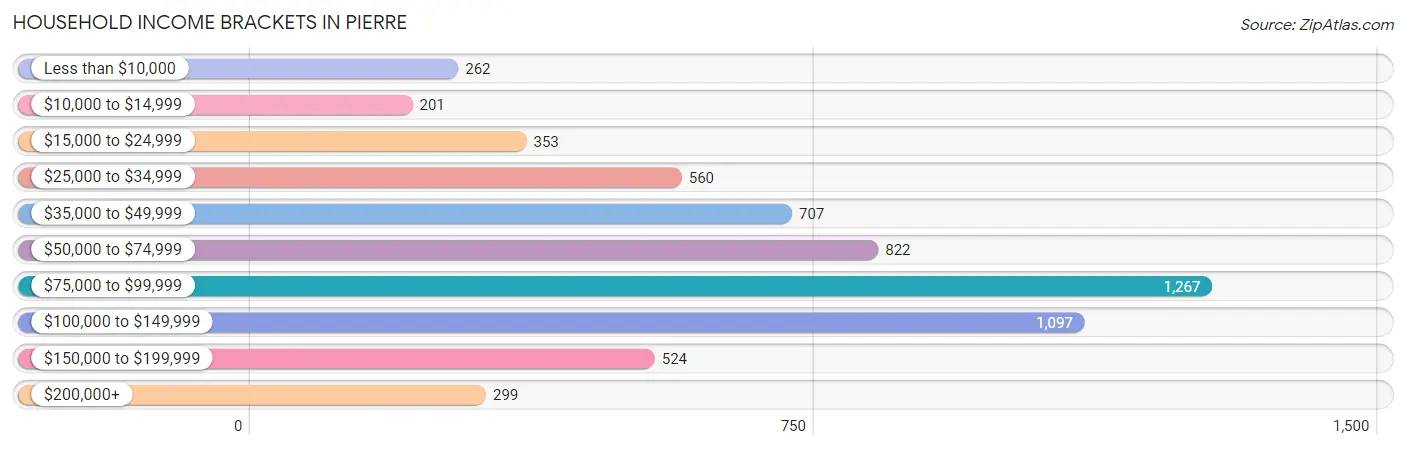
| Income Bracket | # Households | % Households |
| Less than $10,000 | 262 | 4.3% |
| $10,000 to $14,999 | 201 | 3.3% |
| $15,000 to $24,999 | 353 | 5.8% |
| $25,000 to $34,999 | 560 | 9.2% |
| $35,000 to $49,999 | 707 | 11.6% |
| $50,000 to $74,999 | 822 | 13.5% |
| $75,000 to $99,999 | 1,267 | 20.8% |
| $100,000 to $149,999 | 1,097 | 18.0% |
| $150,000 to $199,999 | 524 | 8.6% |
| $200,000+ | 299 | 4.9% |
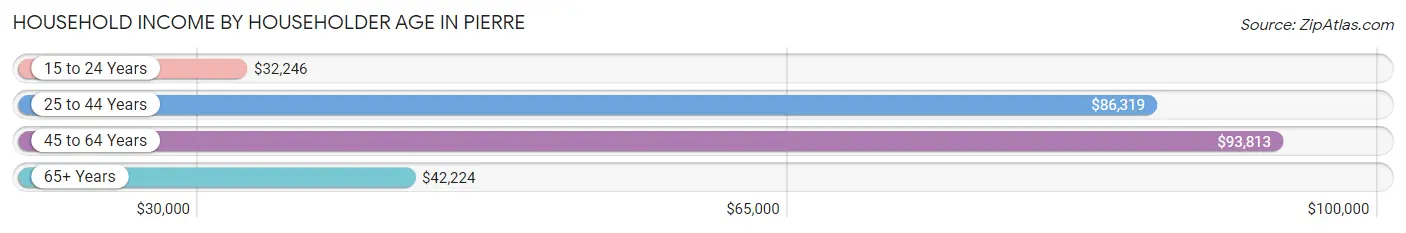
Household Income by Householder Age in Pierre
The median household income in Pierre is $80,473, with the highest median household income of $93,813 found in the 45 to 64 years age bracket for the primary householder. A total of 2,015 households (33.1%) fall into this category. Meanwhile, the 15 to 24 years age bracket for the primary householder has the lowest median household income of $32,246, with 425 households (7.0%) in this group.
| Income Bracket | # Households | Median Income |
| 15 to 24 Years | 425 (7.0%) | $32,246 |
| 25 to 44 Years | 2,020 (33.2%) | $86,319 |
| 45 to 64 Years | 2,015 (33.1%) | $93,813 |
| 65+ Years | 1,632 (26.8%) | $42,224 |
| Total | 6,092 (100.0%) | $80,473 |
Poverty in Pierre
Income Below Poverty by Sex and Age in Pierre
With 12.6% poverty level for males and 10.8% for females among the residents of Pierre, 18 to 24 year old males and 18 to 24 year old females are the most vulnerable to poverty, with 167 males (38.6%) and 214 females (39.4%) in their respective age groups living below the poverty level.
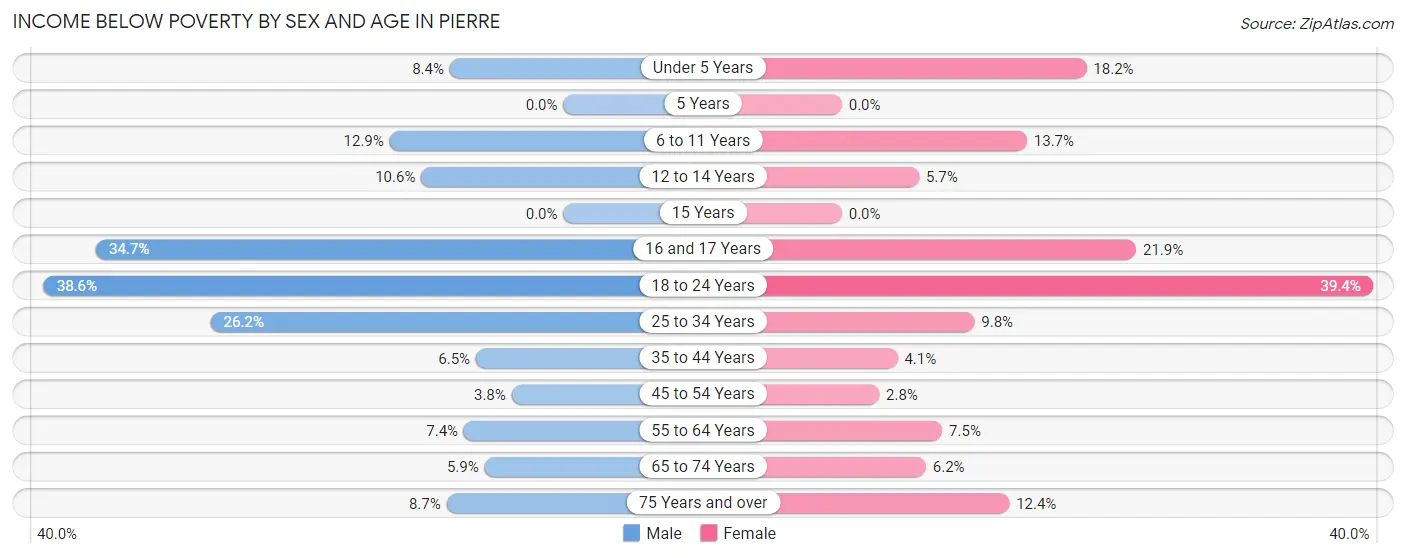
| Age Bracket | Male | Female |
| Under 5 Years | 28 (8.4%) | 69 (18.2%) |
| 5 Years | 0 (0.0%) | 0 (0.0%) |
| 6 to 11 Years | 73 (12.9%) | 82 (13.7%) |
| 12 to 14 Years | 25 (10.5%) | 13 (5.7%) |
| 15 Years | 0 (0.0%) | 0 (0.0%) |
| 16 and 17 Years | 68 (34.7%) | 33 (21.8%) |
| 18 to 24 Years | 167 (38.6%) | 214 (39.4%) |
| 25 to 34 Years | 209 (26.2%) | 67 (9.8%) |
| 35 to 44 Years | 57 (6.5%) | 39 (4.1%) |
| 45 to 54 Years | 32 (3.8%) | 20 (2.8%) |
| 55 to 64 Years | 69 (7.4%) | 75 (7.4%) |
| 65 to 74 Years | 37 (5.9%) | 41 (6.2%) |
| 75 Years and over | 34 (8.7%) | 70 (12.4%) |
| Total | 799 (12.6%) | 723 (10.8%) |
Income Above Poverty by Sex and Age in Pierre
According to the poverty statistics in Pierre, males aged 5 years and females aged 5 years are the age groups that are most secure financially, with 100.0% of males and 100.0% of females in these age groups living above the poverty line.
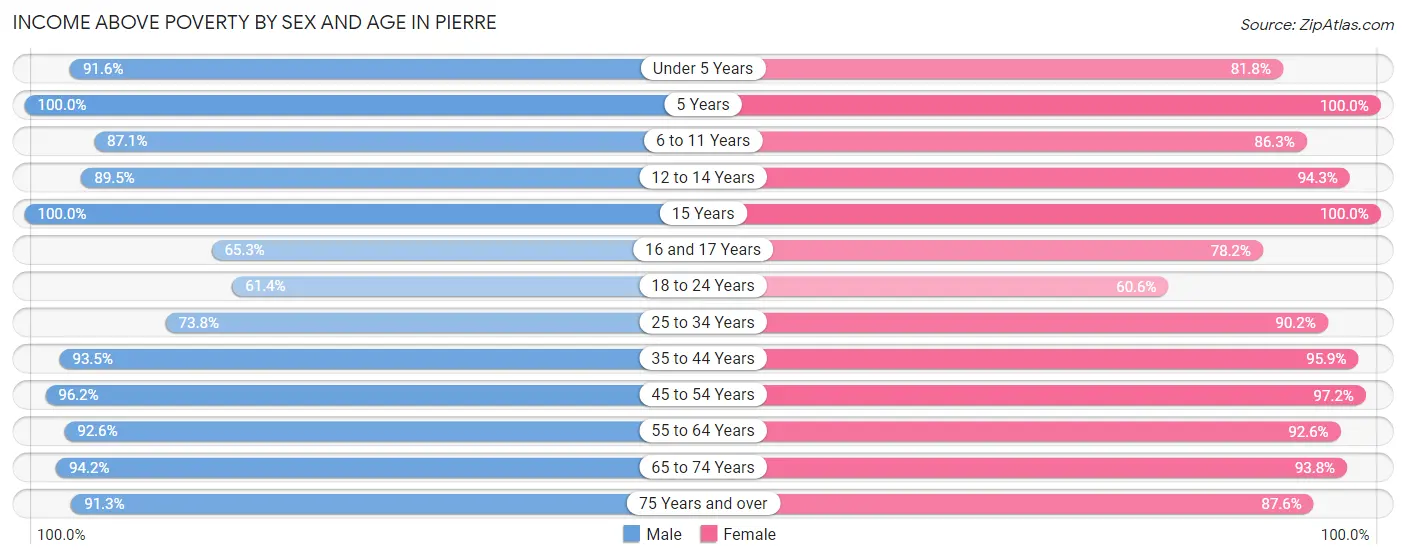
| Age Bracket | Male | Female |
| Under 5 Years | 304 (91.6%) | 311 (81.8%) |
| 5 Years | 89 (100.0%) | 64 (100.0%) |
| 6 to 11 Years | 493 (87.1%) | 515 (86.3%) |
| 12 to 14 Years | 212 (89.4%) | 214 (94.3%) |
| 15 Years | 45 (100.0%) | 127 (100.0%) |
| 16 and 17 Years | 128 (65.3%) | 118 (78.1%) |
| 18 to 24 Years | 266 (61.4%) | 329 (60.6%) |
| 25 to 34 Years | 589 (73.8%) | 614 (90.2%) |
| 35 to 44 Years | 821 (93.5%) | 905 (95.9%) |
| 45 to 54 Years | 801 (96.2%) | 703 (97.2%) |
| 55 to 64 Years | 866 (92.6%) | 932 (92.5%) |
| 65 to 74 Years | 596 (94.2%) | 616 (93.8%) |
| 75 Years and over | 358 (91.3%) | 493 (87.6%) |
| Total | 5,568 (87.5%) | 5,941 (89.1%) |
Income Below Poverty Among Married-Couple Families in Pierre
The poverty statistics for married-couple families in Pierre show that 1.2% or 30 of the total 2,493 families live below the poverty line. Families with no children have the highest poverty rate of 1.8%, comprising of 30 families. On the other hand, families with 1 or 2 children have the lowest poverty rate of 0.0%, which includes 0 families.
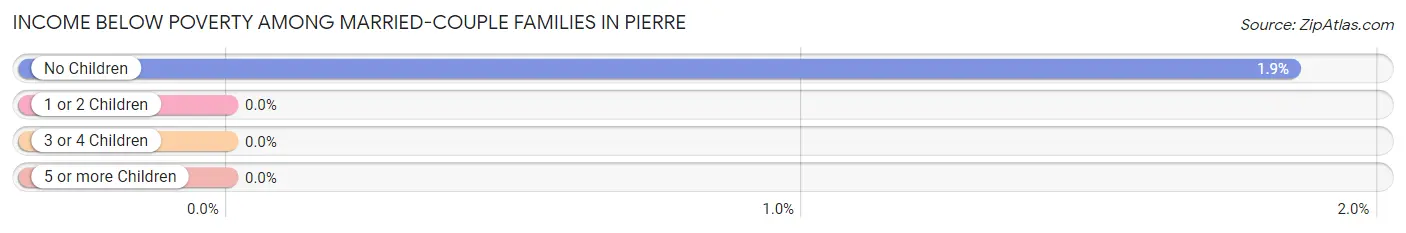
| Children | Above Poverty | Below Poverty |
| No Children | 1,594 (98.2%) | 30 (1.8%) |
| 1 or 2 Children | 721 (100.0%) | 0 (0.0%) |
| 3 or 4 Children | 112 (100.0%) | 0 (0.0%) |
| 5 or more Children | 36 (100.0%) | 0 (0.0%) |
| Total | 2,463 (98.8%) | 30 (1.2%) |
Income Below Poverty Among Single-Parent Households in Pierre
According to the poverty data in Pierre, 18.5% or 113 single-father households and 21.4% or 111 single-mother households are living below the poverty line. Among single-father households, those with 1 or 2 children have the highest poverty rate, with 103 households (19.0%) experiencing poverty. Likewise, among single-mother households, those with 3 or 4 children have the highest poverty rate, with 70 households (78.6%) falling below the poverty line.
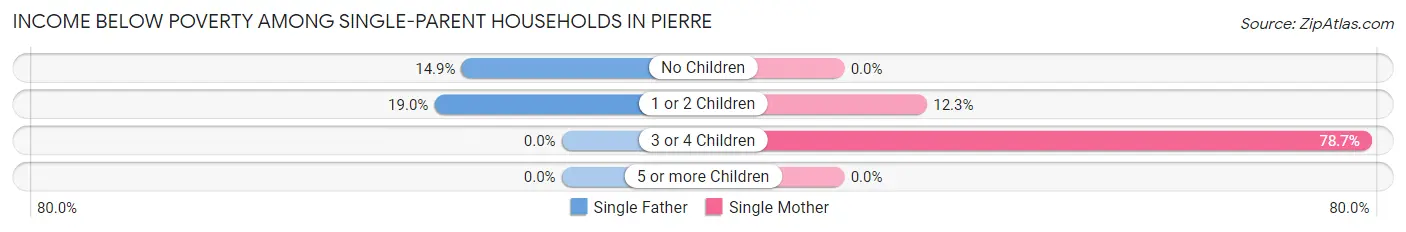
| Children | Single Father | Single Mother |
| No Children | 10 (14.9%) | 0 (0.0%) |
| 1 or 2 Children | 103 (19.0%) | 41 (12.3%) |
| 3 or 4 Children | 0 (0.0%) | 70 (78.6%) |
| 5 or more Children | 0 (0.0%) | 0 (0.0%) |
| Total | 113 (18.5%) | 111 (21.4%) |
Income Below Poverty Among Married-Couple vs Single-Parent Households in Pierre
The poverty data for Pierre shows that 30 of the married-couple family households (1.2%) and 224 of the single-parent households (19.8%) are living below the poverty level. Within the married-couple family households, those with no children have the highest poverty rate, with 30 households (1.8%) falling below the poverty line. Among the single-parent households, those with 3 or 4 children have the highest poverty rate, with 70 household (78.6%) living below poverty.
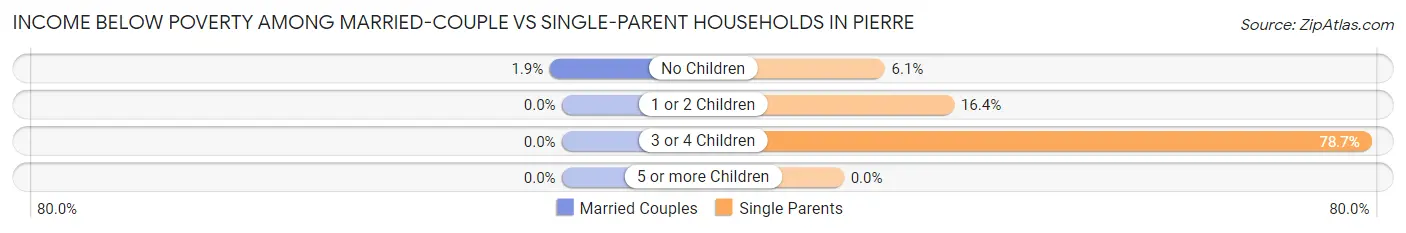
| Children | Married-Couple Families | Single-Parent Households |
| No Children | 30 (1.8%) | 10 (6.1%) |
| 1 or 2 Children | 0 (0.0%) | 144 (16.4%) |
| 3 or 4 Children | 0 (0.0%) | 70 (78.6%) |
| 5 or more Children | 0 (0.0%) | 0 (0.0%) |
| Total | 30 (1.2%) | 224 (19.8%) |
Race in Pierre
The most populous races in Pierre are White / Caucasian (11,706 | 83.0%), Native / Alaskan (1,358 | 9.6%), and Two or more Races (807 | 5.7%).
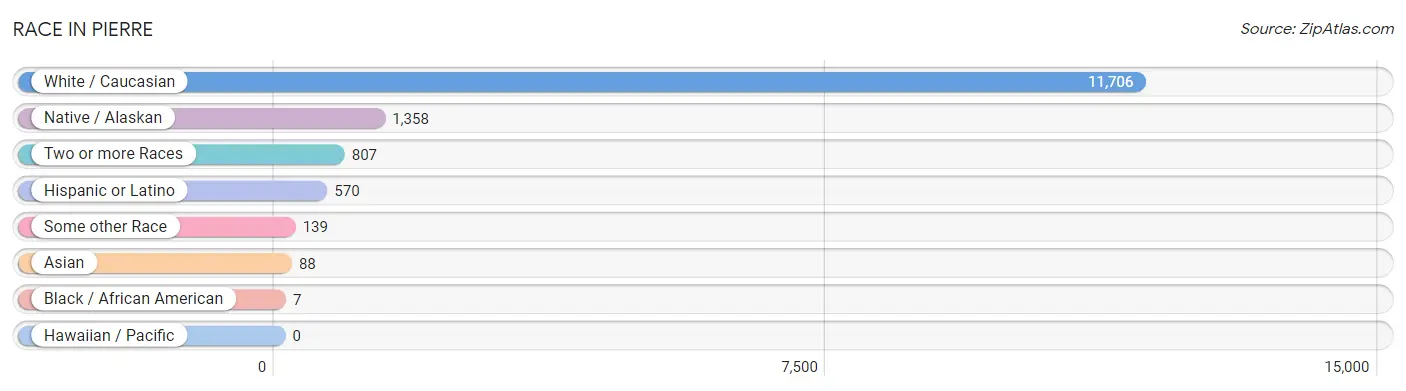
| Race | # Population | % Population |
| Asian | 88 | 0.6% |
| Black / African American | 7 | 0.1% |
| Hawaiian / Pacific | 0 | 0.0% |
| Hispanic or Latino | 570 | 4.0% |
| Native / Alaskan | 1,358 | 9.6% |
| White / Caucasian | 11,706 | 83.0% |
| Two or more Races | 807 | 5.7% |
| Some other Race | 139 | 1.0% |
| Total | 14,105 | 100.0% |
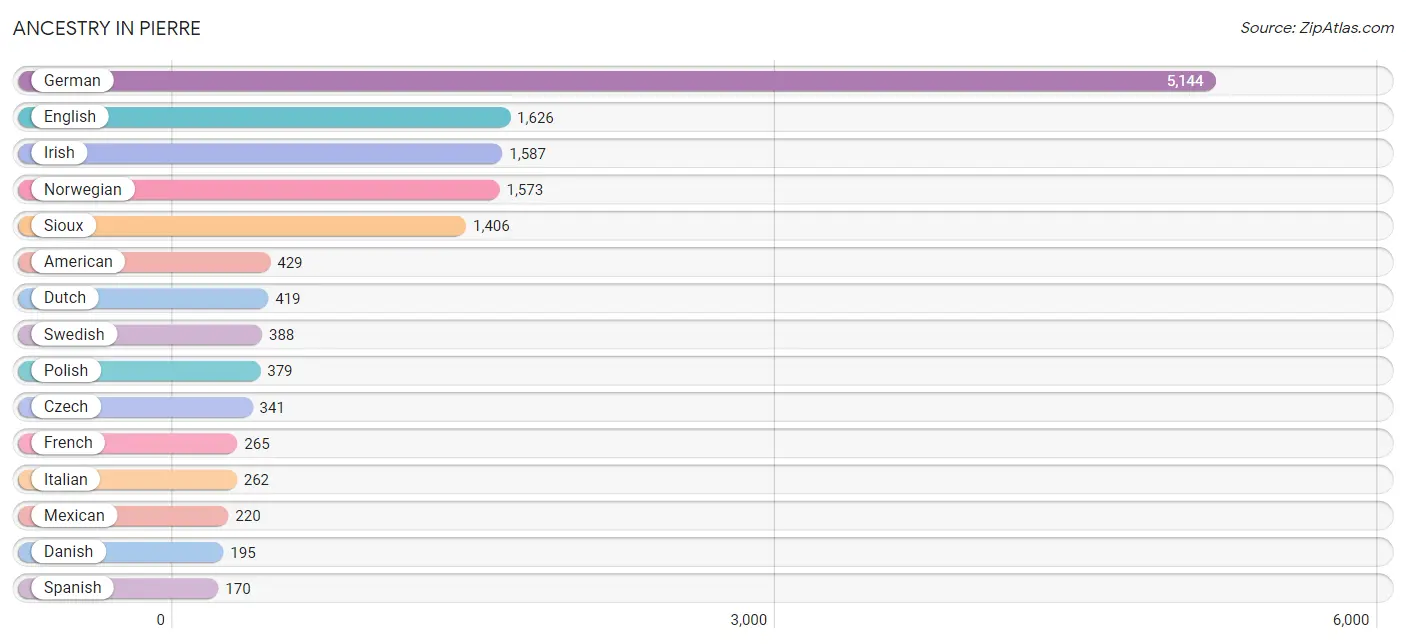
Ancestry in Pierre
The most populous ancestries reported in Pierre are German (5,144 | 36.5%), English (1,626 | 11.5%), Irish (1,587 | 11.3%), Norwegian (1,573 | 11.2%), and Sioux (1,406 | 10.0%), together accounting for 80.4% of all Pierre residents.
| Ancestry | # Population | % Population |
| African | 11 | 0.1% |
| American | 429 | 3.0% |
| Arab | 26 | 0.2% |
| Belgian | 36 | 0.3% |
| Bhutanese | 43 | 0.3% |
| Blackfeet | 5 | 0.0% |
| British | 96 | 0.7% |
| Central American | 69 | 0.5% |
| Cherokee | 74 | 0.5% |
| Chilean | 106 | 0.7% |
| Chippewa | 162 | 1.1% |
| Costa Rican | 21 | 0.2% |
| Croatian | 33 | 0.2% |
| Czech | 341 | 2.4% |
| Czechoslovakian | 49 | 0.4% |
| Danish | 195 | 1.4% |
| Dutch | 419 | 3.0% |
| English | 1,626 | 11.5% |
| European | 82 | 0.6% |
| Finnish | 88 | 0.6% |
| French | 265 | 1.9% |
| French Canadian | 64 | 0.4% |
| German | 5,144 | 36.5% |
| German Russian | 18 | 0.1% |
| Hungarian | 76 | 0.5% |
| Irish | 1,587 | 11.3% |
| Italian | 262 | 1.9% |
| Korean | 10 | 0.1% |
| Latvian | 8 | 0.1% |
| Lebanese | 26 | 0.2% |
| Lumbee | 6 | 0.0% |
| Mexican | 220 | 1.6% |
| Native Hawaiian | 3 | 0.0% |
| Norwegian | 1,573 | 11.2% |
| Pakistani | 28 | 0.2% |
| Pennsylvania German | 39 | 0.3% |
| Polish | 379 | 2.7% |
| Portuguese | 17 | 0.1% |
| Puerto Rican | 5 | 0.0% |
| Romanian | 7 | 0.1% |
| Russian | 99 | 0.7% |
| Salvadoran | 48 | 0.3% |
| Scandinavian | 102 | 0.7% |
| Scotch-Irish | 51 | 0.4% |
| Scottish | 87 | 0.6% |
| Sioux | 1,406 | 10.0% |
| Slovene | 47 | 0.3% |
| South American | 106 | 0.7% |
| Spanish | 170 | 1.2% |
| Sri Lankan | 83 | 0.6% |
| Subsaharan African | 11 | 0.1% |
| Swedish | 388 | 2.8% |
| Swiss | 19 | 0.1% |
| Thai | 25 | 0.2% |
| Ukrainian | 22 | 0.2% |
| Welsh | 61 | 0.4% | View All 56 Rows |
Immigrants in Pierre
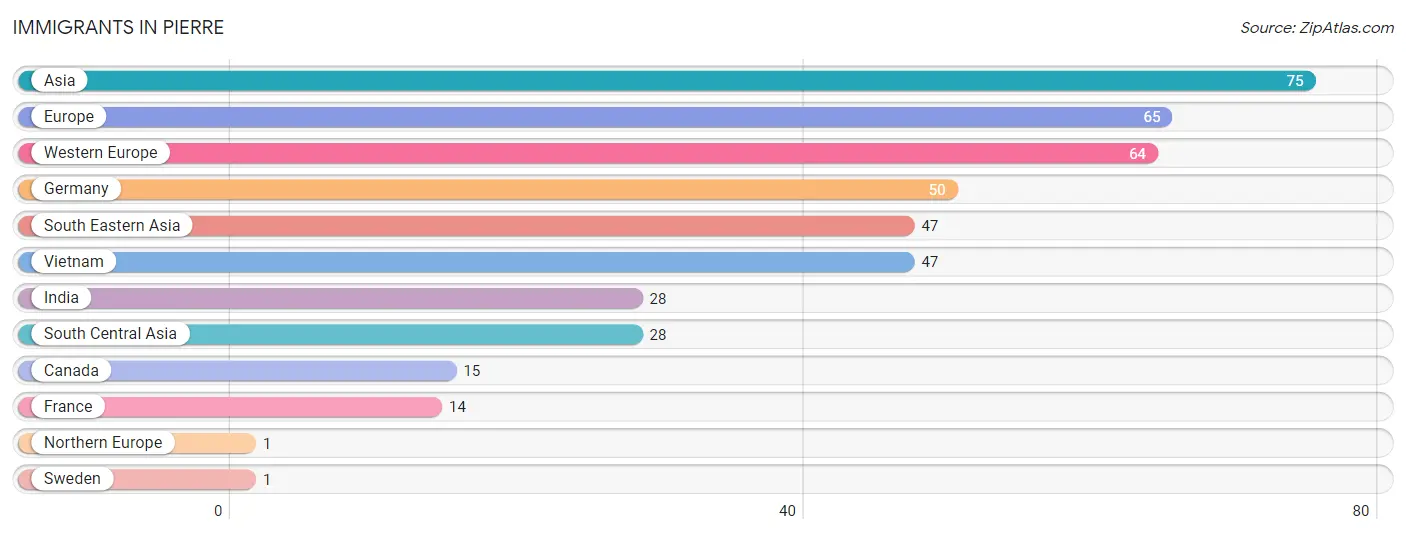
The most numerous immigrant groups reported in Pierre came from Asia (75 | 0.5%), Europe (65 | 0.5%), Western Europe (64 | 0.4%), Germany (50 | 0.4%), and South Eastern Asia (47 | 0.3%), together accounting for 2.1% of all Pierre residents.
| Immigration Origin | # Population | % Population |
| Asia | 75 | 0.5% |
| Canada | 15 | 0.1% |
| Europe | 65 | 0.5% |
| France | 14 | 0.1% |
| Germany | 50 | 0.4% |
| India | 28 | 0.2% |
| Northern Europe | 1 | 0.0% |
| South Central Asia | 28 | 0.2% |
| South Eastern Asia | 47 | 0.3% |
| Sweden | 1 | 0.0% |
| Vietnam | 47 | 0.3% |
| Western Europe | 64 | 0.4% | View All 12 Rows |
Sex and Age in Pierre
Sex and Age in Pierre
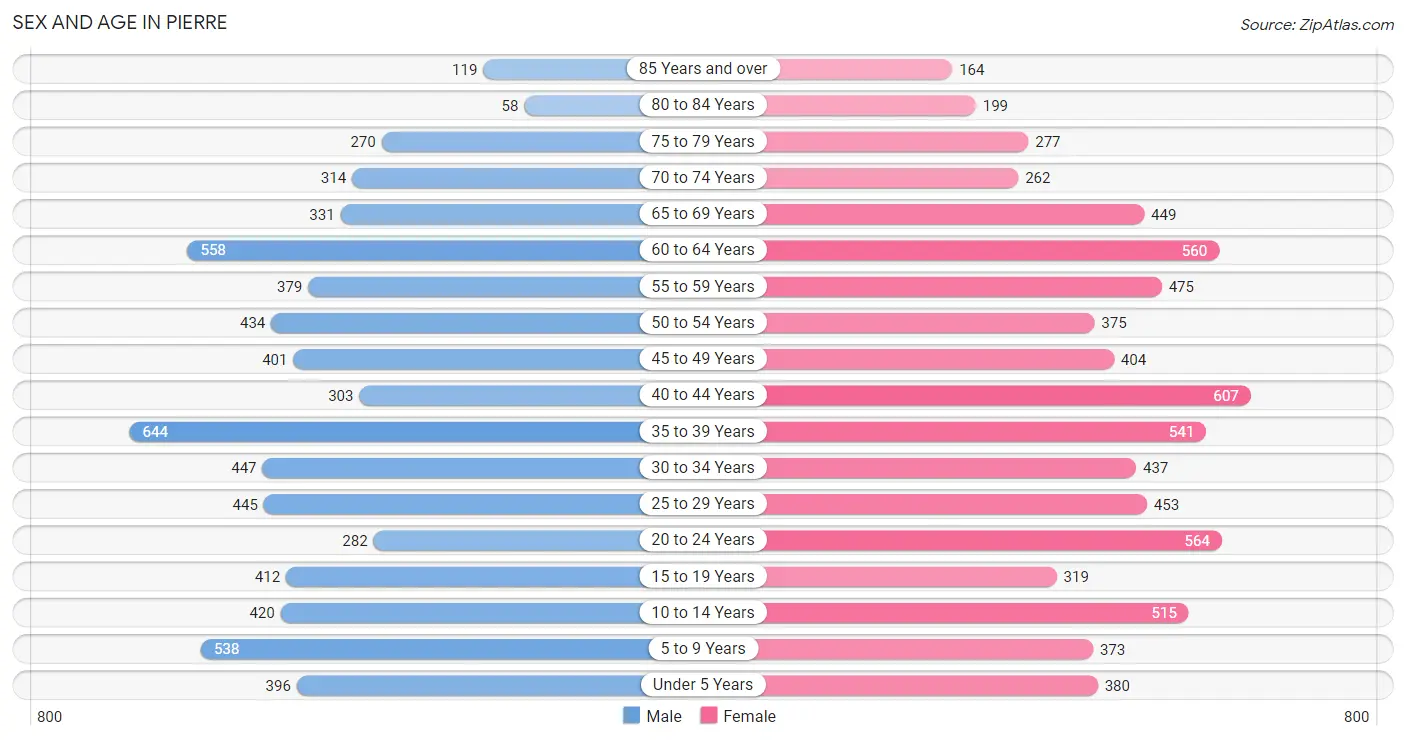
The most populous age groups in Pierre are 35 to 39 Years (644 | 9.5%) for men and 40 to 44 Years (607 | 8.3%) for women.
| Age Bracket | Male | Female |
| Under 5 Years | 396 (5.9%) | 380 (5.2%) |
| 5 to 9 Years | 538 (8.0%) | 373 (5.1%) |
| 10 to 14 Years | 420 (6.2%) | 515 (7.0%) |
| 15 to 19 Years | 412 (6.1%) | 319 (4.3%) |
| 20 to 24 Years | 282 (4.2%) | 564 (7.7%) |
| 25 to 29 Years | 445 (6.6%) | 453 (6.2%) |
| 30 to 34 Years | 447 (6.6%) | 437 (5.9%) |
| 35 to 39 Years | 644 (9.5%) | 541 (7.4%) |
| 40 to 44 Years | 303 (4.5%) | 607 (8.3%) |
| 45 to 49 Years | 401 (5.9%) | 404 (5.5%) |
| 50 to 54 Years | 434 (6.4%) | 375 (5.1%) |
| 55 to 59 Years | 379 (5.6%) | 475 (6.5%) |
| 60 to 64 Years | 558 (8.3%) | 560 (7.6%) |
| 65 to 69 Years | 331 (4.9%) | 449 (6.1%) |
| 70 to 74 Years | 314 (4.6%) | 262 (3.6%) |
| 75 to 79 Years | 270 (4.0%) | 277 (3.8%) |
| 80 to 84 Years | 58 (0.9%) | 199 (2.7%) |
| 85 Years and over | 119 (1.8%) | 164 (2.2%) |
| Total | 6,751 (100.0%) | 7,354 (100.0%) |
Families and Households in Pierre
Median Family Size in Pierre
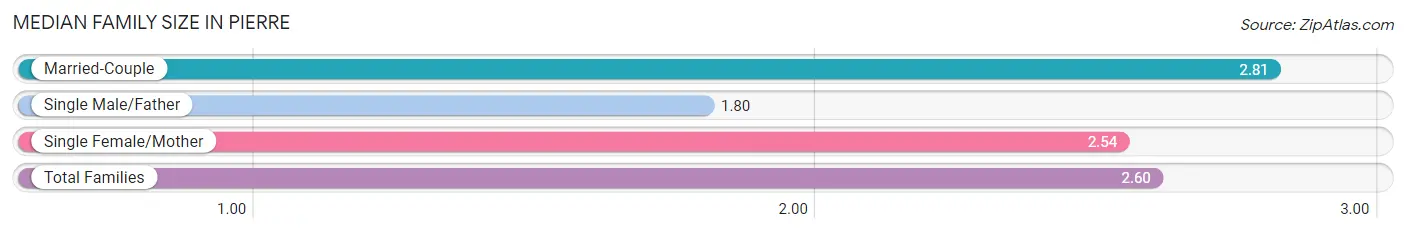
The median family size in Pierre is 2.60 persons per family, with married-couple families (2,493 | 68.8%) accounting for the largest median family size of 2.81 persons per family. On the other hand, single male/father families (610 | 16.8%) represent the smallest median family size with 1.80 persons per family.
| Family Type | # Families | Family Size |
| Married-Couple | 2,493 (68.8%) | 2.81 |
| Single Male/Father | 610 (16.8%) | 1.80 |
| Single Female/Mother | 519 (14.3%) | 2.54 |
| Total Families | 3,622 (100.0%) | 2.60 |
Median Household Size in Pierre
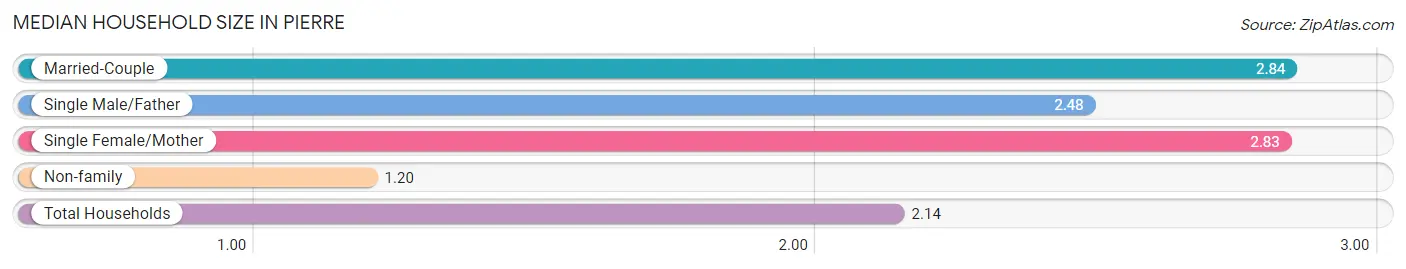
The median household size in Pierre is 2.14 persons per household, with married-couple households (2,493 | 40.9%) accounting for the largest median household size of 2.84 persons per household. non-family households (2,470 | 40.5%) represent the smallest median household size with 1.20 persons per household.
| Household Type | # Households | Household Size |
| Married-Couple | 2,493 (40.9%) | 2.84 |
| Single Male/Father | 610 (10.0%) | 2.48 |
| Single Female/Mother | 519 (8.5%) | 2.83 |
| Non-family | 2,470 (40.5%) | 1.20 |
| Total Households | 6,092 (100.0%) | 2.14 |
Household Size by Marriage Status in Pierre
Out of a total of 6,092 households in Pierre, 3,622 (59.5%) are family households, while 2,470 (40.5%) are nonfamily households. The most numerous type of family households are 2-person households, comprising 1,910, and the most common type of nonfamily households are 1-person households, comprising 2,064.
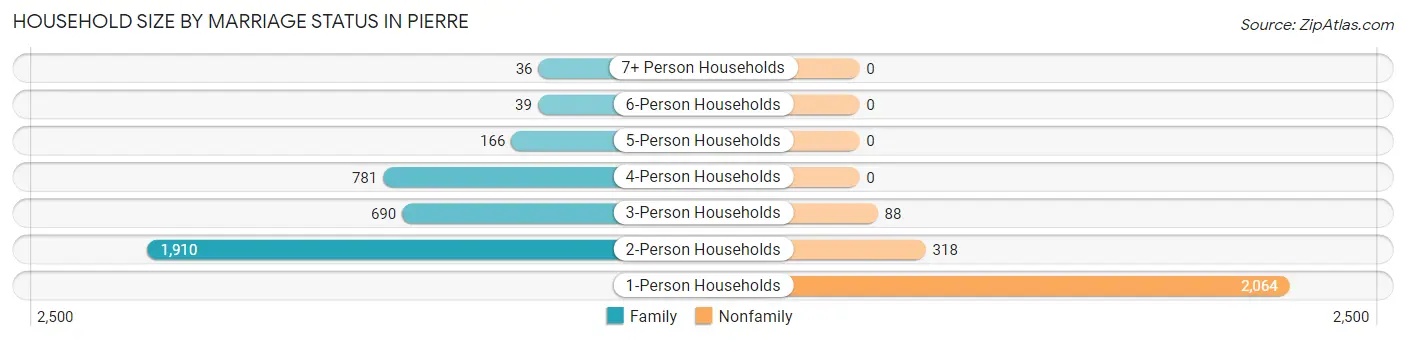
| Household Size | Family Households | Nonfamily Households |
| 1-Person Households | - | 2,064 (33.9%) |
| 2-Person Households | 1,910 (31.4%) | 318 (5.2%) |
| 3-Person Households | 690 (11.3%) | 88 (1.4%) |
| 4-Person Households | 781 (12.8%) | 0 (0.0%) |
| 5-Person Households | 166 (2.7%) | 0 (0.0%) |
| 6-Person Households | 39 (0.6%) | 0 (0.0%) |
| 7+ Person Households | 36 (0.6%) | 0 (0.0%) |
| Total | 3,622 (59.5%) | 2,470 (40.5%) |
Female Fertility in Pierre
Fertility by Age in Pierre
Average fertility rate in Pierre is 54.0 births per 1,000 women. Women in the age bracket of 20 to 34 years have the highest fertility rate with 71.0 births per 1,000 women. Women in the age bracket of 20 to 34 years acount for 56.0% of all women with births.
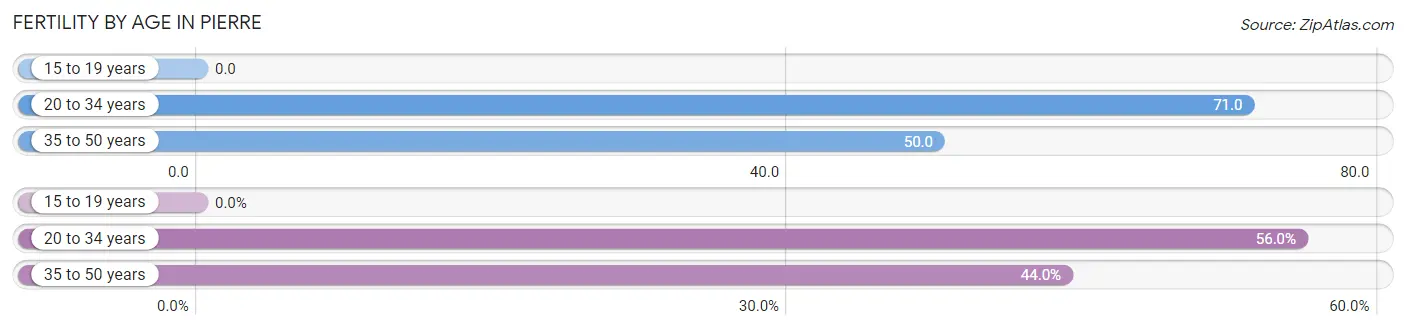
| Age Bracket | Women with Births | Births / 1,000 Women |
| 15 to 19 years | 0 (0.0%) | 0.0 |
| 20 to 34 years | 103 (56.0%) | 71.0 |
| 35 to 50 years | 81 (44.0%) | 50.0 |
| Total | 184 (100.0%) | 54.0 |
Fertility by Age by Marriage Status in Pierre
7.1% of women with births (184) in Pierre are married. The highest percentage of unmarried women with births falls into 35 to 50 years age bracket with 96.3% of them unmarried at the time of birth, while the lowest percentage of unmarried women with births belong to 20 to 34 years age bracket with 90.3% of them unmarried.
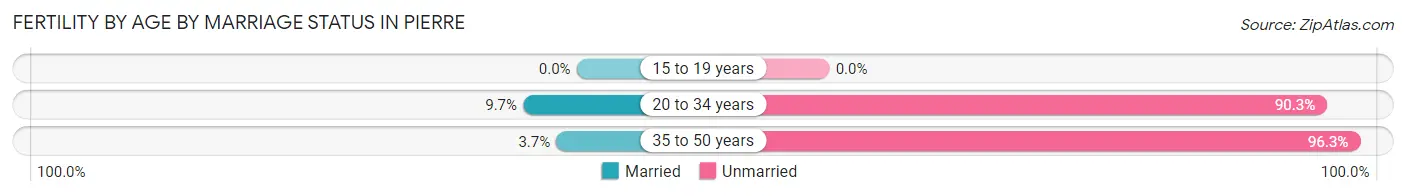
| Age Bracket | Married | Unmarried |
| 15 to 19 years | 0 (0.0%) | 0 (0.0%) |
| 20 to 34 years | 10 (9.7%) | 93 (90.3%) |
| 35 to 50 years | 3 (3.7%) | 78 (96.3%) |
| Total | 13 (7.1%) | 171 (92.9%) |
Fertility by Education in Pierre
Average fertility rate in Pierre is 54.0 births per 1,000 women. Women with the education attainment of high school diploma have the highest fertility rate of 93.0 births per 1,000 women, while women with the education attainment of less than high school have the lowest fertility at 5.0 births per 1,000 women. Women with the education attainment of high school diploma represent 50.5% of all women with births.
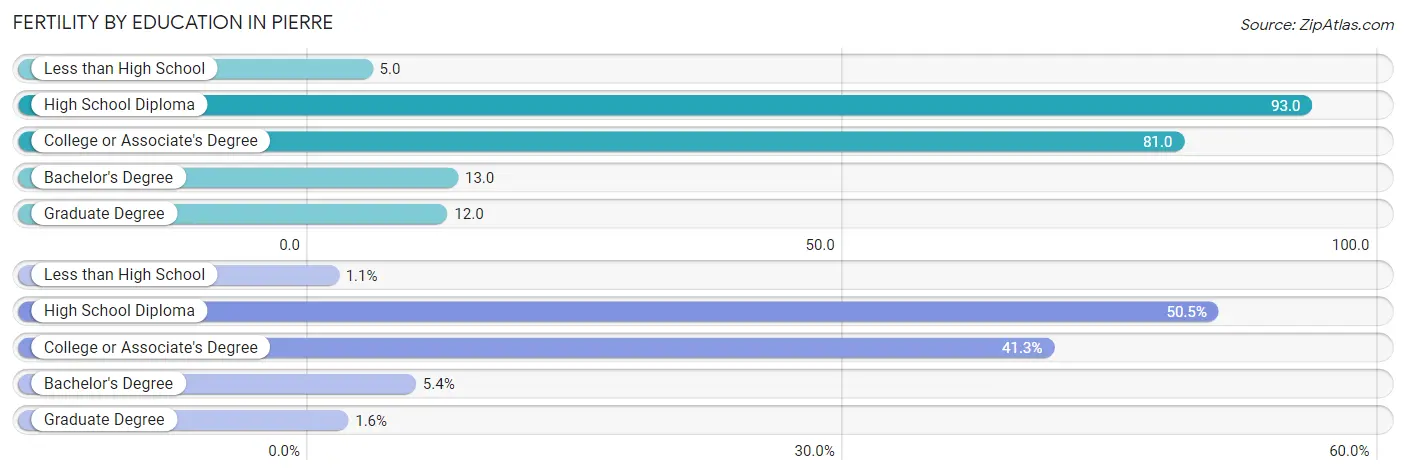
| Educational Attainment | Women with Births | Births / 1,000 Women |
| Less than High School | 2 (1.1%) | 5.0 |
| High School Diploma | 93 (50.5%) | 93.0 |
| College or Associate's Degree | 76 (41.3%) | 81.0 |
| Bachelor's Degree | 10 (5.4%) | 13.0 |
| Graduate Degree | 3 (1.6%) | 12.0 |
| Total | 184 (100.0%) | 54.0 |
Fertility by Education by Marriage Status in Pierre
92.9% of women with births in Pierre are unmarried. Women with the educational attainment of bachelor's degree are most likely to be married with 100.0% of them married at childbirth, while women with the educational attainment of less than high school are least likely to be married with 100.0% of them unmarried at childbirth.
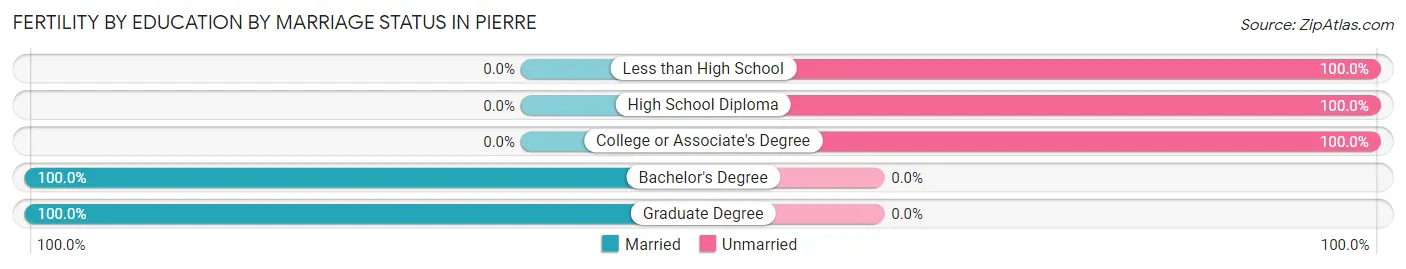
| Educational Attainment | Married | Unmarried |
| Less than High School | 0 (0.0%) | 2 (100.0%) |
| High School Diploma | 0 (0.0%) | 93 (100.0%) |
| College or Associate's Degree | 0 (0.0%) | 76 (100.0%) |
| Bachelor's Degree | 10 (100.0%) | 0 (0.0%) |
| Graduate Degree | 3 (100.0%) | 0 (0.0%) |
| Total | 13 (7.1%) | 171 (92.9%) |
Employment Characteristics in Pierre
Employment by Class of Employer in Pierre
Among the 7,272 employed individuals in Pierre, private company employees (2,631 | 36.2%), state government employees (1,937 | 26.6%), and not-for-profit organizations (1,338 | 18.4%) make up the most common classes of employment.
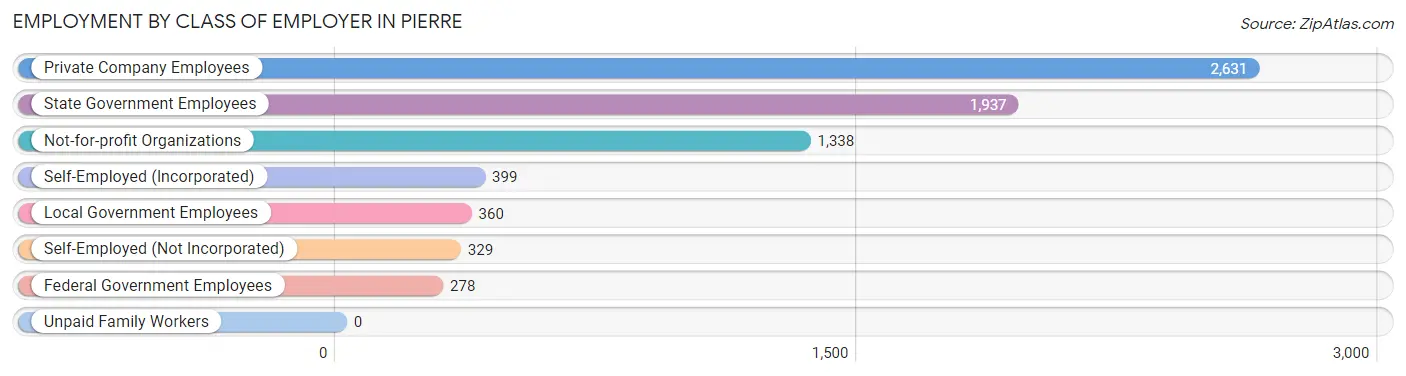
| Employer Class | # Employees | % Employees |
| Private Company Employees | 2,631 | 36.2% |
| Self-Employed (Incorporated) | 399 | 5.5% |
| Self-Employed (Not Incorporated) | 329 | 4.5% |
| Not-for-profit Organizations | 1,338 | 18.4% |
| Local Government Employees | 360 | 5.0% |
| State Government Employees | 1,937 | 26.6% |
| Federal Government Employees | 278 | 3.8% |
| Unpaid Family Workers | 0 | 0.0% |
| Total | 7,272 | 100.0% |
Employment Status by Age in Pierre
According to the labor force statistics for Pierre, out of the total population over 16 years of age (11,307), 65.0% or 7,350 individuals are in the labor force, with 0.5% or 37 of them unemployed. The age group with the highest labor force participation rate is 45 to 54 years, with 92.9% or 1,499 individuals in the labor force. Within the labor force, the 25 to 29 years age range has the highest percentage of unemployed individuals, with 3.1% or 21 of them being unemployed.
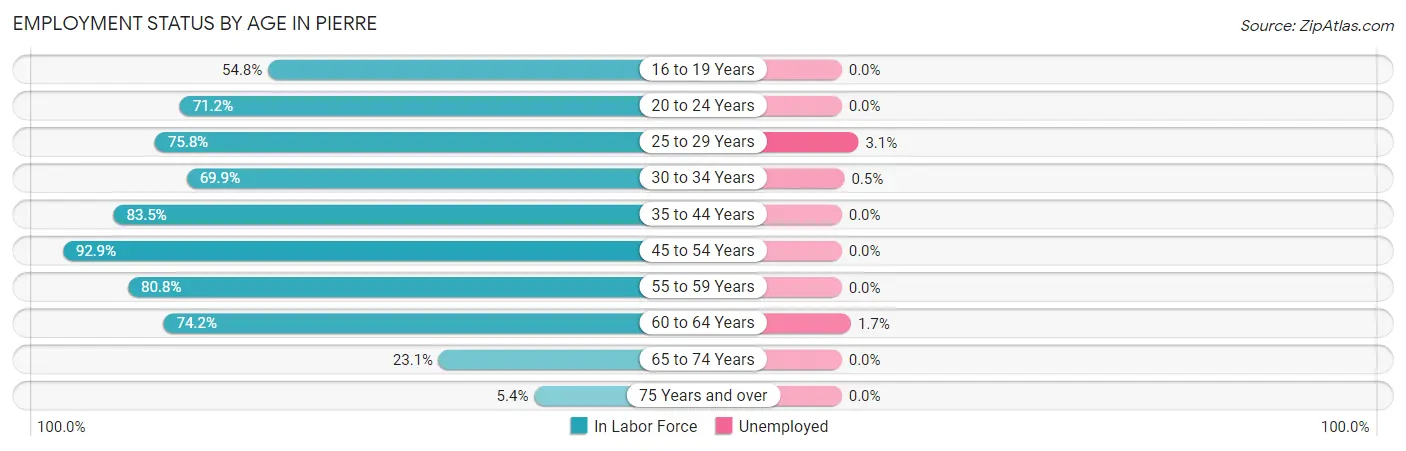
| Age Bracket | In Labor Force | Unemployed |
| 16 to 19 Years | 304 (54.8%) | 0 (0.0%) |
| 20 to 24 Years | 602 (71.2%) | 0 (0.0%) |
| 25 to 29 Years | 681 (75.8%) | 21 (3.1%) |
| 30 to 34 Years | 618 (69.9%) | 3 (0.5%) |
| 35 to 44 Years | 1,749 (83.5%) | 0 (0.0%) |
| 45 to 54 Years | 1,499 (92.9%) | 0 (0.0%) |
| 55 to 59 Years | 690 (80.8%) | 0 (0.0%) |
| 60 to 64 Years | 830 (74.2%) | 14 (1.7%) |
| 65 to 74 Years | 313 (23.1%) | 0 (0.0%) |
| 75 Years and over | 59 (5.4%) | 0 (0.0%) |
| Total | 7,350 (65.0%) | 37 (0.5%) |
Employment Status by Educational Attainment in Pierre
According to labor force statistics for Pierre, 81.3% of individuals (6,067) out of the total population between 25 and 64 years of age (7,463) are in the labor force, with 0.6% or 36 of them being unemployed. The group with the highest labor force participation rate are those with the educational attainment of bachelor's degree or higher, with 95.1% or 2,619 individuals in the labor force. Within the labor force, individuals with college / associate degree education have the highest percentage of unemployment, with 1.2% or 24 of them being unemployed.
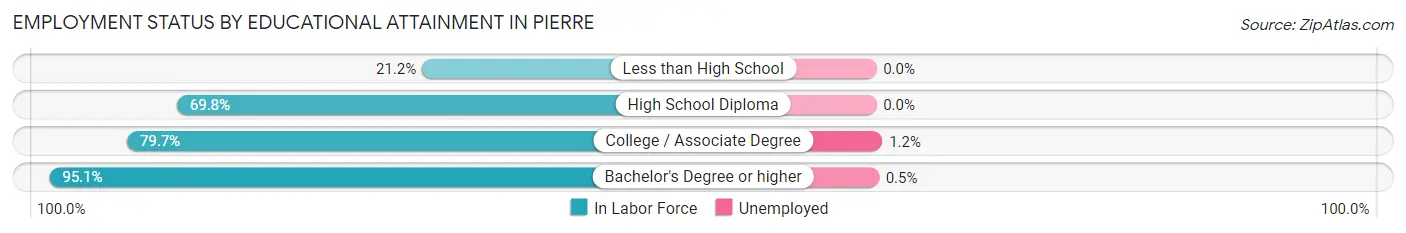
| Educational Attainment | In Labor Force | Unemployed |
| Less than High School | 36 (21.2%) | 0 (0.0%) |
| High School Diploma | 1,442 (69.8%) | 0 (0.0%) |
| College / Associate Degree | 1,971 (79.7%) | 30 (1.2%) |
| Bachelor's Degree or higher | 2,619 (95.1%) | 14 (0.5%) |
| Total | 6,067 (81.3%) | 45 (0.6%) |
Employment Occupations by Sex in Pierre
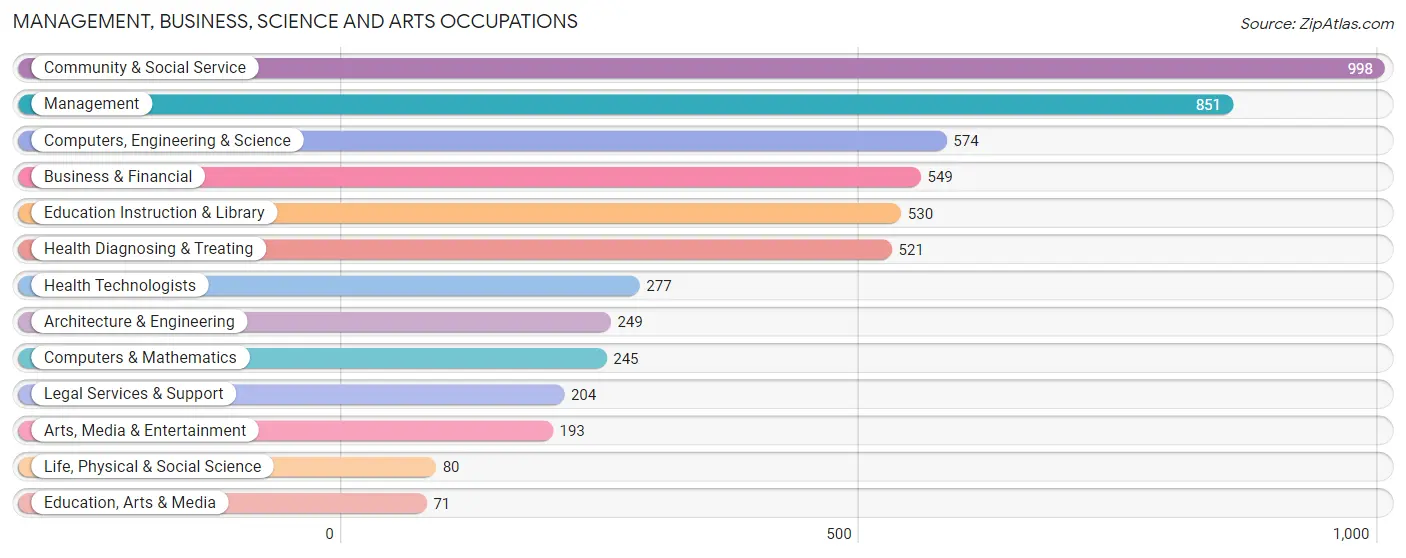
Management, Business, Science and Arts Occupations
The most common Management, Business, Science and Arts occupations in Pierre are Community & Social Service (998 | 13.7%), Management (851 | 11.6%), Computers, Engineering & Science (574 | 7.9%), Business & Financial (549 | 7.5%), and Education Instruction & Library (530 | 7.2%).
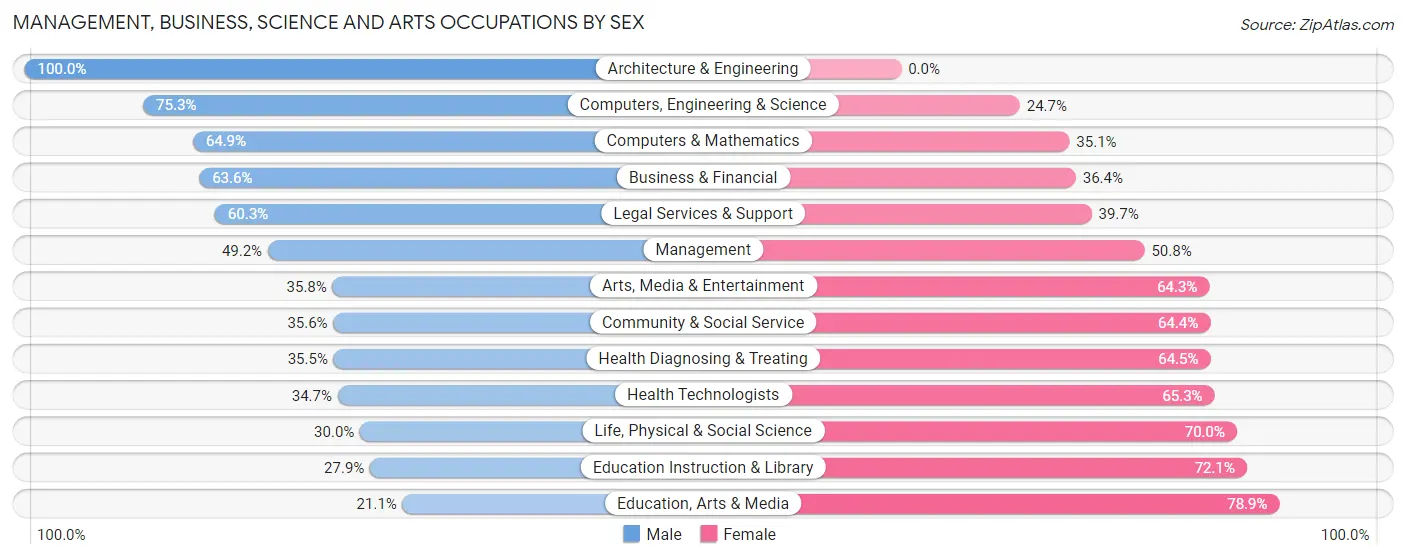
Management, Business, Science and Arts Occupations by Sex
Within the Management, Business, Science and Arts occupations in Pierre, the most male-oriented occupations are Architecture & Engineering (100.0%), Computers, Engineering & Science (75.3%), and Computers & Mathematics (64.9%), while the most female-oriented occupations are Education, Arts & Media (78.9%), Education Instruction & Library (72.1%), and Life, Physical & Social Science (70.0%).
| Occupation | Male | Female |
| Management | 419 (49.2%) | 432 (50.8%) |
| Business & Financial | 349 (63.6%) | 200 (36.4%) |
| Computers, Engineering & Science | 432 (75.3%) | 142 (24.7%) |
| Computers & Mathematics | 159 (64.9%) | 86 (35.1%) |
| Architecture & Engineering | 249 (100.0%) | 0 (0.0%) |
| Life, Physical & Social Science | 24 (30.0%) | 56 (70.0%) |
| Community & Social Service | 355 (35.6%) | 643 (64.4%) |
| Education, Arts & Media | 15 (21.1%) | 56 (78.9%) |
| Legal Services & Support | 123 (60.3%) | 81 (39.7%) |
| Education Instruction & Library | 148 (27.9%) | 382 (72.1%) |
| Arts, Media & Entertainment | 69 (35.7%) | 124 (64.2%) |
| Health Diagnosing & Treating | 185 (35.5%) | 336 (64.5%) |
| Health Technologists | 96 (34.7%) | 181 (65.3%) |
| Total (Category) | 1,740 (49.8%) | 1,753 (50.2%) |
| Total (Overall) | 3,682 (50.4%) | 3,626 (49.6%) |
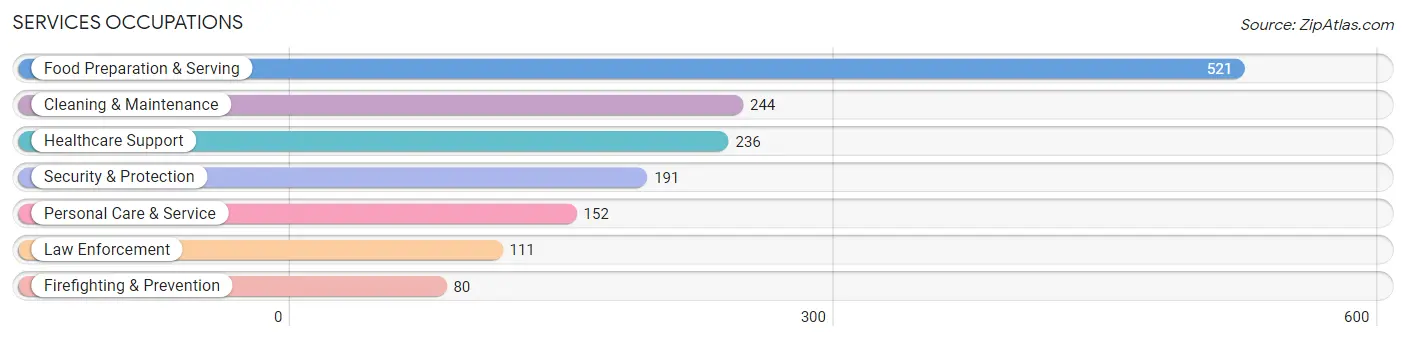
Services Occupations
The most common Services occupations in Pierre are Food Preparation & Serving (521 | 7.1%), Cleaning & Maintenance (244 | 3.3%), Healthcare Support (236 | 3.2%), Security & Protection (191 | 2.6%), and Personal Care & Service (152 | 2.1%).
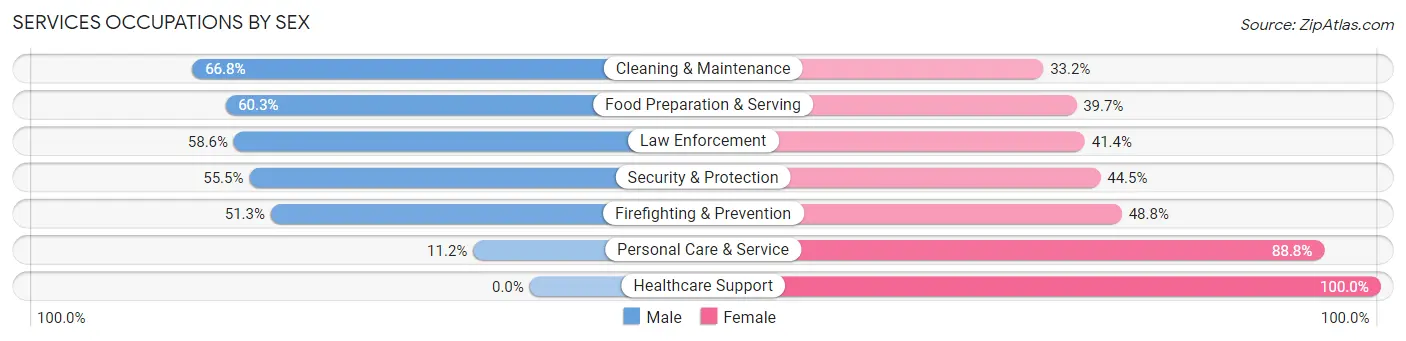
Services Occupations by Sex
Within the Services occupations in Pierre, the most male-oriented occupations are Cleaning & Maintenance (66.8%), Food Preparation & Serving (60.3%), and Law Enforcement (58.6%), while the most female-oriented occupations are Healthcare Support (100.0%), Personal Care & Service (88.8%), and Firefighting & Prevention (48.7%).
| Occupation | Male | Female |
| Healthcare Support | 0 (0.0%) | 236 (100.0%) |
| Security & Protection | 106 (55.5%) | 85 (44.5%) |
| Firefighting & Prevention | 41 (51.2%) | 39 (48.7%) |
| Law Enforcement | 65 (58.6%) | 46 (41.4%) |
| Food Preparation & Serving | 314 (60.3%) | 207 (39.7%) |
| Cleaning & Maintenance | 163 (66.8%) | 81 (33.2%) |
| Personal Care & Service | 17 (11.2%) | 135 (88.8%) |
| Total (Category) | 600 (44.6%) | 744 (55.4%) |
| Total (Overall) | 3,682 (50.4%) | 3,626 (49.6%) |
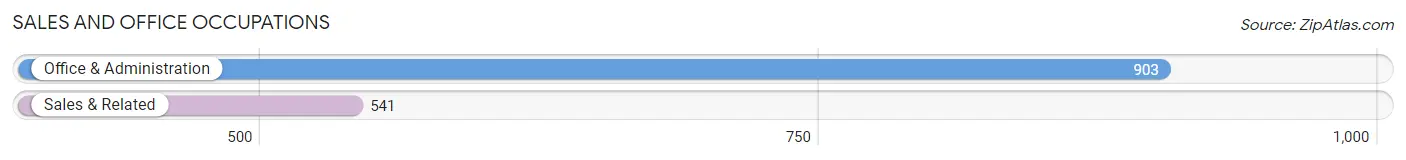
Sales and Office Occupations
The most common Sales and Office occupations in Pierre are Office & Administration (903 | 12.4%), and Sales & Related (541 | 7.4%).
Sales and Office Occupations by Sex
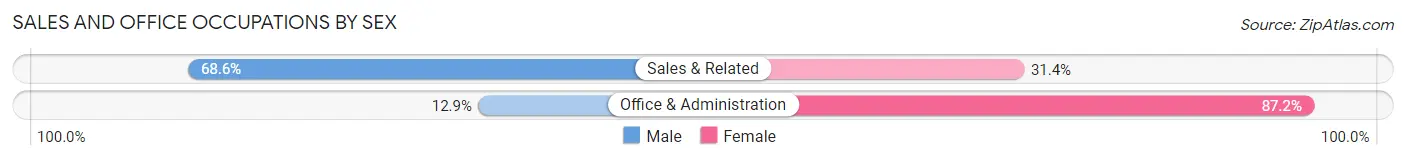
| Occupation | Male | Female |
| Sales & Related | 371 (68.6%) | 170 (31.4%) |
| Office & Administration | 116 (12.9%) | 787 (87.2%) |
| Total (Category) | 487 (33.7%) | 957 (66.3%) |
| Total (Overall) | 3,682 (50.4%) | 3,626 (49.6%) |
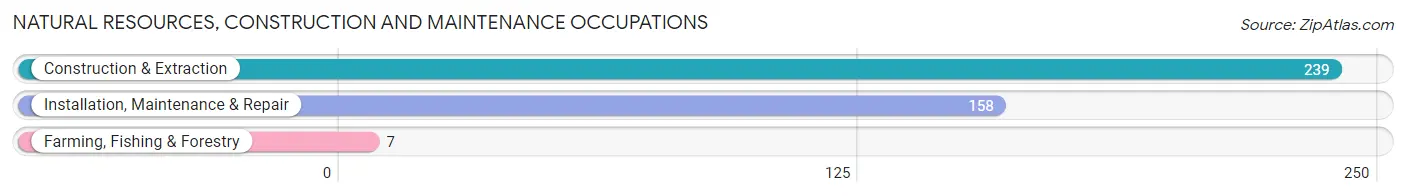
Natural Resources, Construction and Maintenance Occupations
The most common Natural Resources, Construction and Maintenance occupations in Pierre are Construction & Extraction (239 | 3.3%), Installation, Maintenance & Repair (158 | 2.2%), and Farming, Fishing & Forestry (7 | 0.1%).
Natural Resources, Construction and Maintenance Occupations by Sex
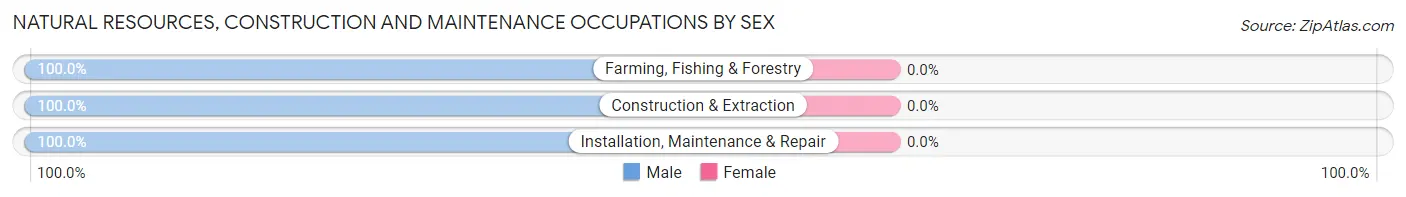
| Occupation | Male | Female |
| Farming, Fishing & Forestry | 7 (100.0%) | 0 (0.0%) |
| Construction & Extraction | 239 (100.0%) | 0 (0.0%) |
| Installation, Maintenance & Repair | 158 (100.0%) | 0 (0.0%) |
| Total (Category) | 404 (100.0%) | 0 (0.0%) |
| Total (Overall) | 3,682 (50.4%) | 3,626 (49.6%) |
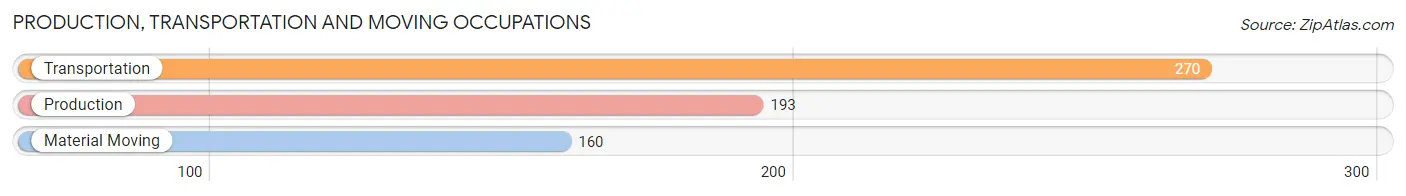
Production, Transportation and Moving Occupations
The most common Production, Transportation and Moving occupations in Pierre are Transportation (270 | 3.7%), Production (193 | 2.6%), and Material Moving (160 | 2.2%).
Production, Transportation and Moving Occupations by Sex
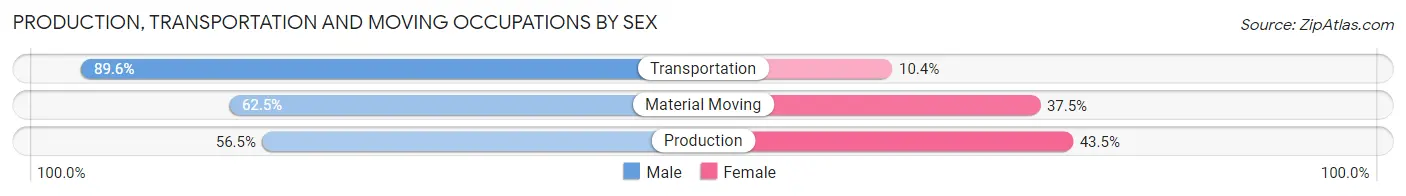
| Occupation | Male | Female |
| Production | 109 (56.5%) | 84 (43.5%) |
| Transportation | 242 (89.6%) | 28 (10.4%) |
| Material Moving | 100 (62.5%) | 60 (37.5%) |
| Total (Category) | 451 (72.4%) | 172 (27.6%) |
| Total (Overall) | 3,682 (50.4%) | 3,626 (49.6%) |
Employment Industries by Sex in Pierre
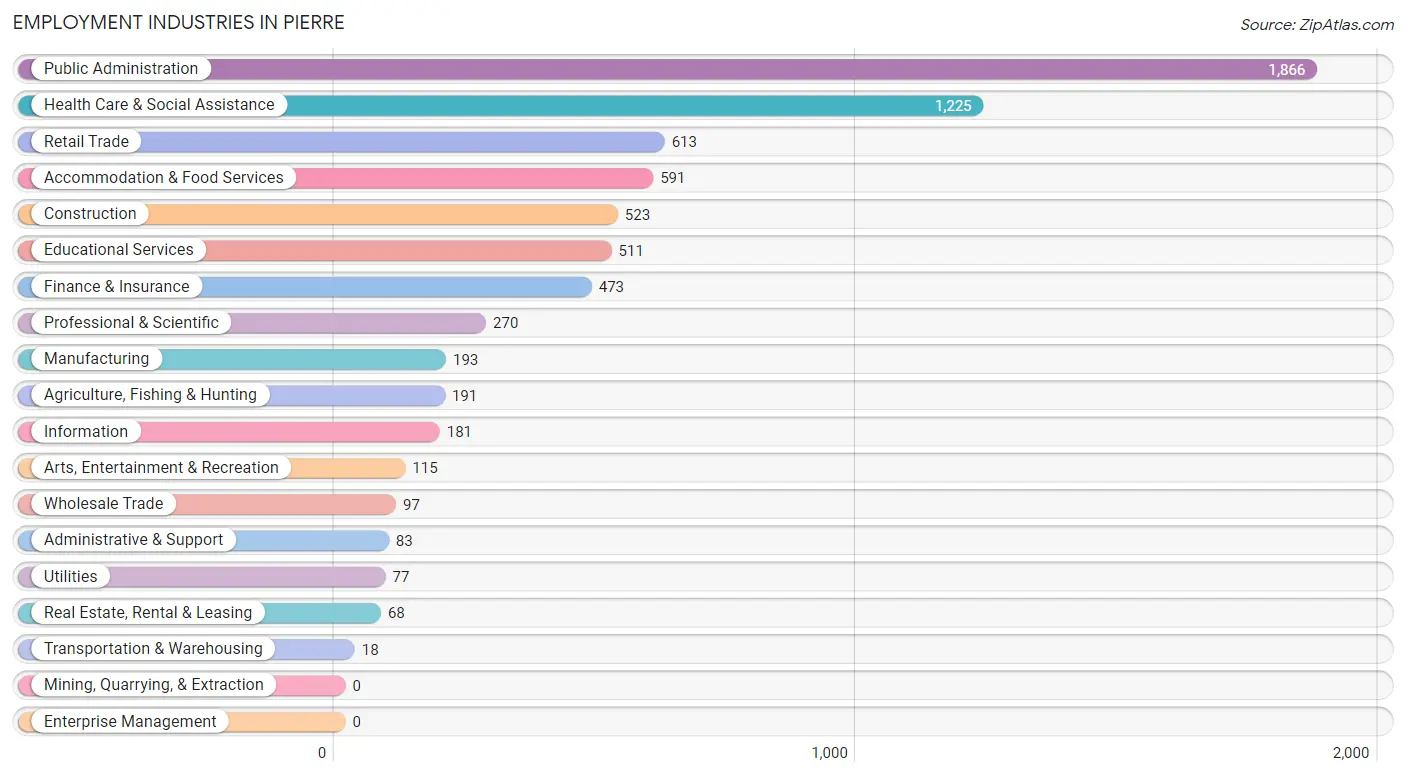
Employment Industries in Pierre
The major employment industries in Pierre include Public Administration (1,866 | 25.5%), Health Care & Social Assistance (1,225 | 16.8%), Retail Trade (613 | 8.4%), Accommodation & Food Services (591 | 8.1%), and Construction (523 | 7.2%).
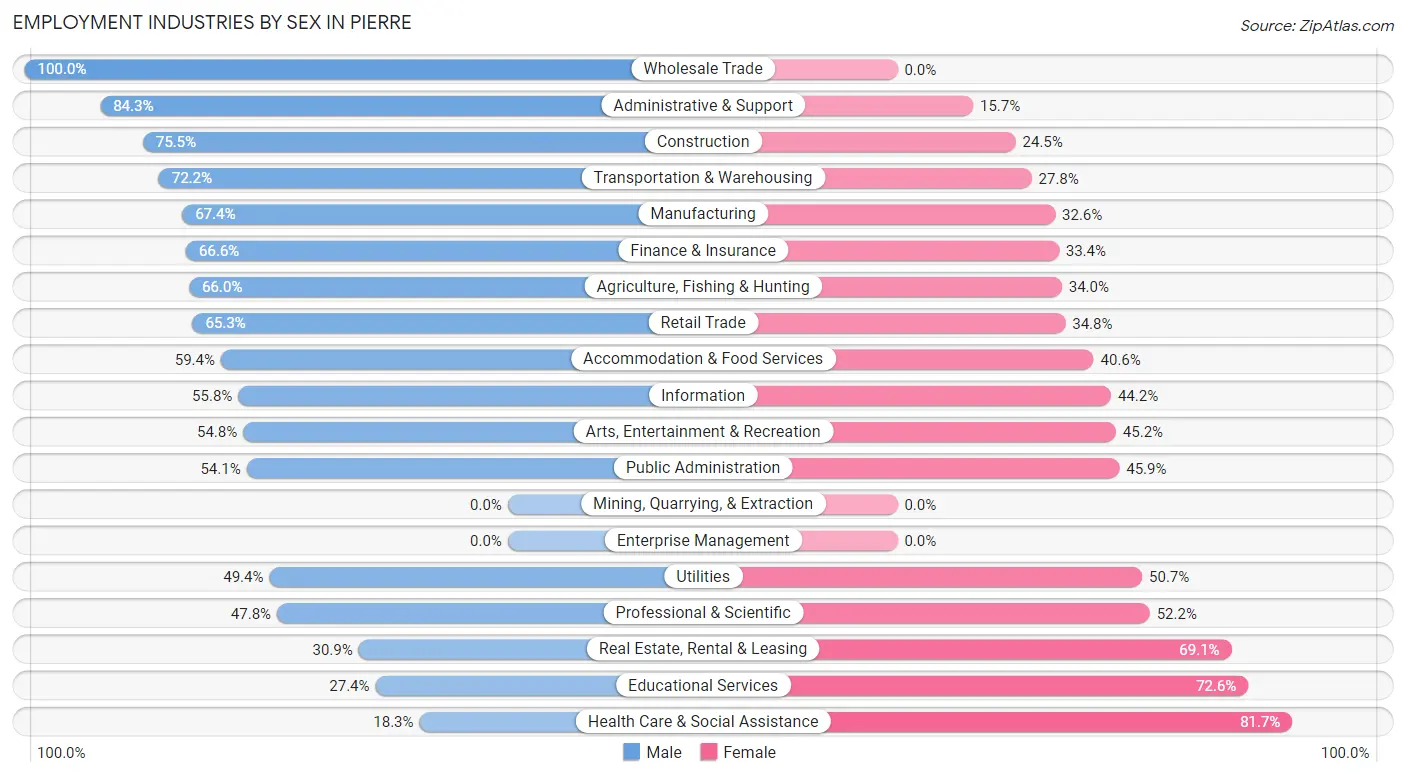
Employment Industries by Sex in Pierre
The Pierre industries that see more men than women are Wholesale Trade (100.0%), Administrative & Support (84.3%), and Construction (75.5%), whereas the industries that tend to have a higher number of women are Health Care & Social Assistance (81.7%), Educational Services (72.6%), and Real Estate, Rental & Leasing (69.1%).
| Industry | Male | Female |
| Agriculture, Fishing & Hunting | 126 (66.0%) | 65 (34.0%) |
| Mining, Quarrying, & Extraction | 0 (0.0%) | 0 (0.0%) |
| Construction | 395 (75.5%) | 128 (24.5%) |
| Manufacturing | 130 (67.4%) | 63 (32.6%) |
| Wholesale Trade | 97 (100.0%) | 0 (0.0%) |
| Retail Trade | 400 (65.2%) | 213 (34.7%) |
| Transportation & Warehousing | 13 (72.2%) | 5 (27.8%) |
| Utilities | 38 (49.3%) | 39 (50.6%) |
| Information | 101 (55.8%) | 80 (44.2%) |
| Finance & Insurance | 315 (66.6%) | 158 (33.4%) |
| Real Estate, Rental & Leasing | 21 (30.9%) | 47 (69.1%) |
| Professional & Scientific | 129 (47.8%) | 141 (52.2%) |
| Enterprise Management | 0 (0.0%) | 0 (0.0%) |
| Administrative & Support | 70 (84.3%) | 13 (15.7%) |
| Educational Services | 140 (27.4%) | 371 (72.6%) |
| Health Care & Social Assistance | 224 (18.3%) | 1,001 (81.7%) |
| Arts, Entertainment & Recreation | 63 (54.8%) | 52 (45.2%) |
| Accommodation & Food Services | 351 (59.4%) | 240 (40.6%) |
| Public Administration | 1,009 (54.1%) | 857 (45.9%) |
| Total | 3,682 (50.4%) | 3,626 (49.6%) |
Education in Pierre
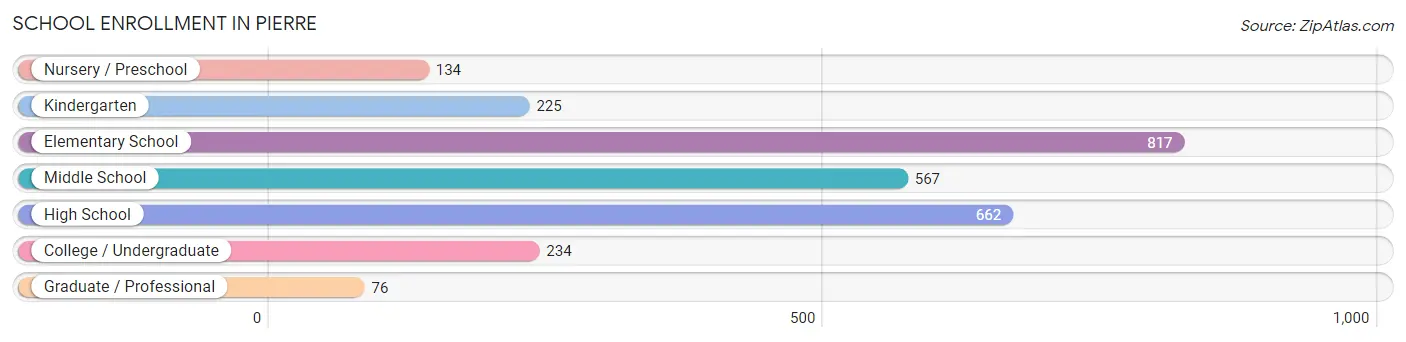
School Enrollment in Pierre
The most common levels of schooling among the 2,715 students in Pierre are elementary school (817 | 30.1%), high school (662 | 24.4%), and middle school (567 | 20.9%).
| School Level | # Students | % Students |
| Nursery / Preschool | 134 | 4.9% |
| Kindergarten | 225 | 8.3% |
| Elementary School | 817 | 30.1% |
| Middle School | 567 | 20.9% |
| High School | 662 | 24.4% |
| College / Undergraduate | 234 | 8.6% |
| Graduate / Professional | 76 | 2.8% |
| Total | 2,715 | 100.0% |
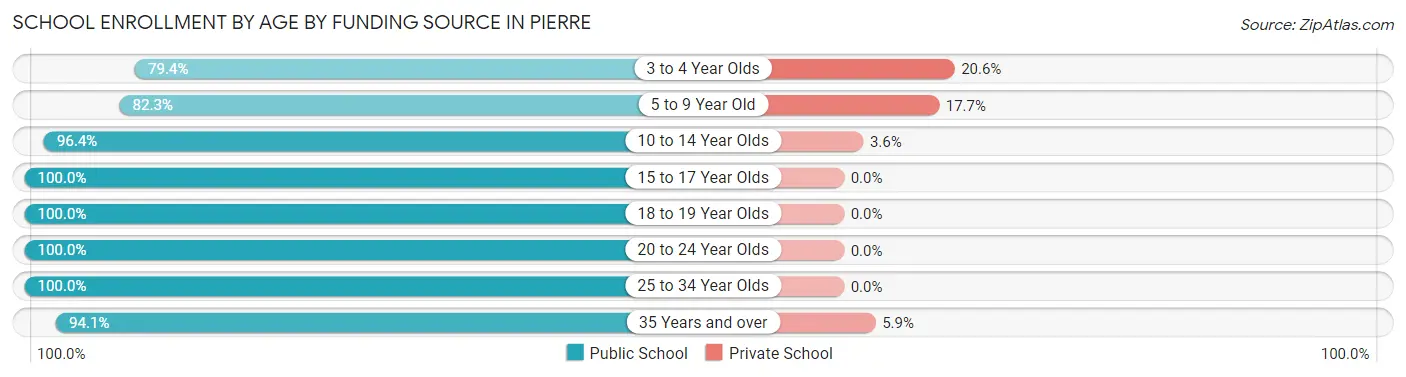
School Enrollment by Age by Funding Source in Pierre
Out of a total of 2,715 students who are enrolled in schools in Pierre, 204 (7.5%) attend a private institution, while the remaining 2,511 (92.5%) are enrolled in public schools. The age group of 3 to 4 year olds has the highest likelihood of being enrolled in private schools, with 21 (20.6% in the age bracket) enrolled. Conversely, the age group of 15 to 17 year olds has the lowest likelihood of being enrolled in a private school, with 524 (100.0% in the age bracket) attending a public institution.
| Age Bracket | Public School | Private School |
| 3 to 4 Year Olds | 81 (79.4%) | 21 (20.6%) |
| 5 to 9 Year Old | 669 (82.3%) | 144 (17.7%) |
| 10 to 14 Year Olds | 858 (96.4%) | 32 (3.6%) |
| 15 to 17 Year Olds | 524 (100.0%) | 0 (0.0%) |
| 18 to 19 Year Olds | 98 (100.0%) | 0 (0.0%) |
| 20 to 24 Year Olds | 60 (100.0%) | 0 (0.0%) |
| 25 to 34 Year Olds | 109 (100.0%) | 0 (0.0%) |
| 35 Years and over | 112 (94.1%) | 7 (5.9%) |
| Total | 2,511 (92.5%) | 204 (7.5%) |
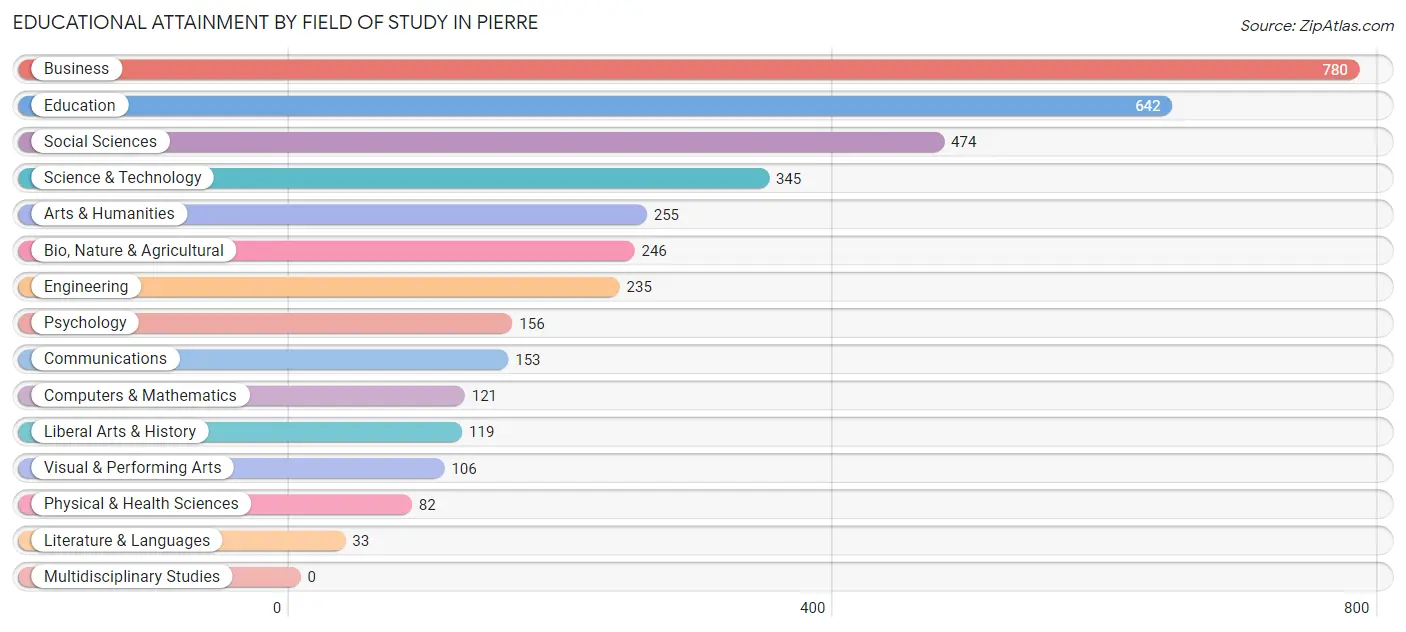
Educational Attainment by Field of Study in Pierre
Business (780 | 20.8%), education (642 | 17.1%), social sciences (474 | 12.7%), science & technology (345 | 9.2%), and arts & humanities (255 | 6.8%) are the most common fields of study among 3,747 individuals in Pierre who have obtained a bachelor's degree or higher.
| Field of Study | # Graduates | % Graduates |
| Computers & Mathematics | 121 | 3.2% |
| Bio, Nature & Agricultural | 246 | 6.6% |
| Physical & Health Sciences | 82 | 2.2% |
| Psychology | 156 | 4.2% |
| Social Sciences | 474 | 12.7% |
| Engineering | 235 | 6.3% |
| Multidisciplinary Studies | 0 | 0.0% |
| Science & Technology | 345 | 9.2% |
| Business | 780 | 20.8% |
| Education | 642 | 17.1% |
| Literature & Languages | 33 | 0.9% |
| Liberal Arts & History | 119 | 3.2% |
| Visual & Performing Arts | 106 | 2.8% |
| Communications | 153 | 4.1% |
| Arts & Humanities | 255 | 6.8% |
| Total | 3,747 | 100.0% |
Transportation & Commute in Pierre
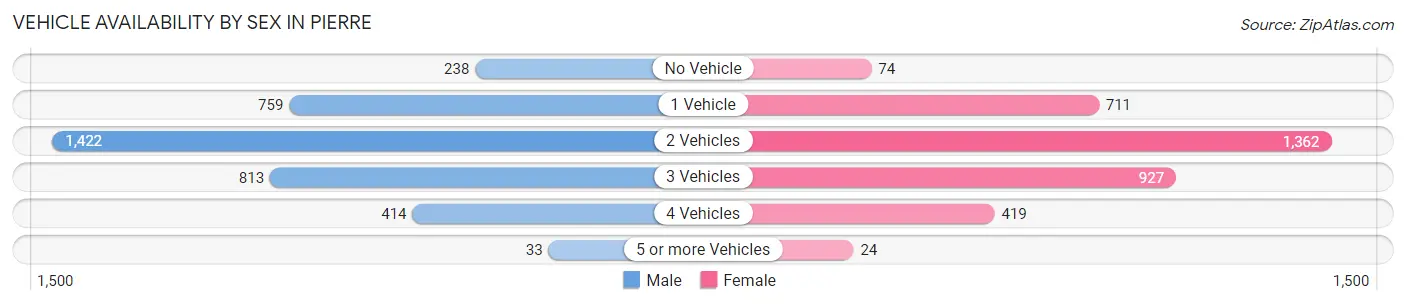
Vehicle Availability by Sex in Pierre
The most prevalent vehicle ownership categories in Pierre are males with 2 vehicles (1,422, accounting for 38.7%) and females with 2 vehicles (1,362, making up 40.4%).
| Vehicles Available | Male | Female |
| No Vehicle | 238 (6.5%) | 74 (2.1%) |
| 1 Vehicle | 759 (20.6%) | 711 (20.2%) |
| 2 Vehicles | 1,422 (38.7%) | 1,362 (38.7%) |
| 3 Vehicles | 813 (22.1%) | 927 (26.4%) |
| 4 Vehicles | 414 (11.3%) | 419 (11.9%) |
| 5 or more Vehicles | 33 (0.9%) | 24 (0.7%) |
| Total | 3,679 (100.0%) | 3,517 (100.0%) |
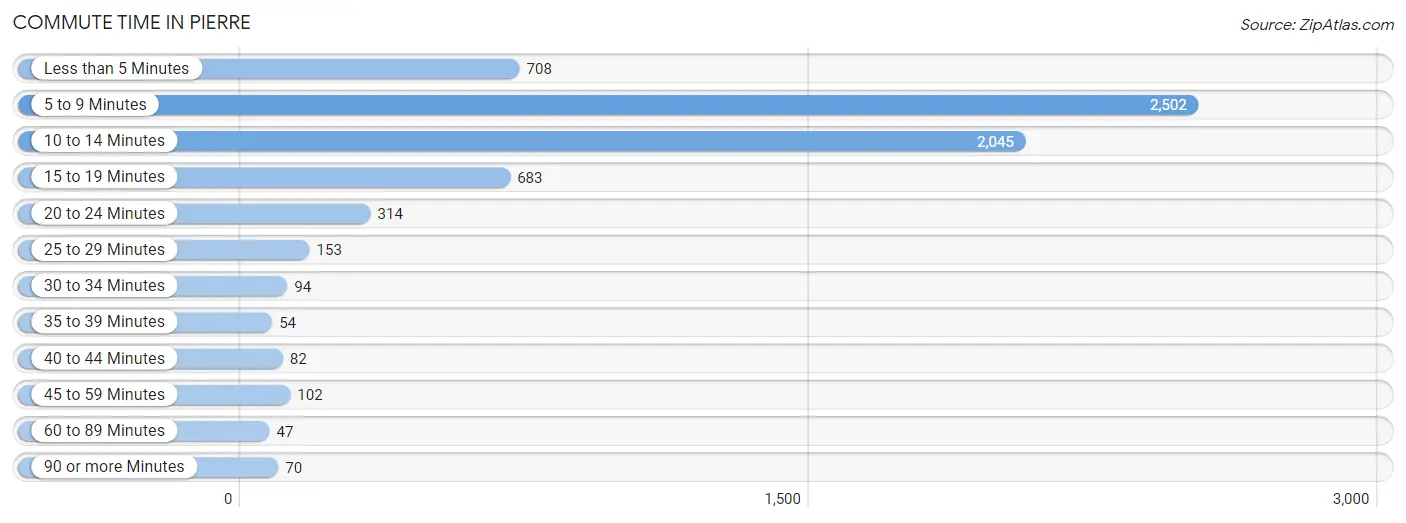
Commute Time in Pierre
The most frequently occuring commute durations in Pierre are 5 to 9 minutes (2,502 commuters, 36.5%), 10 to 14 minutes (2,045 commuters, 29.8%), and less than 5 minutes (708 commuters, 10.3%).
| Commute Time | # Commuters | % Commuters |
| Less than 5 Minutes | 708 | 10.3% |
| 5 to 9 Minutes | 2,502 | 36.5% |
| 10 to 14 Minutes | 2,045 | 29.8% |
| 15 to 19 Minutes | 683 | 10.0% |
| 20 to 24 Minutes | 314 | 4.6% |
| 25 to 29 Minutes | 153 | 2.2% |
| 30 to 34 Minutes | 94 | 1.4% |
| 35 to 39 Minutes | 54 | 0.8% |
| 40 to 44 Minutes | 82 | 1.2% |
| 45 to 59 Minutes | 102 | 1.5% |
| 60 to 89 Minutes | 47 | 0.7% |
| 90 or more Minutes | 70 | 1.0% |
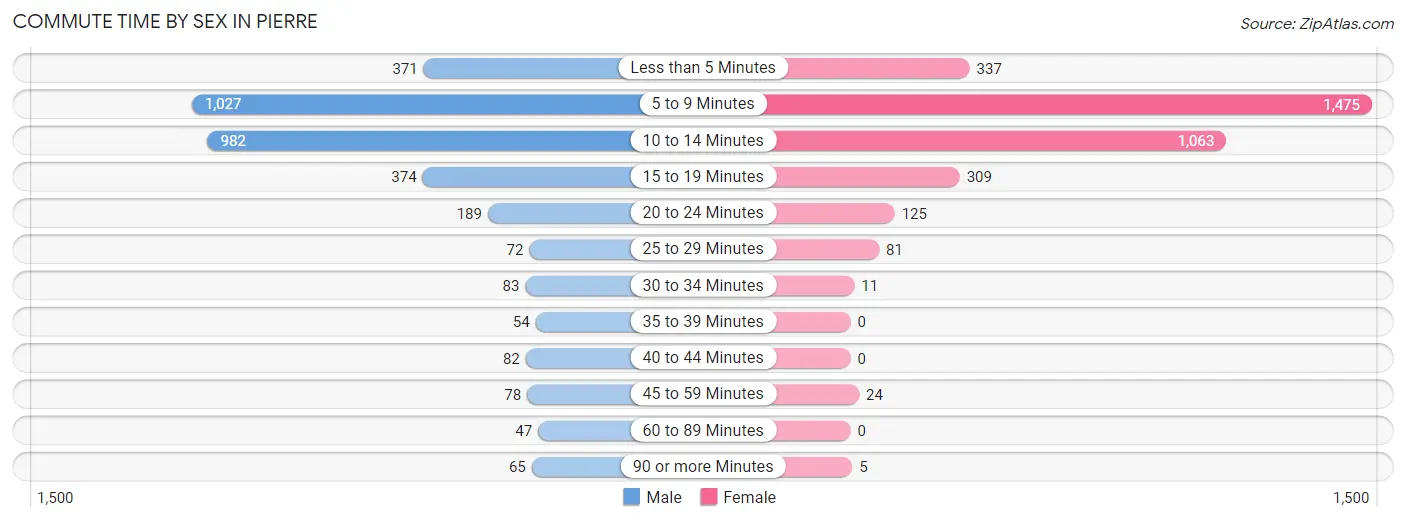
Commute Time by Sex in Pierre
The most common commute times in Pierre are 5 to 9 minutes (1,027 commuters, 30.0%) for males and 5 to 9 minutes (1,475 commuters, 43.0%) for females.
| Commute Time | Male | Female |
| Less than 5 Minutes | 371 (10.8%) | 337 (9.8%) |
| 5 to 9 Minutes | 1,027 (30.0%) | 1,475 (43.0%) |
| 10 to 14 Minutes | 982 (28.7%) | 1,063 (31.0%) |
| 15 to 19 Minutes | 374 (10.9%) | 309 (9.0%) |
| 20 to 24 Minutes | 189 (5.5%) | 125 (3.6%) |
| 25 to 29 Minutes | 72 (2.1%) | 81 (2.4%) |
| 30 to 34 Minutes | 83 (2.4%) | 11 (0.3%) |
| 35 to 39 Minutes | 54 (1.6%) | 0 (0.0%) |
| 40 to 44 Minutes | 82 (2.4%) | 0 (0.0%) |
| 45 to 59 Minutes | 78 (2.3%) | 24 (0.7%) |
| 60 to 89 Minutes | 47 (1.4%) | 0 (0.0%) |
| 90 or more Minutes | 65 (1.9%) | 5 (0.2%) |
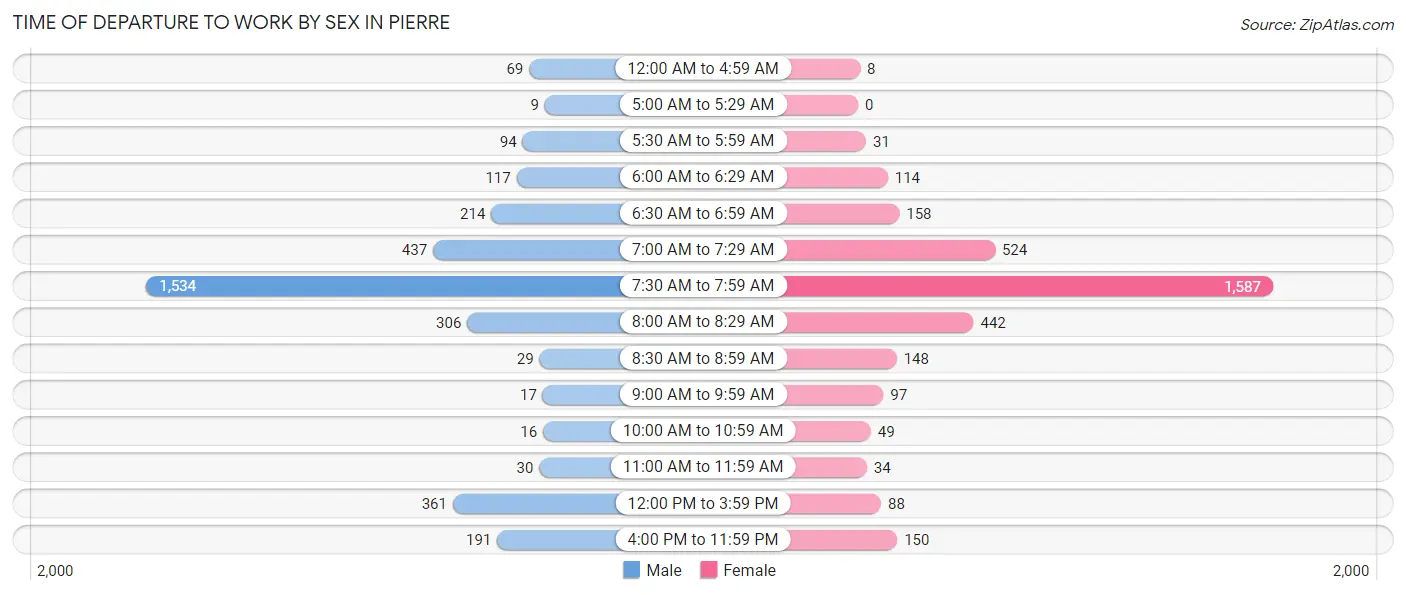
Time of Departure to Work by Sex in Pierre
The most frequent times of departure to work in Pierre are 7:30 AM to 7:59 AM (1,534, 44.8%) for males and 7:30 AM to 7:59 AM (1,587, 46.3%) for females.
| Time of Departure | Male | Female |
| 12:00 AM to 4:59 AM | 69 (2.0%) | 8 (0.2%) |
| 5:00 AM to 5:29 AM | 9 (0.3%) | 0 (0.0%) |
| 5:30 AM to 5:59 AM | 94 (2.8%) | 31 (0.9%) |
| 6:00 AM to 6:29 AM | 117 (3.4%) | 114 (3.3%) |
| 6:30 AM to 6:59 AM | 214 (6.2%) | 158 (4.6%) |
| 7:00 AM to 7:29 AM | 437 (12.8%) | 524 (15.3%) |
| 7:30 AM to 7:59 AM | 1,534 (44.8%) | 1,587 (46.3%) |
| 8:00 AM to 8:29 AM | 306 (8.9%) | 442 (12.9%) |
| 8:30 AM to 8:59 AM | 29 (0.9%) | 148 (4.3%) |
| 9:00 AM to 9:59 AM | 17 (0.5%) | 97 (2.8%) |
| 10:00 AM to 10:59 AM | 16 (0.5%) | 49 (1.4%) |
| 11:00 AM to 11:59 AM | 30 (0.9%) | 34 (1.0%) |
| 12:00 PM to 3:59 PM | 361 (10.5%) | 88 (2.6%) |
| 4:00 PM to 11:59 PM | 191 (5.6%) | 150 (4.4%) |
| Total | 3,424 (100.0%) | 3,430 (100.0%) |
Housing Occupancy in Pierre
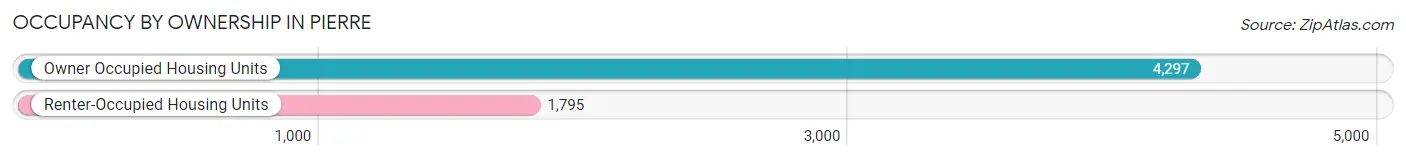
Occupancy by Ownership in Pierre
Of the total 6,092 dwellings in Pierre, owner-occupied units account for 4,297 (70.5%), while renter-occupied units make up 1,795 (29.5%).
| Occupancy | # Housing Units | % Housing Units |
| Owner Occupied Housing Units | 4,297 | 70.5% |
| Renter-Occupied Housing Units | 1,795 | 29.5% |
| Total Occupied Housing Units | 6,092 | 100.0% |
Occupancy by Household Size in Pierre
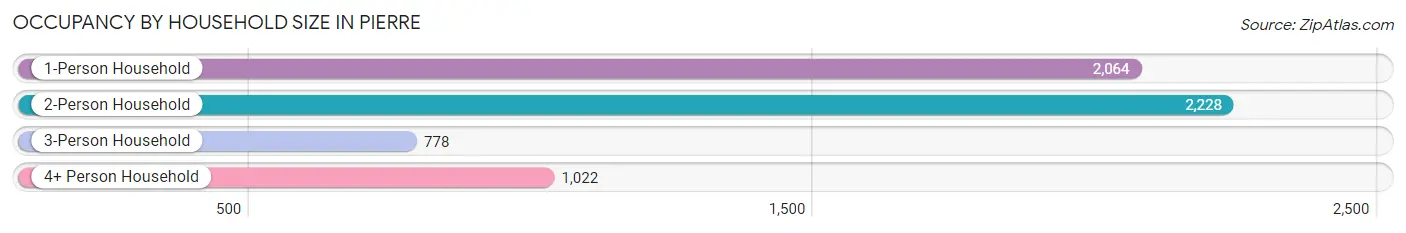
| Household Size | # Housing Units | % Housing Units |
| 1-Person Household | 2,064 | 33.9% |
| 2-Person Household | 2,228 | 36.6% |
| 3-Person Household | 778 | 12.8% |
| 4+ Person Household | 1,022 | 16.8% |
| Total Housing Units | 6,092 | 100.0% |
Occupancy by Ownership by Household Size in Pierre
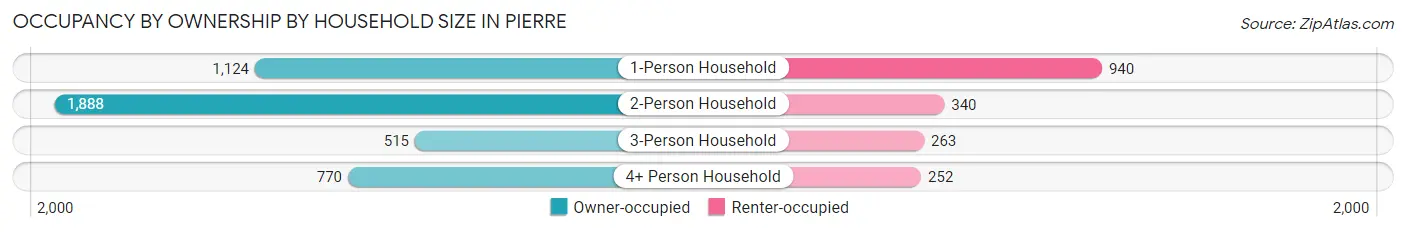
| Household Size | Owner-occupied | Renter-occupied |
| 1-Person Household | 1,124 (54.5%) | 940 (45.5%) |
| 2-Person Household | 1,888 (84.7%) | 340 (15.3%) |
| 3-Person Household | 515 (66.2%) | 263 (33.8%) |
| 4+ Person Household | 770 (75.3%) | 252 (24.7%) |
| Total Housing Units | 4,297 (70.5%) | 1,795 (29.5%) |
Occupancy by Educational Attainment in Pierre
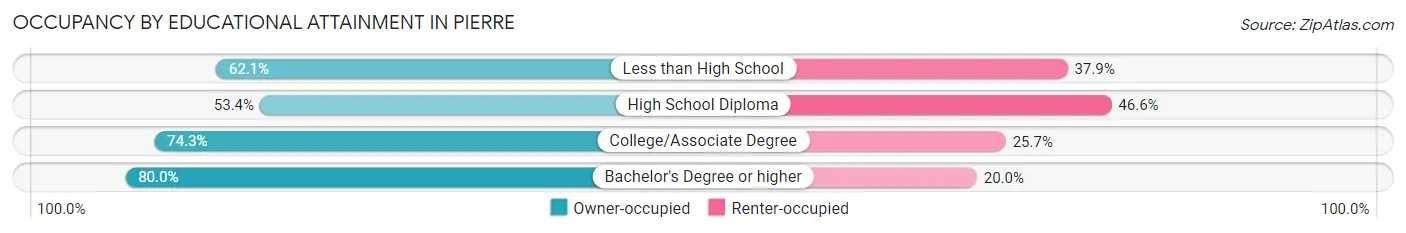
| Household Size | Owner-occupied | Renter-occupied |
| Less than High School | 90 (62.1%) | 55 (37.9%) |
| High School Diploma | 866 (53.4%) | 757 (46.6%) |
| College/Associate Degree | 1,553 (74.3%) | 537 (25.7%) |
| Bachelor's Degree or higher | 1,788 (80.0%) | 446 (20.0%) |
Occupancy by Age of Householder in Pierre
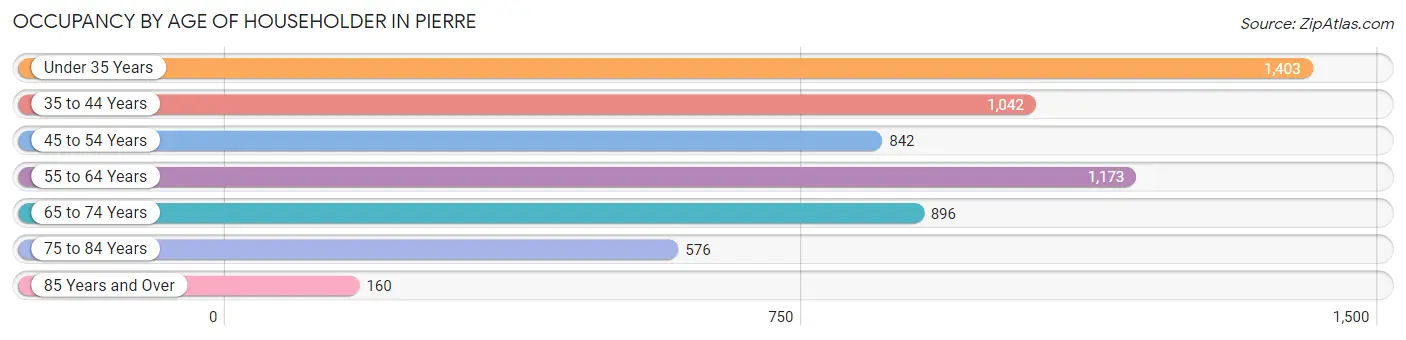
| Age Bracket | # Households | % Households |
| Under 35 Years | 1,403 | 23.0% |
| 35 to 44 Years | 1,042 | 17.1% |
| 45 to 54 Years | 842 | 13.8% |
| 55 to 64 Years | 1,173 | 19.3% |
| 65 to 74 Years | 896 | 14.7% |
| 75 to 84 Years | 576 | 9.5% |
| 85 Years and Over | 160 | 2.6% |
| Total | 6,092 | 100.0% |
Housing Finances in Pierre
Median Income by Occupancy in Pierre
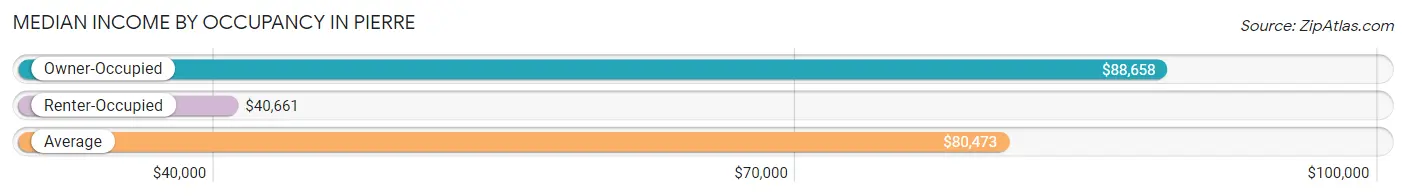
| Occupancy Type | # Households | Median Income |
| Owner-Occupied | 4,297 (70.5%) | $88,658 |
| Renter-Occupied | 1,795 (29.5%) | $40,661 |
| Average | 6,092 (100.0%) | $80,473 |
Occupancy by Householder Income Bracket in Pierre
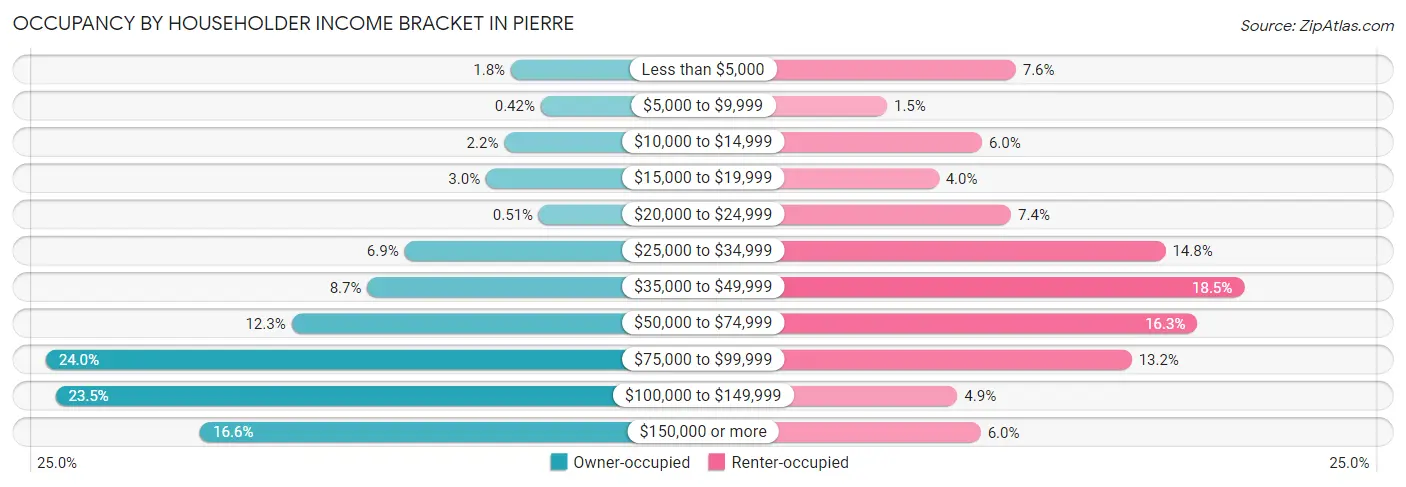
| Income Bracket | Owner-occupied | Renter-occupied |
| Less than $5,000 | 79 (1.8%) | 137 (7.6%) |
| $5,000 to $9,999 | 18 (0.4%) | 27 (1.5%) |
| $10,000 to $14,999 | 93 (2.2%) | 108 (6.0%) |
| $15,000 to $19,999 | 130 (3.0%) | 71 (4.0%) |
| $20,000 to $24,999 | 22 (0.5%) | 133 (7.4%) |
| $25,000 to $34,999 | 297 (6.9%) | 265 (14.8%) |
| $35,000 to $49,999 | 373 (8.7%) | 332 (18.5%) |
| $50,000 to $74,999 | 528 (12.3%) | 292 (16.3%) |
| $75,000 to $99,999 | 1,031 (24.0%) | 236 (13.2%) |
| $100,000 to $149,999 | 1,011 (23.5%) | 87 (4.9%) |
| $150,000 or more | 715 (16.6%) | 107 (6.0%) |
| Total | 4,297 (100.0%) | 1,795 (100.0%) |
Monthly Housing Cost Tiers in Pierre
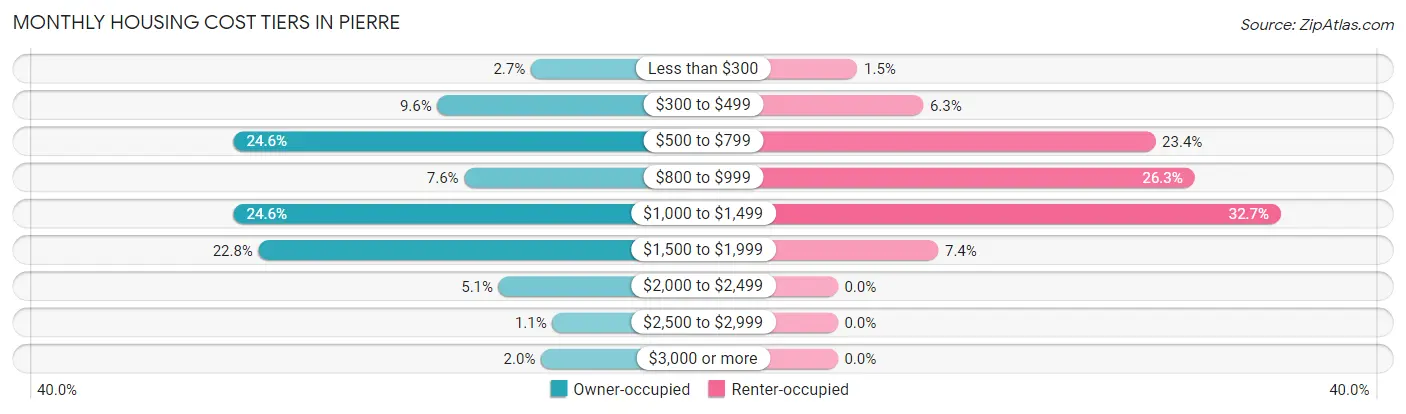
| Monthly Cost | Owner-occupied | Renter-occupied |
| Less than $300 | 116 (2.7%) | 26 (1.5%) |
| $300 to $499 | 412 (9.6%) | 113 (6.3%) |
| $500 to $799 | 1,057 (24.6%) | 420 (23.4%) |
| $800 to $999 | 327 (7.6%) | 472 (26.3%) |
| $1,000 to $1,499 | 1,057 (24.6%) | 586 (32.7%) |
| $1,500 to $1,999 | 978 (22.8%) | 133 (7.4%) |
| $2,000 to $2,499 | 218 (5.1%) | 0 (0.0%) |
| $2,500 to $2,999 | 48 (1.1%) | 0 (0.0%) |
| $3,000 or more | 84 (1.9%) | 0 (0.0%) |
| Total | 4,297 (100.0%) | 1,795 (100.0%) |
Physical Housing Characteristics in Pierre
Housing Structures in Pierre
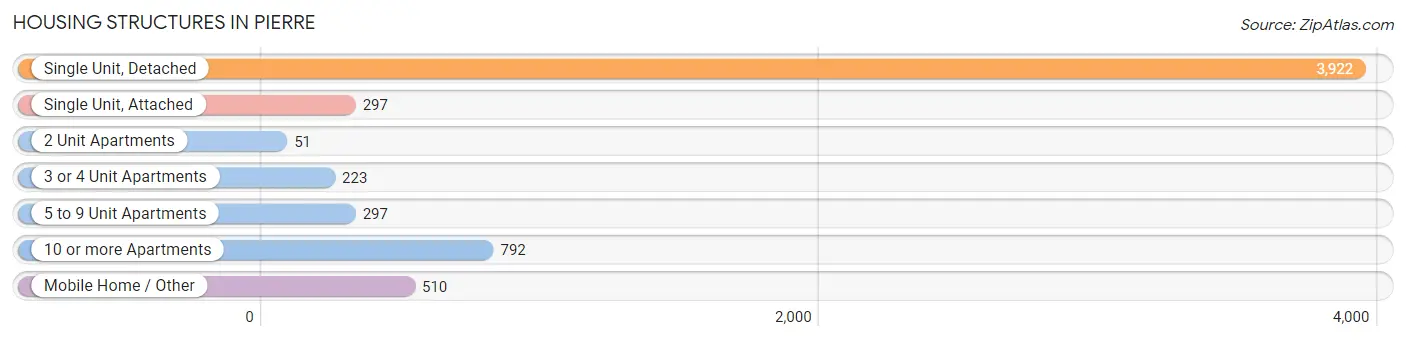
| Structure Type | # Housing Units | % Housing Units |
| Single Unit, Detached | 3,922 | 64.4% |
| Single Unit, Attached | 297 | 4.9% |
| 2 Unit Apartments | 51 | 0.8% |
| 3 or 4 Unit Apartments | 223 | 3.7% |
| 5 to 9 Unit Apartments | 297 | 4.9% |
| 10 or more Apartments | 792 | 13.0% |
| Mobile Home / Other | 510 | 8.4% |
| Total | 6,092 | 100.0% |
Housing Structures by Occupancy in Pierre
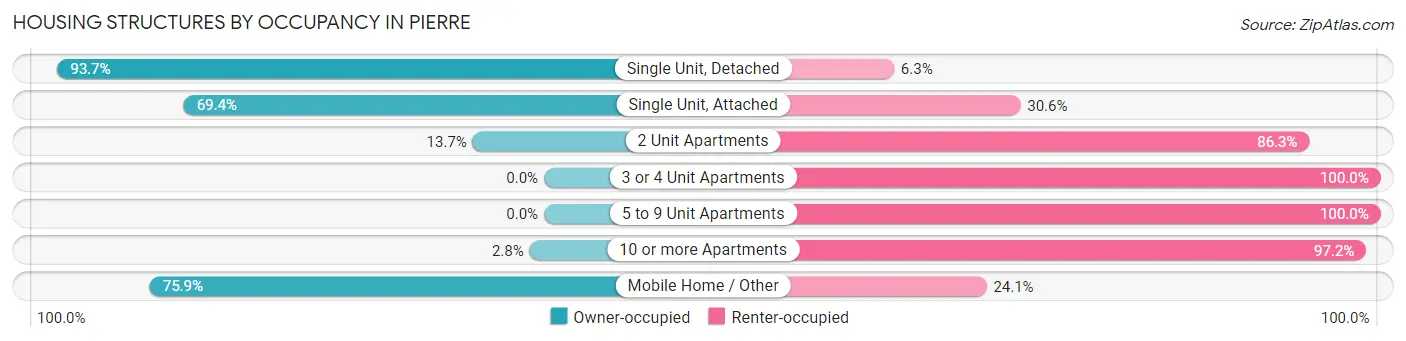
| Structure Type | Owner-occupied | Renter-occupied |
| Single Unit, Detached | 3,675 (93.7%) | 247 (6.3%) |
| Single Unit, Attached | 206 (69.4%) | 91 (30.6%) |
| 2 Unit Apartments | 7 (13.7%) | 44 (86.3%) |
| 3 or 4 Unit Apartments | 0 (0.0%) | 223 (100.0%) |
| 5 to 9 Unit Apartments | 0 (0.0%) | 297 (100.0%) |
| 10 or more Apartments | 22 (2.8%) | 770 (97.2%) |
| Mobile Home / Other | 387 (75.9%) | 123 (24.1%) |
| Total | 4,297 (70.5%) | 1,795 (29.5%) |
Housing Structures by Number of Rooms in Pierre
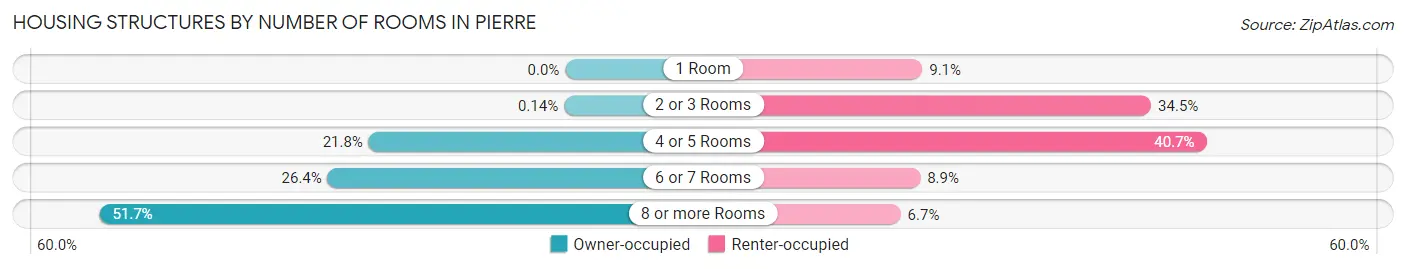
| Number of Rooms | Owner-occupied | Renter-occupied |
| 1 Room | 0 (0.0%) | 164 (9.1%) |
| 2 or 3 Rooms | 6 (0.1%) | 620 (34.5%) |
| 4 or 5 Rooms | 937 (21.8%) | 730 (40.7%) |
| 6 or 7 Rooms | 1,133 (26.4%) | 160 (8.9%) |
| 8 or more Rooms | 2,221 (51.7%) | 121 (6.7%) |
| Total | 4,297 (100.0%) | 1,795 (100.0%) |
Housing Structure by Heating Type in Pierre
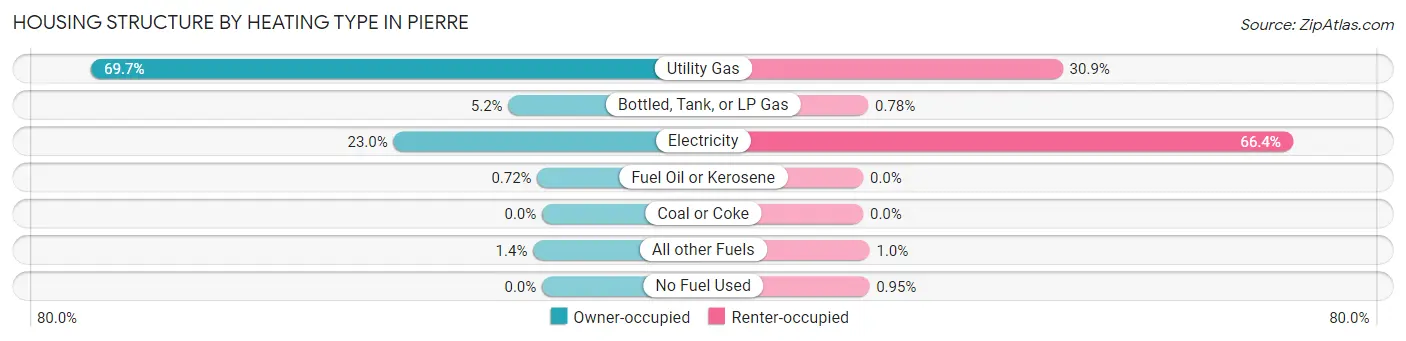
| Heating Type | Owner-occupied | Renter-occupied |
| Utility Gas | 2,996 (69.7%) | 554 (30.9%) |
| Bottled, Tank, or LP Gas | 224 (5.2%) | 14 (0.8%) |
| Electricity | 987 (23.0%) | 1,192 (66.4%) |
| Fuel Oil or Kerosene | 31 (0.7%) | 0 (0.0%) |
| Coal or Coke | 0 (0.0%) | 0 (0.0%) |
| All other Fuels | 59 (1.4%) | 18 (1.0%) |
| No Fuel Used | 0 (0.0%) | 17 (0.9%) |
| Total | 4,297 (100.0%) | 1,795 (100.0%) |
Household Vehicle Usage in Pierre
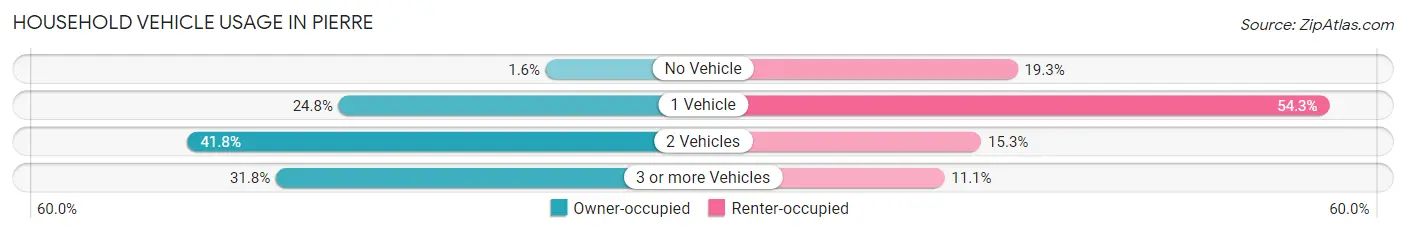
| Vehicles per Household | Owner-occupied | Renter-occupied |
| No Vehicle | 69 (1.6%) | 347 (19.3%) |
| 1 Vehicle | 1,066 (24.8%) | 974 (54.3%) |
| 2 Vehicles | 1,794 (41.7%) | 274 (15.3%) |
| 3 or more Vehicles | 1,368 (31.8%) | 200 (11.1%) |
| Total | 4,297 (100.0%) | 1,795 (100.0%) |
Real Estate & Mortgages in Pierre
Real Estate and Mortgage Overview in Pierre
| Characteristic | Without Mortgage | With Mortgage |
| Housing Units | 1,598 | 2,699 |
| Median Property Value | $187,900 | $224,400 |
| Median Household Income | $76,250 | $513 |
| Monthly Housing Costs | $602 | $84 |
| Real Estate Taxes | $2,185 | $0 |
Property Value by Mortgage Status in Pierre
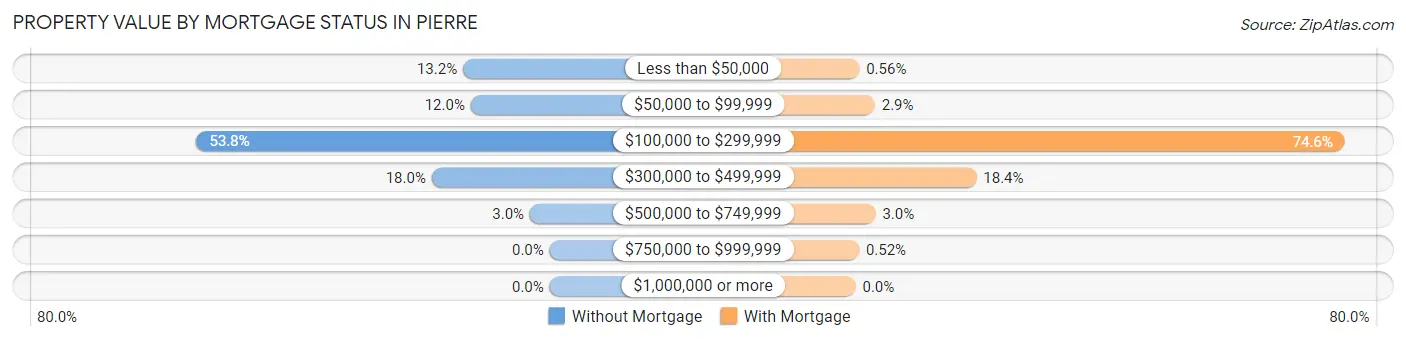
| Property Value | Without Mortgage | With Mortgage |
| Less than $50,000 | 211 (13.2%) | 15 (0.6%) |
| $50,000 to $99,999 | 192 (12.0%) | 79 (2.9%) |
| $100,000 to $299,999 | 860 (53.8%) | 2,012 (74.6%) |
| $300,000 to $499,999 | 287 (18.0%) | 497 (18.4%) |
| $500,000 to $749,999 | 48 (3.0%) | 82 (3.0%) |
| $750,000 to $999,999 | 0 (0.0%) | 14 (0.5%) |
| $1,000,000 or more | 0 (0.0%) | 0 (0.0%) |
| Total | 1,598 (100.0%) | 2,699 (100.0%) |
Household Income by Mortgage Status in Pierre
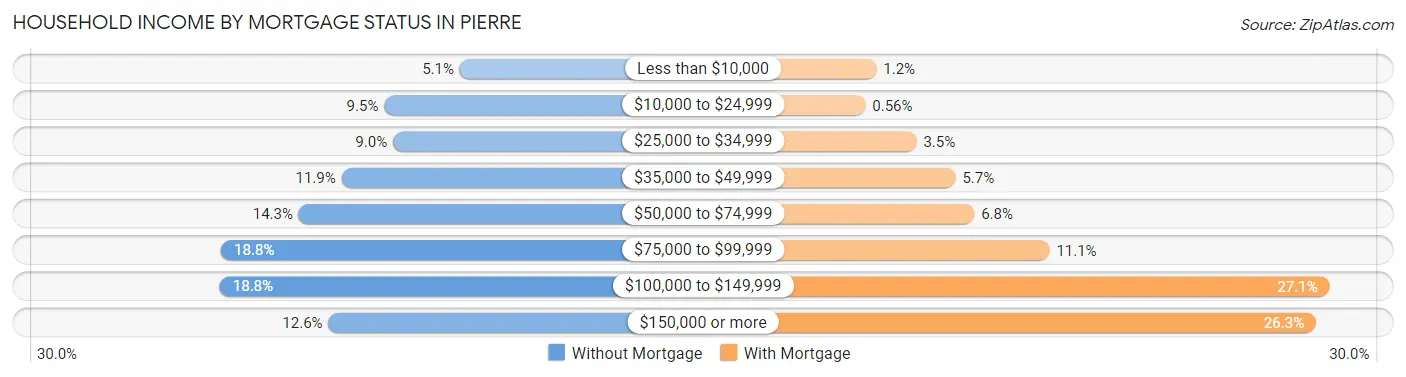
| Household Income | Without Mortgage | With Mortgage |
| Less than $10,000 | 82 (5.1%) | 32 (1.2%) |
| $10,000 to $24,999 | 151 (9.5%) | 15 (0.6%) |
| $25,000 to $34,999 | 143 (8.9%) | 94 (3.5%) |
| $35,000 to $49,999 | 190 (11.9%) | 154 (5.7%) |
| $50,000 to $74,999 | 229 (14.3%) | 183 (6.8%) |
| $75,000 to $99,999 | 300 (18.8%) | 299 (11.1%) |
| $100,000 to $149,999 | 301 (18.8%) | 731 (27.1%) |
| $150,000 or more | 202 (12.6%) | 710 (26.3%) |
| Total | 1,598 (100.0%) | 2,699 (100.0%) |
Property Value to Household Income Ratio in Pierre
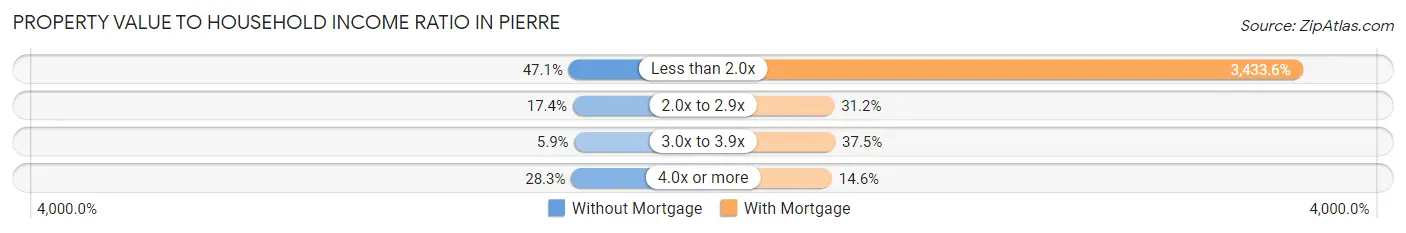
| Value-to-Income Ratio | Without Mortgage | With Mortgage |
| Less than 2.0x | 752 (47.1%) | 92,673 (3,433.6%) |
| 2.0x to 2.9x | 278 (17.4%) | 843 (31.2%) |
| 3.0x to 3.9x | 95 (5.9%) | 1,013 (37.5%) |
| 4.0x or more | 452 (28.3%) | 393 (14.6%) |
| Total | 1,598 (100.0%) | 2,699 (100.0%) |
Real Estate Taxes by Mortgage Status in Pierre
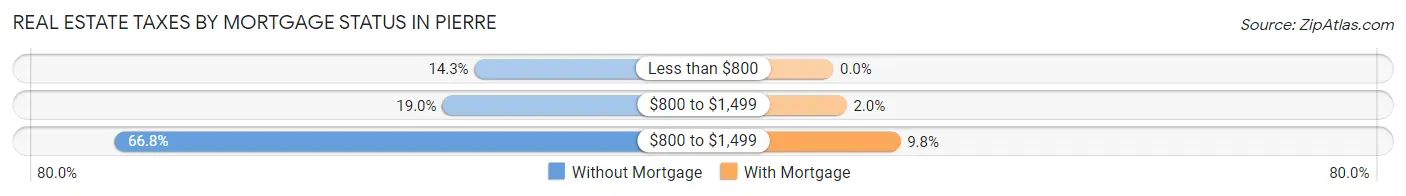
| Property Taxes | Without Mortgage | With Mortgage |
| Less than $800 | 228 (14.3%) | 0 (0.0%) |
| $800 to $1,499 | 303 (19.0%) | 53 (2.0%) |
| $800 to $1,499 | 1,067 (66.8%) | 265 (9.8%) |
| Total | 1,598 (100.0%) | 2,699 (100.0%) |
Health & Disability in Pierre
Health Insurance Coverage by Age in Pierre
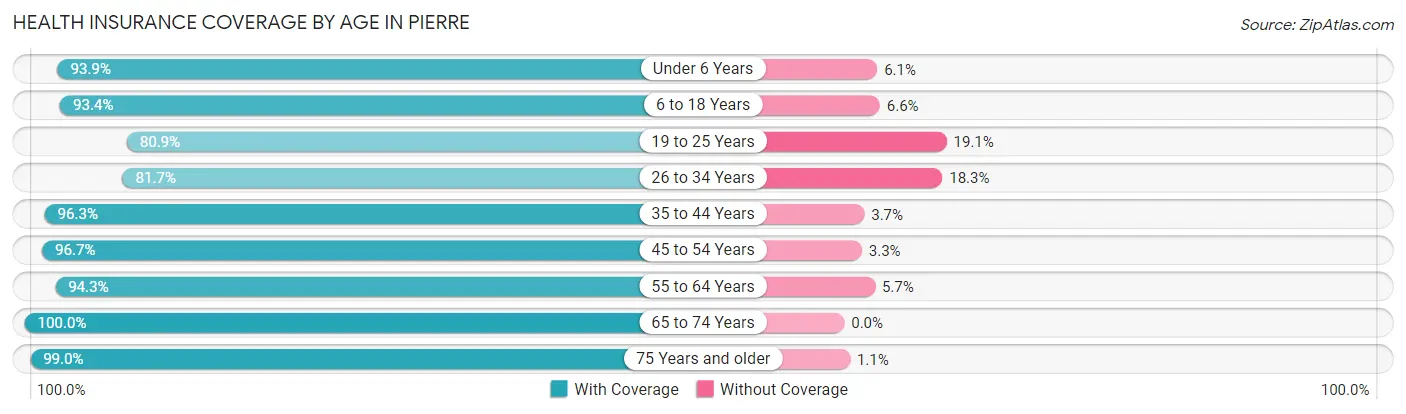
| Age Bracket | With Coverage | Without Coverage |
| Under 6 Years | 872 (93.9%) | 57 (6.1%) |
| 6 to 18 Years | 2,156 (93.4%) | 153 (6.6%) |
| 19 to 25 Years | 899 (80.9%) | 212 (19.1%) |
| 26 to 34 Years | 1,024 (81.7%) | 229 (18.3%) |
| 35 to 44 Years | 1,754 (96.3%) | 68 (3.7%) |
| 45 to 54 Years | 1,505 (96.7%) | 51 (3.3%) |
| 55 to 64 Years | 1,831 (94.3%) | 111 (5.7%) |
| 65 to 74 Years | 1,290 (100.0%) | 0 (0.0%) |
| 75 Years and older | 945 (99.0%) | 10 (1.1%) |
| Total | 12,276 (93.2%) | 891 (6.8%) |
Health Insurance Coverage by Citizenship Status in Pierre
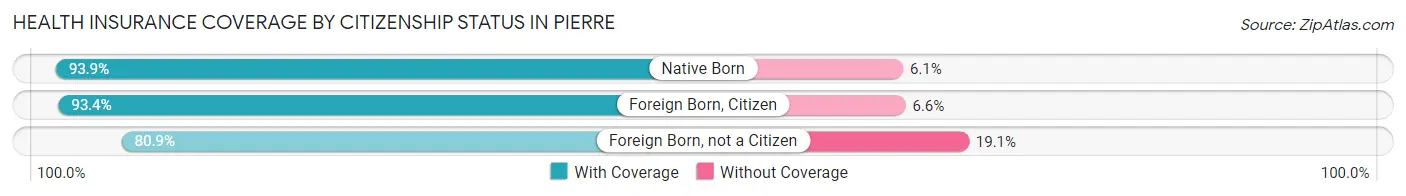
| Citizenship Status | With Coverage | Without Coverage |
| Native Born | 872 (93.9%) | 57 (6.1%) |
| Foreign Born, Citizen | 2,156 (93.4%) | 153 (6.6%) |
| Foreign Born, not a Citizen | 899 (80.9%) | 212 (19.1%) |
Health Insurance Coverage by Household Income in Pierre
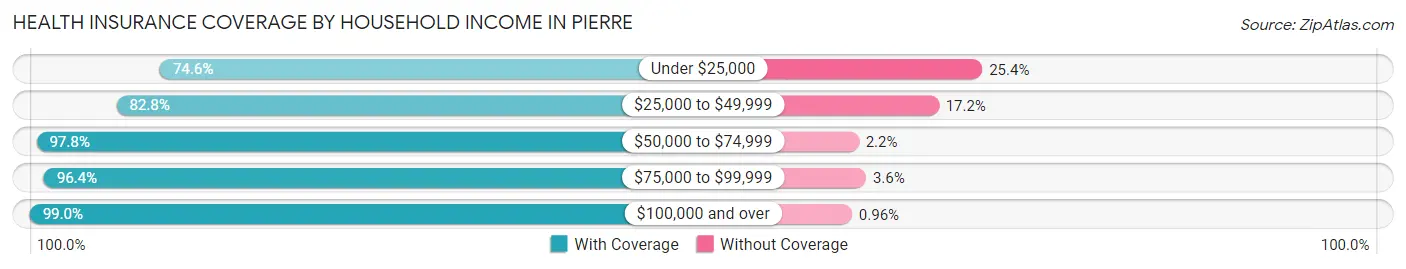
| Household Income | With Coverage | Without Coverage |
| Under $25,000 | 918 (74.6%) | 312 (25.4%) |
| $25,000 to $49,999 | 1,841 (82.8%) | 383 (17.2%) |
| $50,000 to $74,999 | 1,315 (97.8%) | 30 (2.2%) |
| $75,000 to $99,999 | 3,082 (96.4%) | 115 (3.6%) |
| $100,000 and over | 4,977 (99.0%) | 48 (1.0%) |
Public vs Private Health Insurance Coverage by Age in Pierre
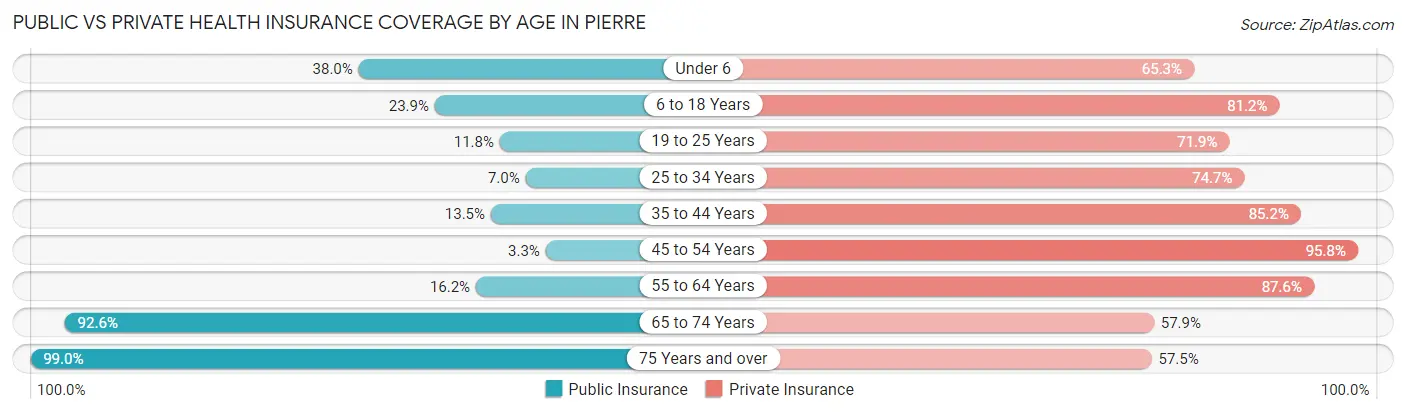
| Age Bracket | Public Insurance | Private Insurance |
| Under 6 | 353 (38.0%) | 607 (65.3%) |
| 6 to 18 Years | 551 (23.9%) | 1,875 (81.2%) |
| 19 to 25 Years | 131 (11.8%) | 799 (71.9%) |
| 25 to 34 Years | 88 (7.0%) | 936 (74.7%) |
| 35 to 44 Years | 245 (13.5%) | 1,552 (85.2%) |
| 45 to 54 Years | 51 (3.3%) | 1,490 (95.8%) |
| 55 to 64 Years | 315 (16.2%) | 1,701 (87.6%) |
| 65 to 74 Years | 1,194 (92.6%) | 747 (57.9%) |
| 75 Years and over | 945 (99.0%) | 549 (57.5%) |
| Total | 3,873 (29.4%) | 10,256 (77.9%) |
Disability Status by Sex by Age in Pierre
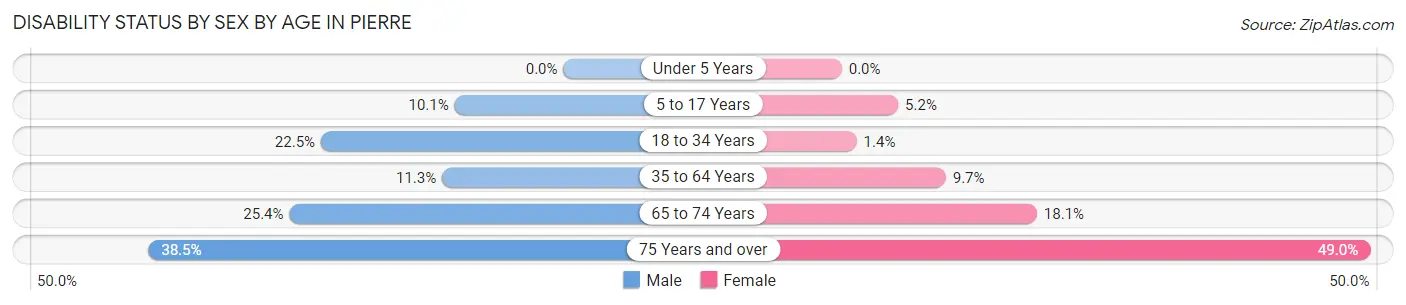
| Age Bracket | Male | Female |
| Under 5 Years | 0 (0.0%) | 0 (0.0%) |
| 5 to 17 Years | 121 (10.1%) | 61 (5.2%) |
| 18 to 34 Years | 277 (22.5%) | 17 (1.4%) |
| 35 to 64 Years | 298 (11.3%) | 258 (9.7%) |
| 65 to 74 Years | 161 (25.4%) | 119 (18.1%) |
| 75 Years and over | 151 (38.5%) | 276 (49.0%) |
Disability Class by Sex by Age in Pierre
Disability Class: Hearing Difficulty
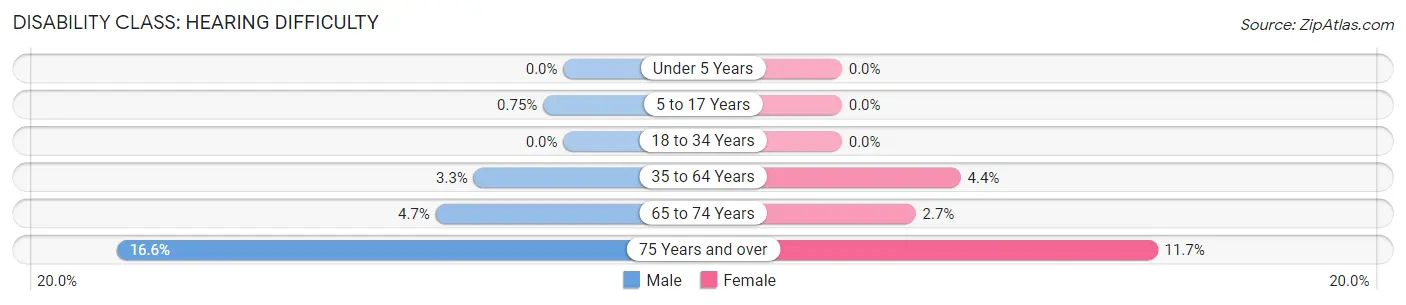
| Age Bracket | Male | Female |
| Under 5 Years | 0 (0.0%) | 0 (0.0%) |
| 5 to 17 Years | 9 (0.7%) | 0 (0.0%) |
| 18 to 34 Years | 0 (0.0%) | 0 (0.0%) |
| 35 to 64 Years | 88 (3.3%) | 118 (4.4%) |
| 65 to 74 Years | 30 (4.7%) | 18 (2.7%) |
| 75 Years and over | 65 (16.6%) | 66 (11.7%) |
Disability Class: Vision Difficulty
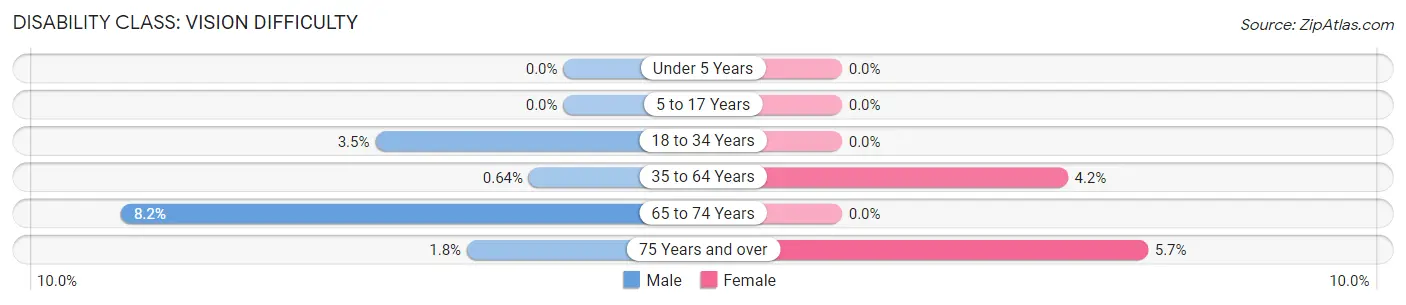
| Age Bracket | Male | Female |
| Under 5 Years | 0 (0.0%) | 0 (0.0%) |
| 5 to 17 Years | 0 (0.0%) | 0 (0.0%) |
| 18 to 34 Years | 43 (3.5%) | 0 (0.0%) |
| 35 to 64 Years | 17 (0.6%) | 112 (4.2%) |
| 65 to 74 Years | 52 (8.2%) | 0 (0.0%) |
| 75 Years and over | 7 (1.8%) | 32 (5.7%) |
Disability Class: Cognitive Difficulty
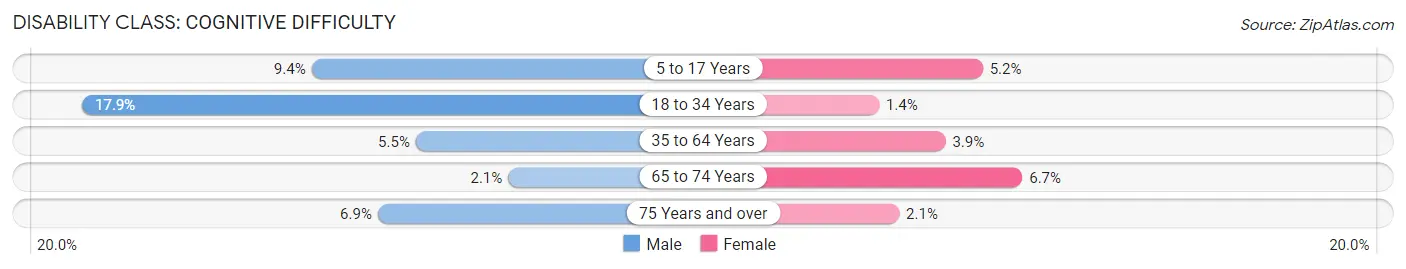
| Age Bracket | Male | Female |
| 5 to 17 Years | 112 (9.3%) | 61 (5.2%) |
| 18 to 34 Years | 220 (17.9%) | 17 (1.4%) |
| 35 to 64 Years | 145 (5.5%) | 103 (3.8%) |
| 65 to 74 Years | 13 (2.1%) | 44 (6.7%) |
| 75 Years and over | 27 (6.9%) | 12 (2.1%) |
Disability Class: Ambulatory Difficulty
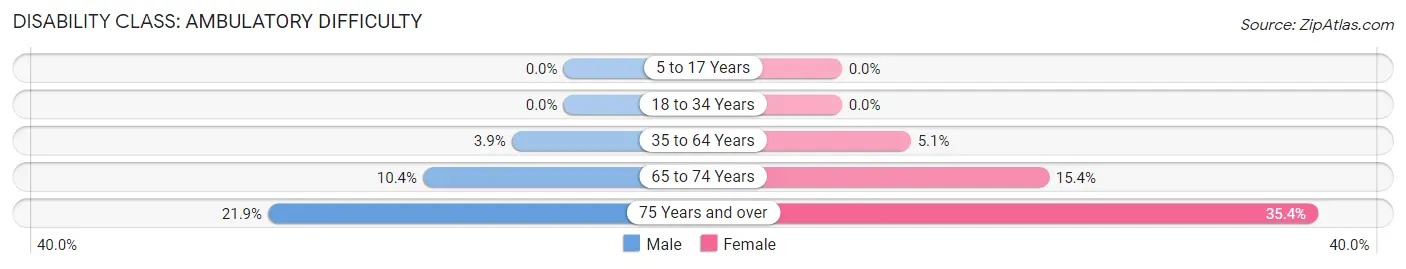
| Age Bracket | Male | Female |
| 5 to 17 Years | 0 (0.0%) | 0 (0.0%) |
| 18 to 34 Years | 0 (0.0%) | 0 (0.0%) |
| 35 to 64 Years | 102 (3.8%) | 137 (5.1%) |
| 65 to 74 Years | 66 (10.4%) | 101 (15.4%) |
| 75 Years and over | 86 (21.9%) | 199 (35.3%) |
Disability Class: Self-Care Difficulty
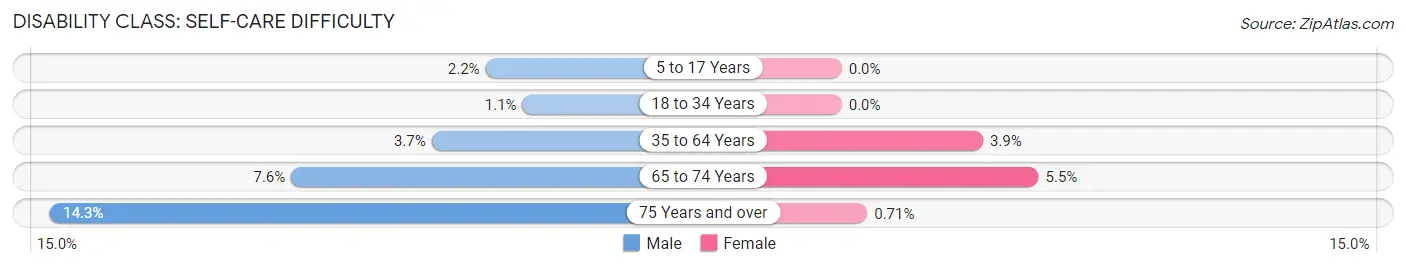
| Age Bracket | Male | Female |
| 5 to 17 Years | 26 (2.2%) | 0 (0.0%) |
| 18 to 34 Years | 14 (1.1%) | 0 (0.0%) |
| 35 to 64 Years | 97 (3.7%) | 105 (3.9%) |
| 65 to 74 Years | 48 (7.6%) | 36 (5.5%) |
| 75 Years and over | 56 (14.3%) | 4 (0.7%) |
Technology Access in Pierre
Computing Device Access in Pierre
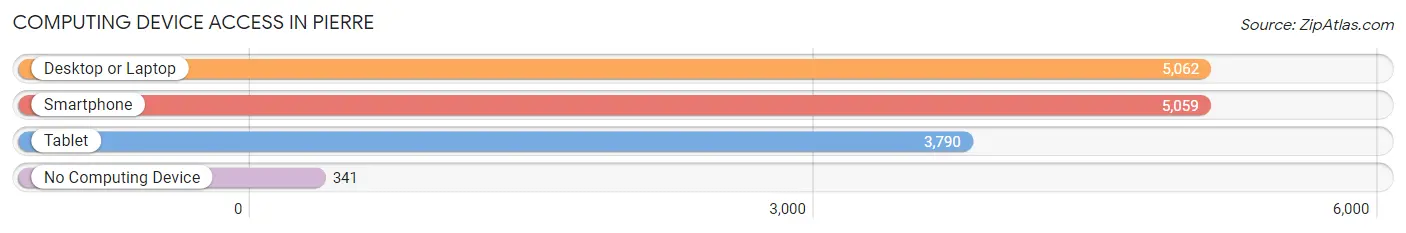
| Device Type | # Households | % Households |
| Desktop or Laptop | 5,062 | 83.1% |
| Smartphone | 5,059 | 83.0% |
| Tablet | 3,790 | 62.2% |
| No Computing Device | 341 | 5.6% |
| Total | 6,092 | 100.0% |
Internet Access in Pierre
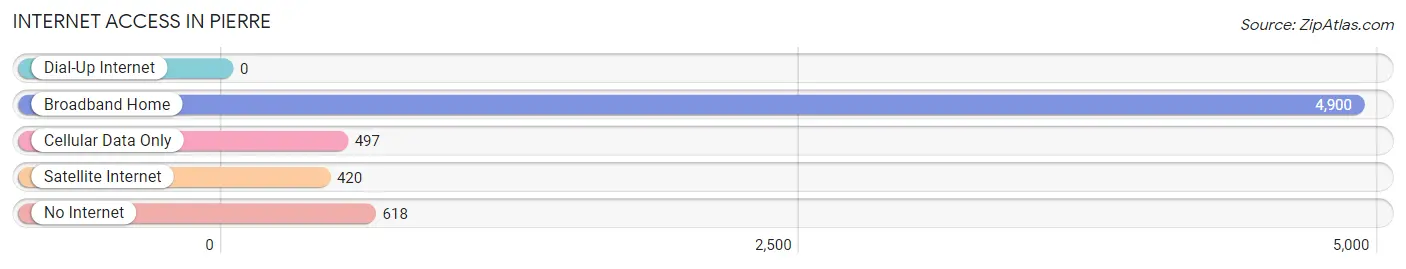
| Internet Type | # Households | % Households |
| Dial-Up Internet | 0 | 0.0% |
| Broadband Home | 4,900 | 80.4% |
| Cellular Data Only | 497 | 8.2% |
| Satellite Internet | 420 | 6.9% |
| No Internet | 618 | 10.1% |
| Total | 6,092 | 100.0% |
Pierre Summary
Pierre, South Dakota is the state capital of South Dakota and the county seat of Hughes County. It is located on the Missouri River in the central part of the state. The city has a population of 13,876 as of the 2010 census, making it the second-smallest state capital in the United States.
History
The area that is now Pierre was first inhabited by the Arikara Native American tribe. The first Europeans to explore the area were French fur traders, who arrived in the late 1700s. The city of Pierre was founded in 1880 by fur trader Pierre Chouteau, Jr. and named after him. The city was incorporated in 1883 and became the state capital in 1889.
Geography
Pierre is located in central South Dakota, on the east bank of the Missouri River. It is situated in the rolling hills of the Great Plains, with an elevation of 1,890 feet (576 m). The city covers an area of 8.2 square miles (21.2 km2).
Climate
Pierre has a humid continental climate, with cold, dry winters and hot, humid summers. The average annual temperature is 48.3°F (9.1°C), and the average annual precipitation is 19.3 inches (490 mm).
Economy
The economy of Pierre is largely based on government and tourism. The state government is the largest employer in the city, followed by the tourism industry. Other major industries include agriculture, manufacturing, and retail.
Demographics
As of the 2010 census, Pierre had a population of 13,876. The racial makeup of the city was 91.2% White, 0.3% African American, 5.3% Native American, 0.5% Asian, 0.1% Pacific Islander, 0.7% from other races, and 1.9% from two or more races. Hispanic or Latino of any race were 2.2% of the population.
The median income for a household in Pierre was $45,945, and the median income for a family was $54,945. The per capita income for the city was $22,945. About 8.2% of families and 11.2% of the population were below the poverty line, including 14.2% of those under age 18 and 8.2% of those age 65 or over.
Common Questions
What is Per Capita Income in Pierre?
Per Capita income in Pierre is $37,285.
What is the Median Family Income in Pierre?
Median Family Income in Pierre is $89,803.
What is the Median Household income in Pierre?
Median Household Income in Pierre is $80,473.
What is Income or Wage Gap in Pierre?
Income or Wage Gap in Pierre is 22.0%.
Women in Pierre earn 78.0 cents for every dollar earned by a man.
What is Inequality or Gini Index in Pierre?
Inequality or Gini Index in Pierre is 0.39.
What is the Total Population of Pierre?
Total Population of Pierre is 14,105.
What is the Total Male Population of Pierre?
Total Male Population of Pierre is 6,751.
What is the Total Female Population of Pierre?
Total Female Population of Pierre is 7,354.
What is the Ratio of Males per 100 Females in Pierre?
There are 91.80 Males per 100 Females in Pierre.
What is the Ratio of Females per 100 Males in Pierre?
There are 108.93 Females per 100 Males in Pierre.
What is the Median Population Age in Pierre?
Median Population Age in Pierre is 39.6 Years.
What is the Average Family Size in Pierre
Average Family Size in Pierre is 2.6 People.
What is the Average Household Size in Pierre
Average Household Size in Pierre is 2.1 People.
How Large is the Labor Force in Pierre?
There are 7,350 People in the Labor Forcein in Pierre.
What is the Percentage of People in the Labor Force in Pierre?
65.0% of People are in the Labor Force in Pierre.
What is the Unemployment Rate in Pierre?
Unemployment Rate in Pierre is 0.5%.