Rosebud, SD Map & Demographics
Rosebud Map
Rosebud Overview
$10,635
PER CAPITA INCOME
$39,438
AVG FAMILY INCOME
$47,813
AVG HOUSEHOLD INCOME
0.44
INEQUALITY / GINI INDEX
2,155
TOTAL POPULATION
1,039
MALE POPULATION
1,116
FEMALE POPULATION
93.10
MALES / 100 FEMALES
107.41
FEMALES / 100 MALES
23.3
MEDIAN AGE
7.0
AVG FAMILY SIZE
5.1
AVG HOUSEHOLD SIZE
684
LABOR FORCE [ PEOPLE ]
48.8%
PERCENT IN LABOR FORCE
19.8%
UNEMPLOYMENT RATE
Rosebud Zip Codes
Rosebud Area Codes
Income in Rosebud
Income Overview in Rosebud
Per Capita Income in Rosebud is $10,635, while median incomes of families and households are $39,438 and $47,813 respectively.
| Characteristic | Number | Measure |
| Per Capita Income | 2,155 | $10,635 |
| Median Family Income | 243 | $39,438 |
| Mean Family Income | 243 | $45,590 |
| Median Household Income | 394 | $47,813 |
| Mean Household Income | 394 | $50,907 |
| Income Deficit | 243 | $0 |
| Wage / Income Gap (%) | 2,155 | 0.00% |
| Wage / Income Gap ($) | 2,155 | 100.00¢ per $1 |
| Gini / Inequality Index | 2,155 | 0.44 |
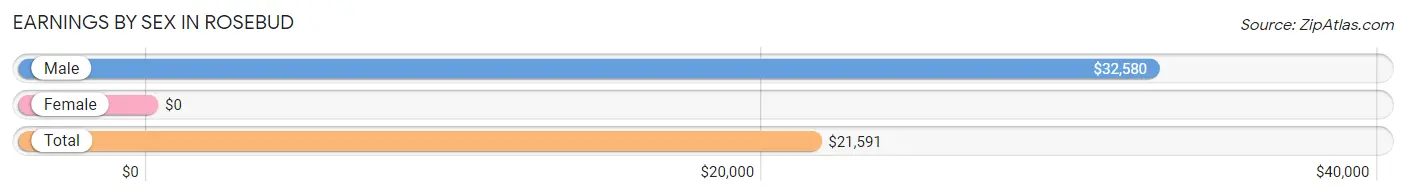
Earnings by Sex in Rosebud
| Sex | Number | Average Earnings |
| Male | 269 (38.4%) | $32,580 |
| Female | 431 (61.6%) | $0 |
| Total | 700 (100.0%) | $21,591 |
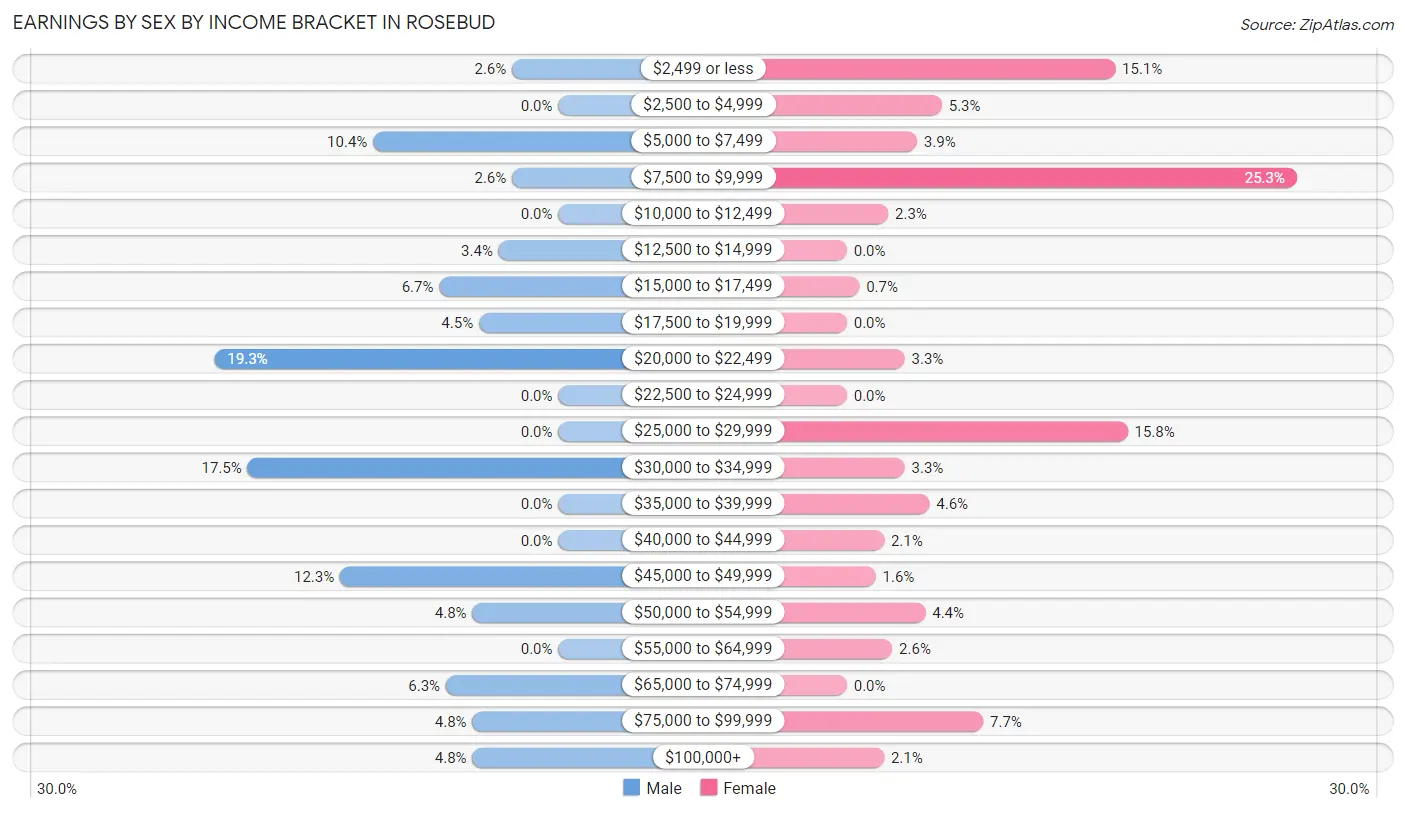
Earnings by Sex by Income Bracket in Rosebud
The most common earnings brackets in Rosebud are $20,000 to $22,499 for men (52 | 19.3%) and $7,500 to $9,999 for women (109 | 25.3%).
| Income | Male | Female |
| $2,499 or less | 7 (2.6%) | 65 (15.1%) |
| $2,500 to $4,999 | 0 (0.0%) | 23 (5.3%) |
| $5,000 to $7,499 | 28 (10.4%) | 17 (3.9%) |
| $7,500 to $9,999 | 7 (2.6%) | 109 (25.3%) |
| $10,000 to $12,499 | 0 (0.0%) | 10 (2.3%) |
| $12,500 to $14,999 | 9 (3.4%) | 0 (0.0%) |
| $15,000 to $17,499 | 18 (6.7%) | 3 (0.7%) |
| $17,500 to $19,999 | 12 (4.5%) | 0 (0.0%) |
| $20,000 to $22,499 | 52 (19.3%) | 14 (3.3%) |
| $22,500 to $24,999 | 0 (0.0%) | 0 (0.0%) |
| $25,000 to $29,999 | 0 (0.0%) | 68 (15.8%) |
| $30,000 to $34,999 | 47 (17.5%) | 14 (3.3%) |
| $35,000 to $39,999 | 0 (0.0%) | 20 (4.6%) |
| $40,000 to $44,999 | 0 (0.0%) | 9 (2.1%) |
| $45,000 to $49,999 | 33 (12.3%) | 7 (1.6%) |
| $50,000 to $54,999 | 13 (4.8%) | 19 (4.4%) |
| $55,000 to $64,999 | 0 (0.0%) | 11 (2.5%) |
| $65,000 to $74,999 | 17 (6.3%) | 0 (0.0%) |
| $75,000 to $99,999 | 13 (4.8%) | 33 (7.7%) |
| $100,000+ | 13 (4.8%) | 9 (2.1%) |
| Total | 269 (100.0%) | 431 (100.0%) |
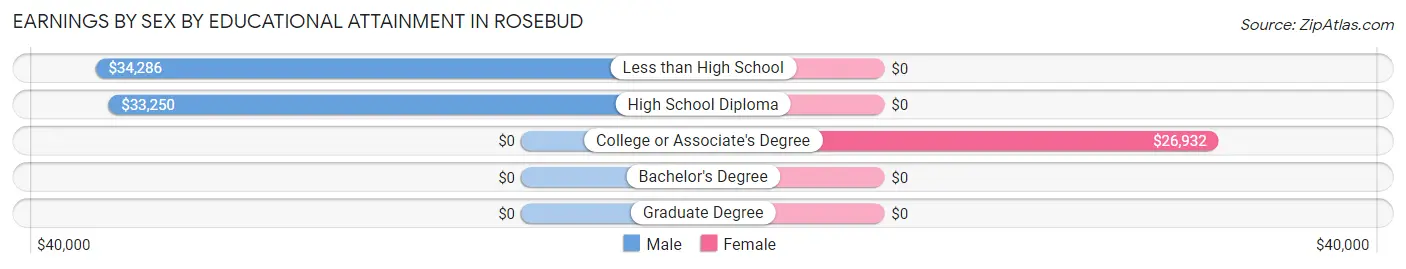
Earnings by Sex by Educational Attainment in Rosebud
Average earnings in Rosebud are $33,590 for men and $26,379 for women, a difference of 21.5%. Men with an educational attainment of less than high school enjoy the highest average annual earnings of $34,286, while those with high school diploma education earn the least with $33,250. Women with an educational attainment of college or associate's degree earn the most with the average annual earnings of $26,932, while those with college or associate's degree education have the smallest earnings of $26,932.
| Educational Attainment | Male Income | Female Income |
| Less than High School | $34,286 | $0 |
| High School Diploma | $33,250 | $0 |
| College or Associate's Degree | - | - |
| Bachelor's Degree | - | - |
| Graduate Degree | - | - |
| Total | $33,590 | $26,379 |
Family Income in Rosebud
Family Income Brackets in Rosebud
According to the Rosebud family income data, there are 47 families falling into the $35,000 to $49,999 income range, which is the most common income bracket and makes up 19.3% of all families.
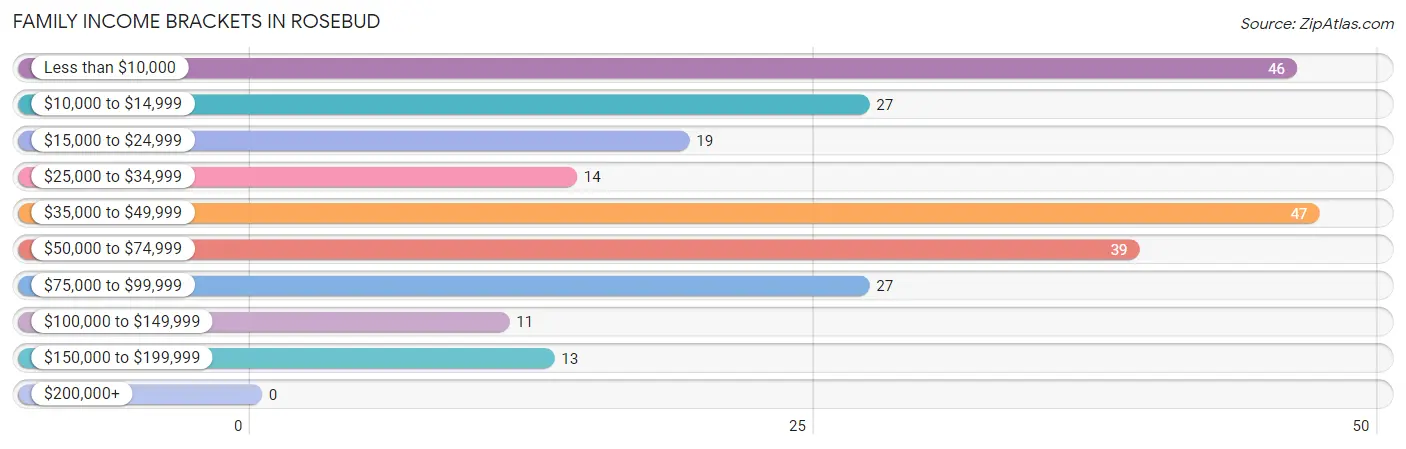
| Income Bracket | # Families | % Families |
| Less than $10,000 | 46 | 18.9% |
| $10,000 to $14,999 | 27 | 11.1% |
| $15,000 to $24,999 | 19 | 7.8% |
| $25,000 to $34,999 | 14 | 5.8% |
| $35,000 to $49,999 | 47 | 19.3% |
| $50,000 to $74,999 | 39 | 16.0% |
| $75,000 to $99,999 | 27 | 11.1% |
| $100,000 to $149,999 | 11 | 4.5% |
| $150,000 to $199,999 | 13 | 5.3% |
| $200,000+ | 0 | 0.0% |
Family Income by Famaliy Size in Rosebud
4-person families (41 | 16.9%) account for the highest median family income in Rosebud with $52,596 per family, while 4-person families (41 | 16.9%) have the highest median income of $13,149 per family member.
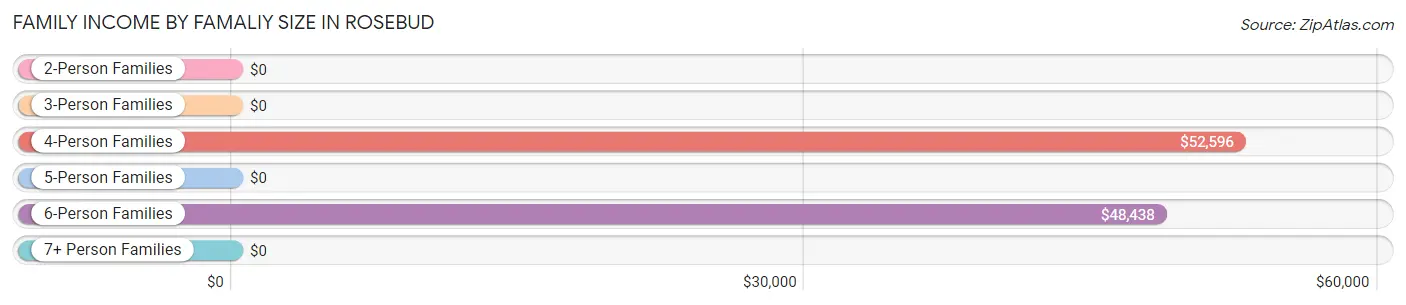
| Income Bracket | # Families | Median Income |
| 2-Person Families | 28 (11.5%) | $0 |
| 3-Person Families | 50 (20.6%) | $0 |
| 4-Person Families | 41 (16.9%) | $52,596 |
| 5-Person Families | 48 (19.8%) | $0 |
| 6-Person Families | 38 (15.6%) | $48,438 |
| 7+ Person Families | 38 (15.6%) | $0 |
| Total | 243 (100.0%) | $39,438 |
Family Income by Number of Earners in Rosebud
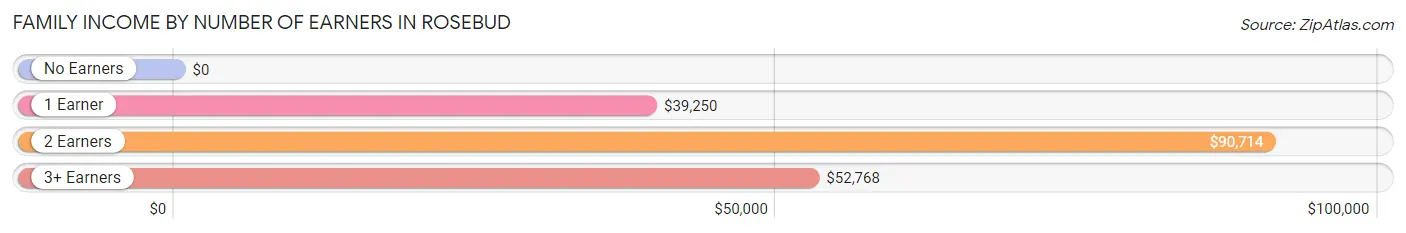
| Number of Earners | # Families | Median Income |
| No Earners | 82 (33.7%) | $0 |
| 1 Earner | 48 (19.8%) | $39,250 |
| 2 Earners | 48 (19.8%) | $90,714 |
| 3+ Earners | 65 (26.8%) | $52,768 |
| Total | 243 (100.0%) | $39,438 |
Household Income in Rosebud
Household Income Brackets in Rosebud
With 73 households falling in the category, the $75,000 to $99,999 income range is the most frequent in Rosebud, accounting for 18.5% of all households.
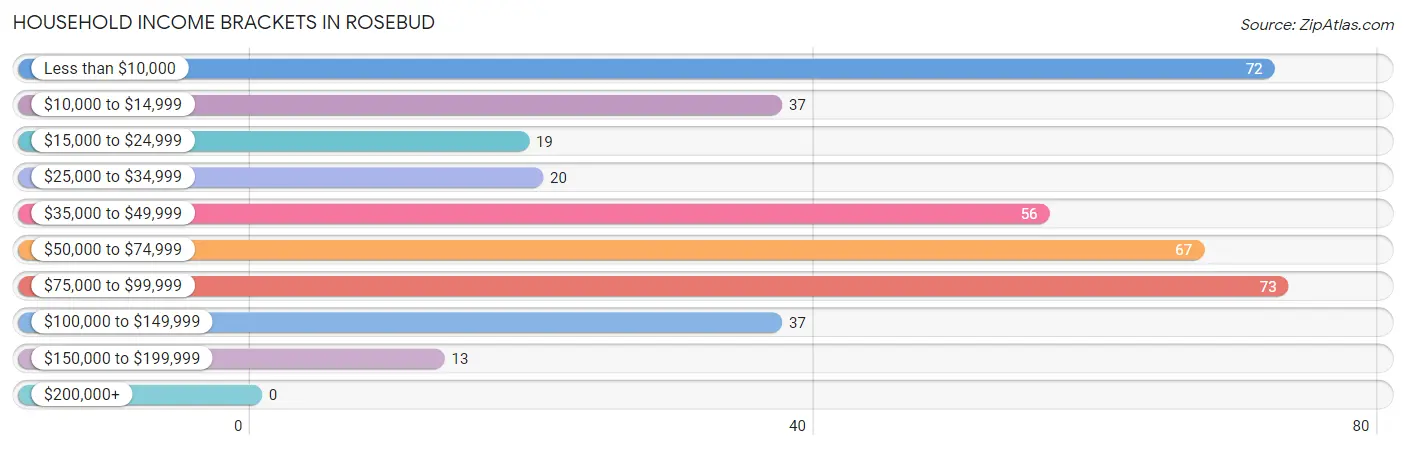
| Income Bracket | # Households | % Households |
| Less than $10,000 | 72 | 18.3% |
| $10,000 to $14,999 | 37 | 9.4% |
| $15,000 to $24,999 | 19 | 4.8% |
| $25,000 to $34,999 | 20 | 5.1% |
| $35,000 to $49,999 | 56 | 14.2% |
| $50,000 to $74,999 | 67 | 17.0% |
| $75,000 to $99,999 | 73 | 18.5% |
| $100,000 to $149,999 | 37 | 9.4% |
| $150,000 to $199,999 | 13 | 3.3% |
| $200,000+ | 0 | 0.0% |
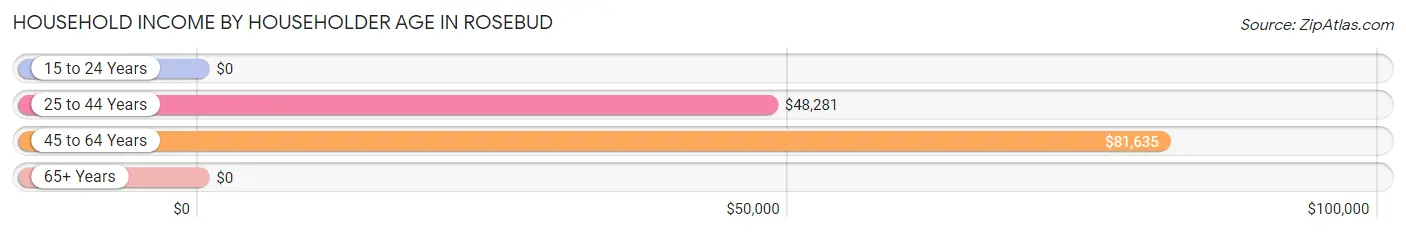
Household Income by Householder Age in Rosebud
The median household income in Rosebud is $47,813, with the highest median household income of $81,635 found in the 45 to 64 years age bracket for the primary householder. A total of 119 households (30.2%) fall into this category. Meanwhile, the 15 to 24 years age bracket for the primary householder has the lowest median household income of $0, with 20 households (5.1%) in this group.
| Income Bracket | # Households | Median Income |
| 15 to 24 Years | 20 (5.1%) | $0 |
| 25 to 44 Years | 201 (51.0%) | $48,281 |
| 45 to 64 Years | 119 (30.2%) | $81,635 |
| 65+ Years | 54 (13.7%) | $0 |
| Total | 394 (100.0%) | $47,813 |
Poverty in Rosebud
Income Below Poverty by Sex and Age in Rosebud
With 57.0% poverty level for males and 57.3% for females among the residents of Rosebud, 16 and 17 year old males and 15 year old females are the most vulnerable to poverty, with 14 males (100.0%) and 14 females (100.0%) in their respective age groups living below the poverty level.
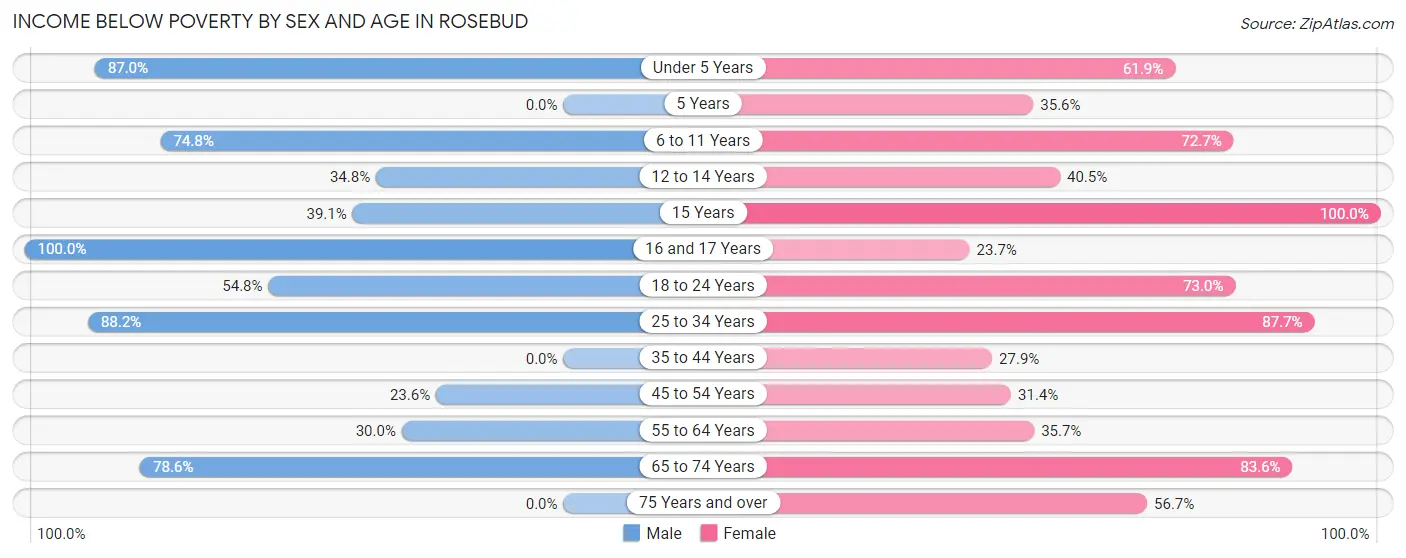
| Age Bracket | Male | Female |
| Under 5 Years | 140 (87.0%) | 73 (61.9%) |
| 5 Years | 0 (0.0%) | 16 (35.6%) |
| 6 to 11 Years | 80 (74.8%) | 48 (72.7%) |
| 12 to 14 Years | 24 (34.8%) | 32 (40.5%) |
| 15 Years | 27 (39.1%) | 14 (100.0%) |
| 16 and 17 Years | 14 (100.0%) | 14 (23.7%) |
| 18 to 24 Years | 92 (54.8%) | 138 (73.0%) |
| 25 to 34 Years | 90 (88.2%) | 150 (87.7%) |
| 35 to 44 Years | 0 (0.0%) | 48 (27.9%) |
| 45 to 54 Years | 13 (23.6%) | 11 (31.4%) |
| 55 to 64 Years | 12 (30.0%) | 25 (35.7%) |
| 65 to 74 Years | 22 (78.6%) | 46 (83.6%) |
| 75 Years and over | 0 (0.0%) | 17 (56.7%) |
| Total | 514 (57.0%) | 632 (57.3%) |
Income Above Poverty by Sex and Age in Rosebud
According to the poverty statistics in Rosebud, males aged 35 to 44 years and females aged 16 and 17 years are the age groups that are most secure financially, with 100.0% of males and 76.3% of females in these age groups living above the poverty line.
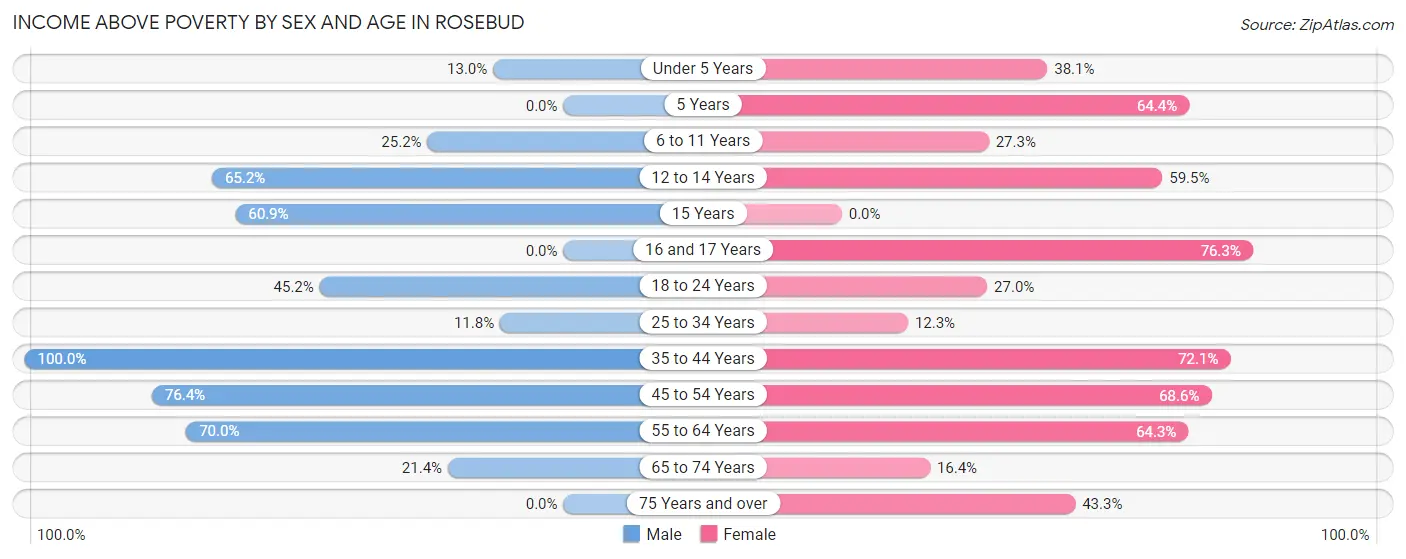
| Age Bracket | Male | Female |
| Under 5 Years | 21 (13.0%) | 45 (38.1%) |
| 5 Years | 0 (0.0%) | 29 (64.4%) |
| 6 to 11 Years | 27 (25.2%) | 18 (27.3%) |
| 12 to 14 Years | 45 (65.2%) | 47 (59.5%) |
| 15 Years | 42 (60.9%) | 0 (0.0%) |
| 16 and 17 Years | 0 (0.0%) | 45 (76.3%) |
| 18 to 24 Years | 76 (45.2%) | 51 (27.0%) |
| 25 to 34 Years | 12 (11.8%) | 21 (12.3%) |
| 35 to 44 Years | 89 (100.0%) | 124 (72.1%) |
| 45 to 54 Years | 42 (76.4%) | 24 (68.6%) |
| 55 to 64 Years | 28 (70.0%) | 45 (64.3%) |
| 65 to 74 Years | 6 (21.4%) | 9 (16.4%) |
| 75 Years and over | 0 (0.0%) | 13 (43.3%) |
| Total | 388 (43.0%) | 471 (42.7%) |
Income Below Poverty Among Married-Couple Families in Rosebud
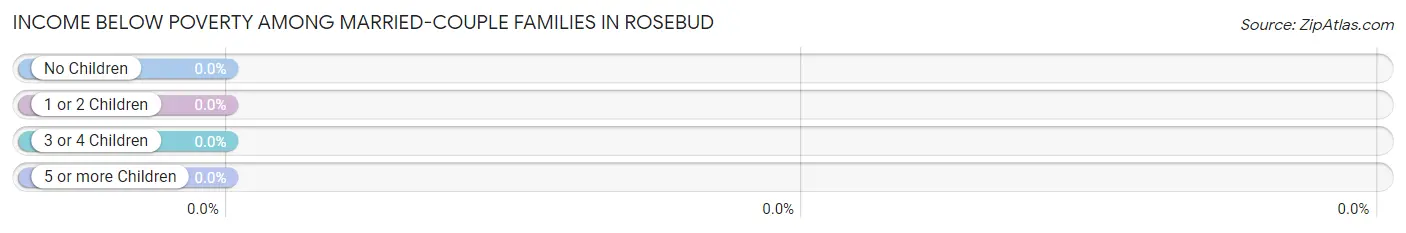
| Children | Above Poverty | Below Poverty |
| No Children | 0 (0.0%) | 0 (0.0%) |
| 1 or 2 Children | 46 (100.0%) | 0 (0.0%) |
| 3 or 4 Children | 28 (100.0%) | 0 (0.0%) |
| 5 or more Children | 0 (0.0%) | 0 (0.0%) |
| Total | 74 (100.0%) | 0 (0.0%) |
Income Below Poverty Among Single-Parent Households in Rosebud
According to the poverty data in Rosebud, 64.7% or 22 single-father households and 65.9% or 89 single-mother households are living below the poverty line. Among single-father households, those with 1 or 2 children have the highest poverty rate, with 22 households (64.7%) experiencing poverty. Likewise, among single-mother households, those with 5 or more children have the highest poverty rate, with 27 households (100.0%) falling below the poverty line.
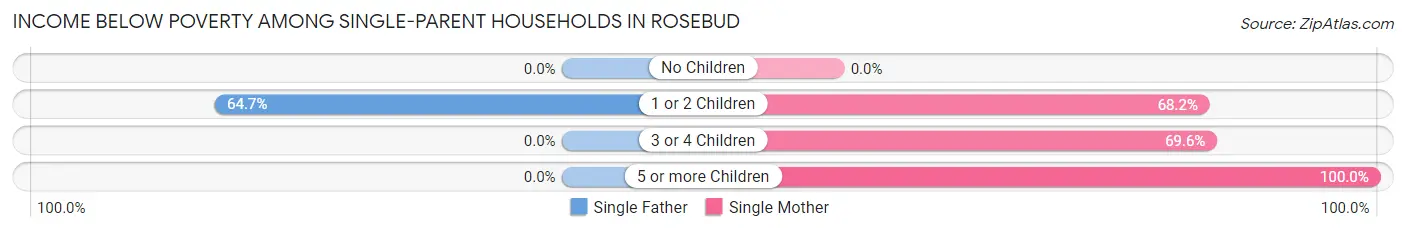
| Children | Single Father | Single Mother |
| No Children | 0 (0.0%) | 0 (0.0%) |
| 1 or 2 Children | 22 (64.7%) | 30 (68.2%) |
| 3 or 4 Children | 0 (0.0%) | 32 (69.6%) |
| 5 or more Children | 0 (0.0%) | 27 (100.0%) |
| Total | 22 (64.7%) | 89 (65.9%) |
Income Below Poverty Among Married-Couple vs Single-Parent Households in Rosebud
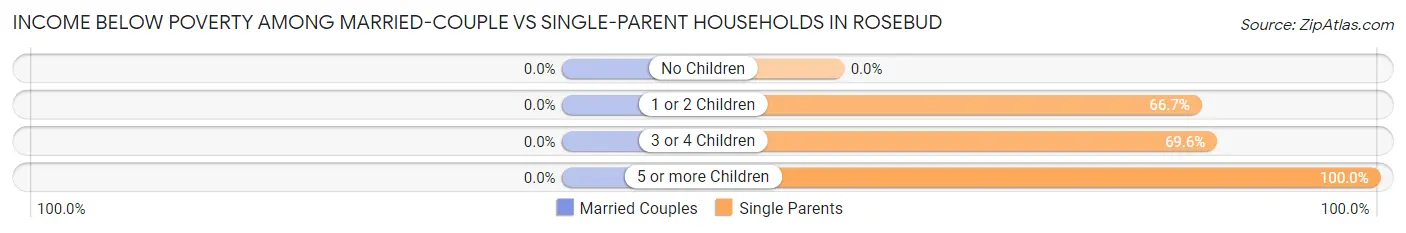
| Children | Married-Couple Families | Single-Parent Households |
| No Children | 0 (0.0%) | 0 (0.0%) |
| 1 or 2 Children | 0 (0.0%) | 52 (66.7%) |
| 3 or 4 Children | 0 (0.0%) | 32 (69.6%) |
| 5 or more Children | 0 (0.0%) | 27 (100.0%) |
| Total | 0 (0.0%) | 111 (65.7%) |
Race in Rosebud
The most populous races in Rosebud are Native / Alaskan (1,942 | 90.1%), Hispanic or Latino (223 | 10.3%), and White / Caucasian (157 | 7.3%).
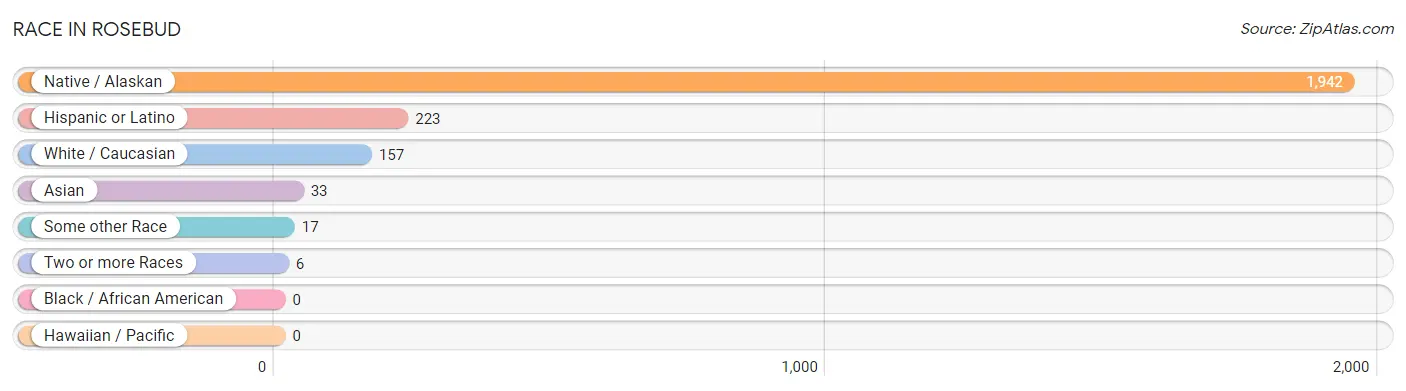
| Race | # Population | % Population |
| Asian | 33 | 1.5% |
| Black / African American | 0 | 0.0% |
| Hawaiian / Pacific | 0 | 0.0% |
| Hispanic or Latino | 223 | 10.3% |
| Native / Alaskan | 1,942 | 90.1% |
| White / Caucasian | 157 | 7.3% |
| Two or more Races | 6 | 0.3% |
| Some other Race | 17 | 0.8% |
| Total | 2,155 | 100.0% |
Ancestry in Rosebud
The most populous ancestries reported in Rosebud are Sioux (1,777 | 82.5%), Mexican (100 | 4.6%), German (57 | 2.6%), Irish (37 | 1.7%), and Indian (Asian) (33 | 1.5%), together accounting for 93.0% of all Rosebud residents.
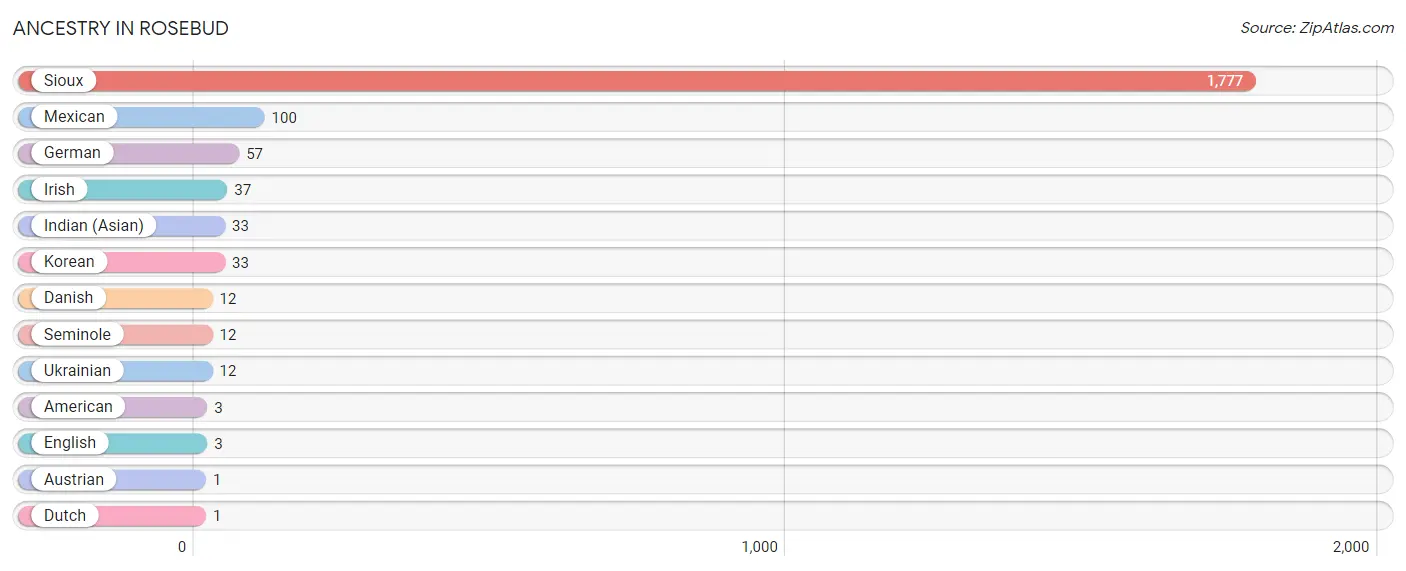
| Ancestry | # Population | % Population |
| American | 3 | 0.1% |
| Austrian | 1 | 0.1% |
| Danish | 12 | 0.6% |
| Dutch | 1 | 0.1% |
| English | 3 | 0.1% |
| German | 57 | 2.6% |
| Indian (Asian) | 33 | 1.5% |
| Irish | 37 | 1.7% |
| Korean | 33 | 1.5% |
| Mexican | 100 | 4.6% |
| Seminole | 12 | 0.6% |
| Sioux | 1,777 | 82.5% |
| Ukrainian | 12 | 0.6% | View All 13 Rows |
Immigrants in Rosebud
The most numerous immigrant groups reported in Rosebud came from Asia (33 | 1.5%), Philippines (33 | 1.5%), South Eastern Asia (33 | 1.5%), Central America (15 | 0.7%), and Latin America (15 | 0.7%), together accounting for 6.0% of all Rosebud residents.
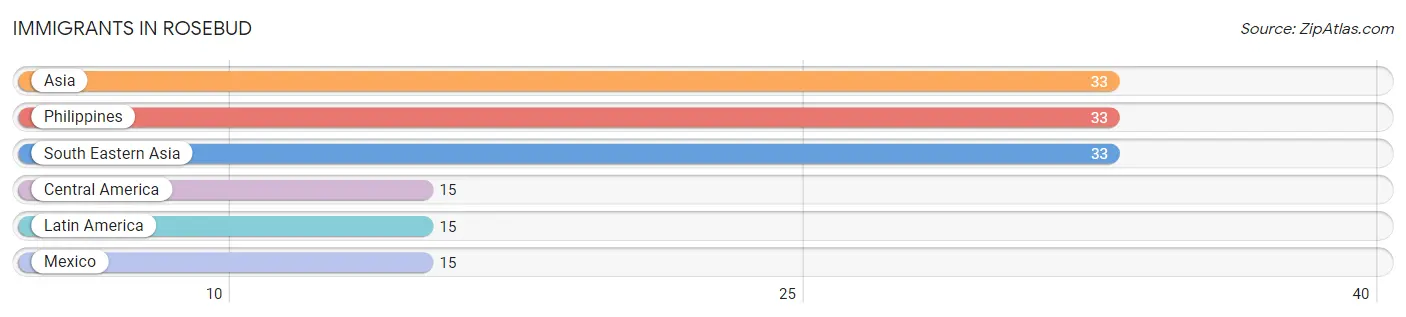
| Immigration Origin | # Population | % Population |
| Asia | 33 | 1.5% |
| Central America | 15 | 0.7% |
| Latin America | 15 | 0.7% |
| Mexico | 15 | 0.7% |
| Philippines | 33 | 1.5% |
| South Eastern Asia | 33 | 1.5% | View All 6 Rows |
Sex and Age in Rosebud
Sex and Age in Rosebud
The most populous age groups in Rosebud are Under 5 Years (187 | 18.0%) for men and 15 to 19 Years (138 | 12.4%) for women.
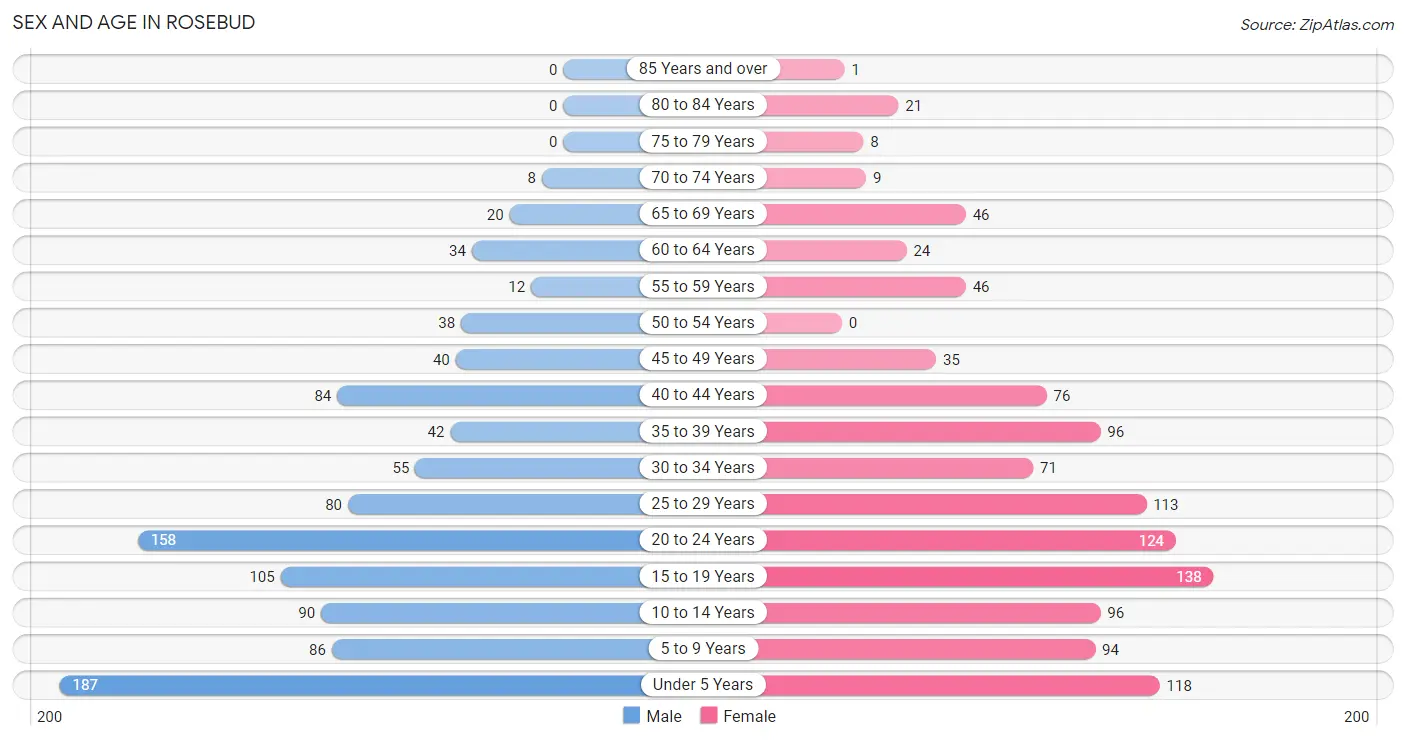
| Age Bracket | Male | Female |
| Under 5 Years | 187 (18.0%) | 118 (10.6%) |
| 5 to 9 Years | 86 (8.3%) | 94 (8.4%) |
| 10 to 14 Years | 90 (8.7%) | 96 (8.6%) |
| 15 to 19 Years | 105 (10.1%) | 138 (12.4%) |
| 20 to 24 Years | 158 (15.2%) | 124 (11.1%) |
| 25 to 29 Years | 80 (7.7%) | 113 (10.1%) |
| 30 to 34 Years | 55 (5.3%) | 71 (6.4%) |
| 35 to 39 Years | 42 (4.0%) | 96 (8.6%) |
| 40 to 44 Years | 84 (8.1%) | 76 (6.8%) |
| 45 to 49 Years | 40 (3.8%) | 35 (3.1%) |
| 50 to 54 Years | 38 (3.7%) | 0 (0.0%) |
| 55 to 59 Years | 12 (1.1%) | 46 (4.1%) |
| 60 to 64 Years | 34 (3.3%) | 24 (2.1%) |
| 65 to 69 Years | 20 (1.9%) | 46 (4.1%) |
| 70 to 74 Years | 8 (0.8%) | 9 (0.8%) |
| 75 to 79 Years | 0 (0.0%) | 8 (0.7%) |
| 80 to 84 Years | 0 (0.0%) | 21 (1.9%) |
| 85 Years and over | 0 (0.0%) | 1 (0.1%) |
| Total | 1,039 (100.0%) | 1,116 (100.0%) |
Families and Households in Rosebud
Median Family Size in Rosebud
The median family size in Rosebud is 7.00 persons per family, with single female/mother families (135 | 55.6%) accounting for the largest median family size of 7.92 persons per family. On the other hand, single male/father families (34 | 14.0%) represent the smallest median family size with 4.29 persons per family.
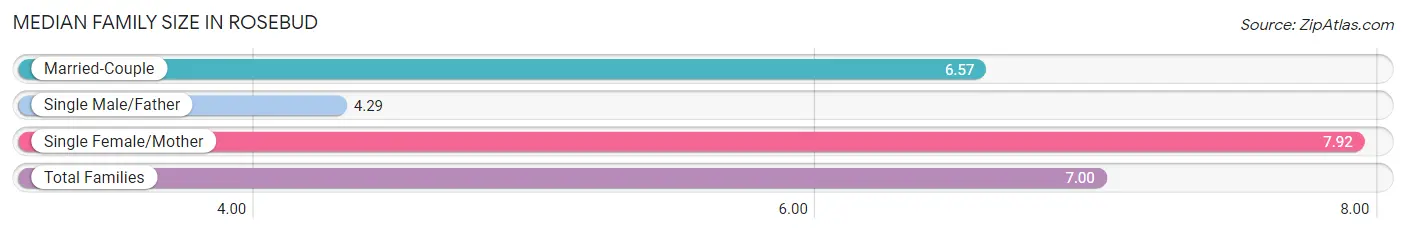
| Family Type | # Families | Family Size |
| Married-Couple | 74 (30.4%) | 6.57 |
| Single Male/Father | 34 (14.0%) | 4.29 |
| Single Female/Mother | 135 (55.6%) | 7.92 |
| Total Families | 243 (100.0%) | 7.00 |
Median Household Size in Rosebud
The median household size in Rosebud is 5.14 persons per household, with single female/mother households (135 | 34.3%) accounting for the largest median household size of 8.31 persons per household. non-family households (151 | 38.3%) represent the smallest median household size with 1.70 persons per household.
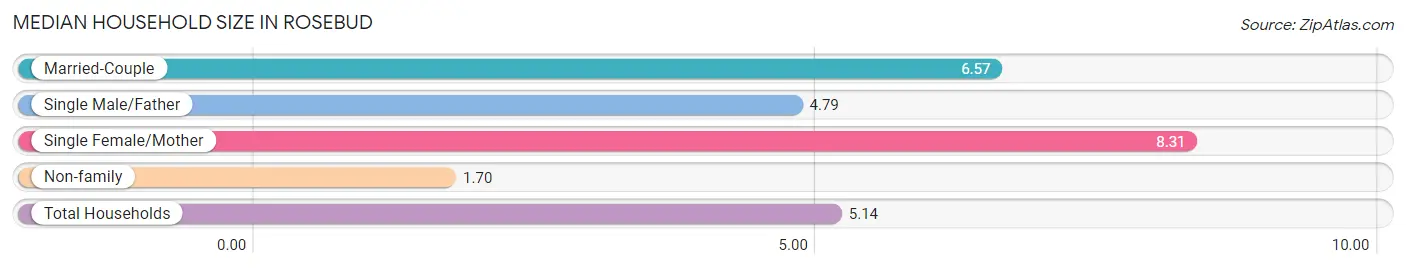
| Household Type | # Households | Household Size |
| Married-Couple | 74 (18.8%) | 6.57 |
| Single Male/Father | 34 (8.6%) | 4.79 |
| Single Female/Mother | 135 (34.3%) | 8.31 |
| Non-family | 151 (38.3%) | 1.70 |
| Total Households | 394 (100.0%) | 5.14 |
Household Size by Marriage Status in Rosebud
Out of a total of 394 households in Rosebud, 243 (61.7%) are family households, while 151 (38.3%) are nonfamily households. The most numerous type of family households are 5-person households, comprising 60, and the most common type of nonfamily households are 1-person households, comprising 110.
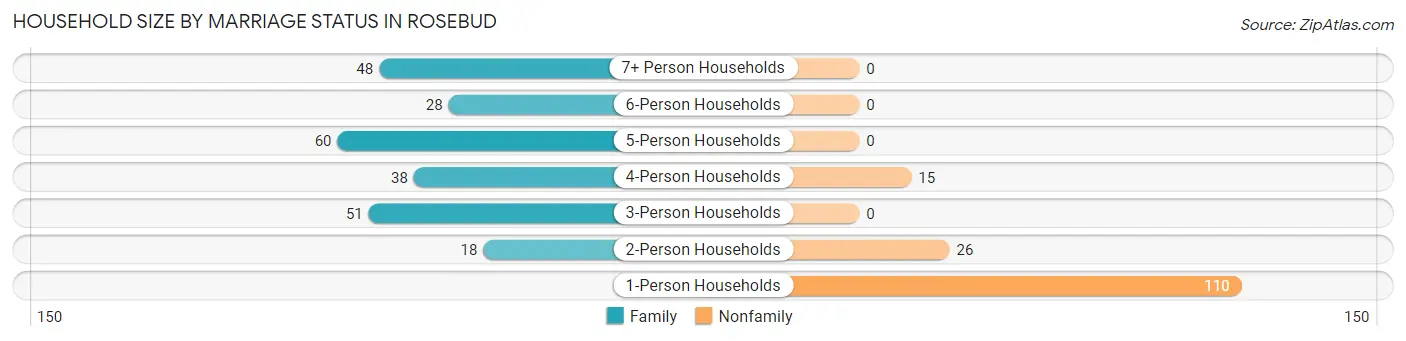
| Household Size | Family Households | Nonfamily Households |
| 1-Person Households | - | 110 (27.9%) |
| 2-Person Households | 18 (4.6%) | 26 (6.6%) |
| 3-Person Households | 51 (12.9%) | 0 (0.0%) |
| 4-Person Households | 38 (9.6%) | 15 (3.8%) |
| 5-Person Households | 60 (15.2%) | 0 (0.0%) |
| 6-Person Households | 28 (7.1%) | 0 (0.0%) |
| 7+ Person Households | 48 (12.2%) | 0 (0.0%) |
| Total | 243 (61.7%) | 151 (38.3%) |
Female Fertility in Rosebud
Fertility by Age in Rosebud
Average fertility rate in Rosebud is 54.0 births per 1,000 women. Women in the age bracket of 20 to 34 years have the highest fertility rate with 114.0 births per 1,000 women. Women in the age bracket of 20 to 34 years acount for 100.0% of all women with births.
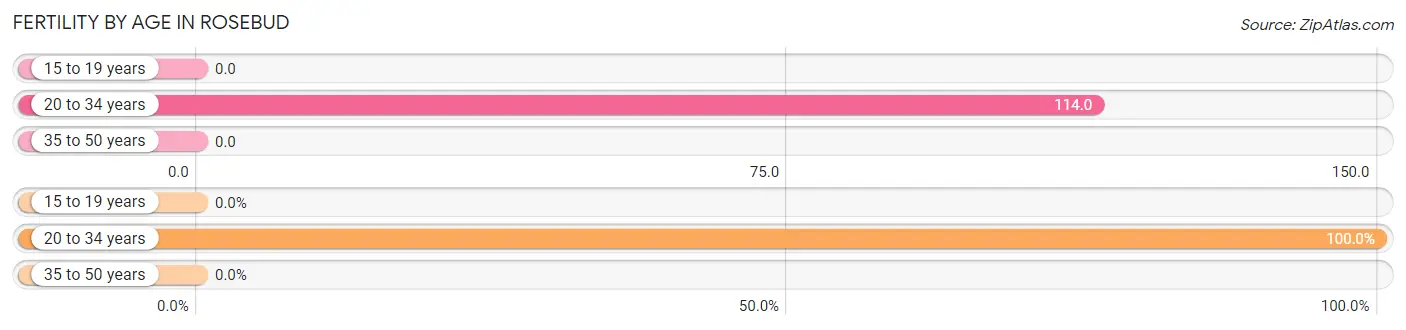
| Age Bracket | Women with Births | Births / 1,000 Women |
| 15 to 19 years | 0 (0.0%) | 0.0 |
| 20 to 34 years | 35 (100.0%) | 114.0 |
| 35 to 50 years | 0 (0.0%) | 0.0 |
| Total | 35 (100.0%) | 54.0 |
Fertility by Age by Marriage Status in Rosebud
77.1% of women with births (35) in Rosebud are married. The highest percentage of unmarried women with births falls into 20 to 34 years age bracket with 22.9% of them unmarried at the time of birth, while the lowest percentage of unmarried women with births belong to 20 to 34 years age bracket with 22.9% of them unmarried.
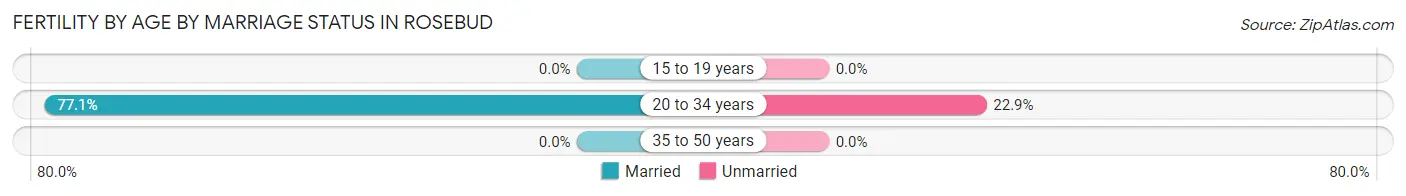
| Age Bracket | Married | Unmarried |
| 15 to 19 years | 0 (0.0%) | 0 (0.0%) |
| 20 to 34 years | 27 (77.1%) | 8 (22.9%) |
| 35 to 50 years | 0 (0.0%) | 0 (0.0%) |
| Total | 27 (77.1%) | 8 (22.9%) |
Fertility by Education in Rosebud
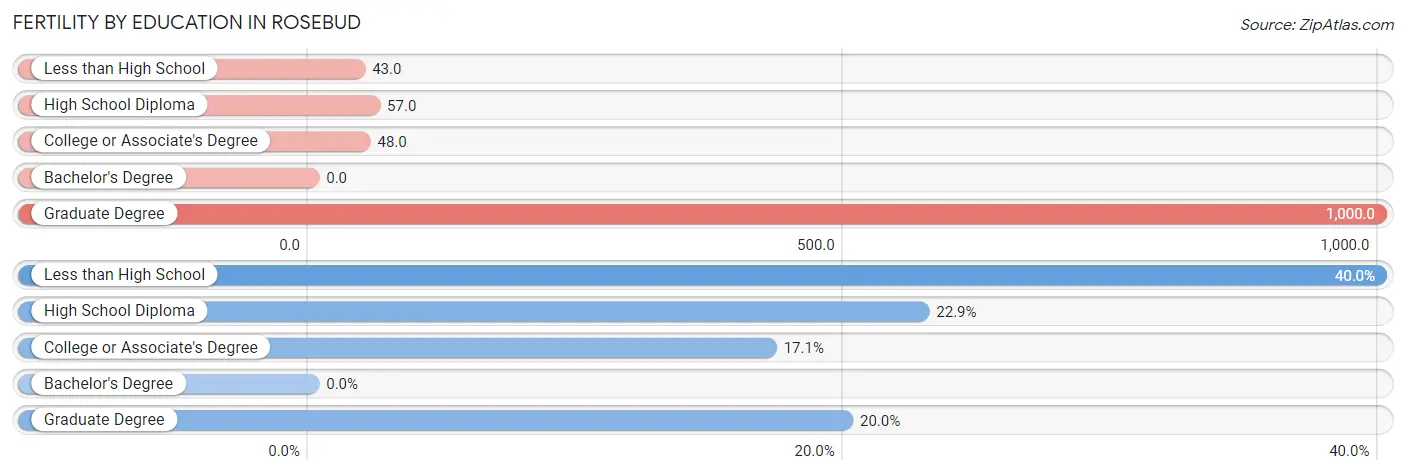
| Educational Attainment | Women with Births | Births / 1,000 Women |
| Less than High School | 14 (40.0%) | 43.0 |
| High School Diploma | 8 (22.9%) | 57.0 |
| College or Associate's Degree | 6 (17.1%) | 48.0 |
| Bachelor's Degree | 0 (0.0%) | 0.0 |
| Graduate Degree | 7 (20.0%) | 1,000.0 |
| Total | 35 (100.0%) | 54.0 |
Fertility by Education by Marriage Status in Rosebud
22.9% of women with births in Rosebud are unmarried. Women with the educational attainment of less than high school are most likely to be married with 100.0% of them married at childbirth, while women with the educational attainment of high school diploma are least likely to be married with 100.0% of them unmarried at childbirth.
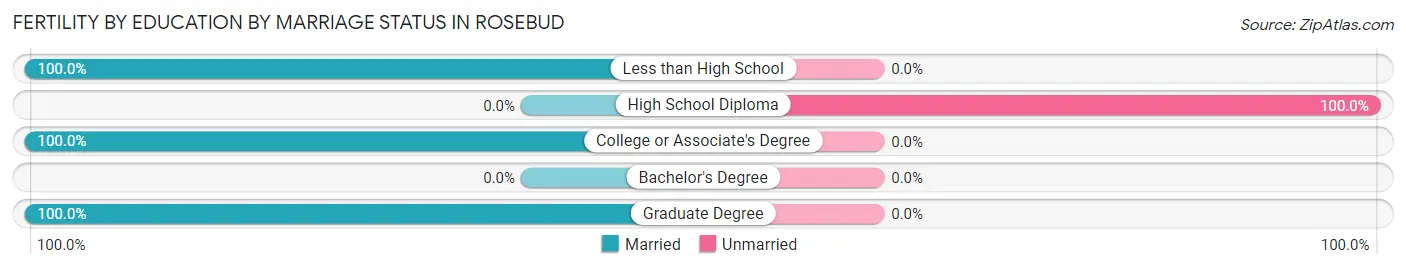
| Educational Attainment | Married | Unmarried |
| Less than High School | 14 (100.0%) | 0 (0.0%) |
| High School Diploma | 0 (0.0%) | 8 (100.0%) |
| College or Associate's Degree | 6 (100.0%) | 0 (0.0%) |
| Bachelor's Degree | 0 (0.0%) | 0 (0.0%) |
| Graduate Degree | 7 (100.0%) | 0 (0.0%) |
| Total | 27 (77.1%) | 8 (22.9%) |
Employment Characteristics in Rosebud
Employment by Class of Employer in Rosebud
Among the 548 employed individuals in Rosebud, private company employees (240 | 43.8%), federal government employees (110 | 20.1%), and local government employees (92 | 16.8%) make up the most common classes of employment.
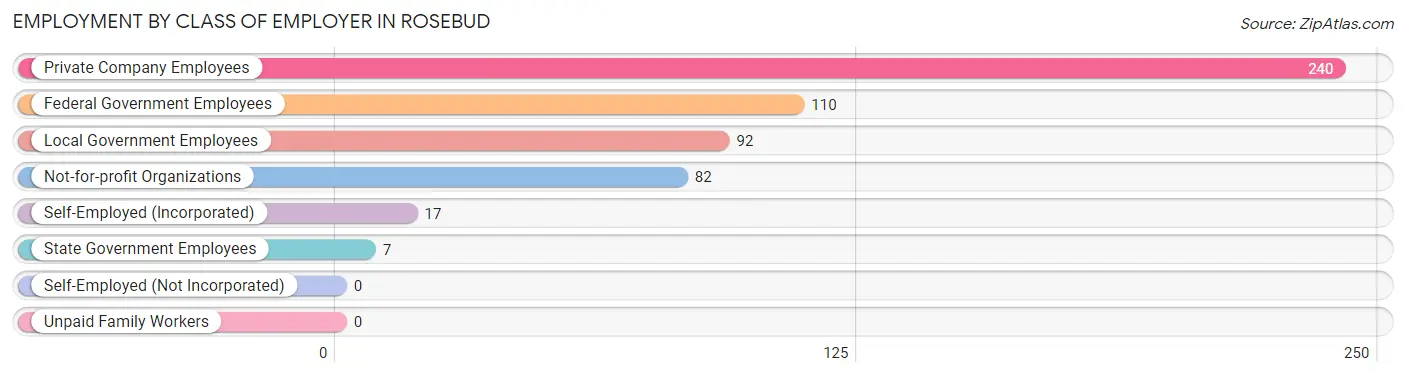
| Employer Class | # Employees | % Employees |
| Private Company Employees | 240 | 43.8% |
| Self-Employed (Incorporated) | 17 | 3.1% |
| Self-Employed (Not Incorporated) | 0 | 0.0% |
| Not-for-profit Organizations | 82 | 15.0% |
| Local Government Employees | 92 | 16.8% |
| State Government Employees | 7 | 1.3% |
| Federal Government Employees | 110 | 20.1% |
| Unpaid Family Workers | 0 | 0.0% |
| Total | 548 | 100.0% |
Employment Status by Age in Rosebud
According to the labor force statistics for Rosebud, out of the total population over 16 years of age (1,401), 48.8% or 684 individuals are in the labor force, with 19.8% or 135 of them unemployed. The age group with the highest labor force participation rate is 60 to 64 years, with 75.9% or 44 individuals in the labor force. Within the labor force, the 25 to 29 years age range has the highest percentage of unemployed individuals, with 82.9% or 58 of them being unemployed.
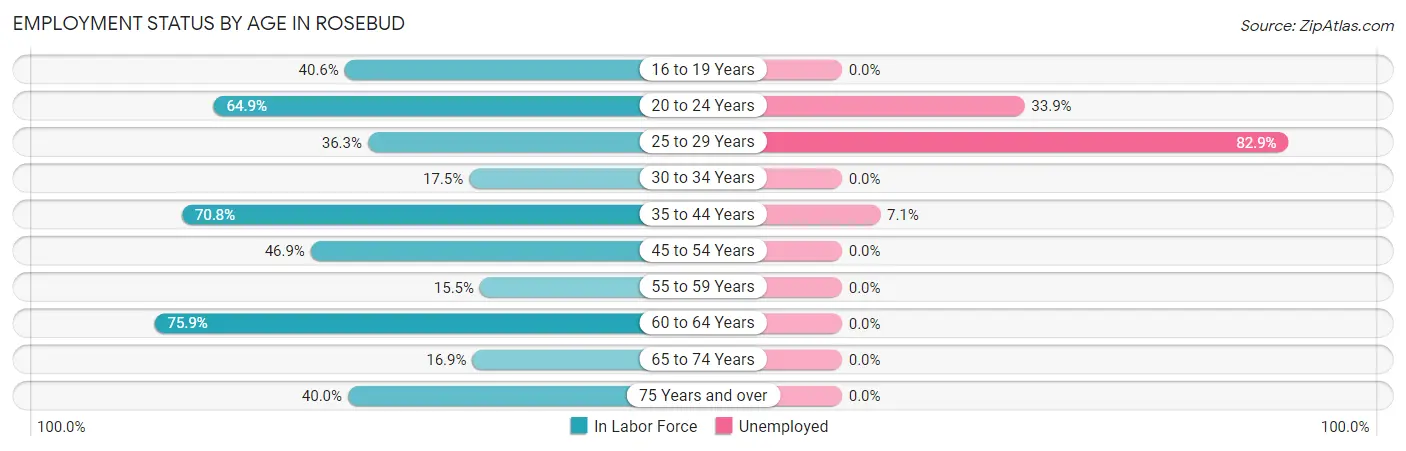
| Age Bracket | In Labor Force | Unemployed |
| 16 to 19 Years | 65 (40.6%) | 0 (0.0%) |
| 20 to 24 Years | 183 (64.9%) | 62 (33.9%) |
| 25 to 29 Years | 70 (36.3%) | 58 (82.9%) |
| 30 to 34 Years | 22 (17.5%) | 0 (0.0%) |
| 35 to 44 Years | 211 (70.8%) | 15 (7.1%) |
| 45 to 54 Years | 53 (46.9%) | 0 (0.0%) |
| 55 to 59 Years | 9 (15.5%) | 0 (0.0%) |
| 60 to 64 Years | 44 (75.9%) | 0 (0.0%) |
| 65 to 74 Years | 14 (16.9%) | 0 (0.0%) |
| 75 Years and over | 12 (40.0%) | 0 (0.0%) |
| Total | 684 (48.8%) | 135 (19.8%) |
Employment Status by Educational Attainment in Rosebud
According to labor force statistics for Rosebud, 48.3% of individuals (409) out of the total population between 25 and 64 years of age (846) are in the labor force, with 17.8% or 73 of them being unemployed. The group with the highest labor force participation rate are those with the educational attainment of bachelor's degree or higher, with 84.9% or 73 individuals in the labor force. Within the labor force, individuals with less than high school education have the highest percentage of unemployment, with 46.8% or 58 of them being unemployed.
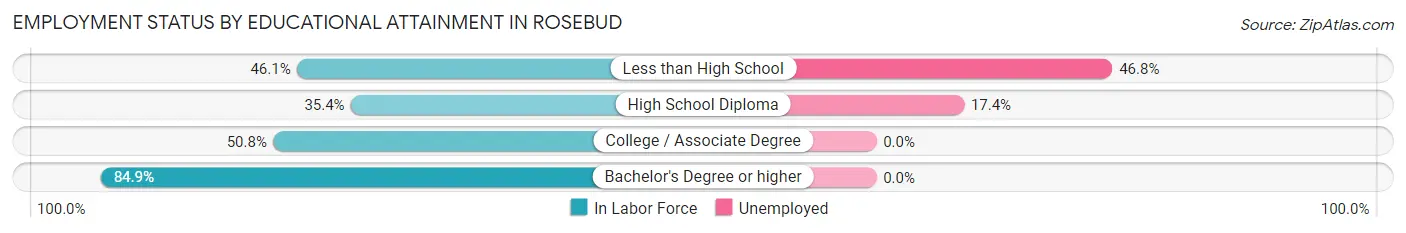
| Educational Attainment | In Labor Force | Unemployed |
| Less than High School | 124 (46.1%) | 126 (46.8%) |
| High School Diploma | 86 (35.4%) | 42 (17.4%) |
| College / Associate Degree | 126 (50.8%) | 0 (0.0%) |
| Bachelor's Degree or higher | 73 (84.9%) | 0 (0.0%) |
| Total | 409 (48.3%) | 151 (17.8%) |
Employment Occupations by Sex in Rosebud
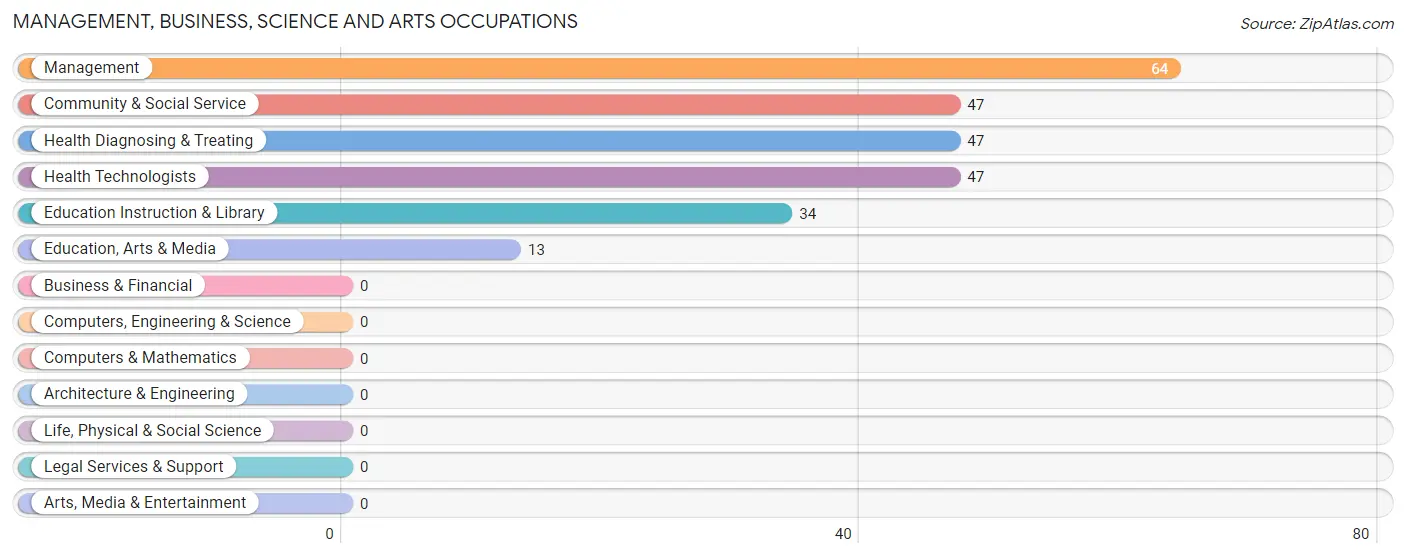
Management, Business, Science and Arts Occupations
The most common Management, Business, Science and Arts occupations in Rosebud are Management (64 | 11.7%), Community & Social Service (47 | 8.6%), Health Diagnosing & Treating (47 | 8.6%), Health Technologists (47 | 8.6%), and Education Instruction & Library (34 | 6.2%).
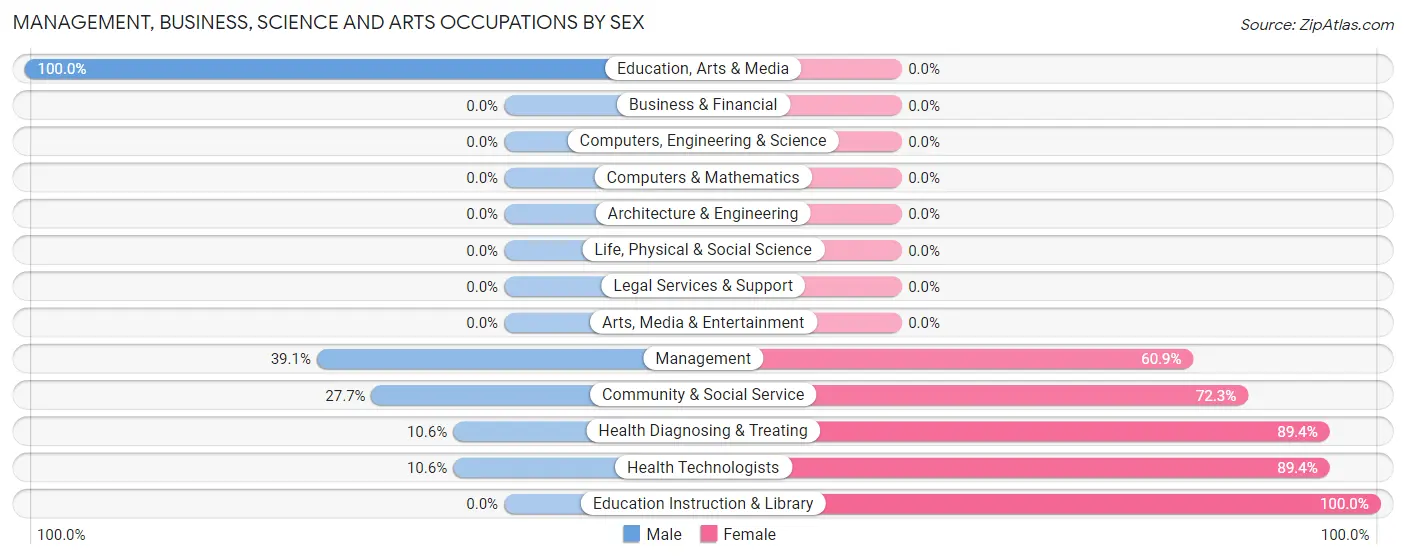
Management, Business, Science and Arts Occupations by Sex
Within the Management, Business, Science and Arts occupations in Rosebud, the most male-oriented occupations are Education, Arts & Media (100.0%), Management (39.1%), and Community & Social Service (27.7%), while the most female-oriented occupations are Education Instruction & Library (100.0%), Health Diagnosing & Treating (89.4%), and Health Technologists (89.4%).
| Occupation | Male | Female |
| Management | 25 (39.1%) | 39 (60.9%) |
| Business & Financial | 0 (0.0%) | 0 (0.0%) |
| Computers, Engineering & Science | 0 (0.0%) | 0 (0.0%) |
| Computers & Mathematics | 0 (0.0%) | 0 (0.0%) |
| Architecture & Engineering | 0 (0.0%) | 0 (0.0%) |
| Life, Physical & Social Science | 0 (0.0%) | 0 (0.0%) |
| Community & Social Service | 13 (27.7%) | 34 (72.3%) |
| Education, Arts & Media | 13 (100.0%) | 0 (0.0%) |
| Legal Services & Support | 0 (0.0%) | 0 (0.0%) |
| Education Instruction & Library | 0 (0.0%) | 34 (100.0%) |
| Arts, Media & Entertainment | 0 (0.0%) | 0 (0.0%) |
| Health Diagnosing & Treating | 5 (10.6%) | 42 (89.4%) |
| Health Technologists | 5 (10.6%) | 42 (89.4%) |
| Total (Category) | 43 (27.2%) | 115 (72.8%) |
| Total (Overall) | 214 (39.1%) | 334 (61.0%) |
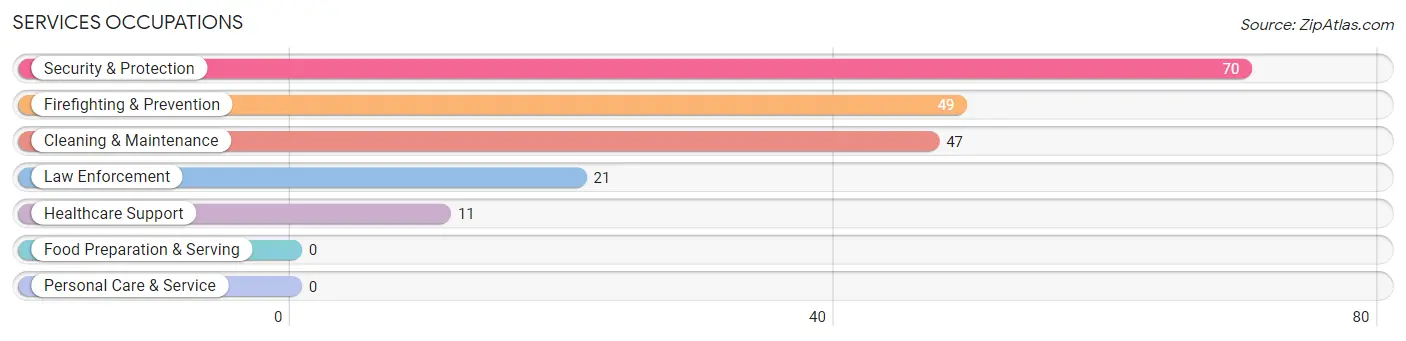
Services Occupations
The most common Services occupations in Rosebud are Security & Protection (70 | 12.8%), Firefighting & Prevention (49 | 8.9%), Cleaning & Maintenance (47 | 8.6%), Law Enforcement (21 | 3.8%), and Healthcare Support (11 | 2.0%).
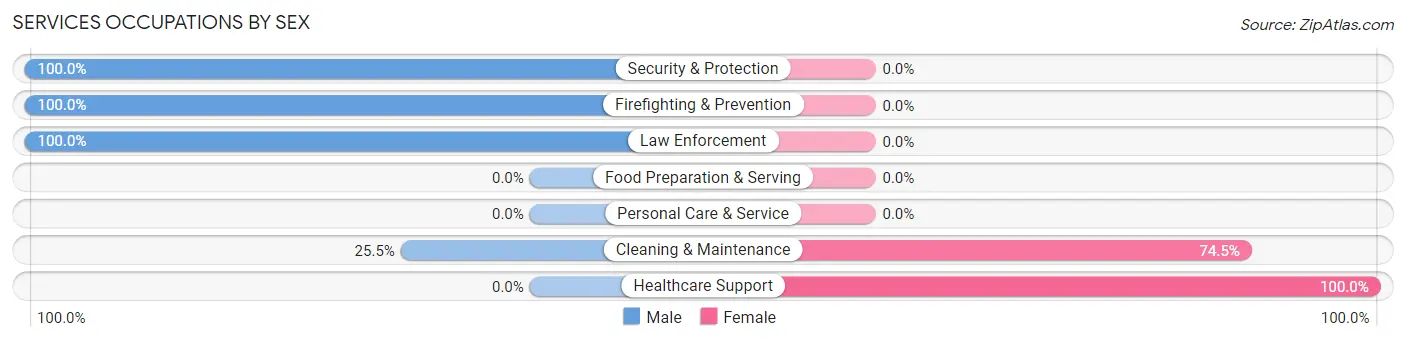
Services Occupations by Sex
Within the Services occupations in Rosebud, the most male-oriented occupations are Security & Protection (100.0%), Firefighting & Prevention (100.0%), and Law Enforcement (100.0%), while the most female-oriented occupations are Healthcare Support (100.0%), and Cleaning & Maintenance (74.5%).
| Occupation | Male | Female |
| Healthcare Support | 0 (0.0%) | 11 (100.0%) |
| Security & Protection | 70 (100.0%) | 0 (0.0%) |
| Firefighting & Prevention | 49 (100.0%) | 0 (0.0%) |
| Law Enforcement | 21 (100.0%) | 0 (0.0%) |
| Food Preparation & Serving | 0 (0.0%) | 0 (0.0%) |
| Cleaning & Maintenance | 12 (25.5%) | 35 (74.5%) |
| Personal Care & Service | 0 (0.0%) | 0 (0.0%) |
| Total (Category) | 82 (64.1%) | 46 (35.9%) |
| Total (Overall) | 214 (39.1%) | 334 (61.0%) |
Sales and Office Occupations
The most common Sales and Office occupations in Rosebud are Sales & Related (64 | 11.7%), and Office & Administration (40 | 7.3%).
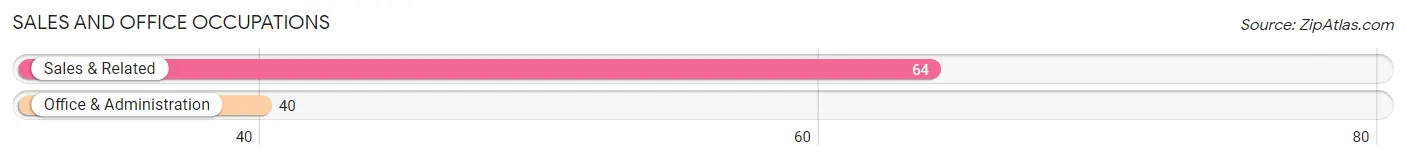
Sales and Office Occupations by Sex
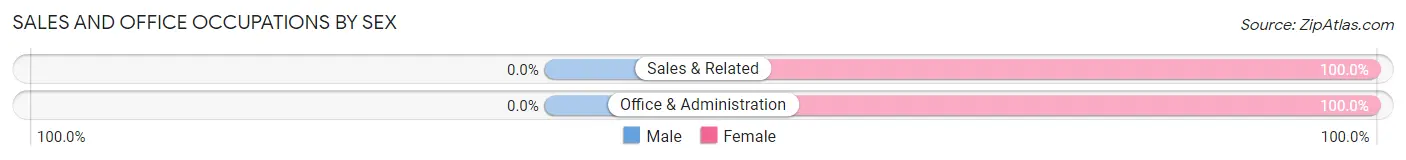
| Occupation | Male | Female |
| Sales & Related | 0 (0.0%) | 64 (100.0%) |
| Office & Administration | 0 (0.0%) | 40 (100.0%) |
| Total (Category) | 0 (0.0%) | 104 (100.0%) |
| Total (Overall) | 214 (39.1%) | 334 (61.0%) |
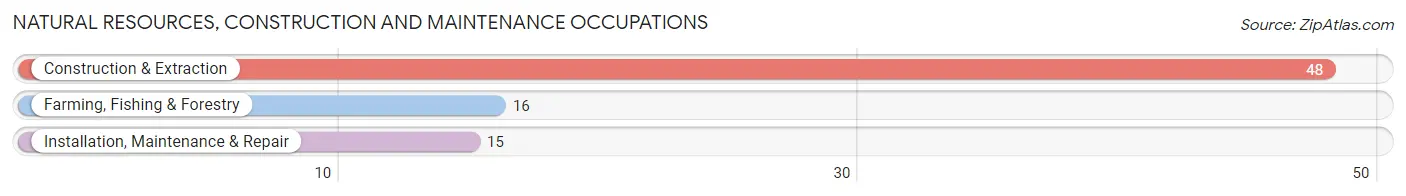
Natural Resources, Construction and Maintenance Occupations
The most common Natural Resources, Construction and Maintenance occupations in Rosebud are Construction & Extraction (48 | 8.8%), Farming, Fishing & Forestry (16 | 2.9%), and Installation, Maintenance & Repair (15 | 2.7%).
Natural Resources, Construction and Maintenance Occupations by Sex
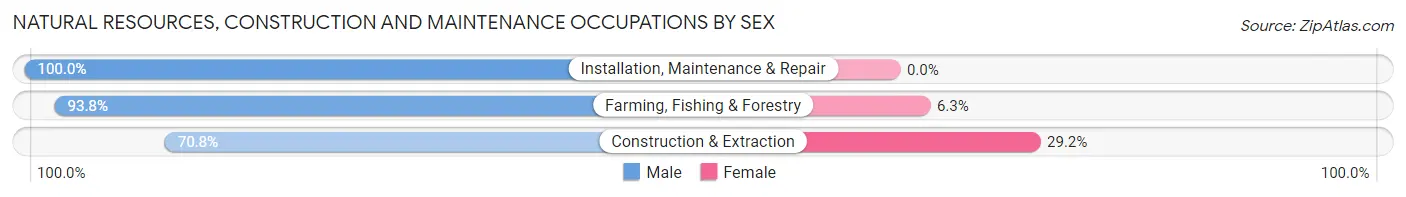
| Occupation | Male | Female |
| Farming, Fishing & Forestry | 15 (93.8%) | 1 (6.2%) |
| Construction & Extraction | 34 (70.8%) | 14 (29.2%) |
| Installation, Maintenance & Repair | 15 (100.0%) | 0 (0.0%) |
| Total (Category) | 64 (81.0%) | 15 (19.0%) |
| Total (Overall) | 214 (39.1%) | 334 (61.0%) |
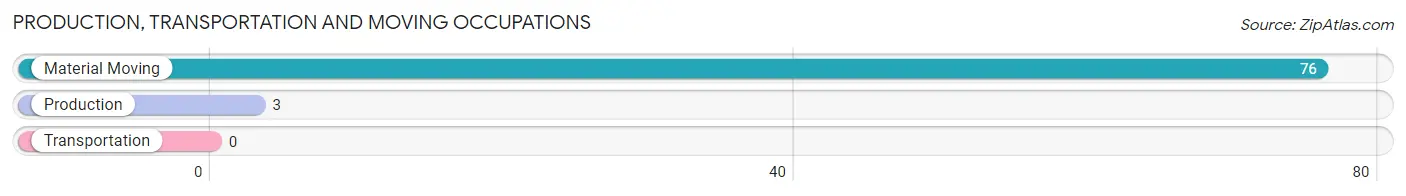
Production, Transportation and Moving Occupations
The most common Production, Transportation and Moving occupations in Rosebud are Material Moving (76 | 13.9%), and Production (3 | 0.5%).
Production, Transportation and Moving Occupations by Sex
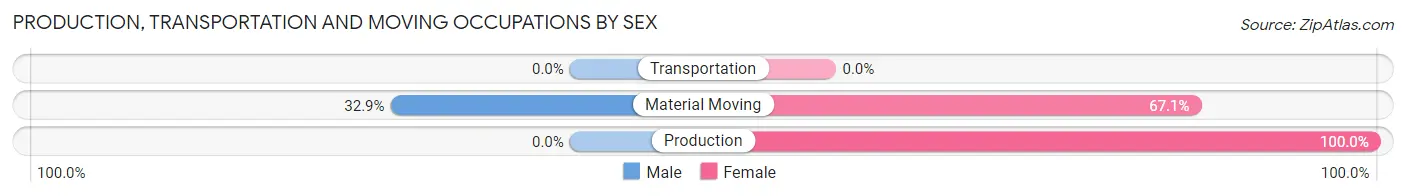
| Occupation | Male | Female |
| Production | 0 (0.0%) | 3 (100.0%) |
| Transportation | 0 (0.0%) | 0 (0.0%) |
| Material Moving | 25 (32.9%) | 51 (67.1%) |
| Total (Category) | 25 (31.7%) | 54 (68.3%) |
| Total (Overall) | 214 (39.1%) | 334 (61.0%) |
Employment Industries by Sex in Rosebud
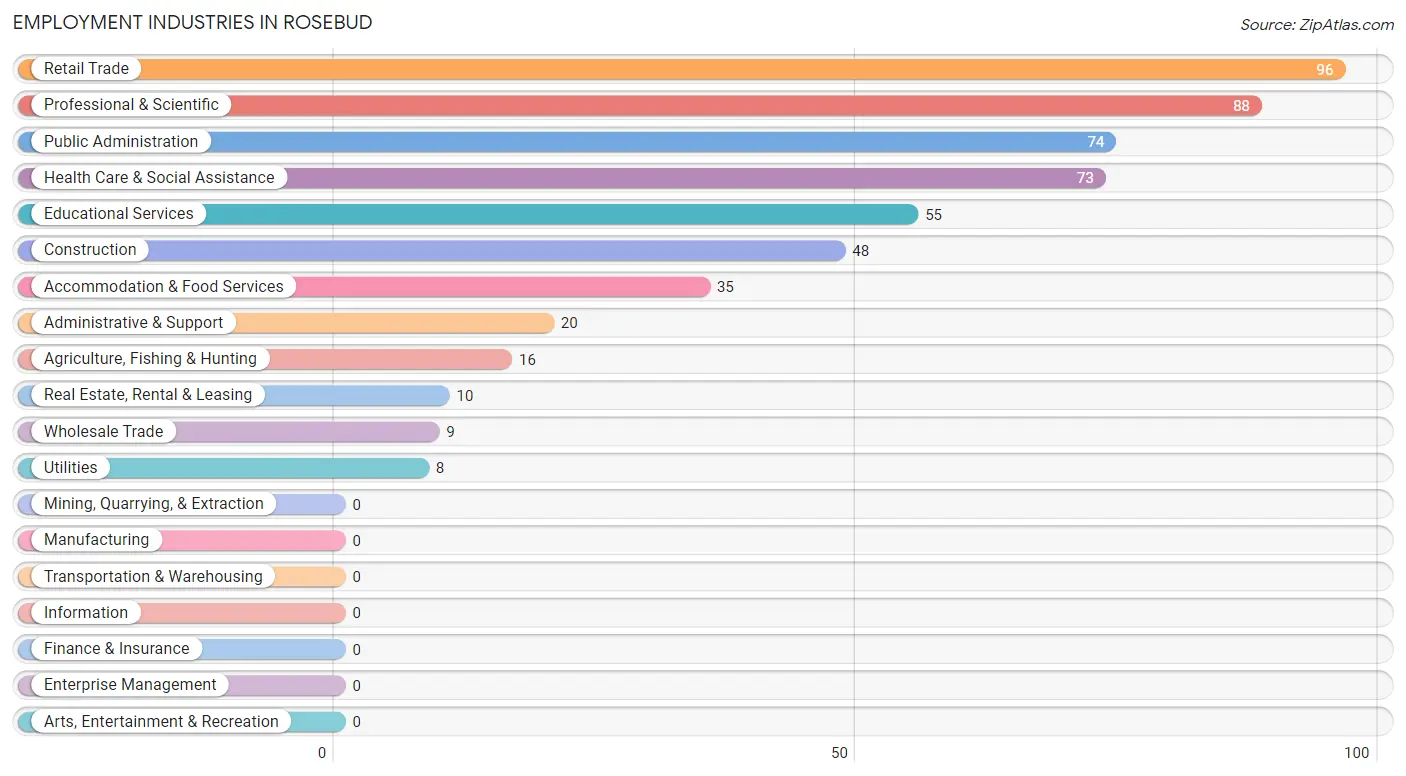
Employment Industries in Rosebud
The major employment industries in Rosebud include Retail Trade (96 | 17.5%), Professional & Scientific (88 | 16.1%), Public Administration (74 | 13.5%), Health Care & Social Assistance (73 | 13.3%), and Educational Services (55 | 10.0%).
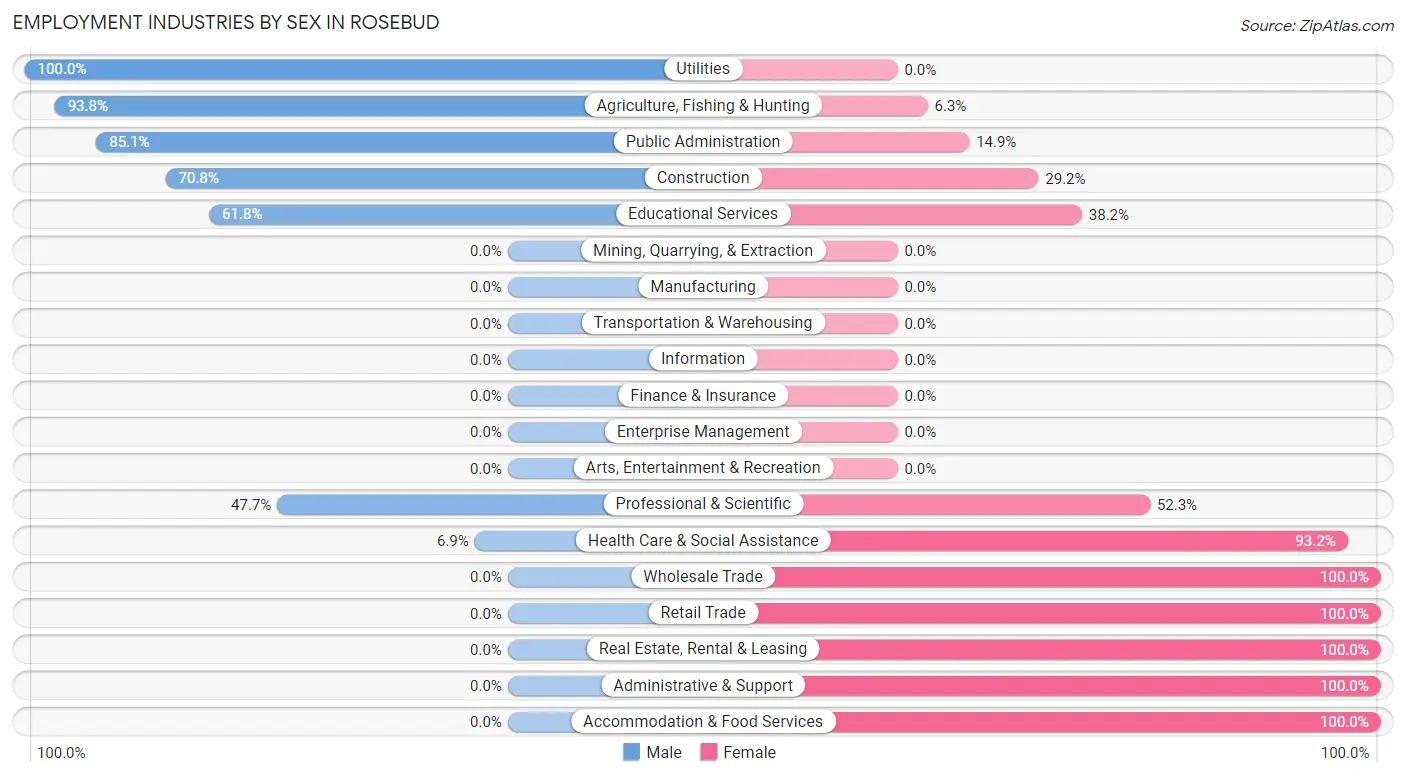
Employment Industries by Sex in Rosebud
The Rosebud industries that see more men than women are Utilities (100.0%), Agriculture, Fishing & Hunting (93.8%), and Public Administration (85.1%), whereas the industries that tend to have a higher number of women are Wholesale Trade (100.0%), Retail Trade (100.0%), and Real Estate, Rental & Leasing (100.0%).
| Industry | Male | Female |
| Agriculture, Fishing & Hunting | 15 (93.8%) | 1 (6.2%) |
| Mining, Quarrying, & Extraction | 0 (0.0%) | 0 (0.0%) |
| Construction | 34 (70.8%) | 14 (29.2%) |
| Manufacturing | 0 (0.0%) | 0 (0.0%) |
| Wholesale Trade | 0 (0.0%) | 9 (100.0%) |
| Retail Trade | 0 (0.0%) | 96 (100.0%) |
| Transportation & Warehousing | 0 (0.0%) | 0 (0.0%) |
| Utilities | 8 (100.0%) | 0 (0.0%) |
| Information | 0 (0.0%) | 0 (0.0%) |
| Finance & Insurance | 0 (0.0%) | 0 (0.0%) |
| Real Estate, Rental & Leasing | 0 (0.0%) | 10 (100.0%) |
| Professional & Scientific | 42 (47.7%) | 46 (52.3%) |
| Enterprise Management | 0 (0.0%) | 0 (0.0%) |
| Administrative & Support | 0 (0.0%) | 20 (100.0%) |
| Educational Services | 34 (61.8%) | 21 (38.2%) |
| Health Care & Social Assistance | 5 (6.9%) | 68 (93.1%) |
| Arts, Entertainment & Recreation | 0 (0.0%) | 0 (0.0%) |
| Accommodation & Food Services | 0 (0.0%) | 35 (100.0%) |
| Public Administration | 63 (85.1%) | 11 (14.9%) |
| Total | 214 (39.1%) | 334 (61.0%) |
Education in Rosebud
School Enrollment in Rosebud
The most common levels of schooling among the 611 students in Rosebud are high school (218 | 35.7%), middle school (150 | 24.5%), and elementary school (99 | 16.2%).
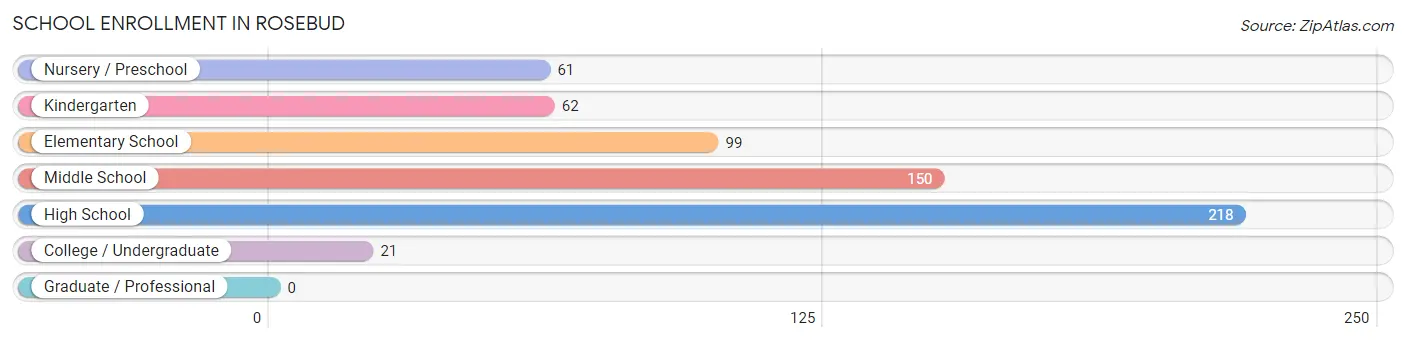
| School Level | # Students | % Students |
| Nursery / Preschool | 61 | 10.0% |
| Kindergarten | 62 | 10.2% |
| Elementary School | 99 | 16.2% |
| Middle School | 150 | 24.5% |
| High School | 218 | 35.7% |
| College / Undergraduate | 21 | 3.4% |
| Graduate / Professional | 0 | 0.0% |
| Total | 611 | 100.0% |
School Enrollment by Age by Funding Source in Rosebud
Out of a total of 611 students who are enrolled in schools in Rosebud, 21 (3.4%) attend a private institution, while the remaining 590 (96.6%) are enrolled in public schools. The age group of 25 to 34 year olds has the highest likelihood of being enrolled in private schools, with 21 (100.0% in the age bracket) enrolled. Conversely, the age group of 3 to 4 year olds has the lowest likelihood of being enrolled in a private school, with 48 (100.0% in the age bracket) attending a public institution.
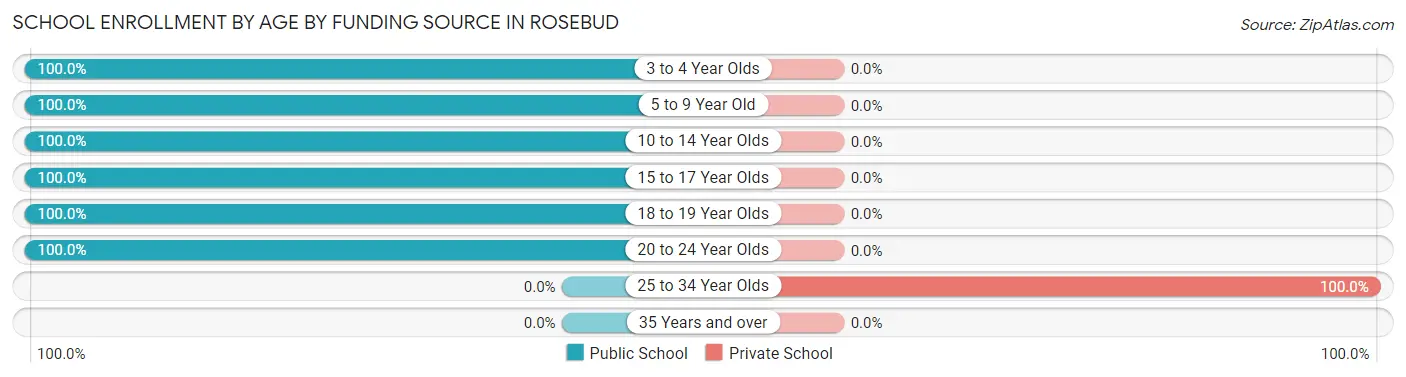
| Age Bracket | Public School | Private School |
| 3 to 4 Year Olds | 48 (100.0%) | 0 (0.0%) |
| 5 to 9 Year Old | 164 (100.0%) | 0 (0.0%) |
| 10 to 14 Year Olds | 174 (100.0%) | 0 (0.0%) |
| 15 to 17 Year Olds | 156 (100.0%) | 0 (0.0%) |
| 18 to 19 Year Olds | 30 (100.0%) | 0 (0.0%) |
| 20 to 24 Year Olds | 18 (100.0%) | 0 (0.0%) |
| 25 to 34 Year Olds | 0 (0.0%) | 21 (100.0%) |
| 35 Years and over | 0 (0.0%) | 0 (0.0%) |
| Total | 590 (96.6%) | 21 (3.4%) |
Educational Attainment by Field of Study in Rosebud
Education (37 | 24.7%), science & technology (33 | 22.0%), business (25 | 16.7%), visual & performing arts (25 | 16.7%), and communications (25 | 16.7%) are the most common fields of study among 150 individuals in Rosebud who have obtained a bachelor's degree or higher.

| Field of Study | # Graduates | % Graduates |
| Computers & Mathematics | 0 | 0.0% |
| Bio, Nature & Agricultural | 0 | 0.0% |
| Physical & Health Sciences | 5 | 3.3% |
| Psychology | 0 | 0.0% |
| Social Sciences | 0 | 0.0% |
| Engineering | 0 | 0.0% |
| Multidisciplinary Studies | 0 | 0.0% |
| Science & Technology | 33 | 22.0% |
| Business | 25 | 16.7% |
| Education | 37 | 24.7% |
| Literature & Languages | 0 | 0.0% |
| Liberal Arts & History | 0 | 0.0% |
| Visual & Performing Arts | 25 | 16.7% |
| Communications | 25 | 16.7% |
| Arts & Humanities | 0 | 0.0% |
| Total | 150 | 100.0% |
Transportation & Commute in Rosebud
Vehicle Availability by Sex in Rosebud
The most prevalent vehicle ownership categories in Rosebud are males with 1 vehicle (79, accounting for 36.9%) and females with 1 vehicle (106, making up 23.9%).
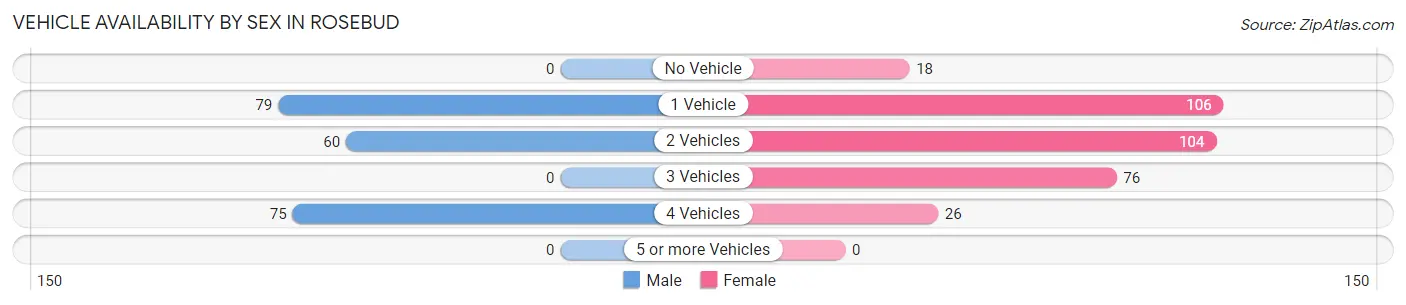
| Vehicles Available | Male | Female |
| No Vehicle | 0 (0.0%) | 18 (5.4%) |
| 1 Vehicle | 79 (36.9%) | 106 (32.1%) |
| 2 Vehicles | 60 (28.0%) | 104 (31.5%) |
| 3 Vehicles | 0 (0.0%) | 76 (23.0%) |
| 4 Vehicles | 75 (35.0%) | 26 (7.9%) |
| 5 or more Vehicles | 0 (0.0%) | 0 (0.0%) |
| Total | 214 (100.0%) | 330 (100.0%) |
Commute Time in Rosebud
The most frequently occuring commute durations in Rosebud are 20 to 24 minutes (140 commuters, 26.1%), 5 to 9 minutes (115 commuters, 21.5%), and 10 to 14 minutes (93 commuters, 17.3%).
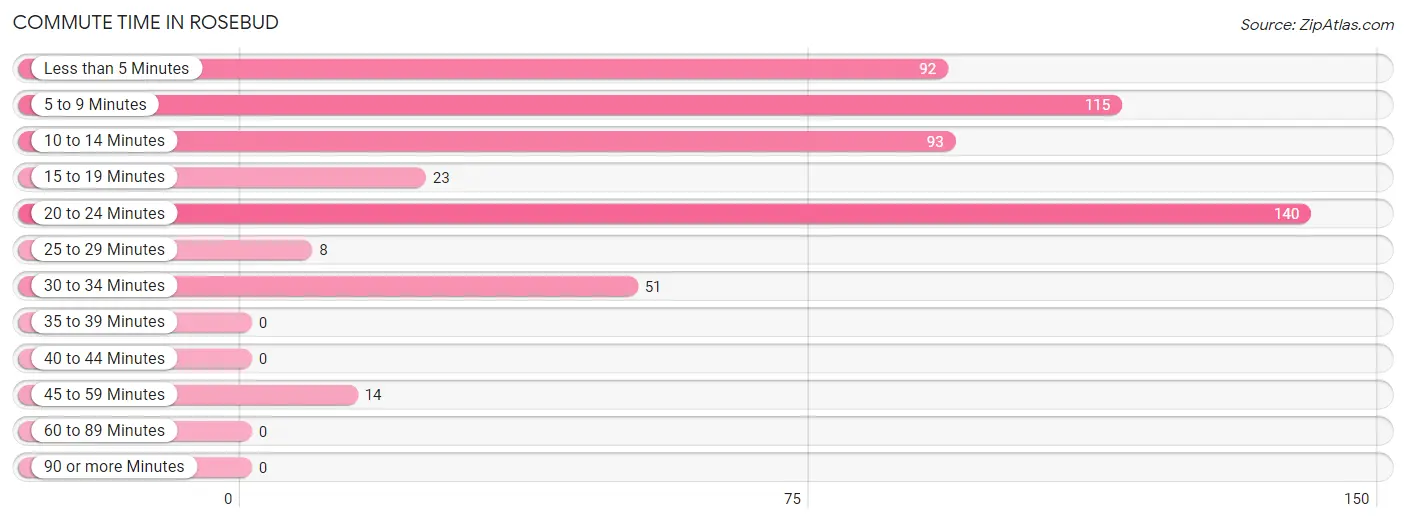
| Commute Time | # Commuters | % Commuters |
| Less than 5 Minutes | 92 | 17.2% |
| 5 to 9 Minutes | 115 | 21.5% |
| 10 to 14 Minutes | 93 | 17.3% |
| 15 to 19 Minutes | 23 | 4.3% |
| 20 to 24 Minutes | 140 | 26.1% |
| 25 to 29 Minutes | 8 | 1.5% |
| 30 to 34 Minutes | 51 | 9.5% |
| 35 to 39 Minutes | 0 | 0.0% |
| 40 to 44 Minutes | 0 | 0.0% |
| 45 to 59 Minutes | 14 | 2.6% |
| 60 to 89 Minutes | 0 | 0.0% |
| 90 or more Minutes | 0 | 0.0% |
Commute Time by Sex in Rosebud
The most common commute times in Rosebud are 20 to 24 minutes (71 commuters, 33.2%) for males and 10 to 14 minutes (81 commuters, 25.2%) for females.
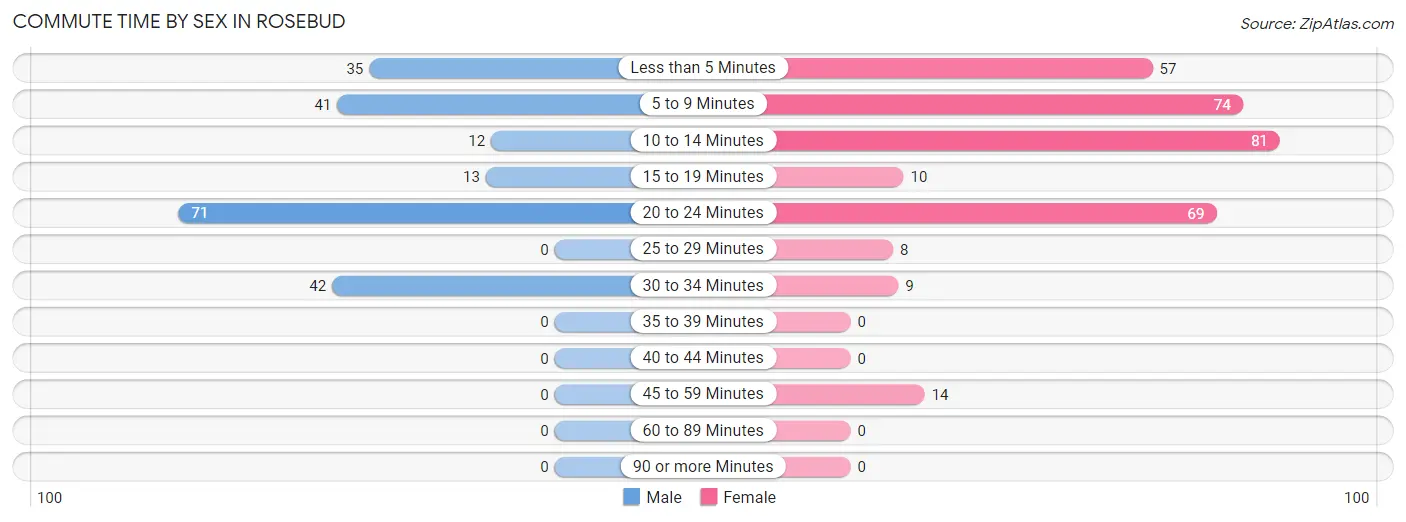
| Commute Time | Male | Female |
| Less than 5 Minutes | 35 (16.4%) | 57 (17.7%) |
| 5 to 9 Minutes | 41 (19.2%) | 74 (23.0%) |
| 10 to 14 Minutes | 12 (5.6%) | 81 (25.2%) |
| 15 to 19 Minutes | 13 (6.1%) | 10 (3.1%) |
| 20 to 24 Minutes | 71 (33.2%) | 69 (21.4%) |
| 25 to 29 Minutes | 0 (0.0%) | 8 (2.5%) |
| 30 to 34 Minutes | 42 (19.6%) | 9 (2.8%) |
| 35 to 39 Minutes | 0 (0.0%) | 0 (0.0%) |
| 40 to 44 Minutes | 0 (0.0%) | 0 (0.0%) |
| 45 to 59 Minutes | 0 (0.0%) | 14 (4.3%) |
| 60 to 89 Minutes | 0 (0.0%) | 0 (0.0%) |
| 90 or more Minutes | 0 (0.0%) | 0 (0.0%) |
Time of Departure to Work by Sex in Rosebud
The most frequent times of departure to work in Rosebud are 7:30 AM to 7:59 AM (87, 40.6%) for males and 7:30 AM to 7:59 AM (197, 61.2%) for females.
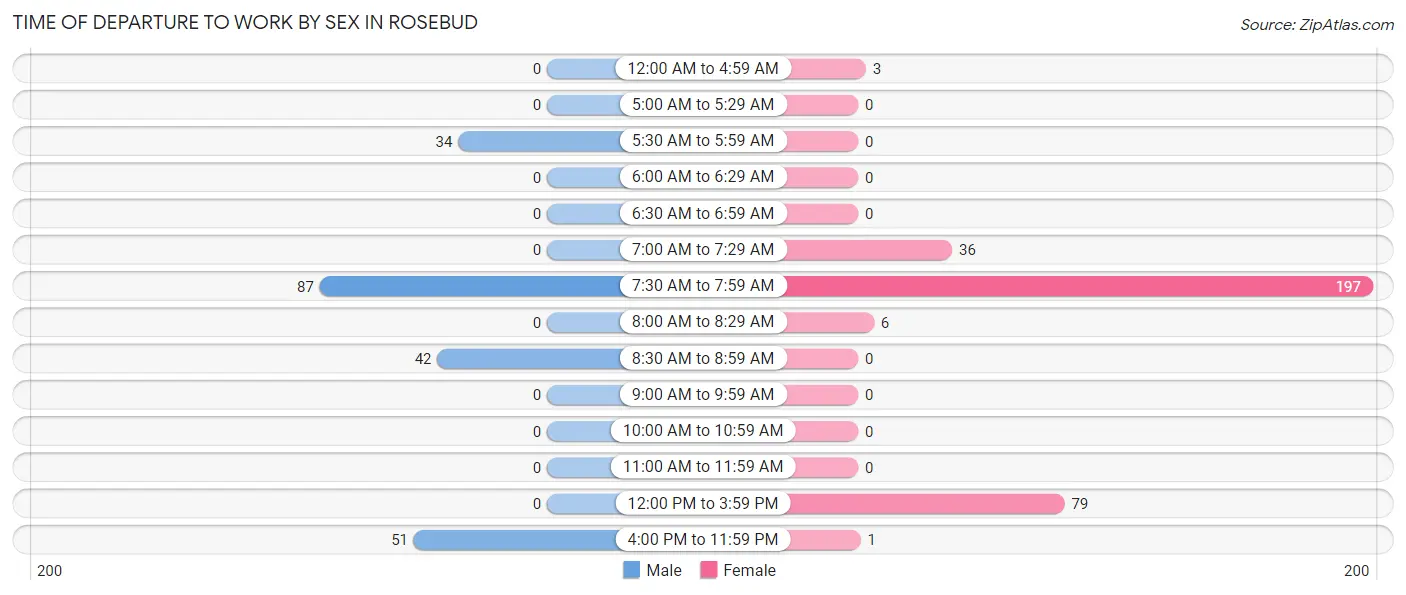
| Time of Departure | Male | Female |
| 12:00 AM to 4:59 AM | 0 (0.0%) | 3 (0.9%) |
| 5:00 AM to 5:29 AM | 0 (0.0%) | 0 (0.0%) |
| 5:30 AM to 5:59 AM | 34 (15.9%) | 0 (0.0%) |
| 6:00 AM to 6:29 AM | 0 (0.0%) | 0 (0.0%) |
| 6:30 AM to 6:59 AM | 0 (0.0%) | 0 (0.0%) |
| 7:00 AM to 7:29 AM | 0 (0.0%) | 36 (11.2%) |
| 7:30 AM to 7:59 AM | 87 (40.6%) | 197 (61.2%) |
| 8:00 AM to 8:29 AM | 0 (0.0%) | 6 (1.9%) |
| 8:30 AM to 8:59 AM | 42 (19.6%) | 0 (0.0%) |
| 9:00 AM to 9:59 AM | 0 (0.0%) | 0 (0.0%) |
| 10:00 AM to 10:59 AM | 0 (0.0%) | 0 (0.0%) |
| 11:00 AM to 11:59 AM | 0 (0.0%) | 0 (0.0%) |
| 12:00 PM to 3:59 PM | 0 (0.0%) | 79 (24.5%) |
| 4:00 PM to 11:59 PM | 51 (23.8%) | 1 (0.3%) |
| Total | 214 (100.0%) | 322 (100.0%) |
Housing Occupancy in Rosebud
Occupancy by Ownership in Rosebud
Of the total 394 dwellings in Rosebud, owner-occupied units account for 121 (30.7%), while renter-occupied units make up 273 (69.3%).
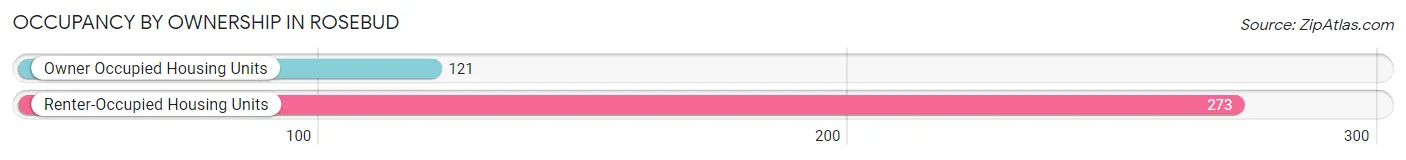
| Occupancy | # Housing Units | % Housing Units |
| Owner Occupied Housing Units | 121 | 30.7% |
| Renter-Occupied Housing Units | 273 | 69.3% |
| Total Occupied Housing Units | 394 | 100.0% |
Occupancy by Household Size in Rosebud
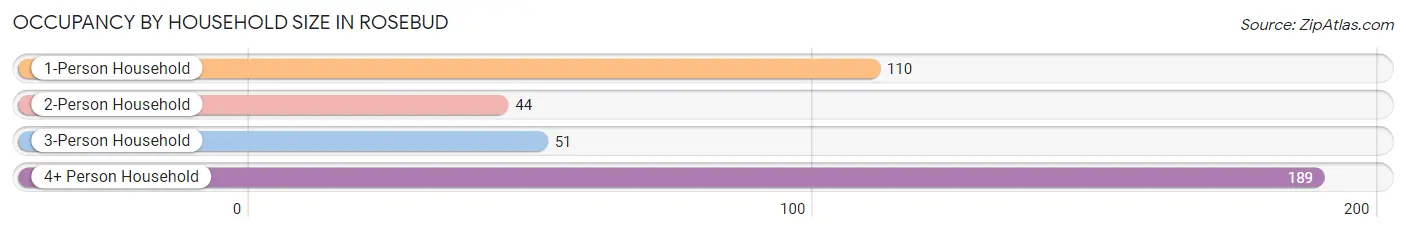
| Household Size | # Housing Units | % Housing Units |
| 1-Person Household | 110 | 27.9% |
| 2-Person Household | 44 | 11.2% |
| 3-Person Household | 51 | 12.9% |
| 4+ Person Household | 189 | 48.0% |
| Total Housing Units | 394 | 100.0% |
Occupancy by Ownership by Household Size in Rosebud
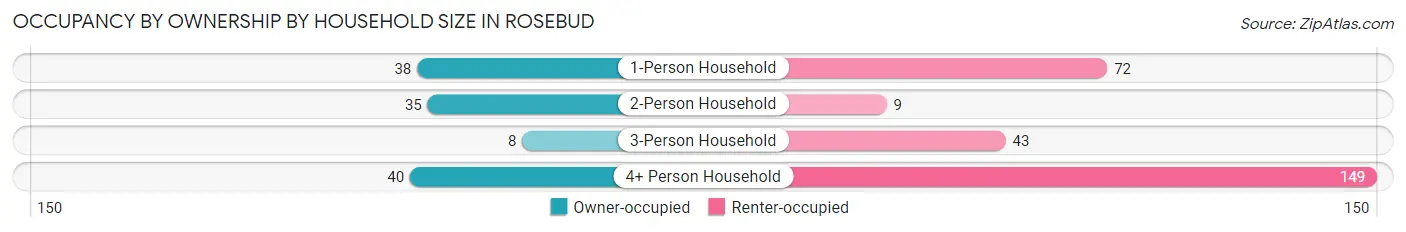
| Household Size | Owner-occupied | Renter-occupied |
| 1-Person Household | 38 (34.5%) | 72 (65.4%) |
| 2-Person Household | 35 (79.5%) | 9 (20.4%) |
| 3-Person Household | 8 (15.7%) | 43 (84.3%) |
| 4+ Person Household | 40 (21.2%) | 149 (78.8%) |
| Total Housing Units | 121 (30.7%) | 273 (69.3%) |
Occupancy by Educational Attainment in Rosebud
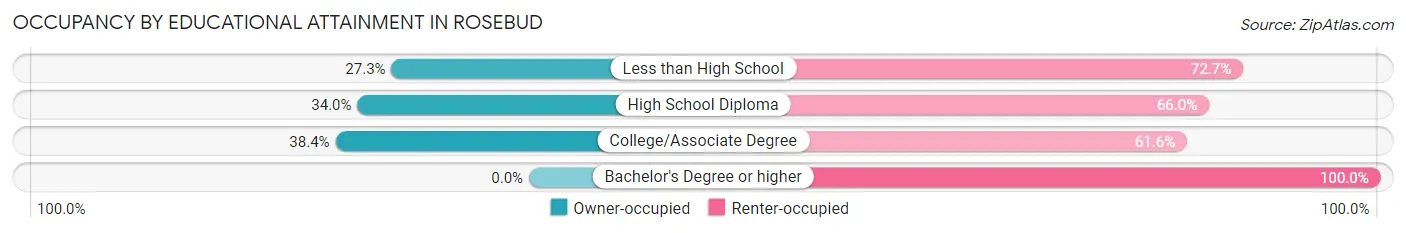
| Household Size | Owner-occupied | Renter-occupied |
| Less than High School | 12 (27.3%) | 32 (72.7%) |
| High School Diploma | 33 (34.0%) | 64 (66.0%) |
| College/Associate Degree | 76 (38.4%) | 122 (61.6%) |
| Bachelor's Degree or higher | 0 (0.0%) | 55 (100.0%) |
Occupancy by Age of Householder in Rosebud
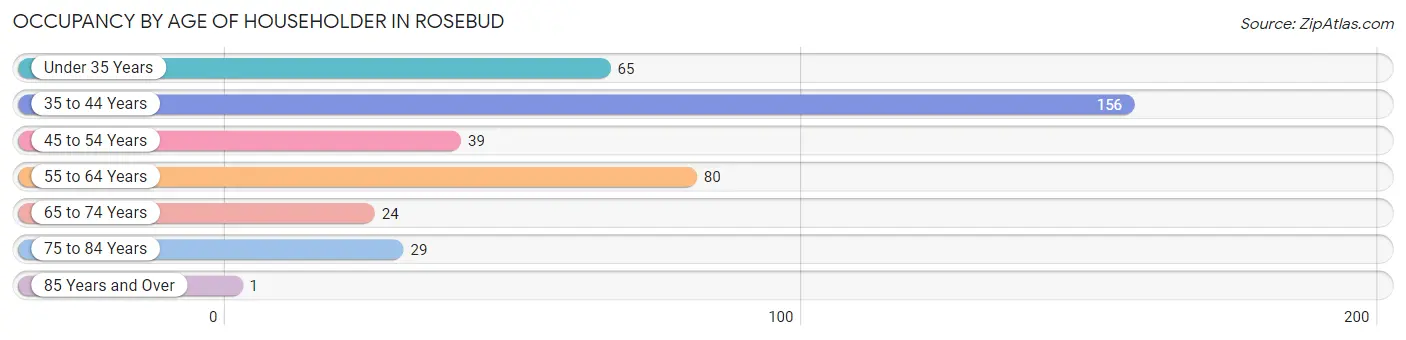
| Age Bracket | # Households | % Households |
| Under 35 Years | 65 | 16.5% |
| 35 to 44 Years | 156 | 39.6% |
| 45 to 54 Years | 39 | 9.9% |
| 55 to 64 Years | 80 | 20.3% |
| 65 to 74 Years | 24 | 6.1% |
| 75 to 84 Years | 29 | 7.4% |
| 85 Years and Over | 1 | 0.3% |
| Total | 394 | 100.0% |
Housing Finances in Rosebud
Median Income by Occupancy in Rosebud
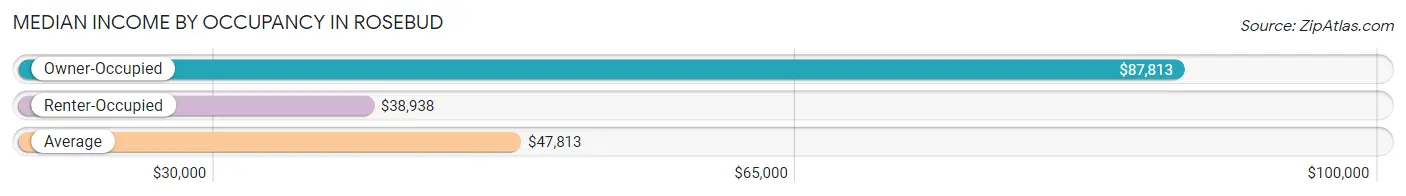
| Occupancy Type | # Households | Median Income |
| Owner-Occupied | 121 (30.7%) | $87,813 |
| Renter-Occupied | 273 (69.3%) | $38,938 |
| Average | 394 (100.0%) | $47,813 |
Occupancy by Householder Income Bracket in Rosebud
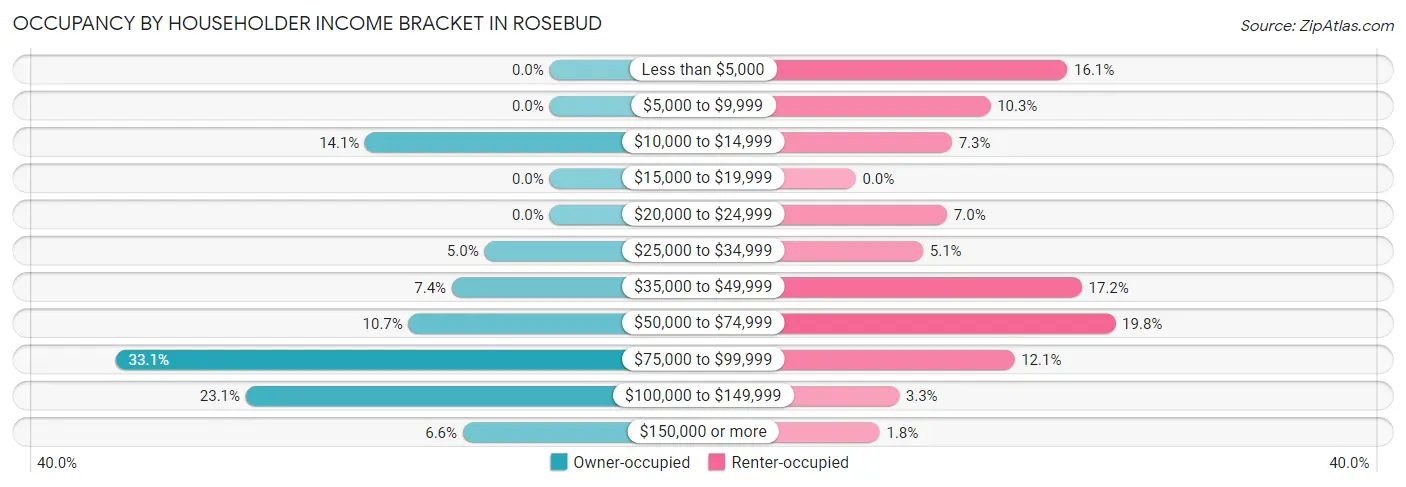
| Income Bracket | Owner-occupied | Renter-occupied |
| Less than $5,000 | 0 (0.0%) | 44 (16.1%) |
| $5,000 to $9,999 | 0 (0.0%) | 28 (10.3%) |
| $10,000 to $14,999 | 17 (14.1%) | 20 (7.3%) |
| $15,000 to $19,999 | 0 (0.0%) | 0 (0.0%) |
| $20,000 to $24,999 | 0 (0.0%) | 19 (7.0%) |
| $25,000 to $34,999 | 6 (5.0%) | 14 (5.1%) |
| $35,000 to $49,999 | 9 (7.4%) | 47 (17.2%) |
| $50,000 to $74,999 | 13 (10.7%) | 54 (19.8%) |
| $75,000 to $99,999 | 40 (33.1%) | 33 (12.1%) |
| $100,000 to $149,999 | 28 (23.1%) | 9 (3.3%) |
| $150,000 or more | 8 (6.6%) | 5 (1.8%) |
| Total | 121 (100.0%) | 273 (100.0%) |
Monthly Housing Cost Tiers in Rosebud
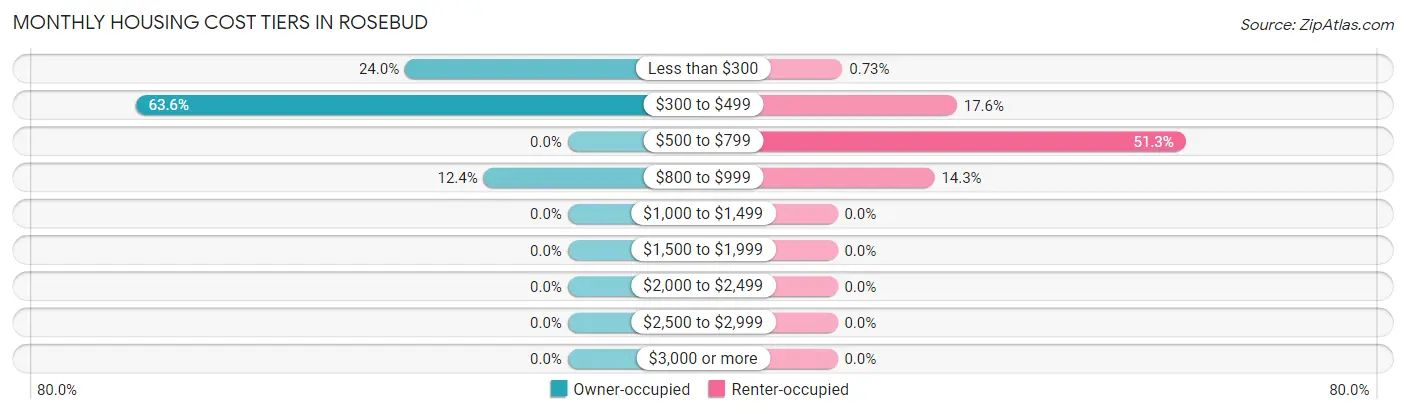
| Monthly Cost | Owner-occupied | Renter-occupied |
| Less than $300 | 29 (24.0%) | 2 (0.7%) |
| $300 to $499 | 77 (63.6%) | 48 (17.6%) |
| $500 to $799 | 0 (0.0%) | 140 (51.3%) |
| $800 to $999 | 15 (12.4%) | 39 (14.3%) |
| $1,000 to $1,499 | 0 (0.0%) | 0 (0.0%) |
| $1,500 to $1,999 | 0 (0.0%) | 0 (0.0%) |
| $2,000 to $2,499 | 0 (0.0%) | 0 (0.0%) |
| $2,500 to $2,999 | 0 (0.0%) | 0 (0.0%) |
| $3,000 or more | 0 (0.0%) | 0 (0.0%) |
| Total | 121 (100.0%) | 273 (100.0%) |
Physical Housing Characteristics in Rosebud
Housing Structures in Rosebud
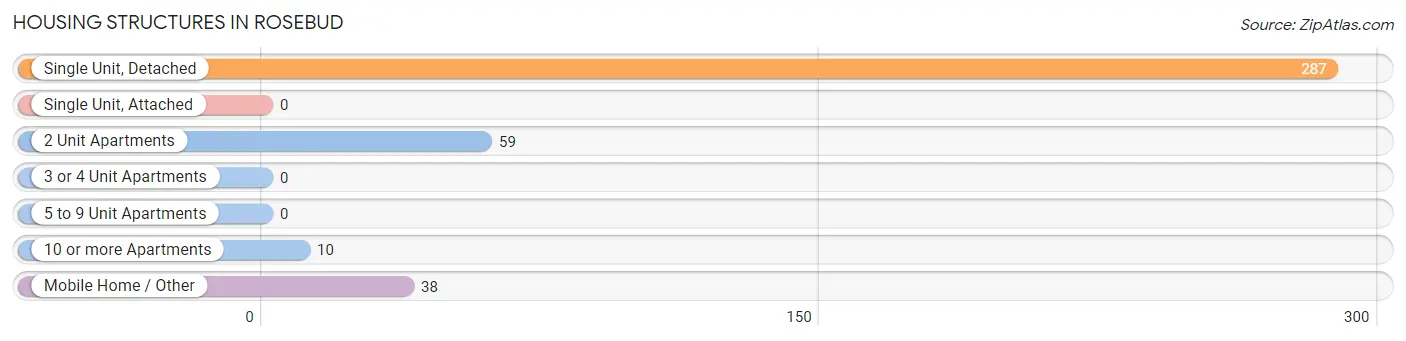
| Structure Type | # Housing Units | % Housing Units |
| Single Unit, Detached | 287 | 72.8% |
| Single Unit, Attached | 0 | 0.0% |
| 2 Unit Apartments | 59 | 15.0% |
| 3 or 4 Unit Apartments | 0 | 0.0% |
| 5 to 9 Unit Apartments | 0 | 0.0% |
| 10 or more Apartments | 10 | 2.5% |
| Mobile Home / Other | 38 | 9.6% |
| Total | 394 | 100.0% |
Housing Structures by Occupancy in Rosebud
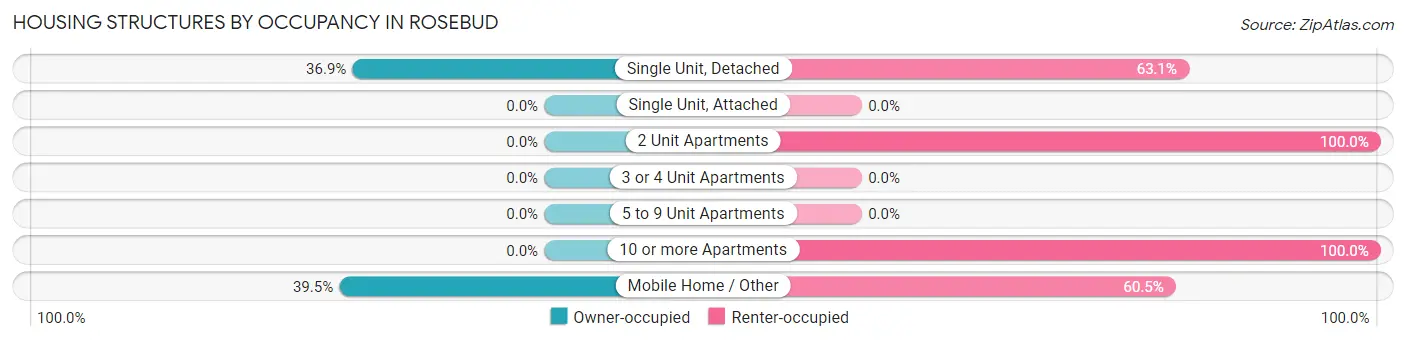
| Structure Type | Owner-occupied | Renter-occupied |
| Single Unit, Detached | 106 (36.9%) | 181 (63.1%) |
| Single Unit, Attached | 0 (0.0%) | 0 (0.0%) |
| 2 Unit Apartments | 0 (0.0%) | 59 (100.0%) |
| 3 or 4 Unit Apartments | 0 (0.0%) | 0 (0.0%) |
| 5 to 9 Unit Apartments | 0 (0.0%) | 0 (0.0%) |
| 10 or more Apartments | 0 (0.0%) | 10 (100.0%) |
| Mobile Home / Other | 15 (39.5%) | 23 (60.5%) |
| Total | 121 (30.7%) | 273 (69.3%) |
Housing Structures by Number of Rooms in Rosebud
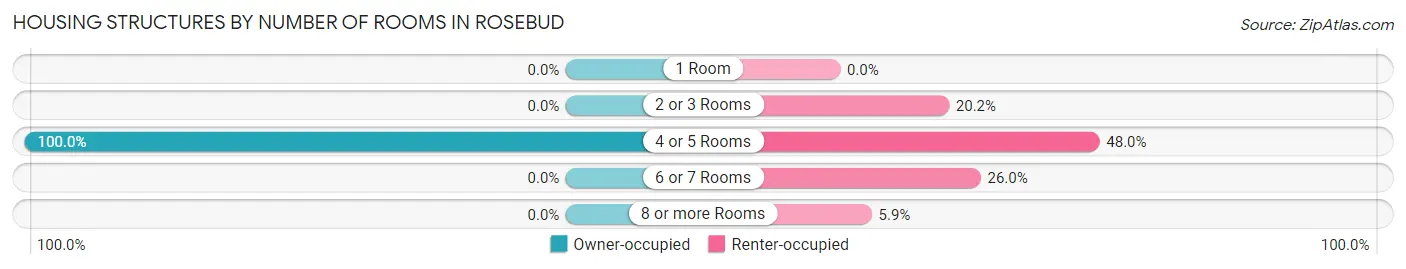
| Number of Rooms | Owner-occupied | Renter-occupied |
| 1 Room | 0 (0.0%) | 0 (0.0%) |
| 2 or 3 Rooms | 0 (0.0%) | 55 (20.2%) |
| 4 or 5 Rooms | 121 (100.0%) | 131 (48.0%) |
| 6 or 7 Rooms | 0 (0.0%) | 71 (26.0%) |
| 8 or more Rooms | 0 (0.0%) | 16 (5.9%) |
| Total | 121 (100.0%) | 273 (100.0%) |
Housing Structure by Heating Type in Rosebud
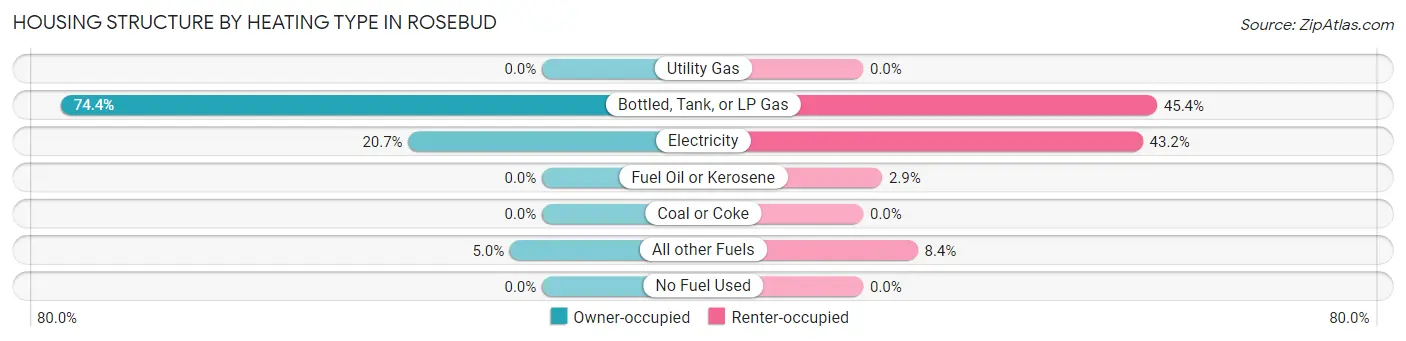
| Heating Type | Owner-occupied | Renter-occupied |
| Utility Gas | 0 (0.0%) | 0 (0.0%) |
| Bottled, Tank, or LP Gas | 90 (74.4%) | 124 (45.4%) |
| Electricity | 25 (20.7%) | 118 (43.2%) |
| Fuel Oil or Kerosene | 0 (0.0%) | 8 (2.9%) |
| Coal or Coke | 0 (0.0%) | 0 (0.0%) |
| All other Fuels | 6 (5.0%) | 23 (8.4%) |
| No Fuel Used | 0 (0.0%) | 0 (0.0%) |
| Total | 121 (100.0%) | 273 (100.0%) |
Household Vehicle Usage in Rosebud
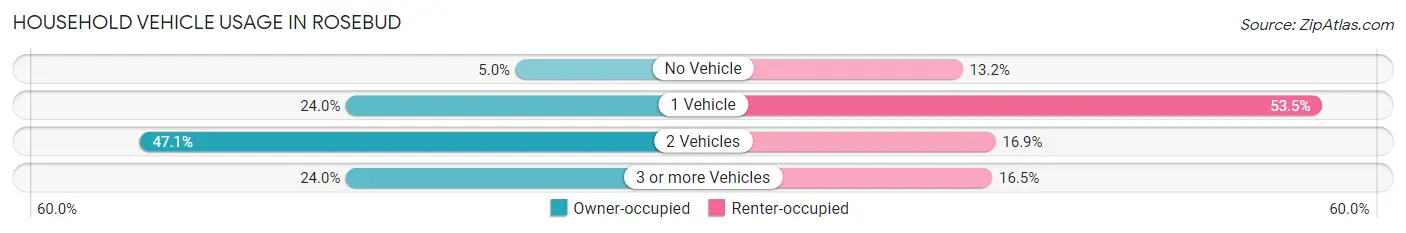
| Vehicles per Household | Owner-occupied | Renter-occupied |
| No Vehicle | 6 (5.0%) | 36 (13.2%) |
| 1 Vehicle | 29 (24.0%) | 146 (53.5%) |
| 2 Vehicles | 57 (47.1%) | 46 (16.9%) |
| 3 or more Vehicles | 29 (24.0%) | 45 (16.5%) |
| Total | 121 (100.0%) | 273 (100.0%) |
Real Estate & Mortgages in Rosebud
Real Estate and Mortgage Overview in Rosebud
| Characteristic | Without Mortgage | With Mortgage |
| Housing Units | 106 | 15 |
| Median Property Value | $45,800 | $0 |
| Median Household Income | $81,538 | $8 |
| Monthly Housing Costs | $321 | $0 |
| Real Estate Taxes | - | - |
Property Value by Mortgage Status in Rosebud
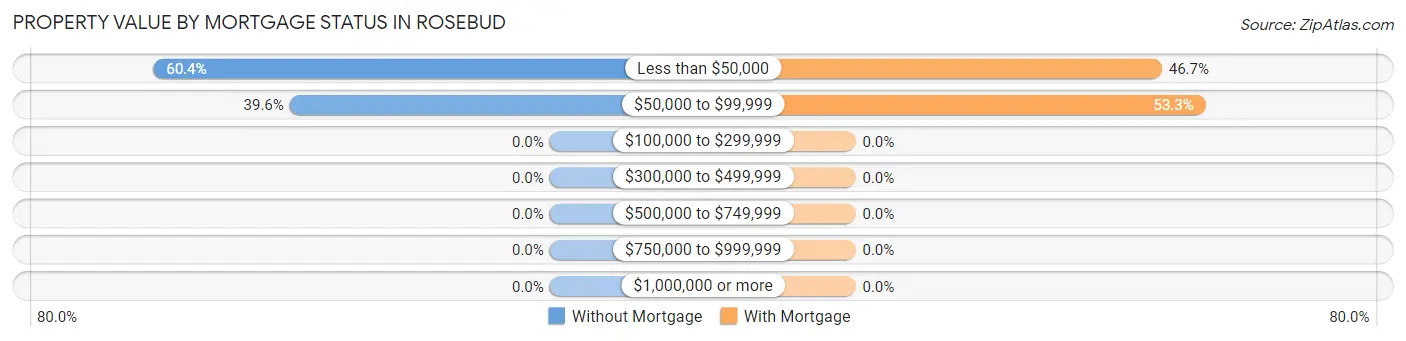
| Property Value | Without Mortgage | With Mortgage |
| Less than $50,000 | 64 (60.4%) | 7 (46.7%) |
| $50,000 to $99,999 | 42 (39.6%) | 8 (53.3%) |
| $100,000 to $299,999 | 0 (0.0%) | 0 (0.0%) |
| $300,000 to $499,999 | 0 (0.0%) | 0 (0.0%) |
| $500,000 to $749,999 | 0 (0.0%) | 0 (0.0%) |
| $750,000 to $999,999 | 0 (0.0%) | 0 (0.0%) |
| $1,000,000 or more | 0 (0.0%) | 0 (0.0%) |
| Total | 106 (100.0%) | 15 (100.0%) |
Household Income by Mortgage Status in Rosebud
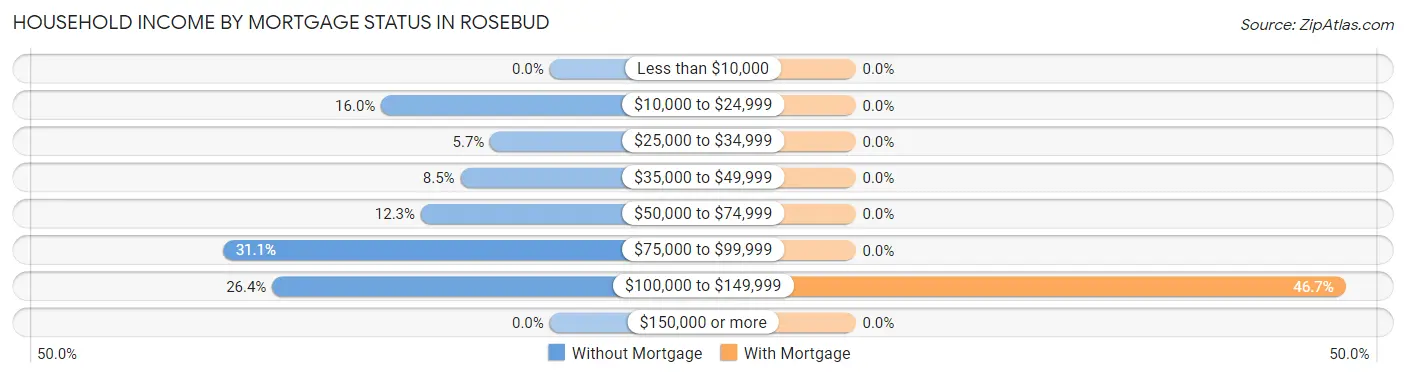
| Household Income | Without Mortgage | With Mortgage |
| Less than $10,000 | 0 (0.0%) | 0 (0.0%) |
| $10,000 to $24,999 | 17 (16.0%) | 0 (0.0%) |
| $25,000 to $34,999 | 6 (5.7%) | 0 (0.0%) |
| $35,000 to $49,999 | 9 (8.5%) | 0 (0.0%) |
| $50,000 to $74,999 | 13 (12.3%) | 0 (0.0%) |
| $75,000 to $99,999 | 33 (31.1%) | 0 (0.0%) |
| $100,000 to $149,999 | 28 (26.4%) | 7 (46.7%) |
| $150,000 or more | 0 (0.0%) | 0 (0.0%) |
| Total | 106 (100.0%) | 15 (100.0%) |
Property Value to Household Income Ratio in Rosebud
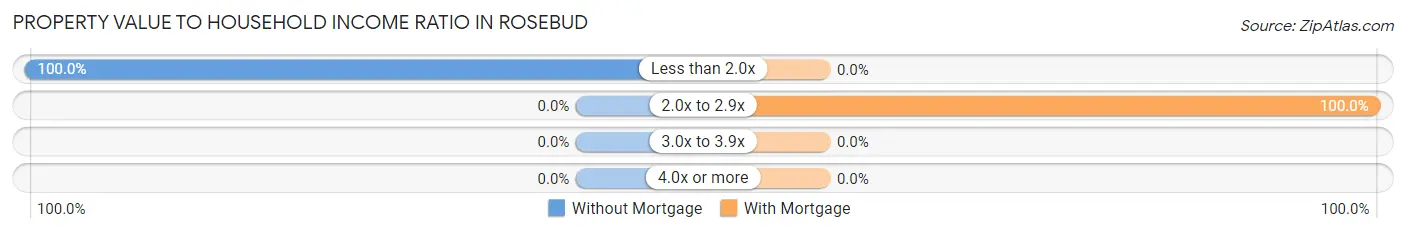
| Value-to-Income Ratio | Without Mortgage | With Mortgage |
| Less than 2.0x | 106 (100.0%) | 0 (0.0%) |
| 2.0x to 2.9x | 0 (0.0%) | 15 (100.0%) |
| 3.0x to 3.9x | 0 (0.0%) | 0 (0.0%) |
| 4.0x or more | 0 (0.0%) | 0 (0.0%) |
| Total | 106 (100.0%) | 15 (100.0%) |
Real Estate Taxes by Mortgage Status in Rosebud
| Property Taxes | Without Mortgage | With Mortgage |
| Less than $800 | 0 (0.0%) | 0 (0.0%) |
| $800 to $1,499 | 0 (0.0%) | 0 (0.0%) |
| $800 to $1,499 | 0 (0.0%) | 0 (0.0%) |
| Total | 106 (100.0%) | 15 (100.0%) |
Health & Disability in Rosebud
Health Insurance Coverage by Age in Rosebud
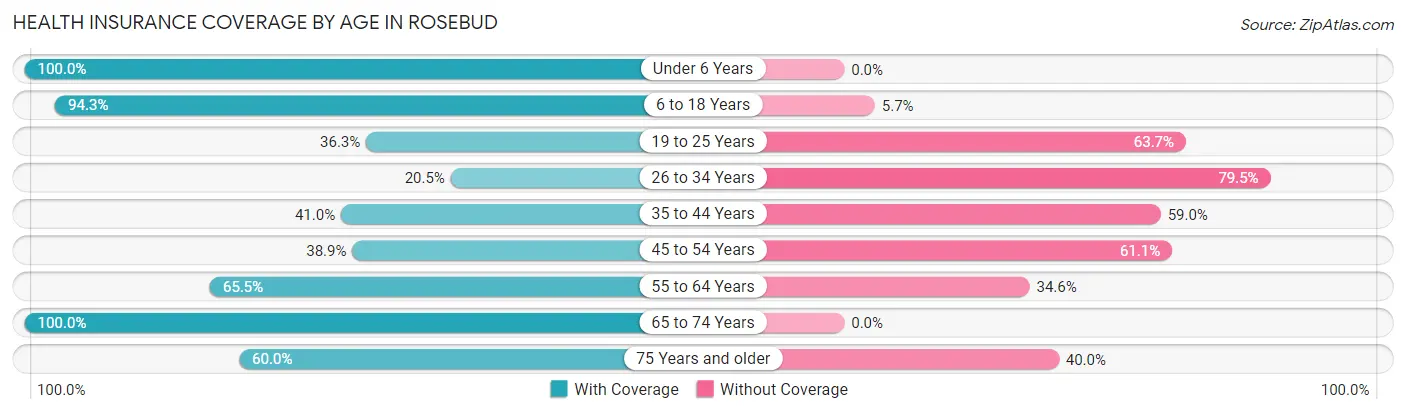
| Age Bracket | With Coverage | Without Coverage |
| Under 6 Years | 350 (100.0%) | 0 (0.0%) |
| 6 to 18 Years | 463 (94.3%) | 28 (5.7%) |
| 19 to 25 Years | 130 (36.3%) | 228 (63.7%) |
| 26 to 34 Years | 53 (20.5%) | 205 (79.5%) |
| 35 to 44 Years | 107 (41.0%) | 154 (59.0%) |
| 45 to 54 Years | 35 (38.9%) | 55 (61.1%) |
| 55 to 64 Years | 72 (65.4%) | 38 (34.5%) |
| 65 to 74 Years | 83 (100.0%) | 0 (0.0%) |
| 75 Years and older | 18 (60.0%) | 12 (40.0%) |
| Total | 1,311 (64.5%) | 720 (35.4%) |
Health Insurance Coverage by Citizenship Status in Rosebud
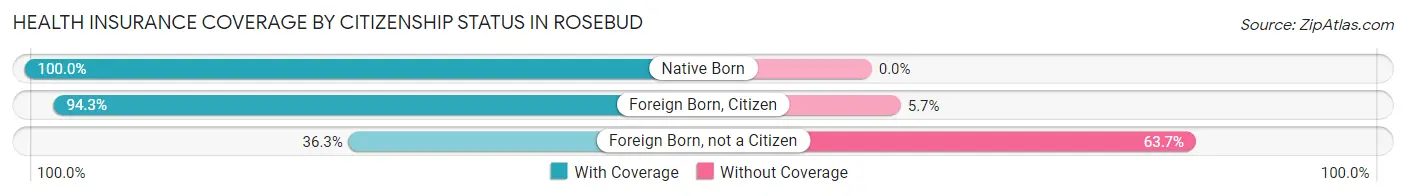
| Citizenship Status | With Coverage | Without Coverage |
| Native Born | 350 (100.0%) | 0 (0.0%) |
| Foreign Born, Citizen | 463 (94.3%) | 28 (5.7%) |
| Foreign Born, not a Citizen | 130 (36.3%) | 228 (63.7%) |
Health Insurance Coverage by Household Income in Rosebud
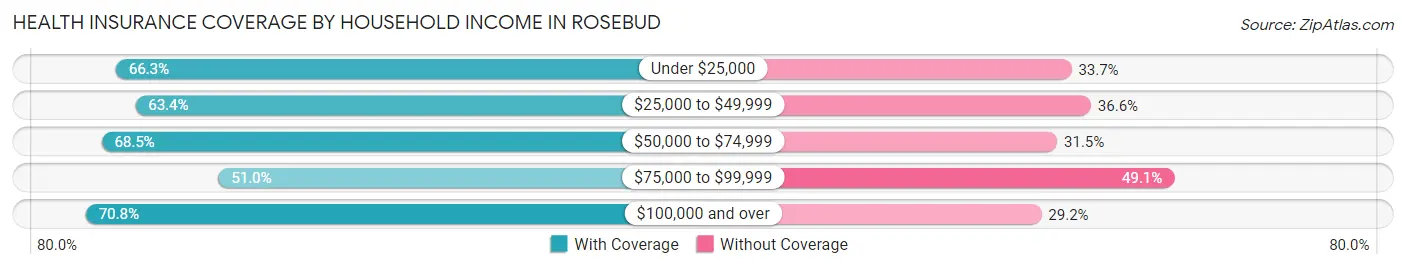
| Household Income | With Coverage | Without Coverage |
| Under $25,000 | 463 (66.3%) | 235 (33.7%) |
| $25,000 to $49,999 | 409 (63.4%) | 236 (36.6%) |
| $50,000 to $74,999 | 226 (68.5%) | 104 (31.5%) |
| $75,000 to $99,999 | 107 (50.9%) | 103 (49.0%) |
| $100,000 and over | 102 (70.8%) | 42 (29.2%) |
Public vs Private Health Insurance Coverage by Age in Rosebud
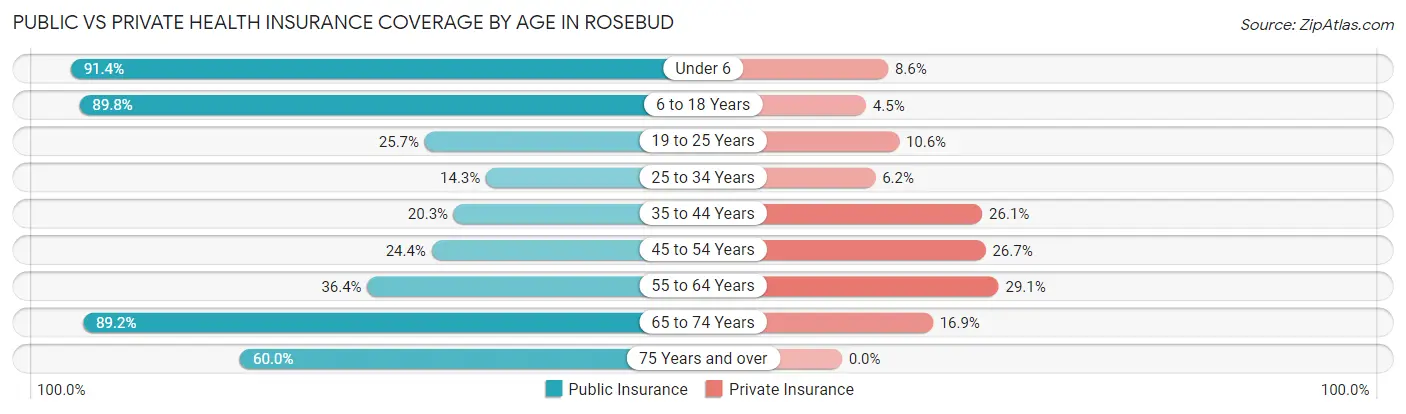
| Age Bracket | Public Insurance | Private Insurance |
| Under 6 | 320 (91.4%) | 30 (8.6%) |
| 6 to 18 Years | 441 (89.8%) | 22 (4.5%) |
| 19 to 25 Years | 92 (25.7%) | 38 (10.6%) |
| 25 to 34 Years | 37 (14.3%) | 16 (6.2%) |
| 35 to 44 Years | 53 (20.3%) | 68 (26.1%) |
| 45 to 54 Years | 22 (24.4%) | 24 (26.7%) |
| 55 to 64 Years | 40 (36.4%) | 32 (29.1%) |
| 65 to 74 Years | 74 (89.2%) | 14 (16.9%) |
| 75 Years and over | 18 (60.0%) | 0 (0.0%) |
| Total | 1,097 (54.0%) | 244 (12.0%) |
Disability Status by Sex by Age in Rosebud
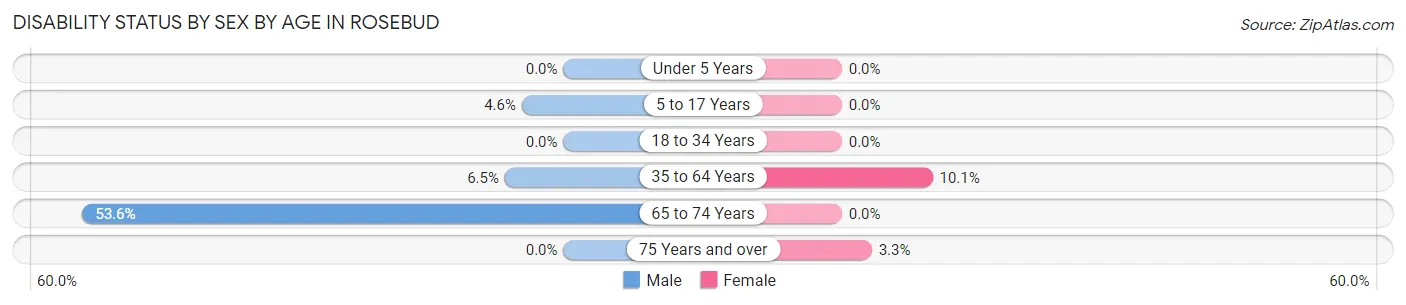
| Age Bracket | Male | Female |
| Under 5 Years | 0 (0.0%) | 0 (0.0%) |
| 5 to 17 Years | 12 (4.6%) | 0 (0.0%) |
| 18 to 34 Years | 0 (0.0%) | 0 (0.0%) |
| 35 to 64 Years | 12 (6.5%) | 28 (10.1%) |
| 65 to 74 Years | 15 (53.6%) | 0 (0.0%) |
| 75 Years and over | 0 (0.0%) | 1 (3.3%) |
Disability Class by Sex by Age in Rosebud
Disability Class: Hearing Difficulty
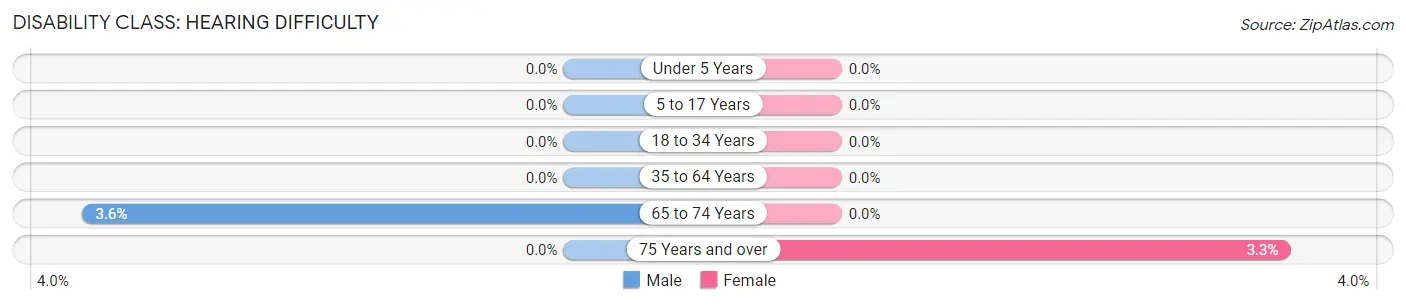
| Age Bracket | Male | Female |
| Under 5 Years | 0 (0.0%) | 0 (0.0%) |
| 5 to 17 Years | 0 (0.0%) | 0 (0.0%) |
| 18 to 34 Years | 0 (0.0%) | 0 (0.0%) |
| 35 to 64 Years | 0 (0.0%) | 0 (0.0%) |
| 65 to 74 Years | 1 (3.6%) | 0 (0.0%) |
| 75 Years and over | 0 (0.0%) | 1 (3.3%) |
Disability Class: Vision Difficulty
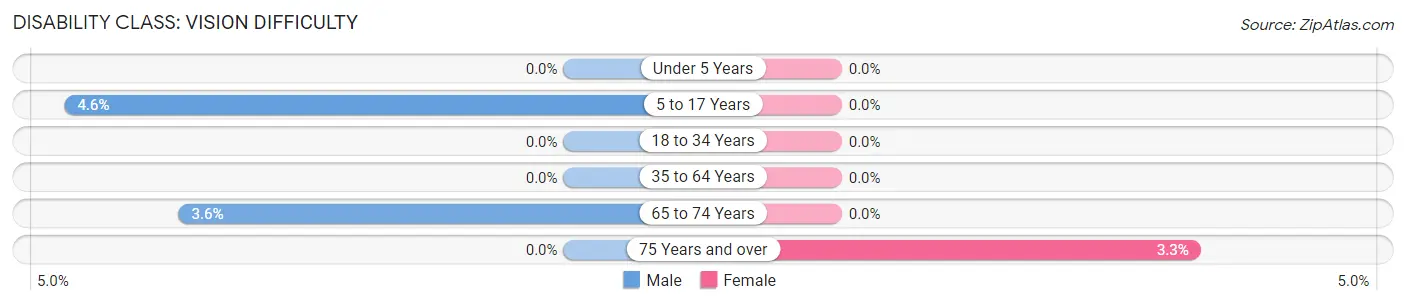
| Age Bracket | Male | Female |
| Under 5 Years | 0 (0.0%) | 0 (0.0%) |
| 5 to 17 Years | 12 (4.6%) | 0 (0.0%) |
| 18 to 34 Years | 0 (0.0%) | 0 (0.0%) |
| 35 to 64 Years | 0 (0.0%) | 0 (0.0%) |
| 65 to 74 Years | 1 (3.6%) | 0 (0.0%) |
| 75 Years and over | 0 (0.0%) | 1 (3.3%) |
Disability Class: Cognitive Difficulty
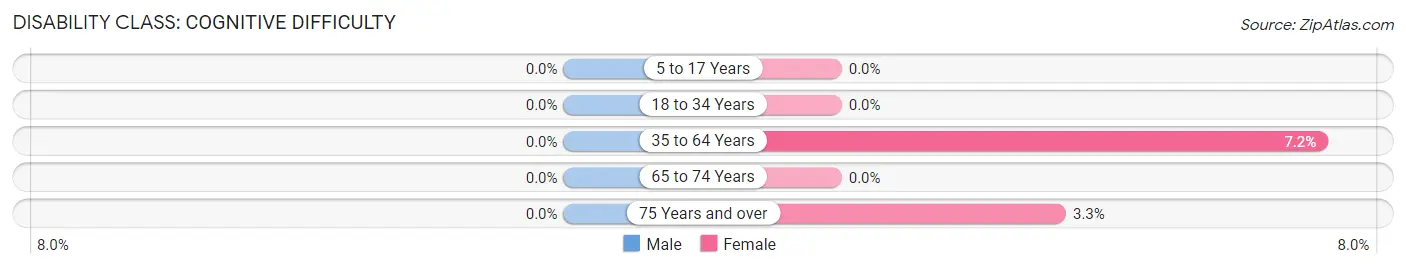
| Age Bracket | Male | Female |
| 5 to 17 Years | 0 (0.0%) | 0 (0.0%) |
| 18 to 34 Years | 0 (0.0%) | 0 (0.0%) |
| 35 to 64 Years | 0 (0.0%) | 20 (7.2%) |
| 65 to 74 Years | 0 (0.0%) | 0 (0.0%) |
| 75 Years and over | 0 (0.0%) | 1 (3.3%) |
Disability Class: Ambulatory Difficulty
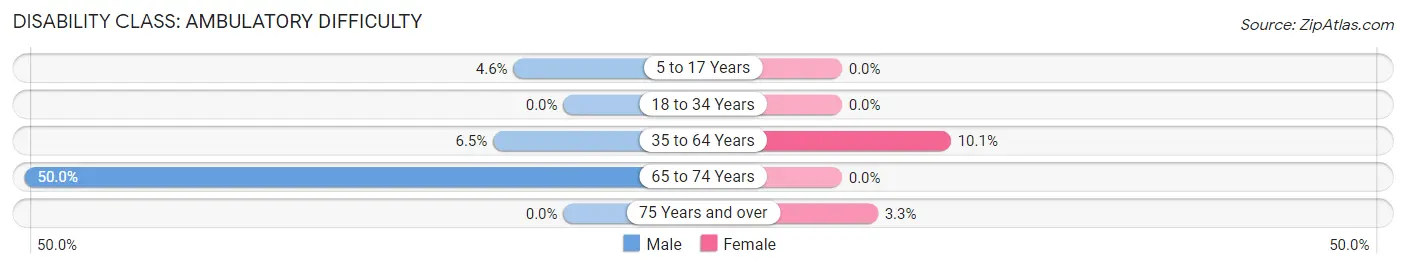
| Age Bracket | Male | Female |
| 5 to 17 Years | 12 (4.6%) | 0 (0.0%) |
| 18 to 34 Years | 0 (0.0%) | 0 (0.0%) |
| 35 to 64 Years | 12 (6.5%) | 28 (10.1%) |
| 65 to 74 Years | 14 (50.0%) | 0 (0.0%) |
| 75 Years and over | 0 (0.0%) | 1 (3.3%) |
Disability Class: Self-Care Difficulty
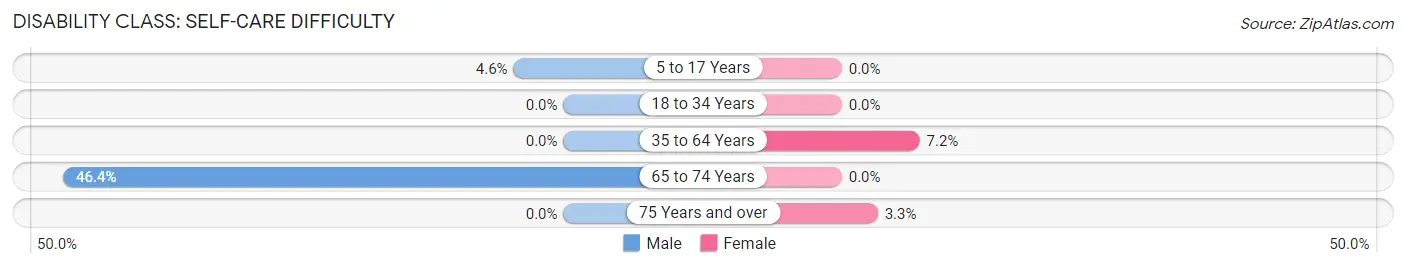
| Age Bracket | Male | Female |
| 5 to 17 Years | 12 (4.6%) | 0 (0.0%) |
| 18 to 34 Years | 0 (0.0%) | 0 (0.0%) |
| 35 to 64 Years | 0 (0.0%) | 20 (7.2%) |
| 65 to 74 Years | 13 (46.4%) | 0 (0.0%) |
| 75 Years and over | 0 (0.0%) | 1 (3.3%) |
Technology Access in Rosebud
Computing Device Access in Rosebud
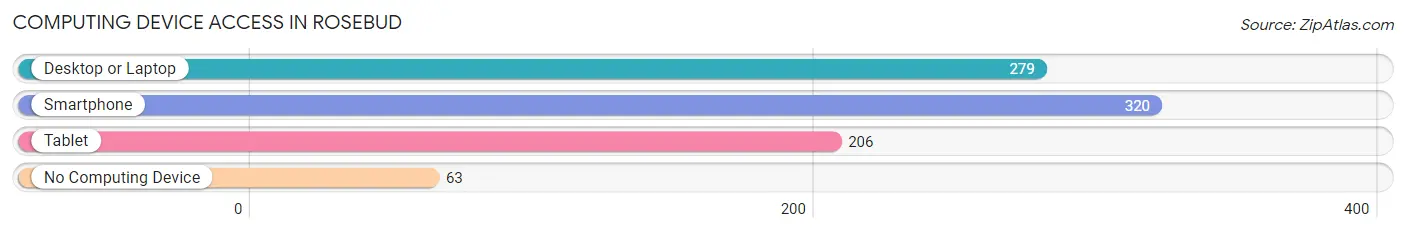
| Device Type | # Households | % Households |
| Desktop or Laptop | 279 | 70.8% |
| Smartphone | 320 | 81.2% |
| Tablet | 206 | 52.3% |
| No Computing Device | 63 | 16.0% |
| Total | 394 | 100.0% |
Internet Access in Rosebud
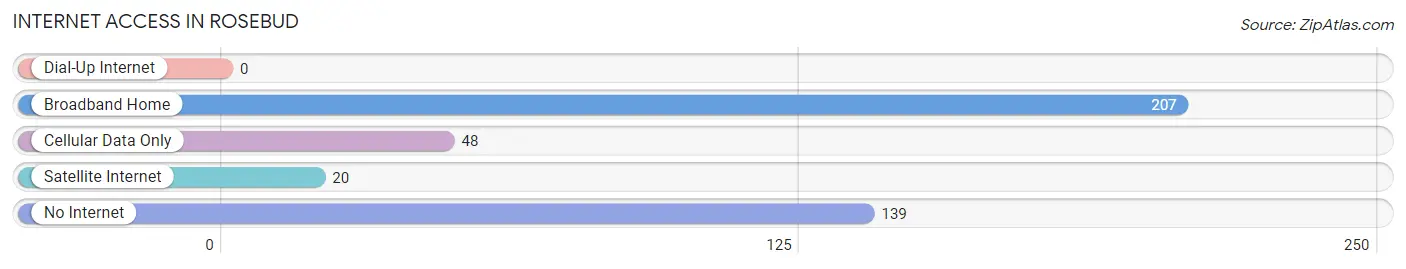
| Internet Type | # Households | % Households |
| Dial-Up Internet | 0 | 0.0% |
| Broadband Home | 207 | 52.5% |
| Cellular Data Only | 48 | 12.2% |
| Satellite Internet | 20 | 5.1% |
| No Internet | 139 | 35.3% |
| Total | 394 | 100.0% |
Rosebud Summary
Rosebud, South Dakota is a small town located in the southeastern corner of the state. It is situated in the Rosebud Indian Reservation, which is home to the Sicangu Lakota people. The town has a population of approximately 1,200 people and is the county seat of Todd County.
History
The Rosebud Indian Reservation was established in 1889 by the United States government. The reservation was created to provide a home for the Sicangu Lakota people, who had been displaced from their traditional homelands in the Great Plains. The town of Rosebud was founded in 1891 and was named after the Rosebud River, which runs through the reservation.
The town was originally a trading post and was the center of commerce for the reservation. In the early 1900s, the town began to grow and develop. The first school was built in 1906 and the first hospital was built in 1910. The town also had a post office, a bank, and a newspaper.
In the 1950s, the town began to decline as the reservation's population decreased. The town was nearly abandoned by the 1970s, but it has since seen a resurgence in population and development.
Geography
Rosebud is located in the southeastern corner of South Dakota, in the Rosebud Indian Reservation. The town is situated on the Rosebud River, which is a tributary of the Missouri River. The town is surrounded by rolling hills and prairies.
The climate in Rosebud is semi-arid, with hot summers and cold winters. The average annual temperature is around 50 degrees Fahrenheit. The average annual precipitation is around 17 inches.
Economy
The economy of Rosebud is largely based on agriculture and tourism. The town is home to several farms and ranches, which produce a variety of crops and livestock. The town is also home to several tourist attractions, including the Rosebud Casino and the Rosebud Sioux Tribal Museum.
The town is also home to several businesses, including a grocery store, a hardware store, and a gas station. The town also has a post office, a bank, and a newspaper.
Demographics
As of the 2010 census, the population of Rosebud was 1,200. The racial makeup of the town was 95.3% Native American, 2.3% White, 0.3% African American, 0.2% Asian, and 1.9% from other races.
The median household income in Rosebud was $25,000, and the median family income was $30,000. The per capita income was $13,000. The unemployment rate was 11.3%.
The town is served by the Rosebud Sioux Tribal School District, which includes two elementary schools, a middle school, and a high school. The town is also home to the Rosebud Sioux Tribal College, which offers a variety of degree and certificate programs.
Common Questions
What is Per Capita Income in Rosebud?
Per Capita income in Rosebud is $10,635.
What is the Median Family Income in Rosebud?
Median Family Income in Rosebud is $39,438.
What is the Median Household income in Rosebud?
Median Household Income in Rosebud is $47,813.
What is Inequality or Gini Index in Rosebud?
Inequality or Gini Index in Rosebud is 0.44.
What is the Total Population of Rosebud?
Total Population of Rosebud is 2,155.
What is the Total Male Population of Rosebud?
Total Male Population of Rosebud is 1,039.
What is the Total Female Population of Rosebud?
Total Female Population of Rosebud is 1,116.
What is the Ratio of Males per 100 Females in Rosebud?
There are 93.10 Males per 100 Females in Rosebud.
What is the Ratio of Females per 100 Males in Rosebud?
There are 107.41 Females per 100 Males in Rosebud.
What is the Median Population Age in Rosebud?
Median Population Age in Rosebud is 23.3 Years.
What is the Average Family Size in Rosebud
Average Family Size in Rosebud is 7.0 People.
What is the Average Household Size in Rosebud
Average Household Size in Rosebud is 5.1 People.
How Large is the Labor Force in Rosebud?
There are 684 People in the Labor Forcein in Rosebud.
What is the Percentage of People in the Labor Force in Rosebud?
48.8% of People are in the Labor Force in Rosebud.
What is the Unemployment Rate in Rosebud?
Unemployment Rate in Rosebud is 19.8%.