Zip Codes with the Highest Percentage of Population Employed in Security & Protection in South Dakota
RELATED REPORTS & OPTIONS
Security & Protection
South Dakota
Compare Zip Codes
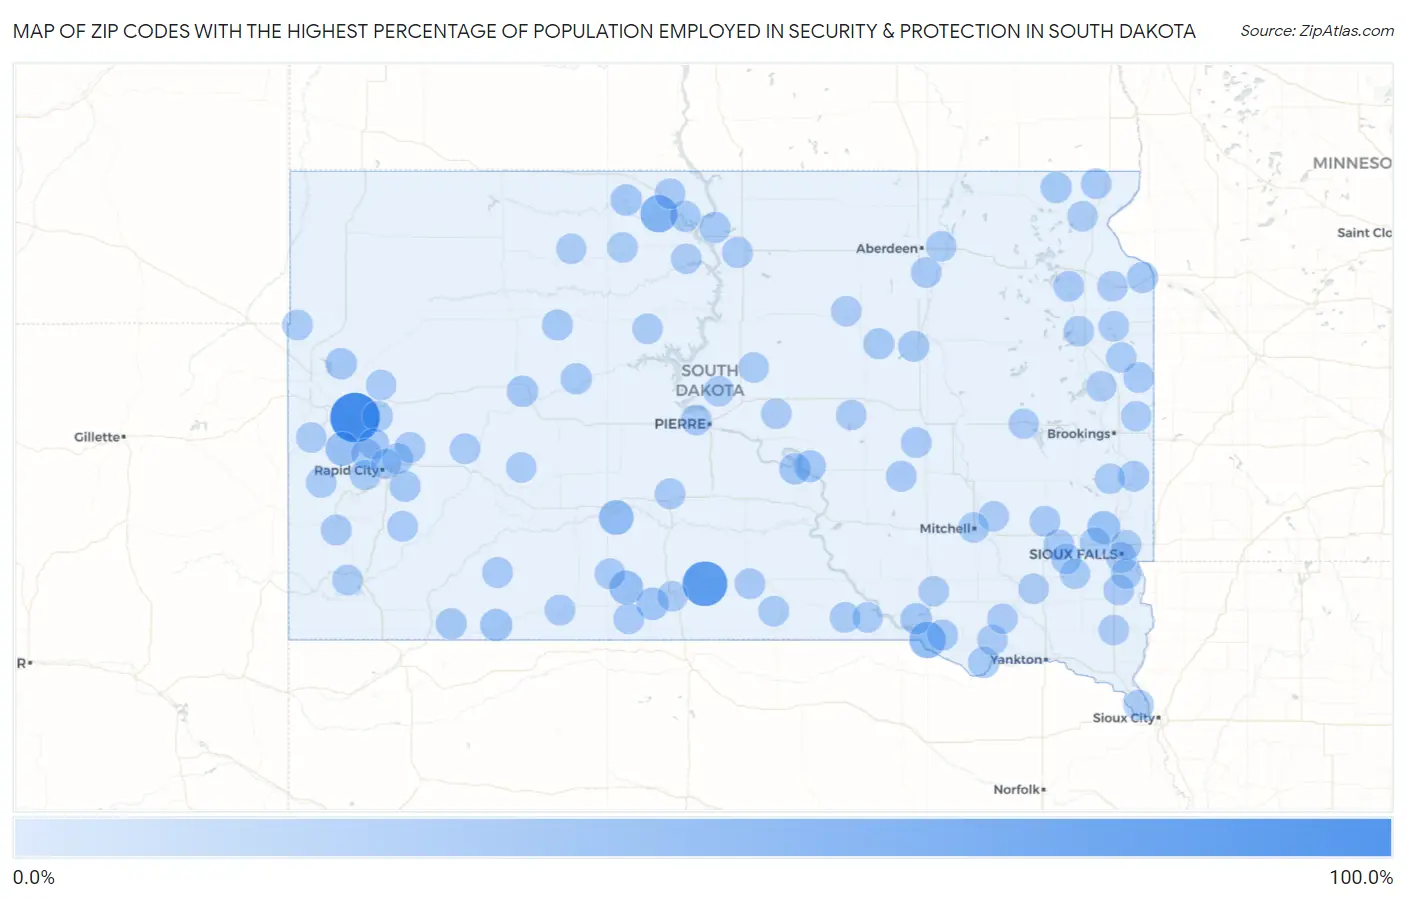
Map of Zip Codes with the Highest Percentage of Population Employed in Security & Protection in South Dakota
0.0%
100.0%
Zip Codes with the Highest Percentage of Population Employed in Security & Protection in South Dakota
| Zip Code | % Employed | vs State | vs National | |
| 1. | 57741 | 98.1% | 1.8%(+96.4)#1 | 2.1%(+96.0)#15 |
| 2. | 57563 | 73.3% | 1.8%(+71.6)#2 | 2.1%(+71.2)#20 |
| 3. | 57639 | 35.7% | 1.8%(+34.0)#3 | 2.1%(+33.6)#68 |
| 4. | 57361 | 31.0% | 1.8%(+29.3)#4 | 2.1%(+28.9)#90 |
| 5. | 57521 | 23.1% | 1.8%(+21.3)#5 | 2.1%(+20.9)#145 |
| 6. | 57759 | 19.1% | 1.8%(+17.3)#6 | 2.1%(+16.9)#223 |
| 7. | 57566 | 18.6% | 1.8%(+16.8)#7 | 2.1%(+16.4)#234 |
| 8. | 57041 | 14.6% | 1.8%(+12.9)#8 | 2.1%(+12.5)#382 |
| 9. | 57570 | 11.2% | 1.8%(+9.44)#9 | 2.1%(+9.05)#626 |
| 10. | 57716 | 10.8% | 1.8%(+9.08)#10 | 2.1%(+8.69)#662 |
| 11. | 57339 | 8.3% | 1.8%(+6.53)#11 | 2.1%(+6.14)#1,077 |
| 12. | 57548 | 7.5% | 1.8%(+5.75)#12 | 2.1%(+5.36)#1,328 |
| 13. | 57356 | 7.3% | 1.8%(+5.51)#13 | 2.1%(+5.12)#1,413 |
| 14. | 57621 | 7.0% | 1.8%(+5.22)#14 | 2.1%(+4.83)#1,542 |
| 15. | 57762 | 6.7% | 1.8%(+4.91)#15 | 2.1%(+4.52)#1,703 |
| 16. | 57748 | 6.6% | 1.8%(+4.82)#16 | 2.1%(+4.43)#1,745 |
| 17. | 57062 | 6.4% | 1.8%(+4.65)#17 | 2.1%(+4.26)#1,827 |
| 18. | 57270 | 6.3% | 1.8%(+4.56)#18 | 2.1%(+4.17)#1,892 |
| 19. | 57622 | 6.2% | 1.8%(+4.40)#19 | 2.1%(+4.01)#1,984 |
| 20. | 57770 | 5.7% | 1.8%(+3.95)#20 | 2.1%(+3.56)#2,283 |
| 21. | 57631 | 5.6% | 1.8%(+3.86)#21 | 2.1%(+3.47)#2,358 |
| 22. | 57703 | 5.4% | 1.8%(+3.64)#22 | 2.1%(+3.25)#2,543 |
| 23. | 57216 | 5.3% | 1.8%(+3.58)#23 | 2.1%(+3.19)#2,600 |
| 24. | 57658 | 5.1% | 1.8%(+3.33)#24 | 2.1%(+2.94)#2,826 |
| 25. | 57706 | 5.0% | 1.8%(+3.23)#25 | 2.1%(+2.84)#2,943 |
| 26. | 57623 | 4.9% | 1.8%(+3.10)#26 | 2.1%(+2.71)#3,098 |
| 27. | 57469 | 4.8% | 1.8%(+3.08)#27 | 2.1%(+2.69)#3,122 |
| 28. | 57380 | 4.8% | 1.8%(+3.00)#28 | 2.1%(+2.61)#3,223 |
| 29. | 57470 | 4.7% | 1.8%(+2.89)#29 | 2.1%(+2.50)#3,368 |
| 30. | 57472 | 4.6% | 1.8%(+2.80)#30 | 2.1%(+2.41)#3,514 |
| 31. | 57012 | 4.1% | 1.8%(+2.38)#31 | 2.1%(+1.99)#4,242 |
| 32. | 57058 | 4.0% | 1.8%(+2.29)#32 | 2.1%(+1.90)#4,404 |
| 33. | 57785 | 4.0% | 1.8%(+2.21)#33 | 2.1%(+1.82)#4,547 |
| 34. | 57382 | 3.8% | 1.8%(+2.06)#34 | 2.1%(+1.67)#4,865 |
| 35. | 57730 | 3.7% | 1.8%(+1.96)#35 | 2.1%(+1.57)#5,096 |
| 36. | 57719 | 3.7% | 1.8%(+1.95)#36 | 2.1%(+1.56)#5,123 |
| 37. | 57560 | 3.7% | 1.8%(+1.95)#37 | 2.1%(+1.56)#5,139 |
| 38. | 57769 | 3.6% | 1.8%(+1.83)#38 | 2.1%(+1.44)#5,443 |
| 39. | 57752 | 3.6% | 1.8%(+1.80)#39 | 2.1%(+1.41)#5,522 |
| 40. | 57559 | 3.5% | 1.8%(+1.78)#40 | 2.1%(+1.39)#5,562 |
| 41. | 57255 | 3.5% | 1.8%(+1.71)#41 | 2.1%(+1.31)#5,774 |
| 42. | 57572 | 3.4% | 1.8%(+1.67)#42 | 2.1%(+1.28)#5,855 |
| 43. | 57028 | 3.4% | 1.8%(+1.65)#43 | 2.1%(+1.26)#5,910 |
| 44. | 57551 | 3.4% | 1.8%(+1.63)#44 | 2.1%(+1.24)#5,986 |
| 45. | 57747 | 3.4% | 1.8%(+1.61)#45 | 2.1%(+1.22)#6,028 |
| 46. | 57791 | 3.3% | 1.8%(+1.58)#46 | 2.1%(+1.18)#6,152 |
| 47. | 57532 | 3.3% | 1.8%(+1.54)#47 | 2.1%(+1.15)#6,257 |
| 48. | 57744 | 3.3% | 1.8%(+1.52)#48 | 2.1%(+1.13)#6,325 |
| 49. | 57256 | 3.2% | 1.8%(+1.47)#49 | 2.1%(+1.08)#6,480 |
| 50. | 57379 | 3.1% | 1.8%(+1.37)#50 | 2.1%(+0.977)#6,807 |
| 51. | 57642 | 3.0% | 1.8%(+1.29)#51 | 2.1%(+0.901)#7,043 |
| 52. | 57528 | 3.0% | 1.8%(+1.24)#52 | 2.1%(+0.849)#7,238 |
| 53. | 57580 | 3.0% | 1.8%(+1.24)#53 | 2.1%(+0.847)#7,249 |
| 54. | 57218 | 2.9% | 1.8%(+1.17)#54 | 2.1%(+0.778)#7,528 |
| 55. | 57538 | 2.9% | 1.8%(+1.16)#55 | 2.1%(+0.771)#7,556 |
| 56. | 57717 | 2.9% | 1.8%(+1.14)#56 | 2.1%(+0.746)#7,673 |
| 57. | 57197 | 2.9% | 1.8%(+1.12)#57 | 2.1%(+0.729)#7,737 |
| 58. | 57479 | 2.8% | 1.8%(+1.08)#58 | 2.1%(+0.692)#7,912 |
| 59. | 57625 | 2.8% | 1.8%(+1.05)#59 | 2.1%(+0.660)#8,081 |
| 60. | 57265 | 2.8% | 1.8%(+1.02)#60 | 2.1%(+0.629)#8,213 |
| 61. | 57201 | 2.8% | 1.8%(+1.00)#61 | 2.1%(+0.612)#8,272 |
| 62. | 57718 | 2.7% | 1.8%(+0.963)#62 | 2.1%(+0.572)#8,439 |
| 63. | 57077 | 2.7% | 1.8%(+0.960)#63 | 2.1%(+0.569)#8,457 |
| 64. | 57427 | 2.7% | 1.8%(+0.953)#64 | 2.1%(+0.562)#8,481 |
| 65. | 57656 | 2.7% | 1.8%(+0.930)#65 | 2.1%(+0.540)#8,592 |
| 66. | 57601 | 2.6% | 1.8%(+0.851)#66 | 2.1%(+0.460)#8,965 |
| 67. | 57555 | 2.6% | 1.8%(+0.837)#67 | 2.1%(+0.446)#9,029 |
| 68. | 57066 | 2.5% | 1.8%(+0.789)#68 | 2.1%(+0.398)#9,268 |
| 69. | 57269 | 2.5% | 1.8%(+0.785)#69 | 2.1%(+0.394)#9,293 |
| 70. | 57029 | 2.5% | 1.8%(+0.782)#70 | 2.1%(+0.391)#9,305 |
| 71. | 57745 | 2.5% | 1.8%(+0.765)#71 | 2.1%(+0.374)#9,393 |
| 72. | 57438 | 2.5% | 1.8%(+0.753)#72 | 2.1%(+0.362)#9,458 |
| 73. | 57536 | 2.5% | 1.8%(+0.742)#73 | 2.1%(+0.352)#9,506 |
| 74. | 57262 | 2.5% | 1.8%(+0.739)#74 | 2.1%(+0.348)#9,527 |
| 75. | 57754 | 2.4% | 1.8%(+0.688)#75 | 2.1%(+0.297)#9,816 |
| 76. | 57564 | 2.4% | 1.8%(+0.687)#76 | 2.1%(+0.296)#9,824 |
| 77. | 57340 | 2.4% | 1.8%(+0.623)#77 | 2.1%(+0.233)#10,159 |
| 78. | 57501 | 2.3% | 1.8%(+0.567)#78 | 2.1%(+0.177)#10,498 |
| 79. | 57017 | 2.3% | 1.8%(+0.534)#79 | 2.1%(+0.144)#10,692 |
| 80. | 57276 | 2.3% | 1.8%(+0.515)#80 | 2.1%(+0.124)#10,810 |
| 81. | 57059 | 2.2% | 1.8%(+0.489)#81 | 2.1%(+0.099)#10,959 |
| 82. | 57038 | 2.2% | 1.8%(+0.441)#82 | 2.1%(+0.051)#11,261 |
| 83. | 57317 | 2.2% | 1.8%(+0.432)#83 | 2.1%(+0.041)#11,318 |
| 84. | 57226 | 2.1% | 1.8%(+0.380)#84 | 2.1%(-0.011)#11,643 |
| 85. | 57004 | 2.1% | 1.8%(+0.328)#85 | 2.1%(-0.063)#12,003 |
| 86. | 57047 | 2.1% | 1.8%(+0.325)#86 | 2.1%(-0.065)#12,028 |
| 87. | 57301 | 2.1% | 1.8%(+0.298)#87 | 2.1%(-0.092)#12,207 |
| 88. | 57775 | 2.0% | 1.8%(+0.242)#88 | 2.1%(-0.148)#12,561 |
| 89. | 57033 | 2.0% | 1.8%(+0.206)#89 | 2.1%(-0.184)#12,790 |
| 90. | 57053 | 1.9% | 1.8%(+0.192)#90 | 2.1%(-0.199)#12,885 |
| 91. | 57032 | 1.9% | 1.8%(+0.190)#91 | 2.1%(-0.200)#12,894 |
| 92. | 57702 | 1.9% | 1.8%(+0.174)#92 | 2.1%(-0.216)#13,007 |
| 93. | 57362 | 1.9% | 1.8%(+0.145)#93 | 2.1%(-0.245)#13,198 |
| 94. | 57788 | 1.9% | 1.8%(+0.143)#94 | 2.1%(-0.247)#13,213 |
| 95. | 57701 | 1.9% | 1.8%(+0.111)#95 | 2.1%(-0.279)#13,443 |
| 96. | 57633 | 1.8% | 1.8%(+0.044)#96 | 2.1%(-0.347)#13,935 |
| 97. | 57231 | 1.8% | 1.8%(+0.005)#97 | 2.1%(-0.386)#14,208 |
| 98. | 57234 | 1.7% | 1.8%(-0.011)#98 | 2.1%(-0.402)#14,332 |
| 99. | 57313 | 1.7% | 1.8%(-0.016)#99 | 2.1%(-0.406)#14,374 |
| 100. | 57104 | 1.7% | 1.8%(-0.025)#100 | 2.1%(-0.415)#14,433 |
Common Questions
What are the Top 10 Zip Codes with the Highest Percentage of Population Employed in Security & Protection in South Dakota?
Top 10 Zip Codes with the Highest Percentage of Population Employed in Security & Protection in South Dakota are:
What zip code has the Highest Percentage of Population Employed in Security & Protection in South Dakota?
57741 has the Highest Percentage of Population Employed in Security & Protection in South Dakota with 98.1%.
What is the Percentage of Population Employed in Security & Protection in the State of South Dakota?
Percentage of Population Employed in Security & Protection in South Dakota is 1.8%.
What is the Percentage of Population Employed in Security & Protection in the United States?
Percentage of Population Employed in Security & Protection in the United States is 2.1%.