Spearfish, SD Map & Demographics
Spearfish Map
Spearfish Overview
$44,700
PER CAPITA INCOME
$89,812
AVG FAMILY INCOME
$58,734
AVG HOUSEHOLD INCOME
37.5%
WAGE / INCOME GAP [ % ]
62.5¢/ $1
WAGE / INCOME GAP [ $ ]
$7,713
FAMILY INCOME DEFICIT
0.50
INEQUALITY / GINI INDEX
12,268
TOTAL POPULATION
5,856
MALE POPULATION
6,412
FEMALE POPULATION
91.33
MALES / 100 FEMALES
109.49
FEMALES / 100 MALES
38.4
MEDIAN AGE
2.9
AVG FAMILY SIZE
2.1
AVG HOUSEHOLD SIZE
6,626
LABOR FORCE [ PEOPLE ]
64.2%
PERCENT IN LABOR FORCE
2.3%
UNEMPLOYMENT RATE
Spearfish Area Codes
Income in Spearfish
Income Overview in Spearfish
Per Capita Income in Spearfish is $44,700, while median incomes of families and households are $89,812 and $58,734 respectively.
| Characteristic | Number | Measure |
| Per Capita Income | 12,268 | $44,700 |
| Median Family Income | 2,570 | $89,812 |
| Mean Family Income | 2,570 | $132,771 |
| Median Household Income | 5,556 | $58,734 |
| Mean Household Income | 5,556 | $89,229 |
| Income Deficit | 2,570 | $7,713 |
| Wage / Income Gap (%) | 12,268 | 37.45% |
| Wage / Income Gap ($) | 12,268 | 62.55¢ per $1 |
| Gini / Inequality Index | 12,268 | 0.50 |
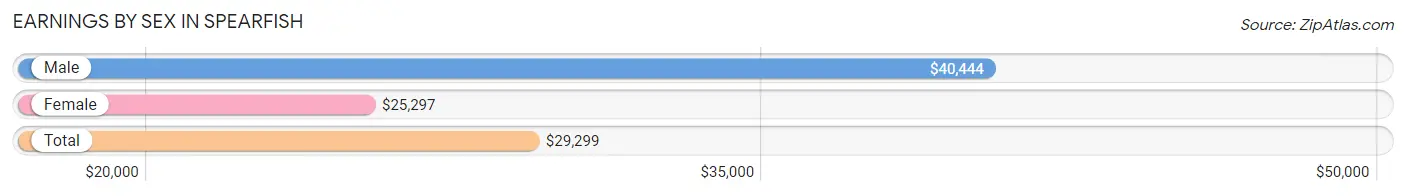
Earnings by Sex in Spearfish
Average Earnings in Spearfish are $29,299, $40,444 for men and $25,297 for women, a difference of 37.4%.
| Sex | Number | Average Earnings |
| Male | 3,394 (46.0%) | $40,444 |
| Female | 3,986 (54.0%) | $25,297 |
| Total | 7,380 (100.0%) | $29,299 |
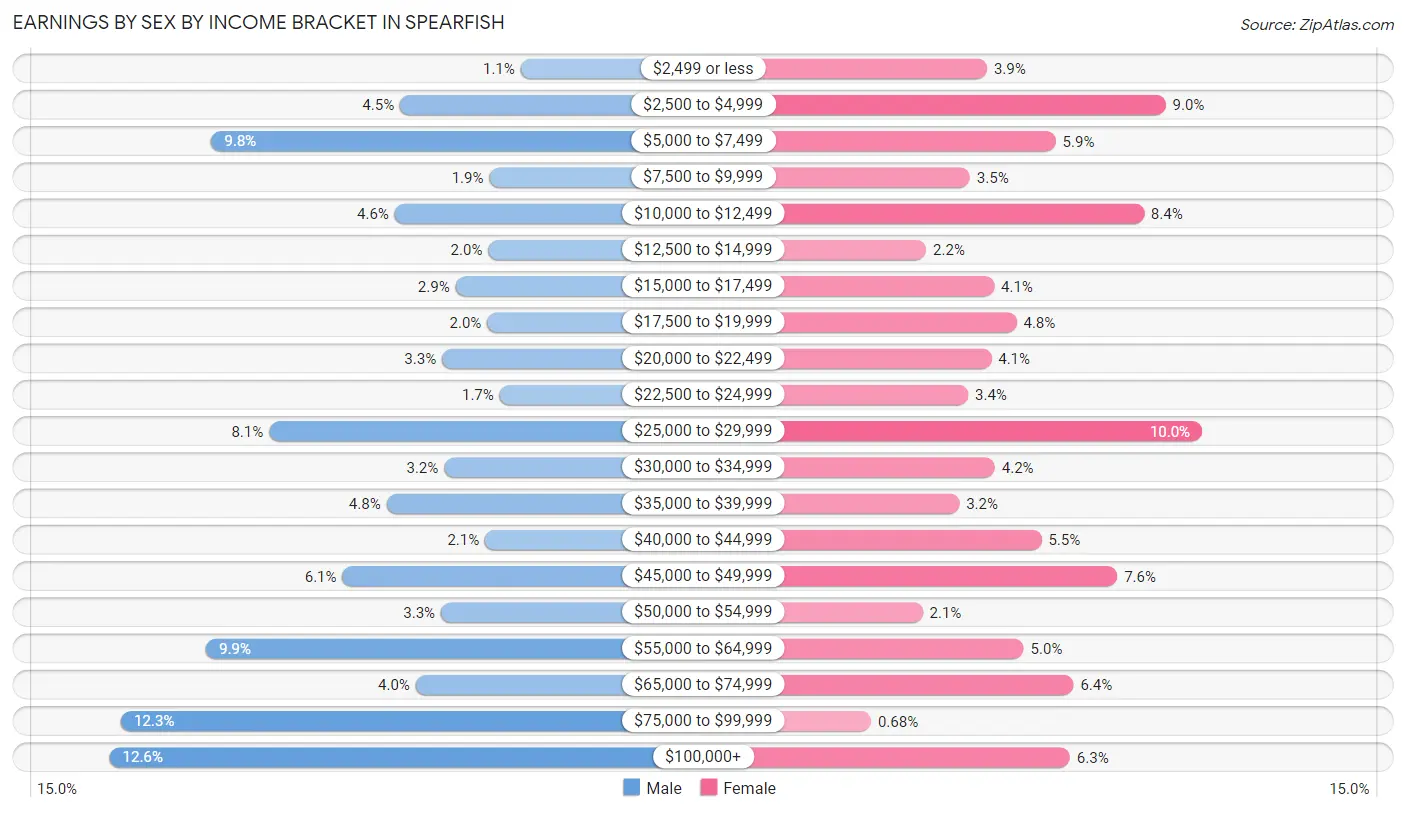
Earnings by Sex by Income Bracket in Spearfish
The most common earnings brackets in Spearfish are $100,000+ for men (428 | 12.6%) and $25,000 to $29,999 for women (398 | 10.0%).
| Income | Male | Female |
| $2,499 or less | 36 (1.1%) | 157 (3.9%) |
| $2,500 to $4,999 | 151 (4.4%) | 357 (9.0%) |
| $5,000 to $7,499 | 331 (9.8%) | 234 (5.9%) |
| $7,500 to $9,999 | 66 (1.9%) | 138 (3.5%) |
| $10,000 to $12,499 | 156 (4.6%) | 333 (8.4%) |
| $12,500 to $14,999 | 67 (2.0%) | 89 (2.2%) |
| $15,000 to $17,499 | 98 (2.9%) | 165 (4.1%) |
| $17,500 to $19,999 | 68 (2.0%) | 190 (4.8%) |
| $20,000 to $22,499 | 111 (3.3%) | 162 (4.1%) |
| $22,500 to $24,999 | 56 (1.7%) | 136 (3.4%) |
| $25,000 to $29,999 | 276 (8.1%) | 398 (10.0%) |
| $30,000 to $34,999 | 109 (3.2%) | 166 (4.2%) |
| $35,000 to $39,999 | 164 (4.8%) | 126 (3.2%) |
| $40,000 to $44,999 | 70 (2.1%) | 218 (5.5%) |
| $45,000 to $49,999 | 206 (6.1%) | 303 (7.6%) |
| $50,000 to $54,999 | 112 (3.3%) | 85 (2.1%) |
| $55,000 to $64,999 | 336 (9.9%) | 198 (5.0%) |
| $65,000 to $74,999 | 136 (4.0%) | 254 (6.4%) |
| $75,000 to $99,999 | 417 (12.3%) | 27 (0.7%) |
| $100,000+ | 428 (12.6%) | 250 (6.3%) |
| Total | 3,394 (100.0%) | 3,986 (100.0%) |
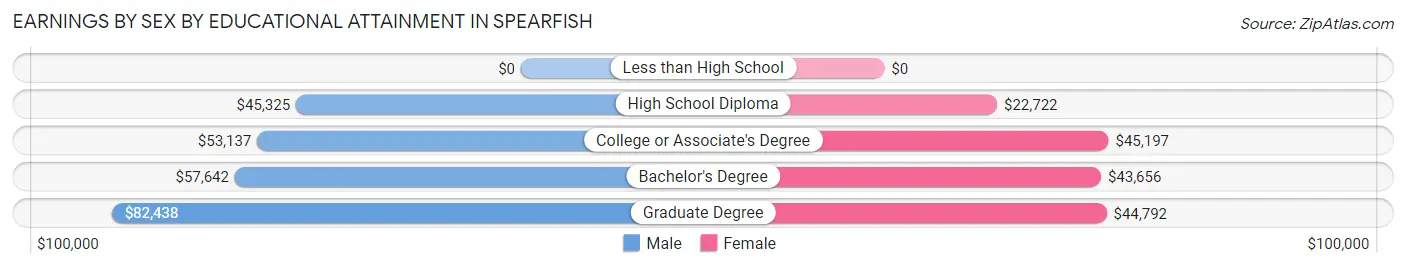
Earnings by Sex by Educational Attainment in Spearfish
Average earnings in Spearfish are $52,090 for men and $39,036 for women, a difference of 25.1%. Men with an educational attainment of graduate degree enjoy the highest average annual earnings of $82,438, while those with high school diploma education earn the least with $45,325. Women with an educational attainment of college or associate's degree earn the most with the average annual earnings of $45,197, while those with high school diploma education have the smallest earnings of $22,722.
| Educational Attainment | Male Income | Female Income |
| Less than High School | - | - |
| High School Diploma | $45,325 | $22,722 |
| College or Associate's Degree | $53,137 | $45,197 |
| Bachelor's Degree | $57,642 | $43,656 |
| Graduate Degree | $82,438 | $44,792 |
| Total | $52,090 | $39,036 |
Family Income in Spearfish
Family Income Brackets in Spearfish
According to the Spearfish family income data, there are 658 families falling into the $100,000 to $149,999 income range, which is the most common income bracket and makes up 25.6% of all families. Conversely, the $10,000 to $14,999 income bracket is the least frequent group with only 21 families (0.8%) belonging to this category.
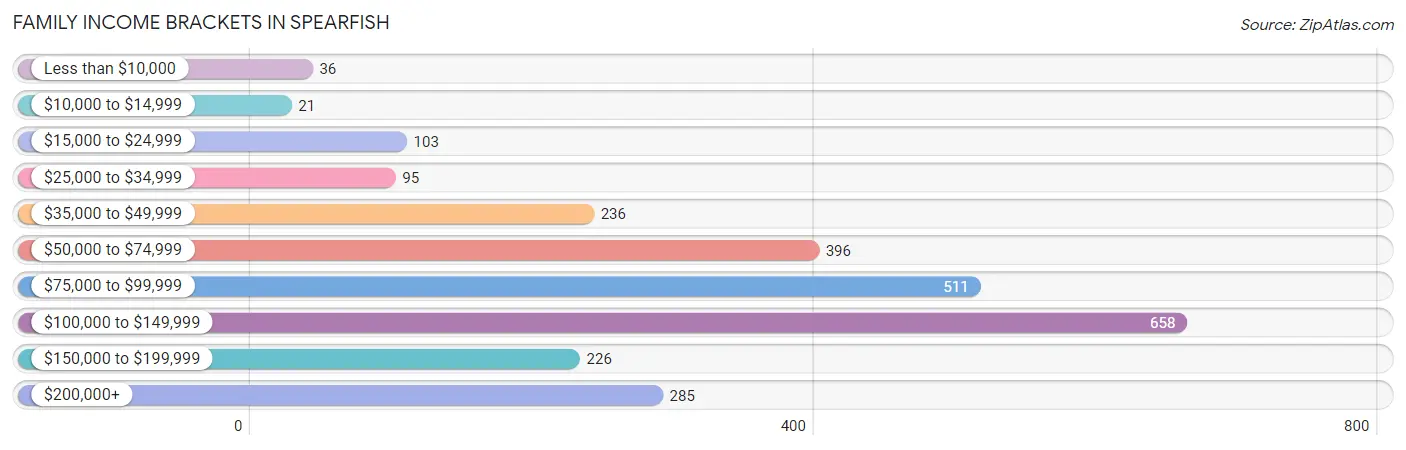
| Income Bracket | # Families | % Families |
| Less than $10,000 | 36 | 1.4% |
| $10,000 to $14,999 | 21 | 0.8% |
| $15,000 to $24,999 | 103 | 4.0% |
| $25,000 to $34,999 | 95 | 3.7% |
| $35,000 to $49,999 | 236 | 9.2% |
| $50,000 to $74,999 | 396 | 15.4% |
| $75,000 to $99,999 | 511 | 19.9% |
| $100,000 to $149,999 | 658 | 25.6% |
| $150,000 to $199,999 | 226 | 8.8% |
| $200,000+ | 285 | 11.1% |
Family Income by Famaliy Size in Spearfish
5-person families (213 | 8.3%) account for the highest median family income in Spearfish with $150,651 per family, while 2-person families (1,501 | 58.4%) have the highest median income of $41,858 per family member.
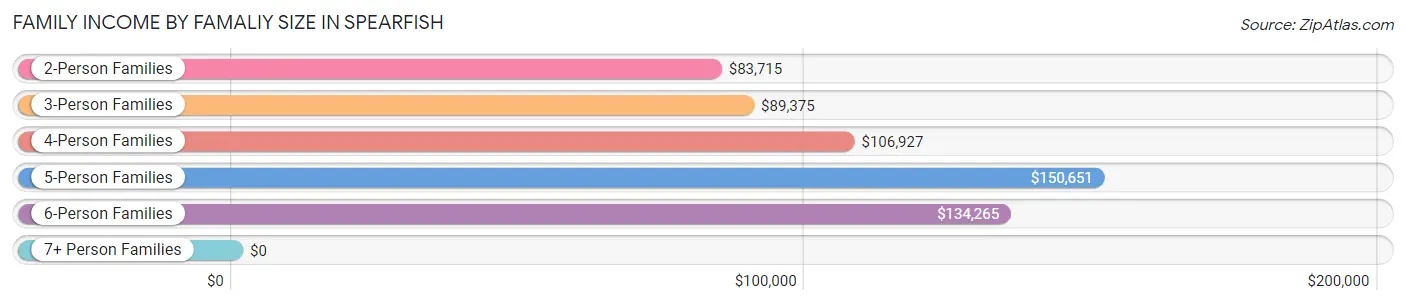
| Income Bracket | # Families | Median Income |
| 2-Person Families | 1,501 (58.4%) | $83,715 |
| 3-Person Families | 525 (20.4%) | $89,375 |
| 4-Person Families | 281 (10.9%) | $106,927 |
| 5-Person Families | 213 (8.3%) | $150,651 |
| 6-Person Families | 24 (0.9%) | $134,265 |
| 7+ Person Families | 26 (1.0%) | $0 |
| Total | 2,570 (100.0%) | $89,812 |
Family Income by Number of Earners in Spearfish
The median family income in Spearfish is $89,812, with families comprising 3+ earners (268) having the highest median family income of $133,929, while families with 1 earner (582) have the lowest median family income of $64,333, accounting for 10.4% and 22.7% of families, respectively.
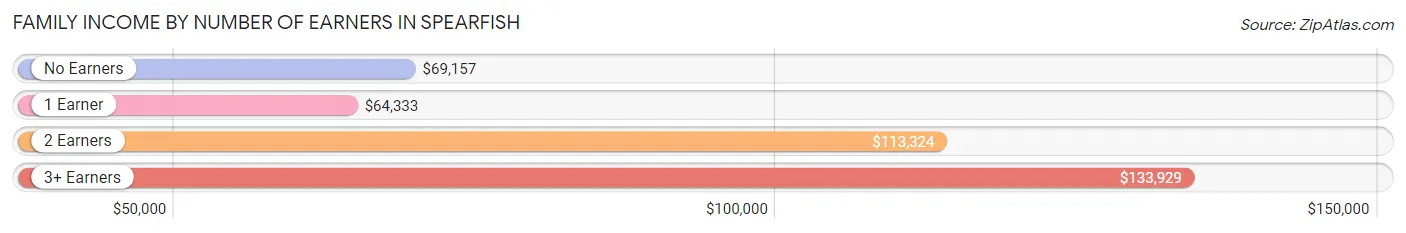
| Number of Earners | # Families | Median Income |
| No Earners | 611 (23.8%) | $69,157 |
| 1 Earner | 582 (22.7%) | $64,333 |
| 2 Earners | 1,109 (43.1%) | $113,324 |
| 3+ Earners | 268 (10.4%) | $133,929 |
| Total | 2,570 (100.0%) | $89,812 |
Household Income in Spearfish
Household Income Brackets in Spearfish
With 933 households falling in the category, the $50,000 to $74,999 income range is the most frequent in Spearfish, accounting for 16.8% of all households. In contrast, only 144 households (2.6%) fall into the less than $10,000 income bracket, making it the least populous group.
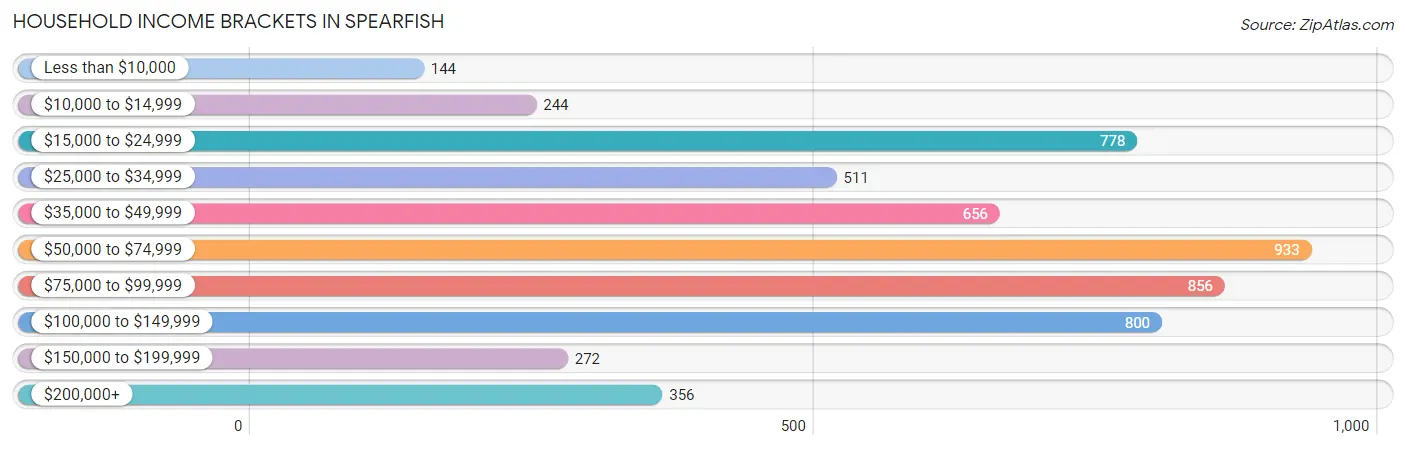
| Income Bracket | # Households | % Households |
| Less than $10,000 | 144 | 2.6% |
| $10,000 to $14,999 | 244 | 4.4% |
| $15,000 to $24,999 | 778 | 14.0% |
| $25,000 to $34,999 | 511 | 9.2% |
| $35,000 to $49,999 | 656 | 11.8% |
| $50,000 to $74,999 | 933 | 16.8% |
| $75,000 to $99,999 | 856 | 15.4% |
| $100,000 to $149,999 | 800 | 14.4% |
| $150,000 to $199,999 | 272 | 4.9% |
| $200,000+ | 356 | 6.4% |
Household Income by Householder Age in Spearfish
The median household income in Spearfish is $58,734, with the highest median household income of $79,798 found in the 45 to 64 years age bracket for the primary householder. A total of 1,444 households (26.0%) fall into this category. Meanwhile, the 15 to 24 years age bracket for the primary householder has the lowest median household income of $20,219, with 664 households (11.9%) in this group.
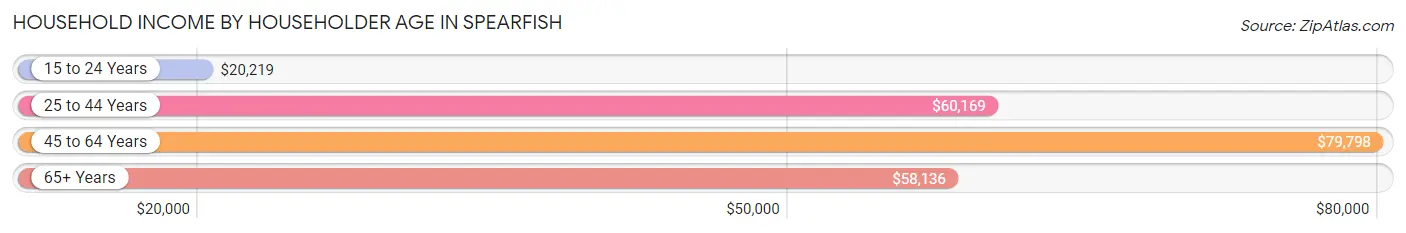
| Income Bracket | # Households | Median Income |
| 15 to 24 Years | 664 (11.9%) | $20,219 |
| 25 to 44 Years | 1,618 (29.1%) | $60,169 |
| 45 to 64 Years | 1,444 (26.0%) | $79,798 |
| 65+ Years | 1,830 (32.9%) | $58,136 |
| Total | 5,556 (100.0%) | $58,734 |
Poverty in Spearfish
Income Below Poverty by Sex and Age in Spearfish
With 10.7% poverty level for males and 15.3% for females among the residents of Spearfish, 18 to 24 year old males and 15 year old females are the most vulnerable to poverty, with 180 males (37.2%) and 34 females (46.0%) in their respective age groups living below the poverty level.
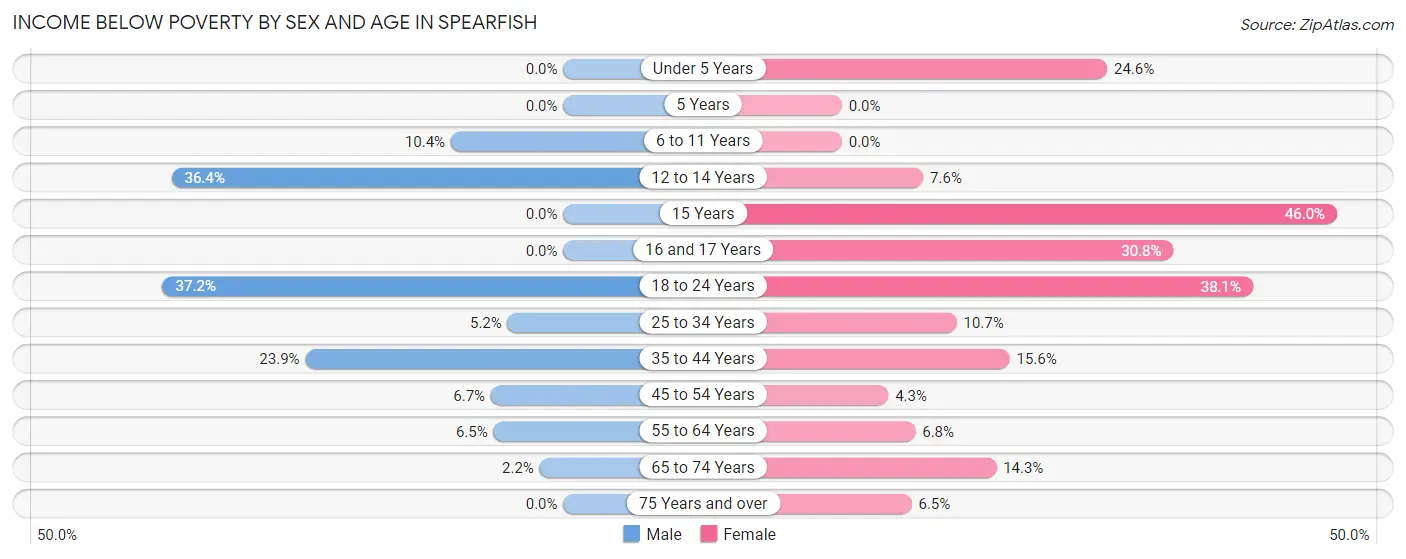
| Age Bracket | Male | Female |
| Under 5 Years | 0 (0.0%) | 64 (24.6%) |
| 5 Years | 0 (0.0%) | 0 (0.0%) |
| 6 to 11 Years | 46 (10.4%) | 0 (0.0%) |
| 12 to 14 Years | 60 (36.4%) | 24 (7.5%) |
| 15 Years | 0 (0.0%) | 34 (46.0%) |
| 16 and 17 Years | 0 (0.0%) | 24 (30.8%) |
| 18 to 24 Years | 180 (37.2%) | 370 (38.1%) |
| 25 to 34 Years | 40 (5.2%) | 67 (10.6%) |
| 35 to 44 Years | 181 (23.9%) | 109 (15.6%) |
| 45 to 54 Years | 31 (6.7%) | 22 (4.3%) |
| 55 to 64 Years | 46 (6.5%) | 48 (6.8%) |
| 65 to 74 Years | 16 (2.2%) | 104 (14.3%) |
| 75 Years and over | 0 (0.0%) | 45 (6.5%) |
| Total | 600 (10.7%) | 911 (15.3%) |
Income Above Poverty by Sex and Age in Spearfish
According to the poverty statistics in Spearfish, males aged under 5 years and females aged 5 years are the age groups that are most secure financially, with 100.0% of males and 100.0% of females in these age groups living above the poverty line.
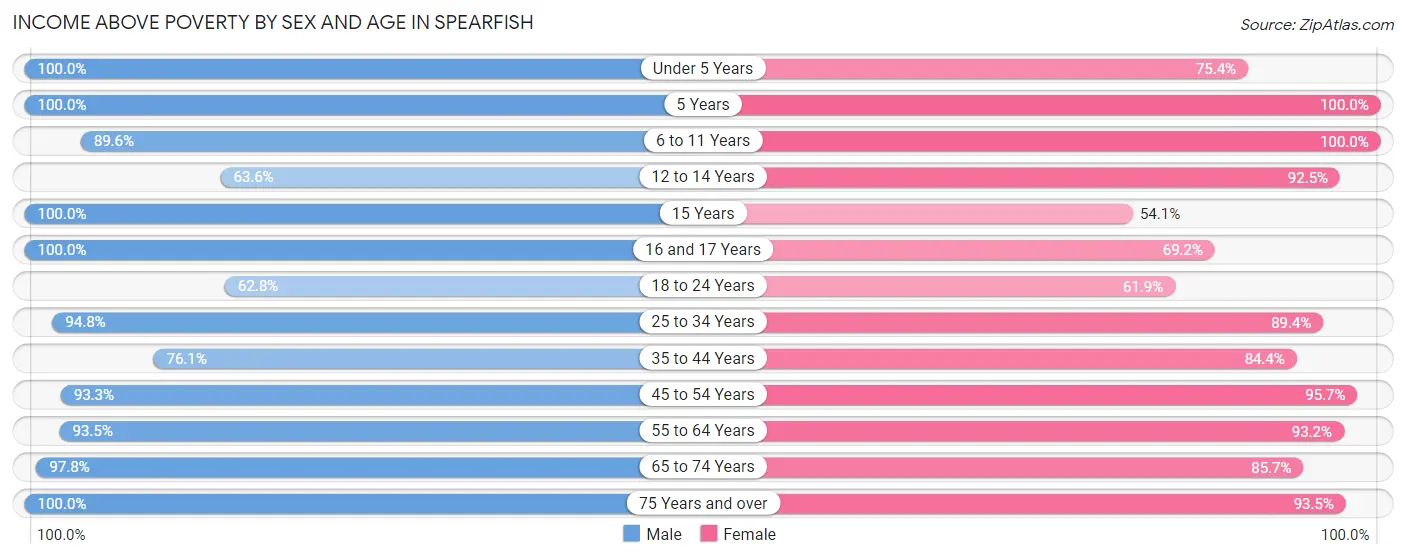
| Age Bracket | Male | Female |
| Under 5 Years | 294 (100.0%) | 196 (75.4%) |
| 5 Years | 15 (100.0%) | 16 (100.0%) |
| 6 to 11 Years | 395 (89.6%) | 268 (100.0%) |
| 12 to 14 Years | 105 (63.6%) | 294 (92.4%) |
| 15 Years | 66 (100.0%) | 40 (54.0%) |
| 16 and 17 Years | 190 (100.0%) | 54 (69.2%) |
| 18 to 24 Years | 304 (62.8%) | 600 (61.9%) |
| 25 to 34 Years | 734 (94.8%) | 562 (89.3%) |
| 35 to 44 Years | 575 (76.1%) | 591 (84.4%) |
| 45 to 54 Years | 430 (93.3%) | 488 (95.7%) |
| 55 to 64 Years | 664 (93.5%) | 656 (93.2%) |
| 65 to 74 Years | 711 (97.8%) | 622 (85.7%) |
| 75 Years and over | 497 (100.0%) | 650 (93.5%) |
| Total | 4,980 (89.2%) | 5,037 (84.7%) |
Income Below Poverty Among Married-Couple Families in Spearfish
The poverty statistics for married-couple families in Spearfish show that 2.8% or 58 of the total 2,052 families live below the poverty line. Families with 1 or 2 children have the highest poverty rate of 9.6%, comprising of 49 families. On the other hand, families with 3 or 4 children have the lowest poverty rate of 0.0%, which includes 0 families.
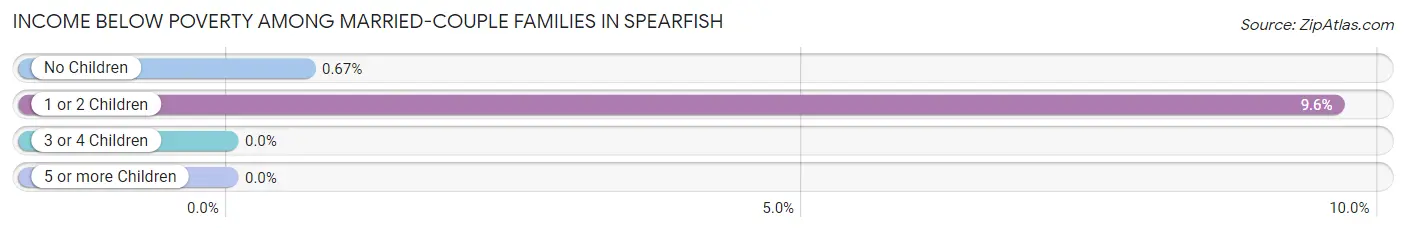
| Children | Above Poverty | Below Poverty |
| No Children | 1,331 (99.3%) | 9 (0.7%) |
| 1 or 2 Children | 460 (90.4%) | 49 (9.6%) |
| 3 or 4 Children | 191 (100.0%) | 0 (0.0%) |
| 5 or more Children | 12 (100.0%) | 0 (0.0%) |
| Total | 1,994 (97.2%) | 58 (2.8%) |
Income Below Poverty Among Single-Parent Households in Spearfish
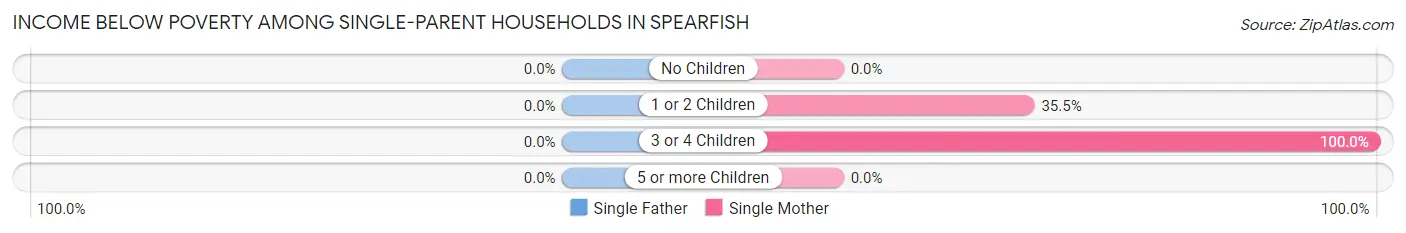
| Children | Single Father | Single Mother |
| No Children | 0 (0.0%) | 0 (0.0%) |
| 1 or 2 Children | 0 (0.0%) | 86 (35.5%) |
| 3 or 4 Children | 0 (0.0%) | 13 (100.0%) |
| 5 or more Children | 0 (0.0%) | 0 (0.0%) |
| Total | 0 (0.0%) | 99 (30.8%) |
Income Below Poverty Among Married-Couple vs Single-Parent Households in Spearfish
The poverty data for Spearfish shows that 58 of the married-couple family households (2.8%) and 99 of the single-parent households (19.1%) are living below the poverty level. Within the married-couple family households, those with 1 or 2 children have the highest poverty rate, with 49 households (9.6%) falling below the poverty line. Among the single-parent households, those with 3 or 4 children have the highest poverty rate, with 13 household (100.0%) living below poverty.
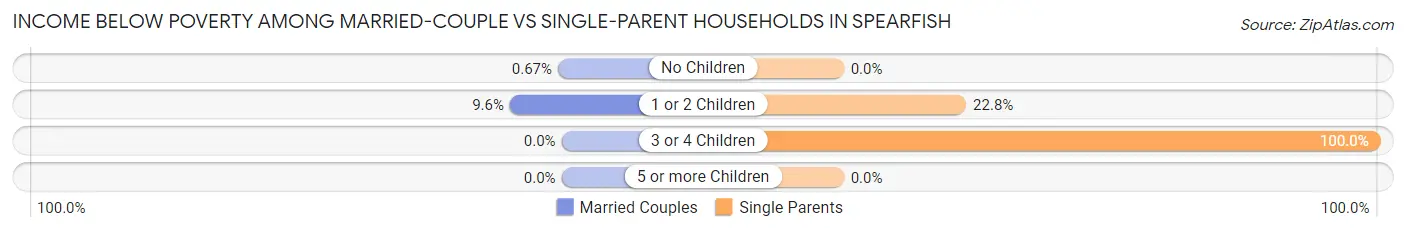
| Children | Married-Couple Families | Single-Parent Households |
| No Children | 9 (0.7%) | 0 (0.0%) |
| 1 or 2 Children | 49 (9.6%) | 86 (22.8%) |
| 3 or 4 Children | 0 (0.0%) | 13 (100.0%) |
| 5 or more Children | 0 (0.0%) | 0 (0.0%) |
| Total | 58 (2.8%) | 99 (19.1%) |
Race in Spearfish
The most populous races in Spearfish are White / Caucasian (10,940 | 89.2%), Two or more Races (715 | 5.8%), and Native / Alaskan (329 | 2.7%).
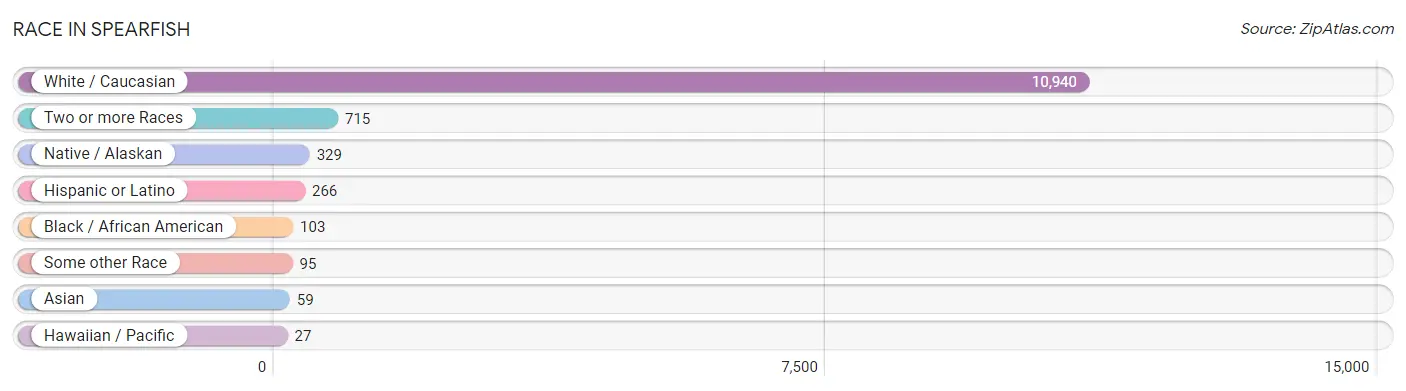
| Race | # Population | % Population |
| Asian | 59 | 0.5% |
| Black / African American | 103 | 0.8% |
| Hawaiian / Pacific | 27 | 0.2% |
| Hispanic or Latino | 266 | 2.2% |
| Native / Alaskan | 329 | 2.7% |
| White / Caucasian | 10,940 | 89.2% |
| Two or more Races | 715 | 5.8% |
| Some other Race | 95 | 0.8% |
| Total | 12,268 | 100.0% |
Ancestry in Spearfish
The most populous ancestries reported in Spearfish are German (4,068 | 33.2%), Norwegian (1,696 | 13.8%), Irish (1,461 | 11.9%), English (1,365 | 11.1%), and Swedish (503 | 4.1%), together accounting for 74.1% of all Spearfish residents.
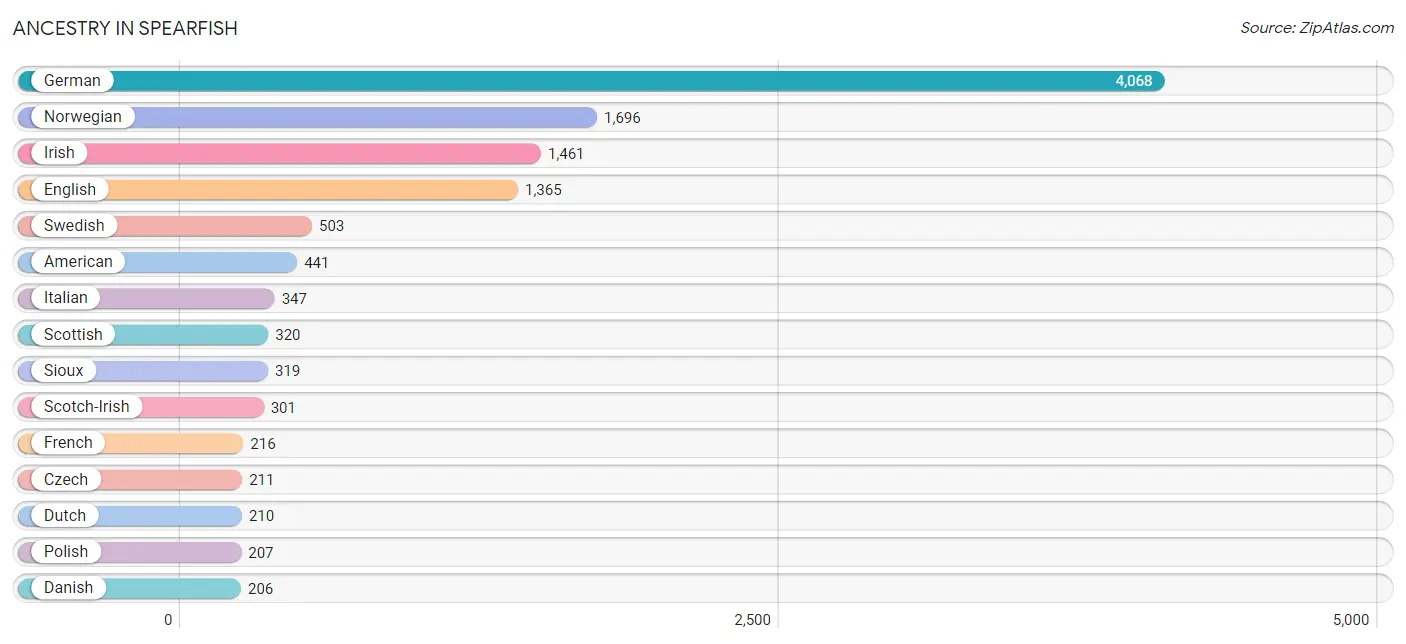
| Ancestry | # Population | % Population |
| African | 15 | 0.1% |
| Aleut | 9 | 0.1% |
| American | 441 | 3.6% |
| Arab | 13 | 0.1% |
| Austrian | 64 | 0.5% |
| Belgian | 14 | 0.1% |
| British | 46 | 0.4% |
| Burmese | 5 | 0.0% |
| Canadian | 39 | 0.3% |
| Central American | 28 | 0.2% |
| Cherokee | 27 | 0.2% |
| Cheyenne | 177 | 1.4% |
| Chippewa | 3 | 0.0% |
| Choctaw | 67 | 0.5% |
| Cuban | 13 | 0.1% |
| Czech | 211 | 1.7% |
| Czechoslovakian | 92 | 0.7% |
| Danish | 206 | 1.7% |
| Dutch | 210 | 1.7% |
| English | 1,365 | 11.1% |
| Estonian | 29 | 0.2% |
| Ethiopian | 68 | 0.5% |
| European | 204 | 1.7% |
| Finnish | 186 | 1.5% |
| French | 216 | 1.8% |
| French Canadian | 181 | 1.5% |
| German | 4,068 | 33.2% |
| German Russian | 39 | 0.3% |
| Greek | 10 | 0.1% |
| Hungarian | 28 | 0.2% |
| Indian (Asian) | 81 | 0.7% |
| Irish | 1,461 | 11.9% |
| Italian | 347 | 2.8% |
| Korean | 166 | 1.3% |
| Lithuanian | 75 | 0.6% |
| Luxembourger | 22 | 0.2% |
| Mexican | 126 | 1.0% |
| Native Hawaiian | 27 | 0.2% |
| Northern European | 79 | 0.6% |
| Norwegian | 1,696 | 13.8% |
| Pakistani | 65 | 0.5% |
| Polish | 207 | 1.7% |
| Puerto Rican | 43 | 0.4% |
| Russian | 181 | 1.5% |
| Salvadoran | 28 | 0.2% |
| Scandinavian | 51 | 0.4% |
| Scotch-Irish | 301 | 2.5% |
| Scottish | 320 | 2.6% |
| Sioux | 319 | 2.6% |
| Spaniard | 19 | 0.2% |
| Spanish | 14 | 0.1% |
| Subsaharan African | 83 | 0.7% |
| Swedish | 503 | 4.1% |
| Swiss | 23 | 0.2% |
| Thai | 1 | 0.0% |
| Turkish | 29 | 0.2% |
| Ukrainian | 14 | 0.1% |
| Welsh | 79 | 0.6% | View All 58 Rows |
Immigrants in Spearfish
The most numerous immigrant groups reported in Spearfish came from Africa (71 | 0.6%), Eastern Africa (68 | 0.5%), Ethiopia (68 | 0.5%), Asia (57 | 0.5%), and Eastern Asia (55 | 0.4%), together accounting for 2.6% of all Spearfish residents.
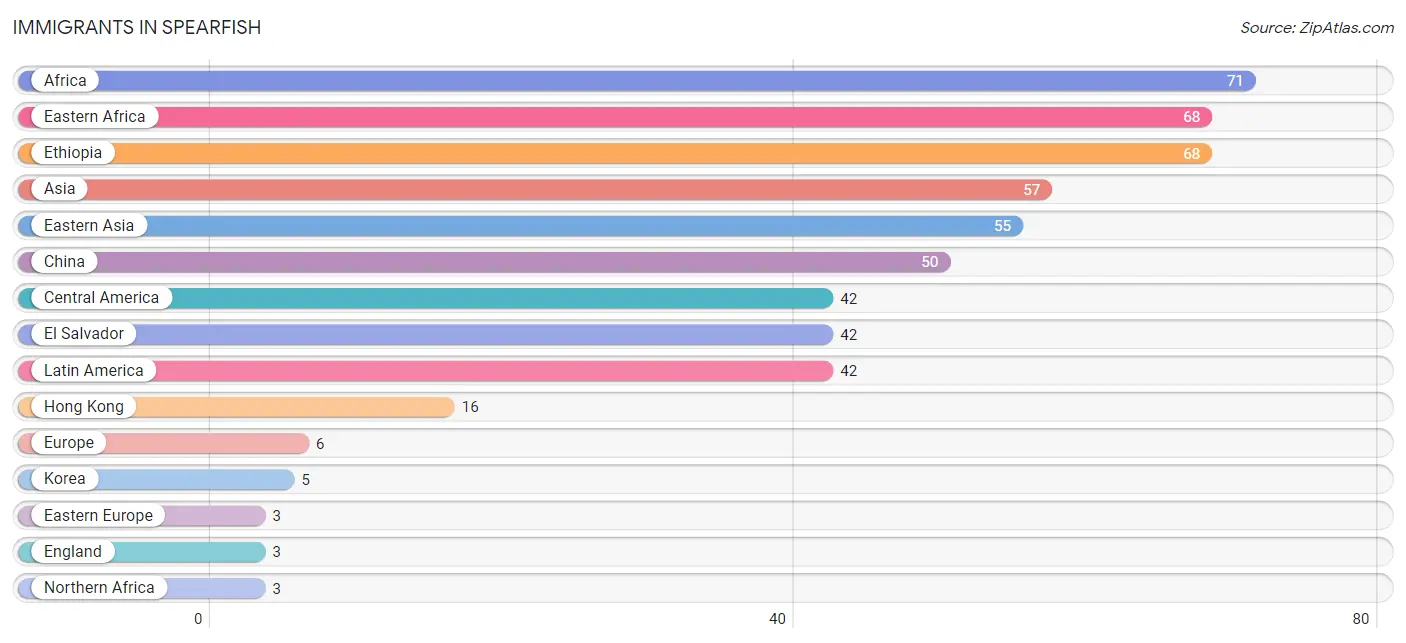
| Immigration Origin | # Population | % Population |
| Africa | 71 | 0.6% |
| Asia | 57 | 0.5% |
| Central America | 42 | 0.3% |
| China | 50 | 0.4% |
| Eastern Africa | 68 | 0.5% |
| Eastern Asia | 55 | 0.4% |
| Eastern Europe | 3 | 0.0% |
| El Salvador | 42 | 0.3% |
| England | 3 | 0.0% |
| Ethiopia | 68 | 0.5% |
| Europe | 6 | 0.1% |
| Hong Kong | 16 | 0.1% |
| India | 1 | 0.0% |
| Korea | 5 | 0.0% |
| Latin America | 42 | 0.3% |
| Northern Africa | 3 | 0.0% |
| Northern Europe | 3 | 0.0% |
| Philippines | 1 | 0.0% |
| Russia | 3 | 0.0% |
| South Central Asia | 1 | 0.0% |
| South Eastern Asia | 1 | 0.0% | View All 21 Rows |
Sex and Age in Spearfish
Sex and Age in Spearfish
The most populous age groups in Spearfish are 15 to 19 Years (568 | 9.7%) for men and 20 to 24 Years (819 | 12.8%) for women.
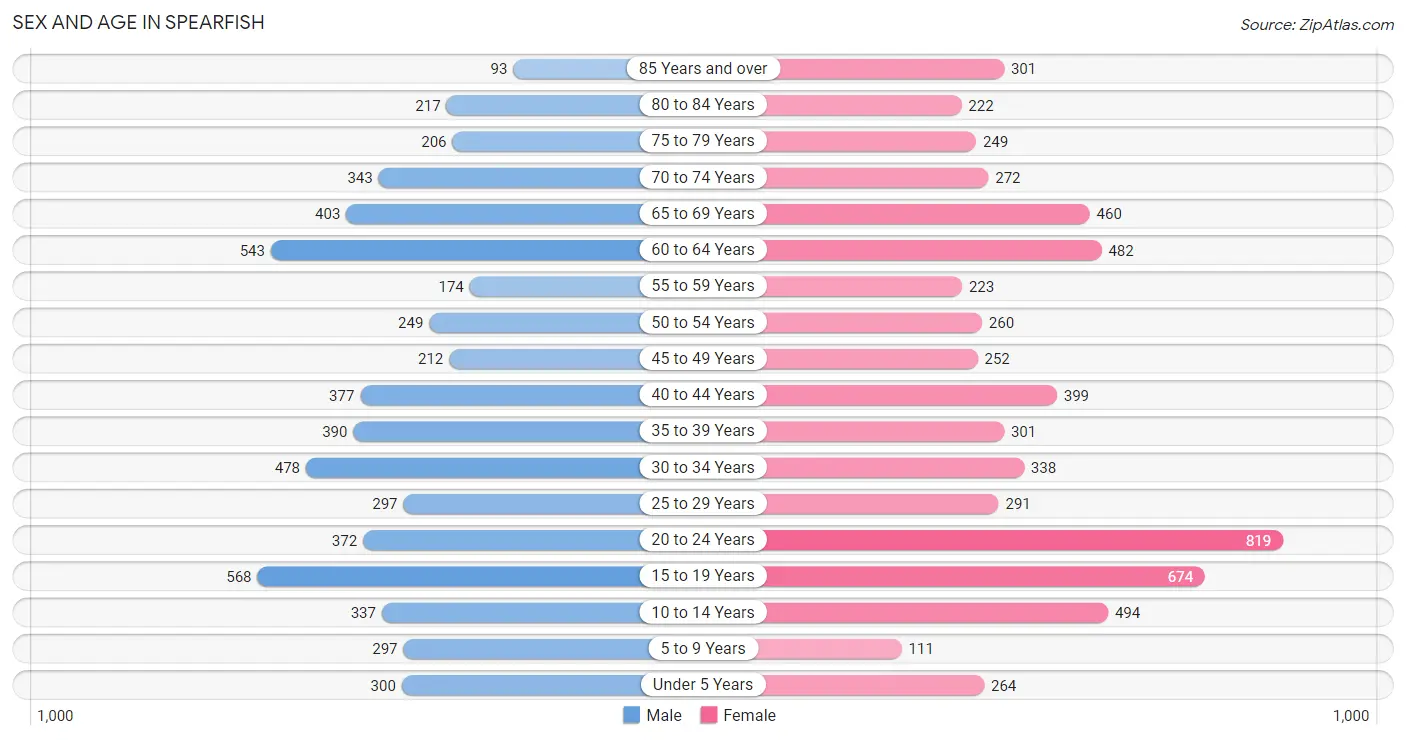
| Age Bracket | Male | Female |
| Under 5 Years | 300 (5.1%) | 264 (4.1%) |
| 5 to 9 Years | 297 (5.1%) | 111 (1.7%) |
| 10 to 14 Years | 337 (5.8%) | 494 (7.7%) |
| 15 to 19 Years | 568 (9.7%) | 674 (10.5%) |
| 20 to 24 Years | 372 (6.4%) | 819 (12.8%) |
| 25 to 29 Years | 297 (5.1%) | 291 (4.5%) |
| 30 to 34 Years | 478 (8.2%) | 338 (5.3%) |
| 35 to 39 Years | 390 (6.7%) | 301 (4.7%) |
| 40 to 44 Years | 377 (6.4%) | 399 (6.2%) |
| 45 to 49 Years | 212 (3.6%) | 252 (3.9%) |
| 50 to 54 Years | 249 (4.3%) | 260 (4.1%) |
| 55 to 59 Years | 174 (3.0%) | 223 (3.5%) |
| 60 to 64 Years | 543 (9.3%) | 482 (7.5%) |
| 65 to 69 Years | 403 (6.9%) | 460 (7.2%) |
| 70 to 74 Years | 343 (5.9%) | 272 (4.2%) |
| 75 to 79 Years | 206 (3.5%) | 249 (3.9%) |
| 80 to 84 Years | 217 (3.7%) | 222 (3.5%) |
| 85 Years and over | 93 (1.6%) | 301 (4.7%) |
| Total | 5,856 (100.0%) | 6,412 (100.0%) |
Families and Households in Spearfish
Median Family Size in Spearfish
The median family size in Spearfish is 2.89 persons per family, with single female/mother families (321 | 12.5%) accounting for the largest median family size of 3.11 persons per family. On the other hand, single male/father families (197 | 7.7%) represent the smallest median family size with 2.70 persons per family.
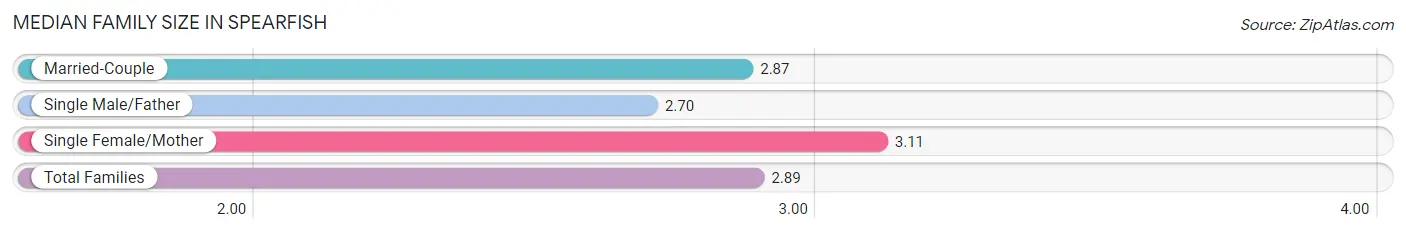
| Family Type | # Families | Family Size |
| Married-Couple | 2,052 (79.8%) | 2.87 |
| Single Male/Father | 197 (7.7%) | 2.70 |
| Single Female/Mother | 321 (12.5%) | 3.11 |
| Total Families | 2,570 (100.0%) | 2.89 |
Median Household Size in Spearfish
The median household size in Spearfish is 2.07 persons per household, with single female/mother households (321 | 5.8%) accounting for the largest median household size of 3.41 persons per household. non-family households (2,986 | 53.7%) represent the smallest median household size with 1.30 persons per household.
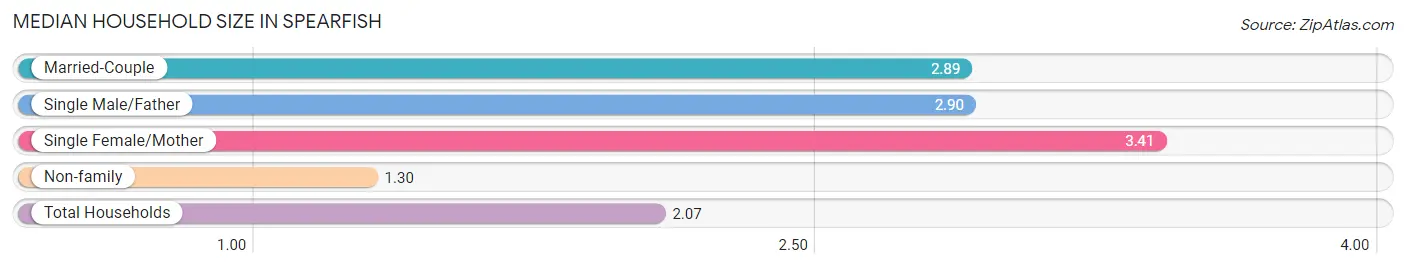
| Household Type | # Households | Household Size |
| Married-Couple | 2,052 (36.9%) | 2.89 |
| Single Male/Father | 197 (3.5%) | 2.90 |
| Single Female/Mother | 321 (5.8%) | 3.41 |
| Non-family | 2,986 (53.7%) | 1.30 |
| Total Households | 5,556 (100.0%) | 2.07 |
Household Size by Marriage Status in Spearfish
Out of a total of 5,556 households in Spearfish, 2,570 (46.3%) are family households, while 2,986 (53.7%) are nonfamily households. The most numerous type of family households are 2-person households, comprising 1,444, and the most common type of nonfamily households are 1-person households, comprising 2,194.
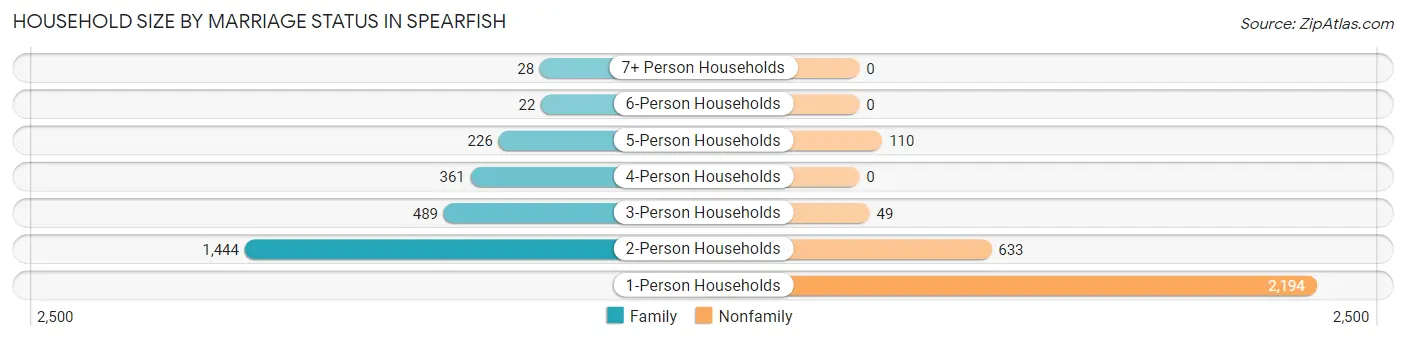
| Household Size | Family Households | Nonfamily Households |
| 1-Person Households | - | 2,194 (39.5%) |
| 2-Person Households | 1,444 (26.0%) | 633 (11.4%) |
| 3-Person Households | 489 (8.8%) | 49 (0.9%) |
| 4-Person Households | 361 (6.5%) | 0 (0.0%) |
| 5-Person Households | 226 (4.1%) | 110 (2.0%) |
| 6-Person Households | 22 (0.4%) | 0 (0.0%) |
| 7+ Person Households | 28 (0.5%) | 0 (0.0%) |
| Total | 2,570 (46.3%) | 2,986 (53.7%) |
Female Fertility in Spearfish
Fertility by Age in Spearfish
Average fertility rate in Spearfish is 17.0 births per 1,000 women. Women in the age bracket of 20 to 34 years have the highest fertility rate with 36.0 births per 1,000 women. Women in the age bracket of 20 to 34 years acount for 100.0% of all women with births.
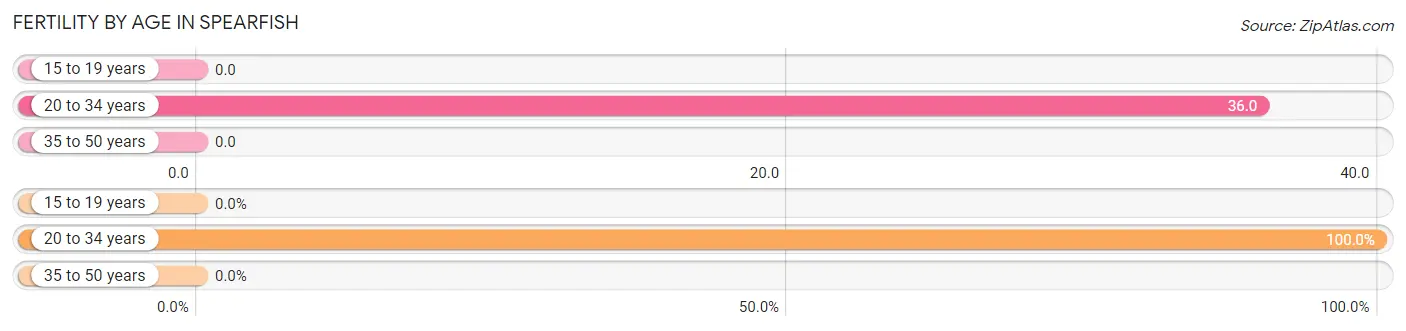
| Age Bracket | Women with Births | Births / 1,000 Women |
| 15 to 19 years | 0 (0.0%) | 0.0 |
| 20 to 34 years | 52 (100.0%) | 36.0 |
| 35 to 50 years | 0 (0.0%) | 0.0 |
| Total | 52 (100.0%) | 17.0 |
Fertility by Age by Marriage Status in Spearfish
76.9% of women with births (52) in Spearfish are married. The highest percentage of unmarried women with births falls into 20 to 34 years age bracket with 23.1% of them unmarried at the time of birth, while the lowest percentage of unmarried women with births belong to 20 to 34 years age bracket with 23.1% of them unmarried.
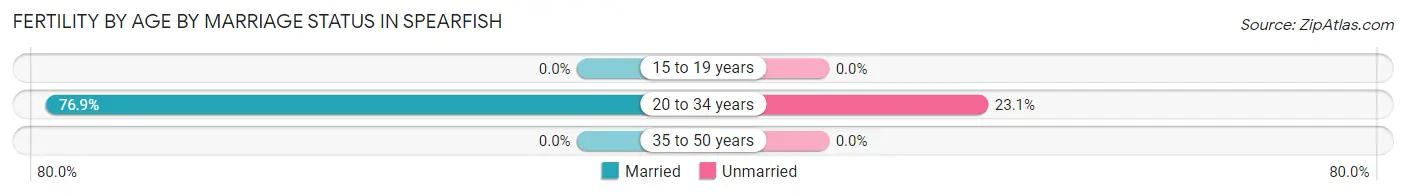
| Age Bracket | Married | Unmarried |
| 15 to 19 years | 0 (0.0%) | 0 (0.0%) |
| 20 to 34 years | 40 (76.9%) | 12 (23.1%) |
| 35 to 50 years | 0 (0.0%) | 0 (0.0%) |
| Total | 40 (76.9%) | 12 (23.1%) |
Fertility by Education in Spearfish
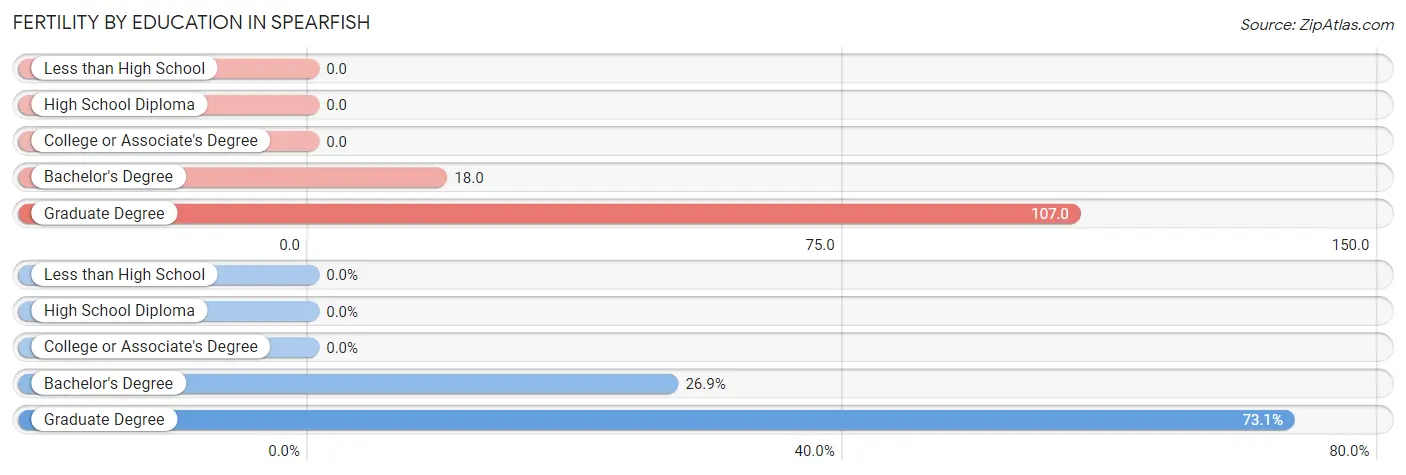
| Educational Attainment | Women with Births | Births / 1,000 Women |
| Less than High School | 0 (0.0%) | 0.0 |
| High School Diploma | 0 (0.0%) | 0.0 |
| College or Associate's Degree | 0 (0.0%) | 0.0 |
| Bachelor's Degree | 14 (26.9%) | 18.0 |
| Graduate Degree | 38 (73.1%) | 107.0 |
| Total | 52 (100.0%) | 17.0 |
Fertility by Education by Marriage Status in Spearfish
23.1% of women with births in Spearfish are unmarried. Women with the educational attainment of graduate degree are most likely to be married with 100.0% of them married at childbirth, while women with the educational attainment of bachelor's degree are least likely to be married with 85.7% of them unmarried at childbirth.
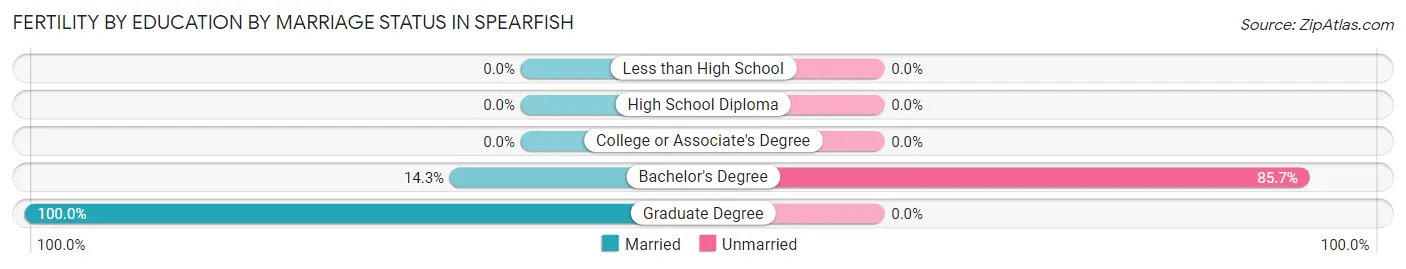
| Educational Attainment | Married | Unmarried |
| Less than High School | 0 (0.0%) | 0 (0.0%) |
| High School Diploma | 0 (0.0%) | 0 (0.0%) |
| College or Associate's Degree | 0 (0.0%) | 0 (0.0%) |
| Bachelor's Degree | 2 (14.3%) | 12 (85.7%) |
| Graduate Degree | 38 (100.0%) | 0 (0.0%) |
| Total | 40 (76.9%) | 12 (23.1%) |
Employment Characteristics in Spearfish
Employment by Class of Employer in Spearfish
Among the 6,413 employed individuals in Spearfish, private company employees (4,068 | 63.4%), not-for-profit organizations (626 | 9.8%), and federal government employees (507 | 7.9%) make up the most common classes of employment.
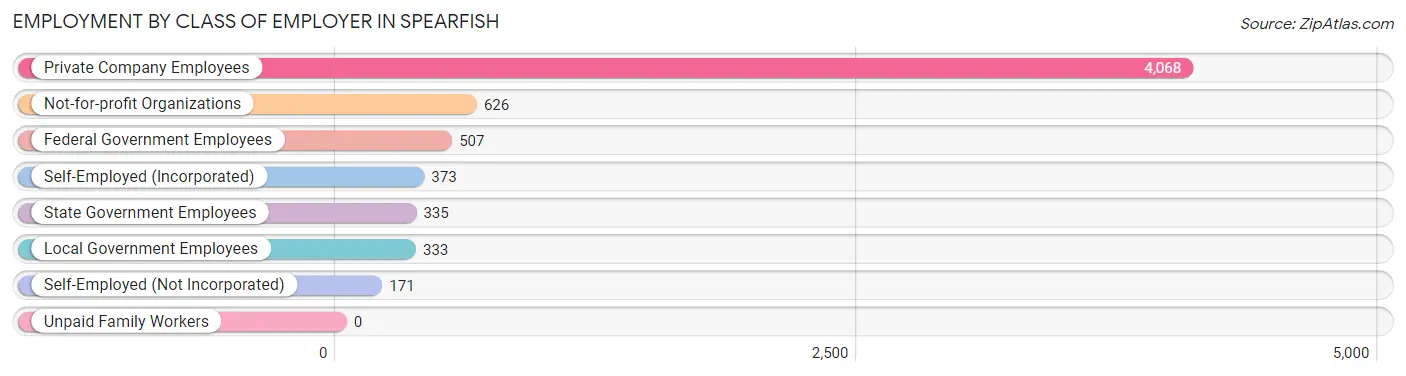
| Employer Class | # Employees | % Employees |
| Private Company Employees | 4,068 | 63.4% |
| Self-Employed (Incorporated) | 373 | 5.8% |
| Self-Employed (Not Incorporated) | 171 | 2.7% |
| Not-for-profit Organizations | 626 | 9.8% |
| Local Government Employees | 333 | 5.2% |
| State Government Employees | 335 | 5.2% |
| Federal Government Employees | 507 | 7.9% |
| Unpaid Family Workers | 0 | 0.0% |
| Total | 6,413 | 100.0% |
Employment Status by Age in Spearfish
According to the labor force statistics for Spearfish, out of the total population over 16 years of age (10,321), 64.2% or 6,626 individuals are in the labor force, with 2.3% or 152 of them unemployed. The age group with the highest labor force participation rate is 45 to 54 years, with 97.5% or 949 individuals in the labor force. Within the labor force, the 16 to 19 years age range has the highest percentage of unemployed individuals, with 9.3% or 69 of them being unemployed.
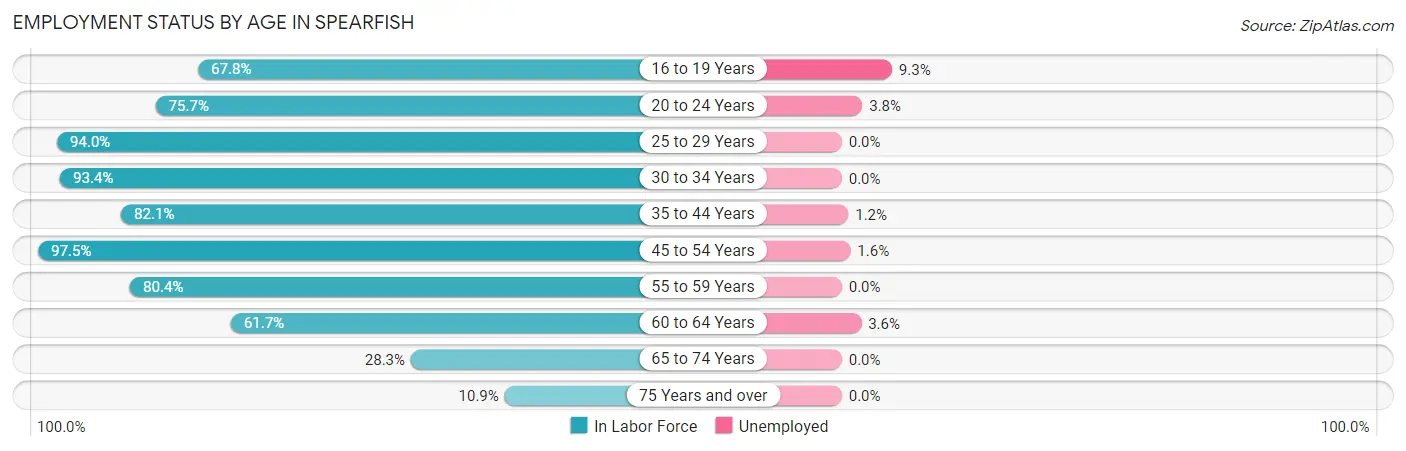
| Age Bracket | In Labor Force | Unemployed |
| 16 to 19 Years | 744 (67.8%) | 69 (9.3%) |
| 20 to 24 Years | 902 (75.7%) | 34 (3.8%) |
| 25 to 29 Years | 553 (94.0%) | 0 (0.0%) |
| 30 to 34 Years | 762 (93.4%) | 0 (0.0%) |
| 35 to 44 Years | 1,204 (82.1%) | 14 (1.2%) |
| 45 to 54 Years | 949 (97.5%) | 15 (1.6%) |
| 55 to 59 Years | 319 (80.4%) | 0 (0.0%) |
| 60 to 64 Years | 632 (61.7%) | 23 (3.6%) |
| 65 to 74 Years | 418 (28.3%) | 0 (0.0%) |
| 75 Years and over | 140 (10.9%) | 0 (0.0%) |
| Total | 6,626 (64.2%) | 152 (2.3%) |
Employment Status by Educational Attainment in Spearfish
According to labor force statistics for Spearfish, 83.9% of individuals (4,418) out of the total population between 25 and 64 years of age (5,266) are in the labor force, with 1.2% or 53 of them being unemployed. The group with the highest labor force participation rate are those with the educational attainment of bachelor's degree or higher, with 91.9% or 2,308 individuals in the labor force. Within the labor force, individuals with high school diploma education have the highest percentage of unemployment, with 2.7% or 23 of them being unemployed.
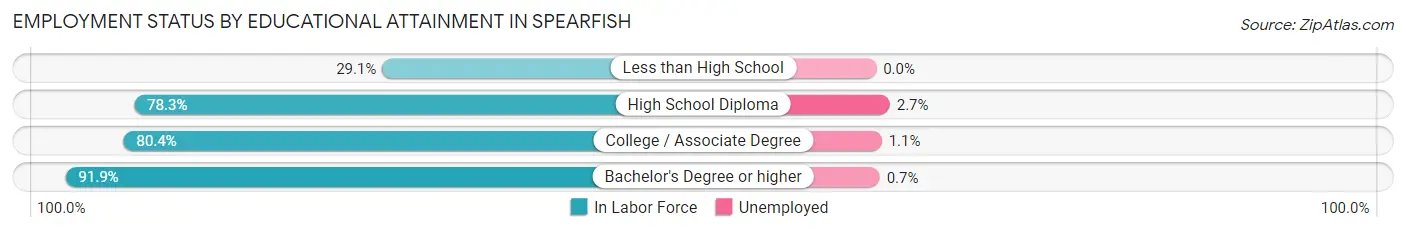
| Educational Attainment | In Labor Force | Unemployed |
| Less than High School | 46 (29.1%) | 0 (0.0%) |
| High School Diploma | 840 (78.3%) | 29 (2.7%) |
| College / Associate Degree | 1,225 (80.4%) | 17 (1.1%) |
| Bachelor's Degree or higher | 2,308 (91.9%) | 18 (0.7%) |
| Total | 4,418 (83.9%) | 63 (1.2%) |
Employment Occupations by Sex in Spearfish
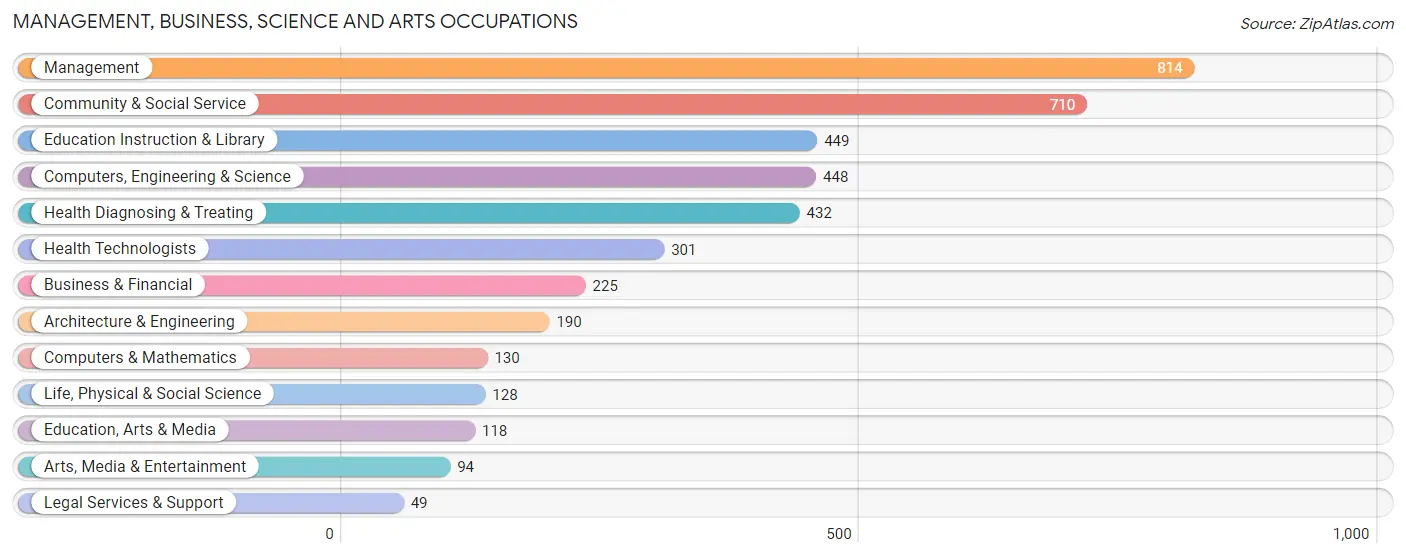
Management, Business, Science and Arts Occupations
The most common Management, Business, Science and Arts occupations in Spearfish are Management (814 | 12.6%), Community & Social Service (710 | 11.0%), Education Instruction & Library (449 | 7.0%), Computers, Engineering & Science (448 | 6.9%), and Health Diagnosing & Treating (432 | 6.7%).
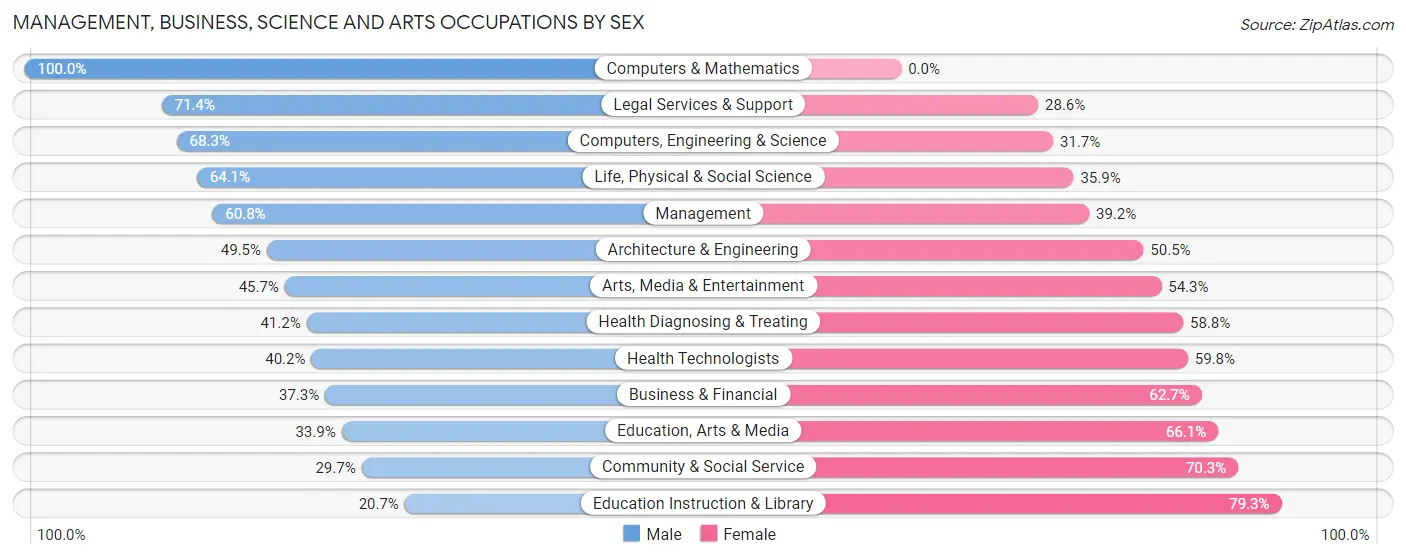
Management, Business, Science and Arts Occupations by Sex
Within the Management, Business, Science and Arts occupations in Spearfish, the most male-oriented occupations are Computers & Mathematics (100.0%), Legal Services & Support (71.4%), and Computers, Engineering & Science (68.3%), while the most female-oriented occupations are Education Instruction & Library (79.3%), Community & Social Service (70.3%), and Education, Arts & Media (66.1%).
| Occupation | Male | Female |
| Management | 495 (60.8%) | 319 (39.2%) |
| Business & Financial | 84 (37.3%) | 141 (62.7%) |
| Computers, Engineering & Science | 306 (68.3%) | 142 (31.7%) |
| Computers & Mathematics | 130 (100.0%) | 0 (0.0%) |
| Architecture & Engineering | 94 (49.5%) | 96 (50.5%) |
| Life, Physical & Social Science | 82 (64.1%) | 46 (35.9%) |
| Community & Social Service | 211 (29.7%) | 499 (70.3%) |
| Education, Arts & Media | 40 (33.9%) | 78 (66.1%) |
| Legal Services & Support | 35 (71.4%) | 14 (28.6%) |
| Education Instruction & Library | 93 (20.7%) | 356 (79.3%) |
| Arts, Media & Entertainment | 43 (45.7%) | 51 (54.3%) |
| Health Diagnosing & Treating | 178 (41.2%) | 254 (58.8%) |
| Health Technologists | 121 (40.2%) | 180 (59.8%) |
| Total (Category) | 1,274 (48.5%) | 1,355 (51.5%) |
| Total (Overall) | 3,051 (47.3%) | 3,400 (52.7%) |
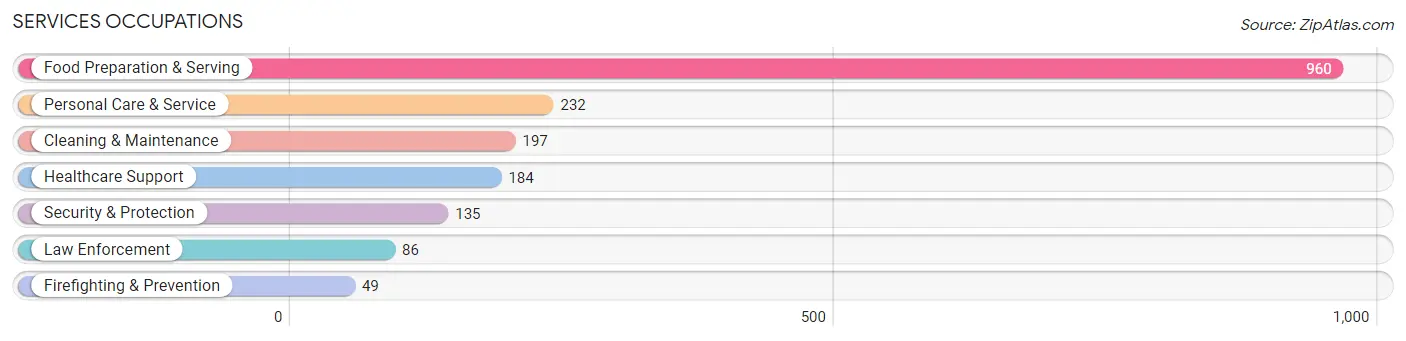
Services Occupations
The most common Services occupations in Spearfish are Food Preparation & Serving (960 | 14.9%), Personal Care & Service (232 | 3.6%), Cleaning & Maintenance (197 | 3.0%), Healthcare Support (184 | 2.9%), and Security & Protection (135 | 2.1%).
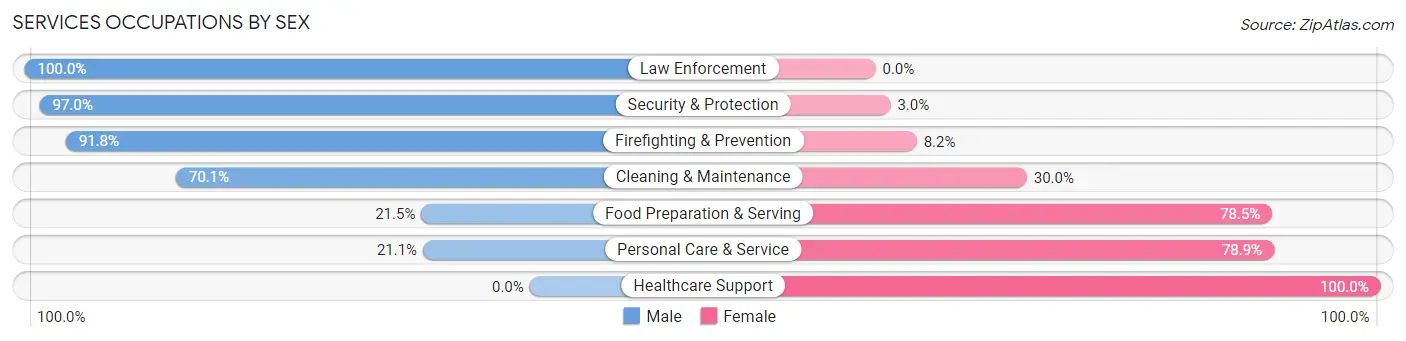
Services Occupations by Sex
Within the Services occupations in Spearfish, the most male-oriented occupations are Law Enforcement (100.0%), Security & Protection (97.0%), and Firefighting & Prevention (91.8%), while the most female-oriented occupations are Healthcare Support (100.0%), Personal Care & Service (78.9%), and Food Preparation & Serving (78.5%).
| Occupation | Male | Female |
| Healthcare Support | 0 (0.0%) | 184 (100.0%) |
| Security & Protection | 131 (97.0%) | 4 (3.0%) |
| Firefighting & Prevention | 45 (91.8%) | 4 (8.2%) |
| Law Enforcement | 86 (100.0%) | 0 (0.0%) |
| Food Preparation & Serving | 206 (21.5%) | 754 (78.5%) |
| Cleaning & Maintenance | 138 (70.1%) | 59 (29.9%) |
| Personal Care & Service | 49 (21.1%) | 183 (78.9%) |
| Total (Category) | 524 (30.7%) | 1,184 (69.3%) |
| Total (Overall) | 3,051 (47.3%) | 3,400 (52.7%) |
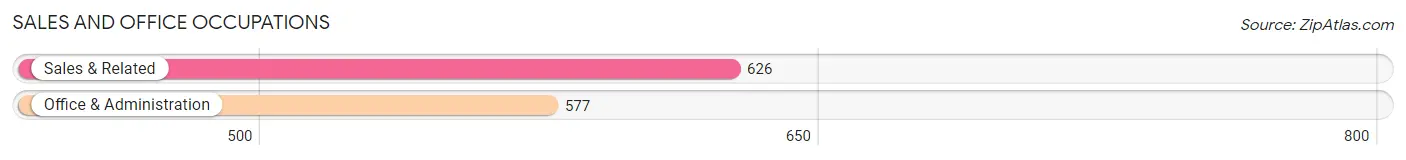
Sales and Office Occupations
The most common Sales and Office occupations in Spearfish are Sales & Related (626 | 9.7%), and Office & Administration (577 | 8.9%).
Sales and Office Occupations by Sex
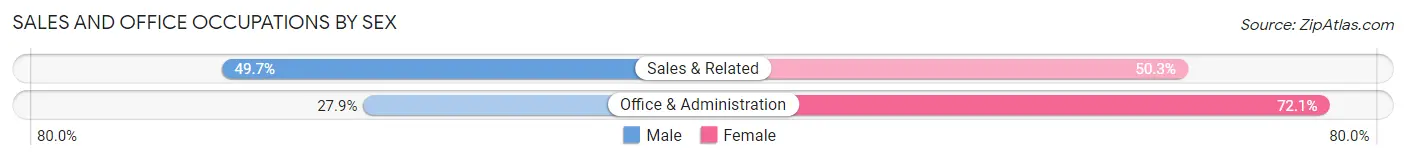
| Occupation | Male | Female |
| Sales & Related | 311 (49.7%) | 315 (50.3%) |
| Office & Administration | 161 (27.9%) | 416 (72.1%) |
| Total (Category) | 472 (39.2%) | 731 (60.8%) |
| Total (Overall) | 3,051 (47.3%) | 3,400 (52.7%) |
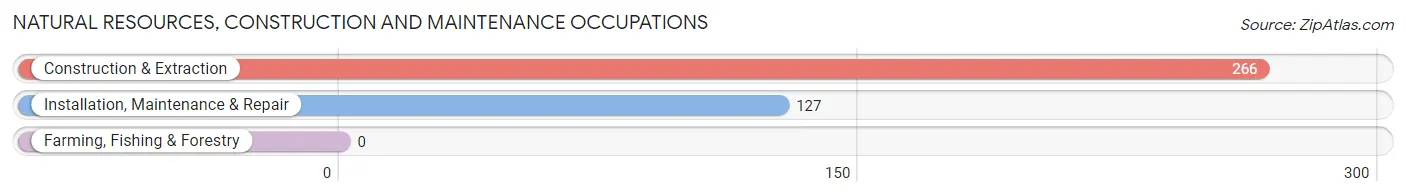
Natural Resources, Construction and Maintenance Occupations
The most common Natural Resources, Construction and Maintenance occupations in Spearfish are Construction & Extraction (266 | 4.1%), and Installation, Maintenance & Repair (127 | 2.0%).
Natural Resources, Construction and Maintenance Occupations by Sex
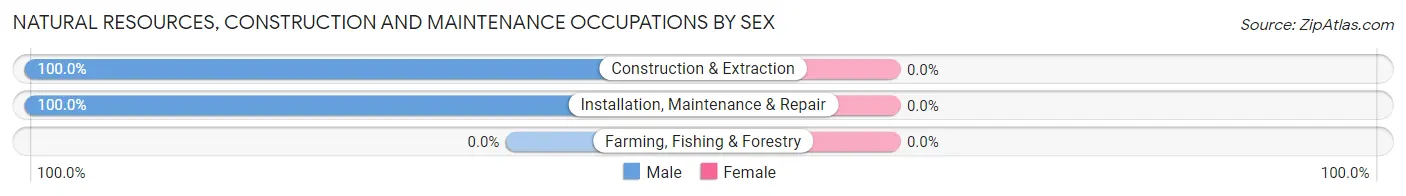
| Occupation | Male | Female |
| Farming, Fishing & Forestry | 0 (0.0%) | 0 (0.0%) |
| Construction & Extraction | 266 (100.0%) | 0 (0.0%) |
| Installation, Maintenance & Repair | 127 (100.0%) | 0 (0.0%) |
| Total (Category) | 393 (100.0%) | 0 (0.0%) |
| Total (Overall) | 3,051 (47.3%) | 3,400 (52.7%) |
Production, Transportation and Moving Occupations
The most common Production, Transportation and Moving occupations in Spearfish are Material Moving (249 | 3.9%), Production (178 | 2.8%), and Transportation (91 | 1.4%).
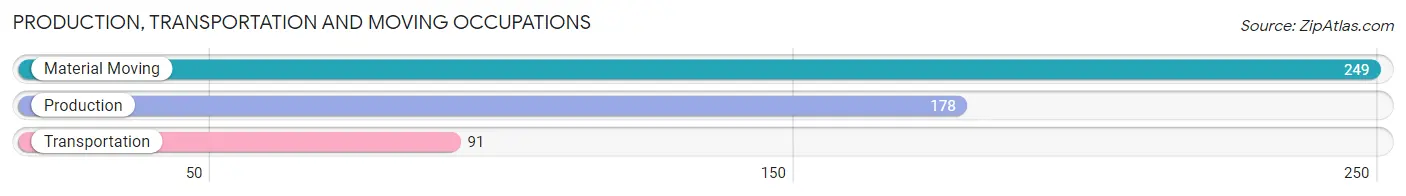
Production, Transportation and Moving Occupations by Sex
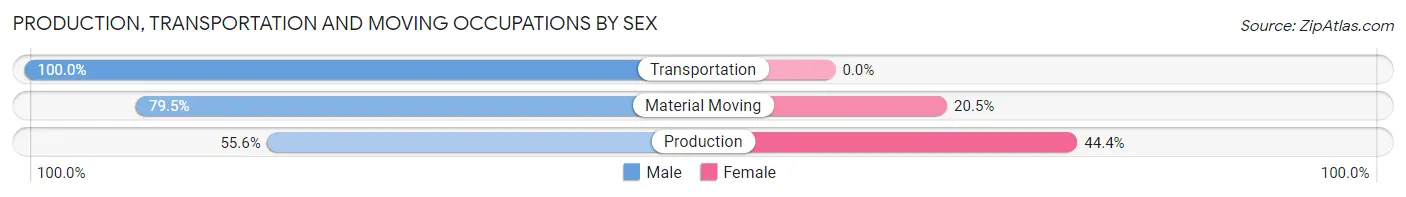
| Occupation | Male | Female |
| Production | 99 (55.6%) | 79 (44.4%) |
| Transportation | 91 (100.0%) | 0 (0.0%) |
| Material Moving | 198 (79.5%) | 51 (20.5%) |
| Total (Category) | 388 (74.9%) | 130 (25.1%) |
| Total (Overall) | 3,051 (47.3%) | 3,400 (52.7%) |
Employment Industries by Sex in Spearfish
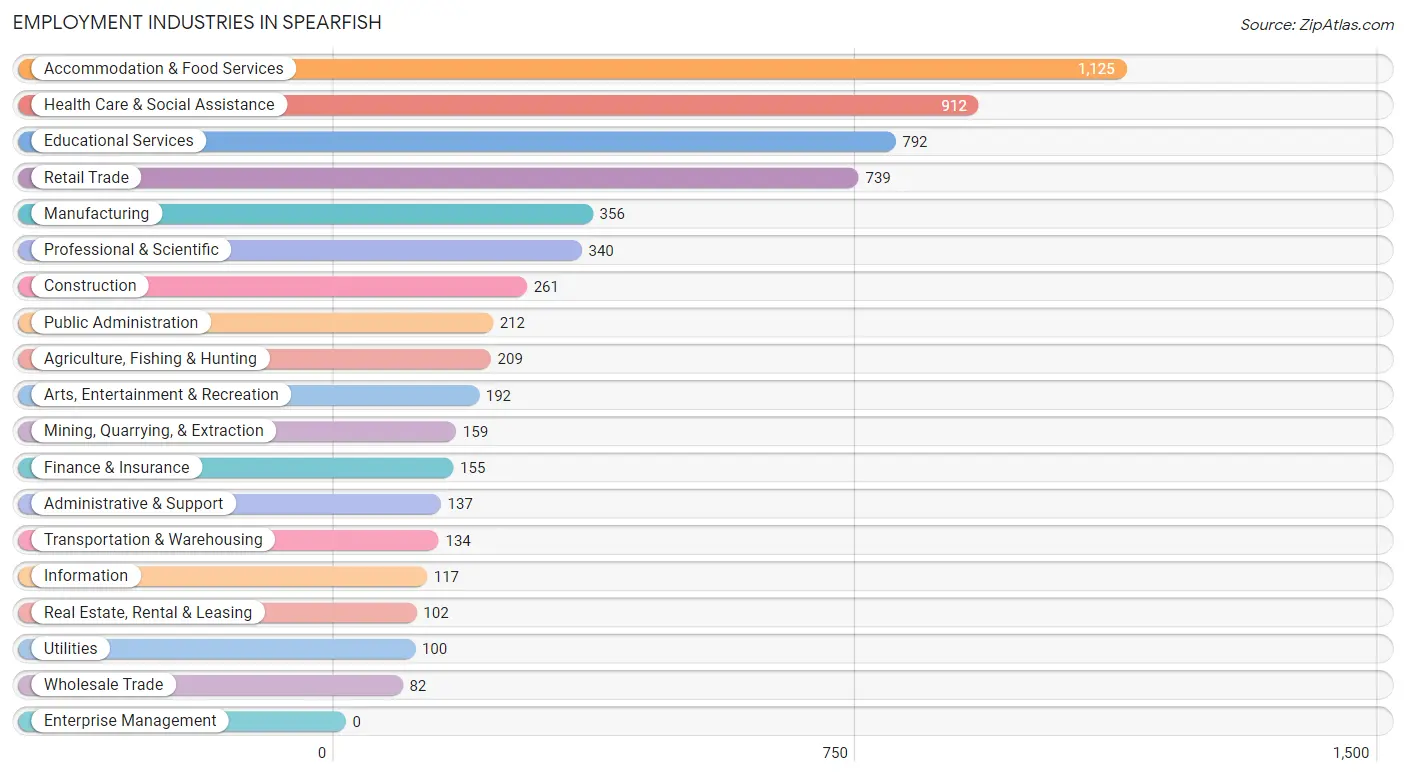
Employment Industries in Spearfish
The major employment industries in Spearfish include Accommodation & Food Services (1,125 | 17.4%), Health Care & Social Assistance (912 | 14.1%), Educational Services (792 | 12.3%), Retail Trade (739 | 11.5%), and Manufacturing (356 | 5.5%).
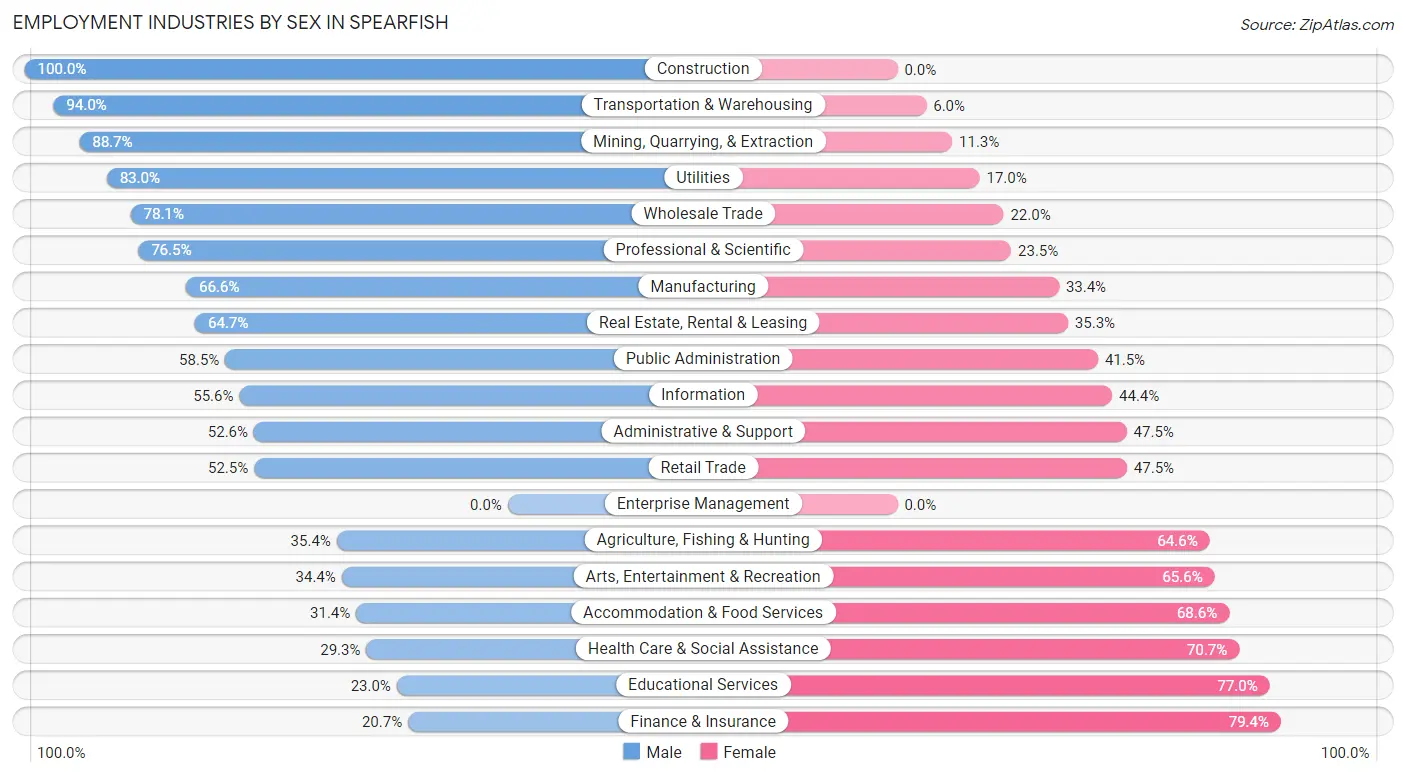
Employment Industries by Sex in Spearfish
The Spearfish industries that see more men than women are Construction (100.0%), Transportation & Warehousing (94.0%), and Mining, Quarrying, & Extraction (88.7%), whereas the industries that tend to have a higher number of women are Finance & Insurance (79.3%), Educational Services (77.0%), and Health Care & Social Assistance (70.7%).
| Industry | Male | Female |
| Agriculture, Fishing & Hunting | 74 (35.4%) | 135 (64.6%) |
| Mining, Quarrying, & Extraction | 141 (88.7%) | 18 (11.3%) |
| Construction | 261 (100.0%) | 0 (0.0%) |
| Manufacturing | 237 (66.6%) | 119 (33.4%) |
| Wholesale Trade | 64 (78.0%) | 18 (22.0%) |
| Retail Trade | 388 (52.5%) | 351 (47.5%) |
| Transportation & Warehousing | 126 (94.0%) | 8 (6.0%) |
| Utilities | 83 (83.0%) | 17 (17.0%) |
| Information | 65 (55.6%) | 52 (44.4%) |
| Finance & Insurance | 32 (20.6%) | 123 (79.3%) |
| Real Estate, Rental & Leasing | 66 (64.7%) | 36 (35.3%) |
| Professional & Scientific | 260 (76.5%) | 80 (23.5%) |
| Enterprise Management | 0 (0.0%) | 0 (0.0%) |
| Administrative & Support | 72 (52.5%) | 65 (47.4%) |
| Educational Services | 182 (23.0%) | 610 (77.0%) |
| Health Care & Social Assistance | 267 (29.3%) | 645 (70.7%) |
| Arts, Entertainment & Recreation | 66 (34.4%) | 126 (65.6%) |
| Accommodation & Food Services | 353 (31.4%) | 772 (68.6%) |
| Public Administration | 124 (58.5%) | 88 (41.5%) |
| Total | 3,051 (47.3%) | 3,400 (52.7%) |
Education in Spearfish
School Enrollment in Spearfish
The most common levels of schooling among the 3,285 students in Spearfish are college / undergraduate (1,503 | 45.8%), middle school (674 | 20.5%), and high school (495 | 15.1%).
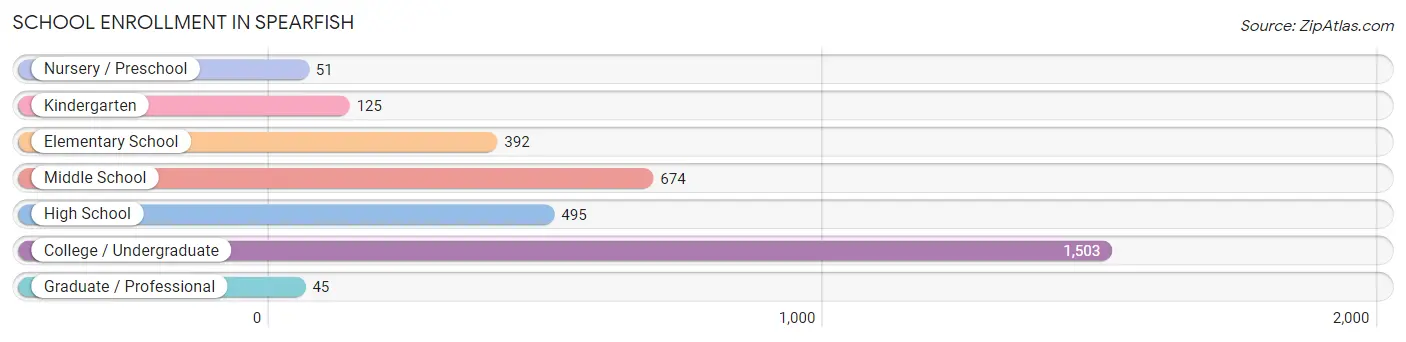
| School Level | # Students | % Students |
| Nursery / Preschool | 51 | 1.5% |
| Kindergarten | 125 | 3.8% |
| Elementary School | 392 | 11.9% |
| Middle School | 674 | 20.5% |
| High School | 495 | 15.1% |
| College / Undergraduate | 1,503 | 45.8% |
| Graduate / Professional | 45 | 1.4% |
| Total | 3,285 | 100.0% |
School Enrollment by Age by Funding Source in Spearfish
Out of a total of 3,285 students who are enrolled in schools in Spearfish, 138 (4.2%) attend a private institution, while the remaining 3,147 (95.8%) are enrolled in public schools. The age group of 18 to 19 year olds has the highest likelihood of being enrolled in private schools, with 76 (14.3% in the age bracket) enrolled. Conversely, the age group of 3 to 4 year olds has the lowest likelihood of being enrolled in a private school, with 92 (100.0% in the age bracket) attending a public institution.
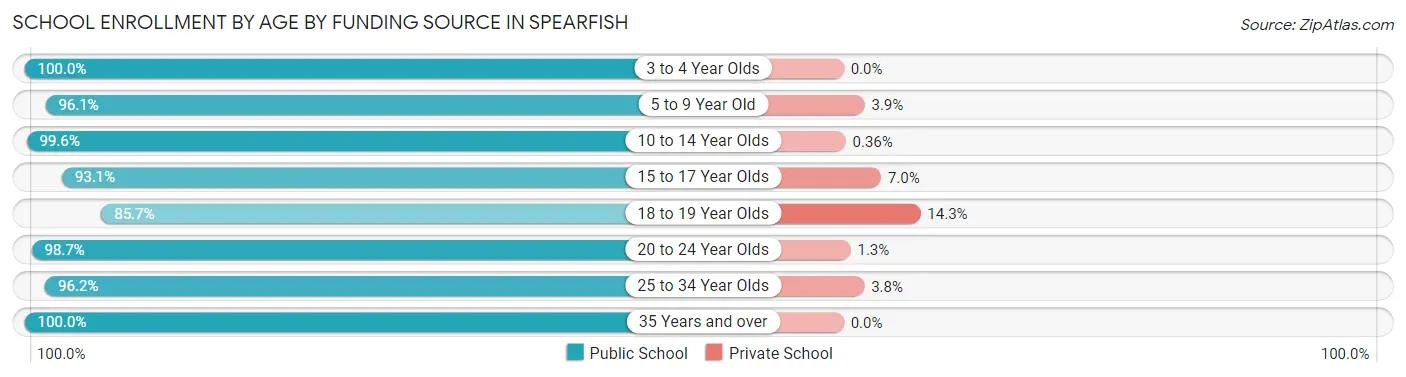
| Age Bracket | Public School | Private School |
| 3 to 4 Year Olds | 92 (100.0%) | 0 (0.0%) |
| 5 to 9 Year Old | 321 (96.1%) | 13 (3.9%) |
| 10 to 14 Year Olds | 828 (99.6%) | 3 (0.4%) |
| 15 to 17 Year Olds | 388 (93.0%) | 29 (7.0%) |
| 18 to 19 Year Olds | 456 (85.7%) | 76 (14.3%) |
| 20 to 24 Year Olds | 848 (98.7%) | 11 (1.3%) |
| 25 to 34 Year Olds | 176 (96.2%) | 7 (3.8%) |
| 35 Years and over | 37 (100.0%) | 0 (0.0%) |
| Total | 3,147 (95.8%) | 138 (4.2%) |
Educational Attainment by Field of Study in Spearfish
Education (802 | 19.8%), business (750 | 18.5%), social sciences (382 | 9.4%), science & technology (356 | 8.8%), and arts & humanities (303 | 7.5%) are the most common fields of study among 4,050 individuals in Spearfish who have obtained a bachelor's degree or higher.
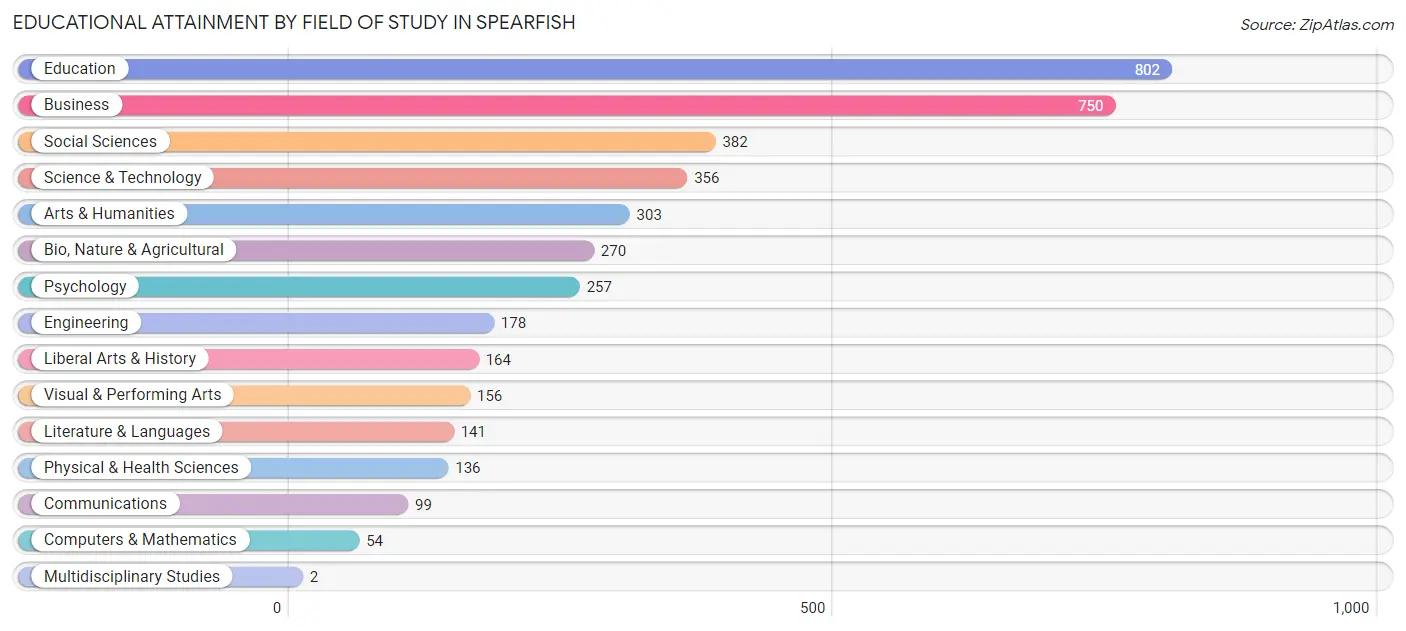
| Field of Study | # Graduates | % Graduates |
| Computers & Mathematics | 54 | 1.3% |
| Bio, Nature & Agricultural | 270 | 6.7% |
| Physical & Health Sciences | 136 | 3.4% |
| Psychology | 257 | 6.4% |
| Social Sciences | 382 | 9.4% |
| Engineering | 178 | 4.4% |
| Multidisciplinary Studies | 2 | 0.1% |
| Science & Technology | 356 | 8.8% |
| Business | 750 | 18.5% |
| Education | 802 | 19.8% |
| Literature & Languages | 141 | 3.5% |
| Liberal Arts & History | 164 | 4.1% |
| Visual & Performing Arts | 156 | 3.8% |
| Communications | 99 | 2.4% |
| Arts & Humanities | 303 | 7.5% |
| Total | 4,050 | 100.0% |
Transportation & Commute in Spearfish
Vehicle Availability by Sex in Spearfish
The most prevalent vehicle ownership categories in Spearfish are males with 2 vehicles (1,344, accounting for 45.8%) and females with 2 vehicles (1,547, making up 42.4%).
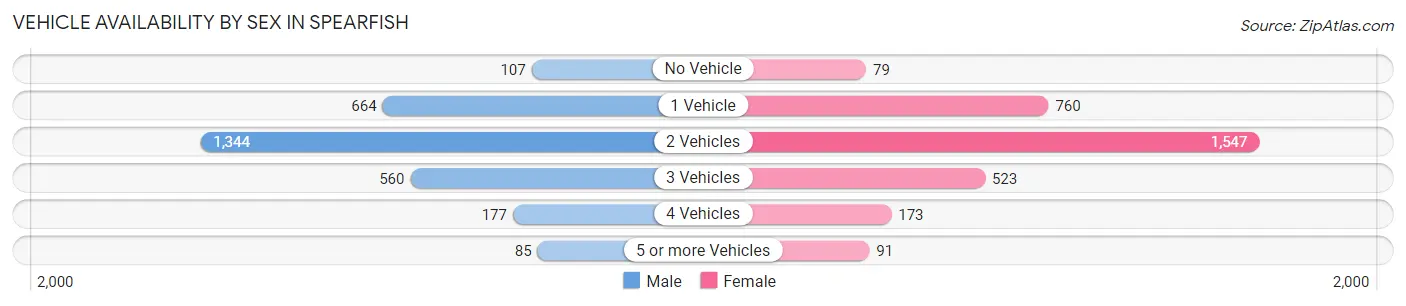
| Vehicles Available | Male | Female |
| No Vehicle | 107 (3.6%) | 79 (2.5%) |
| 1 Vehicle | 664 (22.6%) | 760 (23.9%) |
| 2 Vehicles | 1,344 (45.8%) | 1,547 (48.8%) |
| 3 Vehicles | 560 (19.1%) | 523 (16.5%) |
| 4 Vehicles | 177 (6.0%) | 173 (5.4%) |
| 5 or more Vehicles | 85 (2.9%) | 91 (2.9%) |
| Total | 2,937 (100.0%) | 3,173 (100.0%) |
Commute Time in Spearfish
The most frequently occuring commute durations in Spearfish are 5 to 9 minutes (2,160 commuters, 35.8%), 10 to 14 minutes (1,116 commuters, 18.5%), and 15 to 19 minutes (628 commuters, 10.4%).
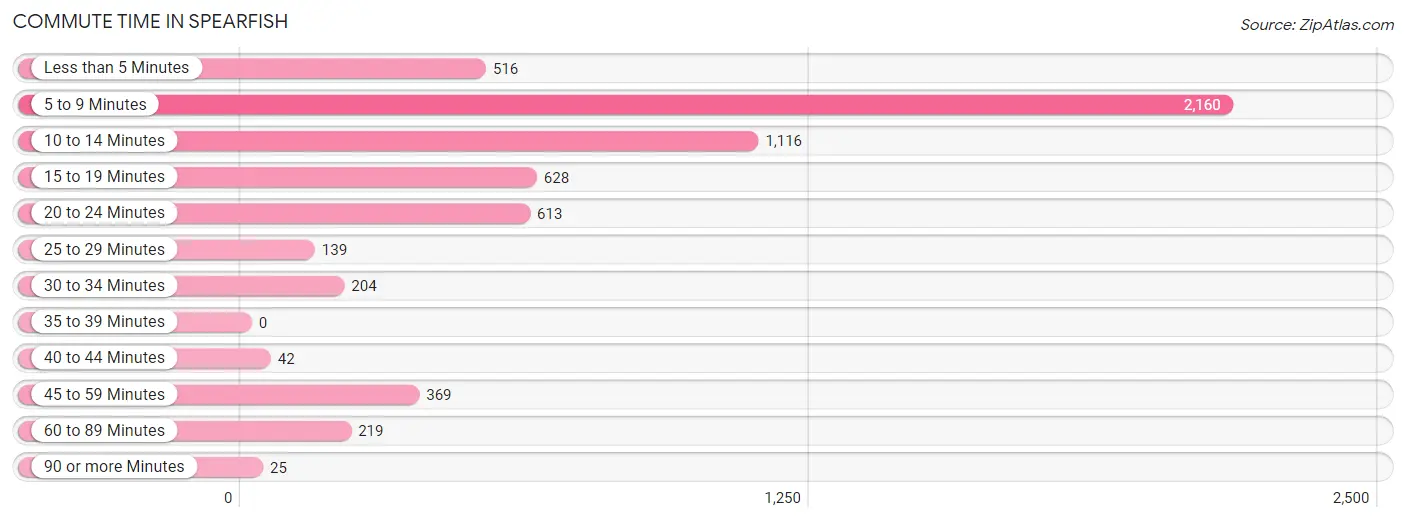
| Commute Time | # Commuters | % Commuters |
| Less than 5 Minutes | 516 | 8.6% |
| 5 to 9 Minutes | 2,160 | 35.8% |
| 10 to 14 Minutes | 1,116 | 18.5% |
| 15 to 19 Minutes | 628 | 10.4% |
| 20 to 24 Minutes | 613 | 10.2% |
| 25 to 29 Minutes | 139 | 2.3% |
| 30 to 34 Minutes | 204 | 3.4% |
| 35 to 39 Minutes | 0 | 0.0% |
| 40 to 44 Minutes | 42 | 0.7% |
| 45 to 59 Minutes | 369 | 6.1% |
| 60 to 89 Minutes | 219 | 3.6% |
| 90 or more Minutes | 25 | 0.4% |
Commute Time by Sex in Spearfish
The most common commute times in Spearfish are 5 to 9 minutes (847 commuters, 29.1%) for males and 5 to 9 minutes (1,313 commuters, 42.0%) for females.
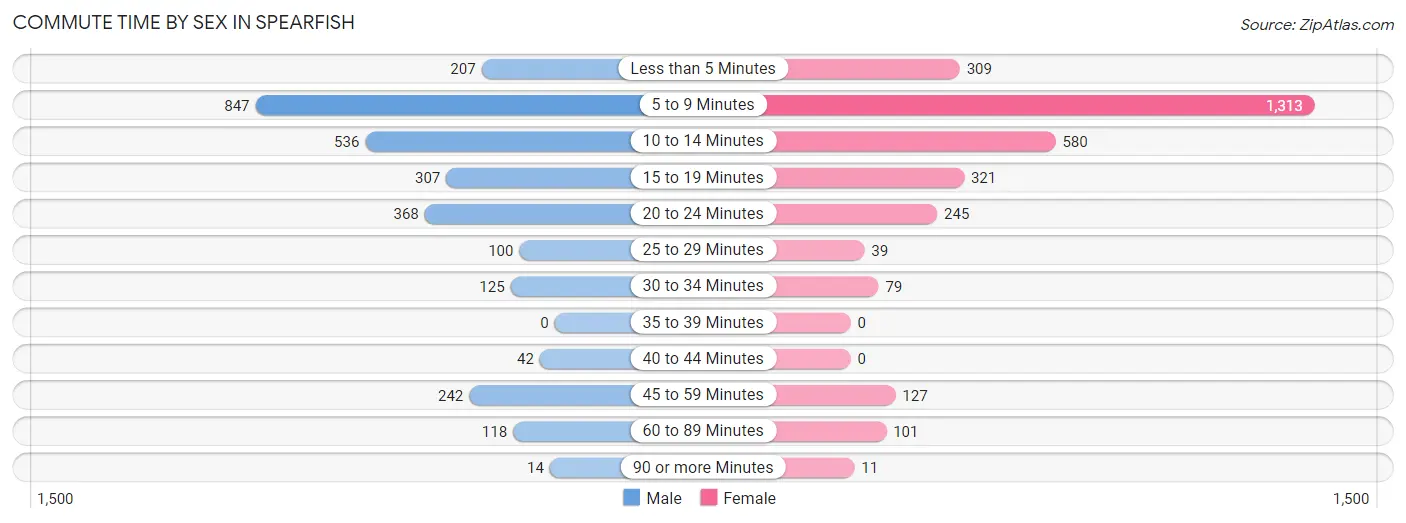
| Commute Time | Male | Female |
| Less than 5 Minutes | 207 (7.1%) | 309 (9.9%) |
| 5 to 9 Minutes | 847 (29.1%) | 1,313 (42.0%) |
| 10 to 14 Minutes | 536 (18.4%) | 580 (18.6%) |
| 15 to 19 Minutes | 307 (10.6%) | 321 (10.3%) |
| 20 to 24 Minutes | 368 (12.7%) | 245 (7.8%) |
| 25 to 29 Minutes | 100 (3.4%) | 39 (1.3%) |
| 30 to 34 Minutes | 125 (4.3%) | 79 (2.5%) |
| 35 to 39 Minutes | 0 (0.0%) | 0 (0.0%) |
| 40 to 44 Minutes | 42 (1.5%) | 0 (0.0%) |
| 45 to 59 Minutes | 242 (8.3%) | 127 (4.1%) |
| 60 to 89 Minutes | 118 (4.1%) | 101 (3.2%) |
| 90 or more Minutes | 14 (0.5%) | 11 (0.4%) |
Time of Departure to Work by Sex in Spearfish
The most frequent times of departure to work in Spearfish are 6:30 AM to 6:59 AM (477, 16.4%) for males and 7:30 AM to 7:59 AM (537, 17.2%) for females.
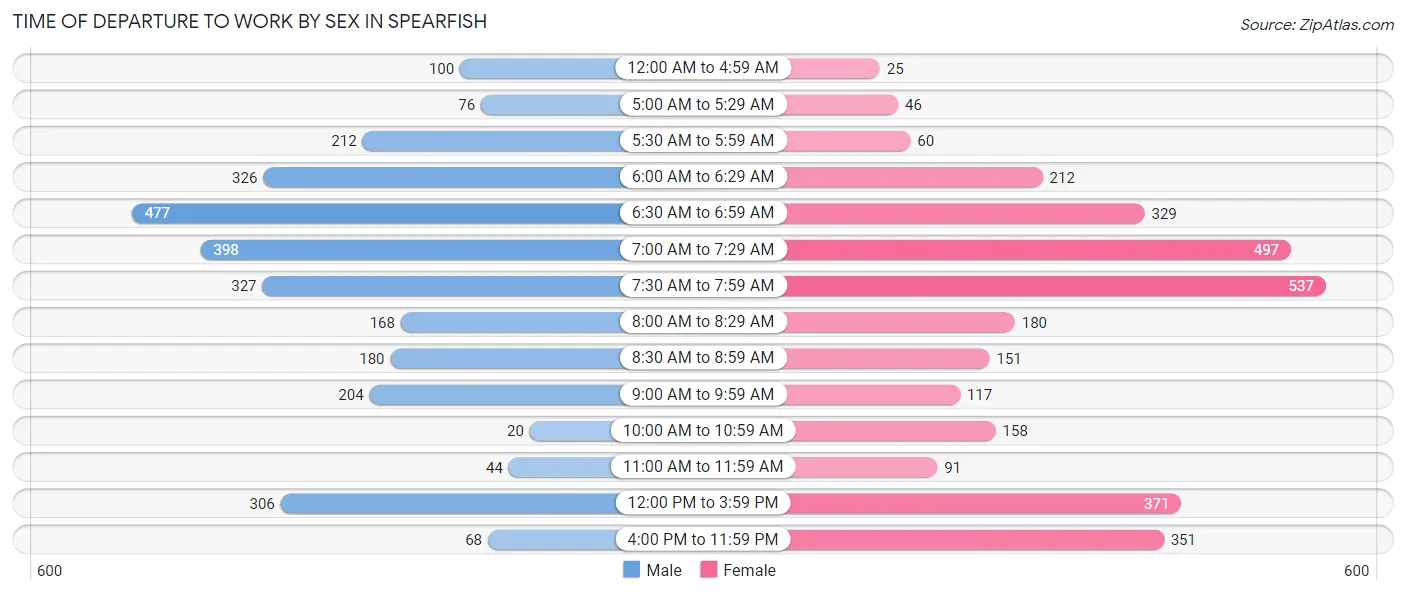
| Time of Departure | Male | Female |
| 12:00 AM to 4:59 AM | 100 (3.4%) | 25 (0.8%) |
| 5:00 AM to 5:29 AM | 76 (2.6%) | 46 (1.5%) |
| 5:30 AM to 5:59 AM | 212 (7.3%) | 60 (1.9%) |
| 6:00 AM to 6:29 AM | 326 (11.2%) | 212 (6.8%) |
| 6:30 AM to 6:59 AM | 477 (16.4%) | 329 (10.5%) |
| 7:00 AM to 7:29 AM | 398 (13.7%) | 497 (15.9%) |
| 7:30 AM to 7:59 AM | 327 (11.3%) | 537 (17.2%) |
| 8:00 AM to 8:29 AM | 168 (5.8%) | 180 (5.8%) |
| 8:30 AM to 8:59 AM | 180 (6.2%) | 151 (4.8%) |
| 9:00 AM to 9:59 AM | 204 (7.0%) | 117 (3.7%) |
| 10:00 AM to 10:59 AM | 20 (0.7%) | 158 (5.1%) |
| 11:00 AM to 11:59 AM | 44 (1.5%) | 91 (2.9%) |
| 12:00 PM to 3:59 PM | 306 (10.5%) | 371 (11.9%) |
| 4:00 PM to 11:59 PM | 68 (2.3%) | 351 (11.2%) |
| Total | 2,906 (100.0%) | 3,125 (100.0%) |
Housing Occupancy in Spearfish
Occupancy by Ownership in Spearfish
Of the total 5,556 dwellings in Spearfish, owner-occupied units account for 2,889 (52.0%), while renter-occupied units make up 2,667 (48.0%).
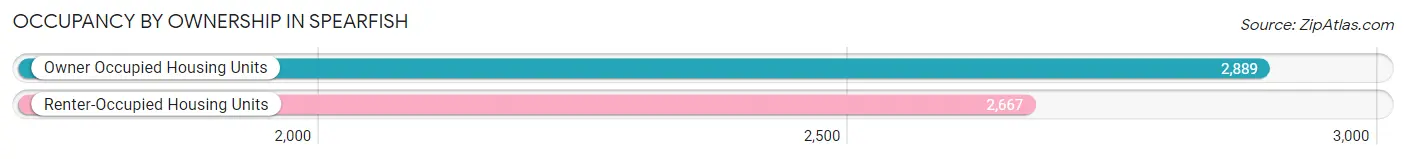
| Occupancy | # Housing Units | % Housing Units |
| Owner Occupied Housing Units | 2,889 | 52.0% |
| Renter-Occupied Housing Units | 2,667 | 48.0% |
| Total Occupied Housing Units | 5,556 | 100.0% |
Occupancy by Household Size in Spearfish
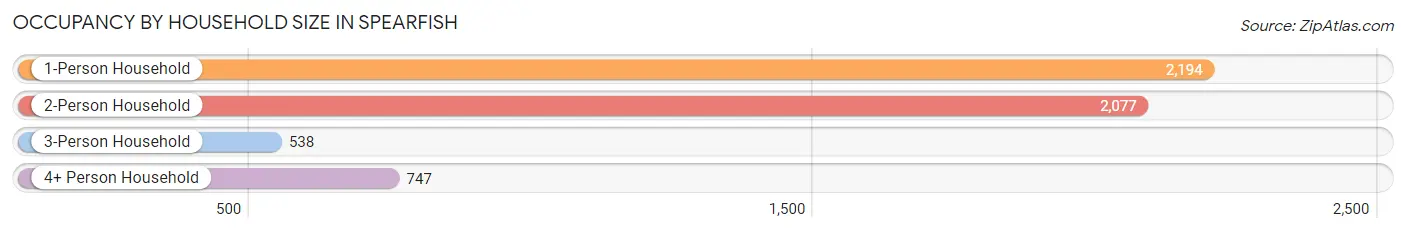
| Household Size | # Housing Units | % Housing Units |
| 1-Person Household | 2,194 | 39.5% |
| 2-Person Household | 2,077 | 37.4% |
| 3-Person Household | 538 | 9.7% |
| 4+ Person Household | 747 | 13.4% |
| Total Housing Units | 5,556 | 100.0% |
Occupancy by Ownership by Household Size in Spearfish
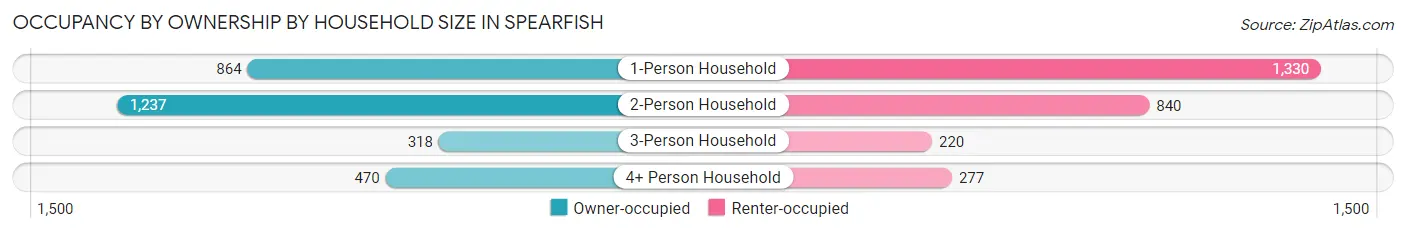
| Household Size | Owner-occupied | Renter-occupied |
| 1-Person Household | 864 (39.4%) | 1,330 (60.6%) |
| 2-Person Household | 1,237 (59.6%) | 840 (40.4%) |
| 3-Person Household | 318 (59.1%) | 220 (40.9%) |
| 4+ Person Household | 470 (62.9%) | 277 (37.1%) |
| Total Housing Units | 2,889 (52.0%) | 2,667 (48.0%) |
Occupancy by Educational Attainment in Spearfish
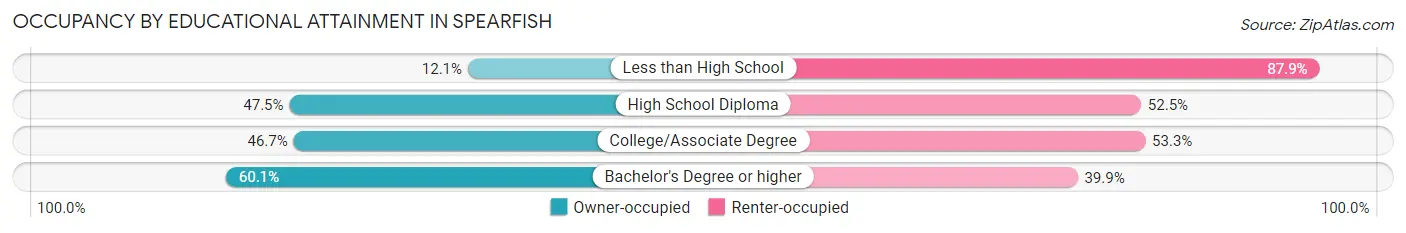
| Household Size | Owner-occupied | Renter-occupied |
| Less than High School | 12 (12.1%) | 87 (87.9%) |
| High School Diploma | 583 (47.5%) | 644 (52.5%) |
| College/Associate Degree | 862 (46.7%) | 985 (53.3%) |
| Bachelor's Degree or higher | 1,432 (60.1%) | 951 (39.9%) |
Occupancy by Age of Householder in Spearfish
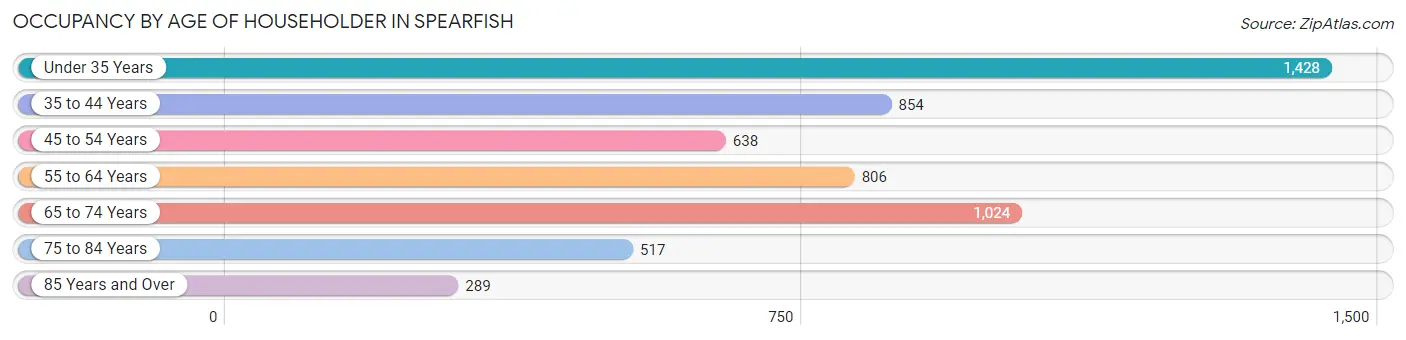
| Age Bracket | # Households | % Households |
| Under 35 Years | 1,428 | 25.7% |
| 35 to 44 Years | 854 | 15.4% |
| 45 to 54 Years | 638 | 11.5% |
| 55 to 64 Years | 806 | 14.5% |
| 65 to 74 Years | 1,024 | 18.4% |
| 75 to 84 Years | 517 | 9.3% |
| 85 Years and Over | 289 | 5.2% |
| Total | 5,556 | 100.0% |
Housing Finances in Spearfish
Median Income by Occupancy in Spearfish
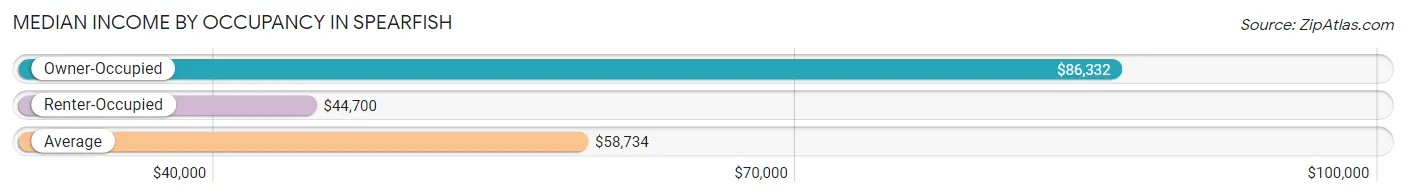
| Occupancy Type | # Households | Median Income |
| Owner-Occupied | 2,889 (52.0%) | $86,332 |
| Renter-Occupied | 2,667 (48.0%) | $44,700 |
| Average | 5,556 (100.0%) | $58,734 |
Occupancy by Householder Income Bracket in Spearfish
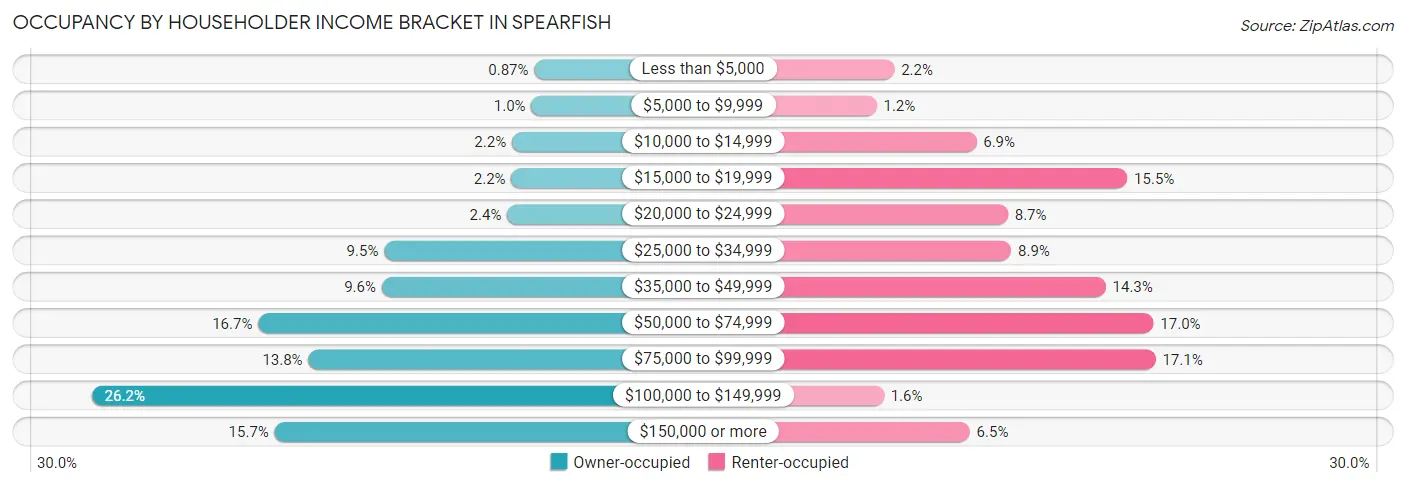
| Income Bracket | Owner-occupied | Renter-occupied |
| Less than $5,000 | 25 (0.9%) | 59 (2.2%) |
| $5,000 to $9,999 | 30 (1.0%) | 32 (1.2%) |
| $10,000 to $14,999 | 62 (2.1%) | 184 (6.9%) |
| $15,000 to $19,999 | 63 (2.2%) | 414 (15.5%) |
| $20,000 to $24,999 | 70 (2.4%) | 232 (8.7%) |
| $25,000 to $34,999 | 273 (9.5%) | 237 (8.9%) |
| $35,000 to $49,999 | 277 (9.6%) | 381 (14.3%) |
| $50,000 to $74,999 | 481 (16.7%) | 454 (17.0%) |
| $75,000 to $99,999 | 398 (13.8%) | 457 (17.1%) |
| $100,000 to $149,999 | 756 (26.2%) | 43 (1.6%) |
| $150,000 or more | 454 (15.7%) | 174 (6.5%) |
| Total | 2,889 (100.0%) | 2,667 (100.0%) |
Monthly Housing Cost Tiers in Spearfish
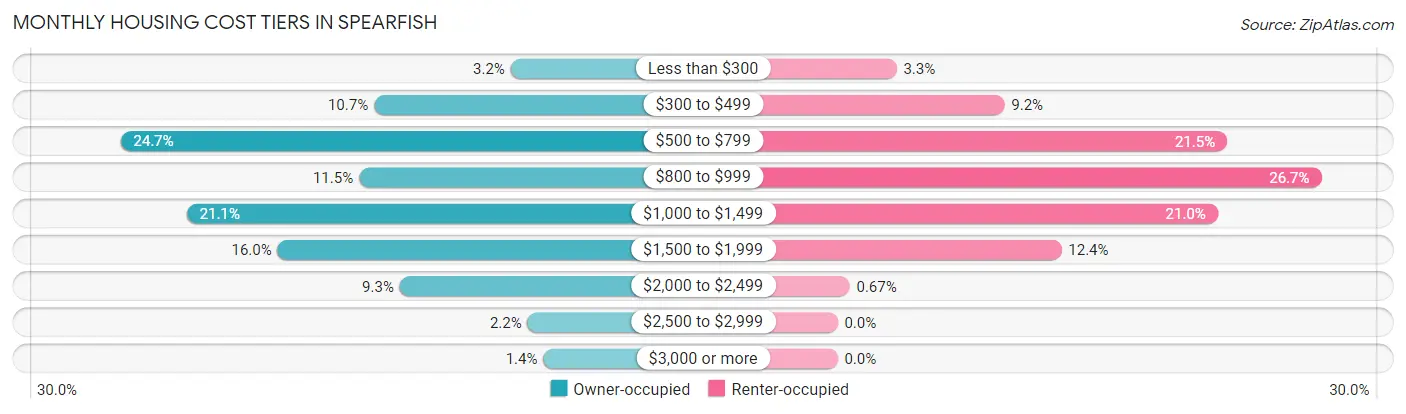
| Monthly Cost | Owner-occupied | Renter-occupied |
| Less than $300 | 91 (3.2%) | 87 (3.3%) |
| $300 to $499 | 309 (10.7%) | 246 (9.2%) |
| $500 to $799 | 714 (24.7%) | 574 (21.5%) |
| $800 to $999 | 333 (11.5%) | 713 (26.7%) |
| $1,000 to $1,499 | 608 (21.0%) | 560 (21.0%) |
| $1,500 to $1,999 | 463 (16.0%) | 330 (12.4%) |
| $2,000 to $2,499 | 268 (9.3%) | 18 (0.7%) |
| $2,500 to $2,999 | 64 (2.2%) | 0 (0.0%) |
| $3,000 or more | 39 (1.3%) | 0 (0.0%) |
| Total | 2,889 (100.0%) | 2,667 (100.0%) |
Physical Housing Characteristics in Spearfish
Housing Structures in Spearfish
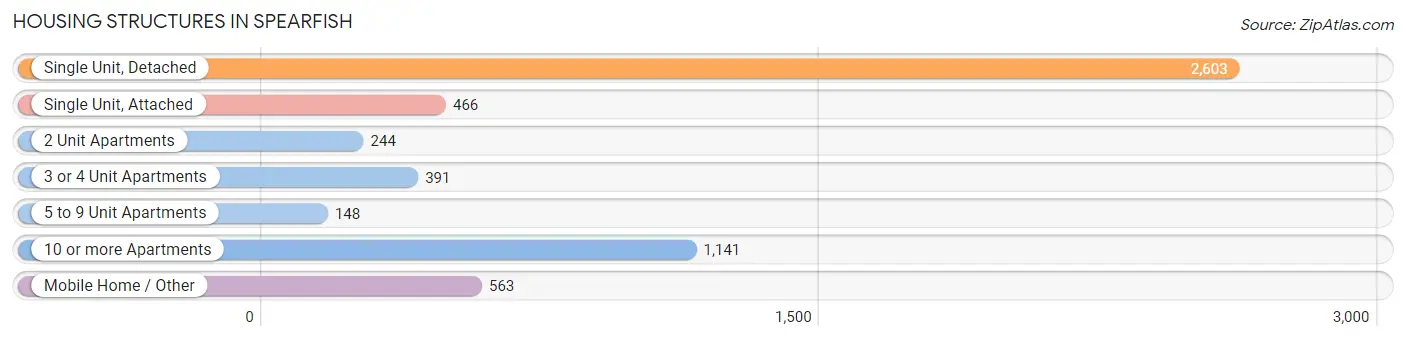
| Structure Type | # Housing Units | % Housing Units |
| Single Unit, Detached | 2,603 | 46.9% |
| Single Unit, Attached | 466 | 8.4% |
| 2 Unit Apartments | 244 | 4.4% |
| 3 or 4 Unit Apartments | 391 | 7.0% |
| 5 to 9 Unit Apartments | 148 | 2.7% |
| 10 or more Apartments | 1,141 | 20.5% |
| Mobile Home / Other | 563 | 10.1% |
| Total | 5,556 | 100.0% |
Housing Structures by Occupancy in Spearfish
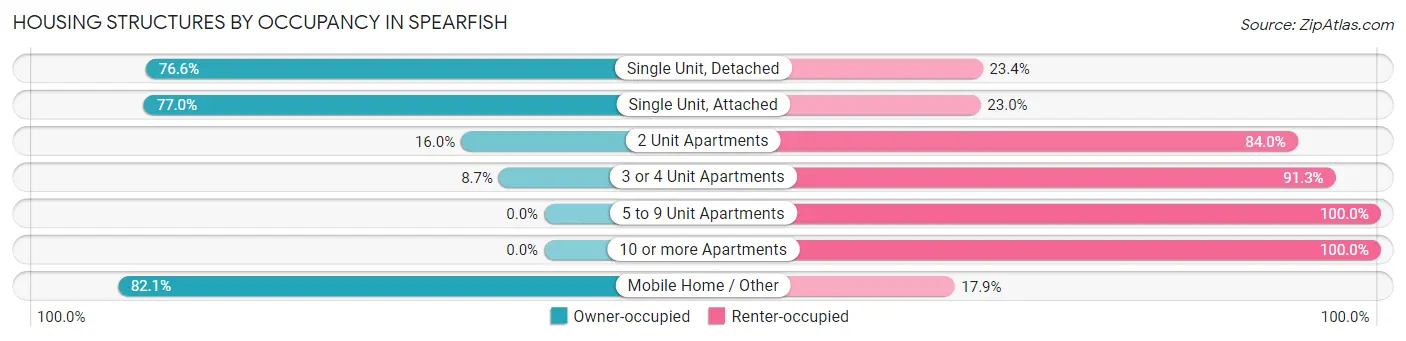
| Structure Type | Owner-occupied | Renter-occupied |
| Single Unit, Detached | 1,995 (76.6%) | 608 (23.4%) |
| Single Unit, Attached | 359 (77.0%) | 107 (23.0%) |
| 2 Unit Apartments | 39 (16.0%) | 205 (84.0%) |
| 3 or 4 Unit Apartments | 34 (8.7%) | 357 (91.3%) |
| 5 to 9 Unit Apartments | 0 (0.0%) | 148 (100.0%) |
| 10 or more Apartments | 0 (0.0%) | 1,141 (100.0%) |
| Mobile Home / Other | 462 (82.1%) | 101 (17.9%) |
| Total | 2,889 (52.0%) | 2,667 (48.0%) |
Housing Structures by Number of Rooms in Spearfish
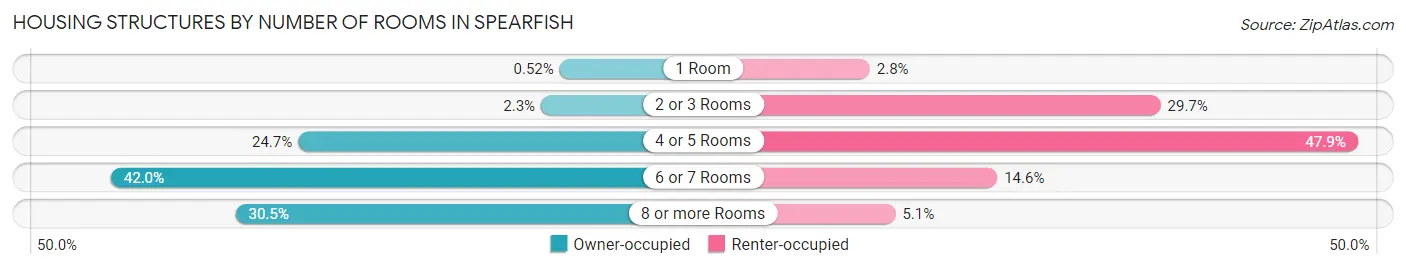
| Number of Rooms | Owner-occupied | Renter-occupied |
| 1 Room | 15 (0.5%) | 74 (2.8%) |
| 2 or 3 Rooms | 65 (2.2%) | 791 (29.7%) |
| 4 or 5 Rooms | 714 (24.7%) | 1,277 (47.9%) |
| 6 or 7 Rooms | 1,214 (42.0%) | 388 (14.5%) |
| 8 or more Rooms | 881 (30.5%) | 137 (5.1%) |
| Total | 2,889 (100.0%) | 2,667 (100.0%) |
Housing Structure by Heating Type in Spearfish
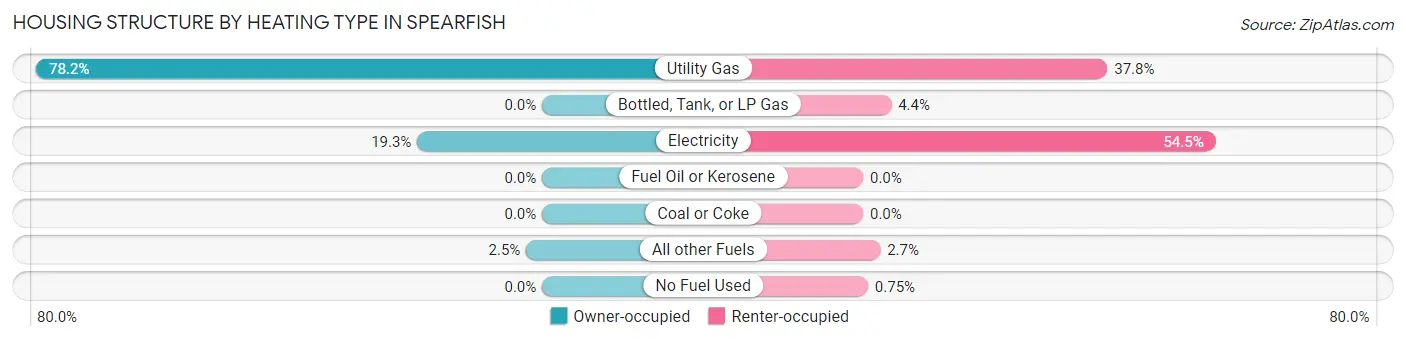
| Heating Type | Owner-occupied | Renter-occupied |
| Utility Gas | 2,260 (78.2%) | 1,007 (37.8%) |
| Bottled, Tank, or LP Gas | 0 (0.0%) | 116 (4.3%) |
| Electricity | 558 (19.3%) | 1,453 (54.5%) |
| Fuel Oil or Kerosene | 0 (0.0%) | 0 (0.0%) |
| Coal or Coke | 0 (0.0%) | 0 (0.0%) |
| All other Fuels | 71 (2.5%) | 71 (2.7%) |
| No Fuel Used | 0 (0.0%) | 20 (0.7%) |
| Total | 2,889 (100.0%) | 2,667 (100.0%) |
Household Vehicle Usage in Spearfish
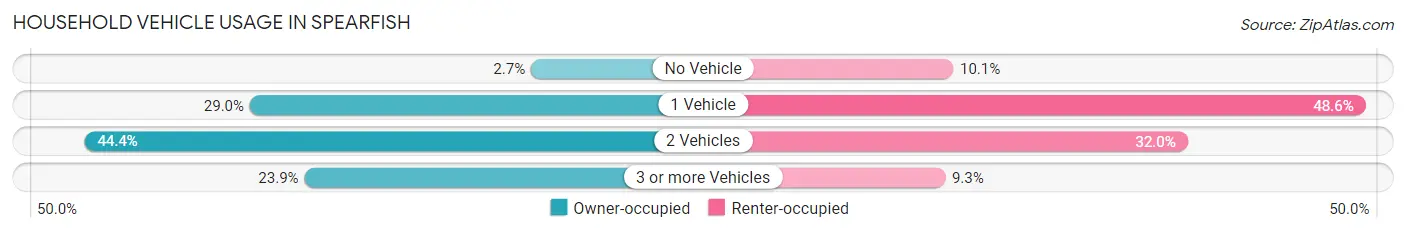
| Vehicles per Household | Owner-occupied | Renter-occupied |
| No Vehicle | 79 (2.7%) | 269 (10.1%) |
| 1 Vehicle | 837 (29.0%) | 1,296 (48.6%) |
| 2 Vehicles | 1,283 (44.4%) | 853 (32.0%) |
| 3 or more Vehicles | 690 (23.9%) | 249 (9.3%) |
| Total | 2,889 (100.0%) | 2,667 (100.0%) |
Real Estate & Mortgages in Spearfish
Real Estate and Mortgage Overview in Spearfish
| Characteristic | Without Mortgage | With Mortgage |
| Housing Units | 1,467 | 1,422 |
| Median Property Value | $232,500 | $290,200 |
| Median Household Income | $64,750 | $285 |
| Monthly Housing Costs | $615 | $39 |
| Real Estate Taxes | $2,540 | $89 |
Property Value by Mortgage Status in Spearfish
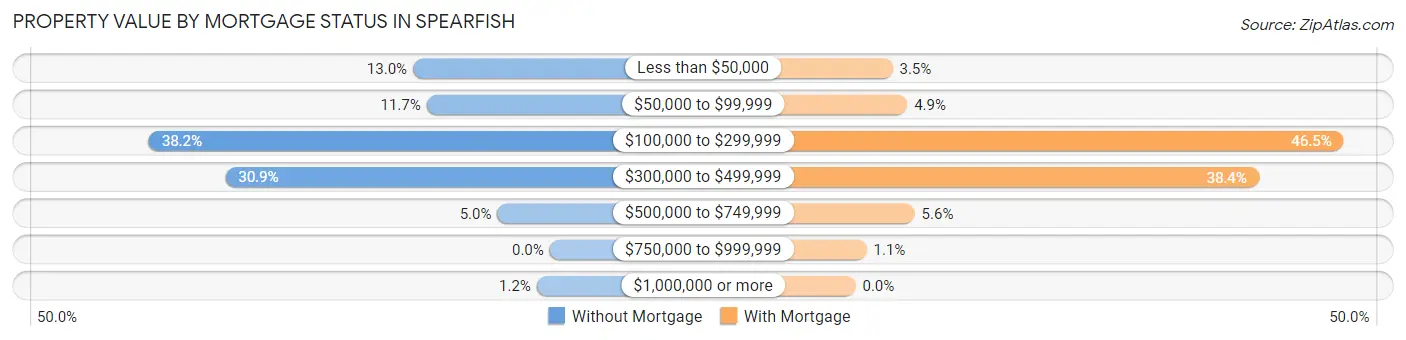
| Property Value | Without Mortgage | With Mortgage |
| Less than $50,000 | 191 (13.0%) | 50 (3.5%) |
| $50,000 to $99,999 | 172 (11.7%) | 70 (4.9%) |
| $100,000 to $299,999 | 560 (38.2%) | 661 (46.5%) |
| $300,000 to $499,999 | 453 (30.9%) | 546 (38.4%) |
| $500,000 to $749,999 | 73 (5.0%) | 80 (5.6%) |
| $750,000 to $999,999 | 0 (0.0%) | 15 (1.1%) |
| $1,000,000 or more | 18 (1.2%) | 0 (0.0%) |
| Total | 1,467 (100.0%) | 1,422 (100.0%) |
Household Income by Mortgage Status in Spearfish
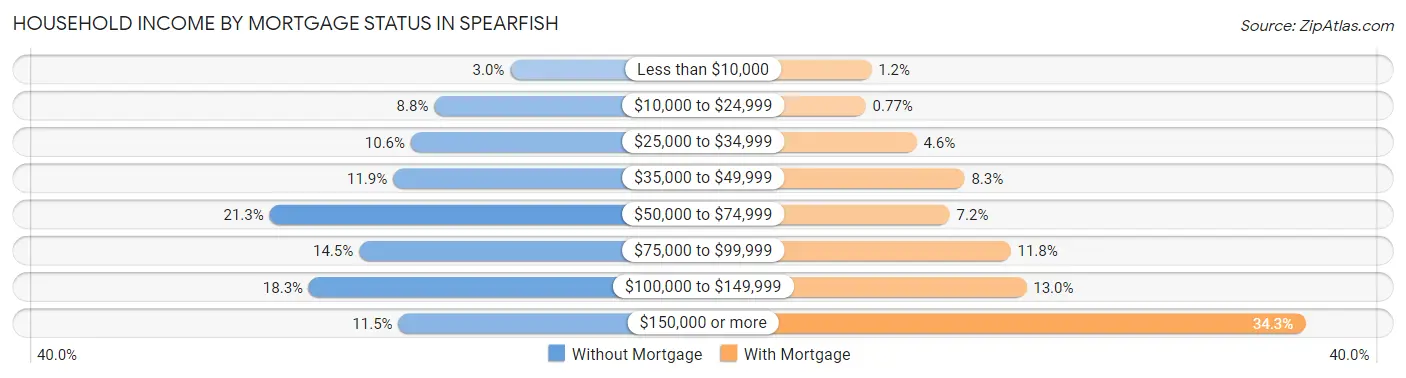
| Household Income | Without Mortgage | With Mortgage |
| Less than $10,000 | 44 (3.0%) | 17 (1.2%) |
| $10,000 to $24,999 | 129 (8.8%) | 11 (0.8%) |
| $25,000 to $34,999 | 155 (10.6%) | 66 (4.6%) |
| $35,000 to $49,999 | 175 (11.9%) | 118 (8.3%) |
| $50,000 to $74,999 | 313 (21.3%) | 102 (7.2%) |
| $75,000 to $99,999 | 213 (14.5%) | 168 (11.8%) |
| $100,000 to $149,999 | 269 (18.3%) | 185 (13.0%) |
| $150,000 or more | 169 (11.5%) | 487 (34.3%) |
| Total | 1,467 (100.0%) | 1,422 (100.0%) |
Property Value to Household Income Ratio in Spearfish
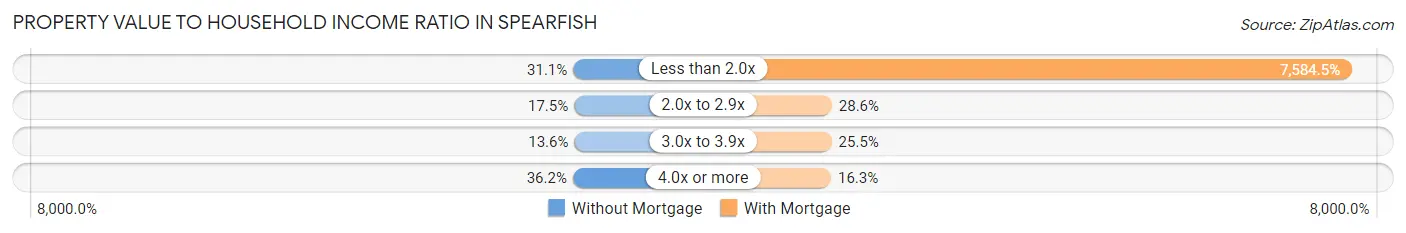
| Value-to-Income Ratio | Without Mortgage | With Mortgage |
| Less than 2.0x | 456 (31.1%) | 107,852 (7,584.5%) |
| 2.0x to 2.9x | 256 (17.4%) | 406 (28.5%) |
| 3.0x to 3.9x | 199 (13.6%) | 362 (25.5%) |
| 4.0x or more | 531 (36.2%) | 232 (16.3%) |
| Total | 1,467 (100.0%) | 1,422 (100.0%) |
Real Estate Taxes by Mortgage Status in Spearfish
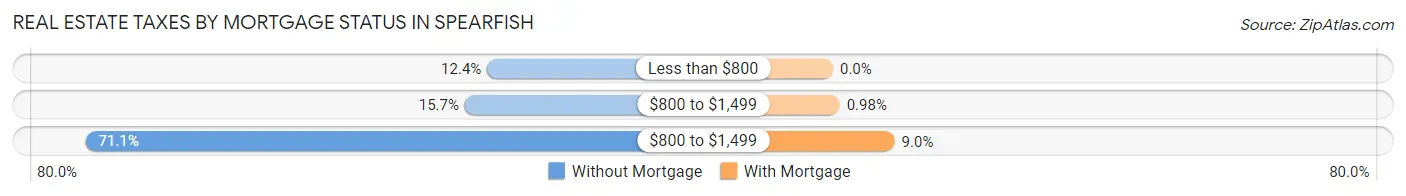
| Property Taxes | Without Mortgage | With Mortgage |
| Less than $800 | 182 (12.4%) | 0 (0.0%) |
| $800 to $1,499 | 230 (15.7%) | 14 (1.0%) |
| $800 to $1,499 | 1,043 (71.1%) | 128 (9.0%) |
| Total | 1,467 (100.0%) | 1,422 (100.0%) |
Health & Disability in Spearfish
Health Insurance Coverage by Age in Spearfish
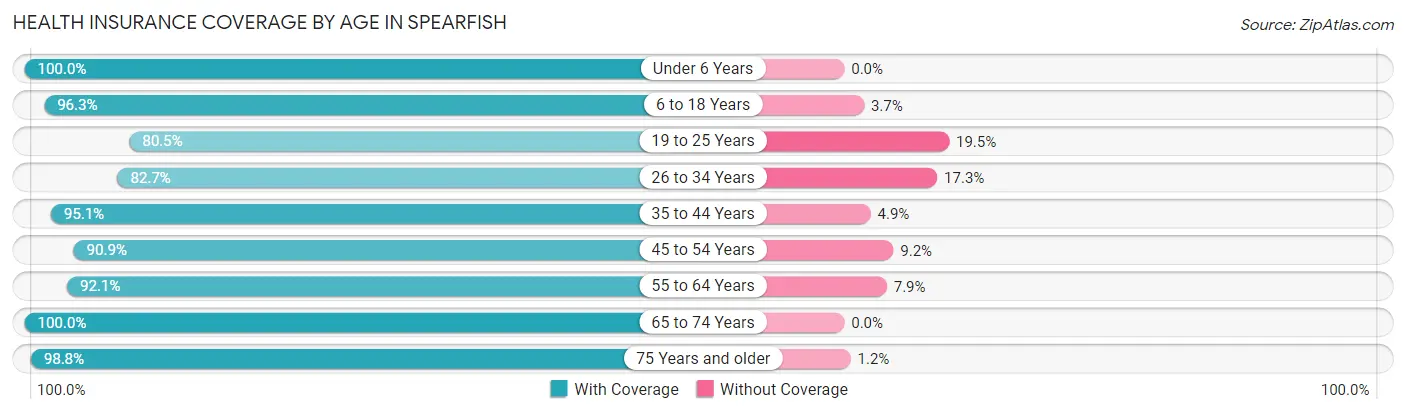
| Age Bracket | With Coverage | Without Coverage |
| Under 6 Years | 595 (100.0%) | 0 (0.0%) |
| 6 to 18 Years | 1,837 (96.3%) | 70 (3.7%) |
| 19 to 25 Years | 1,446 (80.5%) | 351 (19.5%) |
| 26 to 34 Years | 1,069 (82.7%) | 224 (17.3%) |
| 35 to 44 Years | 1,395 (95.1%) | 72 (4.9%) |
| 45 to 54 Years | 884 (90.8%) | 89 (9.1%) |
| 55 to 64 Years | 1,303 (92.1%) | 112 (7.9%) |
| 65 to 74 Years | 1,453 (100.0%) | 0 (0.0%) |
| 75 Years and older | 1,178 (98.8%) | 14 (1.2%) |
| Total | 11,160 (92.3%) | 932 (7.7%) |
Health Insurance Coverage by Citizenship Status in Spearfish
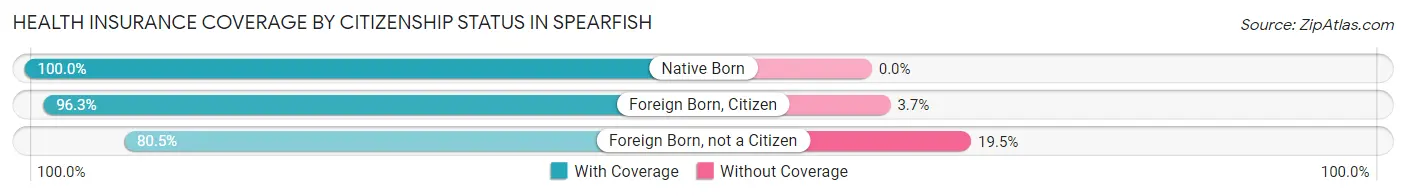
| Citizenship Status | With Coverage | Without Coverage |
| Native Born | 595 (100.0%) | 0 (0.0%) |
| Foreign Born, Citizen | 1,837 (96.3%) | 70 (3.7%) |
| Foreign Born, not a Citizen | 1,446 (80.5%) | 351 (19.5%) |
Health Insurance Coverage by Household Income in Spearfish
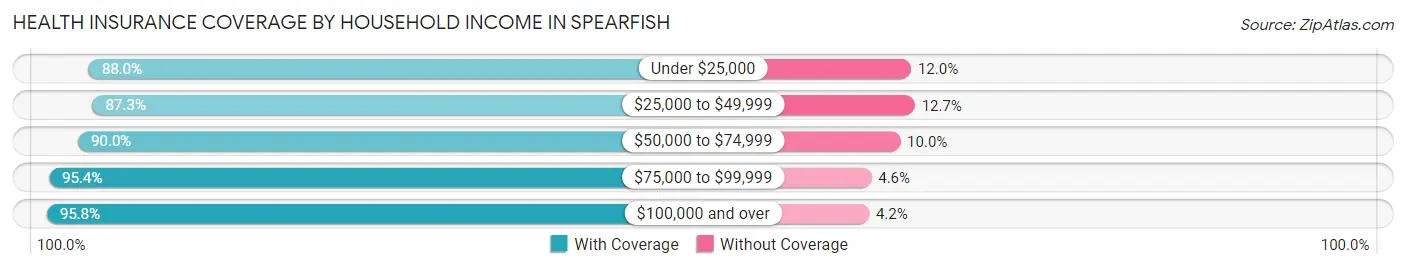
| Household Income | With Coverage | Without Coverage |
| Under $25,000 | 1,397 (88.0%) | 191 (12.0%) |
| $25,000 to $49,999 | 1,729 (87.3%) | 252 (12.7%) |
| $50,000 to $74,999 | 1,467 (90.0%) | 163 (10.0%) |
| $75,000 to $99,999 | 1,829 (95.4%) | 88 (4.6%) |
| $100,000 and over | 4,167 (95.8%) | 181 (4.2%) |
Public vs Private Health Insurance Coverage by Age in Spearfish
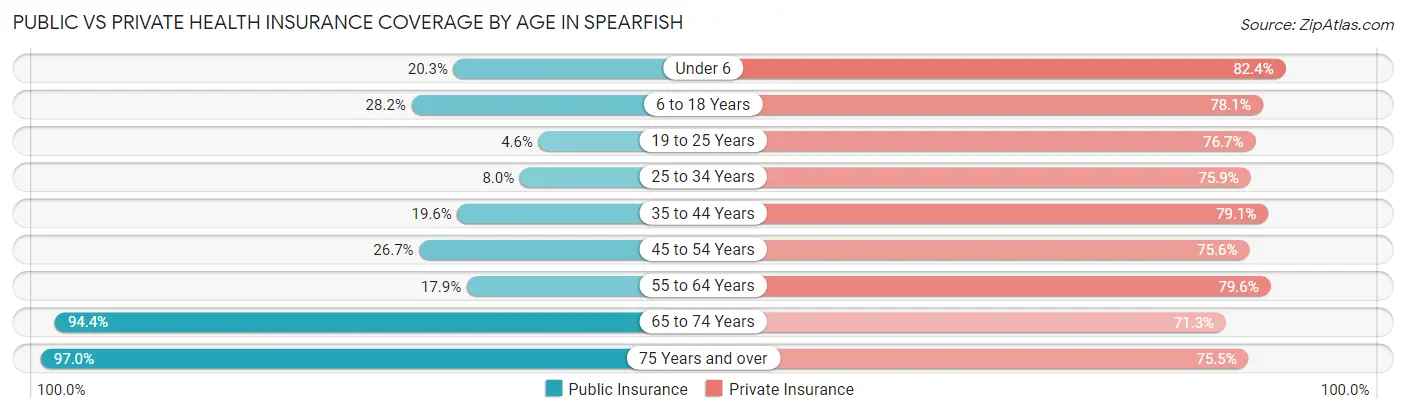
| Age Bracket | Public Insurance | Private Insurance |
| Under 6 | 121 (20.3%) | 490 (82.4%) |
| 6 to 18 Years | 537 (28.2%) | 1,489 (78.1%) |
| 19 to 25 Years | 82 (4.6%) | 1,379 (76.7%) |
| 25 to 34 Years | 104 (8.0%) | 981 (75.9%) |
| 35 to 44 Years | 288 (19.6%) | 1,161 (79.1%) |
| 45 to 54 Years | 260 (26.7%) | 736 (75.6%) |
| 55 to 64 Years | 253 (17.9%) | 1,126 (79.6%) |
| 65 to 74 Years | 1,371 (94.4%) | 1,036 (71.3%) |
| 75 Years and over | 1,156 (97.0%) | 900 (75.5%) |
| Total | 4,172 (34.5%) | 9,298 (76.9%) |
Disability Status by Sex by Age in Spearfish
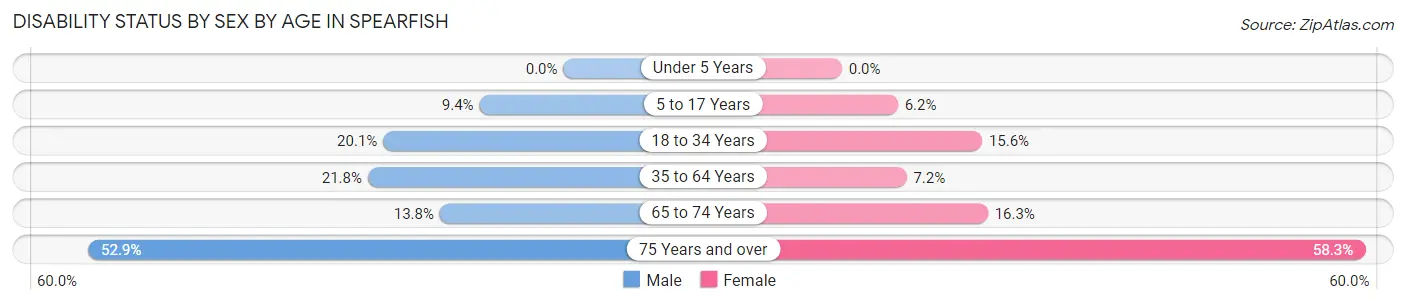
| Age Bracket | Male | Female |
| Under 5 Years | 0 (0.0%) | 0 (0.0%) |
| 5 to 17 Years | 82 (9.3%) | 47 (6.2%) |
| 18 to 34 Years | 287 (20.1%) | 307 (15.6%) |
| 35 to 64 Years | 422 (21.8%) | 138 (7.2%) |
| 65 to 74 Years | 100 (13.8%) | 118 (16.3%) |
| 75 Years and over | 263 (52.9%) | 405 (58.3%) |
Disability Class by Sex by Age in Spearfish
Disability Class: Hearing Difficulty
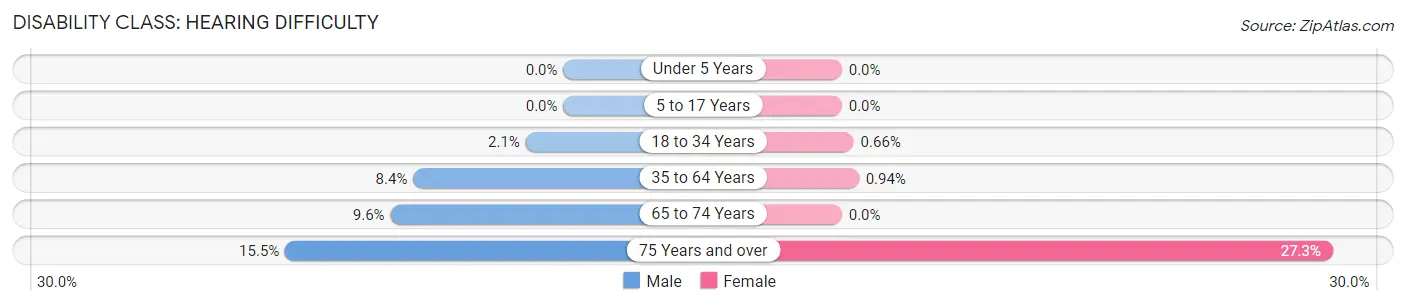
| Age Bracket | Male | Female |
| Under 5 Years | 0 (0.0%) | 0 (0.0%) |
| 5 to 17 Years | 0 (0.0%) | 0 (0.0%) |
| 18 to 34 Years | 30 (2.1%) | 13 (0.7%) |
| 35 to 64 Years | 162 (8.4%) | 18 (0.9%) |
| 65 to 74 Years | 70 (9.6%) | 0 (0.0%) |
| 75 Years and over | 77 (15.5%) | 190 (27.3%) |
Disability Class: Vision Difficulty
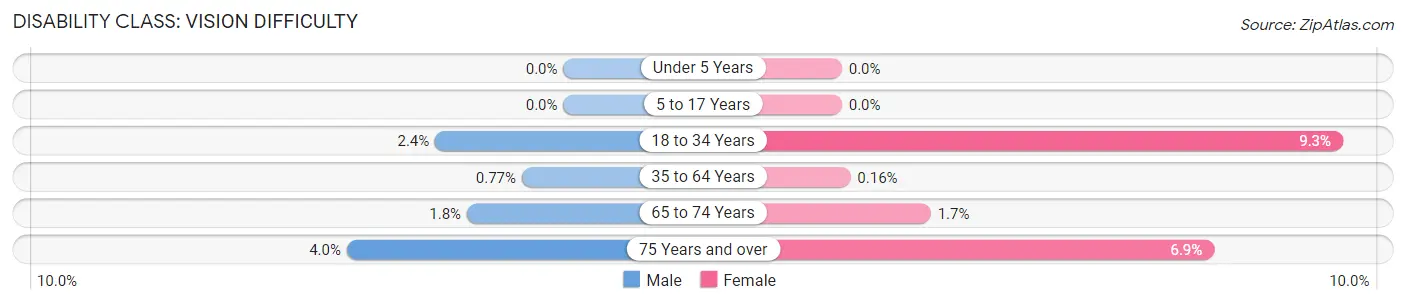
| Age Bracket | Male | Female |
| Under 5 Years | 0 (0.0%) | 0 (0.0%) |
| 5 to 17 Years | 0 (0.0%) | 0 (0.0%) |
| 18 to 34 Years | 34 (2.4%) | 183 (9.3%) |
| 35 to 64 Years | 15 (0.8%) | 3 (0.2%) |
| 65 to 74 Years | 13 (1.8%) | 12 (1.7%) |
| 75 Years and over | 20 (4.0%) | 48 (6.9%) |
Disability Class: Cognitive Difficulty
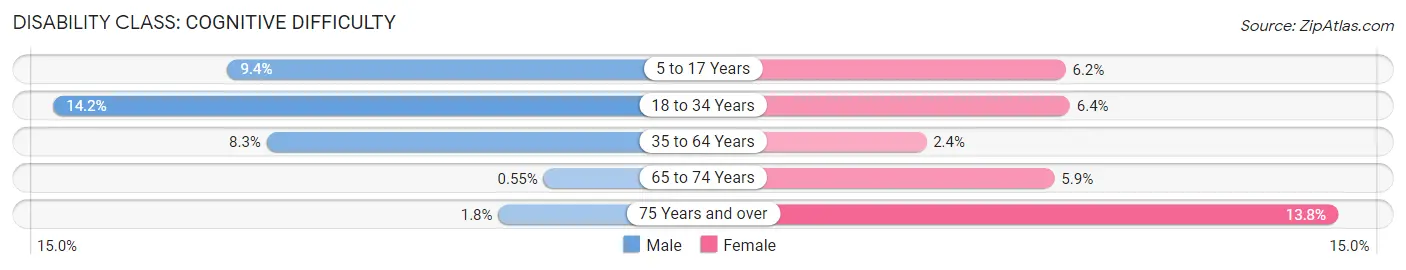
| Age Bracket | Male | Female |
| 5 to 17 Years | 82 (9.3%) | 47 (6.2%) |
| 18 to 34 Years | 203 (14.2%) | 125 (6.4%) |
| 35 to 64 Years | 160 (8.3%) | 45 (2.4%) |
| 65 to 74 Years | 4 (0.5%) | 43 (5.9%) |
| 75 Years and over | 9 (1.8%) | 96 (13.8%) |
Disability Class: Ambulatory Difficulty
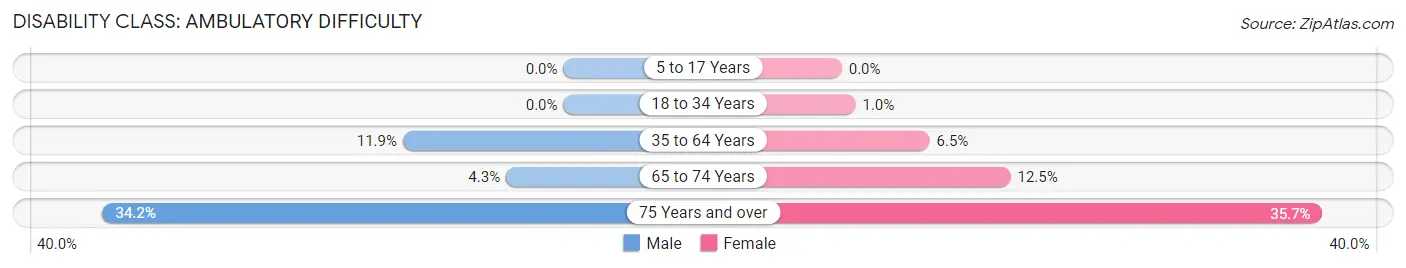
| Age Bracket | Male | Female |
| 5 to 17 Years | 0 (0.0%) | 0 (0.0%) |
| 18 to 34 Years | 0 (0.0%) | 20 (1.0%) |
| 35 to 64 Years | 231 (11.9%) | 125 (6.5%) |
| 65 to 74 Years | 31 (4.3%) | 91 (12.5%) |
| 75 Years and over | 170 (34.2%) | 248 (35.7%) |
Disability Class: Self-Care Difficulty
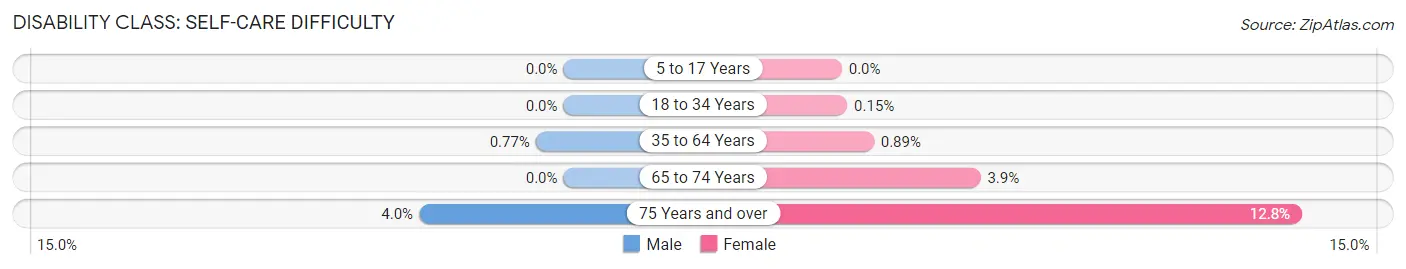
| Age Bracket | Male | Female |
| 5 to 17 Years | 0 (0.0%) | 0 (0.0%) |
| 18 to 34 Years | 0 (0.0%) | 3 (0.2%) |
| 35 to 64 Years | 15 (0.8%) | 17 (0.9%) |
| 65 to 74 Years | 0 (0.0%) | 28 (3.9%) |
| 75 Years and over | 20 (4.0%) | 89 (12.8%) |
Technology Access in Spearfish
Computing Device Access in Spearfish
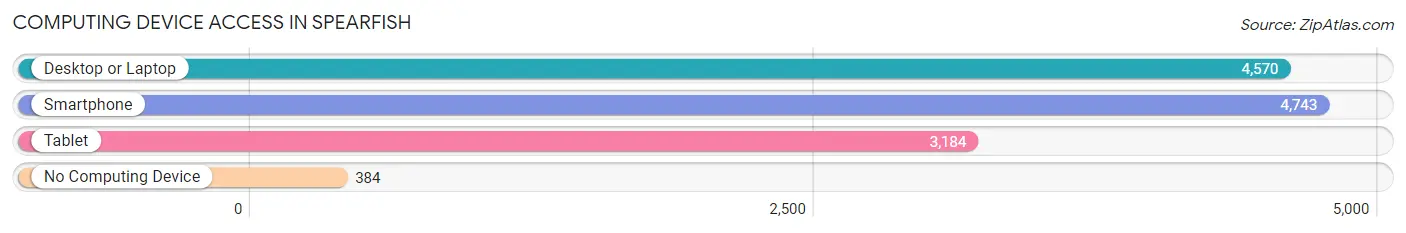
| Device Type | # Households | % Households |
| Desktop or Laptop | 4,570 | 82.3% |
| Smartphone | 4,743 | 85.4% |
| Tablet | 3,184 | 57.3% |
| No Computing Device | 384 | 6.9% |
| Total | 5,556 | 100.0% |
Internet Access in Spearfish
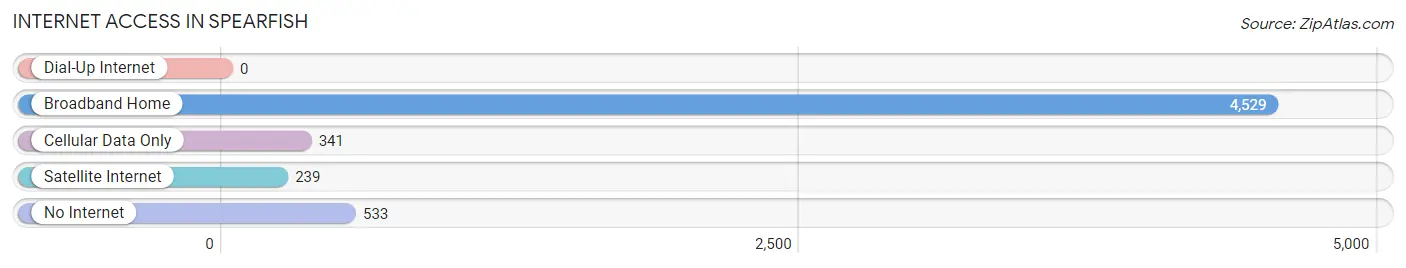
| Internet Type | # Households | % Households |
| Dial-Up Internet | 0 | 0.0% |
| Broadband Home | 4,529 | 81.5% |
| Cellular Data Only | 341 | 6.1% |
| Satellite Internet | 239 | 4.3% |
| No Internet | 533 | 9.6% |
| Total | 5,556 | 100.0% |
Spearfish Summary
Spearfish, South Dakota is a small city located in the northern Black Hills region of the state. It is the county seat of Lawrence County and is home to a population of approximately 11,000 people. The city is known for its outdoor recreation opportunities, its historic downtown, and its proximity to the Black Hills National Forest.
Geography
Spearfish is located in the northern Black Hills region of South Dakota, approximately 20 miles east of the Wyoming border. The city is situated in a valley between the Black Hills and the Bear Lodge Mountains. Spearfish Creek runs through the city, and Spearfish Canyon is located just to the north. The city is located at an elevation of 3,845 feet.
Climate
Spearfish has a semi-arid climate, with hot summers and cold winters. The average high temperature in July is 85°F, and the average low temperature in January is 11°F. The city receives an average of 17 inches of precipitation per year, with most of it falling in the spring and summer months.
Economy
Spearfish’s economy is largely based on tourism, with many visitors coming to the city to take advantage of its outdoor recreation opportunities. The city is also home to several manufacturing companies, including a steel mill and a paper mill. The city is also home to several retail stores, restaurants, and other businesses.
Demographics
As of the 2010 census, the population of Spearfish was 10,494. The racial makeup of the city was 94.3% White, 0.7% African American, 1.2% Native American, 0.7% Asian, 0.1% Pacific Islander, 1.3% from other races, and 1.9% from two or more races. Hispanic or Latino of any race were 3.2% of the population.
The median income for a household in Spearfish was $41,945, and the median income for a family was $50,945. The per capita income for the city was $20,945. About 8.3% of families and 11.2% of the population were below the poverty line, including 14.2% of those under age 18 and 6.2% of those age 65 or over.
History
Spearfish was founded in 1876 by miners who were searching for gold in the Black Hills. The city was named after the Spearfish River, which was named by the Lakota Sioux for the abundance of fish in the river. The city was incorporated in 1883 and quickly became a center for mining and ranching.
In the early 1900s, Spearfish began to attract tourists who were drawn to the city’s outdoor recreation opportunities. The city was also home to several resorts, including the Spearfish Hotel, which was built in 1907.
In the 1950s, Spearfish began to experience a population boom as people moved to the city to take advantage of its outdoor recreation opportunities. The city has continued to grow since then, and today it is a popular destination for tourists and outdoor enthusiasts.
Common Questions
What is Per Capita Income in Spearfish?
Per Capita income in Spearfish is $44,700.
What is the Median Family Income in Spearfish?
Median Family Income in Spearfish is $89,812.
What is the Median Household income in Spearfish?
Median Household Income in Spearfish is $58,734.
What is Income or Wage Gap in Spearfish?
Income or Wage Gap in Spearfish is 37.5%.
Women in Spearfish earn 62.5 cents for every dollar earned by a man.
What is Family Income Deficit in Spearfish?
Family Income Deficit in Spearfish is $7,713.
Families that are below poverty line in Spearfish earn $7,713 less on average than the poverty threshold level.
What is Inequality or Gini Index in Spearfish?
Inequality or Gini Index in Spearfish is 0.50.
What is the Total Population of Spearfish?
Total Population of Spearfish is 12,268.
What is the Total Male Population of Spearfish?
Total Male Population of Spearfish is 5,856.
What is the Total Female Population of Spearfish?
Total Female Population of Spearfish is 6,412.
What is the Ratio of Males per 100 Females in Spearfish?
There are 91.33 Males per 100 Females in Spearfish.
What is the Ratio of Females per 100 Males in Spearfish?
There are 109.49 Females per 100 Males in Spearfish.
What is the Median Population Age in Spearfish?
Median Population Age in Spearfish is 38.4 Years.
What is the Average Family Size in Spearfish
Average Family Size in Spearfish is 2.9 People.
What is the Average Household Size in Spearfish
Average Household Size in Spearfish is 2.1 People.
How Large is the Labor Force in Spearfish?
There are 6,626 People in the Labor Forcein in Spearfish.
What is the Percentage of People in the Labor Force in Spearfish?
64.2% of People are in the Labor Force in Spearfish.
What is the Unemployment Rate in Spearfish?
Unemployment Rate in Spearfish is 2.3%.