De Smet, SD Map & Demographics
De Smet Map
De Smet Overview
$37,271
PER CAPITA INCOME
$86,591
AVG FAMILY INCOME
$57,656
AVG HOUSEHOLD INCOME
32.6%
WAGE / INCOME GAP [ % ]
67.4¢/ $1
WAGE / INCOME GAP [ $ ]
0.39
INEQUALITY / GINI INDEX
990
TOTAL POPULATION
512
MALE POPULATION
478
FEMALE POPULATION
107.11
MALES / 100 FEMALES
93.36
FEMALES / 100 MALES
55.2
MEDIAN AGE
3.0
AVG FAMILY SIZE
2.2
AVG HOUSEHOLD SIZE
513
LABOR FORCE [ PEOPLE ]
61.9%
PERCENT IN LABOR FORCE
De Smet Zip Codes
De Smet Area Codes
Income in De Smet
Income Overview in De Smet
Per Capita Income in De Smet is $37,271, while median incomes of families and households are $86,591 and $57,656 respectively.
| Characteristic | Number | Measure |
| Per Capita Income | 990 | $37,271 |
| Median Family Income | 226 | $86,591 |
| Mean Family Income | 226 | $98,818 |
| Median Household Income | 431 | $57,656 |
| Mean Household Income | 431 | $78,782 |
| Income Deficit | 226 | $0 |
| Wage / Income Gap (%) | 990 | 32.65% |
| Wage / Income Gap ($) | 990 | 67.35¢ per $1 |
| Gini / Inequality Index | 990 | 0.39 |
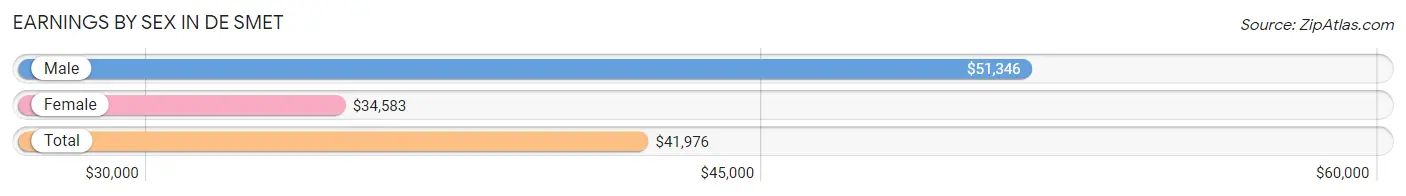
Earnings by Sex in De Smet
Average Earnings in De Smet are $41,976, $51,346 for men and $34,583 for women, a difference of 32.7%.
| Sex | Number | Average Earnings |
| Male | 276 (52.8%) | $51,346 |
| Female | 247 (47.2%) | $34,583 |
| Total | 523 (100.0%) | $41,976 |
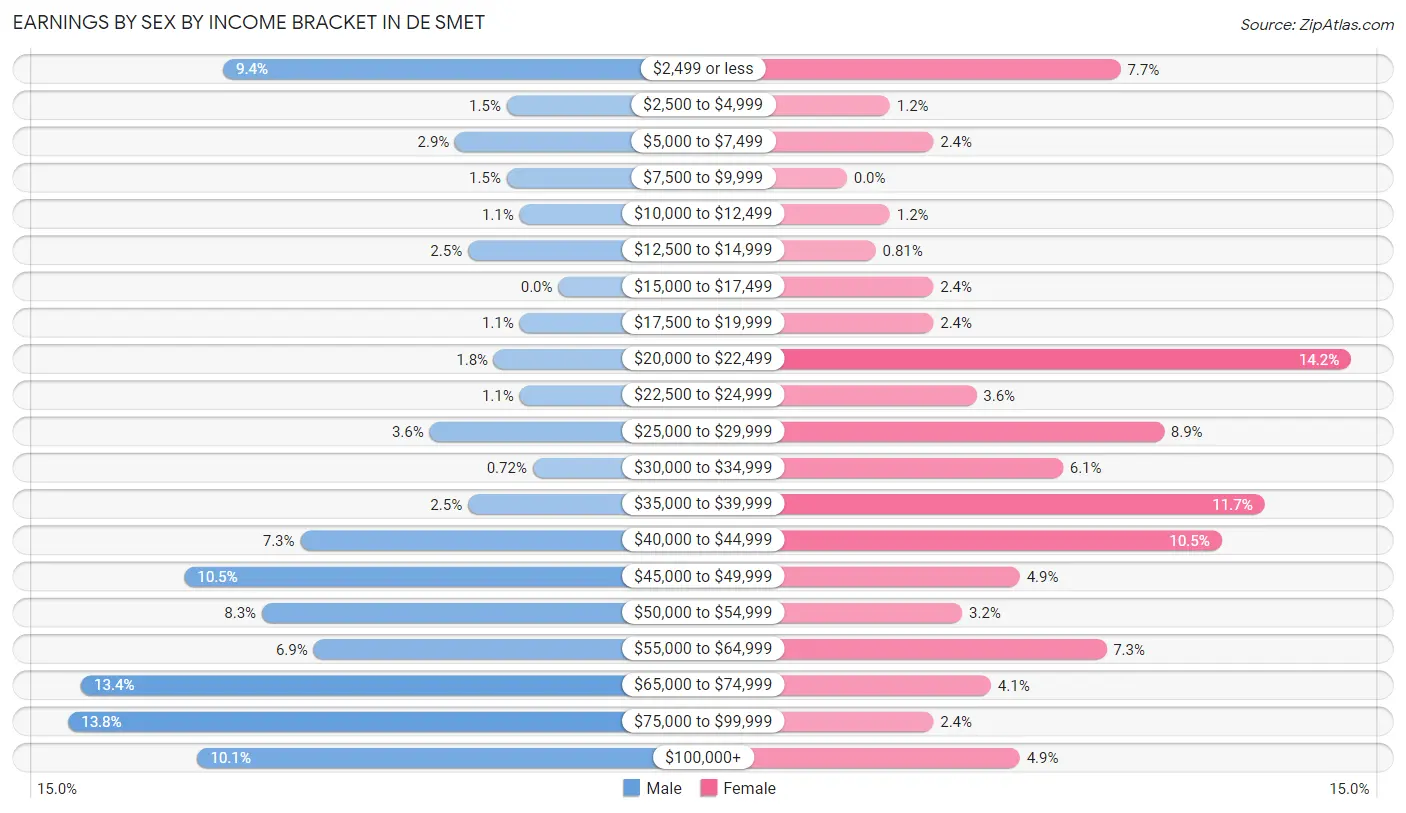
Earnings by Sex by Income Bracket in De Smet
The most common earnings brackets in De Smet are $75,000 to $99,999 for men (38 | 13.8%) and $20,000 to $22,499 for women (35 | 14.2%).
| Income | Male | Female |
| $2,499 or less | 26 (9.4%) | 19 (7.7%) |
| $2,500 to $4,999 | 4 (1.5%) | 3 (1.2%) |
| $5,000 to $7,499 | 8 (2.9%) | 6 (2.4%) |
| $7,500 to $9,999 | 4 (1.5%) | 0 (0.0%) |
| $10,000 to $12,499 | 3 (1.1%) | 3 (1.2%) |
| $12,500 to $14,999 | 7 (2.5%) | 2 (0.8%) |
| $15,000 to $17,499 | 0 (0.0%) | 6 (2.4%) |
| $17,500 to $19,999 | 3 (1.1%) | 6 (2.4%) |
| $20,000 to $22,499 | 5 (1.8%) | 35 (14.2%) |
| $22,500 to $24,999 | 3 (1.1%) | 9 (3.6%) |
| $25,000 to $29,999 | 10 (3.6%) | 22 (8.9%) |
| $30,000 to $34,999 | 2 (0.7%) | 15 (6.1%) |
| $35,000 to $39,999 | 7 (2.5%) | 29 (11.7%) |
| $40,000 to $44,999 | 20 (7.2%) | 26 (10.5%) |
| $45,000 to $49,999 | 29 (10.5%) | 12 (4.9%) |
| $50,000 to $54,999 | 23 (8.3%) | 8 (3.2%) |
| $55,000 to $64,999 | 19 (6.9%) | 18 (7.3%) |
| $65,000 to $74,999 | 37 (13.4%) | 10 (4.1%) |
| $75,000 to $99,999 | 38 (13.8%) | 6 (2.4%) |
| $100,000+ | 28 (10.1%) | 12 (4.9%) |
| Total | 276 (100.0%) | 247 (100.0%) |
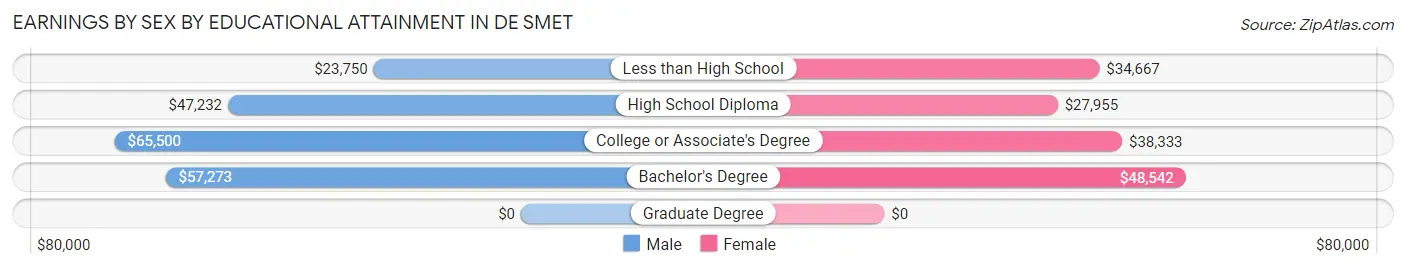
Earnings by Sex by Educational Attainment in De Smet
Average earnings in De Smet are $52,308 for men and $36,579 for women, a difference of 30.1%. Men with an educational attainment of college or associate's degree enjoy the highest average annual earnings of $65,500, while those with less than high school education earn the least with $23,750. Women with an educational attainment of bachelor's degree earn the most with the average annual earnings of $48,542, while those with high school diploma education have the smallest earnings of $27,955.
| Educational Attainment | Male Income | Female Income |
| Less than High School | $23,750 | $34,667 |
| High School Diploma | $47,232 | $27,955 |
| College or Associate's Degree | $65,500 | $38,333 |
| Bachelor's Degree | $57,273 | $48,542 |
| Graduate Degree | - | - |
| Total | $52,308 | $36,579 |
Family Income in De Smet
Family Income Brackets in De Smet
According to the De Smet family income data, there are 66 families falling into the $100,000 to $149,999 income range, which is the most common income bracket and makes up 29.2% of all families. Conversely, the less than $10,000 income bracket is the least frequent group with only 2 families (0.9%) belonging to this category.
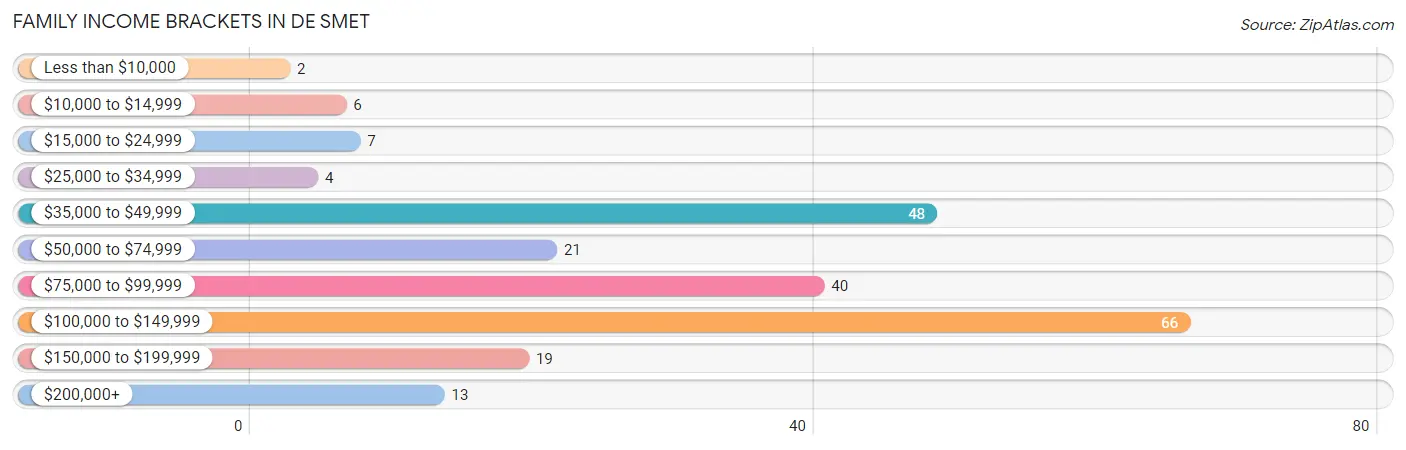
| Income Bracket | # Families | % Families |
| Less than $10,000 | 2 | 0.9% |
| $10,000 to $14,999 | 6 | 2.7% |
| $15,000 to $24,999 | 7 | 3.1% |
| $25,000 to $34,999 | 4 | 1.8% |
| $35,000 to $49,999 | 48 | 21.2% |
| $50,000 to $74,999 | 21 | 9.3% |
| $75,000 to $99,999 | 40 | 17.7% |
| $100,000 to $149,999 | 66 | 29.2% |
| $150,000 to $199,999 | 19 | 8.4% |
| $200,000+ | 13 | 5.8% |
Family Income by Famaliy Size in De Smet
5-person families (32 | 14.2%) account for the highest median family income in De Smet with $156,250 per family, while 2-person families (149 | 65.9%) have the highest median income of $39,219 per family member.
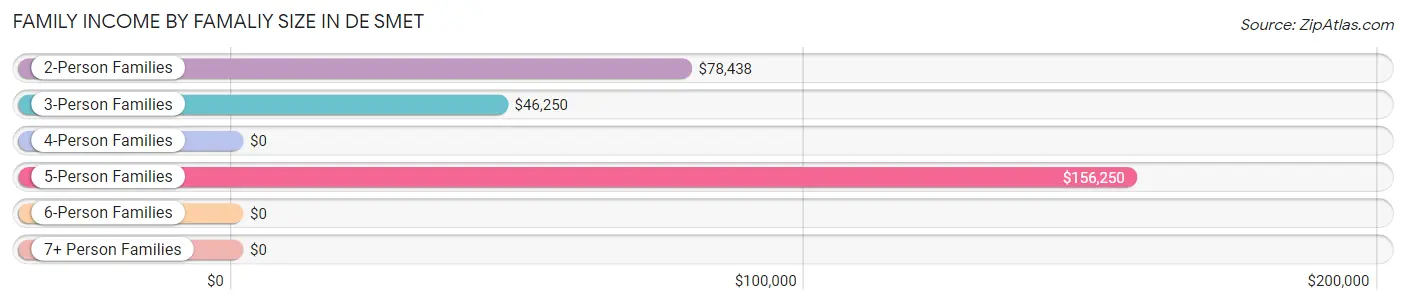
| Income Bracket | # Families | Median Income |
| 2-Person Families | 149 (65.9%) | $78,438 |
| 3-Person Families | 20 (8.8%) | $46,250 |
| 4-Person Families | 19 (8.4%) | $0 |
| 5-Person Families | 32 (14.2%) | $156,250 |
| 6-Person Families | 6 (2.6%) | $0 |
| 7+ Person Families | 0 (0.0%) | $0 |
| Total | 226 (100.0%) | $86,591 |
Family Income by Number of Earners in De Smet
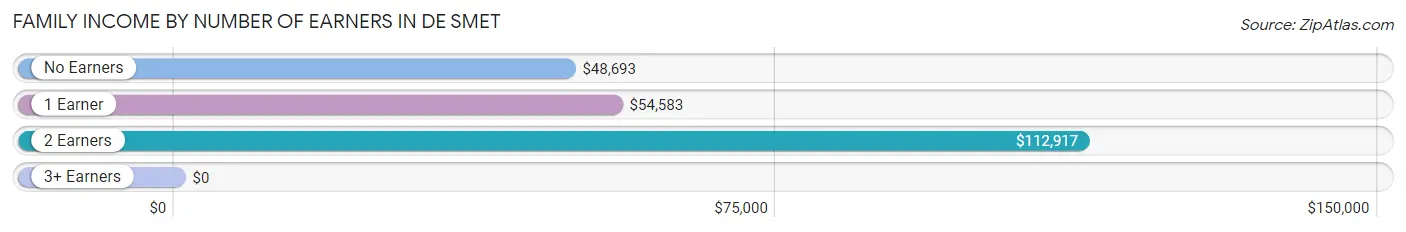
| Number of Earners | # Families | Median Income |
| No Earners | 45 (19.9%) | $48,693 |
| 1 Earner | 55 (24.3%) | $54,583 |
| 2 Earners | 114 (50.4%) | $112,917 |
| 3+ Earners | 12 (5.3%) | $0 |
| Total | 226 (100.0%) | $86,591 |
Household Income in De Smet
Household Income Brackets in De Smet
With 109 households falling in the category, the $35,000 to $49,999 income range is the most frequent in De Smet, accounting for 25.3% of all households. In contrast, only 12 households (2.8%) fall into the less than $10,000 income bracket, making it the least populous group.
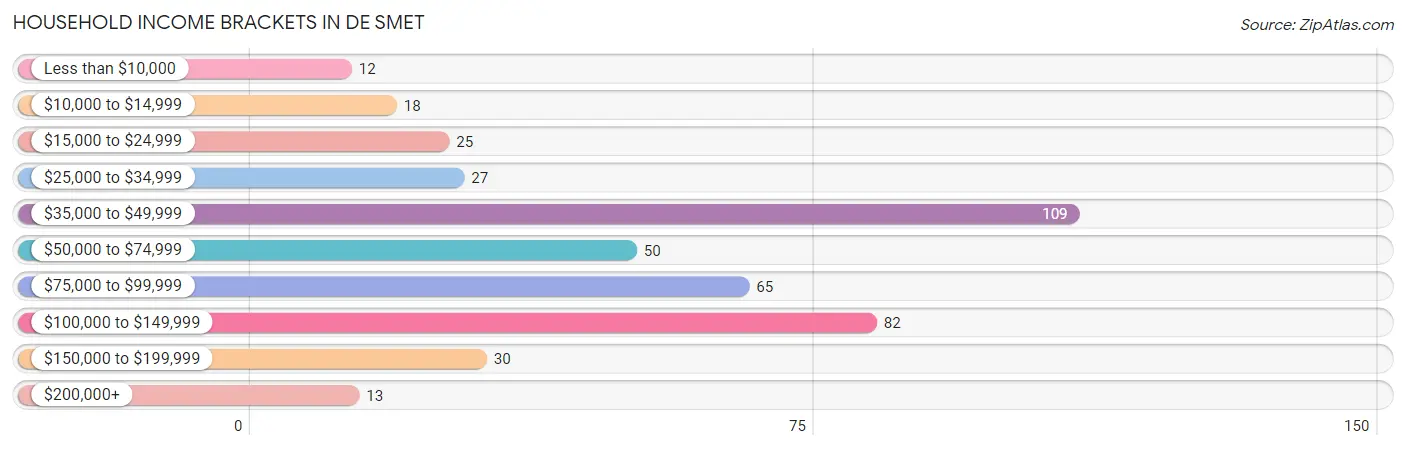
| Income Bracket | # Households | % Households |
| Less than $10,000 | 12 | 2.8% |
| $10,000 to $14,999 | 18 | 4.2% |
| $15,000 to $24,999 | 25 | 5.8% |
| $25,000 to $34,999 | 27 | 6.3% |
| $35,000 to $49,999 | 109 | 25.3% |
| $50,000 to $74,999 | 50 | 11.6% |
| $75,000 to $99,999 | 65 | 15.1% |
| $100,000 to $149,999 | 82 | 19.0% |
| $150,000 to $199,999 | 30 | 7.0% |
| $200,000+ | 13 | 3.0% |
Household Income by Householder Age in De Smet
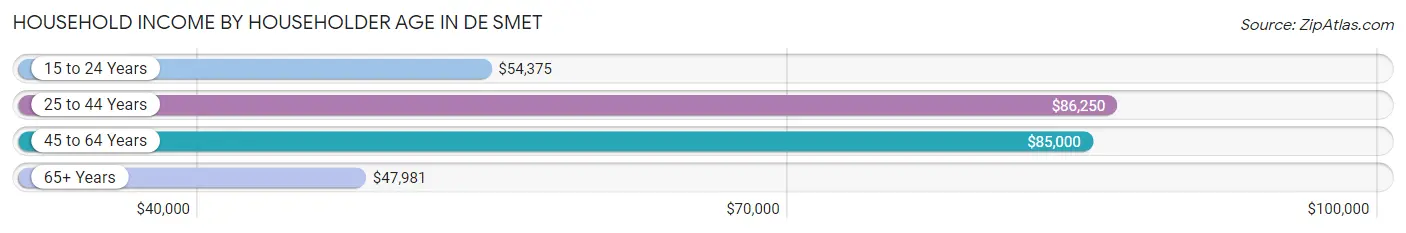
The median household income in De Smet is $57,656, with the highest median household income of $86,250 found in the 25 to 44 years age bracket for the primary householder. A total of 96 households (22.3%) fall into this category. Meanwhile, the 65+ years age bracket for the primary householder has the lowest median household income of $47,981, with 180 households (41.8%) in this group.
| Income Bracket | # Households | Median Income |
| 15 to 24 Years | 23 (5.3%) | $54,375 |
| 25 to 44 Years | 96 (22.3%) | $86,250 |
| 45 to 64 Years | 132 (30.6%) | $85,000 |
| 65+ Years | 180 (41.8%) | $47,981 |
| Total | 431 (100.0%) | $57,656 |
Poverty in De Smet
Income Below Poverty by Sex and Age in De Smet
With 6.9% poverty level for males and 6.6% for females among the residents of De Smet, 75 year old and over males and 16 and 17 year old females are the most vulnerable to poverty, with 14 males (17.7%) and 3 females (100.0%) in their respective age groups living below the poverty level.
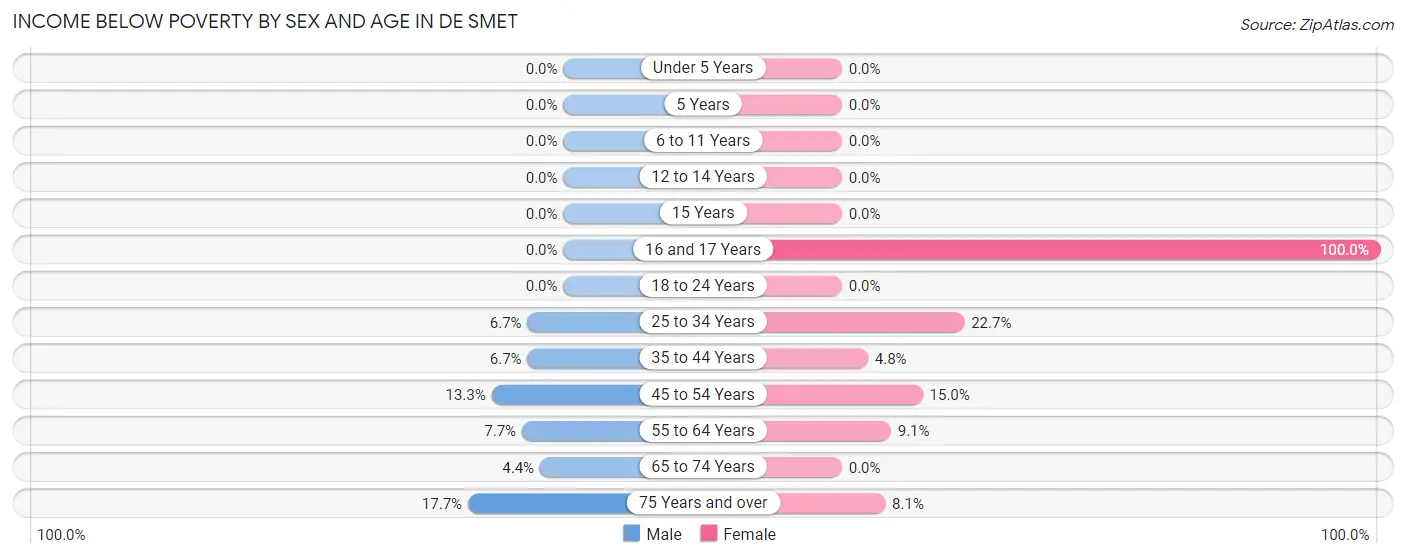
| Age Bracket | Male | Female |
| Under 5 Years | 0 (0.0%) | 0 (0.0%) |
| 5 Years | 0 (0.0%) | 0 (0.0%) |
| 6 to 11 Years | 0 (0.0%) | 0 (0.0%) |
| 12 to 14 Years | 0 (0.0%) | 0 (0.0%) |
| 15 Years | 0 (0.0%) | 0 (0.0%) |
| 16 and 17 Years | 0 (0.0%) | 3 (100.0%) |
| 18 to 24 Years | 0 (0.0%) | 0 (0.0%) |
| 25 to 34 Years | 3 (6.7%) | 5 (22.7%) |
| 35 to 44 Years | 3 (6.7%) | 3 (4.8%) |
| 45 to 54 Years | 4 (13.3%) | 6 (15.0%) |
| 55 to 64 Years | 6 (7.7%) | 6 (9.1%) |
| 65 to 74 Years | 3 (4.3%) | 0 (0.0%) |
| 75 Years and over | 14 (17.7%) | 7 (8.1%) |
| Total | 33 (6.9%) | 30 (6.6%) |
Income Above Poverty by Sex and Age in De Smet
According to the poverty statistics in De Smet, males aged under 5 years and females aged under 5 years are the age groups that are most secure financially, with 100.0% of males and 100.0% of females in these age groups living above the poverty line.
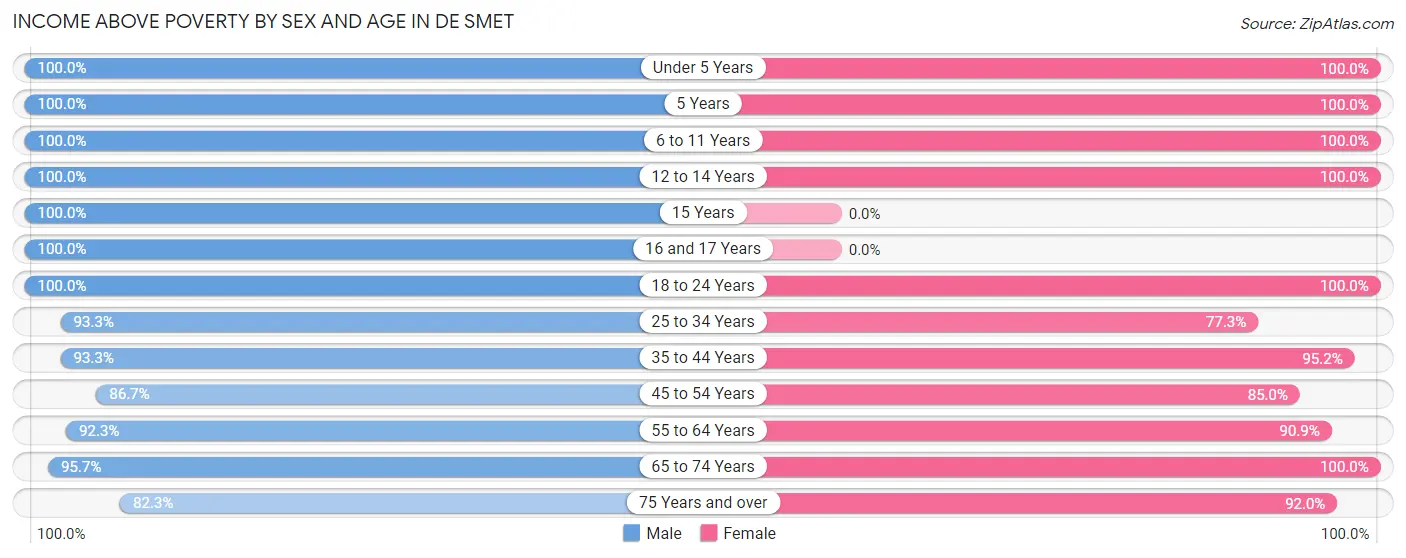
| Age Bracket | Male | Female |
| Under 5 Years | 13 (100.0%) | 20 (100.0%) |
| 5 Years | 5 (100.0%) | 4 (100.0%) |
| 6 to 11 Years | 58 (100.0%) | 26 (100.0%) |
| 12 to 14 Years | 10 (100.0%) | 14 (100.0%) |
| 15 Years | 11 (100.0%) | 0 (0.0%) |
| 16 and 17 Years | 14 (100.0%) | 0 (0.0%) |
| 18 to 24 Years | 24 (100.0%) | 44 (100.0%) |
| 25 to 34 Years | 42 (93.3%) | 17 (77.3%) |
| 35 to 44 Years | 42 (93.3%) | 59 (95.2%) |
| 45 to 54 Years | 26 (86.7%) | 34 (85.0%) |
| 55 to 64 Years | 72 (92.3%) | 60 (90.9%) |
| 65 to 74 Years | 66 (95.7%) | 68 (100.0%) |
| 75 Years and over | 65 (82.3%) | 80 (91.9%) |
| Total | 448 (93.1%) | 426 (93.4%) |
Income Below Poverty Among Married-Couple Families in De Smet
The poverty statistics for married-couple families in De Smet show that 1.6% or 3 of the total 187 families live below the poverty line. Families with no children have the highest poverty rate of 2.5%, comprising of 3 families. On the other hand, families with 1 or 2 children have the lowest poverty rate of 0.0%, which includes 0 families.
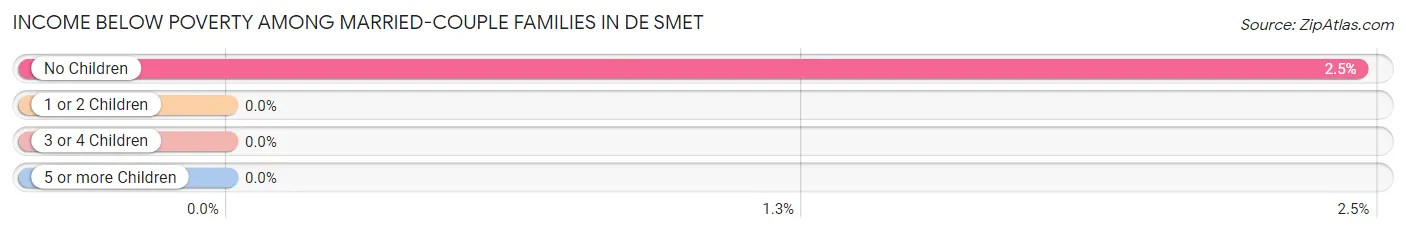
| Children | Above Poverty | Below Poverty |
| No Children | 119 (97.5%) | 3 (2.5%) |
| 1 or 2 Children | 27 (100.0%) | 0 (0.0%) |
| 3 or 4 Children | 38 (100.0%) | 0 (0.0%) |
| 5 or more Children | 0 (0.0%) | 0 (0.0%) |
| Total | 184 (98.4%) | 3 (1.6%) |
Income Below Poverty Among Single-Parent Households in De Smet
According to the poverty data in De Smet, 100.0% or 6 single-father households and 6.1% or 2 single-mother households are living below the poverty line. Among single-father households, those with no children have the highest poverty rate, with 6 households (100.0%) experiencing poverty. Likewise, among single-mother households, those with 1 or 2 children have the highest poverty rate, with 2 households (10.5%) falling below the poverty line.
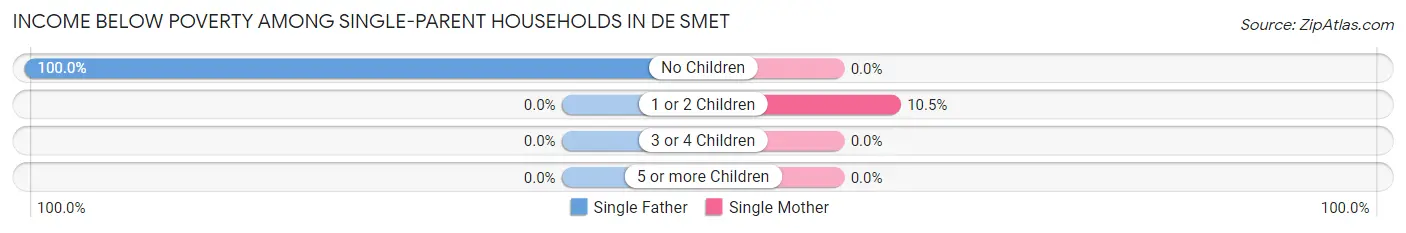
| Children | Single Father | Single Mother |
| No Children | 6 (100.0%) | 0 (0.0%) |
| 1 or 2 Children | 0 (0.0%) | 2 (10.5%) |
| 3 or 4 Children | 0 (0.0%) | 0 (0.0%) |
| 5 or more Children | 0 (0.0%) | 0 (0.0%) |
| Total | 6 (100.0%) | 2 (6.1%) |
Income Below Poverty Among Married-Couple vs Single-Parent Households in De Smet
The poverty data for De Smet shows that 3 of the married-couple family households (1.6%) and 8 of the single-parent households (20.5%) are living below the poverty level. Within the married-couple family households, those with no children have the highest poverty rate, with 3 households (2.5%) falling below the poverty line. Among the single-parent households, those with no children have the highest poverty rate, with 6 household (30.0%) living below poverty.
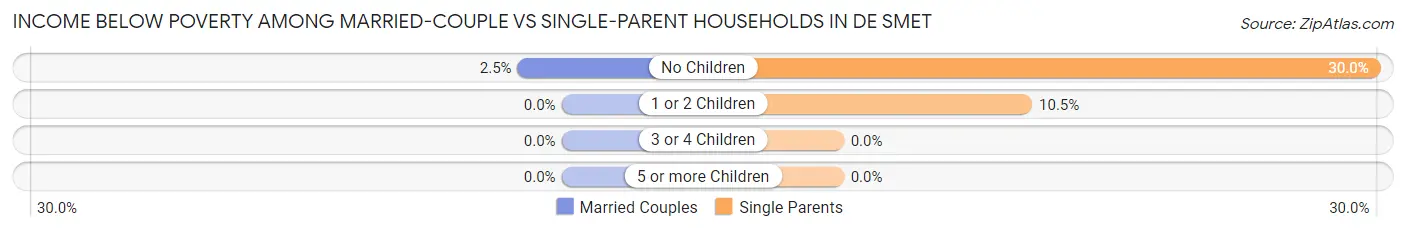
| Children | Married-Couple Families | Single-Parent Households |
| No Children | 3 (2.5%) | 6 (30.0%) |
| 1 or 2 Children | 0 (0.0%) | 2 (10.5%) |
| 3 or 4 Children | 0 (0.0%) | 0 (0.0%) |
| 5 or more Children | 0 (0.0%) | 0 (0.0%) |
| Total | 3 (1.6%) | 8 (20.5%) |
Race in De Smet
The most populous races in De Smet are White / Caucasian (980 | 99.0%), and Two or more Races (10 | 1.0%).
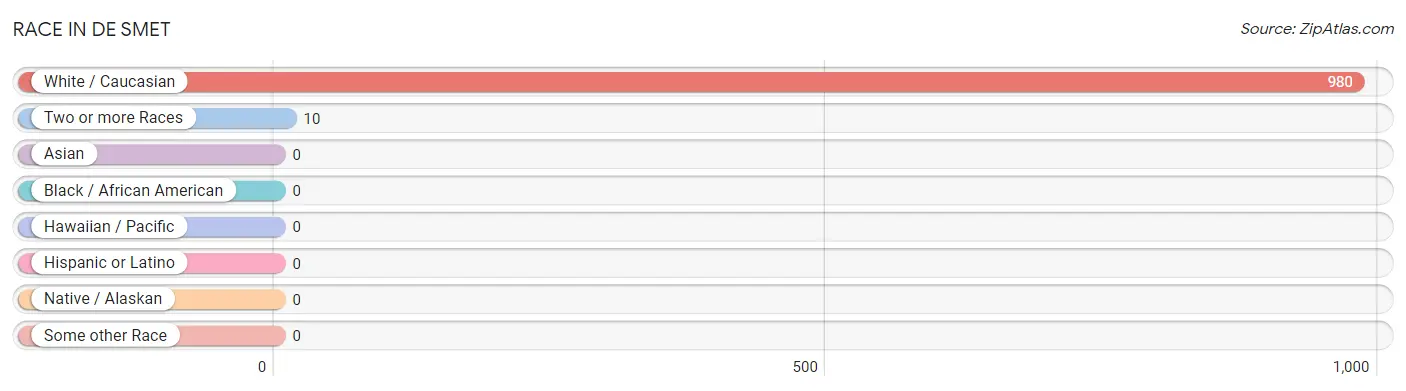
| Race | # Population | % Population |
| Asian | 0 | 0.0% |
| Black / African American | 0 | 0.0% |
| Hawaiian / Pacific | 0 | 0.0% |
| Hispanic or Latino | 0 | 0.0% |
| Native / Alaskan | 0 | 0.0% |
| White / Caucasian | 980 | 99.0% |
| Two or more Races | 10 | 1.0% |
| Some other Race | 0 | 0.0% |
| Total | 990 | 100.0% |
Ancestry in De Smet
The most populous ancestries reported in De Smet are German (386 | 39.0%), Norwegian (211 | 21.3%), Irish (179 | 18.1%), Dutch (81 | 8.2%), and Danish (70 | 7.1%), together accounting for 93.6% of all De Smet residents.
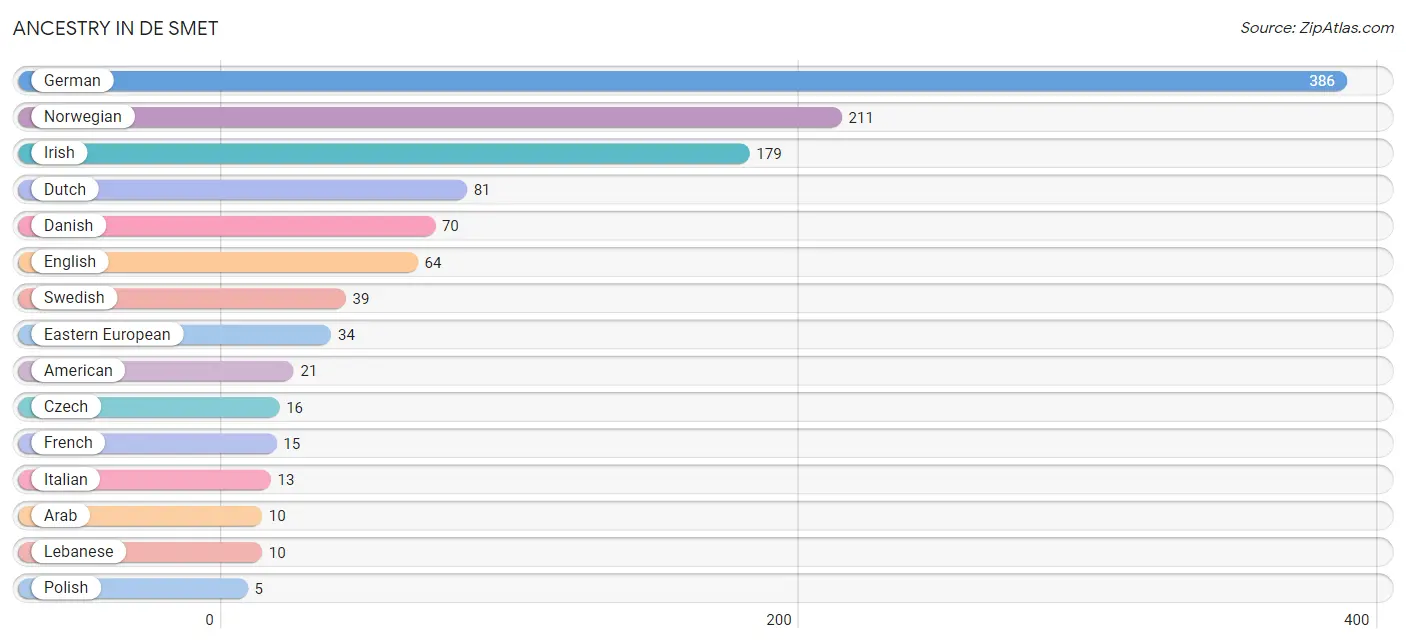
| Ancestry | # Population | % Population |
| American | 21 | 2.1% |
| Arab | 10 | 1.0% |
| Czech | 16 | 1.6% |
| Danish | 70 | 7.1% |
| Dutch | 81 | 8.2% |
| Eastern European | 34 | 3.4% |
| English | 64 | 6.5% |
| French | 15 | 1.5% |
| French Canadian | 4 | 0.4% |
| German | 386 | 39.0% |
| Irish | 179 | 18.1% |
| Italian | 13 | 1.3% |
| Lebanese | 10 | 1.0% |
| Luxembourger | 2 | 0.2% |
| Norwegian | 211 | 21.3% |
| Polish | 5 | 0.5% |
| Scandinavian | 2 | 0.2% |
| Scotch-Irish | 5 | 0.5% |
| Scottish | 3 | 0.3% |
| Swedish | 39 | 3.9% |
| Welsh | 3 | 0.3% | View All 21 Rows |
Immigrants in De Smet

| Immigration Origin | # Population | % Population | View All 0 Rows |
Sex and Age in De Smet
Sex and Age in De Smet
The most populous age groups in De Smet are 60 to 64 Years (57 | 11.1%) for men and 85 Years and over (54 | 11.3%) for women.
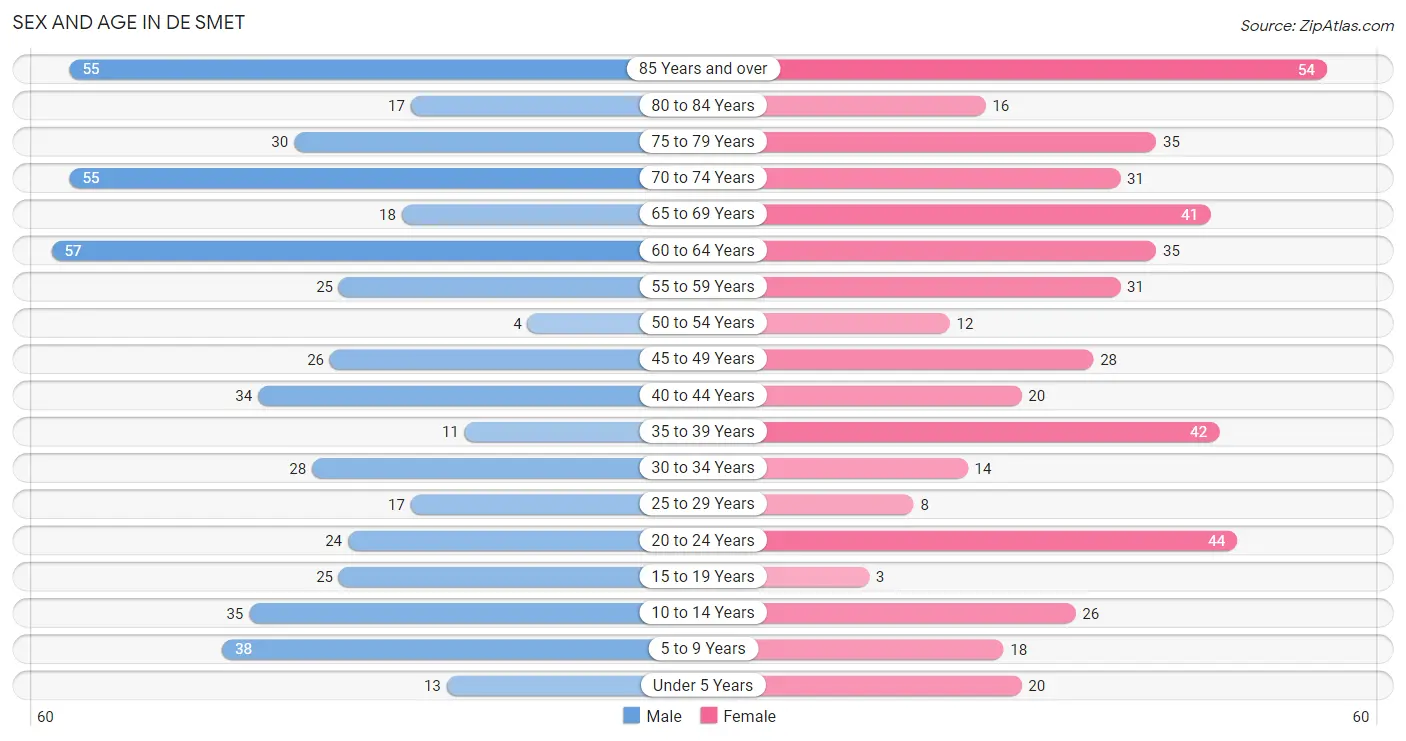
| Age Bracket | Male | Female |
| Under 5 Years | 13 (2.5%) | 20 (4.2%) |
| 5 to 9 Years | 38 (7.4%) | 18 (3.8%) |
| 10 to 14 Years | 35 (6.8%) | 26 (5.4%) |
| 15 to 19 Years | 25 (4.9%) | 3 (0.6%) |
| 20 to 24 Years | 24 (4.7%) | 44 (9.2%) |
| 25 to 29 Years | 17 (3.3%) | 8 (1.7%) |
| 30 to 34 Years | 28 (5.5%) | 14 (2.9%) |
| 35 to 39 Years | 11 (2.1%) | 42 (8.8%) |
| 40 to 44 Years | 34 (6.6%) | 20 (4.2%) |
| 45 to 49 Years | 26 (5.1%) | 28 (5.9%) |
| 50 to 54 Years | 4 (0.8%) | 12 (2.5%) |
| 55 to 59 Years | 25 (4.9%) | 31 (6.5%) |
| 60 to 64 Years | 57 (11.1%) | 35 (7.3%) |
| 65 to 69 Years | 18 (3.5%) | 41 (8.6%) |
| 70 to 74 Years | 55 (10.7%) | 31 (6.5%) |
| 75 to 79 Years | 30 (5.9%) | 35 (7.3%) |
| 80 to 84 Years | 17 (3.3%) | 16 (3.4%) |
| 85 Years and over | 55 (10.7%) | 54 (11.3%) |
| Total | 512 (100.0%) | 478 (100.0%) |
Families and Households in De Smet
Median Family Size in De Smet
The median family size in De Smet is 3.00 persons per family, with single female/mother families (33 | 14.6%) accounting for the largest median family size of 3.76 persons per family. On the other hand, married-couple families (187 | 82.7%) represent the smallest median family size with 2.85 persons per family.
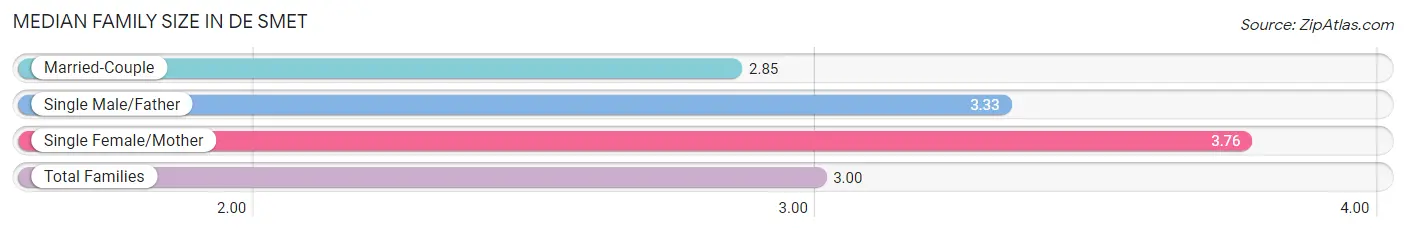
| Family Type | # Families | Family Size |
| Married-Couple | 187 (82.7%) | 2.85 |
| Single Male/Father | 6 (2.6%) | 3.33 |
| Single Female/Mother | 33 (14.6%) | 3.76 |
| Total Families | 226 (100.0%) | 3.00 |
Median Household Size in De Smet
The median household size in De Smet is 2.17 persons per household, with single female/mother households (33 | 7.7%) accounting for the largest median household size of 4.06 persons per household. non-family households (205 | 47.6%) represent the smallest median household size with 1.22 persons per household.
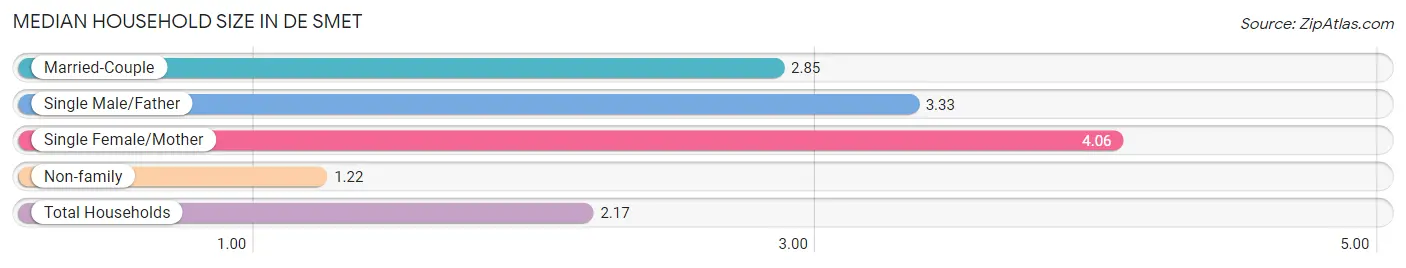
| Household Type | # Households | Household Size |
| Married-Couple | 187 (43.4%) | 2.85 |
| Single Male/Father | 6 (1.4%) | 3.33 |
| Single Female/Mother | 33 (7.7%) | 4.06 |
| Non-family | 205 (47.6%) | 1.22 |
| Total Households | 431 (100.0%) | 2.17 |
Household Size by Marriage Status in De Smet
Out of a total of 431 households in De Smet, 226 (52.4%) are family households, while 205 (47.6%) are nonfamily households. The most numerous type of family households are 2-person households, comprising 146, and the most common type of nonfamily households are 1-person households, comprising 173.
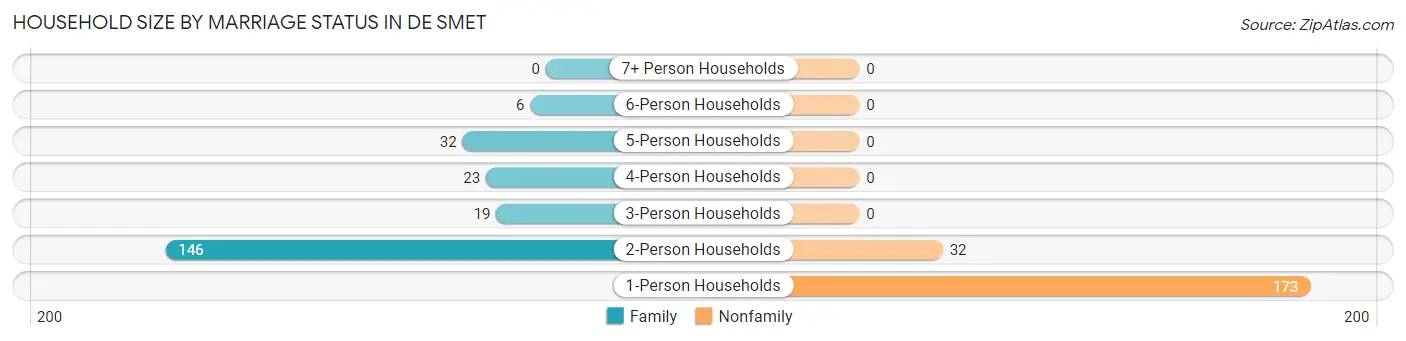
| Household Size | Family Households | Nonfamily Households |
| 1-Person Households | - | 173 (40.1%) |
| 2-Person Households | 146 (33.9%) | 32 (7.4%) |
| 3-Person Households | 19 (4.4%) | 0 (0.0%) |
| 4-Person Households | 23 (5.3%) | 0 (0.0%) |
| 5-Person Households | 32 (7.4%) | 0 (0.0%) |
| 6-Person Households | 6 (1.4%) | 0 (0.0%) |
| 7+ Person Households | 0 (0.0%) | 0 (0.0%) |
| Total | 226 (52.4%) | 205 (47.6%) |
Female Fertility in De Smet
Fertility by Age in De Smet
Average fertility rate in De Smet is 31.0 births per 1,000 women. Women in the age bracket of 20 to 34 years have the highest fertility rate with 76.0 births per 1,000 women. Women in the age bracket of 20 to 34 years acount for 100.0% of all women with births.
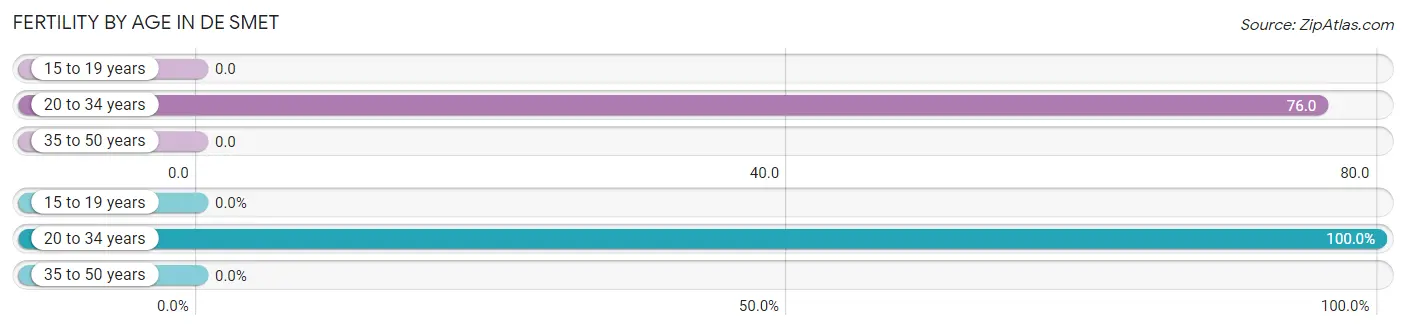
| Age Bracket | Women with Births | Births / 1,000 Women |
| 15 to 19 years | 0 (0.0%) | 0.0 |
| 20 to 34 years | 5 (100.0%) | 76.0 |
| 35 to 50 years | 0 (0.0%) | 0.0 |
| Total | 5 (100.0%) | 31.0 |
Fertility by Age by Marriage Status in De Smet
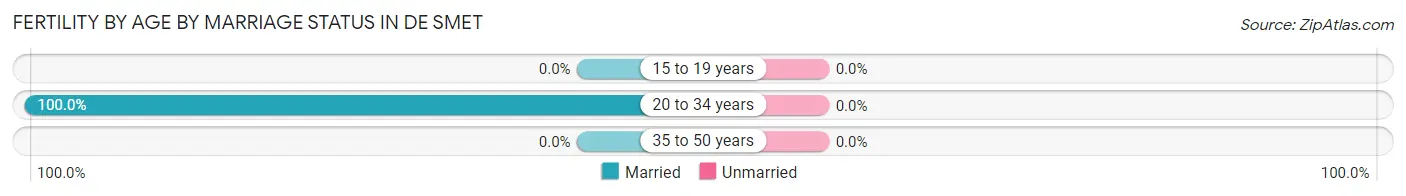
| Age Bracket | Married | Unmarried |
| 15 to 19 years | 0 (0.0%) | 0 (0.0%) |
| 20 to 34 years | 5 (100.0%) | 0 (0.0%) |
| 35 to 50 years | 0 (0.0%) | 0 (0.0%) |
| Total | 5 (100.0%) | 0 (0.0%) |
Fertility by Education in De Smet
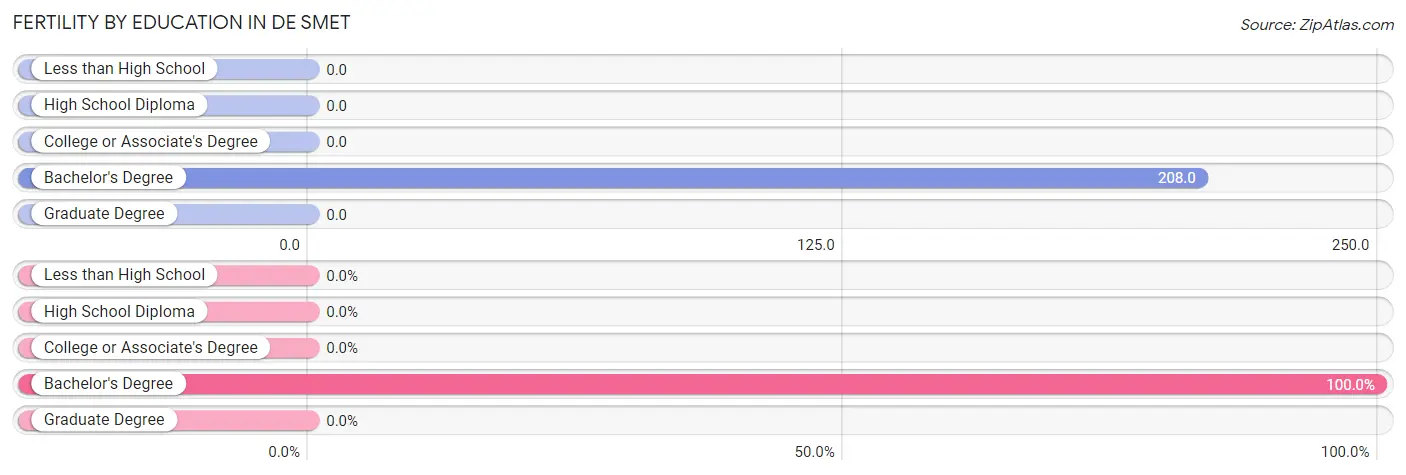
| Educational Attainment | Women with Births | Births / 1,000 Women |
| Less than High School | 0 (0.0%) | 0.0 |
| High School Diploma | 0 (0.0%) | 0.0 |
| College or Associate's Degree | 0 (0.0%) | 0.0 |
| Bachelor's Degree | 5 (100.0%) | 208.0 |
| Graduate Degree | 0 (0.0%) | 0.0 |
| Total | 5 (100.0%) | 31.0 |
Fertility by Education by Marriage Status in De Smet
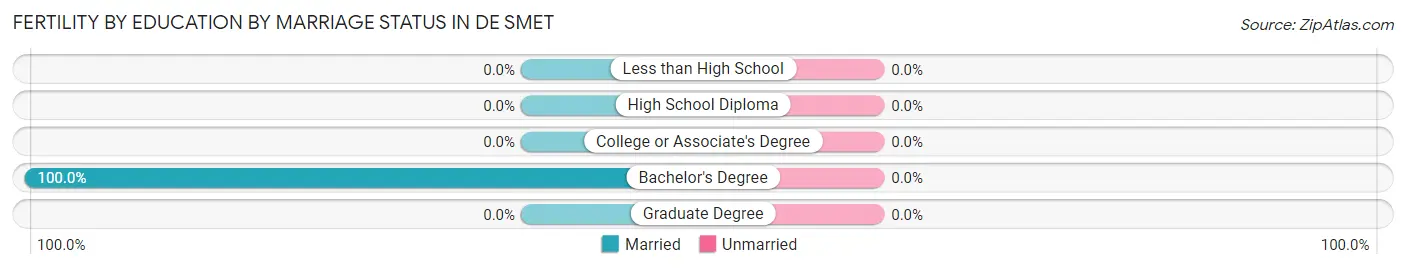
| Educational Attainment | Married | Unmarried |
| Less than High School | 0 (0.0%) | 0 (0.0%) |
| High School Diploma | 0 (0.0%) | 0 (0.0%) |
| College or Associate's Degree | 0 (0.0%) | 0 (0.0%) |
| Bachelor's Degree | 5 (100.0%) | 0 (0.0%) |
| Graduate Degree | 0 (0.0%) | 0 (0.0%) |
| Total | 5 (100.0%) | 0 (0.0%) |
Employment Characteristics in De Smet
Employment by Class of Employer in De Smet
Among the 510 employed individuals in De Smet, private company employees (311 | 61.0%), not-for-profit organizations (64 | 12.6%), and self-employed (not incorporated) (56 | 11.0%) make up the most common classes of employment.
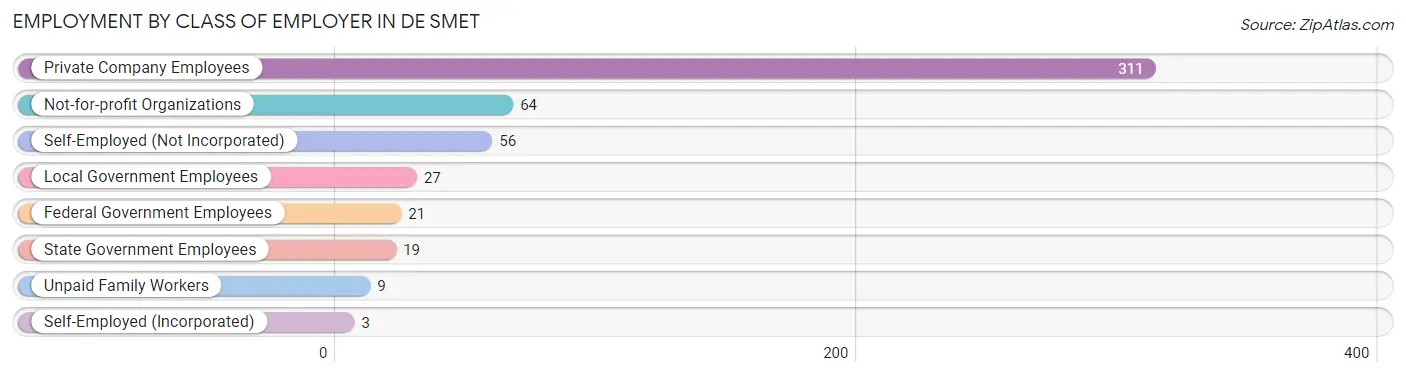
| Employer Class | # Employees | % Employees |
| Private Company Employees | 311 | 61.0% |
| Self-Employed (Incorporated) | 3 | 0.6% |
| Self-Employed (Not Incorporated) | 56 | 11.0% |
| Not-for-profit Organizations | 64 | 12.6% |
| Local Government Employees | 27 | 5.3% |
| State Government Employees | 19 | 3.7% |
| Federal Government Employees | 21 | 4.1% |
| Unpaid Family Workers | 9 | 1.8% |
| Total | 510 | 100.0% |
Employment Status by Age in De Smet
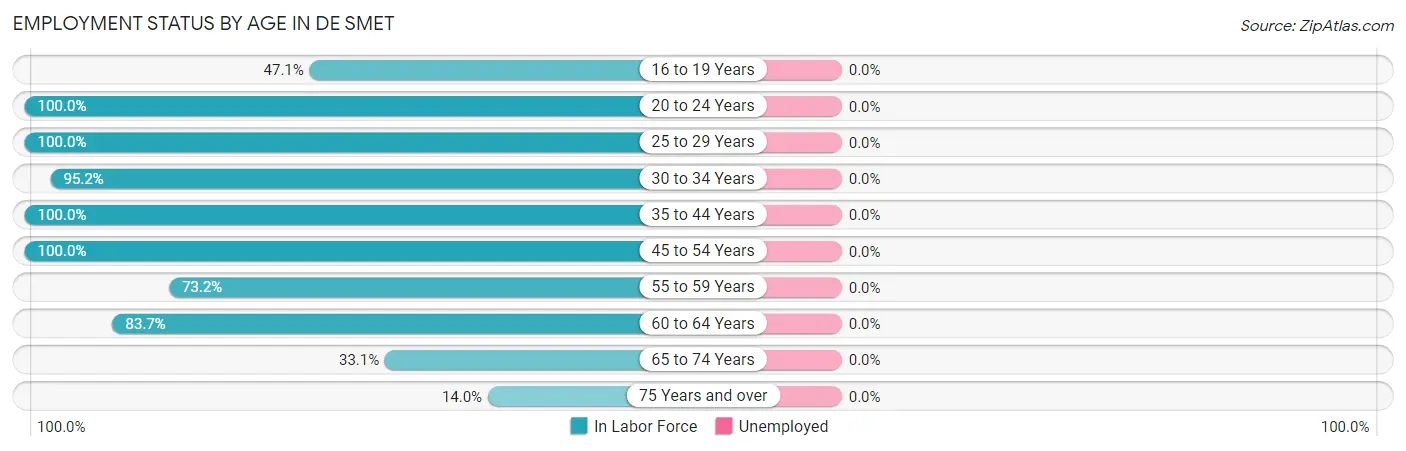
| Age Bracket | In Labor Force | Unemployed |
| 16 to 19 Years | 8 (47.1%) | 0 (0.0%) |
| 20 to 24 Years | 68 (100.0%) | 0 (0.0%) |
| 25 to 29 Years | 25 (100.0%) | 0 (0.0%) |
| 30 to 34 Years | 40 (95.2%) | 0 (0.0%) |
| 35 to 44 Years | 107 (100.0%) | 0 (0.0%) |
| 45 to 54 Years | 70 (100.0%) | 0 (0.0%) |
| 55 to 59 Years | 41 (73.2%) | 0 (0.0%) |
| 60 to 64 Years | 77 (83.7%) | 0 (0.0%) |
| 65 to 74 Years | 48 (33.1%) | 0 (0.0%) |
| 75 Years and over | 29 (14.0%) | 0 (0.0%) |
| Total | 513 (61.9%) | 0 (0.0%) |
Employment Status by Educational Attainment in De Smet
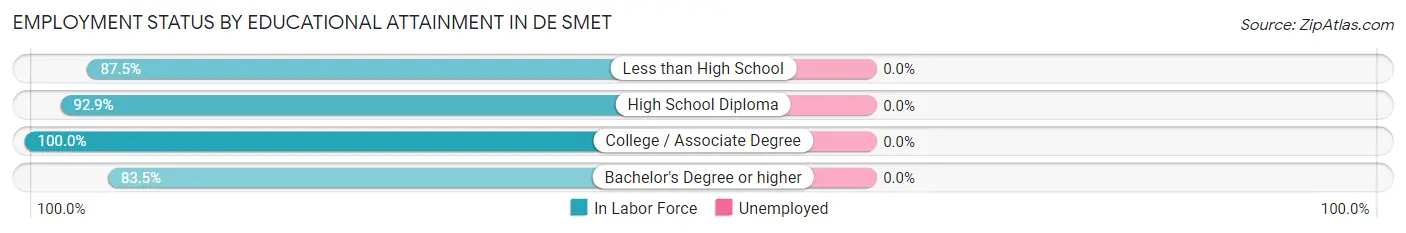
| Educational Attainment | In Labor Force | Unemployed |
| Less than High School | 28 (87.5%) | 0 (0.0%) |
| High School Diploma | 171 (92.9%) | 0 (0.0%) |
| College / Associate Degree | 85 (100.0%) | 0 (0.0%) |
| Bachelor's Degree or higher | 76 (83.5%) | 0 (0.0%) |
| Total | 360 (91.8%) | 0 (0.0%) |
Employment Occupations by Sex in De Smet
Management, Business, Science and Arts Occupations
The most common Management, Business, Science and Arts occupations in De Smet are Management (94 | 18.3%), Community & Social Service (45 | 8.8%), Health Diagnosing & Treating (31 | 6.0%), Business & Financial (19 | 3.7%), and Education Instruction & Library (16 | 3.1%).
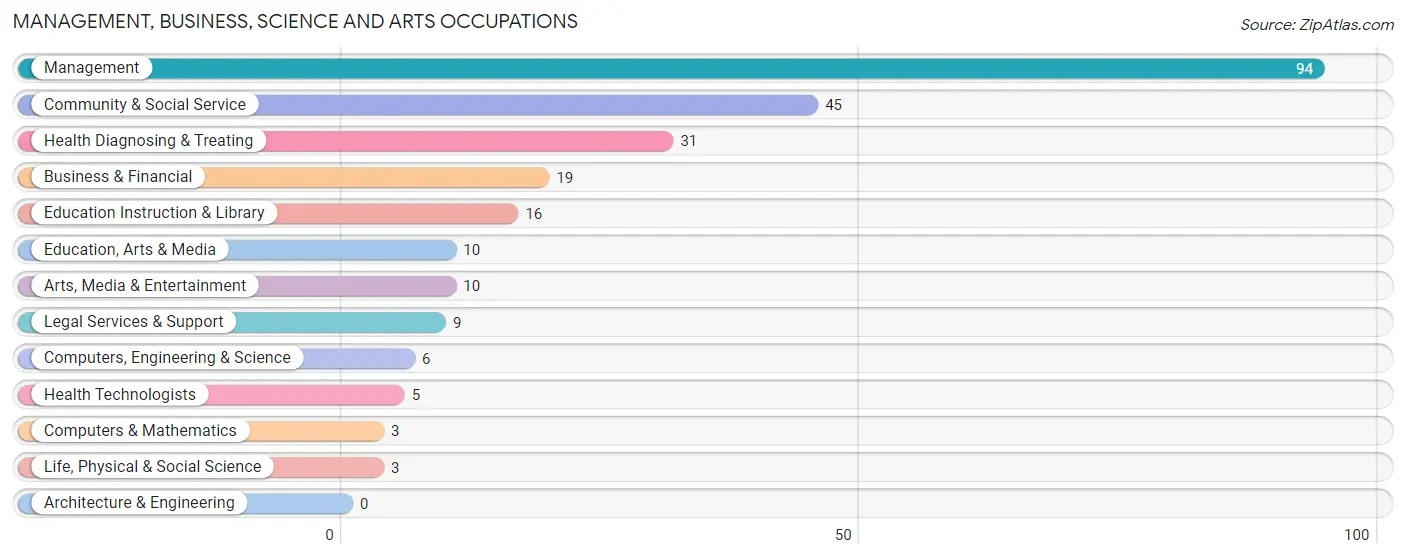
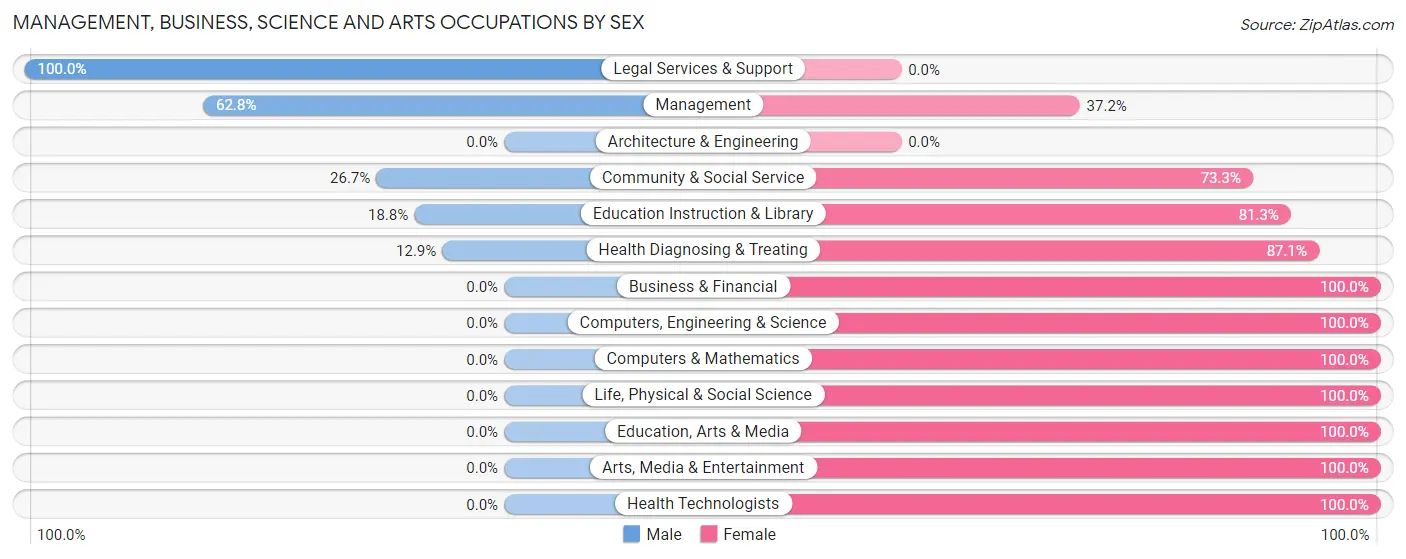
Management, Business, Science and Arts Occupations by Sex
Within the Management, Business, Science and Arts occupations in De Smet, the most male-oriented occupations are Legal Services & Support (100.0%), Management (62.8%), and Community & Social Service (26.7%), while the most female-oriented occupations are Business & Financial (100.0%), Computers, Engineering & Science (100.0%), and Computers & Mathematics (100.0%).
| Occupation | Male | Female |
| Management | 59 (62.8%) | 35 (37.2%) |
| Business & Financial | 0 (0.0%) | 19 (100.0%) |
| Computers, Engineering & Science | 0 (0.0%) | 6 (100.0%) |
| Computers & Mathematics | 0 (0.0%) | 3 (100.0%) |
| Architecture & Engineering | 0 (0.0%) | 0 (0.0%) |
| Life, Physical & Social Science | 0 (0.0%) | 3 (100.0%) |
| Community & Social Service | 12 (26.7%) | 33 (73.3%) |
| Education, Arts & Media | 0 (0.0%) | 10 (100.0%) |
| Legal Services & Support | 9 (100.0%) | 0 (0.0%) |
| Education Instruction & Library | 3 (18.8%) | 13 (81.2%) |
| Arts, Media & Entertainment | 0 (0.0%) | 10 (100.0%) |
| Health Diagnosing & Treating | 4 (12.9%) | 27 (87.1%) |
| Health Technologists | 0 (0.0%) | 5 (100.0%) |
| Total (Category) | 75 (38.5%) | 120 (61.5%) |
| Total (Overall) | 271 (52.8%) | 242 (47.2%) |
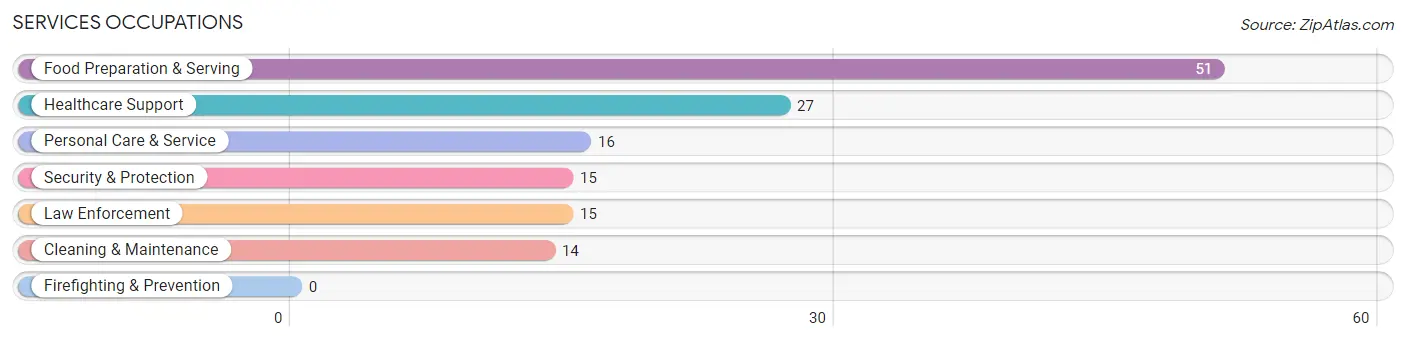
Services Occupations
The most common Services occupations in De Smet are Food Preparation & Serving (51 | 9.9%), Healthcare Support (27 | 5.3%), Personal Care & Service (16 | 3.1%), Security & Protection (15 | 2.9%), and Law Enforcement (15 | 2.9%).
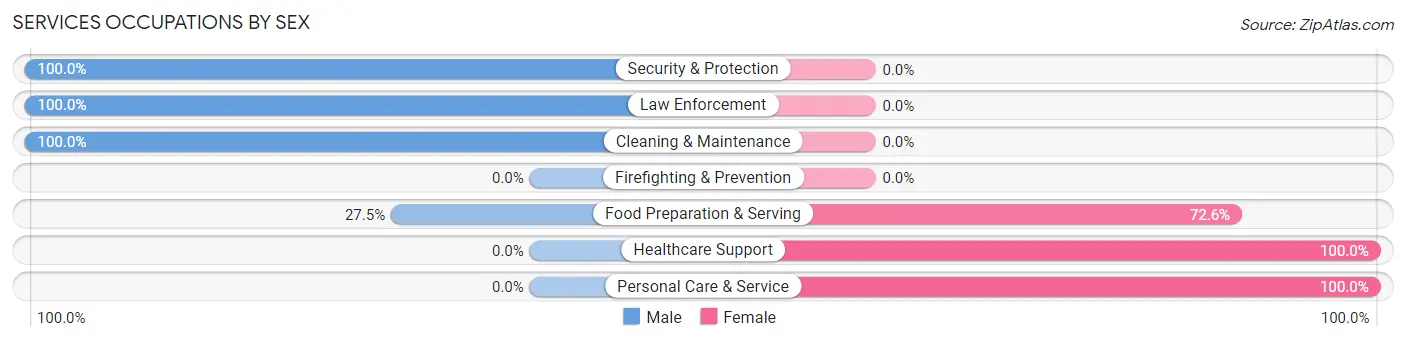
Services Occupations by Sex
Within the Services occupations in De Smet, the most male-oriented occupations are Security & Protection (100.0%), Law Enforcement (100.0%), and Cleaning & Maintenance (100.0%), while the most female-oriented occupations are Healthcare Support (100.0%), Personal Care & Service (100.0%), and Food Preparation & Serving (72.6%).
| Occupation | Male | Female |
| Healthcare Support | 0 (0.0%) | 27 (100.0%) |
| Security & Protection | 15 (100.0%) | 0 (0.0%) |
| Firefighting & Prevention | 0 (0.0%) | 0 (0.0%) |
| Law Enforcement | 15 (100.0%) | 0 (0.0%) |
| Food Preparation & Serving | 14 (27.5%) | 37 (72.6%) |
| Cleaning & Maintenance | 14 (100.0%) | 0 (0.0%) |
| Personal Care & Service | 0 (0.0%) | 16 (100.0%) |
| Total (Category) | 43 (35.0%) | 80 (65.0%) |
| Total (Overall) | 271 (52.8%) | 242 (47.2%) |
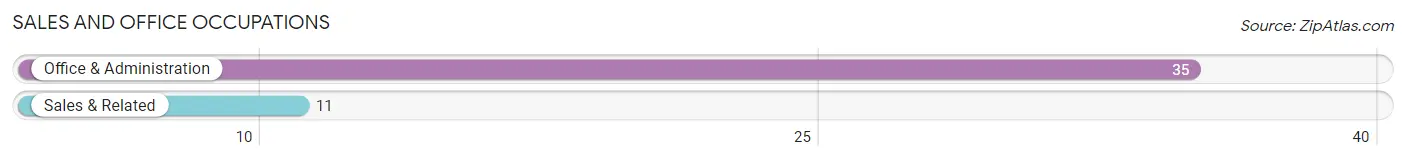
Sales and Office Occupations
The most common Sales and Office occupations in De Smet are Office & Administration (35 | 6.8%), and Sales & Related (11 | 2.1%).
Sales and Office Occupations by Sex

| Occupation | Male | Female |
| Sales & Related | 11 (100.0%) | 0 (0.0%) |
| Office & Administration | 8 (22.9%) | 27 (77.1%) |
| Total (Category) | 19 (41.3%) | 27 (58.7%) |
| Total (Overall) | 271 (52.8%) | 242 (47.2%) |
Natural Resources, Construction and Maintenance Occupations
The most common Natural Resources, Construction and Maintenance occupations in De Smet are Farming, Fishing & Forestry (38 | 7.4%), Installation, Maintenance & Repair (13 | 2.5%), and Construction & Extraction (10 | 1.9%).
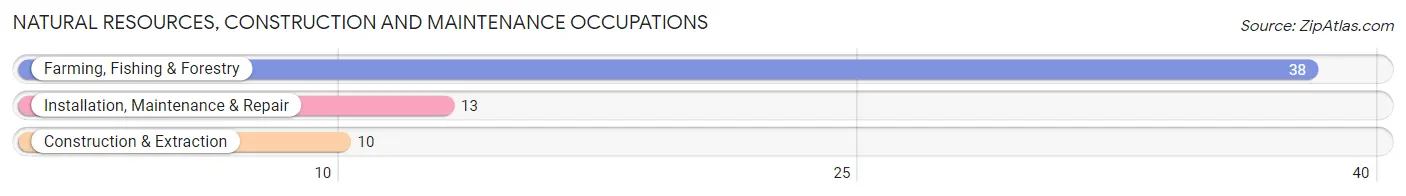
Natural Resources, Construction and Maintenance Occupations by Sex
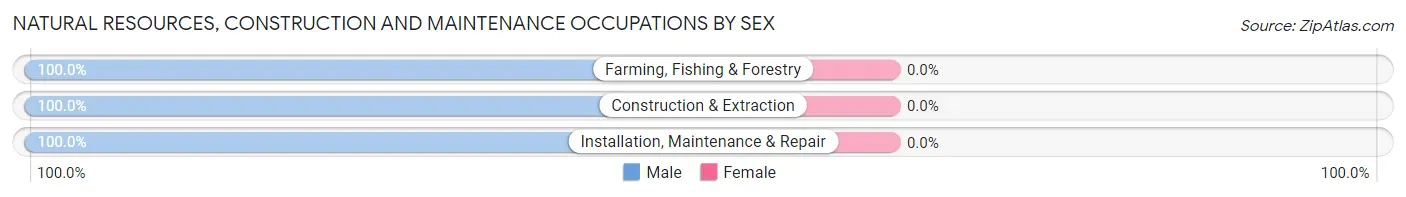
| Occupation | Male | Female |
| Farming, Fishing & Forestry | 38 (100.0%) | 0 (0.0%) |
| Construction & Extraction | 10 (100.0%) | 0 (0.0%) |
| Installation, Maintenance & Repair | 13 (100.0%) | 0 (0.0%) |
| Total (Category) | 61 (100.0%) | 0 (0.0%) |
| Total (Overall) | 271 (52.8%) | 242 (47.2%) |
Production, Transportation and Moving Occupations
The most common Production, Transportation and Moving occupations in De Smet are Production (60 | 11.7%), Transportation (19 | 3.7%), and Material Moving (9 | 1.8%).
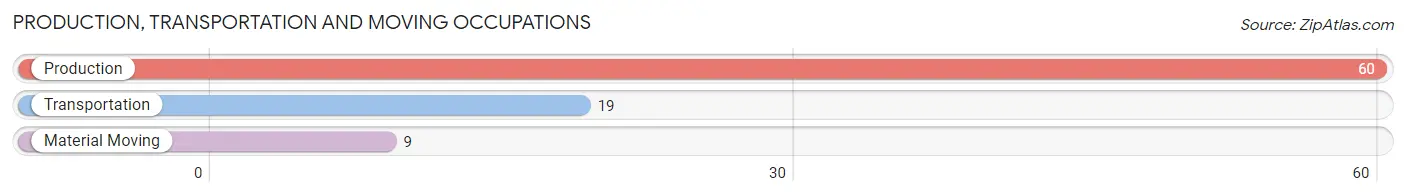
Production, Transportation and Moving Occupations by Sex
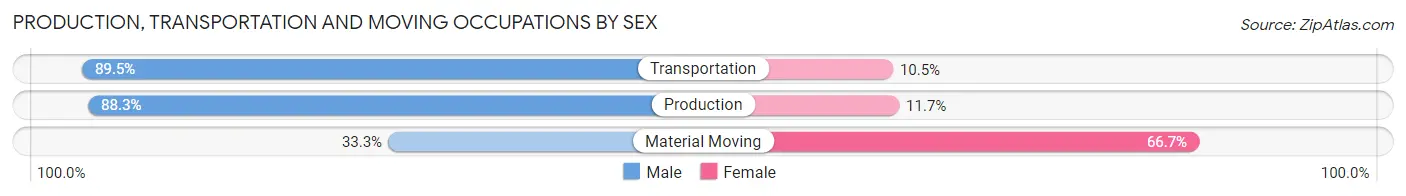
| Occupation | Male | Female |
| Production | 53 (88.3%) | 7 (11.7%) |
| Transportation | 17 (89.5%) | 2 (10.5%) |
| Material Moving | 3 (33.3%) | 6 (66.7%) |
| Total (Category) | 73 (83.0%) | 15 (17.1%) |
| Total (Overall) | 271 (52.8%) | 242 (47.2%) |
Employment Industries by Sex in De Smet
Employment Industries in De Smet
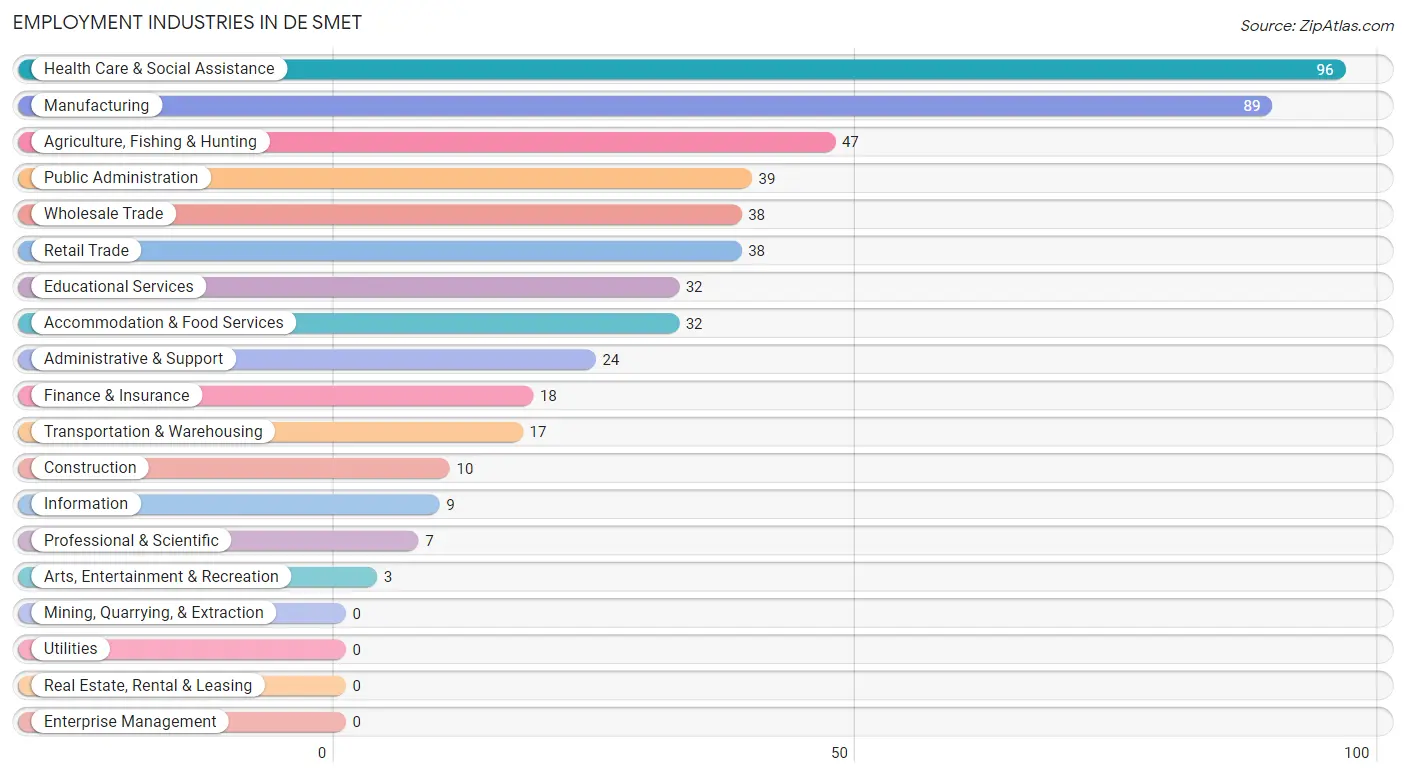
The major employment industries in De Smet include Health Care & Social Assistance (96 | 18.7%), Manufacturing (89 | 17.3%), Agriculture, Fishing & Hunting (47 | 9.2%), Public Administration (39 | 7.6%), and Wholesale Trade (38 | 7.4%).
Employment Industries by Sex in De Smet
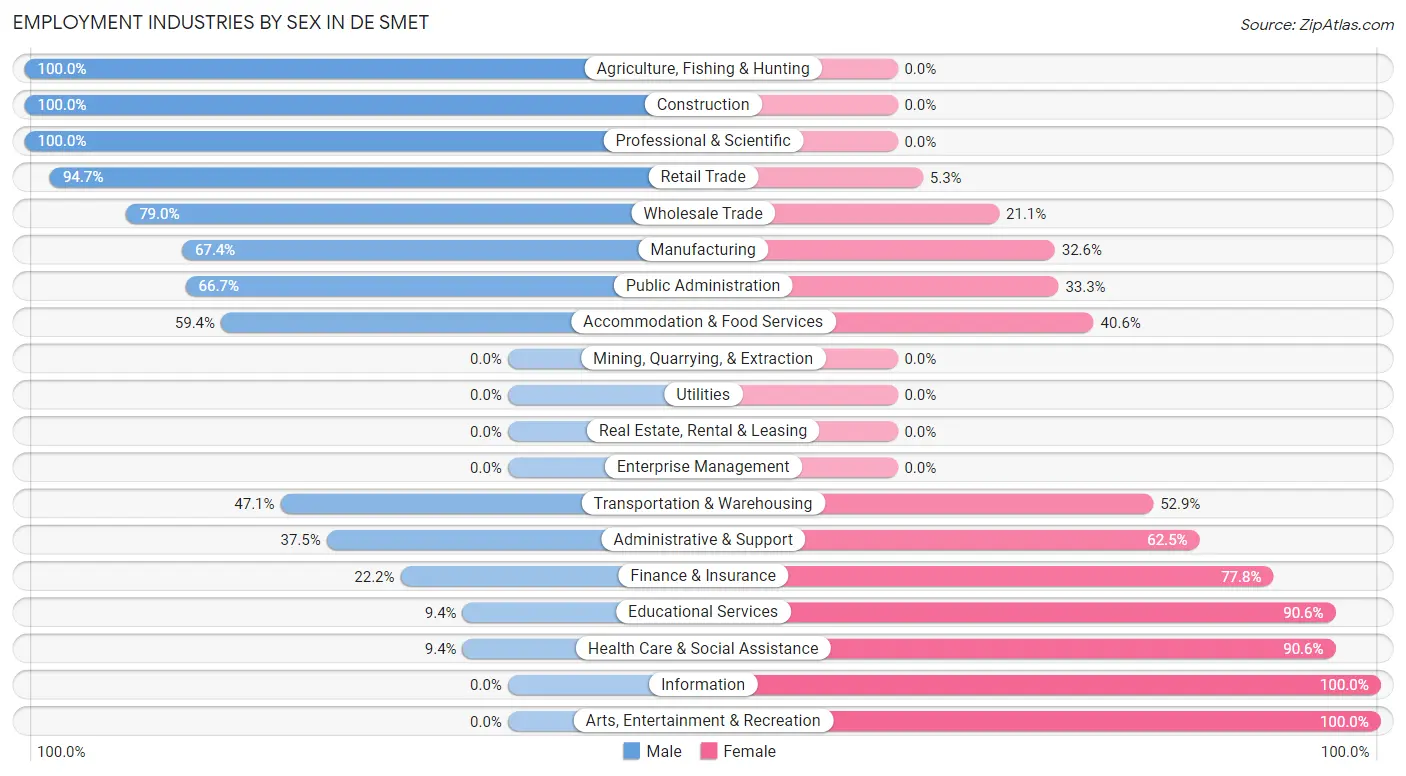
The De Smet industries that see more men than women are Agriculture, Fishing & Hunting (100.0%), Construction (100.0%), and Professional & Scientific (100.0%), whereas the industries that tend to have a higher number of women are Information (100.0%), Arts, Entertainment & Recreation (100.0%), and Educational Services (90.6%).
| Industry | Male | Female |
| Agriculture, Fishing & Hunting | 47 (100.0%) | 0 (0.0%) |
| Mining, Quarrying, & Extraction | 0 (0.0%) | 0 (0.0%) |
| Construction | 10 (100.0%) | 0 (0.0%) |
| Manufacturing | 60 (67.4%) | 29 (32.6%) |
| Wholesale Trade | 30 (78.9%) | 8 (21.0%) |
| Retail Trade | 36 (94.7%) | 2 (5.3%) |
| Transportation & Warehousing | 8 (47.1%) | 9 (52.9%) |
| Utilities | 0 (0.0%) | 0 (0.0%) |
| Information | 0 (0.0%) | 9 (100.0%) |
| Finance & Insurance | 4 (22.2%) | 14 (77.8%) |
| Real Estate, Rental & Leasing | 0 (0.0%) | 0 (0.0%) |
| Professional & Scientific | 7 (100.0%) | 0 (0.0%) |
| Enterprise Management | 0 (0.0%) | 0 (0.0%) |
| Administrative & Support | 9 (37.5%) | 15 (62.5%) |
| Educational Services | 3 (9.4%) | 29 (90.6%) |
| Health Care & Social Assistance | 9 (9.4%) | 87 (90.6%) |
| Arts, Entertainment & Recreation | 0 (0.0%) | 3 (100.0%) |
| Accommodation & Food Services | 19 (59.4%) | 13 (40.6%) |
| Public Administration | 26 (66.7%) | 13 (33.3%) |
| Total | 271 (52.8%) | 242 (47.2%) |
Education in De Smet
School Enrollment in De Smet
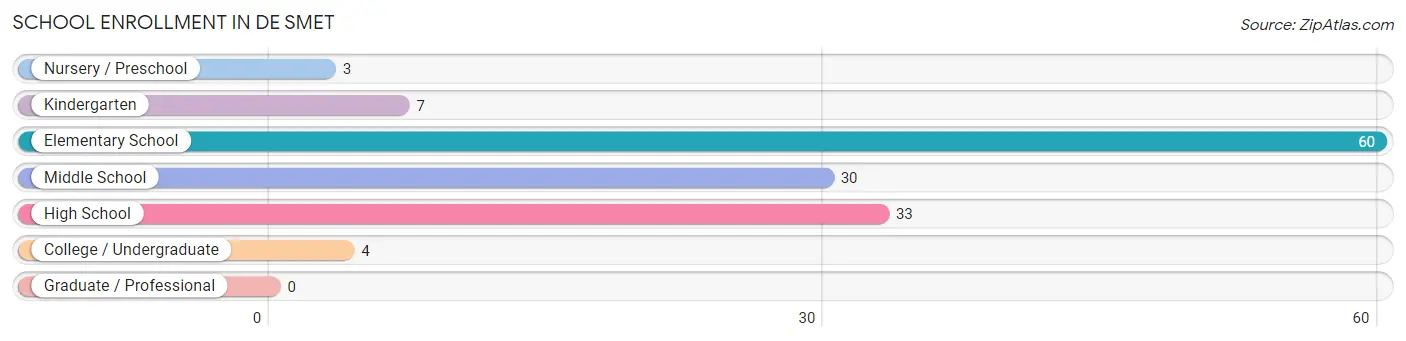
The most common levels of schooling among the 137 students in De Smet are elementary school (60 | 43.8%), high school (33 | 24.1%), and middle school (30 | 21.9%).
| School Level | # Students | % Students |
| Nursery / Preschool | 3 | 2.2% |
| Kindergarten | 7 | 5.1% |
| Elementary School | 60 | 43.8% |
| Middle School | 30 | 21.9% |
| High School | 33 | 24.1% |
| College / Undergraduate | 4 | 2.9% |
| Graduate / Professional | 0 | 0.0% |
| Total | 137 | 100.0% |
School Enrollment by Age by Funding Source in De Smet
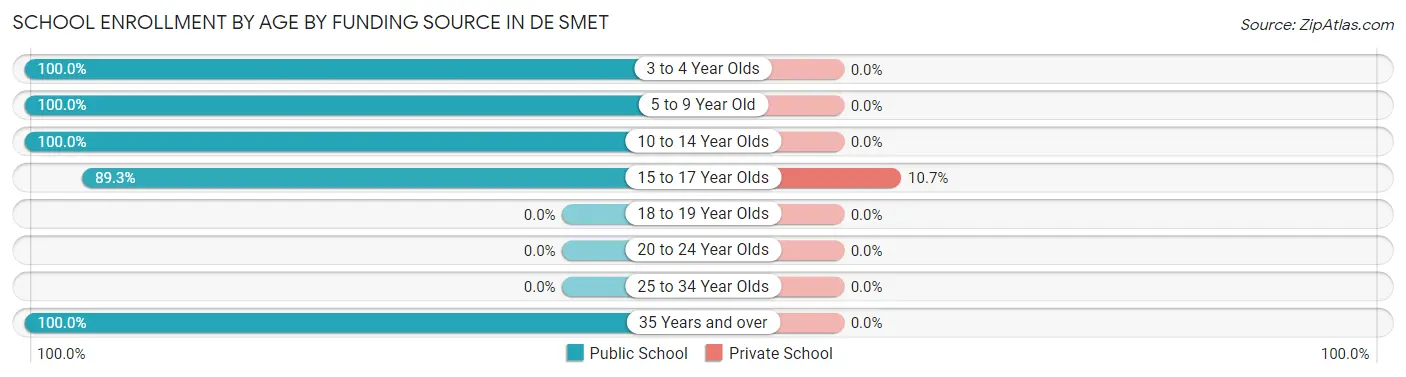
Out of a total of 137 students who are enrolled in schools in De Smet, 3 (2.2%) attend a private institution, while the remaining 134 (97.8%) are enrolled in public schools. The age group of 15 to 17 year olds has the highest likelihood of being enrolled in private schools, with 3 (10.7% in the age bracket) enrolled. Conversely, the age group of 3 to 4 year olds has the lowest likelihood of being enrolled in a private school, with 3 (100.0% in the age bracket) attending a public institution.
| Age Bracket | Public School | Private School |
| 3 to 4 Year Olds | 3 (100.0%) | 0 (0.0%) |
| 5 to 9 Year Old | 46 (100.0%) | 0 (0.0%) |
| 10 to 14 Year Olds | 56 (100.0%) | 0 (0.0%) |
| 15 to 17 Year Olds | 25 (89.3%) | 3 (10.7%) |
| 18 to 19 Year Olds | 0 (0.0%) | 0 (0.0%) |
| 20 to 24 Year Olds | 0 (0.0%) | 0 (0.0%) |
| 25 to 34 Year Olds | 0 (0.0%) | 0 (0.0%) |
| 35 Years and over | 4 (100.0%) | 0 (0.0%) |
| Total | 134 (97.8%) | 3 (2.2%) |
Educational Attainment by Field of Study in De Smet
Education (40 | 25.6%), science & technology (25 | 16.0%), business (17 | 10.9%), liberal arts & history (17 | 10.9%), and psychology (16 | 10.3%) are the most common fields of study among 156 individuals in De Smet who have obtained a bachelor's degree or higher.
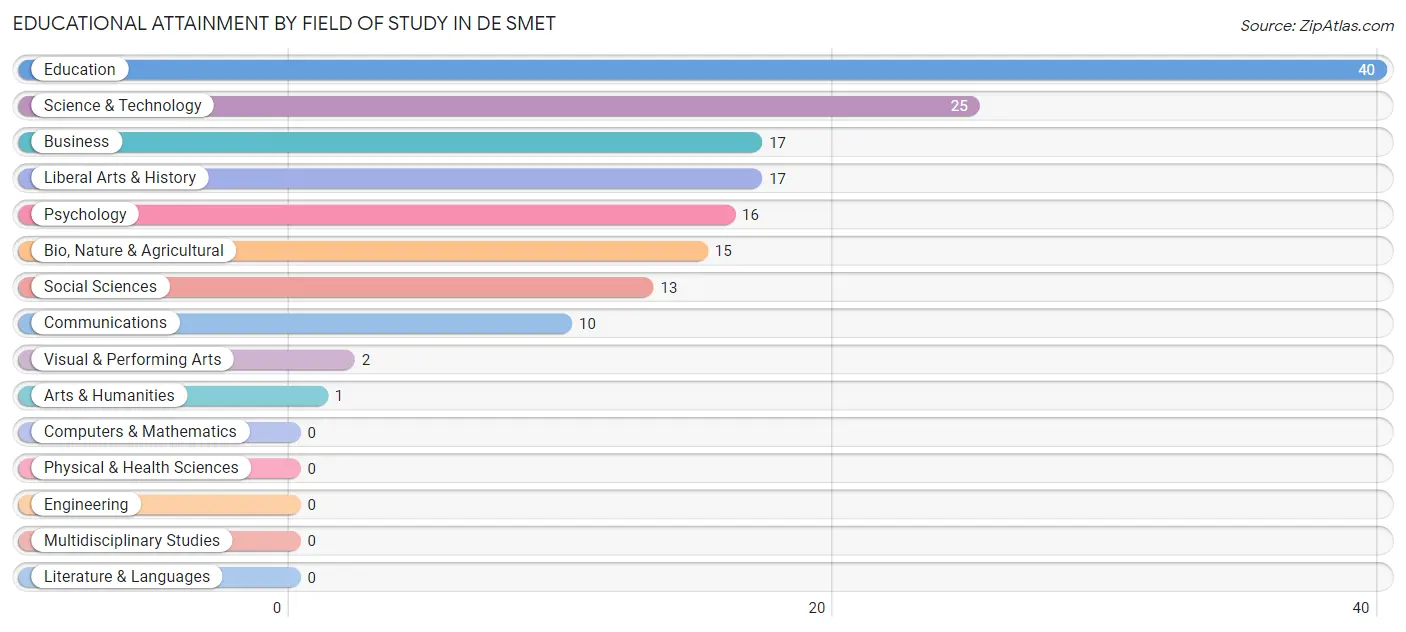
| Field of Study | # Graduates | % Graduates |
| Computers & Mathematics | 0 | 0.0% |
| Bio, Nature & Agricultural | 15 | 9.6% |
| Physical & Health Sciences | 0 | 0.0% |
| Psychology | 16 | 10.3% |
| Social Sciences | 13 | 8.3% |
| Engineering | 0 | 0.0% |
| Multidisciplinary Studies | 0 | 0.0% |
| Science & Technology | 25 | 16.0% |
| Business | 17 | 10.9% |
| Education | 40 | 25.6% |
| Literature & Languages | 0 | 0.0% |
| Liberal Arts & History | 17 | 10.9% |
| Visual & Performing Arts | 2 | 1.3% |
| Communications | 10 | 6.4% |
| Arts & Humanities | 1 | 0.6% |
| Total | 156 | 100.0% |
Transportation & Commute in De Smet
Vehicle Availability by Sex in De Smet
The most prevalent vehicle ownership categories in De Smet are males with 2 vehicles (100, accounting for 36.9%) and females with 2 vehicles (74, making up 41.8%).
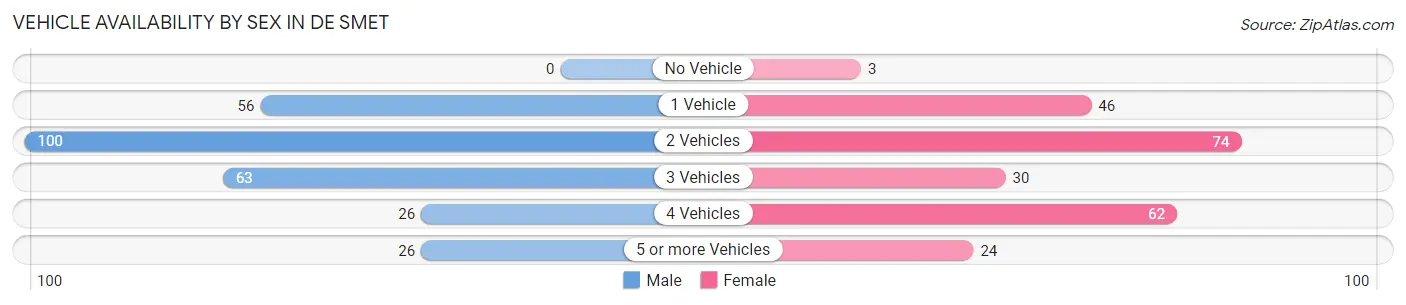
| Vehicles Available | Male | Female |
| No Vehicle | 0 (0.0%) | 3 (1.3%) |
| 1 Vehicle | 56 (20.7%) | 46 (19.3%) |
| 2 Vehicles | 100 (36.9%) | 74 (31.0%) |
| 3 Vehicles | 63 (23.3%) | 30 (12.6%) |
| 4 Vehicles | 26 (9.6%) | 62 (25.9%) |
| 5 or more Vehicles | 26 (9.6%) | 24 (10.0%) |
| Total | 271 (100.0%) | 239 (100.0%) |
Commute Time in De Smet
The most frequently occuring commute durations in De Smet are 5 to 9 minutes (206 commuters, 41.4%), less than 5 minutes (142 commuters, 28.5%), and 15 to 19 minutes (46 commuters, 9.2%).
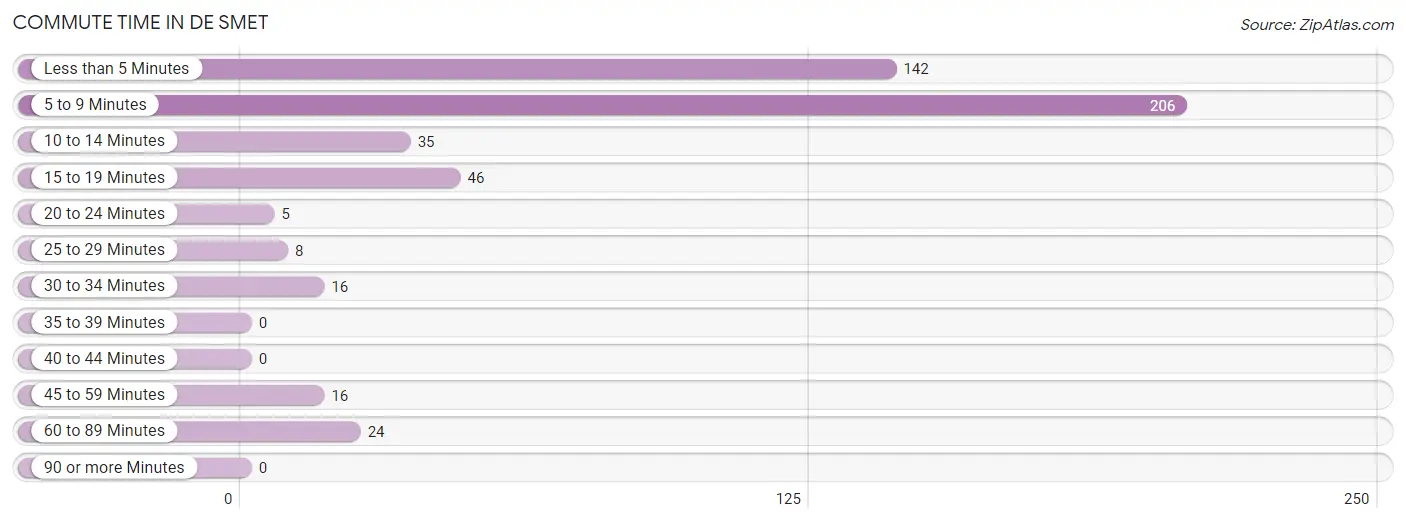
| Commute Time | # Commuters | % Commuters |
| Less than 5 Minutes | 142 | 28.5% |
| 5 to 9 Minutes | 206 | 41.4% |
| 10 to 14 Minutes | 35 | 7.0% |
| 15 to 19 Minutes | 46 | 9.2% |
| 20 to 24 Minutes | 5 | 1.0% |
| 25 to 29 Minutes | 8 | 1.6% |
| 30 to 34 Minutes | 16 | 3.2% |
| 35 to 39 Minutes | 0 | 0.0% |
| 40 to 44 Minutes | 0 | 0.0% |
| 45 to 59 Minutes | 16 | 3.2% |
| 60 to 89 Minutes | 24 | 4.8% |
| 90 or more Minutes | 0 | 0.0% |
Commute Time by Sex in De Smet
The most common commute times in De Smet are 5 to 9 minutes (99 commuters, 37.1%) for males and 5 to 9 minutes (107 commuters, 46.3%) for females.
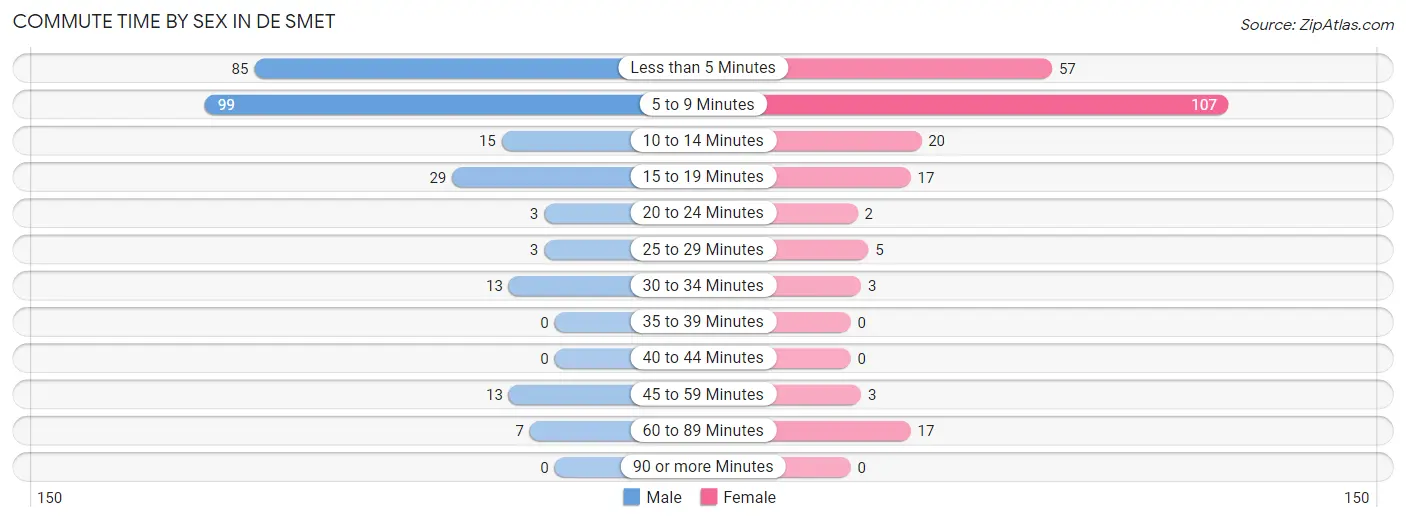
| Commute Time | Male | Female |
| Less than 5 Minutes | 85 (31.8%) | 57 (24.7%) |
| 5 to 9 Minutes | 99 (37.1%) | 107 (46.3%) |
| 10 to 14 Minutes | 15 (5.6%) | 20 (8.7%) |
| 15 to 19 Minutes | 29 (10.9%) | 17 (7.4%) |
| 20 to 24 Minutes | 3 (1.1%) | 2 (0.9%) |
| 25 to 29 Minutes | 3 (1.1%) | 5 (2.2%) |
| 30 to 34 Minutes | 13 (4.9%) | 3 (1.3%) |
| 35 to 39 Minutes | 0 (0.0%) | 0 (0.0%) |
| 40 to 44 Minutes | 0 (0.0%) | 0 (0.0%) |
| 45 to 59 Minutes | 13 (4.9%) | 3 (1.3%) |
| 60 to 89 Minutes | 7 (2.6%) | 17 (7.4%) |
| 90 or more Minutes | 0 (0.0%) | 0 (0.0%) |
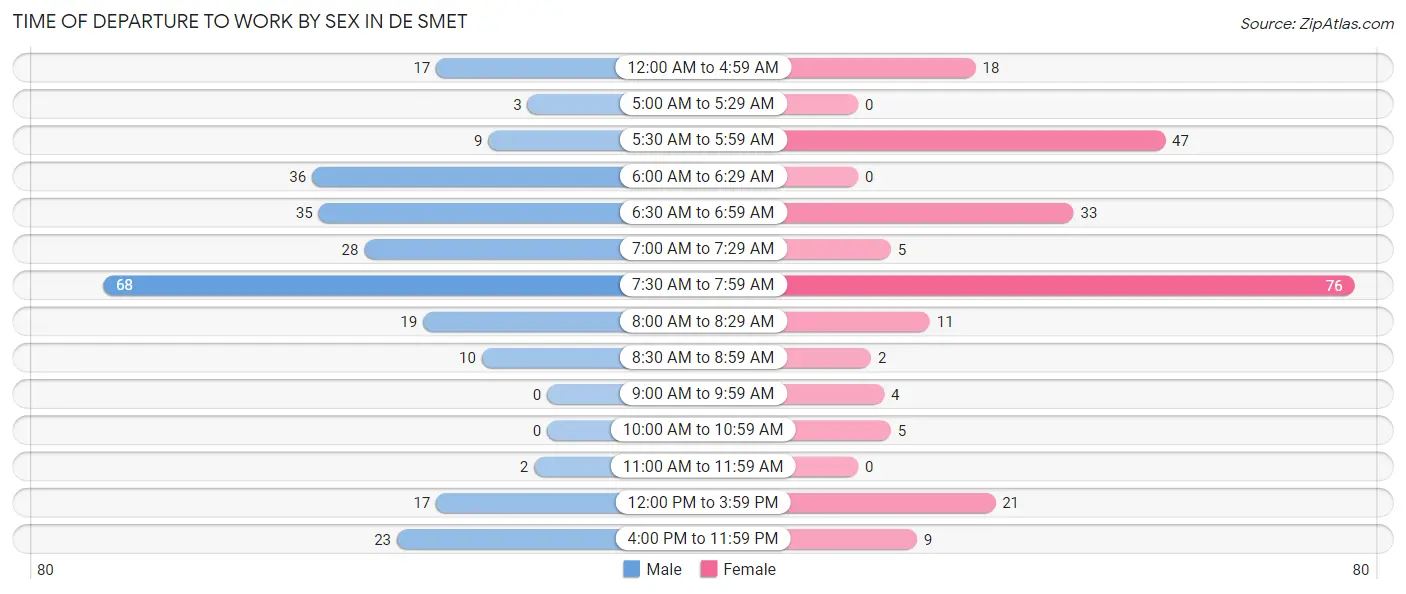
Time of Departure to Work by Sex in De Smet
The most frequent times of departure to work in De Smet are 7:30 AM to 7:59 AM (68, 25.5%) for males and 7:30 AM to 7:59 AM (76, 32.9%) for females.
| Time of Departure | Male | Female |
| 12:00 AM to 4:59 AM | 17 (6.4%) | 18 (7.8%) |
| 5:00 AM to 5:29 AM | 3 (1.1%) | 0 (0.0%) |
| 5:30 AM to 5:59 AM | 9 (3.4%) | 47 (20.3%) |
| 6:00 AM to 6:29 AM | 36 (13.5%) | 0 (0.0%) |
| 6:30 AM to 6:59 AM | 35 (13.1%) | 33 (14.3%) |
| 7:00 AM to 7:29 AM | 28 (10.5%) | 5 (2.2%) |
| 7:30 AM to 7:59 AM | 68 (25.5%) | 76 (32.9%) |
| 8:00 AM to 8:29 AM | 19 (7.1%) | 11 (4.8%) |
| 8:30 AM to 8:59 AM | 10 (3.7%) | 2 (0.9%) |
| 9:00 AM to 9:59 AM | 0 (0.0%) | 4 (1.7%) |
| 10:00 AM to 10:59 AM | 0 (0.0%) | 5 (2.2%) |
| 11:00 AM to 11:59 AM | 2 (0.7%) | 0 (0.0%) |
| 12:00 PM to 3:59 PM | 17 (6.4%) | 21 (9.1%) |
| 4:00 PM to 11:59 PM | 23 (8.6%) | 9 (3.9%) |
| Total | 267 (100.0%) | 231 (100.0%) |
Housing Occupancy in De Smet
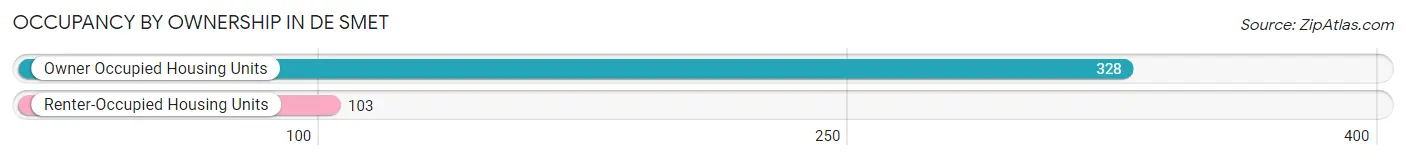
Occupancy by Ownership in De Smet
Of the total 431 dwellings in De Smet, owner-occupied units account for 328 (76.1%), while renter-occupied units make up 103 (23.9%).
| Occupancy | # Housing Units | % Housing Units |
| Owner Occupied Housing Units | 328 | 76.1% |
| Renter-Occupied Housing Units | 103 | 23.9% |
| Total Occupied Housing Units | 431 | 100.0% |
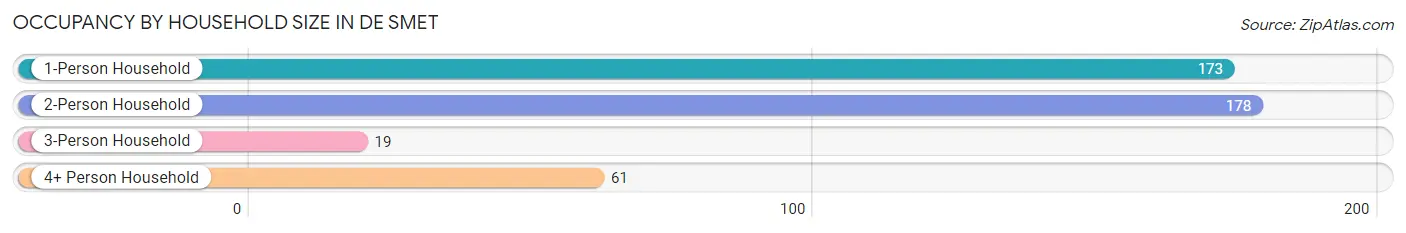
Occupancy by Household Size in De Smet
| Household Size | # Housing Units | % Housing Units |
| 1-Person Household | 173 | 40.1% |
| 2-Person Household | 178 | 41.3% |
| 3-Person Household | 19 | 4.4% |
| 4+ Person Household | 61 | 14.1% |
| Total Housing Units | 431 | 100.0% |
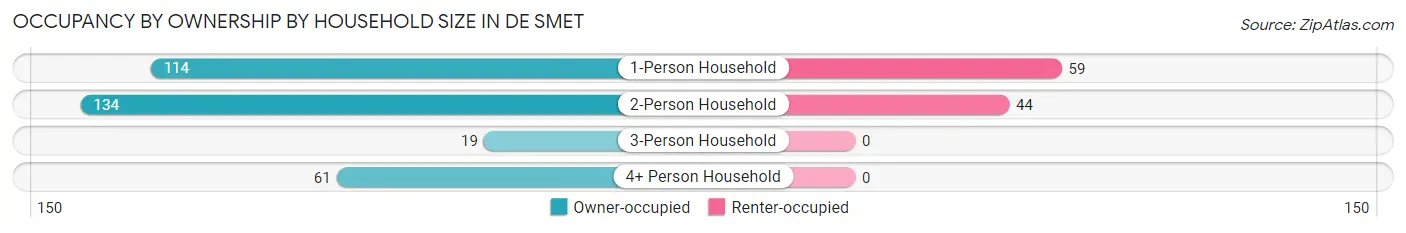
Occupancy by Ownership by Household Size in De Smet
| Household Size | Owner-occupied | Renter-occupied |
| 1-Person Household | 114 (65.9%) | 59 (34.1%) |
| 2-Person Household | 134 (75.3%) | 44 (24.7%) |
| 3-Person Household | 19 (100.0%) | 0 (0.0%) |
| 4+ Person Household | 61 (100.0%) | 0 (0.0%) |
| Total Housing Units | 328 (76.1%) | 103 (23.9%) |
Occupancy by Educational Attainment in De Smet
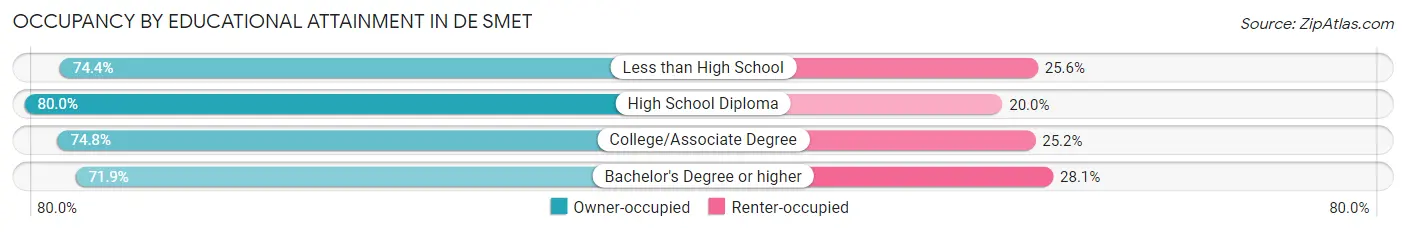
| Household Size | Owner-occupied | Renter-occupied |
| Less than High School | 29 (74.4%) | 10 (25.6%) |
| High School Diploma | 140 (80.0%) | 35 (20.0%) |
| College/Associate Degree | 77 (74.8%) | 26 (25.2%) |
| Bachelor's Degree or higher | 82 (71.9%) | 32 (28.1%) |
Occupancy by Age of Householder in De Smet
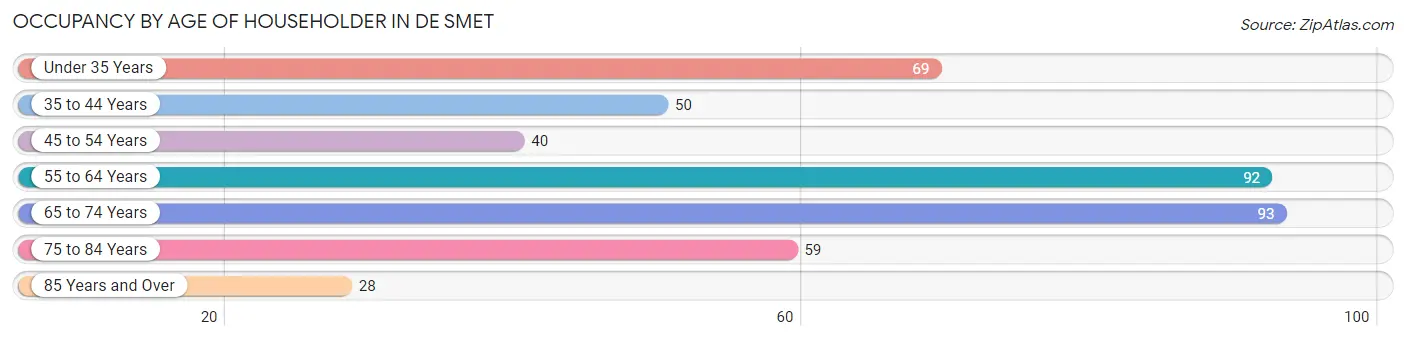
| Age Bracket | # Households | % Households |
| Under 35 Years | 69 | 16.0% |
| 35 to 44 Years | 50 | 11.6% |
| 45 to 54 Years | 40 | 9.3% |
| 55 to 64 Years | 92 | 21.3% |
| 65 to 74 Years | 93 | 21.6% |
| 75 to 84 Years | 59 | 13.7% |
| 85 Years and Over | 28 | 6.5% |
| Total | 431 | 100.0% |
Housing Finances in De Smet
Median Income by Occupancy in De Smet
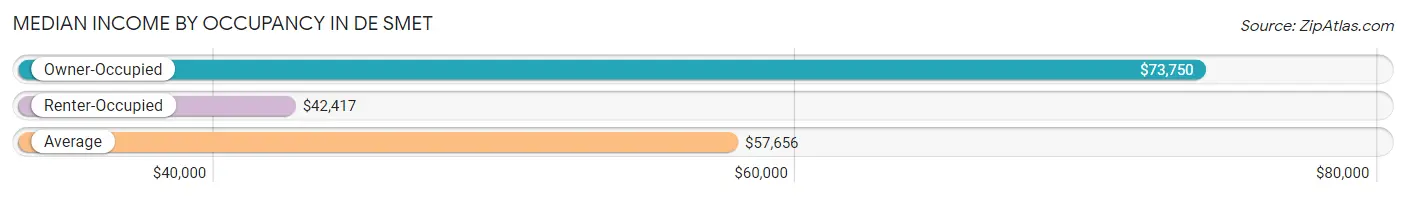
| Occupancy Type | # Households | Median Income |
| Owner-Occupied | 328 (76.1%) | $73,750 |
| Renter-Occupied | 103 (23.9%) | $42,417 |
| Average | 431 (100.0%) | $57,656 |
Occupancy by Householder Income Bracket in De Smet
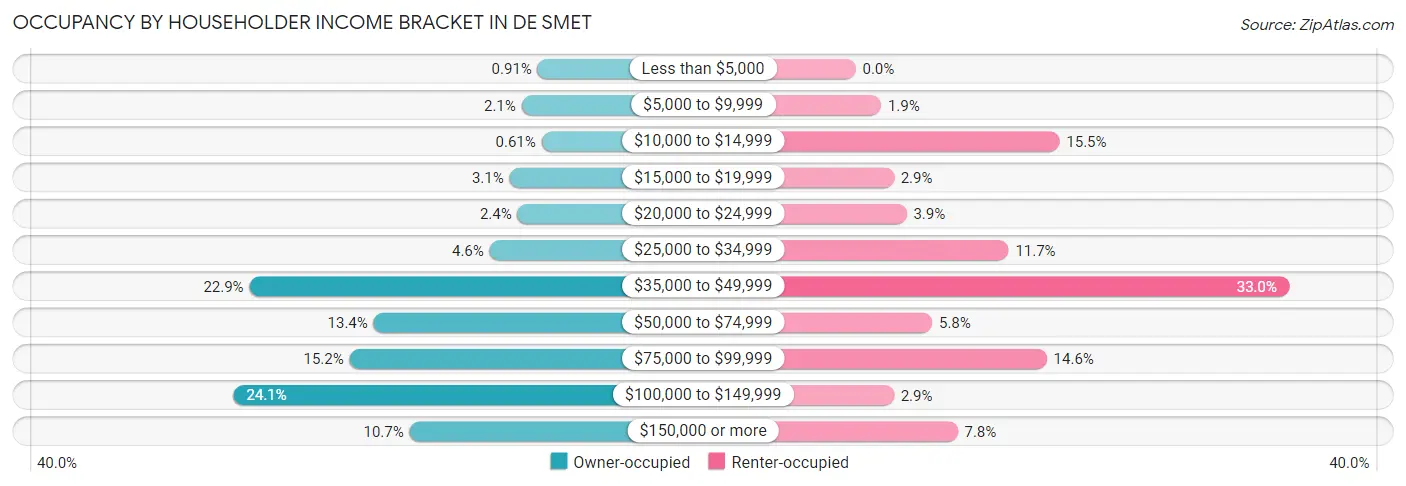
| Income Bracket | Owner-occupied | Renter-occupied |
| Less than $5,000 | 3 (0.9%) | 0 (0.0%) |
| $5,000 to $9,999 | 7 (2.1%) | 2 (1.9%) |
| $10,000 to $14,999 | 2 (0.6%) | 16 (15.5%) |
| $15,000 to $19,999 | 10 (3.0%) | 3 (2.9%) |
| $20,000 to $24,999 | 8 (2.4%) | 4 (3.9%) |
| $25,000 to $34,999 | 15 (4.6%) | 12 (11.7%) |
| $35,000 to $49,999 | 75 (22.9%) | 34 (33.0%) |
| $50,000 to $74,999 | 44 (13.4%) | 6 (5.8%) |
| $75,000 to $99,999 | 50 (15.2%) | 15 (14.6%) |
| $100,000 to $149,999 | 79 (24.1%) | 3 (2.9%) |
| $150,000 or more | 35 (10.7%) | 8 (7.8%) |
| Total | 328 (100.0%) | 103 (100.0%) |
Monthly Housing Cost Tiers in De Smet
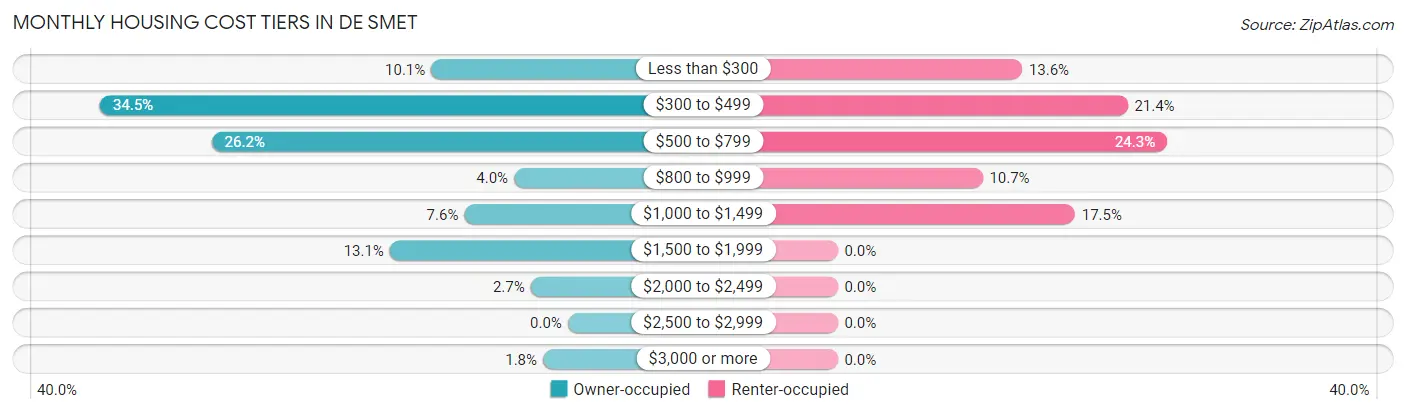
| Monthly Cost | Owner-occupied | Renter-occupied |
| Less than $300 | 33 (10.1%) | 14 (13.6%) |
| $300 to $499 | 113 (34.4%) | 22 (21.4%) |
| $500 to $799 | 86 (26.2%) | 25 (24.3%) |
| $800 to $999 | 13 (4.0%) | 11 (10.7%) |
| $1,000 to $1,499 | 25 (7.6%) | 18 (17.5%) |
| $1,500 to $1,999 | 43 (13.1%) | 0 (0.0%) |
| $2,000 to $2,499 | 9 (2.7%) | 0 (0.0%) |
| $2,500 to $2,999 | 0 (0.0%) | 0 (0.0%) |
| $3,000 or more | 6 (1.8%) | 0 (0.0%) |
| Total | 328 (100.0%) | 103 (100.0%) |
Physical Housing Characteristics in De Smet
Housing Structures in De Smet
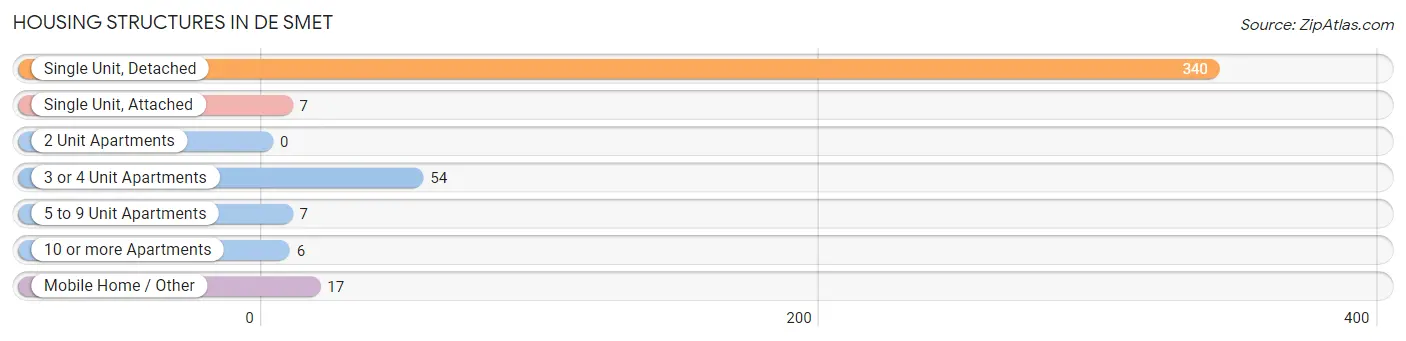
| Structure Type | # Housing Units | % Housing Units |
| Single Unit, Detached | 340 | 78.9% |
| Single Unit, Attached | 7 | 1.6% |
| 2 Unit Apartments | 0 | 0.0% |
| 3 or 4 Unit Apartments | 54 | 12.5% |
| 5 to 9 Unit Apartments | 7 | 1.6% |
| 10 or more Apartments | 6 | 1.4% |
| Mobile Home / Other | 17 | 3.9% |
| Total | 431 | 100.0% |
Housing Structures by Occupancy in De Smet
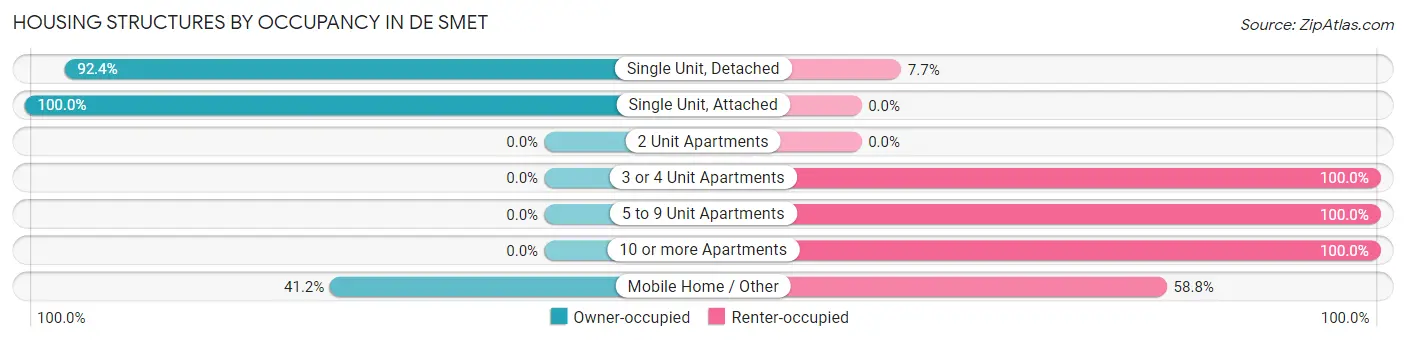
| Structure Type | Owner-occupied | Renter-occupied |
| Single Unit, Detached | 314 (92.3%) | 26 (7.6%) |
| Single Unit, Attached | 7 (100.0%) | 0 (0.0%) |
| 2 Unit Apartments | 0 (0.0%) | 0 (0.0%) |
| 3 or 4 Unit Apartments | 0 (0.0%) | 54 (100.0%) |
| 5 to 9 Unit Apartments | 0 (0.0%) | 7 (100.0%) |
| 10 or more Apartments | 0 (0.0%) | 6 (100.0%) |
| Mobile Home / Other | 7 (41.2%) | 10 (58.8%) |
| Total | 328 (76.1%) | 103 (23.9%) |
Housing Structures by Number of Rooms in De Smet
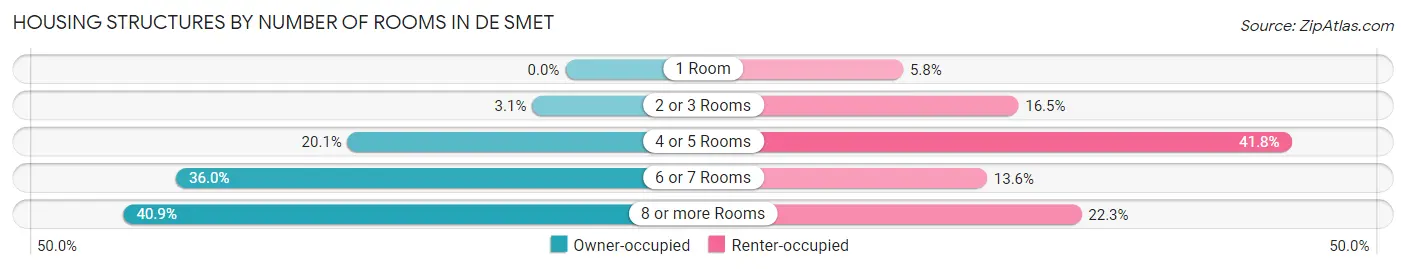
| Number of Rooms | Owner-occupied | Renter-occupied |
| 1 Room | 0 (0.0%) | 6 (5.8%) |
| 2 or 3 Rooms | 10 (3.0%) | 17 (16.5%) |
| 4 or 5 Rooms | 66 (20.1%) | 43 (41.7%) |
| 6 or 7 Rooms | 118 (36.0%) | 14 (13.6%) |
| 8 or more Rooms | 134 (40.8%) | 23 (22.3%) |
| Total | 328 (100.0%) | 103 (100.0%) |
Housing Structure by Heating Type in De Smet
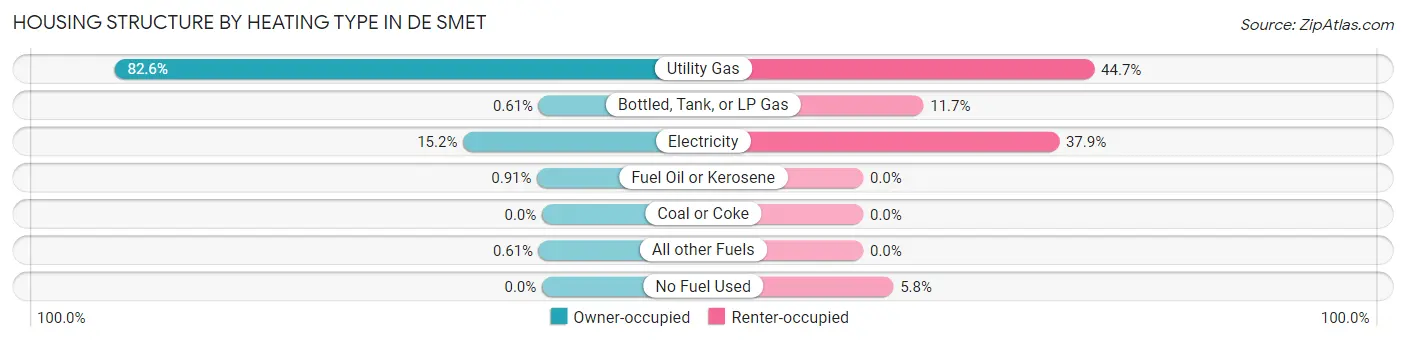
| Heating Type | Owner-occupied | Renter-occupied |
| Utility Gas | 271 (82.6%) | 46 (44.7%) |
| Bottled, Tank, or LP Gas | 2 (0.6%) | 12 (11.7%) |
| Electricity | 50 (15.2%) | 39 (37.9%) |
| Fuel Oil or Kerosene | 3 (0.9%) | 0 (0.0%) |
| Coal or Coke | 0 (0.0%) | 0 (0.0%) |
| All other Fuels | 2 (0.6%) | 0 (0.0%) |
| No Fuel Used | 0 (0.0%) | 6 (5.8%) |
| Total | 328 (100.0%) | 103 (100.0%) |
Household Vehicle Usage in De Smet
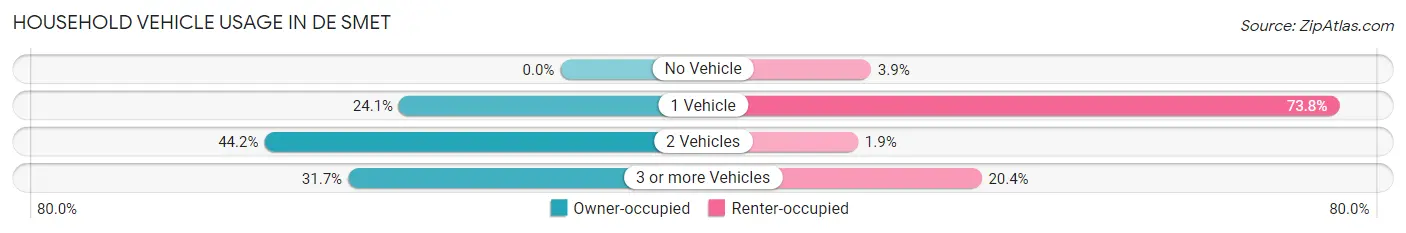
| Vehicles per Household | Owner-occupied | Renter-occupied |
| No Vehicle | 0 (0.0%) | 4 (3.9%) |
| 1 Vehicle | 79 (24.1%) | 76 (73.8%) |
| 2 Vehicles | 145 (44.2%) | 2 (1.9%) |
| 3 or more Vehicles | 104 (31.7%) | 21 (20.4%) |
| Total | 328 (100.0%) | 103 (100.0%) |
Real Estate & Mortgages in De Smet
Real Estate and Mortgage Overview in De Smet
| Characteristic | Without Mortgage | With Mortgage |
| Housing Units | 207 | 121 |
| Median Property Value | $133,900 | $200,700 |
| Median Household Income | $53,365 | $19 |
| Monthly Housing Costs | $431 | $6 |
| Real Estate Taxes | $1,547 | $0 |
Property Value by Mortgage Status in De Smet
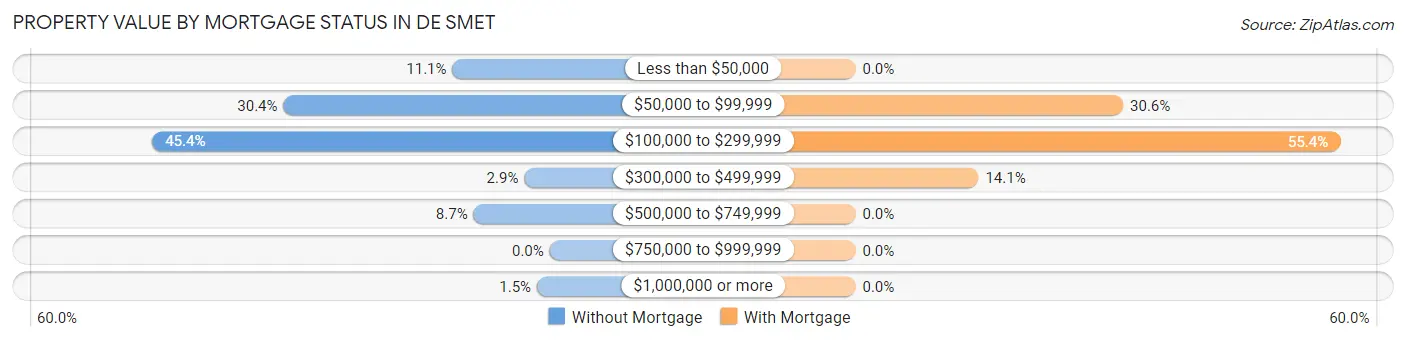
| Property Value | Without Mortgage | With Mortgage |
| Less than $50,000 | 23 (11.1%) | 0 (0.0%) |
| $50,000 to $99,999 | 63 (30.4%) | 37 (30.6%) |
| $100,000 to $299,999 | 94 (45.4%) | 67 (55.4%) |
| $300,000 to $499,999 | 6 (2.9%) | 17 (14.1%) |
| $500,000 to $749,999 | 18 (8.7%) | 0 (0.0%) |
| $750,000 to $999,999 | 0 (0.0%) | 0 (0.0%) |
| $1,000,000 or more | 3 (1.5%) | 0 (0.0%) |
| Total | 207 (100.0%) | 121 (100.0%) |
Household Income by Mortgage Status in De Smet
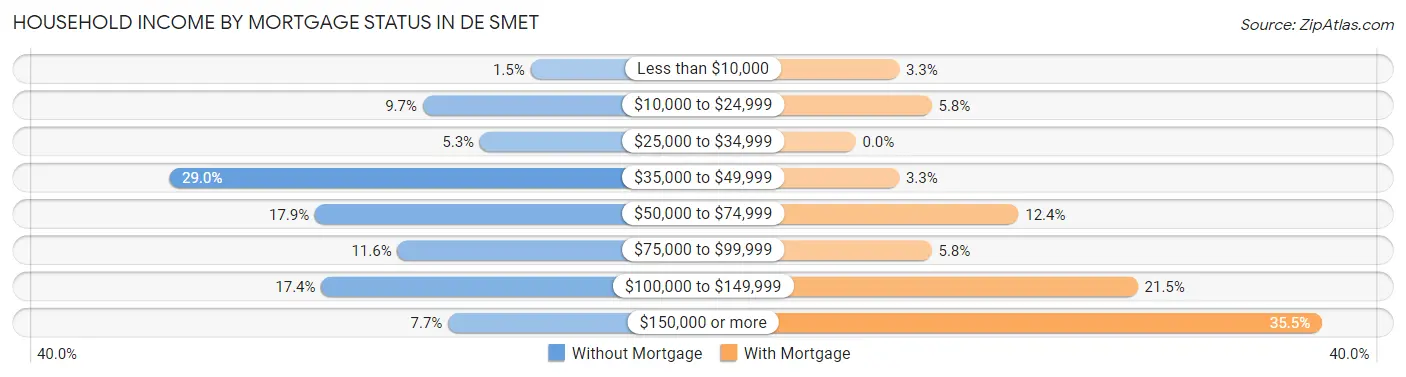
| Household Income | Without Mortgage | With Mortgage |
| Less than $10,000 | 3 (1.5%) | 4 (3.3%) |
| $10,000 to $24,999 | 20 (9.7%) | 7 (5.8%) |
| $25,000 to $34,999 | 11 (5.3%) | 0 (0.0%) |
| $35,000 to $49,999 | 60 (29.0%) | 4 (3.3%) |
| $50,000 to $74,999 | 37 (17.9%) | 15 (12.4%) |
| $75,000 to $99,999 | 24 (11.6%) | 7 (5.8%) |
| $100,000 to $149,999 | 36 (17.4%) | 26 (21.5%) |
| $150,000 or more | 16 (7.7%) | 43 (35.5%) |
| Total | 207 (100.0%) | 121 (100.0%) |
Property Value to Household Income Ratio in De Smet
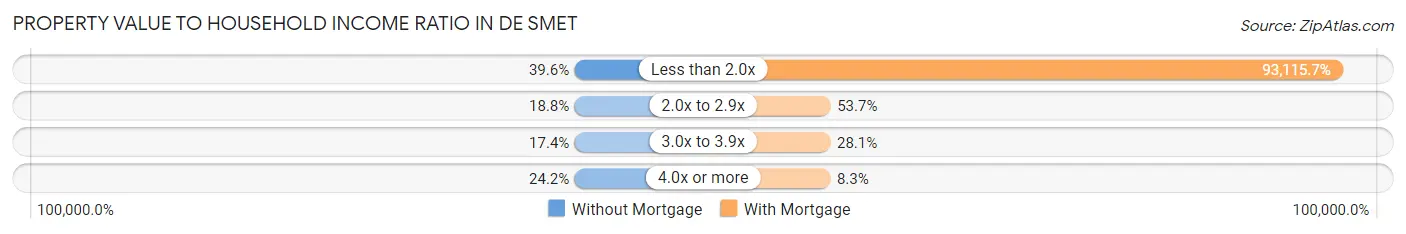
| Value-to-Income Ratio | Without Mortgage | With Mortgage |
| Less than 2.0x | 82 (39.6%) | 112,670 (93,115.7%) |
| 2.0x to 2.9x | 39 (18.8%) | 65 (53.7%) |
| 3.0x to 3.9x | 36 (17.4%) | 34 (28.1%) |
| 4.0x or more | 50 (24.1%) | 10 (8.3%) |
| Total | 207 (100.0%) | 121 (100.0%) |
Real Estate Taxes by Mortgage Status in De Smet
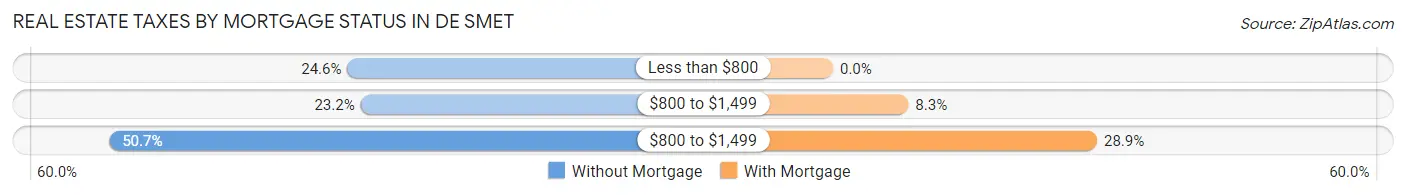
| Property Taxes | Without Mortgage | With Mortgage |
| Less than $800 | 51 (24.6%) | 0 (0.0%) |
| $800 to $1,499 | 48 (23.2%) | 10 (8.3%) |
| $800 to $1,499 | 105 (50.7%) | 35 (28.9%) |
| Total | 207 (100.0%) | 121 (100.0%) |
Health & Disability in De Smet
Health Insurance Coverage by Age in De Smet
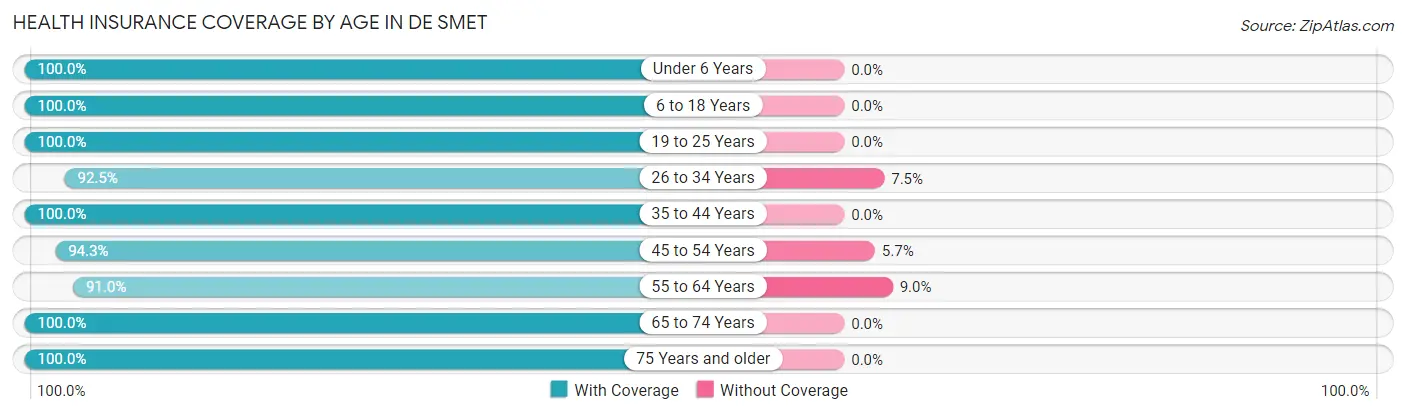
| Age Bracket | With Coverage | Without Coverage |
| Under 6 Years | 42 (100.0%) | 0 (0.0%) |
| 6 to 18 Years | 136 (100.0%) | 0 (0.0%) |
| 19 to 25 Years | 68 (100.0%) | 0 (0.0%) |
| 26 to 34 Years | 62 (92.5%) | 5 (7.5%) |
| 35 to 44 Years | 107 (100.0%) | 0 (0.0%) |
| 45 to 54 Years | 66 (94.3%) | 4 (5.7%) |
| 55 to 64 Years | 131 (91.0%) | 13 (9.0%) |
| 65 to 74 Years | 137 (100.0%) | 0 (0.0%) |
| 75 Years and older | 166 (100.0%) | 0 (0.0%) |
| Total | 915 (97.7%) | 22 (2.4%) |
Health Insurance Coverage by Citizenship Status in De Smet
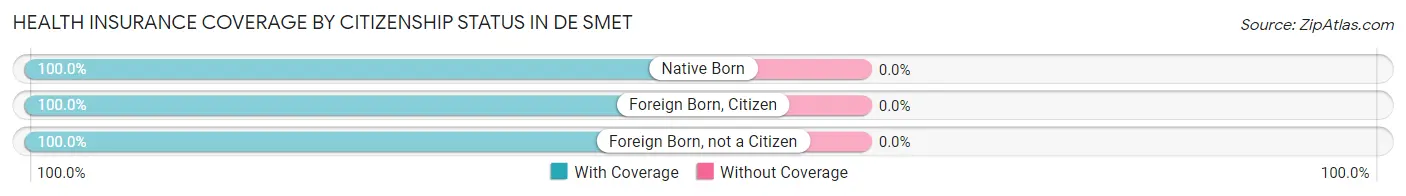
| Citizenship Status | With Coverage | Without Coverage |
| Native Born | 42 (100.0%) | 0 (0.0%) |
| Foreign Born, Citizen | 136 (100.0%) | 0 (0.0%) |
| Foreign Born, not a Citizen | 68 (100.0%) | 0 (0.0%) |
Health Insurance Coverage by Household Income in De Smet
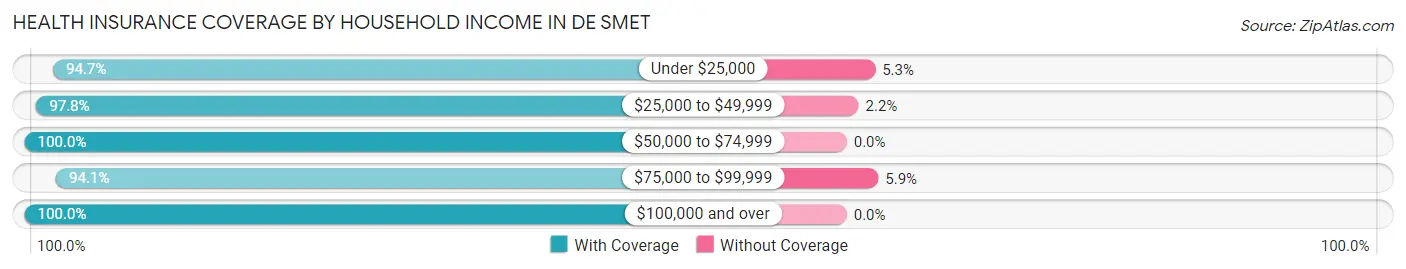
| Household Income | With Coverage | Without Coverage |
| Under $25,000 | 71 (94.7%) | 4 (5.3%) |
| $25,000 to $49,999 | 221 (97.8%) | 5 (2.2%) |
| $50,000 to $74,999 | 85 (100.0%) | 0 (0.0%) |
| $75,000 to $99,999 | 207 (94.1%) | 13 (5.9%) |
| $100,000 and over | 331 (100.0%) | 0 (0.0%) |
Public vs Private Health Insurance Coverage by Age in De Smet
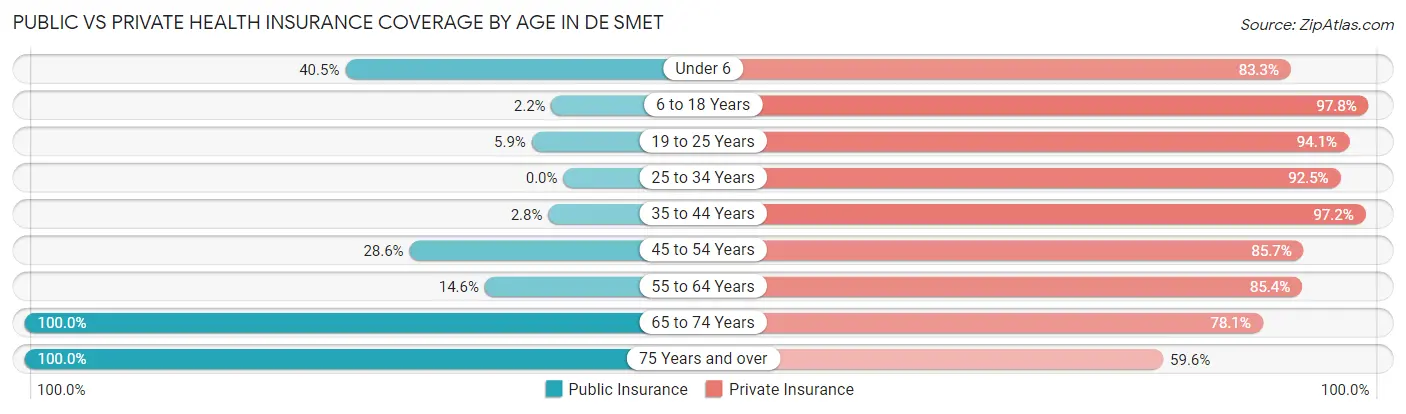
| Age Bracket | Public Insurance | Private Insurance |
| Under 6 | 17 (40.5%) | 35 (83.3%) |
| 6 to 18 Years | 3 (2.2%) | 133 (97.8%) |
| 19 to 25 Years | 4 (5.9%) | 64 (94.1%) |
| 25 to 34 Years | 0 (0.0%) | 62 (92.5%) |
| 35 to 44 Years | 3 (2.8%) | 104 (97.2%) |
| 45 to 54 Years | 20 (28.6%) | 60 (85.7%) |
| 55 to 64 Years | 21 (14.6%) | 123 (85.4%) |
| 65 to 74 Years | 137 (100.0%) | 107 (78.1%) |
| 75 Years and over | 166 (100.0%) | 99 (59.6%) |
| Total | 371 (39.6%) | 787 (84.0%) |
Disability Status by Sex by Age in De Smet
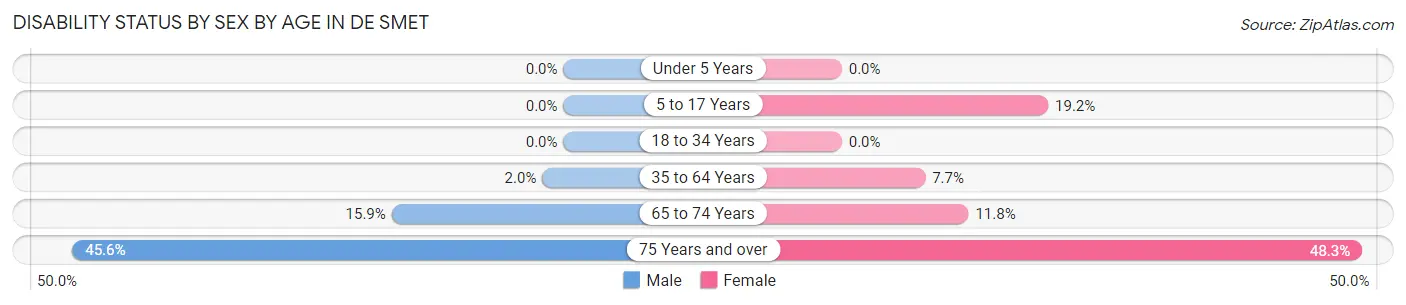
| Age Bracket | Male | Female |
| Under 5 Years | 0 (0.0%) | 0 (0.0%) |
| 5 to 17 Years | 0 (0.0%) | 9 (19.2%) |
| 18 to 34 Years | 0 (0.0%) | 0 (0.0%) |
| 35 to 64 Years | 3 (2.0%) | 13 (7.7%) |
| 65 to 74 Years | 11 (15.9%) | 8 (11.8%) |
| 75 Years and over | 36 (45.6%) | 42 (48.3%) |
Disability Class by Sex by Age in De Smet
Disability Class: Hearing Difficulty
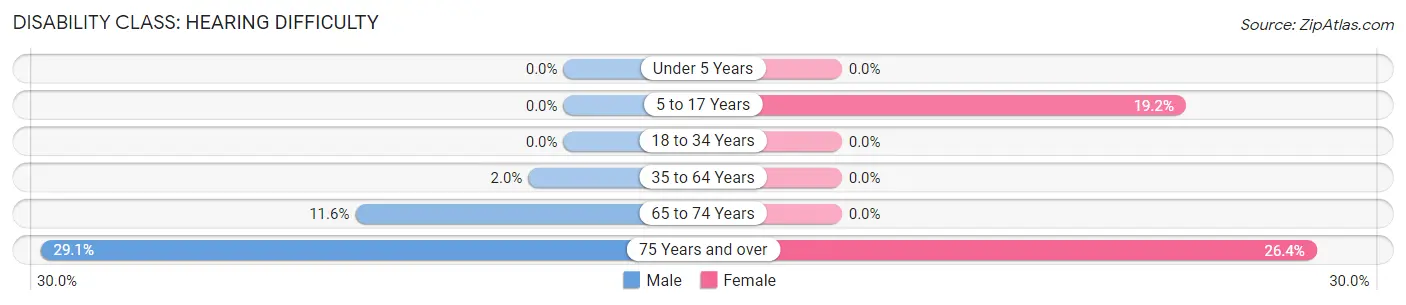
| Age Bracket | Male | Female |
| Under 5 Years | 0 (0.0%) | 0 (0.0%) |
| 5 to 17 Years | 0 (0.0%) | 9 (19.2%) |
| 18 to 34 Years | 0 (0.0%) | 0 (0.0%) |
| 35 to 64 Years | 3 (2.0%) | 0 (0.0%) |
| 65 to 74 Years | 8 (11.6%) | 0 (0.0%) |
| 75 Years and over | 23 (29.1%) | 23 (26.4%) |
Disability Class: Vision Difficulty
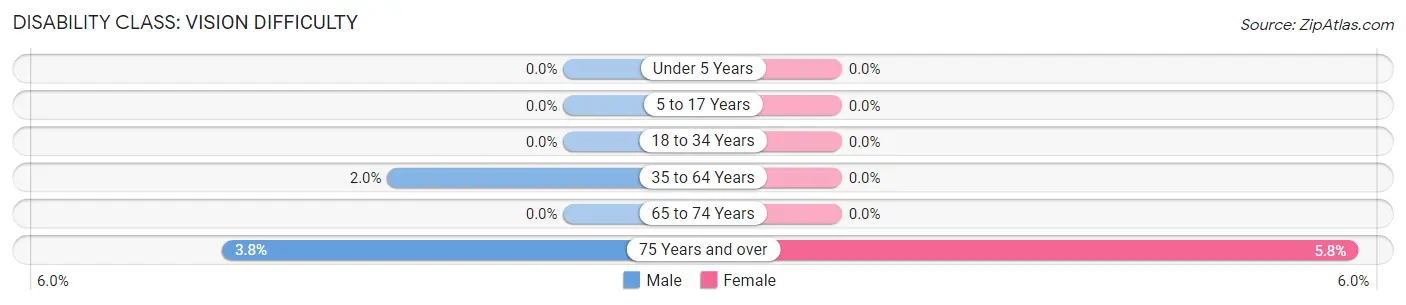
| Age Bracket | Male | Female |
| Under 5 Years | 0 (0.0%) | 0 (0.0%) |
| 5 to 17 Years | 0 (0.0%) | 0 (0.0%) |
| 18 to 34 Years | 0 (0.0%) | 0 (0.0%) |
| 35 to 64 Years | 3 (2.0%) | 0 (0.0%) |
| 65 to 74 Years | 0 (0.0%) | 0 (0.0%) |
| 75 Years and over | 3 (3.8%) | 5 (5.8%) |
Disability Class: Cognitive Difficulty
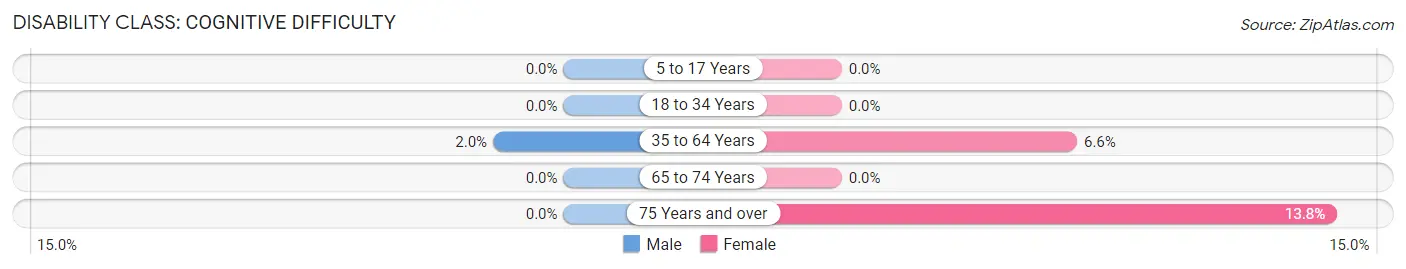
| Age Bracket | Male | Female |
| 5 to 17 Years | 0 (0.0%) | 0 (0.0%) |
| 18 to 34 Years | 0 (0.0%) | 0 (0.0%) |
| 35 to 64 Years | 3 (2.0%) | 11 (6.6%) |
| 65 to 74 Years | 0 (0.0%) | 0 (0.0%) |
| 75 Years and over | 0 (0.0%) | 12 (13.8%) |
Disability Class: Ambulatory Difficulty
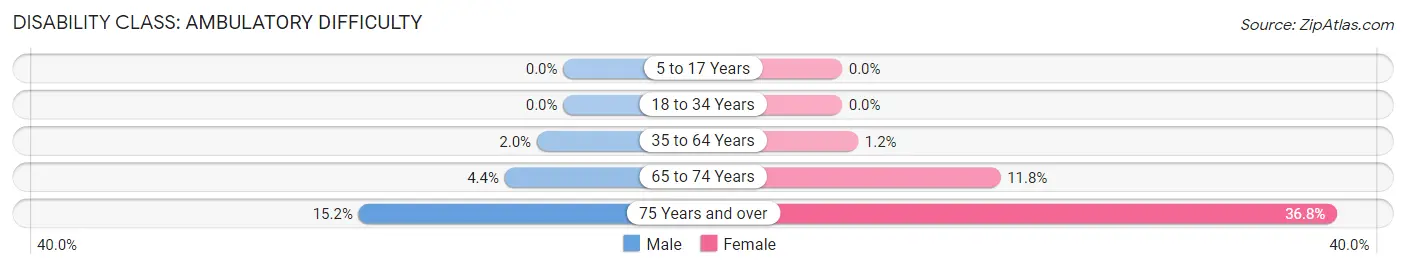
| Age Bracket | Male | Female |
| 5 to 17 Years | 0 (0.0%) | 0 (0.0%) |
| 18 to 34 Years | 0 (0.0%) | 0 (0.0%) |
| 35 to 64 Years | 3 (2.0%) | 2 (1.2%) |
| 65 to 74 Years | 3 (4.3%) | 8 (11.8%) |
| 75 Years and over | 12 (15.2%) | 32 (36.8%) |
Disability Class: Self-Care Difficulty
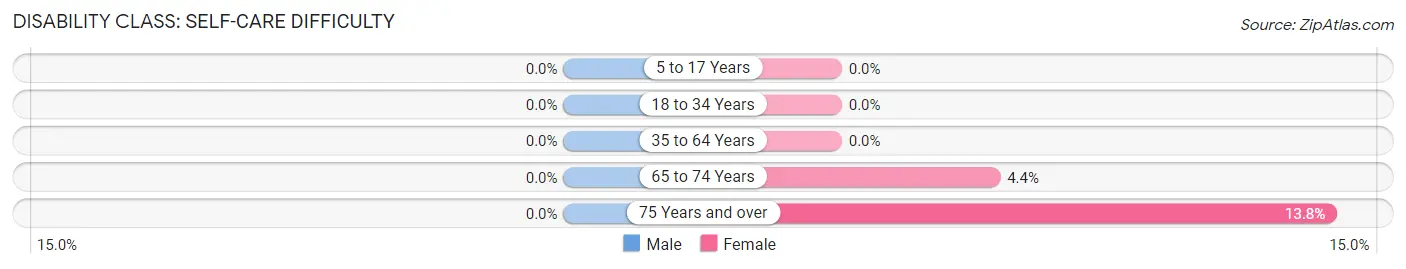
| Age Bracket | Male | Female |
| 5 to 17 Years | 0 (0.0%) | 0 (0.0%) |
| 18 to 34 Years | 0 (0.0%) | 0 (0.0%) |
| 35 to 64 Years | 0 (0.0%) | 0 (0.0%) |
| 65 to 74 Years | 0 (0.0%) | 3 (4.4%) |
| 75 Years and over | 0 (0.0%) | 12 (13.8%) |
Technology Access in De Smet
Computing Device Access in De Smet
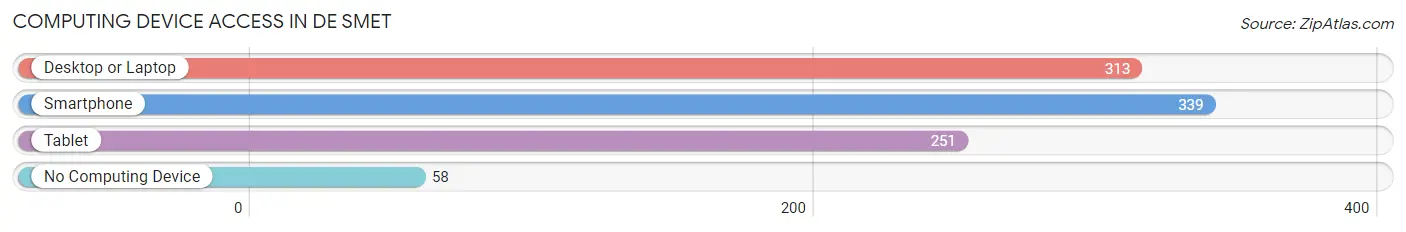
| Device Type | # Households | % Households |
| Desktop or Laptop | 313 | 72.6% |
| Smartphone | 339 | 78.6% |
| Tablet | 251 | 58.2% |
| No Computing Device | 58 | 13.5% |
| Total | 431 | 100.0% |
Internet Access in De Smet

| Internet Type | # Households | % Households |
| Dial-Up Internet | 0 | 0.0% |
| Broadband Home | 293 | 68.0% |
| Cellular Data Only | 42 | 9.7% |
| Satellite Internet | 52 | 12.1% |
| No Internet | 72 | 16.7% |
| Total | 431 | 100.0% |
De Smet Summary
De Smet, South Dakota is a small town located in Kingsbury County in the northeastern part of the state. It is situated on the shores of Lake Thompson, a natural lake that was created by the melting of a glacier during the last ice age. The town was founded in 1879 by a group of settlers led by the Reverend Edward P. Smith, who named it after his hometown of De Smet, Belgium.
The town of De Smet has a rich history that dates back to the early days of the American West. It was a popular stop for travelers on the Oregon Trail, and was the home of the Ingalls family, who were the subjects of the popular Little House on the Prairie books and television series. The town was also the site of the first post office in Kingsbury County, and the first school in the county was established here in 1883.
Geographically, De Smet is located in the rolling hills of the Great Plains, and is surrounded by prairie grasslands and wetlands. The town is situated on the shores of Lake Thompson, which is a popular destination for fishing, boating, and swimming. The lake is also home to a variety of wildlife, including bald eagles, ospreys, and white-tailed deer.
The economy of De Smet is largely based on agriculture, with the town being home to several large farms and ranches. The town is also home to a number of small businesses, including a grocery store, a hardware store, and a few restaurants. The town is also home to a number of churches, and is the site of the annual De Smet Days celebration, which is held each summer.
The population of De Smet was 1,072 in the 2010 census, making it one of the smallest towns in South Dakota. The town is predominantly white, with a small percentage of African Americans, Native Americans, and Hispanics. The median household income in De Smet is $41,250, and the median home value is $90,000.
De Smet is a small town with a rich history and a strong sense of community. It is a great place to live, work, and raise a family, and is a great example of the rural lifestyle that is so common in South Dakota.
Common Questions
What is Per Capita Income in De Smet?
Per Capita income in De Smet is $37,271.
What is the Median Family Income in De Smet?
Median Family Income in De Smet is $86,591.
What is the Median Household income in De Smet?
Median Household Income in De Smet is $57,656.
What is Income or Wage Gap in De Smet?
Income or Wage Gap in De Smet is 32.6%.
Women in De Smet earn 67.4 cents for every dollar earned by a man.
What is Inequality or Gini Index in De Smet?
Inequality or Gini Index in De Smet is 0.39.
What is the Total Population of De Smet?
Total Population of De Smet is 990.
What is the Total Male Population of De Smet?
Total Male Population of De Smet is 512.
What is the Total Female Population of De Smet?
Total Female Population of De Smet is 478.
What is the Ratio of Males per 100 Females in De Smet?
There are 107.11 Males per 100 Females in De Smet.
What is the Ratio of Females per 100 Males in De Smet?
There are 93.36 Females per 100 Males in De Smet.
What is the Median Population Age in De Smet?
Median Population Age in De Smet is 55.2 Years.
What is the Average Family Size in De Smet
Average Family Size in De Smet is 3.0 People.
What is the Average Household Size in De Smet
Average Household Size in De Smet is 2.2 People.
How Large is the Labor Force in De Smet?
There are 513 People in the Labor Forcein in De Smet.
What is the Percentage of People in the Labor Force in De Smet?
61.9% of People are in the Labor Force in De Smet.