Eagle Butte, SD Map & Demographics
Eagle Butte Map
Eagle Butte Overview
$16,462
PER CAPITA INCOME
$41,875
AVG FAMILY INCOME
$40,556
AVG HOUSEHOLD INCOME
7.2%
WAGE / INCOME GAP [ % ]
92.8¢/ $1
WAGE / INCOME GAP [ $ ]
0.46
INEQUALITY / GINI INDEX
1,396
TOTAL POPULATION
685
MALE POPULATION
711
FEMALE POPULATION
96.34
MALES / 100 FEMALES
103.80
FEMALES / 100 MALES
29.8
MEDIAN AGE
4.1
AVG FAMILY SIZE
3.5
AVG HOUSEHOLD SIZE
689
LABOR FORCE [ PEOPLE ]
70.5%
PERCENT IN LABOR FORCE
37.6%
UNEMPLOYMENT RATE
Eagle Butte Zip Codes
Eagle Butte Area Codes
Income in Eagle Butte
Income Overview in Eagle Butte
Per Capita Income in Eagle Butte is $16,462, while median incomes of families and households are $41,875 and $40,556 respectively.
| Characteristic | Number | Measure |
| Per Capita Income | 1,396 | $16,462 |
| Median Family Income | 281 | $41,875 |
| Mean Family Income | 281 | $55,956 |
| Median Household Income | 386 | $40,556 |
| Mean Household Income | 386 | $59,767 |
| Income Deficit | 281 | $0 |
| Wage / Income Gap (%) | 1,396 | 7.22% |
| Wage / Income Gap ($) | 1,396 | 92.78¢ per $1 |
| Gini / Inequality Index | 1,396 | 0.46 |
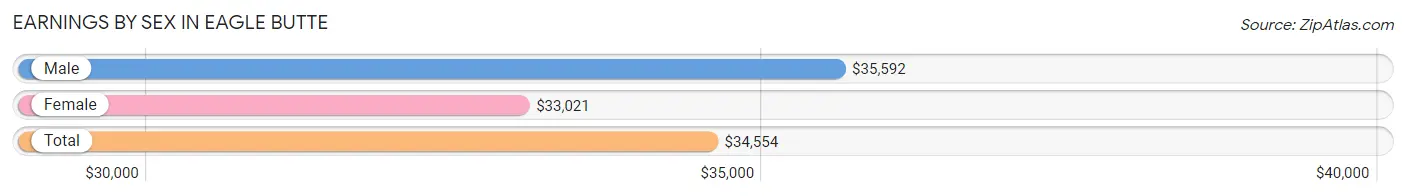
Earnings by Sex in Eagle Butte
Average Earnings in Eagle Butte are $34,554, $35,592 for men and $33,021 for women, a difference of 7.2%.
| Sex | Number | Average Earnings |
| Male | 225 (44.6%) | $35,592 |
| Female | 279 (55.4%) | $33,021 |
| Total | 504 (100.0%) | $34,554 |
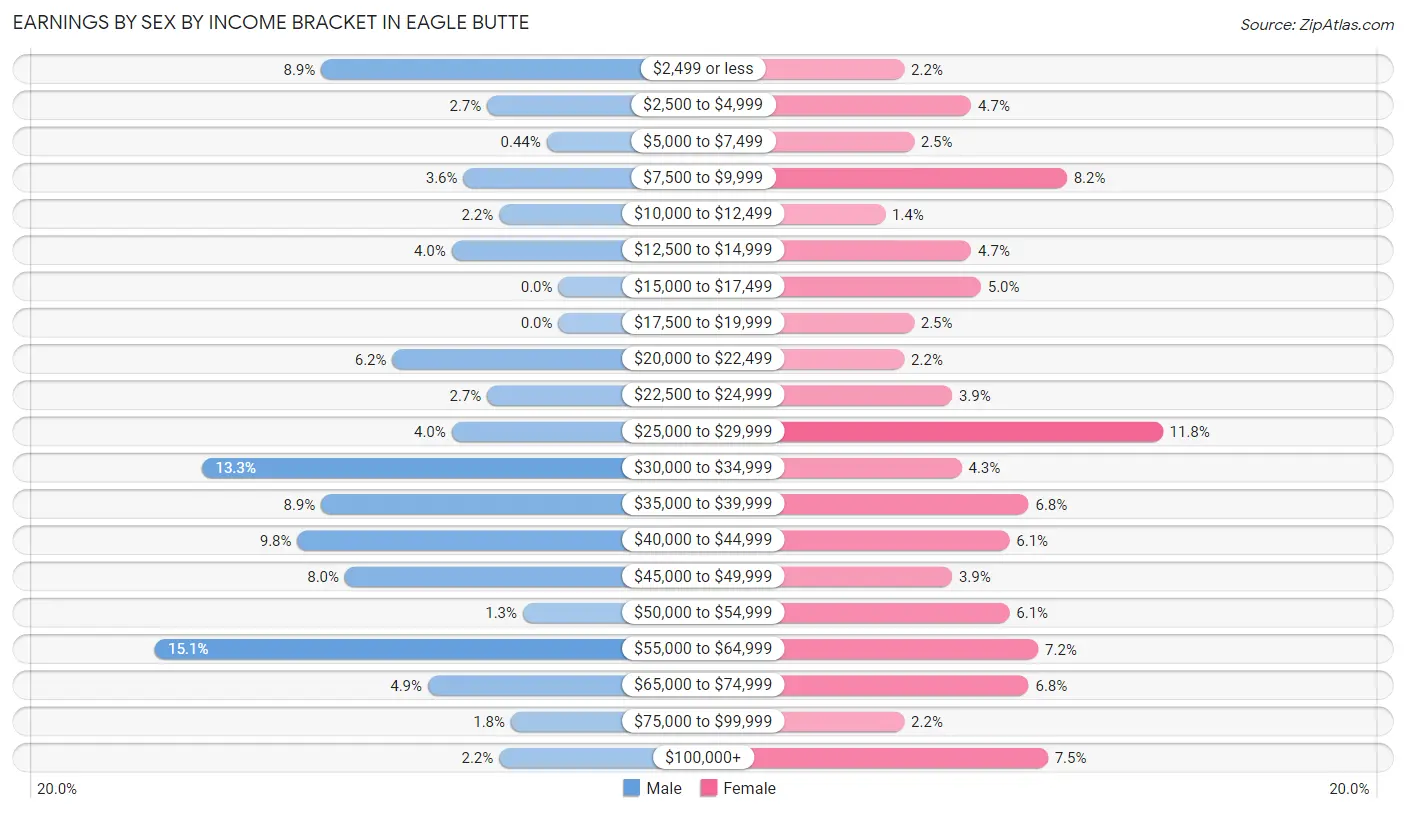
Earnings by Sex by Income Bracket in Eagle Butte
The most common earnings brackets in Eagle Butte are $55,000 to $64,999 for men (34 | 15.1%) and $25,000 to $29,999 for women (33 | 11.8%).
| Income | Male | Female |
| $2,499 or less | 20 (8.9%) | 6 (2.1%) |
| $2,500 to $4,999 | 6 (2.7%) | 13 (4.7%) |
| $5,000 to $7,499 | 1 (0.4%) | 7 (2.5%) |
| $7,500 to $9,999 | 8 (3.6%) | 23 (8.2%) |
| $10,000 to $12,499 | 5 (2.2%) | 4 (1.4%) |
| $12,500 to $14,999 | 9 (4.0%) | 13 (4.7%) |
| $15,000 to $17,499 | 0 (0.0%) | 14 (5.0%) |
| $17,500 to $19,999 | 0 (0.0%) | 7 (2.5%) |
| $20,000 to $22,499 | 14 (6.2%) | 6 (2.1%) |
| $22,500 to $24,999 | 6 (2.7%) | 11 (3.9%) |
| $25,000 to $29,999 | 9 (4.0%) | 33 (11.8%) |
| $30,000 to $34,999 | 30 (13.3%) | 12 (4.3%) |
| $35,000 to $39,999 | 20 (8.9%) | 19 (6.8%) |
| $40,000 to $44,999 | 22 (9.8%) | 17 (6.1%) |
| $45,000 to $49,999 | 18 (8.0%) | 11 (3.9%) |
| $50,000 to $54,999 | 3 (1.3%) | 17 (6.1%) |
| $55,000 to $64,999 | 34 (15.1%) | 20 (7.2%) |
| $65,000 to $74,999 | 11 (4.9%) | 19 (6.8%) |
| $75,000 to $99,999 | 4 (1.8%) | 6 (2.1%) |
| $100,000+ | 5 (2.2%) | 21 (7.5%) |
| Total | 225 (100.0%) | 279 (100.0%) |
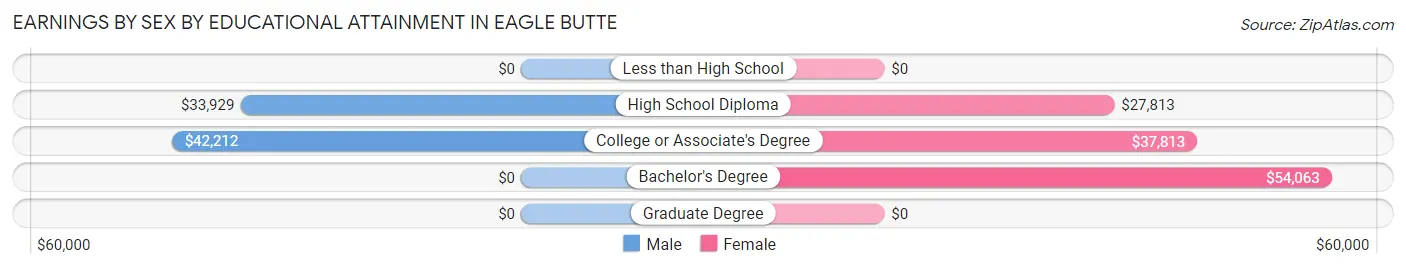
Earnings by Sex by Educational Attainment in Eagle Butte
Average earnings in Eagle Butte are $36,953 for men and $36,364 for women, a difference of 1.6%. Men with an educational attainment of college or associate's degree enjoy the highest average annual earnings of $42,212, while those with high school diploma education earn the least with $33,929. Women with an educational attainment of bachelor's degree earn the most with the average annual earnings of $54,063, while those with high school diploma education have the smallest earnings of $27,813.
| Educational Attainment | Male Income | Female Income |
| Less than High School | - | - |
| High School Diploma | $33,929 | $27,813 |
| College or Associate's Degree | $42,212 | $37,813 |
| Bachelor's Degree | - | - |
| Graduate Degree | - | - |
| Total | $36,953 | $36,364 |
Family Income in Eagle Butte
Family Income Brackets in Eagle Butte
According to the Eagle Butte family income data, there are 53 families falling into the $75,000 to $99,999 income range, which is the most common income bracket and makes up 18.9% of all families. Conversely, the $150,000 to $199,999 income bracket is the least frequent group with only 4 families (1.4%) belonging to this category.
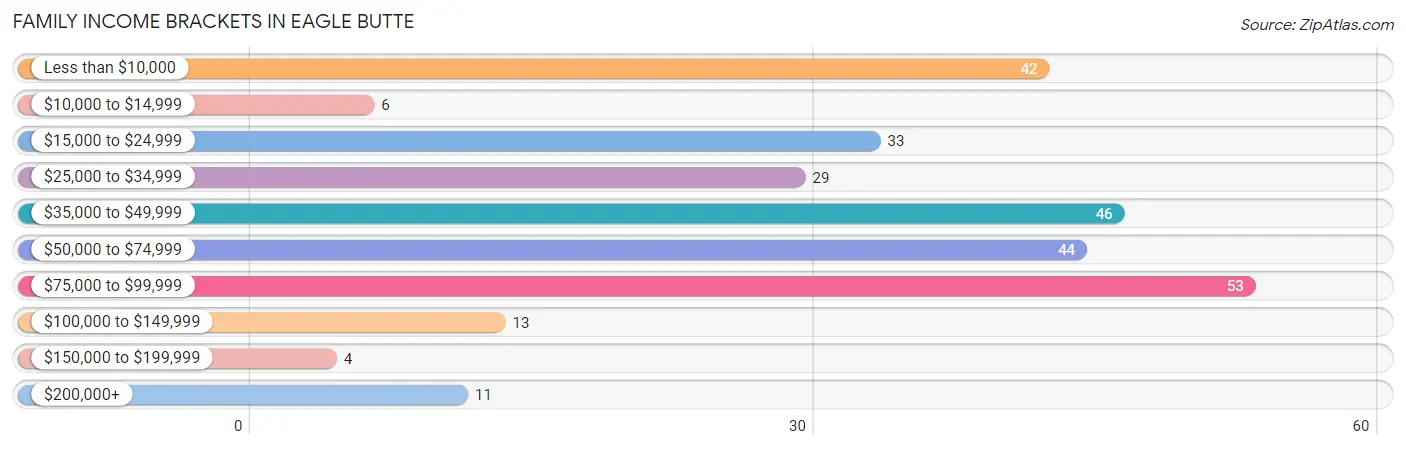
| Income Bracket | # Families | % Families |
| Less than $10,000 | 42 | 14.9% |
| $10,000 to $14,999 | 6 | 2.1% |
| $15,000 to $24,999 | 33 | 11.7% |
| $25,000 to $34,999 | 29 | 10.3% |
| $35,000 to $49,999 | 46 | 16.4% |
| $50,000 to $74,999 | 44 | 15.7% |
| $75,000 to $99,999 | 53 | 18.9% |
| $100,000 to $149,999 | 13 | 4.6% |
| $150,000 to $199,999 | 4 | 1.4% |
| $200,000+ | 11 | 3.9% |
Family Income by Famaliy Size in Eagle Butte
6-person families (11 | 3.9%) account for the highest median family income in Eagle Butte with $52,917 per family, while 2-person families (121 | 43.1%) have the highest median income of $19,532 per family member.
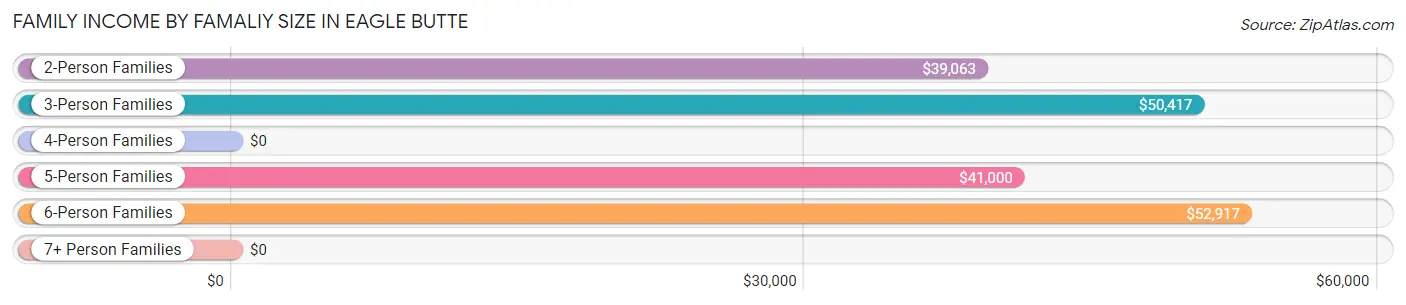
| Income Bracket | # Families | Median Income |
| 2-Person Families | 121 (43.1%) | $39,063 |
| 3-Person Families | 41 (14.6%) | $50,417 |
| 4-Person Families | 64 (22.8%) | $0 |
| 5-Person Families | 32 (11.4%) | $41,000 |
| 6-Person Families | 11 (3.9%) | $52,917 |
| 7+ Person Families | 12 (4.3%) | $0 |
| Total | 281 (100.0%) | $41,875 |
Family Income by Number of Earners in Eagle Butte
The median family income in Eagle Butte is $41,875, with families comprising 3+ earners (22) having the highest median family income of $176,250, while families with no earners (56) have the lowest median family income of $5,313, accounting for 7.8% and 19.9% of families, respectively.
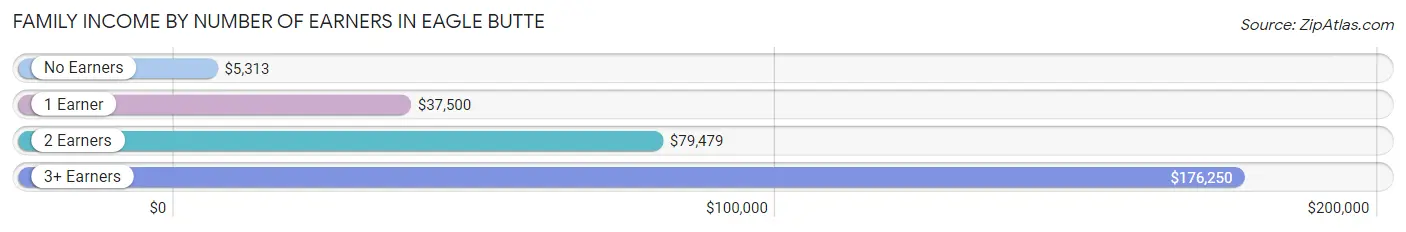
| Number of Earners | # Families | Median Income |
| No Earners | 56 (19.9%) | $5,313 |
| 1 Earner | 124 (44.1%) | $37,500 |
| 2 Earners | 79 (28.1%) | $79,479 |
| 3+ Earners | 22 (7.8%) | $176,250 |
| Total | 281 (100.0%) | $41,875 |
Household Income in Eagle Butte
Household Income Brackets in Eagle Butte
With 68 households falling in the category, the $50,000 to $74,999 income range is the most frequent in Eagle Butte, accounting for 17.6% of all households. In contrast, only 11 households (2.9%) fall into the $200,000+ income bracket, making it the least populous group.
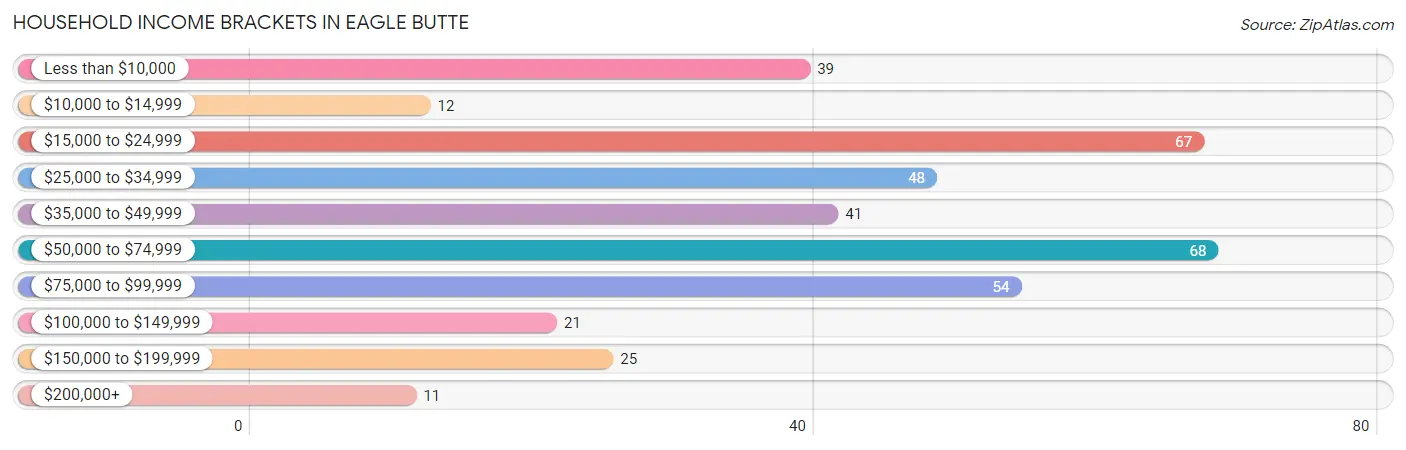
| Income Bracket | # Households | % Households |
| Less than $10,000 | 39 | 10.1% |
| $10,000 to $14,999 | 12 | 3.1% |
| $15,000 to $24,999 | 67 | 17.4% |
| $25,000 to $34,999 | 48 | 12.4% |
| $35,000 to $49,999 | 41 | 10.6% |
| $50,000 to $74,999 | 68 | 17.6% |
| $75,000 to $99,999 | 54 | 14.0% |
| $100,000 to $149,999 | 21 | 5.4% |
| $150,000 to $199,999 | 25 | 6.5% |
| $200,000+ | 11 | 2.8% |
Household Income by Householder Age in Eagle Butte
The median household income in Eagle Butte is $40,556, with the highest median household income of $50,833 found in the 45 to 64 years age bracket for the primary householder. A total of 158 households (40.9%) fall into this category. Meanwhile, the 65+ years age bracket for the primary householder has the lowest median household income of $33,816, with 58 households (15.0%) in this group.
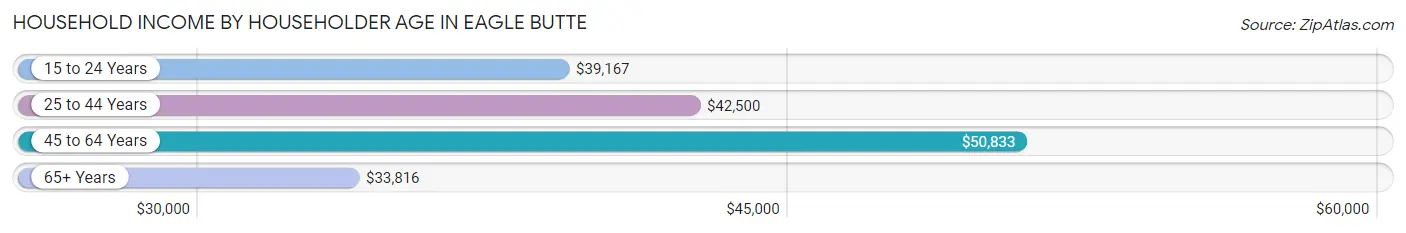
| Income Bracket | # Households | Median Income |
| 15 to 24 Years | 22 (5.7%) | $39,167 |
| 25 to 44 Years | 148 (38.3%) | $42,500 |
| 45 to 64 Years | 158 (40.9%) | $50,833 |
| 65+ Years | 58 (15.0%) | $33,816 |
| Total | 386 (100.0%) | $40,556 |
Poverty in Eagle Butte
Income Below Poverty by Sex and Age in Eagle Butte
With 44.6% poverty level for males and 31.1% for females among the residents of Eagle Butte, 5 year old males and 5 year old females are the most vulnerable to poverty, with 12 males (85.7%) and 3 females (100.0%) in their respective age groups living below the poverty level.
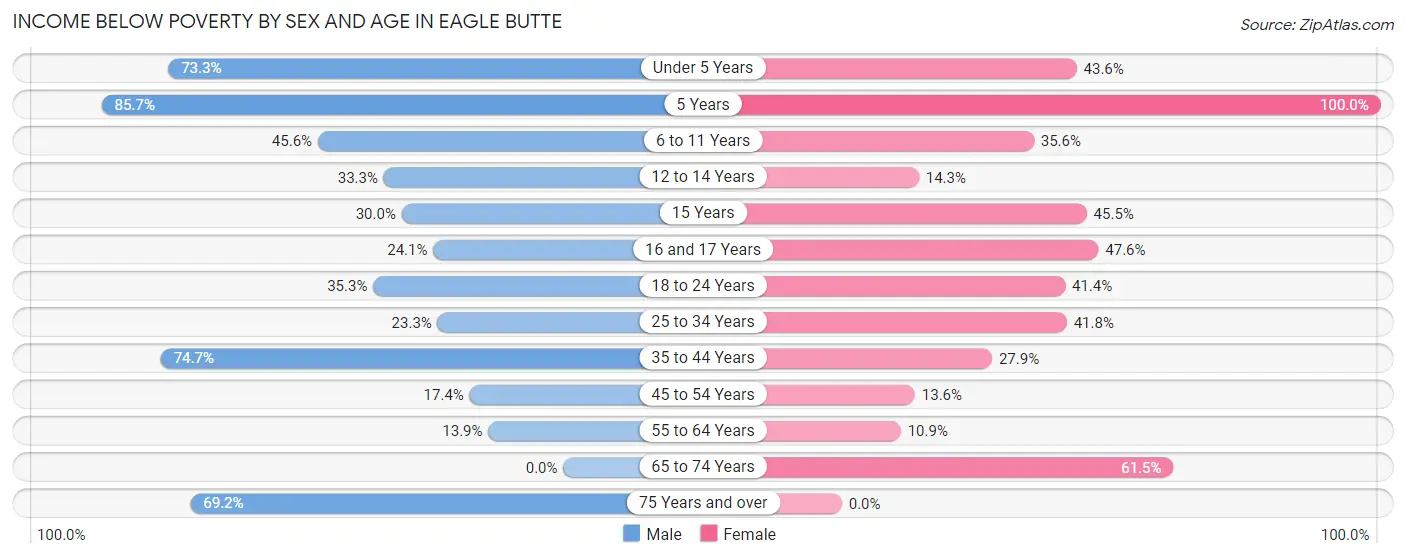
| Age Bracket | Male | Female |
| Under 5 Years | 22 (73.3%) | 34 (43.6%) |
| 5 Years | 12 (85.7%) | 3 (100.0%) |
| 6 to 11 Years | 41 (45.6%) | 31 (35.6%) |
| 12 to 14 Years | 10 (33.3%) | 6 (14.3%) |
| 15 Years | 3 (30.0%) | 10 (45.5%) |
| 16 and 17 Years | 7 (24.1%) | 10 (47.6%) |
| 18 to 24 Years | 18 (35.3%) | 29 (41.4%) |
| 25 to 34 Years | 21 (23.3%) | 43 (41.7%) |
| 35 to 44 Years | 136 (74.7%) | 29 (27.9%) |
| 45 to 54 Years | 4 (17.4%) | 8 (13.6%) |
| 55 to 64 Years | 11 (13.9%) | 7 (10.9%) |
| 65 to 74 Years | 0 (0.0%) | 8 (61.5%) |
| 75 Years and over | 9 (69.2%) | 0 (0.0%) |
| Total | 294 (44.6%) | 218 (31.1%) |
Income Above Poverty by Sex and Age in Eagle Butte
According to the poverty statistics in Eagle Butte, males aged 65 to 74 years and females aged 75 years and over are the age groups that are most secure financially, with 100.0% of males and 100.0% of females in these age groups living above the poverty line.
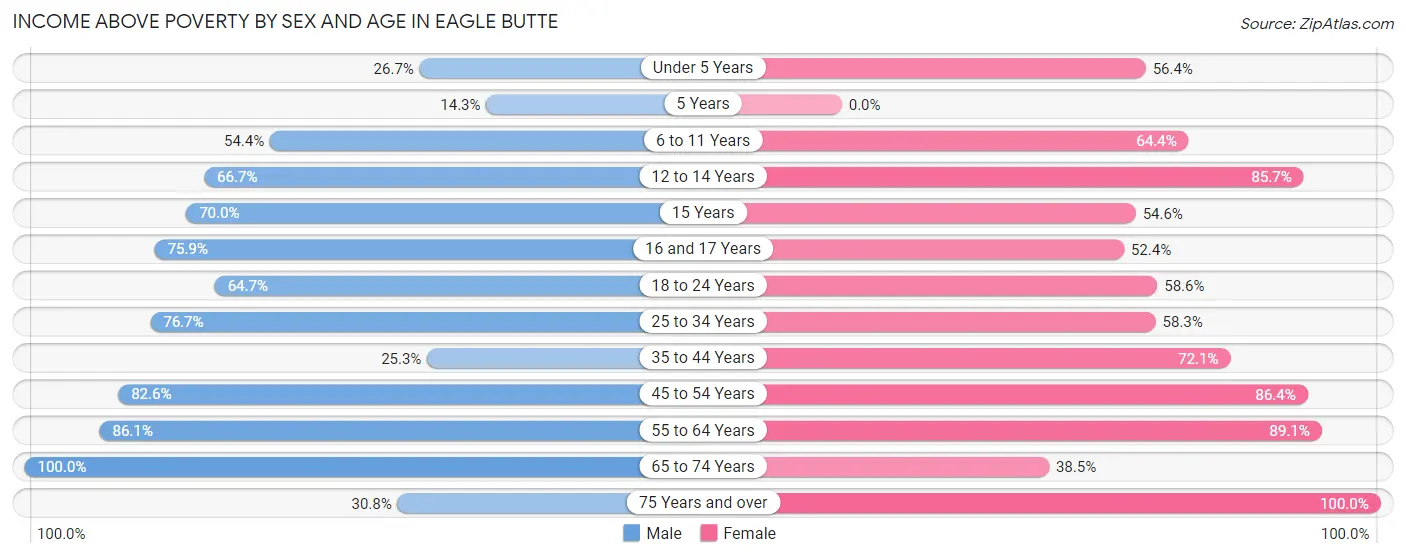
| Age Bracket | Male | Female |
| Under 5 Years | 8 (26.7%) | 44 (56.4%) |
| 5 Years | 2 (14.3%) | 0 (0.0%) |
| 6 to 11 Years | 49 (54.4%) | 56 (64.4%) |
| 12 to 14 Years | 20 (66.7%) | 36 (85.7%) |
| 15 Years | 7 (70.0%) | 12 (54.5%) |
| 16 and 17 Years | 22 (75.9%) | 11 (52.4%) |
| 18 to 24 Years | 33 (64.7%) | 41 (58.6%) |
| 25 to 34 Years | 69 (76.7%) | 60 (58.3%) |
| 35 to 44 Years | 46 (25.3%) | 75 (72.1%) |
| 45 to 54 Years | 19 (82.6%) | 51 (86.4%) |
| 55 to 64 Years | 68 (86.1%) | 57 (89.1%) |
| 65 to 74 Years | 18 (100.0%) | 5 (38.5%) |
| 75 Years and over | 4 (30.8%) | 35 (100.0%) |
| Total | 365 (55.4%) | 483 (68.9%) |
Income Below Poverty Among Married-Couple Families in Eagle Butte
The poverty statistics for married-couple families in Eagle Butte show that 5.9% or 5 of the total 84 families live below the poverty line. Families with 3 or 4 children have the highest poverty rate of 26.7%, comprising of 4 families. On the other hand, families with no children have the lowest poverty rate of 0.0%, which includes 0 families.
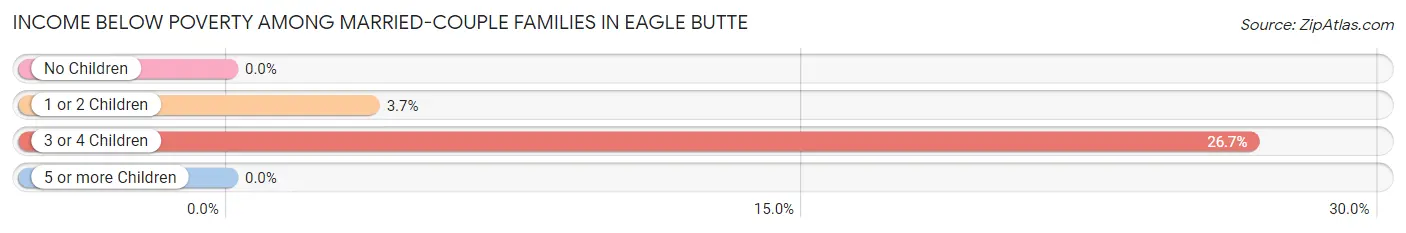
| Children | Above Poverty | Below Poverty |
| No Children | 42 (100.0%) | 0 (0.0%) |
| 1 or 2 Children | 26 (96.3%) | 1 (3.7%) |
| 3 or 4 Children | 11 (73.3%) | 4 (26.7%) |
| 5 or more Children | 0 (0.0%) | 0 (0.0%) |
| Total | 79 (94.1%) | 5 (5.9%) |
Income Below Poverty Among Single-Parent Households in Eagle Butte
According to the poverty data in Eagle Butte, 25.8% or 17 single-father households and 42.0% or 55 single-mother households are living below the poverty line. Among single-father households, those with 1 or 2 children have the highest poverty rate, with 9 households (32.1%) experiencing poverty. Likewise, among single-mother households, those with 5 or more children have the highest poverty rate, with 3 households (100.0%) falling below the poverty line.
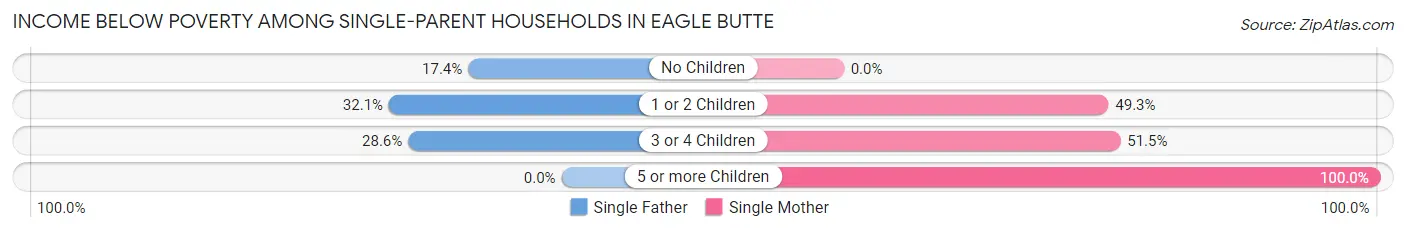
| Children | Single Father | Single Mother |
| No Children | 4 (17.4%) | 0 (0.0%) |
| 1 or 2 Children | 9 (32.1%) | 35 (49.3%) |
| 3 or 4 Children | 4 (28.6%) | 17 (51.5%) |
| 5 or more Children | 0 (0.0%) | 3 (100.0%) |
| Total | 17 (25.8%) | 55 (42.0%) |
Income Below Poverty Among Married-Couple vs Single-Parent Households in Eagle Butte
The poverty data for Eagle Butte shows that 5 of the married-couple family households (5.9%) and 72 of the single-parent households (36.5%) are living below the poverty level. Within the married-couple family households, those with 3 or 4 children have the highest poverty rate, with 4 households (26.7%) falling below the poverty line. Among the single-parent households, those with 5 or more children have the highest poverty rate, with 3 household (75.0%) living below poverty.
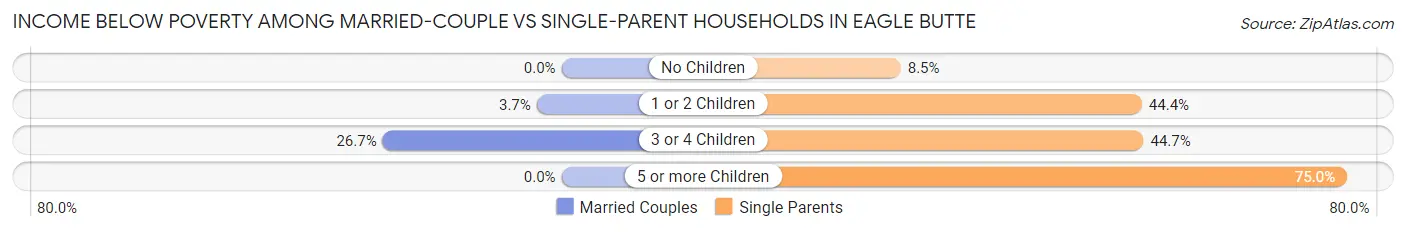
| Children | Married-Couple Families | Single-Parent Households |
| No Children | 0 (0.0%) | 4 (8.5%) |
| 1 or 2 Children | 1 (3.7%) | 44 (44.4%) |
| 3 or 4 Children | 4 (26.7%) | 21 (44.7%) |
| 5 or more Children | 0 (0.0%) | 3 (75.0%) |
| Total | 5 (5.9%) | 72 (36.5%) |
Race in Eagle Butte
The most populous races in Eagle Butte are Native / Alaskan (1,112 | 79.7%), Two or more Races (182 | 13.0%), and Hispanic or Latino (153 | 11.0%).
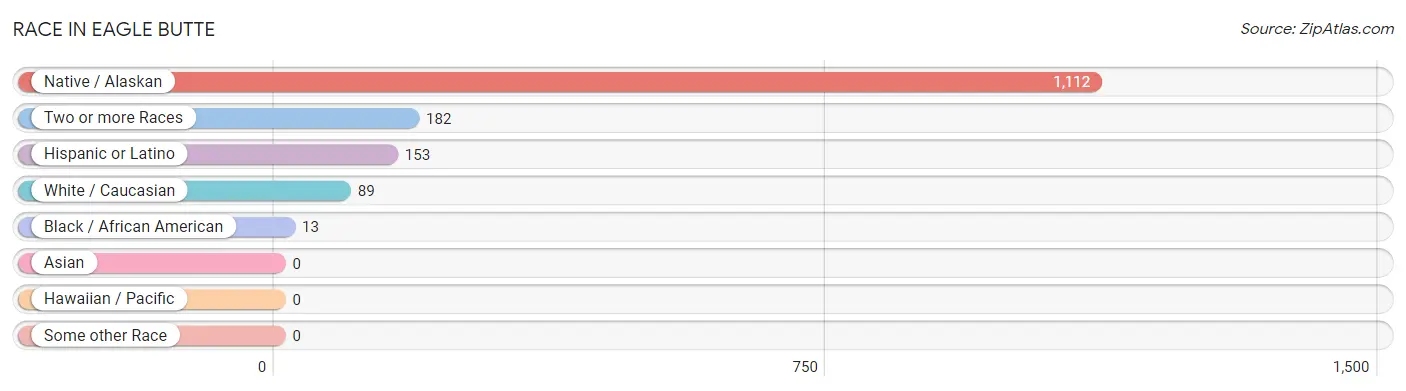
| Race | # Population | % Population |
| Asian | 0 | 0.0% |
| Black / African American | 13 | 0.9% |
| Hawaiian / Pacific | 0 | 0.0% |
| Hispanic or Latino | 153 | 11.0% |
| Native / Alaskan | 1,112 | 79.7% |
| White / Caucasian | 89 | 6.4% |
| Two or more Races | 182 | 13.0% |
| Some other Race | 0 | 0.0% |
| Total | 1,396 | 100.0% |
Ancestry in Eagle Butte
The most populous ancestries reported in Eagle Butte are Sioux (1,197 | 85.7%), Mexican (145 | 10.4%), German (41 | 2.9%), American (27 | 1.9%), and Irish (10 | 0.7%), together accounting for 101.7% of all Eagle Butte residents.
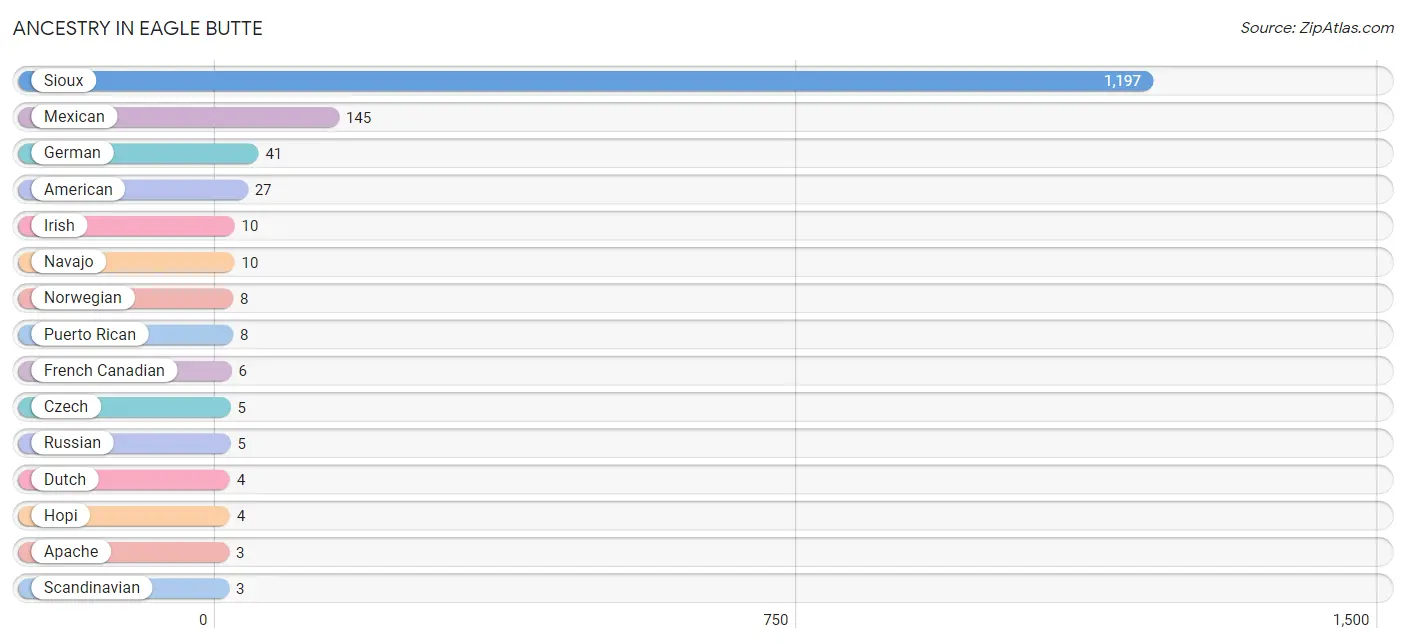
| Ancestry | # Population | % Population |
| American | 27 | 1.9% |
| Apache | 3 | 0.2% |
| Austrian | 1 | 0.1% |
| Czech | 5 | 0.4% |
| Dutch | 4 | 0.3% |
| French Canadian | 6 | 0.4% |
| German | 41 | 2.9% |
| Hopi | 4 | 0.3% |
| Irish | 10 | 0.7% |
| Mexican | 145 | 10.4% |
| Navajo | 10 | 0.7% |
| Norwegian | 8 | 0.6% |
| Puerto Rican | 8 | 0.6% |
| Russian | 5 | 0.4% |
| Scandinavian | 3 | 0.2% |
| Scotch-Irish | 1 | 0.1% |
| Sioux | 1,197 | 85.7% | View All 17 Rows |
Immigrants in Eagle Butte

| Immigration Origin | # Population | % Population | View All 0 Rows |
Sex and Age in Eagle Butte
Sex and Age in Eagle Butte
The most populous age groups in Eagle Butte are 35 to 39 Years (139 | 20.3%) for men and Under 5 Years (78 | 11.0%) for women.
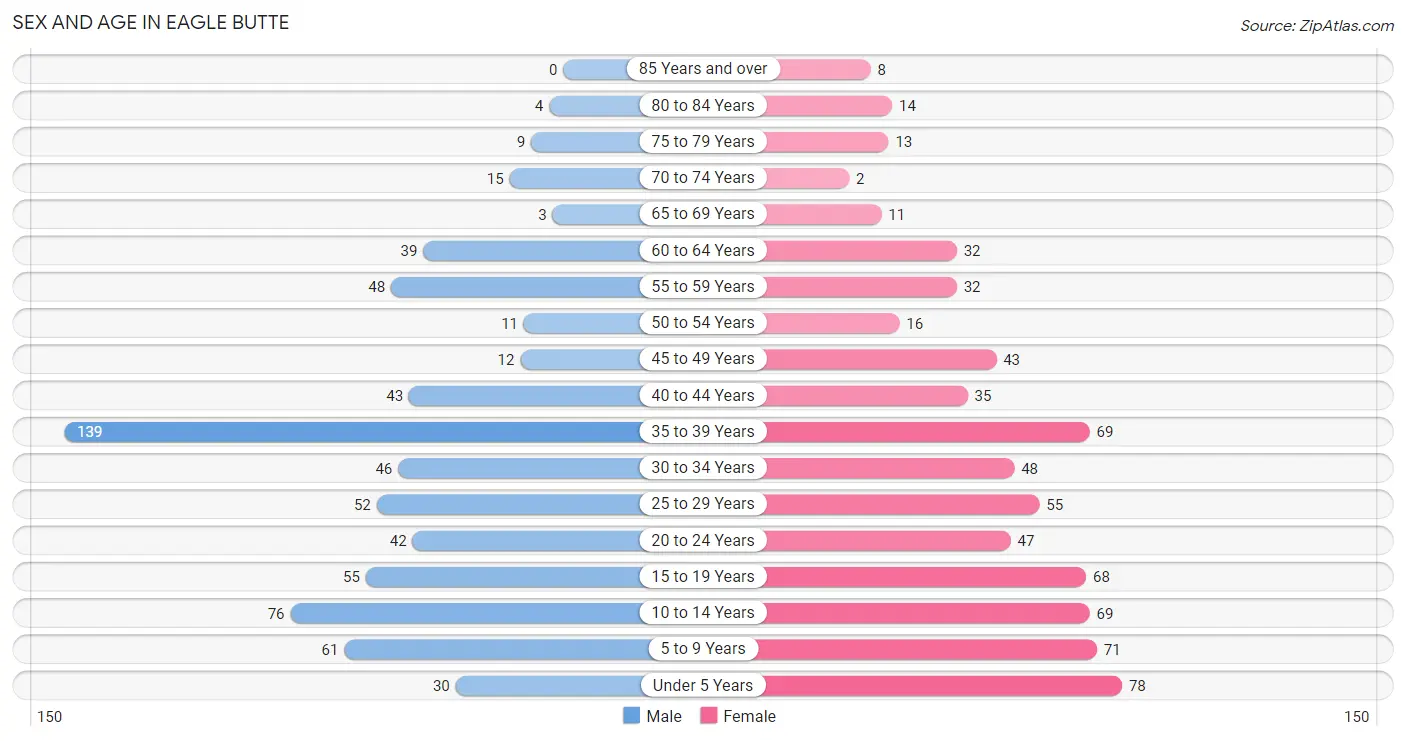
| Age Bracket | Male | Female |
| Under 5 Years | 30 (4.4%) | 78 (11.0%) |
| 5 to 9 Years | 61 (8.9%) | 71 (10.0%) |
| 10 to 14 Years | 76 (11.1%) | 69 (9.7%) |
| 15 to 19 Years | 55 (8.0%) | 68 (9.6%) |
| 20 to 24 Years | 42 (6.1%) | 47 (6.6%) |
| 25 to 29 Years | 52 (7.6%) | 55 (7.7%) |
| 30 to 34 Years | 46 (6.7%) | 48 (6.8%) |
| 35 to 39 Years | 139 (20.3%) | 69 (9.7%) |
| 40 to 44 Years | 43 (6.3%) | 35 (4.9%) |
| 45 to 49 Years | 12 (1.8%) | 43 (6.0%) |
| 50 to 54 Years | 11 (1.6%) | 16 (2.2%) |
| 55 to 59 Years | 48 (7.0%) | 32 (4.5%) |
| 60 to 64 Years | 39 (5.7%) | 32 (4.5%) |
| 65 to 69 Years | 3 (0.4%) | 11 (1.5%) |
| 70 to 74 Years | 15 (2.2%) | 2 (0.3%) |
| 75 to 79 Years | 9 (1.3%) | 13 (1.8%) |
| 80 to 84 Years | 4 (0.6%) | 14 (2.0%) |
| 85 Years and over | 0 (0.0%) | 8 (1.1%) |
| Total | 685 (100.0%) | 711 (100.0%) |
Families and Households in Eagle Butte
Median Family Size in Eagle Butte
The median family size in Eagle Butte is 4.06 persons per family, with single male/father families (66 | 23.5%) accounting for the largest median family size of 4.95 persons per family. On the other hand, single female/mother families (131 | 46.6%) represent the smallest median family size with 3.58 persons per family.
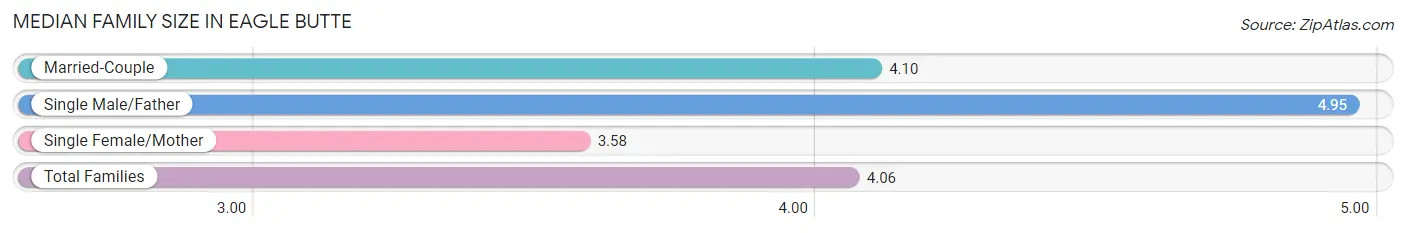
| Family Type | # Families | Family Size |
| Married-Couple | 84 (29.9%) | 4.10 |
| Single Male/Father | 66 (23.5%) | 4.95 |
| Single Female/Mother | 131 (46.6%) | 3.58 |
| Total Families | 281 (100.0%) | 4.06 |
Median Household Size in Eagle Butte
The median household size in Eagle Butte is 3.54 persons per household, with single male/father households (66 | 17.1%) accounting for the largest median household size of 5.39 persons per household. non-family households (105 | 27.2%) represent the smallest median household size with 1.37 persons per household.
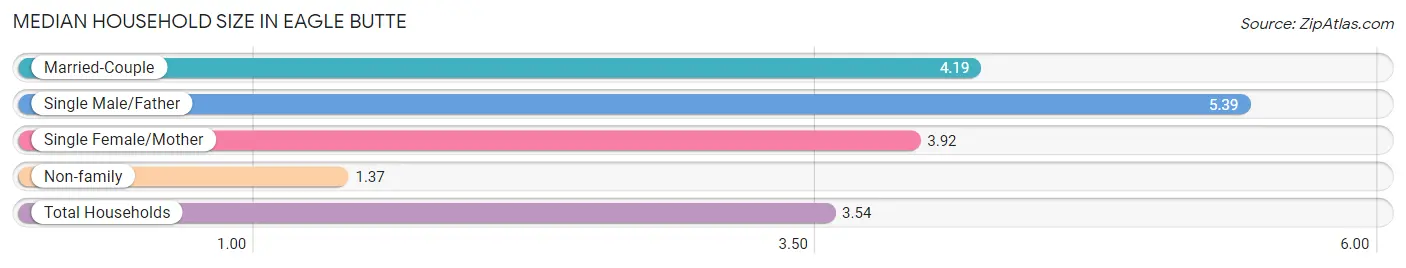
| Household Type | # Households | Household Size |
| Married-Couple | 84 (21.8%) | 4.19 |
| Single Male/Father | 66 (17.1%) | 5.39 |
| Single Female/Mother | 131 (33.9%) | 3.92 |
| Non-family | 105 (27.2%) | 1.37 |
| Total Households | 386 (100.0%) | 3.54 |
Household Size by Marriage Status in Eagle Butte
Out of a total of 386 households in Eagle Butte, 281 (72.8%) are family households, while 105 (27.2%) are nonfamily households. The most numerous type of family households are 2-person households, comprising 113, and the most common type of nonfamily households are 1-person households, comprising 66.
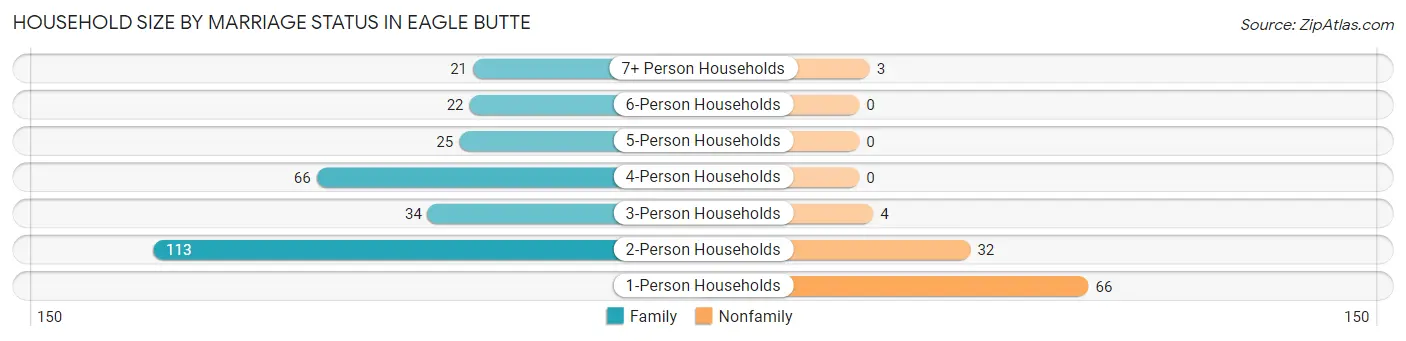
| Household Size | Family Households | Nonfamily Households |
| 1-Person Households | - | 66 (17.1%) |
| 2-Person Households | 113 (29.3%) | 32 (8.3%) |
| 3-Person Households | 34 (8.8%) | 4 (1.0%) |
| 4-Person Households | 66 (17.1%) | 0 (0.0%) |
| 5-Person Households | 25 (6.5%) | 0 (0.0%) |
| 6-Person Households | 22 (5.7%) | 0 (0.0%) |
| 7+ Person Households | 21 (5.4%) | 3 (0.8%) |
| Total | 281 (72.8%) | 105 (27.2%) |
Female Fertility in Eagle Butte
Fertility by Age in Eagle Butte
Average fertility rate in Eagle Butte is 46.0 births per 1,000 women. Women in the age bracket of 20 to 34 years have the highest fertility rate with 87.0 births per 1,000 women. Women in the age bracket of 20 to 34 years acount for 76.5% of all women with births.
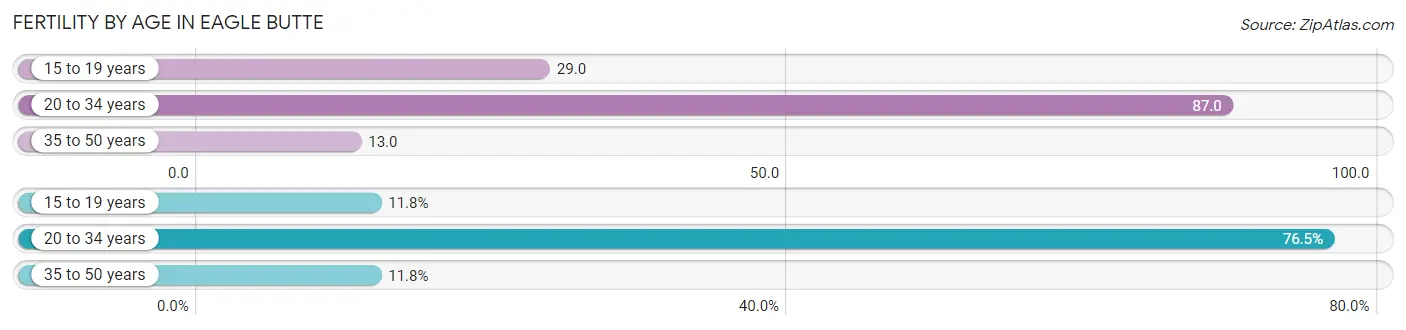
| Age Bracket | Women with Births | Births / 1,000 Women |
| 15 to 19 years | 2 (11.8%) | 29.0 |
| 20 to 34 years | 13 (76.5%) | 87.0 |
| 35 to 50 years | 2 (11.8%) | 13.0 |
| Total | 17 (100.0%) | 46.0 |
Fertility by Age by Marriage Status in Eagle Butte
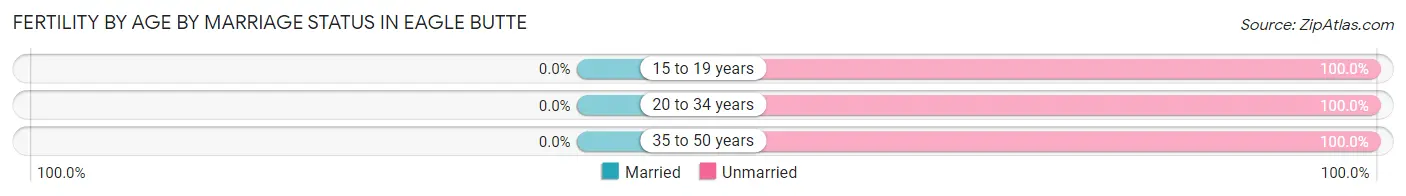
| Age Bracket | Married | Unmarried |
| 15 to 19 years | 0 (0.0%) | 2 (100.0%) |
| 20 to 34 years | 0 (0.0%) | 13 (100.0%) |
| 35 to 50 years | 0 (0.0%) | 2 (100.0%) |
| Total | 0 (0.0%) | 17 (100.0%) |
Fertility by Education in Eagle Butte
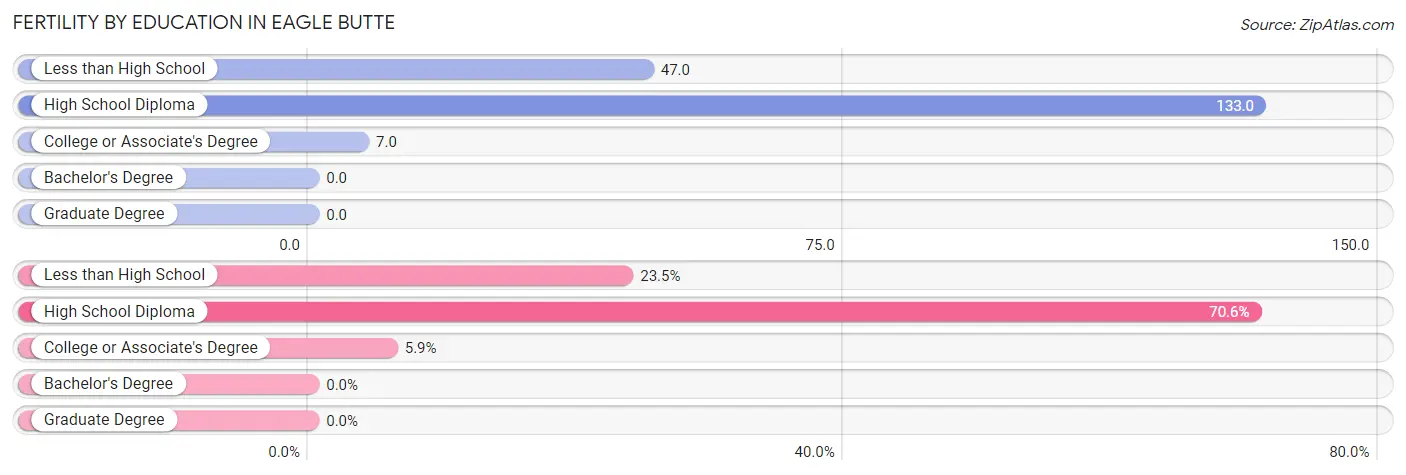
| Educational Attainment | Women with Births | Births / 1,000 Women |
| Less than High School | 4 (23.5%) | 47.0 |
| High School Diploma | 12 (70.6%) | 133.0 |
| College or Associate's Degree | 1 (5.9%) | 7.0 |
| Bachelor's Degree | 0 (0.0%) | 0.0 |
| Graduate Degree | 0 (0.0%) | 0.0 |
| Total | 17 (100.0%) | 46.0 |
Fertility by Education by Marriage Status in Eagle Butte
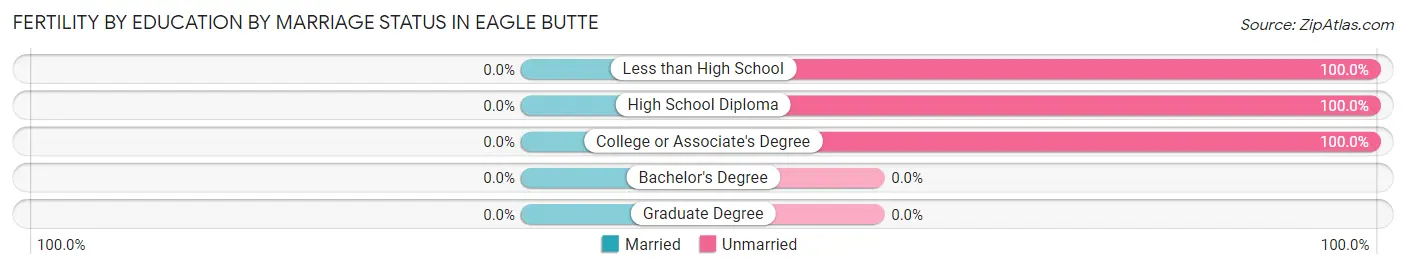
| Educational Attainment | Married | Unmarried |
| Less than High School | 0 (0.0%) | 4 (100.0%) |
| High School Diploma | 0 (0.0%) | 12 (100.0%) |
| College or Associate's Degree | 0 (0.0%) | 1 (100.0%) |
| Bachelor's Degree | 0 (0.0%) | 0 (0.0%) |
| Graduate Degree | 0 (0.0%) | 0 (0.0%) |
| Total | 0 (0.0%) | 17 (100.0%) |
Employment Characteristics in Eagle Butte
Employment by Class of Employer in Eagle Butte
Among the 424 employed individuals in Eagle Butte, local government employees (164 | 38.7%), federal government employees (96 | 22.6%), and private company employees (88 | 20.7%) make up the most common classes of employment.
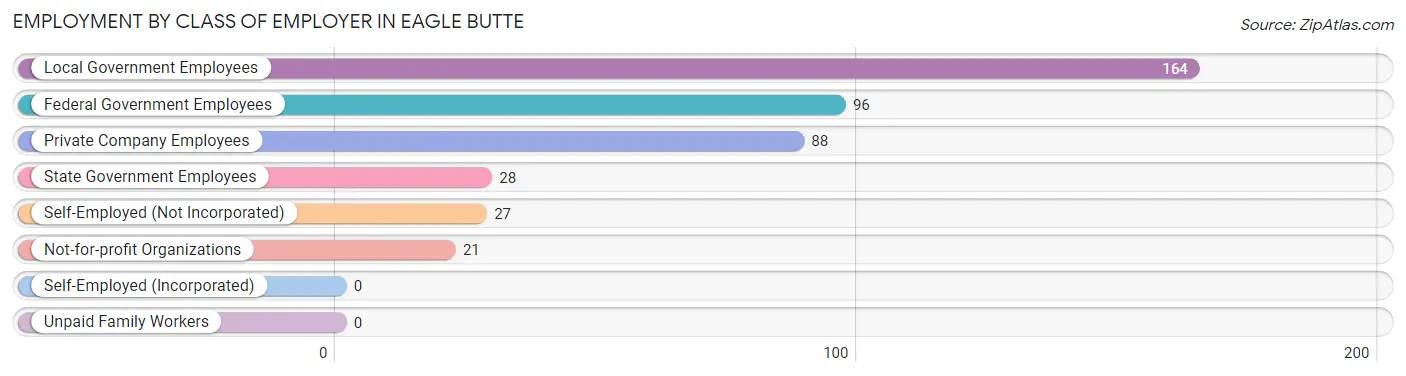
| Employer Class | # Employees | % Employees |
| Private Company Employees | 88 | 20.7% |
| Self-Employed (Incorporated) | 0 | 0.0% |
| Self-Employed (Not Incorporated) | 27 | 6.4% |
| Not-for-profit Organizations | 21 | 5.0% |
| Local Government Employees | 164 | 38.7% |
| State Government Employees | 28 | 6.6% |
| Federal Government Employees | 96 | 22.6% |
| Unpaid Family Workers | 0 | 0.0% |
| Total | 424 | 100.0% |
Employment Status by Age in Eagle Butte
According to the labor force statistics for Eagle Butte, out of the total population over 16 years of age (977), 70.5% or 689 individuals are in the labor force, with 37.6% or 259 of them unemployed. The age group with the highest labor force participation rate is 45 to 54 years, with 90.2% or 74 individuals in the labor force. Within the labor force, the 35 to 44 years age range has the highest percentage of unemployed individuals, with 61.8% or 152 of them being unemployed.
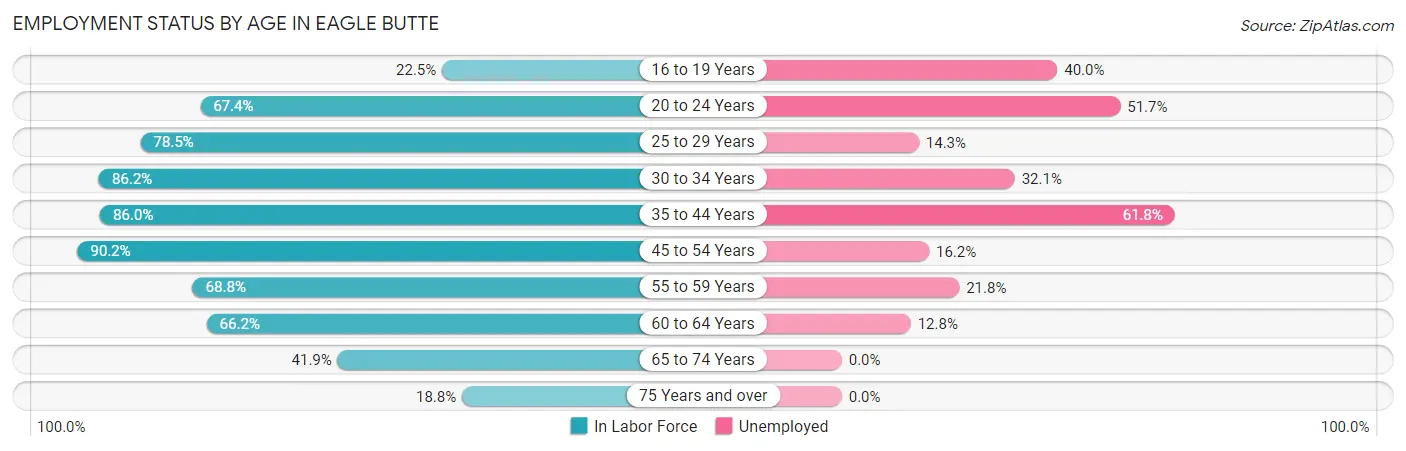
| Age Bracket | In Labor Force | Unemployed |
| 16 to 19 Years | 20 (22.5%) | 8 (40.0%) |
| 20 to 24 Years | 60 (67.4%) | 31 (51.7%) |
| 25 to 29 Years | 84 (78.5%) | 12 (14.3%) |
| 30 to 34 Years | 81 (86.2%) | 26 (32.1%) |
| 35 to 44 Years | 246 (86.0%) | 152 (61.8%) |
| 45 to 54 Years | 74 (90.2%) | 12 (16.2%) |
| 55 to 59 Years | 55 (68.8%) | 12 (21.8%) |
| 60 to 64 Years | 47 (66.2%) | 6 (12.8%) |
| 65 to 74 Years | 13 (41.9%) | 0 (0.0%) |
| 75 Years and over | 9 (18.8%) | 0 (0.0%) |
| Total | 689 (70.5%) | 259 (37.6%) |
Employment Status by Educational Attainment in Eagle Butte
According to labor force statistics for Eagle Butte, 81.5% of individuals (587) out of the total population between 25 and 64 years of age (720) are in the labor force, with 37.5% or 220 of them being unemployed. The group with the highest labor force participation rate are those with the educational attainment of bachelor's degree or higher, with 94.3% or 83 individuals in the labor force. Within the labor force, individuals with less than high school education have the highest percentage of unemployment, with 87.5% or 14 of them being unemployed.
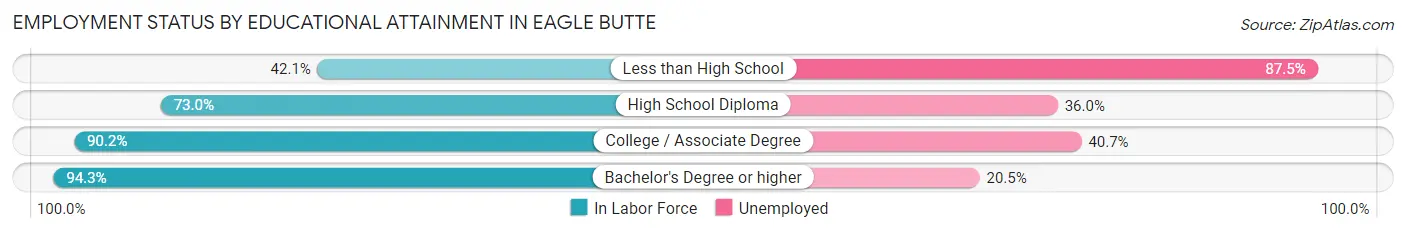
| Educational Attainment | In Labor Force | Unemployed |
| Less than High School | 16 (42.1%) | 33 (87.5%) |
| High School Diploma | 203 (73.0%) | 100 (36.0%) |
| College / Associate Degree | 285 (90.2%) | 129 (40.7%) |
| Bachelor's Degree or higher | 83 (94.3%) | 18 (20.5%) |
| Total | 587 (81.5%) | 270 (37.5%) |
Employment Occupations by Sex in Eagle Butte
Management, Business, Science and Arts Occupations
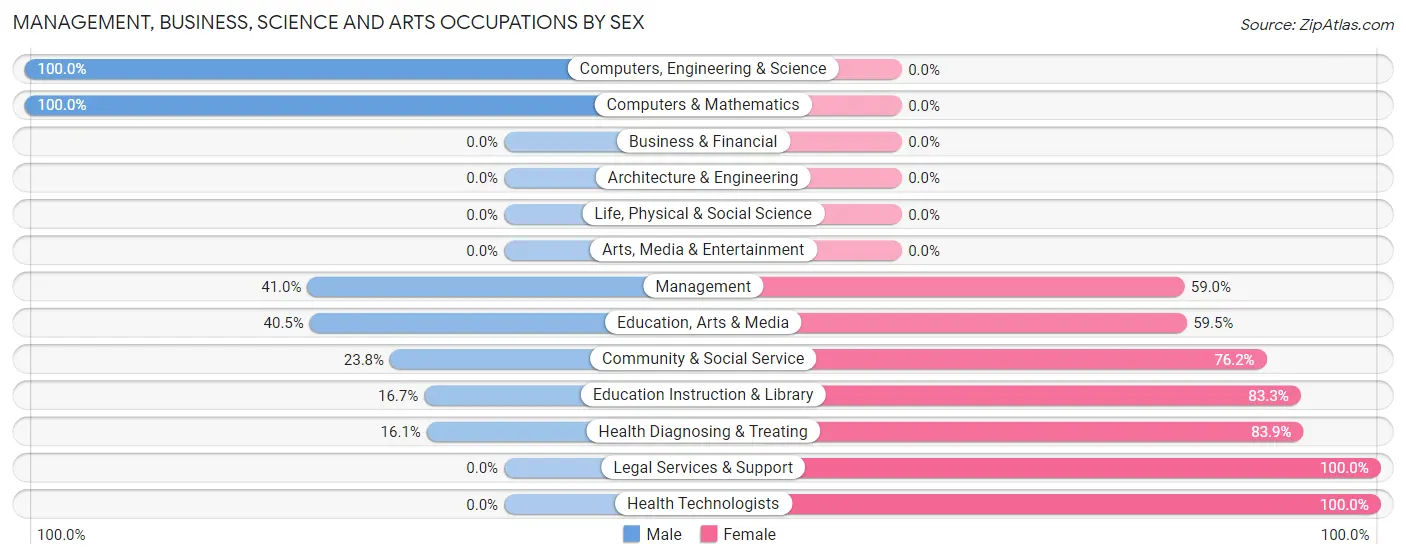
The most common Management, Business, Science and Arts occupations in Eagle Butte are Community & Social Service (105 | 24.4%), Education Instruction & Library (60 | 14.0%), Management (39 | 9.1%), Education, Arts & Media (37 | 8.6%), and Health Diagnosing & Treating (31 | 7.2%).
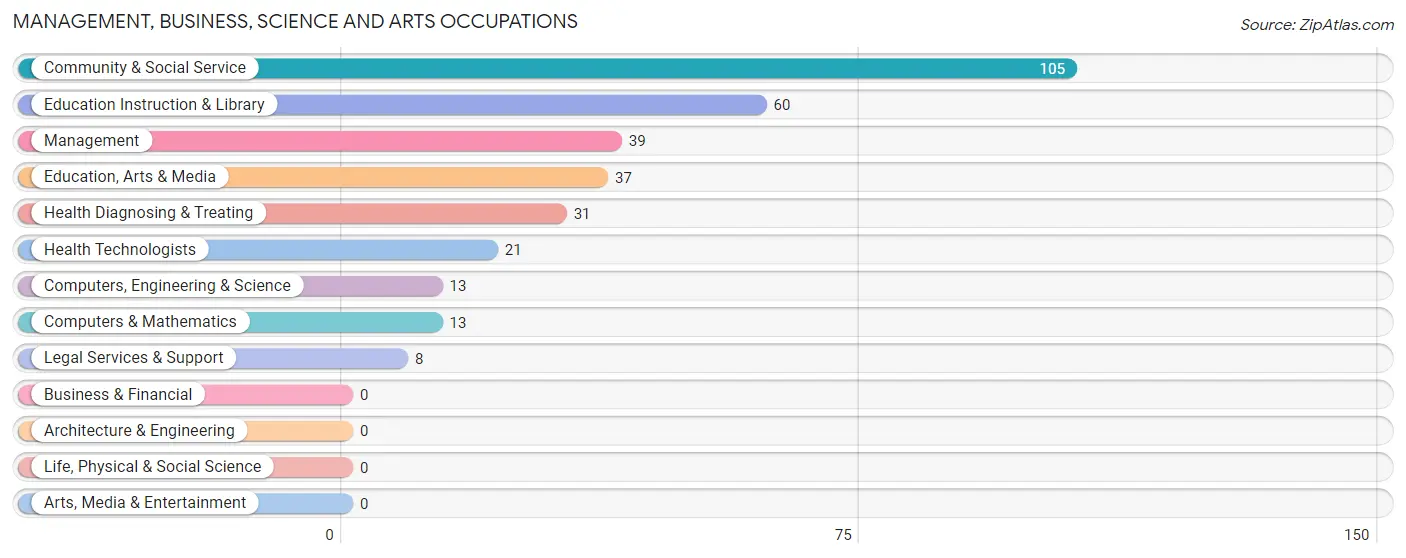
Management, Business, Science and Arts Occupations by Sex
Within the Management, Business, Science and Arts occupations in Eagle Butte, the most male-oriented occupations are Computers, Engineering & Science (100.0%), Computers & Mathematics (100.0%), and Management (41.0%), while the most female-oriented occupations are Legal Services & Support (100.0%), Health Technologists (100.0%), and Health Diagnosing & Treating (83.9%).
| Occupation | Male | Female |
| Management | 16 (41.0%) | 23 (59.0%) |
| Business & Financial | 0 (0.0%) | 0 (0.0%) |
| Computers, Engineering & Science | 13 (100.0%) | 0 (0.0%) |
| Computers & Mathematics | 13 (100.0%) | 0 (0.0%) |
| Architecture & Engineering | 0 (0.0%) | 0 (0.0%) |
| Life, Physical & Social Science | 0 (0.0%) | 0 (0.0%) |
| Community & Social Service | 25 (23.8%) | 80 (76.2%) |
| Education, Arts & Media | 15 (40.5%) | 22 (59.5%) |
| Legal Services & Support | 0 (0.0%) | 8 (100.0%) |
| Education Instruction & Library | 10 (16.7%) | 50 (83.3%) |
| Arts, Media & Entertainment | 0 (0.0%) | 0 (0.0%) |
| Health Diagnosing & Treating | 5 (16.1%) | 26 (83.9%) |
| Health Technologists | 0 (0.0%) | 21 (100.0%) |
| Total (Category) | 59 (31.4%) | 129 (68.6%) |
| Total (Overall) | 188 (43.7%) | 242 (56.3%) |
Services Occupations
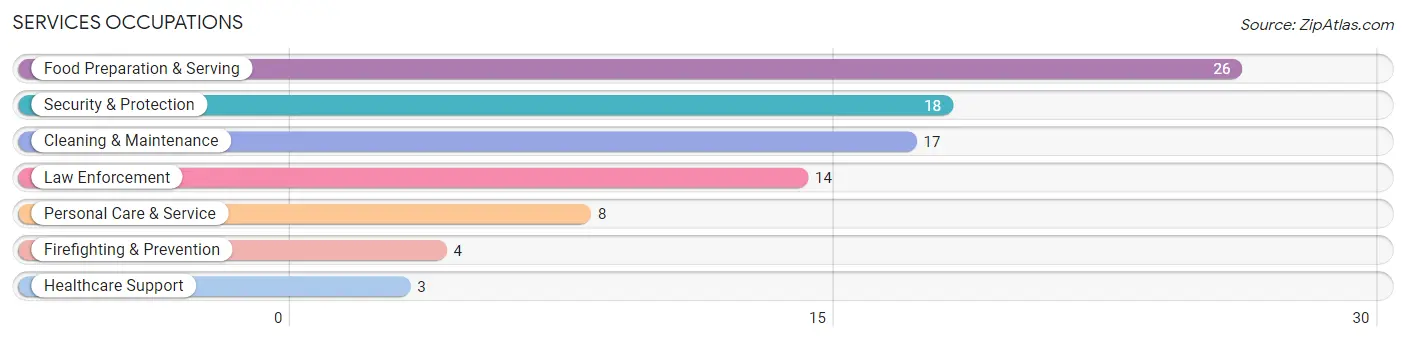
The most common Services occupations in Eagle Butte are Food Preparation & Serving (26 | 6.0%), Security & Protection (18 | 4.2%), Cleaning & Maintenance (17 | 4.0%), Law Enforcement (14 | 3.3%), and Personal Care & Service (8 | 1.9%).
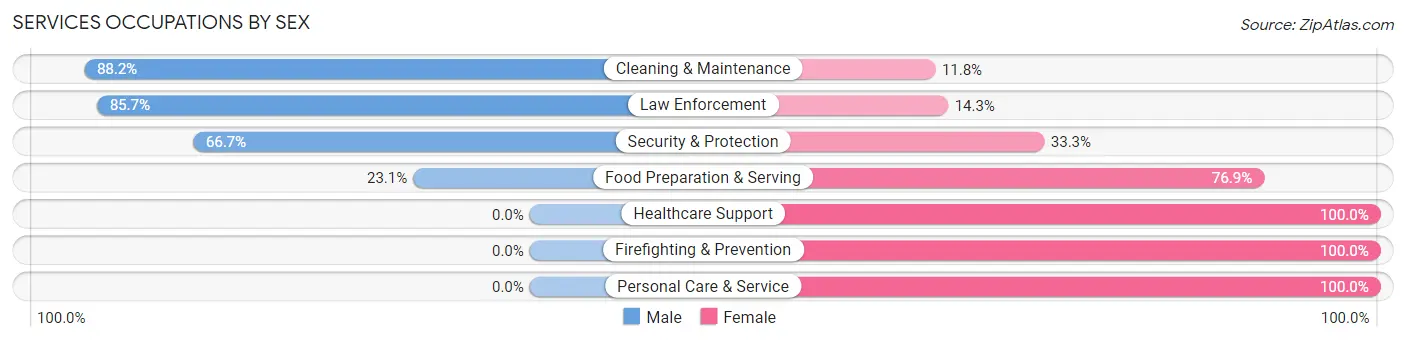
Services Occupations by Sex
Within the Services occupations in Eagle Butte, the most male-oriented occupations are Cleaning & Maintenance (88.2%), Law Enforcement (85.7%), and Security & Protection (66.7%), while the most female-oriented occupations are Healthcare Support (100.0%), Firefighting & Prevention (100.0%), and Personal Care & Service (100.0%).
| Occupation | Male | Female |
| Healthcare Support | 0 (0.0%) | 3 (100.0%) |
| Security & Protection | 12 (66.7%) | 6 (33.3%) |
| Firefighting & Prevention | 0 (0.0%) | 4 (100.0%) |
| Law Enforcement | 12 (85.7%) | 2 (14.3%) |
| Food Preparation & Serving | 6 (23.1%) | 20 (76.9%) |
| Cleaning & Maintenance | 15 (88.2%) | 2 (11.8%) |
| Personal Care & Service | 0 (0.0%) | 8 (100.0%) |
| Total (Category) | 33 (45.8%) | 39 (54.2%) |
| Total (Overall) | 188 (43.7%) | 242 (56.3%) |
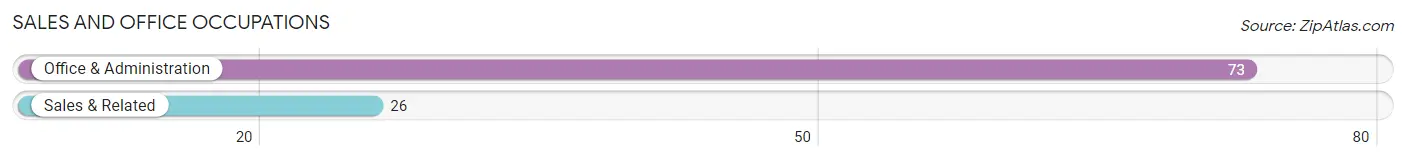
Sales and Office Occupations
The most common Sales and Office occupations in Eagle Butte are Office & Administration (73 | 17.0%), and Sales & Related (26 | 6.0%).
Sales and Office Occupations by Sex
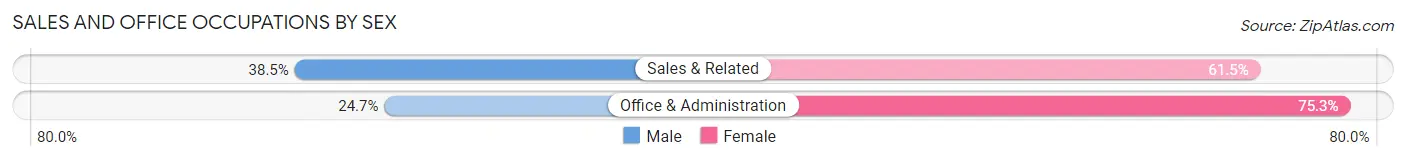
| Occupation | Male | Female |
| Sales & Related | 10 (38.5%) | 16 (61.5%) |
| Office & Administration | 18 (24.7%) | 55 (75.3%) |
| Total (Category) | 28 (28.3%) | 71 (71.7%) |
| Total (Overall) | 188 (43.7%) | 242 (56.3%) |
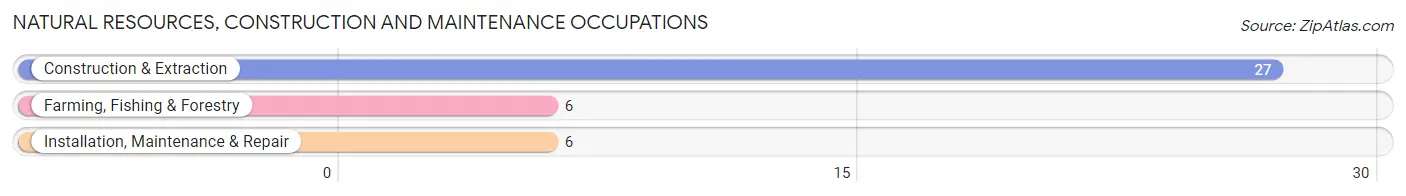
Natural Resources, Construction and Maintenance Occupations
The most common Natural Resources, Construction and Maintenance occupations in Eagle Butte are Construction & Extraction (27 | 6.3%), Farming, Fishing & Forestry (6 | 1.4%), and Installation, Maintenance & Repair (6 | 1.4%).
Natural Resources, Construction and Maintenance Occupations by Sex
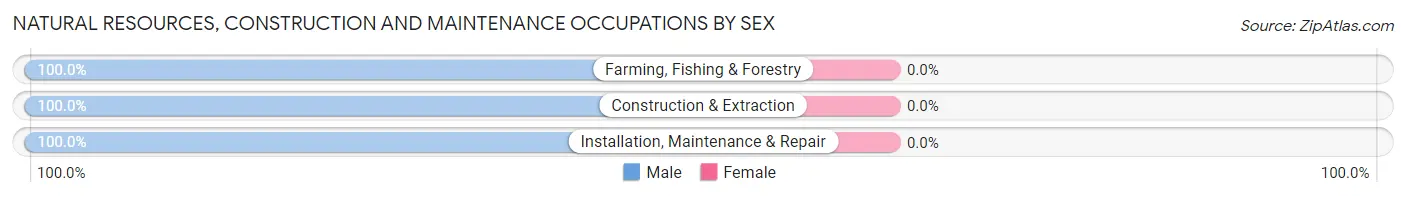
| Occupation | Male | Female |
| Farming, Fishing & Forestry | 6 (100.0%) | 0 (0.0%) |
| Construction & Extraction | 27 (100.0%) | 0 (0.0%) |
| Installation, Maintenance & Repair | 6 (100.0%) | 0 (0.0%) |
| Total (Category) | 39 (100.0%) | 0 (0.0%) |
| Total (Overall) | 188 (43.7%) | 242 (56.3%) |
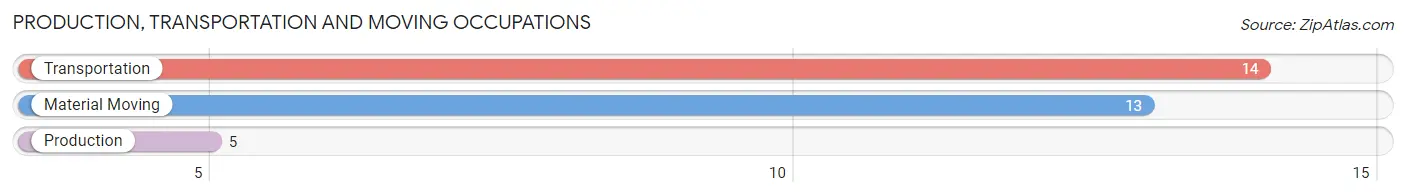
Production, Transportation and Moving Occupations
The most common Production, Transportation and Moving occupations in Eagle Butte are Transportation (14 | 3.3%), Material Moving (13 | 3.0%), and Production (5 | 1.2%).
Production, Transportation and Moving Occupations by Sex
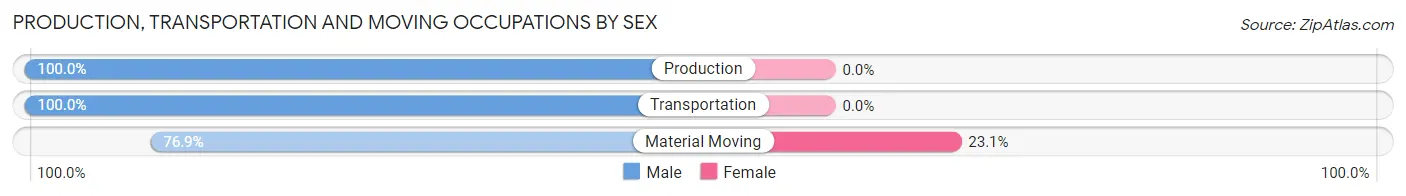
| Occupation | Male | Female |
| Production | 5 (100.0%) | 0 (0.0%) |
| Transportation | 14 (100.0%) | 0 (0.0%) |
| Material Moving | 10 (76.9%) | 3 (23.1%) |
| Total (Category) | 29 (90.6%) | 3 (9.4%) |
| Total (Overall) | 188 (43.7%) | 242 (56.3%) |
Employment Industries by Sex in Eagle Butte
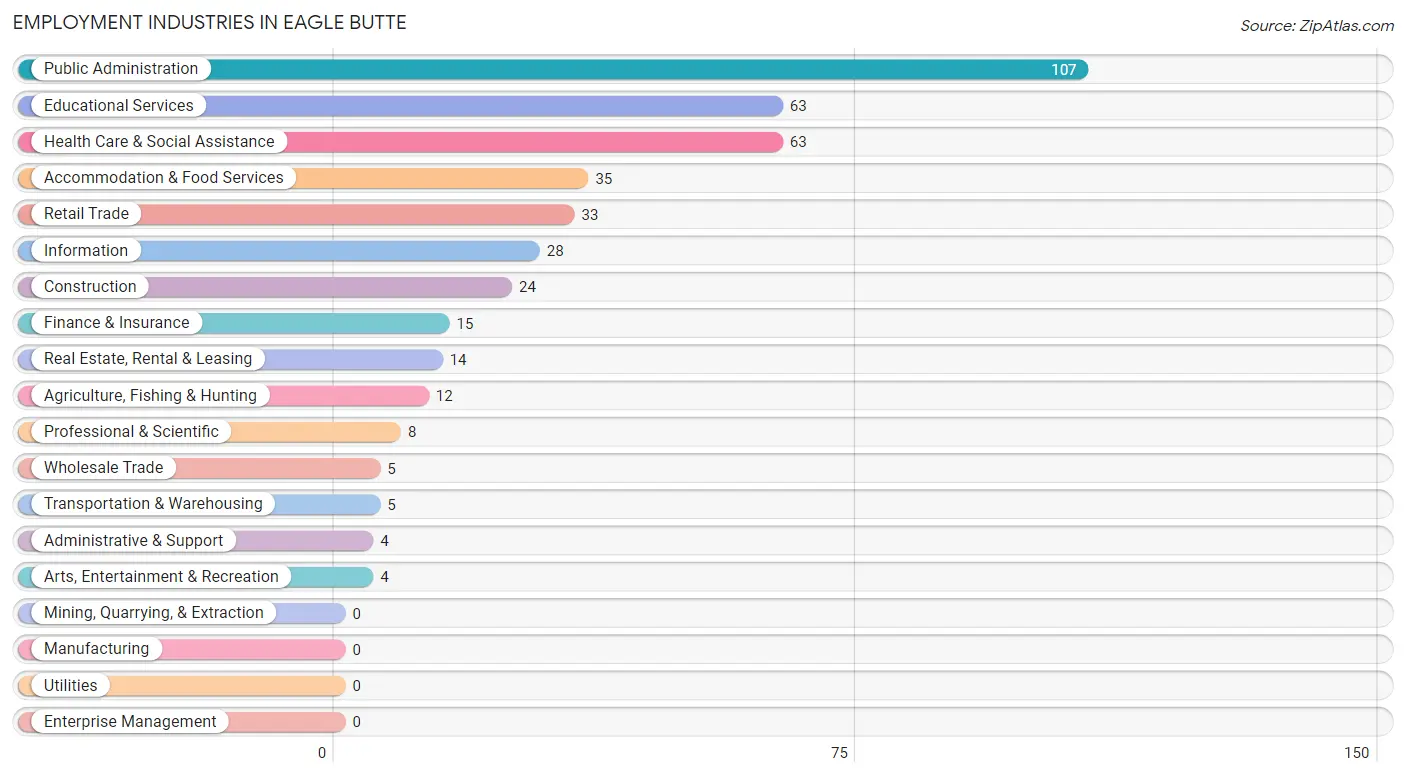
Employment Industries in Eagle Butte
The major employment industries in Eagle Butte include Public Administration (107 | 24.9%), Educational Services (63 | 14.6%), Health Care & Social Assistance (63 | 14.6%), Accommodation & Food Services (35 | 8.1%), and Retail Trade (33 | 7.7%).
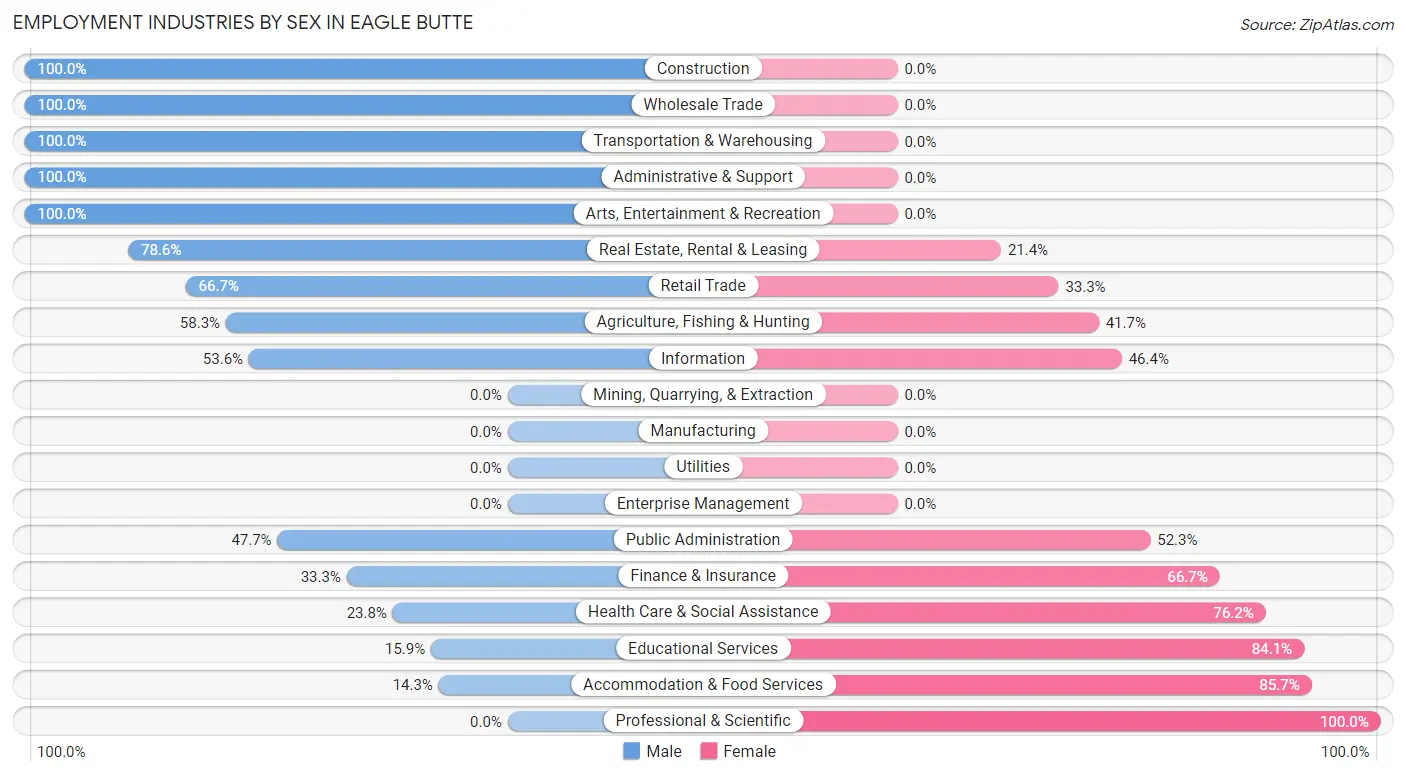
Employment Industries by Sex in Eagle Butte
The Eagle Butte industries that see more men than women are Construction (100.0%), Wholesale Trade (100.0%), and Transportation & Warehousing (100.0%), whereas the industries that tend to have a higher number of women are Professional & Scientific (100.0%), Accommodation & Food Services (85.7%), and Educational Services (84.1%).
| Industry | Male | Female |
| Agriculture, Fishing & Hunting | 7 (58.3%) | 5 (41.7%) |
| Mining, Quarrying, & Extraction | 0 (0.0%) | 0 (0.0%) |
| Construction | 24 (100.0%) | 0 (0.0%) |
| Manufacturing | 0 (0.0%) | 0 (0.0%) |
| Wholesale Trade | 5 (100.0%) | 0 (0.0%) |
| Retail Trade | 22 (66.7%) | 11 (33.3%) |
| Transportation & Warehousing | 5 (100.0%) | 0 (0.0%) |
| Utilities | 0 (0.0%) | 0 (0.0%) |
| Information | 15 (53.6%) | 13 (46.4%) |
| Finance & Insurance | 5 (33.3%) | 10 (66.7%) |
| Real Estate, Rental & Leasing | 11 (78.6%) | 3 (21.4%) |
| Professional & Scientific | 0 (0.0%) | 8 (100.0%) |
| Enterprise Management | 0 (0.0%) | 0 (0.0%) |
| Administrative & Support | 4 (100.0%) | 0 (0.0%) |
| Educational Services | 10 (15.9%) | 53 (84.1%) |
| Health Care & Social Assistance | 15 (23.8%) | 48 (76.2%) |
| Arts, Entertainment & Recreation | 4 (100.0%) | 0 (0.0%) |
| Accommodation & Food Services | 5 (14.3%) | 30 (85.7%) |
| Public Administration | 51 (47.7%) | 56 (52.3%) |
| Total | 188 (43.7%) | 242 (56.3%) |
Education in Eagle Butte
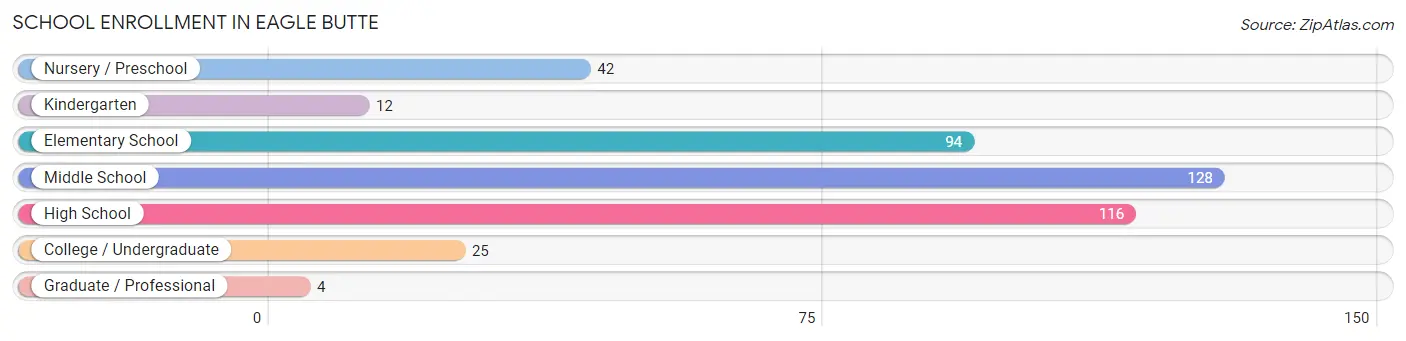
School Enrollment in Eagle Butte
The most common levels of schooling among the 421 students in Eagle Butte are middle school (128 | 30.4%), high school (116 | 27.6%), and elementary school (94 | 22.3%).
| School Level | # Students | % Students |
| Nursery / Preschool | 42 | 10.0% |
| Kindergarten | 12 | 2.9% |
| Elementary School | 94 | 22.3% |
| Middle School | 128 | 30.4% |
| High School | 116 | 27.6% |
| College / Undergraduate | 25 | 5.9% |
| Graduate / Professional | 4 | 0.9% |
| Total | 421 | 100.0% |
School Enrollment by Age by Funding Source in Eagle Butte
Out of a total of 421 students who are enrolled in schools in Eagle Butte, 24 (5.7%) attend a private institution, while the remaining 397 (94.3%) are enrolled in public schools. The age group of 35 years and over has the highest likelihood of being enrolled in private schools, with 4 (30.8% in the age bracket) enrolled. Conversely, the age group of 18 to 19 year olds has the lowest likelihood of being enrolled in a private school, with 27 (100.0% in the age bracket) attending a public institution.
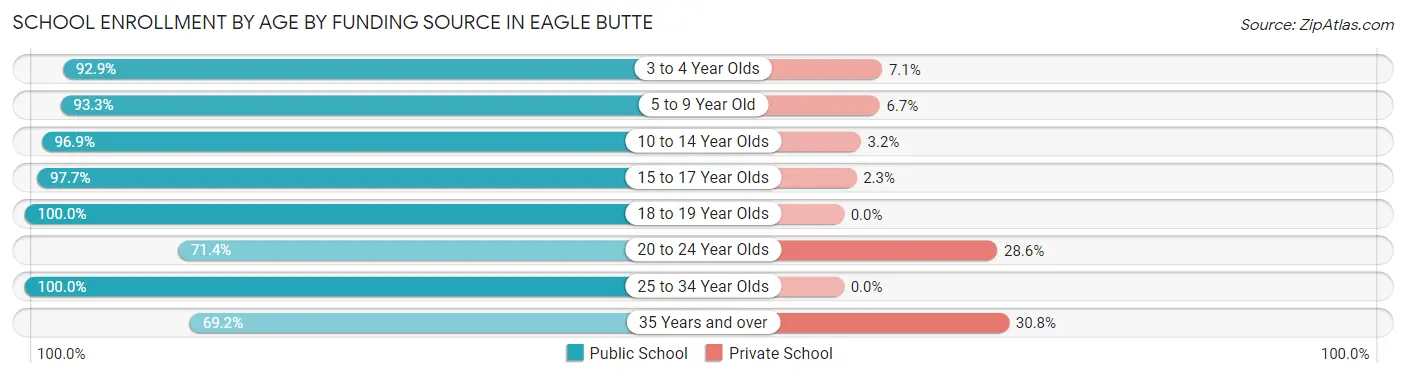
| Age Bracket | Public School | Private School |
| 3 to 4 Year Olds | 26 (92.9%) | 2 (7.1%) |
| 5 to 9 Year Old | 112 (93.3%) | 8 (6.7%) |
| 10 to 14 Year Olds | 123 (96.9%) | 4 (3.2%) |
| 15 to 17 Year Olds | 84 (97.7%) | 2 (2.3%) |
| 18 to 19 Year Olds | 27 (100.0%) | 0 (0.0%) |
| 20 to 24 Year Olds | 10 (71.4%) | 4 (28.6%) |
| 25 to 34 Year Olds | 6 (100.0%) | 0 (0.0%) |
| 35 Years and over | 9 (69.2%) | 4 (30.8%) |
| Total | 397 (94.3%) | 24 (5.7%) |
Educational Attainment by Field of Study in Eagle Butte
Education (52 | 48.1%), bio, nature & agricultural (13 | 12.0%), liberal arts & history (13 | 12.0%), social sciences (8 | 7.4%), and computers & mathematics (7 | 6.5%) are the most common fields of study among 108 individuals in Eagle Butte who have obtained a bachelor's degree or higher.
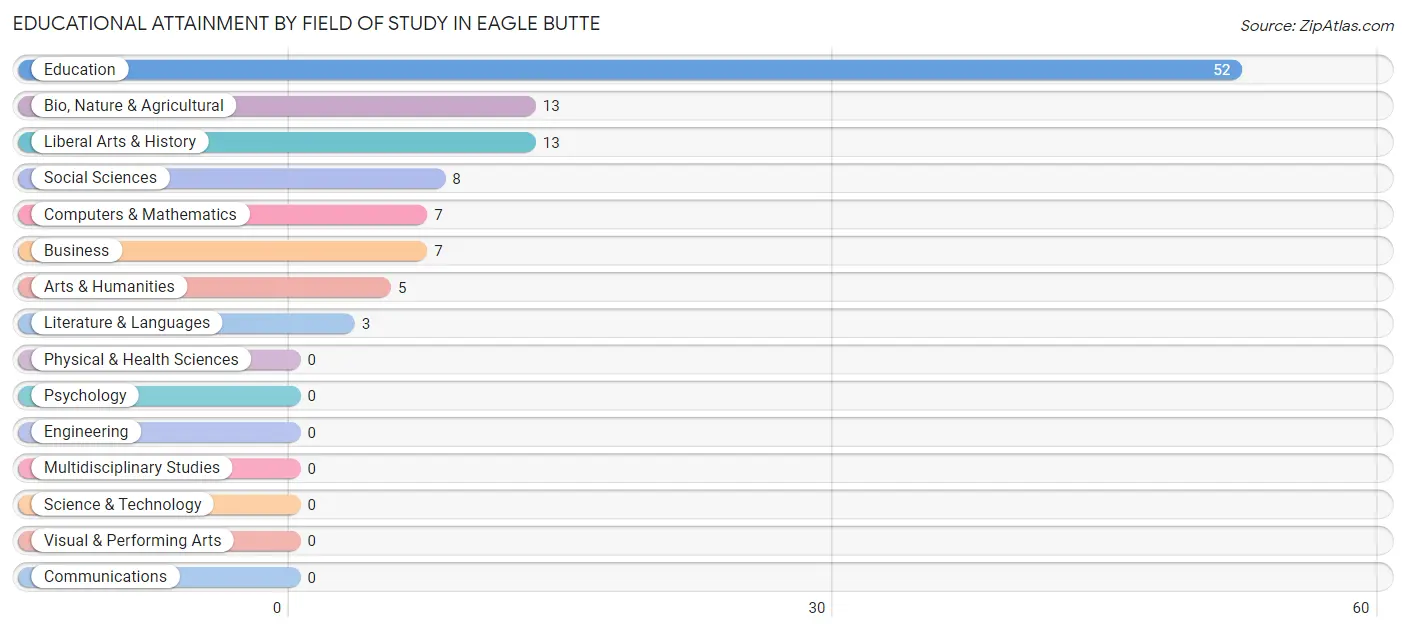
| Field of Study | # Graduates | % Graduates |
| Computers & Mathematics | 7 | 6.5% |
| Bio, Nature & Agricultural | 13 | 12.0% |
| Physical & Health Sciences | 0 | 0.0% |
| Psychology | 0 | 0.0% |
| Social Sciences | 8 | 7.4% |
| Engineering | 0 | 0.0% |
| Multidisciplinary Studies | 0 | 0.0% |
| Science & Technology | 0 | 0.0% |
| Business | 7 | 6.5% |
| Education | 52 | 48.1% |
| Literature & Languages | 3 | 2.8% |
| Liberal Arts & History | 13 | 12.0% |
| Visual & Performing Arts | 0 | 0.0% |
| Communications | 0 | 0.0% |
| Arts & Humanities | 5 | 4.6% |
| Total | 108 | 100.0% |
Transportation & Commute in Eagle Butte
Vehicle Availability by Sex in Eagle Butte
The most prevalent vehicle ownership categories in Eagle Butte are males with 2 vehicles (84, accounting for 46.2%) and females with 2 vehicles (103, making up 35.0%).
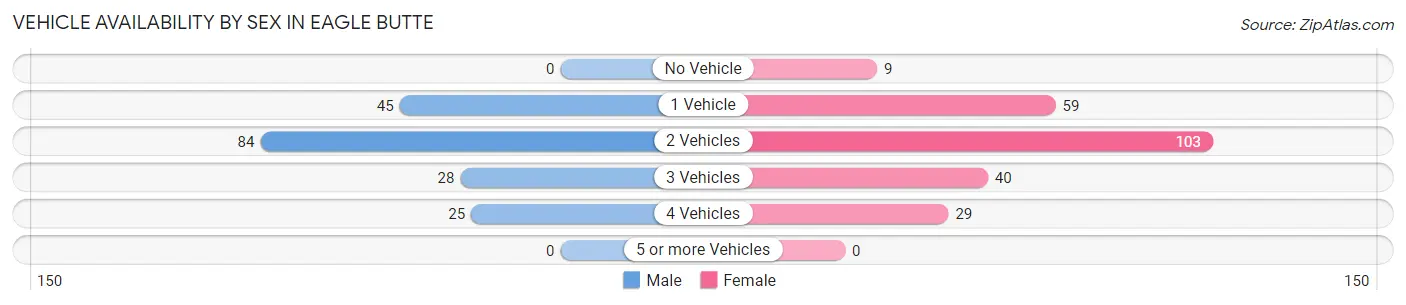
| Vehicles Available | Male | Female |
| No Vehicle | 0 (0.0%) | 9 (3.7%) |
| 1 Vehicle | 45 (24.7%) | 59 (24.6%) |
| 2 Vehicles | 84 (46.2%) | 103 (42.9%) |
| 3 Vehicles | 28 (15.4%) | 40 (16.7%) |
| 4 Vehicles | 25 (13.7%) | 29 (12.1%) |
| 5 or more Vehicles | 0 (0.0%) | 0 (0.0%) |
| Total | 182 (100.0%) | 240 (100.0%) |
Commute Time in Eagle Butte
The most frequently occuring commute durations in Eagle Butte are 10 to 14 minutes (230 commuters, 57.1%), less than 5 minutes (79 commuters, 19.6%), and 5 to 9 minutes (48 commuters, 11.9%).
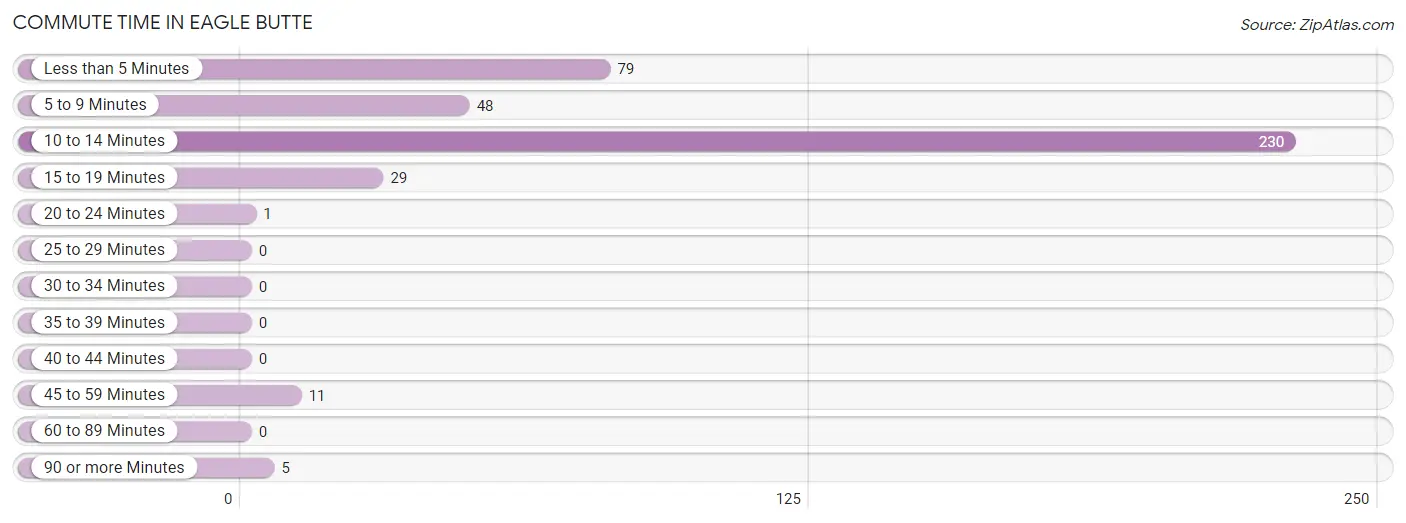
| Commute Time | # Commuters | % Commuters |
| Less than 5 Minutes | 79 | 19.6% |
| 5 to 9 Minutes | 48 | 11.9% |
| 10 to 14 Minutes | 230 | 57.1% |
| 15 to 19 Minutes | 29 | 7.2% |
| 20 to 24 Minutes | 1 | 0.3% |
| 25 to 29 Minutes | 0 | 0.0% |
| 30 to 34 Minutes | 0 | 0.0% |
| 35 to 39 Minutes | 0 | 0.0% |
| 40 to 44 Minutes | 0 | 0.0% |
| 45 to 59 Minutes | 11 | 2.7% |
| 60 to 89 Minutes | 0 | 0.0% |
| 90 or more Minutes | 5 | 1.2% |
Commute Time by Sex in Eagle Butte
The most common commute times in Eagle Butte are 10 to 14 minutes (96 commuters, 55.5%) for males and 10 to 14 minutes (134 commuters, 58.3%) for females.
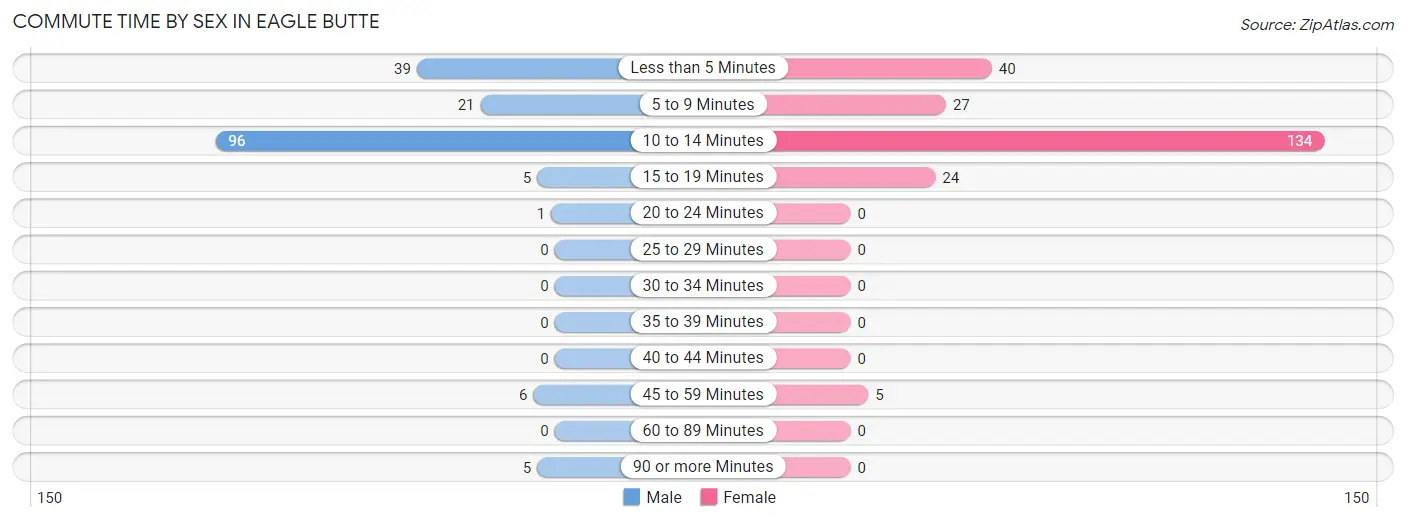
| Commute Time | Male | Female |
| Less than 5 Minutes | 39 (22.5%) | 40 (17.4%) |
| 5 to 9 Minutes | 21 (12.1%) | 27 (11.7%) |
| 10 to 14 Minutes | 96 (55.5%) | 134 (58.3%) |
| 15 to 19 Minutes | 5 (2.9%) | 24 (10.4%) |
| 20 to 24 Minutes | 1 (0.6%) | 0 (0.0%) |
| 25 to 29 Minutes | 0 (0.0%) | 0 (0.0%) |
| 30 to 34 Minutes | 0 (0.0%) | 0 (0.0%) |
| 35 to 39 Minutes | 0 (0.0%) | 0 (0.0%) |
| 40 to 44 Minutes | 0 (0.0%) | 0 (0.0%) |
| 45 to 59 Minutes | 6 (3.5%) | 5 (2.2%) |
| 60 to 89 Minutes | 0 (0.0%) | 0 (0.0%) |
| 90 or more Minutes | 5 (2.9%) | 0 (0.0%) |
Time of Departure to Work by Sex in Eagle Butte
The most frequent times of departure to work in Eagle Butte are 7:30 AM to 7:59 AM (70, 40.5%) for males and 7:30 AM to 7:59 AM (123, 53.5%) for females.
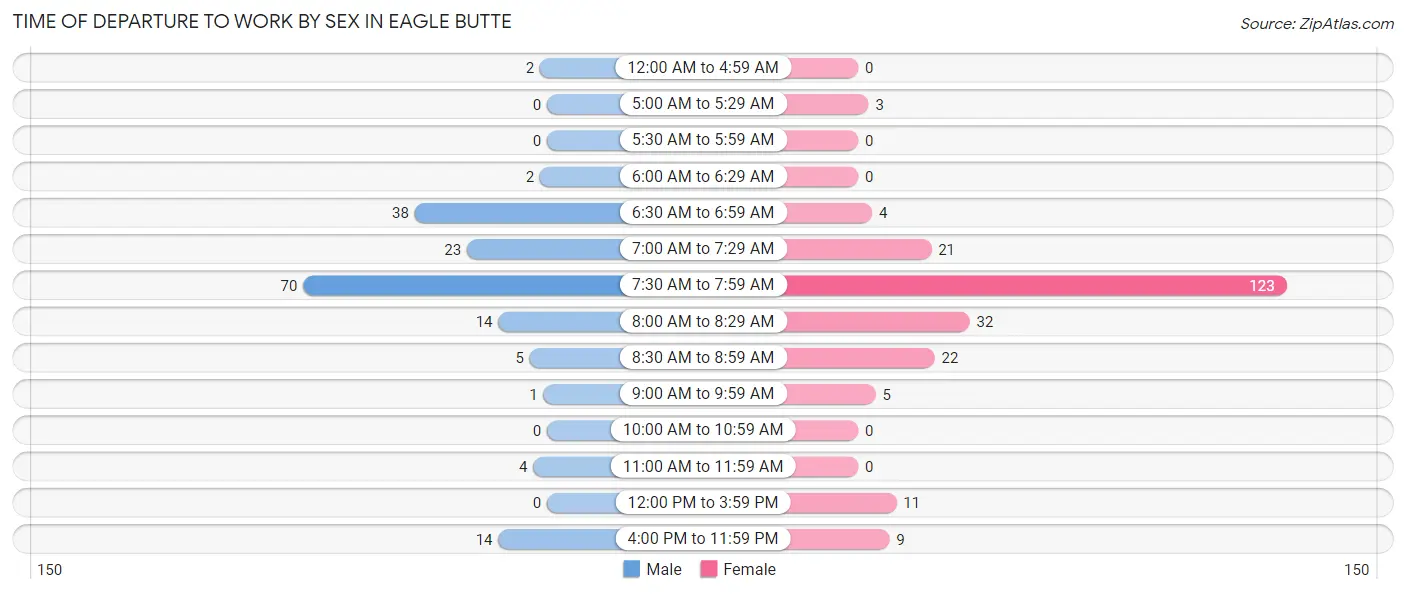
| Time of Departure | Male | Female |
| 12:00 AM to 4:59 AM | 2 (1.2%) | 0 (0.0%) |
| 5:00 AM to 5:29 AM | 0 (0.0%) | 3 (1.3%) |
| 5:30 AM to 5:59 AM | 0 (0.0%) | 0 (0.0%) |
| 6:00 AM to 6:29 AM | 2 (1.2%) | 0 (0.0%) |
| 6:30 AM to 6:59 AM | 38 (22.0%) | 4 (1.7%) |
| 7:00 AM to 7:29 AM | 23 (13.3%) | 21 (9.1%) |
| 7:30 AM to 7:59 AM | 70 (40.5%) | 123 (53.5%) |
| 8:00 AM to 8:29 AM | 14 (8.1%) | 32 (13.9%) |
| 8:30 AM to 8:59 AM | 5 (2.9%) | 22 (9.6%) |
| 9:00 AM to 9:59 AM | 1 (0.6%) | 5 (2.2%) |
| 10:00 AM to 10:59 AM | 0 (0.0%) | 0 (0.0%) |
| 11:00 AM to 11:59 AM | 4 (2.3%) | 0 (0.0%) |
| 12:00 PM to 3:59 PM | 0 (0.0%) | 11 (4.8%) |
| 4:00 PM to 11:59 PM | 14 (8.1%) | 9 (3.9%) |
| Total | 173 (100.0%) | 230 (100.0%) |
Housing Occupancy in Eagle Butte
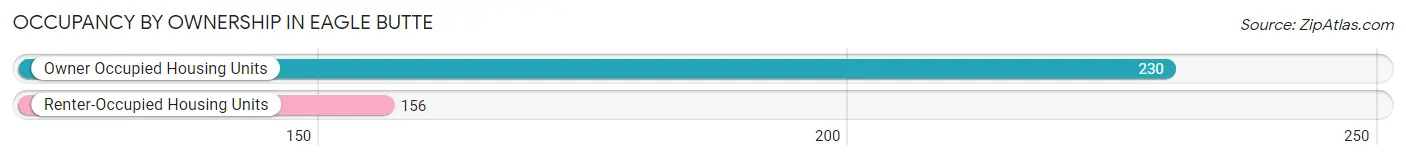
Occupancy by Ownership in Eagle Butte
Of the total 386 dwellings in Eagle Butte, owner-occupied units account for 230 (59.6%), while renter-occupied units make up 156 (40.4%).
| Occupancy | # Housing Units | % Housing Units |
| Owner Occupied Housing Units | 230 | 59.6% |
| Renter-Occupied Housing Units | 156 | 40.4% |
| Total Occupied Housing Units | 386 | 100.0% |
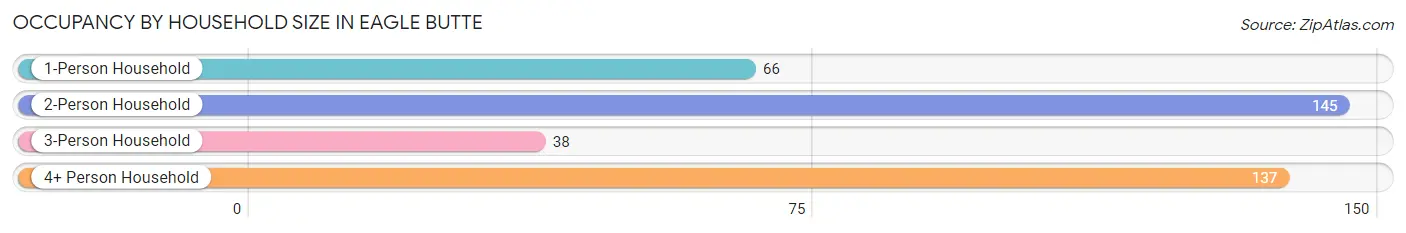
Occupancy by Household Size in Eagle Butte
| Household Size | # Housing Units | % Housing Units |
| 1-Person Household | 66 | 17.1% |
| 2-Person Household | 145 | 37.6% |
| 3-Person Household | 38 | 9.8% |
| 4+ Person Household | 137 | 35.5% |
| Total Housing Units | 386 | 100.0% |
Occupancy by Ownership by Household Size in Eagle Butte
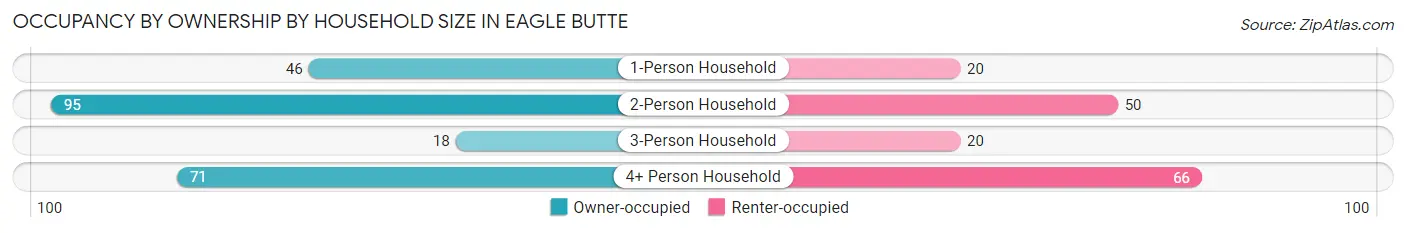
| Household Size | Owner-occupied | Renter-occupied |
| 1-Person Household | 46 (69.7%) | 20 (30.3%) |
| 2-Person Household | 95 (65.5%) | 50 (34.5%) |
| 3-Person Household | 18 (47.4%) | 20 (52.6%) |
| 4+ Person Household | 71 (51.8%) | 66 (48.2%) |
| Total Housing Units | 230 (59.6%) | 156 (40.4%) |
Occupancy by Educational Attainment in Eagle Butte
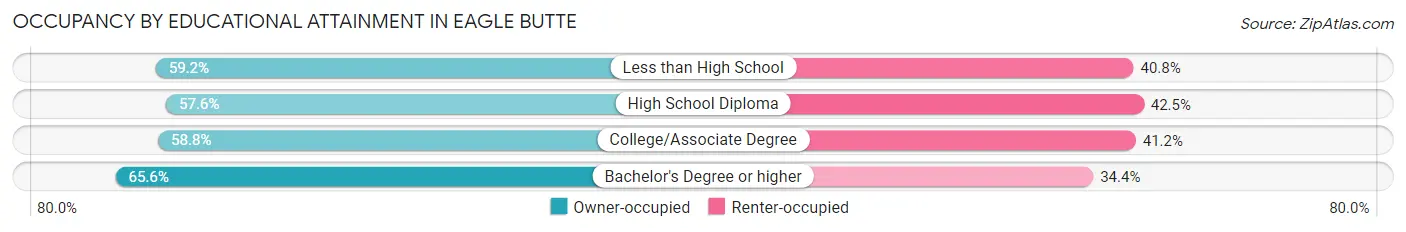
| Household Size | Owner-occupied | Renter-occupied |
| Less than High School | 29 (59.2%) | 20 (40.8%) |
| High School Diploma | 61 (57.6%) | 45 (42.4%) |
| College/Associate Degree | 100 (58.8%) | 70 (41.2%) |
| Bachelor's Degree or higher | 40 (65.6%) | 21 (34.4%) |
Occupancy by Age of Householder in Eagle Butte
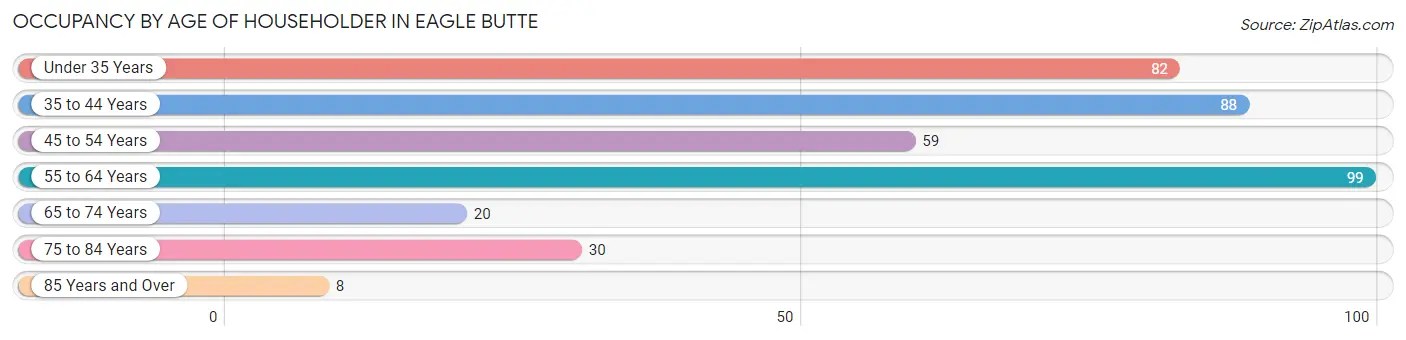
| Age Bracket | # Households | % Households |
| Under 35 Years | 82 | 21.2% |
| 35 to 44 Years | 88 | 22.8% |
| 45 to 54 Years | 59 | 15.3% |
| 55 to 64 Years | 99 | 25.7% |
| 65 to 74 Years | 20 | 5.2% |
| 75 to 84 Years | 30 | 7.8% |
| 85 Years and Over | 8 | 2.1% |
| Total | 386 | 100.0% |
Housing Finances in Eagle Butte
Median Income by Occupancy in Eagle Butte
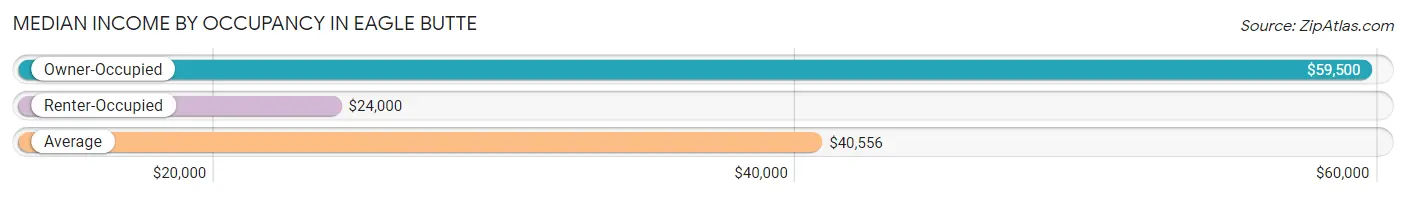
| Occupancy Type | # Households | Median Income |
| Owner-Occupied | 230 (59.6%) | $59,500 |
| Renter-Occupied | 156 (40.4%) | $24,000 |
| Average | 386 (100.0%) | $40,556 |
Occupancy by Householder Income Bracket in Eagle Butte
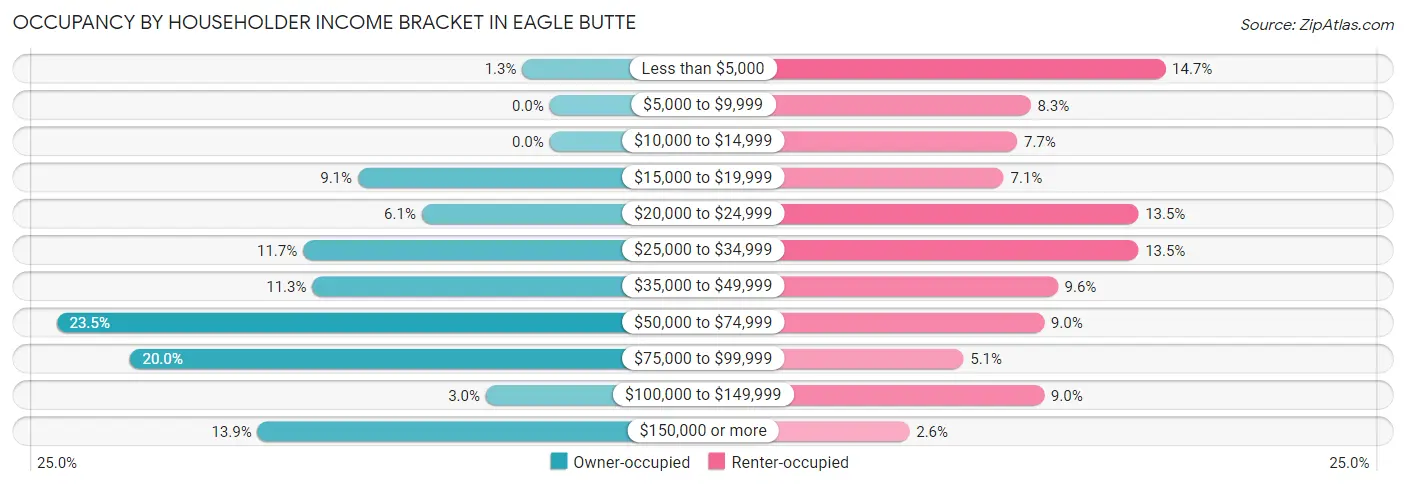
| Income Bracket | Owner-occupied | Renter-occupied |
| Less than $5,000 | 3 (1.3%) | 23 (14.7%) |
| $5,000 to $9,999 | 0 (0.0%) | 13 (8.3%) |
| $10,000 to $14,999 | 0 (0.0%) | 12 (7.7%) |
| $15,000 to $19,999 | 21 (9.1%) | 11 (7.0%) |
| $20,000 to $24,999 | 14 (6.1%) | 21 (13.5%) |
| $25,000 to $34,999 | 27 (11.7%) | 21 (13.5%) |
| $35,000 to $49,999 | 26 (11.3%) | 15 (9.6%) |
| $50,000 to $74,999 | 54 (23.5%) | 14 (9.0%) |
| $75,000 to $99,999 | 46 (20.0%) | 8 (5.1%) |
| $100,000 to $149,999 | 7 (3.0%) | 14 (9.0%) |
| $150,000 or more | 32 (13.9%) | 4 (2.6%) |
| Total | 230 (100.0%) | 156 (100.0%) |
Monthly Housing Cost Tiers in Eagle Butte
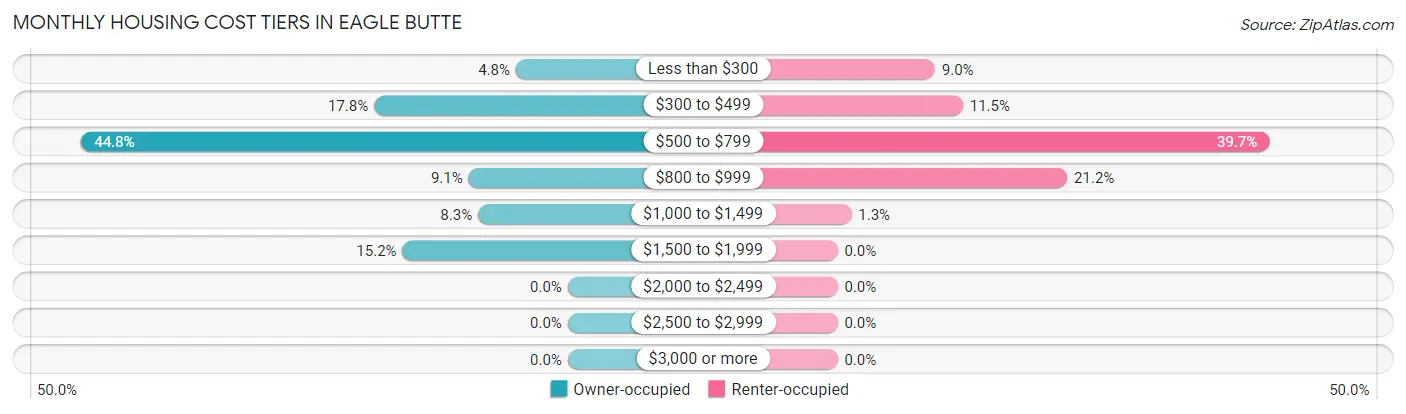
| Monthly Cost | Owner-occupied | Renter-occupied |
| Less than $300 | 11 (4.8%) | 14 (9.0%) |
| $300 to $499 | 41 (17.8%) | 18 (11.5%) |
| $500 to $799 | 103 (44.8%) | 62 (39.7%) |
| $800 to $999 | 21 (9.1%) | 33 (21.1%) |
| $1,000 to $1,499 | 19 (8.3%) | 2 (1.3%) |
| $1,500 to $1,999 | 35 (15.2%) | 0 (0.0%) |
| $2,000 to $2,499 | 0 (0.0%) | 0 (0.0%) |
| $2,500 to $2,999 | 0 (0.0%) | 0 (0.0%) |
| $3,000 or more | 0 (0.0%) | 0 (0.0%) |
| Total | 230 (100.0%) | 156 (100.0%) |
Physical Housing Characteristics in Eagle Butte
Housing Structures in Eagle Butte
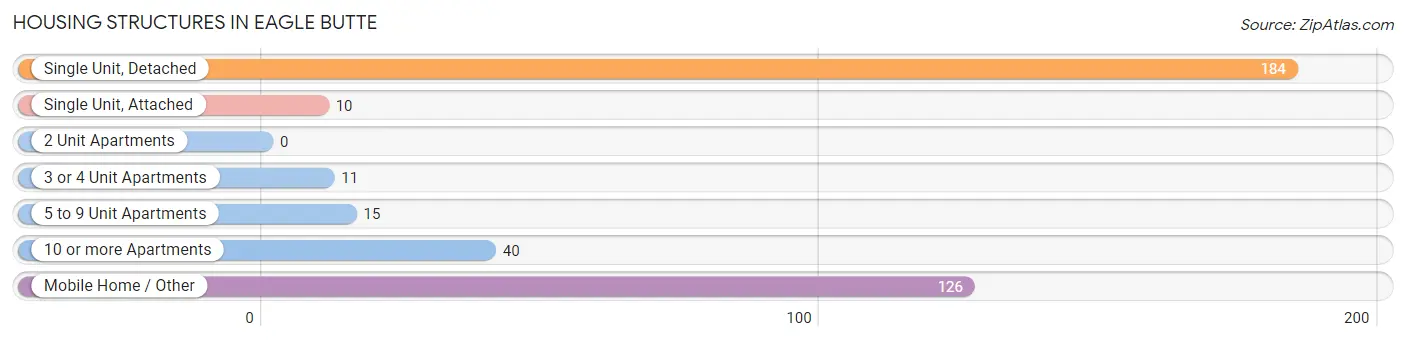
| Structure Type | # Housing Units | % Housing Units |
| Single Unit, Detached | 184 | 47.7% |
| Single Unit, Attached | 10 | 2.6% |
| 2 Unit Apartments | 0 | 0.0% |
| 3 or 4 Unit Apartments | 11 | 2.9% |
| 5 to 9 Unit Apartments | 15 | 3.9% |
| 10 or more Apartments | 40 | 10.4% |
| Mobile Home / Other | 126 | 32.6% |
| Total | 386 | 100.0% |
Housing Structures by Occupancy in Eagle Butte
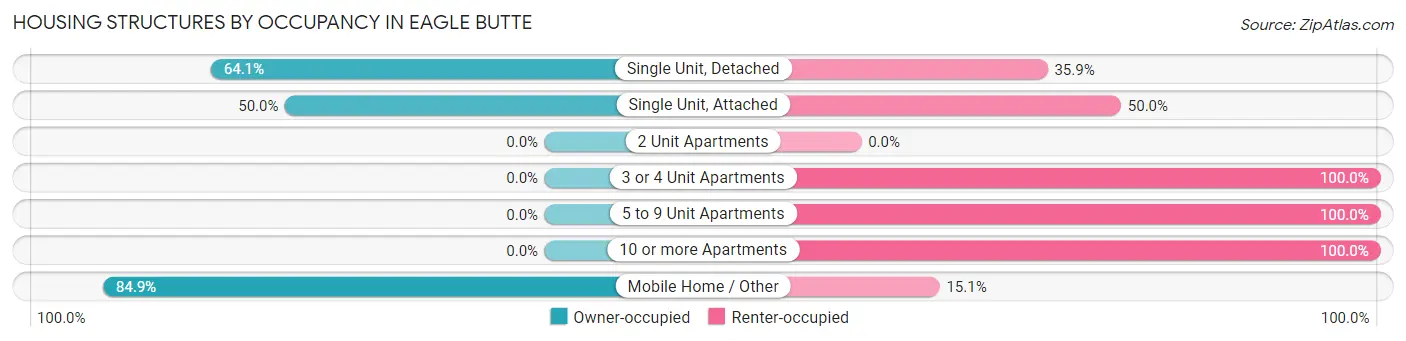
| Structure Type | Owner-occupied | Renter-occupied |
| Single Unit, Detached | 118 (64.1%) | 66 (35.9%) |
| Single Unit, Attached | 5 (50.0%) | 5 (50.0%) |
| 2 Unit Apartments | 0 (0.0%) | 0 (0.0%) |
| 3 or 4 Unit Apartments | 0 (0.0%) | 11 (100.0%) |
| 5 to 9 Unit Apartments | 0 (0.0%) | 15 (100.0%) |
| 10 or more Apartments | 0 (0.0%) | 40 (100.0%) |
| Mobile Home / Other | 107 (84.9%) | 19 (15.1%) |
| Total | 230 (59.6%) | 156 (40.4%) |
Housing Structures by Number of Rooms in Eagle Butte
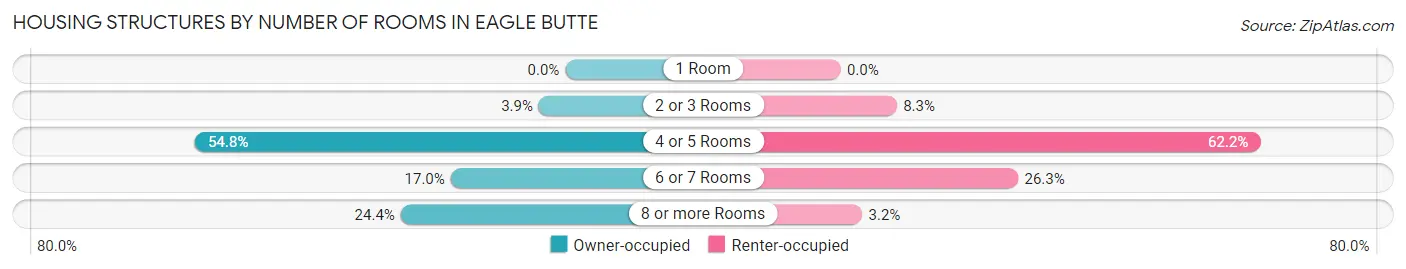
| Number of Rooms | Owner-occupied | Renter-occupied |
| 1 Room | 0 (0.0%) | 0 (0.0%) |
| 2 or 3 Rooms | 9 (3.9%) | 13 (8.3%) |
| 4 or 5 Rooms | 126 (54.8%) | 97 (62.2%) |
| 6 or 7 Rooms | 39 (17.0%) | 41 (26.3%) |
| 8 or more Rooms | 56 (24.3%) | 5 (3.2%) |
| Total | 230 (100.0%) | 156 (100.0%) |
Housing Structure by Heating Type in Eagle Butte
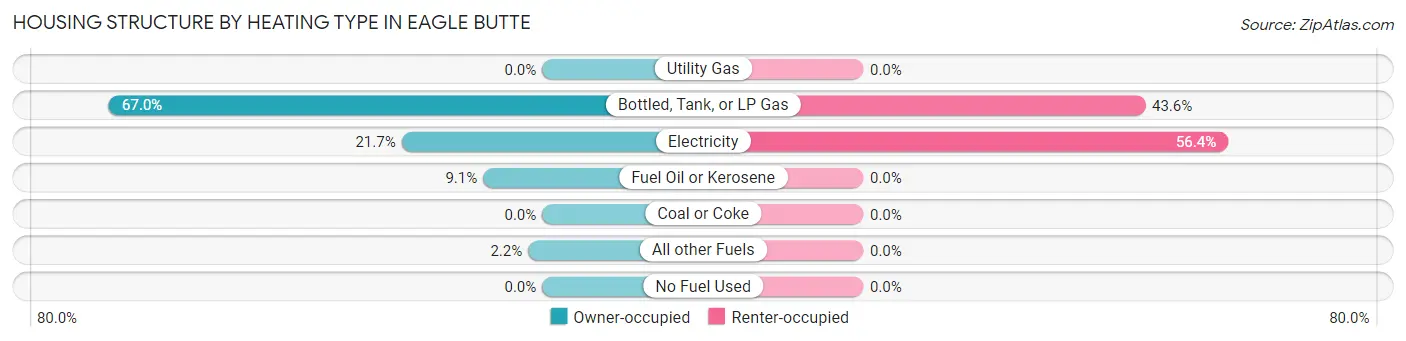
| Heating Type | Owner-occupied | Renter-occupied |
| Utility Gas | 0 (0.0%) | 0 (0.0%) |
| Bottled, Tank, or LP Gas | 154 (67.0%) | 68 (43.6%) |
| Electricity | 50 (21.7%) | 88 (56.4%) |
| Fuel Oil or Kerosene | 21 (9.1%) | 0 (0.0%) |
| Coal or Coke | 0 (0.0%) | 0 (0.0%) |
| All other Fuels | 5 (2.2%) | 0 (0.0%) |
| No Fuel Used | 0 (0.0%) | 0 (0.0%) |
| Total | 230 (100.0%) | 156 (100.0%) |
Household Vehicle Usage in Eagle Butte
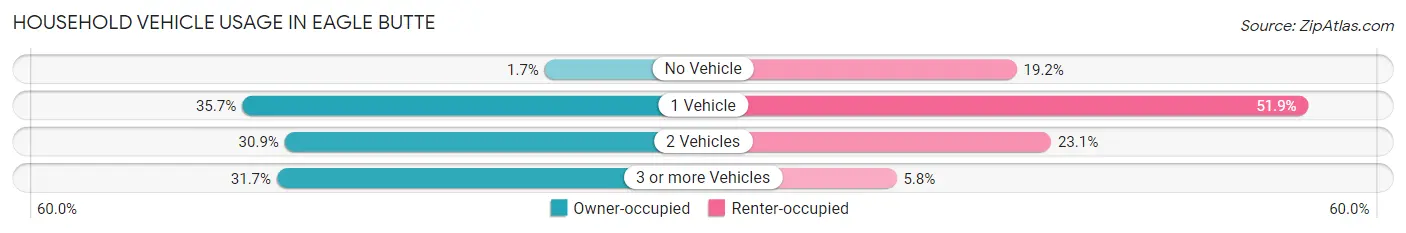
| Vehicles per Household | Owner-occupied | Renter-occupied |
| No Vehicle | 4 (1.7%) | 30 (19.2%) |
| 1 Vehicle | 82 (35.6%) | 81 (51.9%) |
| 2 Vehicles | 71 (30.9%) | 36 (23.1%) |
| 3 or more Vehicles | 73 (31.7%) | 9 (5.8%) |
| Total | 230 (100.0%) | 156 (100.0%) |
Real Estate & Mortgages in Eagle Butte
Real Estate and Mortgage Overview in Eagle Butte
| Characteristic | Without Mortgage | With Mortgage |
| Housing Units | 133 | 97 |
| Median Property Value | $40,800 | $86,400 |
| Median Household Income | $50,750 | $32 |
| Monthly Housing Costs | $534 | $0 |
| Real Estate Taxes | $767 | $28 |
Property Value by Mortgage Status in Eagle Butte
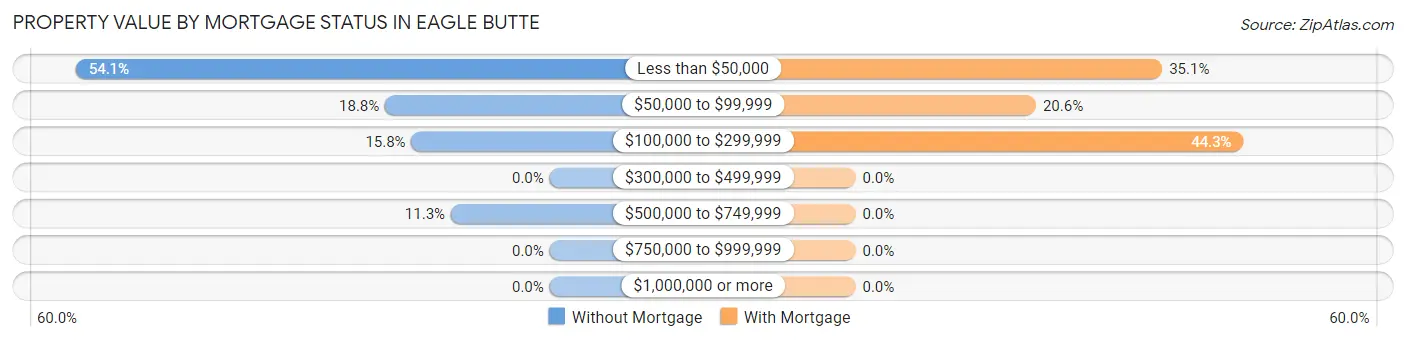
| Property Value | Without Mortgage | With Mortgage |
| Less than $50,000 | 72 (54.1%) | 34 (35.0%) |
| $50,000 to $99,999 | 25 (18.8%) | 20 (20.6%) |
| $100,000 to $299,999 | 21 (15.8%) | 43 (44.3%) |
| $300,000 to $499,999 | 0 (0.0%) | 0 (0.0%) |
| $500,000 to $749,999 | 15 (11.3%) | 0 (0.0%) |
| $750,000 to $999,999 | 0 (0.0%) | 0 (0.0%) |
| $1,000,000 or more | 0 (0.0%) | 0 (0.0%) |
| Total | 133 (100.0%) | 97 (100.0%) |
Household Income by Mortgage Status in Eagle Butte
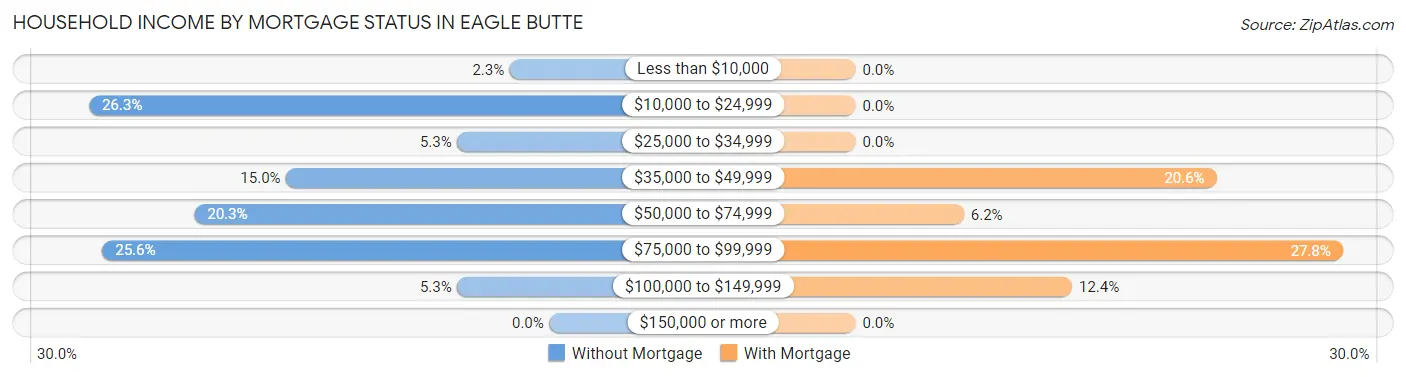
| Household Income | Without Mortgage | With Mortgage |
| Less than $10,000 | 3 (2.3%) | 0 (0.0%) |
| $10,000 to $24,999 | 35 (26.3%) | 0 (0.0%) |
| $25,000 to $34,999 | 7 (5.3%) | 0 (0.0%) |
| $35,000 to $49,999 | 20 (15.0%) | 20 (20.6%) |
| $50,000 to $74,999 | 27 (20.3%) | 6 (6.2%) |
| $75,000 to $99,999 | 34 (25.6%) | 27 (27.8%) |
| $100,000 to $149,999 | 7 (5.3%) | 12 (12.4%) |
| $150,000 or more | 0 (0.0%) | 0 (0.0%) |
| Total | 133 (100.0%) | 97 (100.0%) |
Property Value to Household Income Ratio in Eagle Butte
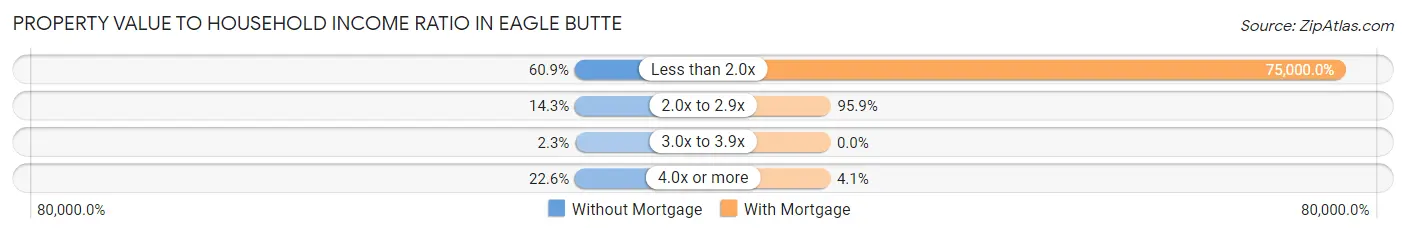
| Value-to-Income Ratio | Without Mortgage | With Mortgage |
| Less than 2.0x | 81 (60.9%) | 72,750 (75,000.0%) |
| 2.0x to 2.9x | 19 (14.3%) | 93 (95.9%) |
| 3.0x to 3.9x | 3 (2.3%) | 0 (0.0%) |
| 4.0x or more | 30 (22.6%) | 4 (4.1%) |
| Total | 133 (100.0%) | 97 (100.0%) |
Real Estate Taxes by Mortgage Status in Eagle Butte
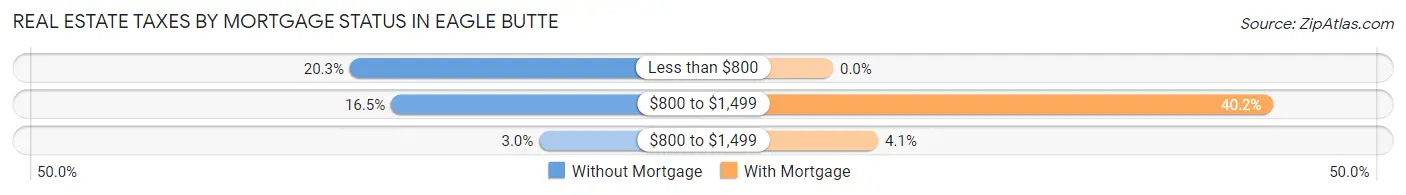
| Property Taxes | Without Mortgage | With Mortgage |
| Less than $800 | 27 (20.3%) | 0 (0.0%) |
| $800 to $1,499 | 22 (16.5%) | 39 (40.2%) |
| $800 to $1,499 | 4 (3.0%) | 4 (4.1%) |
| Total | 133 (100.0%) | 97 (100.0%) |
Health & Disability in Eagle Butte
Health Insurance Coverage by Age in Eagle Butte
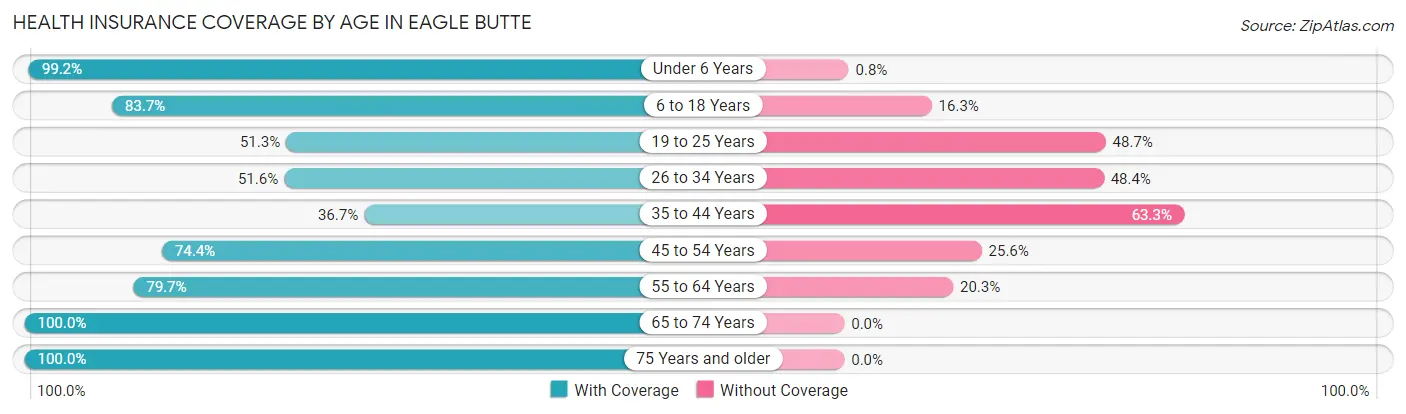
| Age Bracket | With Coverage | Without Coverage |
| Under 6 Years | 124 (99.2%) | 1 (0.8%) |
| 6 to 18 Years | 293 (83.7%) | 57 (16.3%) |
| 19 to 25 Years | 61 (51.3%) | 58 (48.7%) |
| 26 to 34 Years | 95 (51.6%) | 89 (48.4%) |
| 35 to 44 Years | 105 (36.7%) | 181 (63.3%) |
| 45 to 54 Years | 61 (74.4%) | 21 (25.6%) |
| 55 to 64 Years | 114 (79.7%) | 29 (20.3%) |
| 65 to 74 Years | 31 (100.0%) | 0 (0.0%) |
| 75 Years and older | 48 (100.0%) | 0 (0.0%) |
| Total | 932 (68.1%) | 436 (31.9%) |
Health Insurance Coverage by Citizenship Status in Eagle Butte
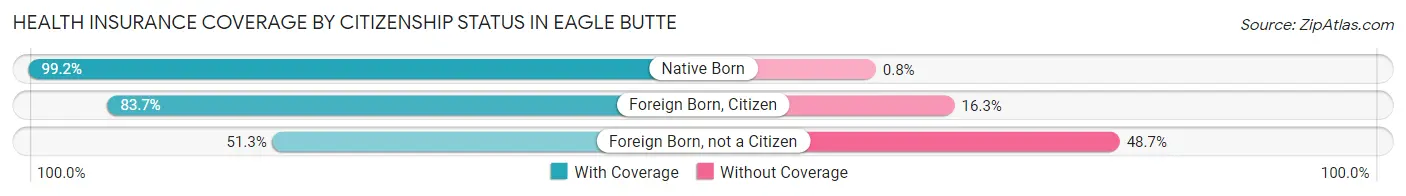
| Citizenship Status | With Coverage | Without Coverage |
| Native Born | 124 (99.2%) | 1 (0.8%) |
| Foreign Born, Citizen | 293 (83.7%) | 57 (16.3%) |
| Foreign Born, not a Citizen | 61 (51.3%) | 58 (48.7%) |
Health Insurance Coverage by Household Income in Eagle Butte
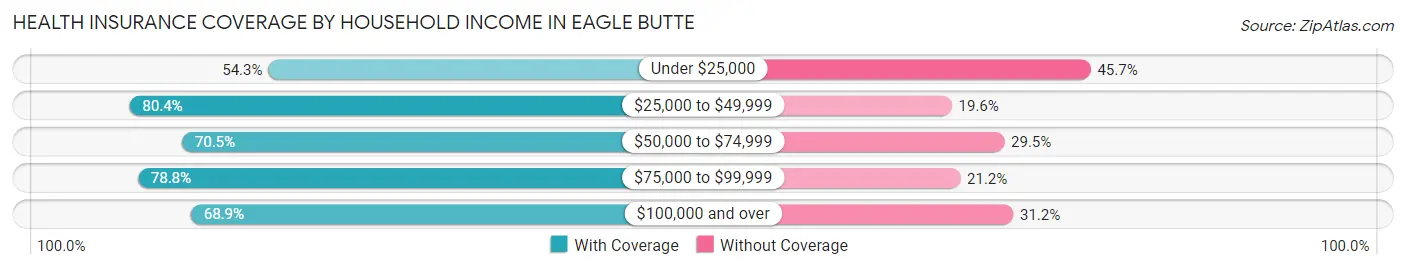
| Household Income | With Coverage | Without Coverage |
| Under $25,000 | 238 (54.3%) | 200 (45.7%) |
| $25,000 to $49,999 | 225 (80.4%) | 55 (19.6%) |
| $50,000 to $74,999 | 201 (70.5%) | 84 (29.5%) |
| $75,000 to $99,999 | 141 (78.8%) | 38 (21.2%) |
| $100,000 and over | 126 (68.9%) | 57 (31.1%) |
Public vs Private Health Insurance Coverage by Age in Eagle Butte
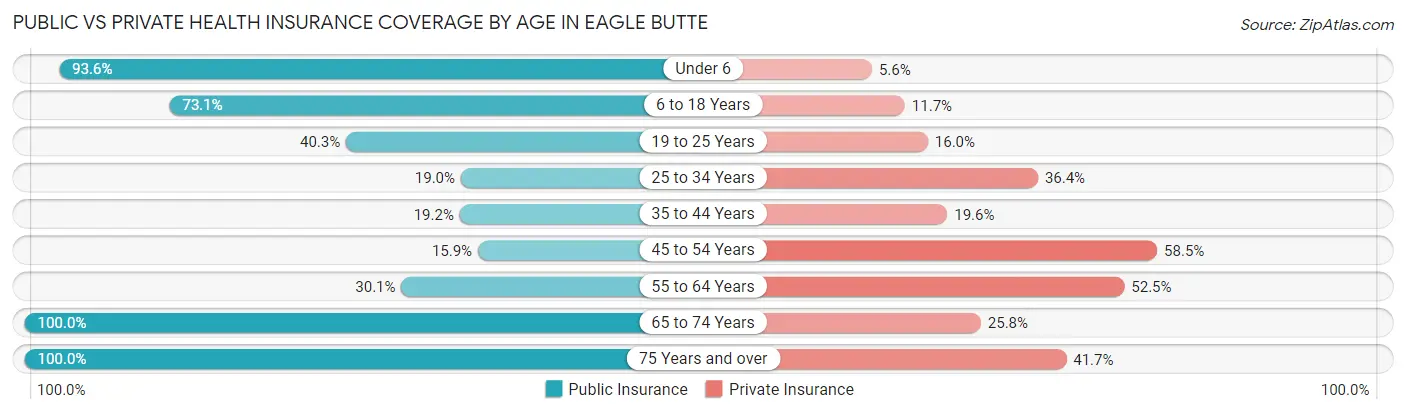
| Age Bracket | Public Insurance | Private Insurance |
| Under 6 | 117 (93.6%) | 7 (5.6%) |
| 6 to 18 Years | 256 (73.1%) | 41 (11.7%) |
| 19 to 25 Years | 48 (40.3%) | 19 (16.0%) |
| 25 to 34 Years | 35 (19.0%) | 67 (36.4%) |
| 35 to 44 Years | 55 (19.2%) | 56 (19.6%) |
| 45 to 54 Years | 13 (15.9%) | 48 (58.5%) |
| 55 to 64 Years | 43 (30.1%) | 75 (52.4%) |
| 65 to 74 Years | 31 (100.0%) | 8 (25.8%) |
| 75 Years and over | 48 (100.0%) | 20 (41.7%) |
| Total | 646 (47.2%) | 341 (24.9%) |
Disability Status by Sex by Age in Eagle Butte
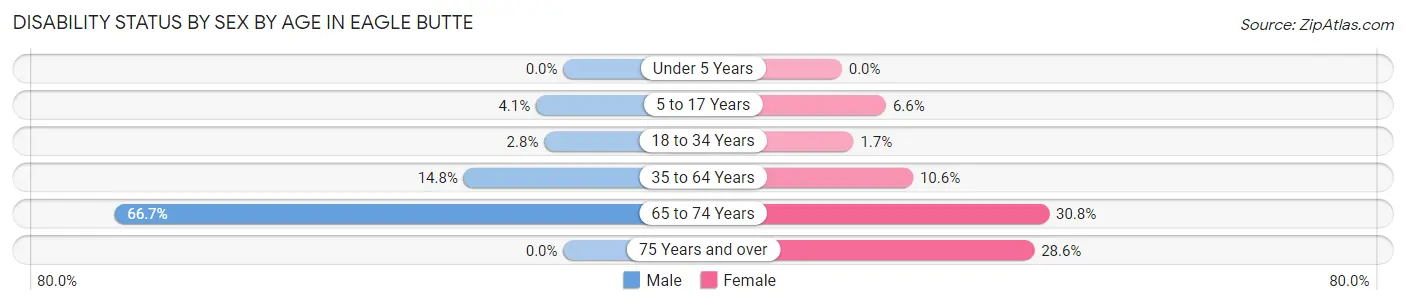
| Age Bracket | Male | Female |
| Under 5 Years | 0 (0.0%) | 0 (0.0%) |
| 5 to 17 Years | 7 (4.1%) | 12 (6.6%) |
| 18 to 34 Years | 4 (2.8%) | 3 (1.7%) |
| 35 to 64 Years | 42 (14.8%) | 24 (10.6%) |
| 65 to 74 Years | 12 (66.7%) | 4 (30.8%) |
| 75 Years and over | 0 (0.0%) | 10 (28.6%) |
Disability Class by Sex by Age in Eagle Butte
Disability Class: Hearing Difficulty
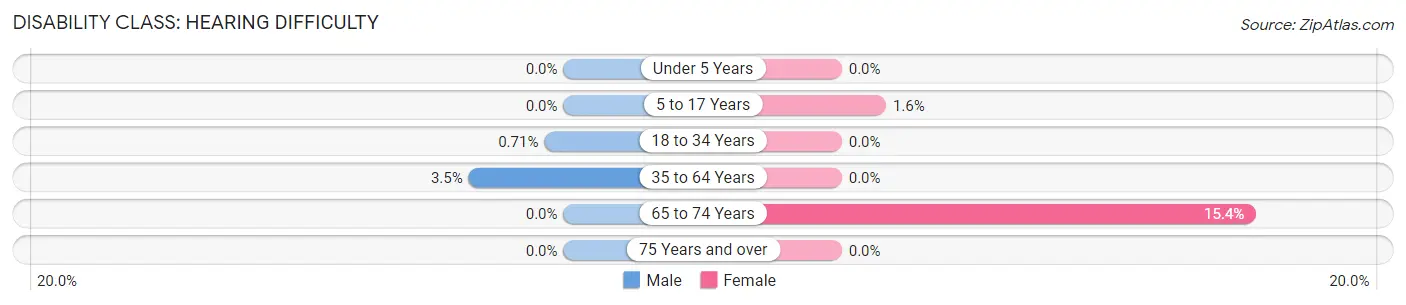
| Age Bracket | Male | Female |
| Under 5 Years | 0 (0.0%) | 0 (0.0%) |
| 5 to 17 Years | 0 (0.0%) | 3 (1.6%) |
| 18 to 34 Years | 1 (0.7%) | 0 (0.0%) |
| 35 to 64 Years | 10 (3.5%) | 0 (0.0%) |
| 65 to 74 Years | 0 (0.0%) | 2 (15.4%) |
| 75 Years and over | 0 (0.0%) | 0 (0.0%) |
Disability Class: Vision Difficulty
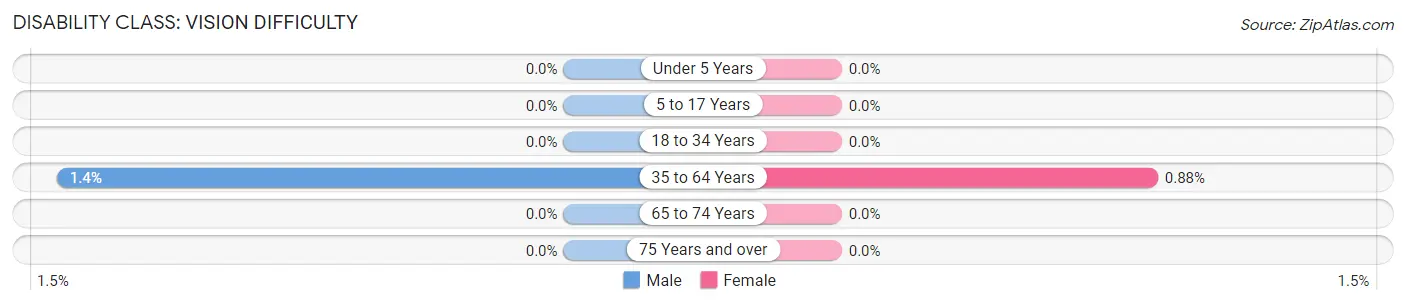
| Age Bracket | Male | Female |
| Under 5 Years | 0 (0.0%) | 0 (0.0%) |
| 5 to 17 Years | 0 (0.0%) | 0 (0.0%) |
| 18 to 34 Years | 0 (0.0%) | 0 (0.0%) |
| 35 to 64 Years | 4 (1.4%) | 2 (0.9%) |
| 65 to 74 Years | 0 (0.0%) | 0 (0.0%) |
| 75 Years and over | 0 (0.0%) | 0 (0.0%) |
Disability Class: Cognitive Difficulty
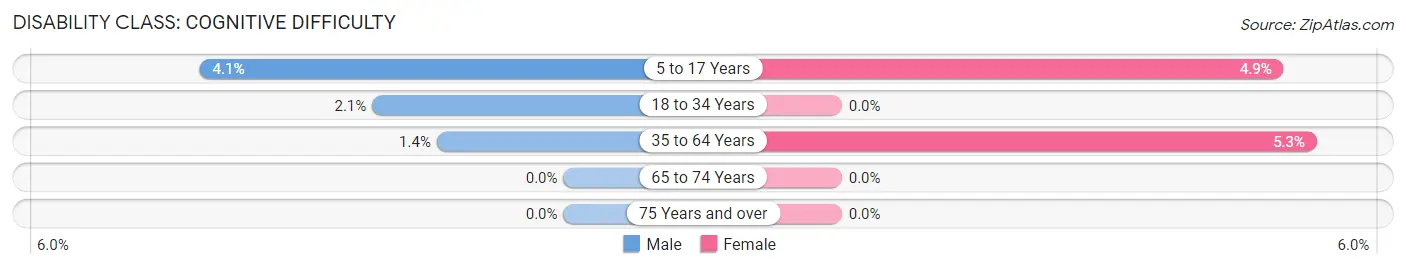
| Age Bracket | Male | Female |
| 5 to 17 Years | 7 (4.1%) | 9 (4.9%) |
| 18 to 34 Years | 3 (2.1%) | 0 (0.0%) |
| 35 to 64 Years | 4 (1.4%) | 12 (5.3%) |
| 65 to 74 Years | 0 (0.0%) | 0 (0.0%) |
| 75 Years and over | 0 (0.0%) | 0 (0.0%) |
Disability Class: Ambulatory Difficulty
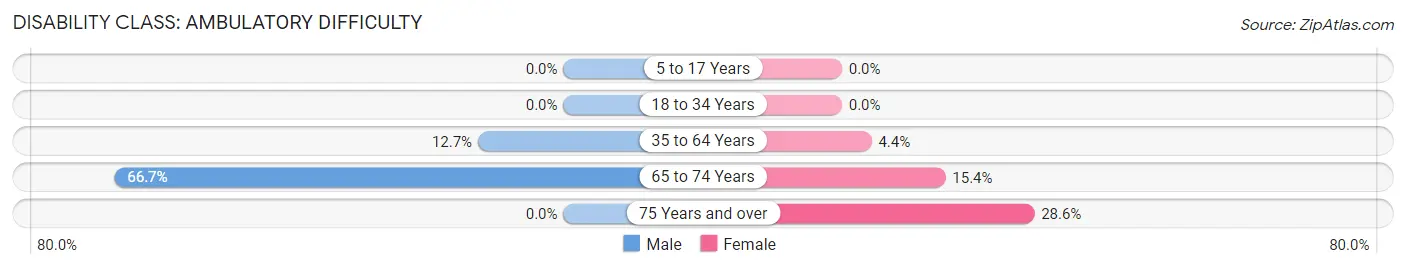
| Age Bracket | Male | Female |
| 5 to 17 Years | 0 (0.0%) | 0 (0.0%) |
| 18 to 34 Years | 0 (0.0%) | 0 (0.0%) |
| 35 to 64 Years | 36 (12.7%) | 10 (4.4%) |
| 65 to 74 Years | 12 (66.7%) | 2 (15.4%) |
| 75 Years and over | 0 (0.0%) | 10 (28.6%) |
Disability Class: Self-Care Difficulty
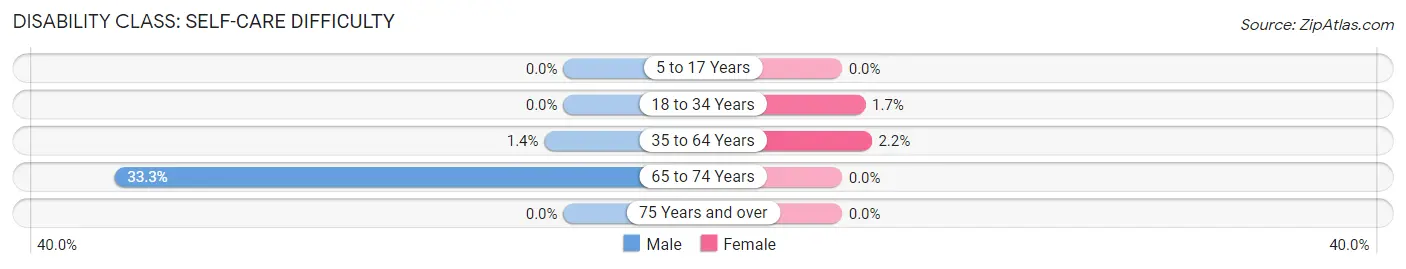
| Age Bracket | Male | Female |
| 5 to 17 Years | 0 (0.0%) | 0 (0.0%) |
| 18 to 34 Years | 0 (0.0%) | 3 (1.7%) |
| 35 to 64 Years | 4 (1.4%) | 5 (2.2%) |
| 65 to 74 Years | 6 (33.3%) | 0 (0.0%) |
| 75 Years and over | 0 (0.0%) | 0 (0.0%) |
Technology Access in Eagle Butte
Computing Device Access in Eagle Butte
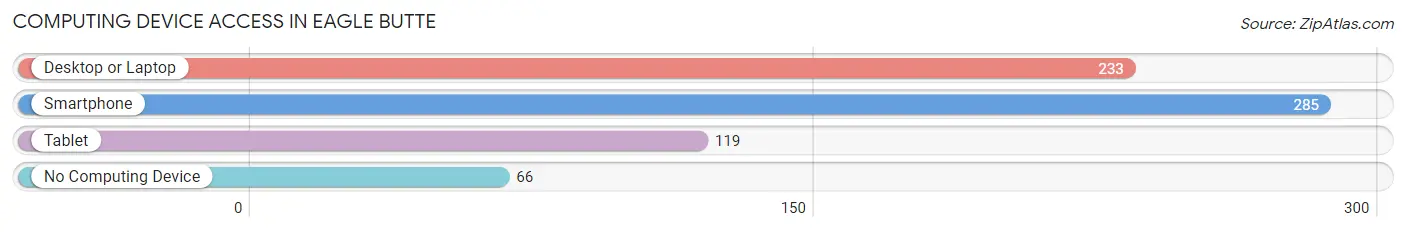
| Device Type | # Households | % Households |
| Desktop or Laptop | 233 | 60.4% |
| Smartphone | 285 | 73.8% |
| Tablet | 119 | 30.8% |
| No Computing Device | 66 | 17.1% |
| Total | 386 | 100.0% |
Internet Access in Eagle Butte
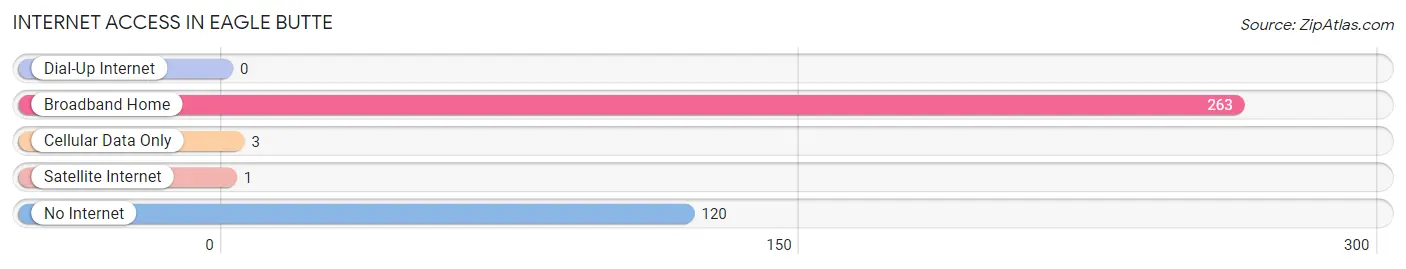
| Internet Type | # Households | % Households |
| Dial-Up Internet | 0 | 0.0% |
| Broadband Home | 263 | 68.1% |
| Cellular Data Only | 3 | 0.8% |
| Satellite Internet | 1 | 0.3% |
| No Internet | 120 | 31.1% |
| Total | 386 | 100.0% |
Eagle Butte Summary
Eagle Butte is a small city located in the Cheyenne River Indian Reservation in Dewey County, South Dakota. It is the county seat of Dewey County and is the largest city in the county. The city is located on the Cheyenne River, approximately 20 miles east of the state capital, Pierre.
History
The area that is now Eagle Butte was originally inhabited by the Lakota Sioux. The city was founded in 1876 by the U.S. Army as a military post. The post was named after the nearby Eagle Butte, a prominent landmark in the area. The post was abandoned in 1881, but the town remained and was incorporated in 1883.
In the early 1900s, the town was a major trading center for the surrounding area. It was also a popular stop for travelers on the Great Northern Railroad. The town was also home to a number of businesses, including a hotel, a bank, a newspaper, and a number of stores.
In the 1950s, the town began to decline as the railroad stopped running and businesses began to close. The population of the town dropped from a peak of 1,000 in the 1940s to just over 500 in the 1970s.
In the 1980s, the town began to experience a resurgence. The population began to grow again and new businesses began to open. The town was also home to a number of cultural events, including the annual Cheyenne River Powwow.
Geography
Eagle Butte is located in the Cheyenne River Indian Reservation in Dewey County, South Dakota. The city is located on the Cheyenne River, approximately 20 miles east of the state capital, Pierre. The city is located at an elevation of 2,845 feet.
The city has a total area of 1.2 square miles, all of which is land. The city is located in a semi-arid climate, with hot summers and cold winters. The average annual precipitation is 16.5 inches.
Economy
The economy of Eagle Butte is largely based on agriculture and tourism. The city is home to a number of agricultural businesses, including a feedlot, a dairy, and a grain elevator. The city is also home to a number of tourist attractions, including the Cheyenne River Powwow and the Eagle Butte National Wildlife Refuge.
The city is also home to a number of businesses, including a hotel, a bank, a newspaper, and a number of stores. The city is also home to a number of government offices, including the Cheyenne River Sioux Tribe headquarters.
Demographics
As of the 2010 census, the population of Eagle Butte was 1,093. The racial makeup of the city was 94.3% Native American, 4.2% White, 0.2% African American, 0.2% Asian, and 0.9% from other races. The median household income was $20,938. The per capita income was $10,938.
Conclusion
Eagle Butte is a small city located in the Cheyenne River Indian Reservation in Dewey County, South Dakota. The city has a long history, dating back to 1876 when it was founded as a military post. The city has experienced a resurgence in recent years, with the population increasing and new businesses opening. The economy of the city is largely based on agriculture and tourism. The population of the city is predominantly Native American, with a median household income of $20,938.
Common Questions
What is Per Capita Income in Eagle Butte?
Per Capita income in Eagle Butte is $16,462.
What is the Median Family Income in Eagle Butte?
Median Family Income in Eagle Butte is $41,875.
What is the Median Household income in Eagle Butte?
Median Household Income in Eagle Butte is $40,556.
What is Income or Wage Gap in Eagle Butte?
Income or Wage Gap in Eagle Butte is 7.2%.
Women in Eagle Butte earn 92.8 cents for every dollar earned by a man.
What is Inequality or Gini Index in Eagle Butte?
Inequality or Gini Index in Eagle Butte is 0.46.
What is the Total Population of Eagle Butte?
Total Population of Eagle Butte is 1,396.
What is the Total Male Population of Eagle Butte?
Total Male Population of Eagle Butte is 685.
What is the Total Female Population of Eagle Butte?
Total Female Population of Eagle Butte is 711.
What is the Ratio of Males per 100 Females in Eagle Butte?
There are 96.34 Males per 100 Females in Eagle Butte.
What is the Ratio of Females per 100 Males in Eagle Butte?
There are 103.80 Females per 100 Males in Eagle Butte.
What is the Median Population Age in Eagle Butte?
Median Population Age in Eagle Butte is 29.8 Years.
What is the Average Family Size in Eagle Butte
Average Family Size in Eagle Butte is 4.1 People.
What is the Average Household Size in Eagle Butte
Average Household Size in Eagle Butte is 3.5 People.
How Large is the Labor Force in Eagle Butte?
There are 689 People in the Labor Forcein in Eagle Butte.
What is the Percentage of People in the Labor Force in Eagle Butte?
70.5% of People are in the Labor Force in Eagle Butte.
What is the Unemployment Rate in Eagle Butte?
Unemployment Rate in Eagle Butte is 37.6%.