Britton, SD Map & Demographics
Britton Map
Britton Overview
$33,126
PER CAPITA INCOME
$93,889
AVG FAMILY INCOME
$69,375
AVG HOUSEHOLD INCOME
32.6%
WAGE / INCOME GAP [ % ]
67.4¢/ $1
WAGE / INCOME GAP [ $ ]
0.38
INEQUALITY / GINI INDEX
1,108
TOTAL POPULATION
491
MALE POPULATION
617
FEMALE POPULATION
79.58
MALES / 100 FEMALES
125.66
FEMALES / 100 MALES
40.9
MEDIAN AGE
3.5
AVG FAMILY SIZE
2.4
AVG HOUSEHOLD SIZE
582
LABOR FORCE [ PEOPLE ]
64.5%
PERCENT IN LABOR FORCE
1.0%
UNEMPLOYMENT RATE
Britton Zip Codes
Britton Area Codes
Income in Britton
Income Overview in Britton
Per Capita Income in Britton is $33,126, while median incomes of families and households are $93,889 and $69,375 respectively.
| Characteristic | Number | Measure |
| Per Capita Income | 1,108 | $33,126 |
| Median Family Income | 236 | $93,889 |
| Mean Family Income | 236 | $104,972 |
| Median Household Income | 432 | $69,375 |
| Mean Household Income | 432 | $77,967 |
| Income Deficit | 236 | $0 |
| Wage / Income Gap (%) | 1,108 | 32.58% |
| Wage / Income Gap ($) | 1,108 | 67.42¢ per $1 |
| Gini / Inequality Index | 1,108 | 0.38 |
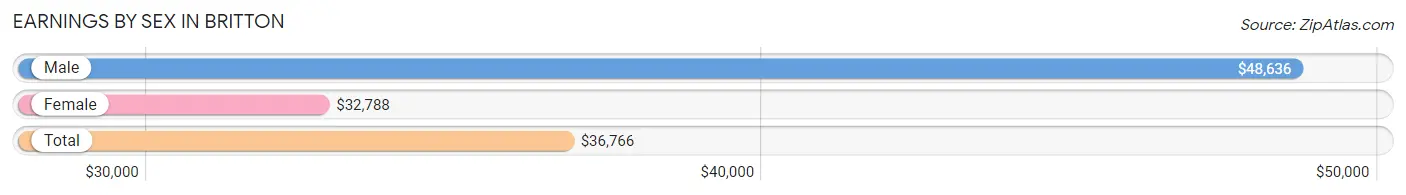
Earnings by Sex in Britton
Average Earnings in Britton are $36,766, $48,636 for men and $32,788 for women, a difference of 32.6%.
| Sex | Number | Average Earnings |
| Male | 320 (50.1%) | $48,636 |
| Female | 319 (49.9%) | $32,788 |
| Total | 639 (100.0%) | $36,766 |
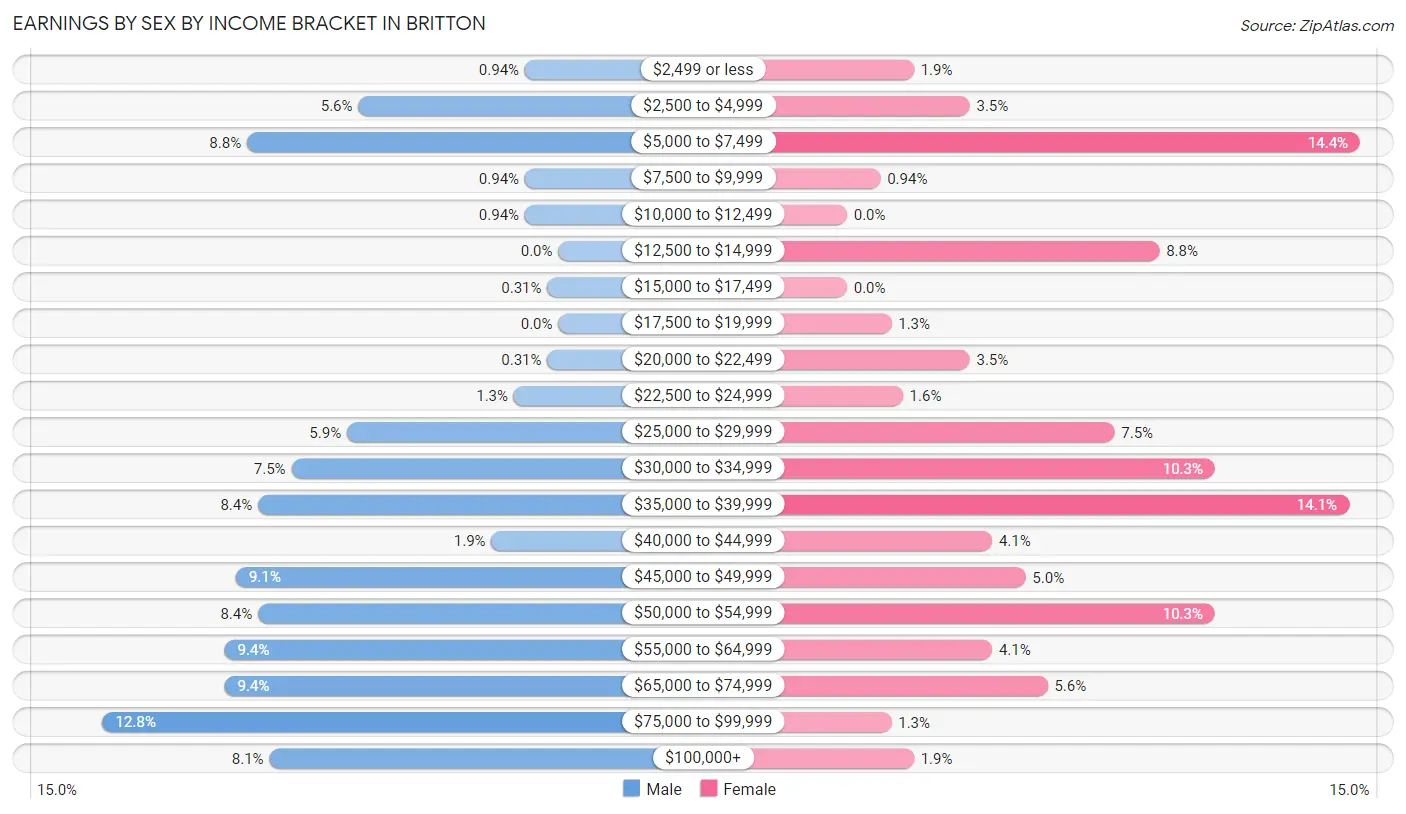
Earnings by Sex by Income Bracket in Britton
The most common earnings brackets in Britton are $75,000 to $99,999 for men (41 | 12.8%) and $5,000 to $7,499 for women (46 | 14.4%).
| Income | Male | Female |
| $2,499 or less | 3 (0.9%) | 6 (1.9%) |
| $2,500 to $4,999 | 18 (5.6%) | 11 (3.5%) |
| $5,000 to $7,499 | 28 (8.7%) | 46 (14.4%) |
| $7,500 to $9,999 | 3 (0.9%) | 3 (0.9%) |
| $10,000 to $12,499 | 3 (0.9%) | 0 (0.0%) |
| $12,500 to $14,999 | 0 (0.0%) | 28 (8.8%) |
| $15,000 to $17,499 | 1 (0.3%) | 0 (0.0%) |
| $17,500 to $19,999 | 0 (0.0%) | 4 (1.3%) |
| $20,000 to $22,499 | 1 (0.3%) | 11 (3.5%) |
| $22,500 to $24,999 | 4 (1.3%) | 5 (1.6%) |
| $25,000 to $29,999 | 19 (5.9%) | 24 (7.5%) |
| $30,000 to $34,999 | 24 (7.5%) | 33 (10.3%) |
| $35,000 to $39,999 | 27 (8.4%) | 45 (14.1%) |
| $40,000 to $44,999 | 6 (1.9%) | 13 (4.1%) |
| $45,000 to $49,999 | 29 (9.1%) | 16 (5.0%) |
| $50,000 to $54,999 | 27 (8.4%) | 33 (10.3%) |
| $55,000 to $64,999 | 30 (9.4%) | 13 (4.1%) |
| $65,000 to $74,999 | 30 (9.4%) | 18 (5.6%) |
| $75,000 to $99,999 | 41 (12.8%) | 4 (1.3%) |
| $100,000+ | 26 (8.1%) | 6 (1.9%) |
| Total | 320 (100.0%) | 319 (100.0%) |
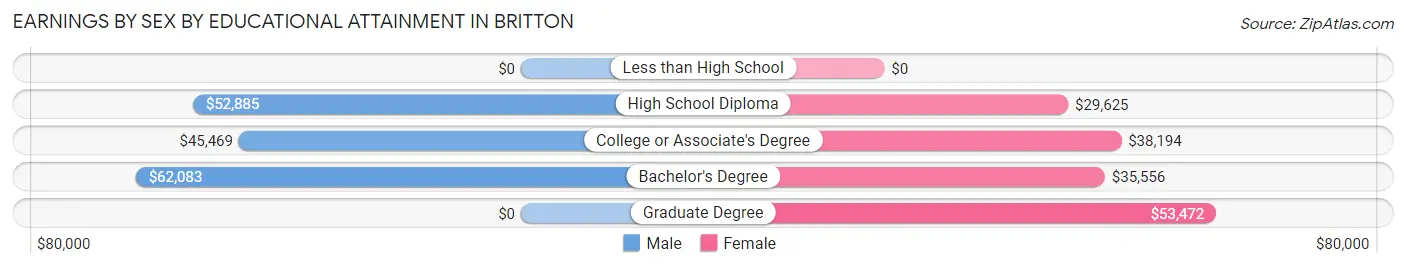
Earnings by Sex by Educational Attainment in Britton
Average earnings in Britton are $51,429 for men and $35,556 for women, a difference of 30.9%. Men with an educational attainment of bachelor's degree enjoy the highest average annual earnings of $62,083, while those with college or associate's degree education earn the least with $45,469. Women with an educational attainment of graduate degree earn the most with the average annual earnings of $53,472, while those with high school diploma education have the smallest earnings of $29,625.
| Educational Attainment | Male Income | Female Income |
| Less than High School | - | - |
| High School Diploma | $52,885 | $29,625 |
| College or Associate's Degree | $45,469 | $38,194 |
| Bachelor's Degree | $62,083 | $35,556 |
| Graduate Degree | - | - |
| Total | $51,429 | $35,556 |
Family Income in Britton
Family Income Brackets in Britton
According to the Britton family income data, there are 64 families falling into the $75,000 to $99,999 income range, which is the most common income bracket and makes up 27.1% of all families.
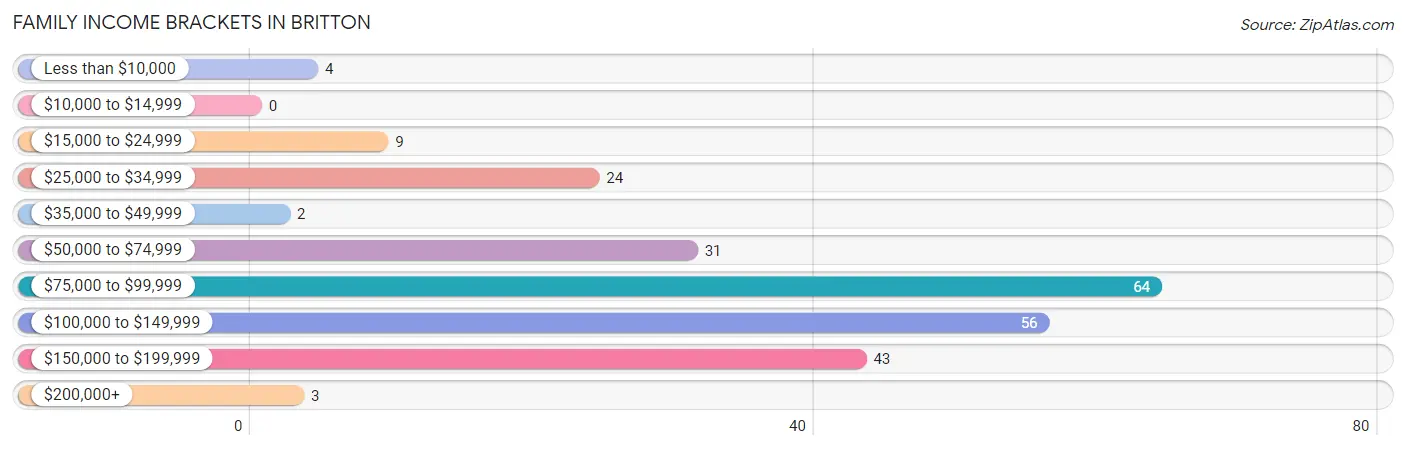
| Income Bracket | # Families | % Families |
| Less than $10,000 | 4 | 1.7% |
| $10,000 to $14,999 | 0 | 0.0% |
| $15,000 to $24,999 | 9 | 3.8% |
| $25,000 to $34,999 | 24 | 10.2% |
| $35,000 to $49,999 | 2 | 0.8% |
| $50,000 to $74,999 | 31 | 13.1% |
| $75,000 to $99,999 | 64 | 27.1% |
| $100,000 to $149,999 | 56 | 23.7% |
| $150,000 to $199,999 | 43 | 18.2% |
| $200,000+ | 3 | 1.3% |
Family Income by Famaliy Size in Britton
4-person families (38 | 16.1%) account for the highest median family income in Britton with $170,147 per family, while 2-person families (128 | 54.2%) have the highest median income of $44,188 per family member.
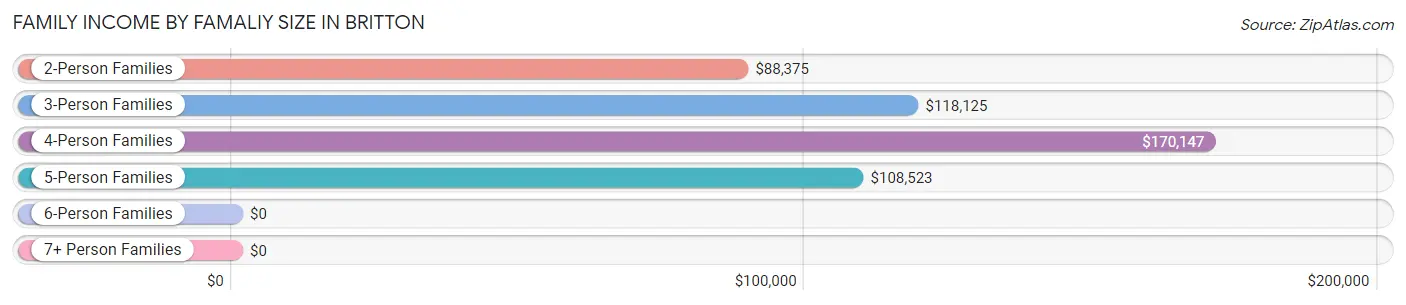
| Income Bracket | # Families | Median Income |
| 2-Person Families | 128 (54.2%) | $88,375 |
| 3-Person Families | 31 (13.1%) | $118,125 |
| 4-Person Families | 38 (16.1%) | $170,147 |
| 5-Person Families | 31 (13.1%) | $108,523 |
| 6-Person Families | 5 (2.1%) | $0 |
| 7+ Person Families | 3 (1.3%) | $0 |
| Total | 236 (100.0%) | $93,889 |
Family Income by Number of Earners in Britton
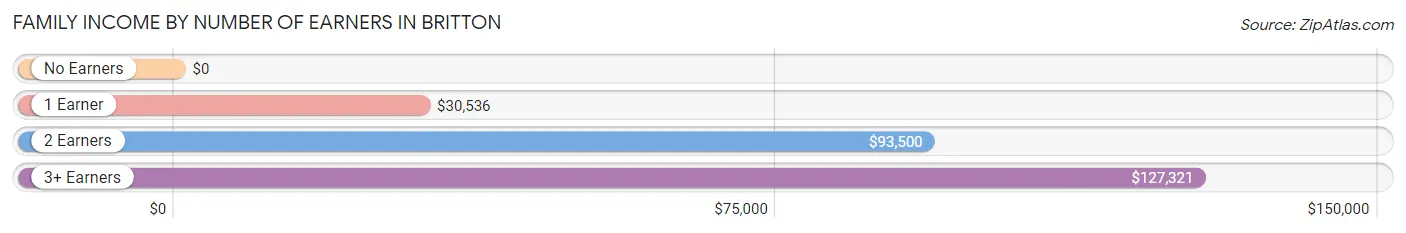
| Number of Earners | # Families | Median Income |
| No Earners | 22 (9.3%) | $0 |
| 1 Earner | 39 (16.5%) | $30,536 |
| 2 Earners | 126 (53.4%) | $93,500 |
| 3+ Earners | 49 (20.8%) | $127,321 |
| Total | 236 (100.0%) | $93,889 |
Household Income in Britton
Household Income Brackets in Britton
With 84 households falling in the category, the $75,000 to $99,999 income range is the most frequent in Britton, accounting for 19.4% of all households. In contrast, only 3 households (0.7%) fall into the $200,000+ income bracket, making it the least populous group.
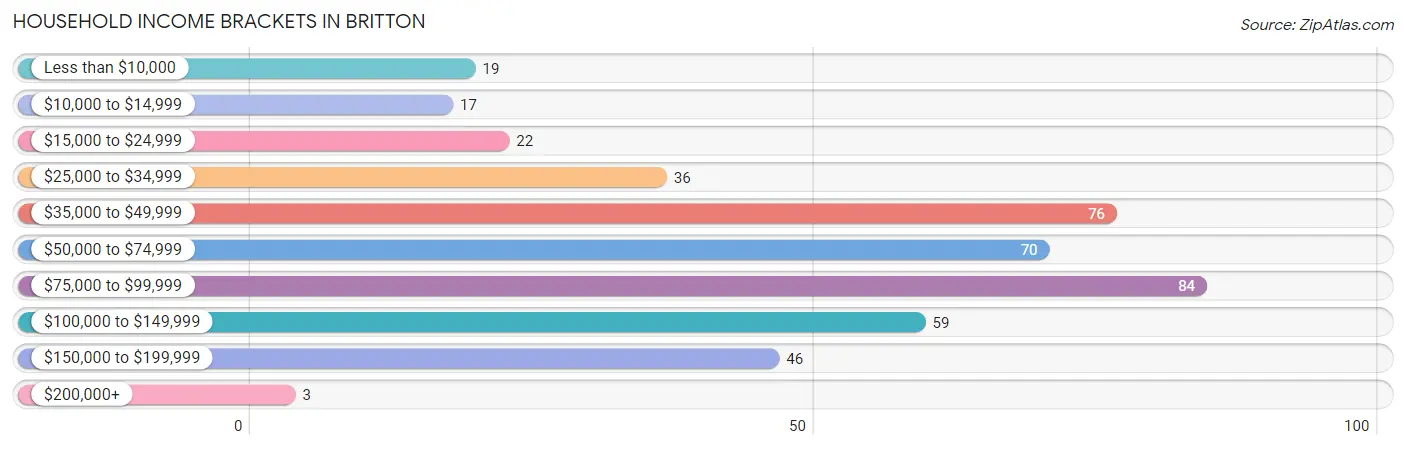
| Income Bracket | # Households | % Households |
| Less than $10,000 | 19 | 4.4% |
| $10,000 to $14,999 | 17 | 3.9% |
| $15,000 to $24,999 | 22 | 5.1% |
| $25,000 to $34,999 | 36 | 8.3% |
| $35,000 to $49,999 | 76 | 17.6% |
| $50,000 to $74,999 | 70 | 16.2% |
| $75,000 to $99,999 | 84 | 19.4% |
| $100,000 to $149,999 | 59 | 13.7% |
| $150,000 to $199,999 | 46 | 10.6% |
| $200,000+ | 3 | 0.7% |
Household Income by Householder Age in Britton
The median household income in Britton is $69,375, with the highest median household income of $88,750 found in the 45 to 64 years age bracket for the primary householder. A total of 138 households (31.9%) fall into this category. Meanwhile, the 15 to 24 years age bracket for the primary householder has the lowest median household income of $0, with 10 households (2.3%) in this group.
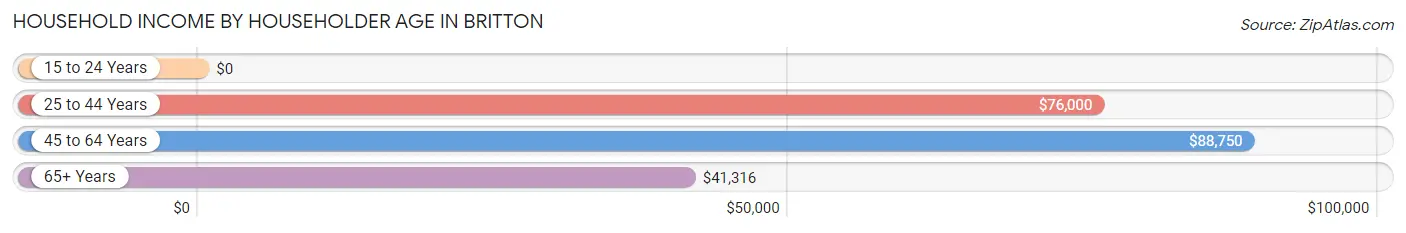
| Income Bracket | # Households | Median Income |
| 15 to 24 Years | 10 (2.3%) | $0 |
| 25 to 44 Years | 168 (38.9%) | $76,000 |
| 45 to 64 Years | 138 (31.9%) | $88,750 |
| 65+ Years | 116 (26.9%) | $41,316 |
| Total | 432 (100.0%) | $69,375 |
Poverty in Britton
Income Below Poverty by Sex and Age in Britton
With 3.8% poverty level for males and 19.5% for females among the residents of Britton, under 5 year old males and 6 to 11 year old females are the most vulnerable to poverty, with 12 males (32.4%) and 16 females (53.3%) in their respective age groups living below the poverty level.
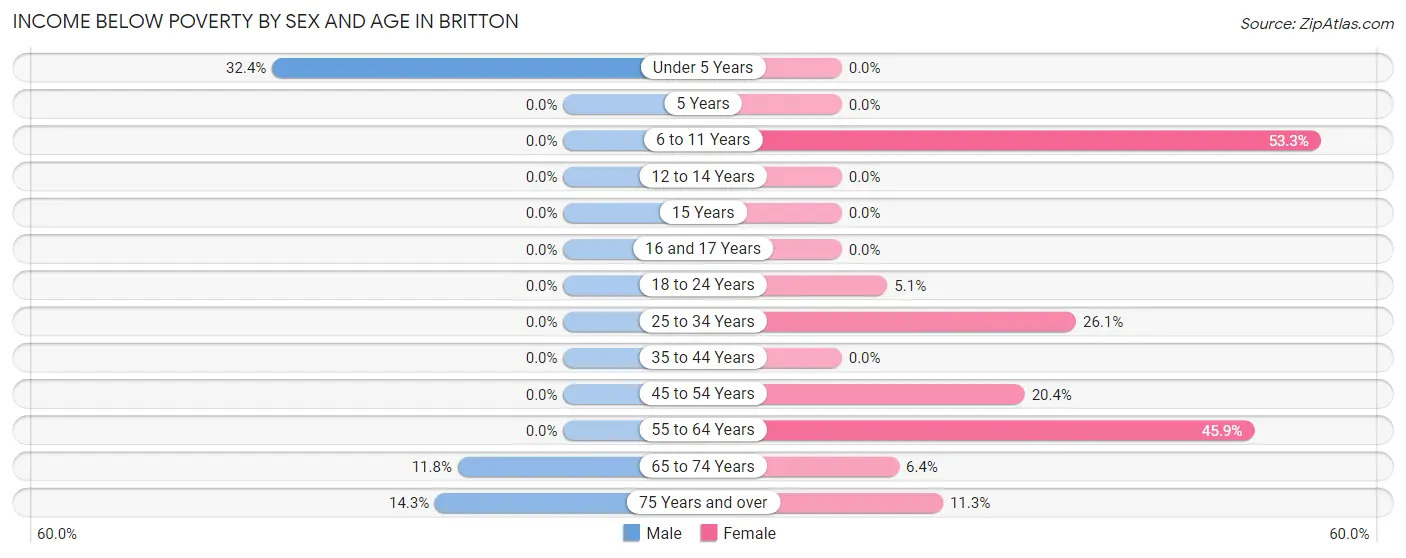
| Age Bracket | Male | Female |
| Under 5 Years | 12 (32.4%) | 0 (0.0%) |
| 5 Years | 0 (0.0%) | 0 (0.0%) |
| 6 to 11 Years | 0 (0.0%) | 16 (53.3%) |
| 12 to 14 Years | 0 (0.0%) | 0 (0.0%) |
| 15 Years | 0 (0.0%) | 0 (0.0%) |
| 16 and 17 Years | 0 (0.0%) | 0 (0.0%) |
| 18 to 24 Years | 0 (0.0%) | 3 (5.1%) |
| 25 to 34 Years | 0 (0.0%) | 24 (26.1%) |
| 35 to 44 Years | 0 (0.0%) | 0 (0.0%) |
| 45 to 54 Years | 0 (0.0%) | 11 (20.4%) |
| 55 to 64 Years | 0 (0.0%) | 45 (45.9%) |
| 65 to 74 Years | 2 (11.8%) | 3 (6.4%) |
| 75 Years and over | 4 (14.3%) | 8 (11.3%) |
| Total | 18 (3.8%) | 110 (19.5%) |
Income Above Poverty by Sex and Age in Britton
According to the poverty statistics in Britton, males aged 5 years and females aged under 5 years are the age groups that are most secure financially, with 100.0% of males and 100.0% of females in these age groups living above the poverty line.
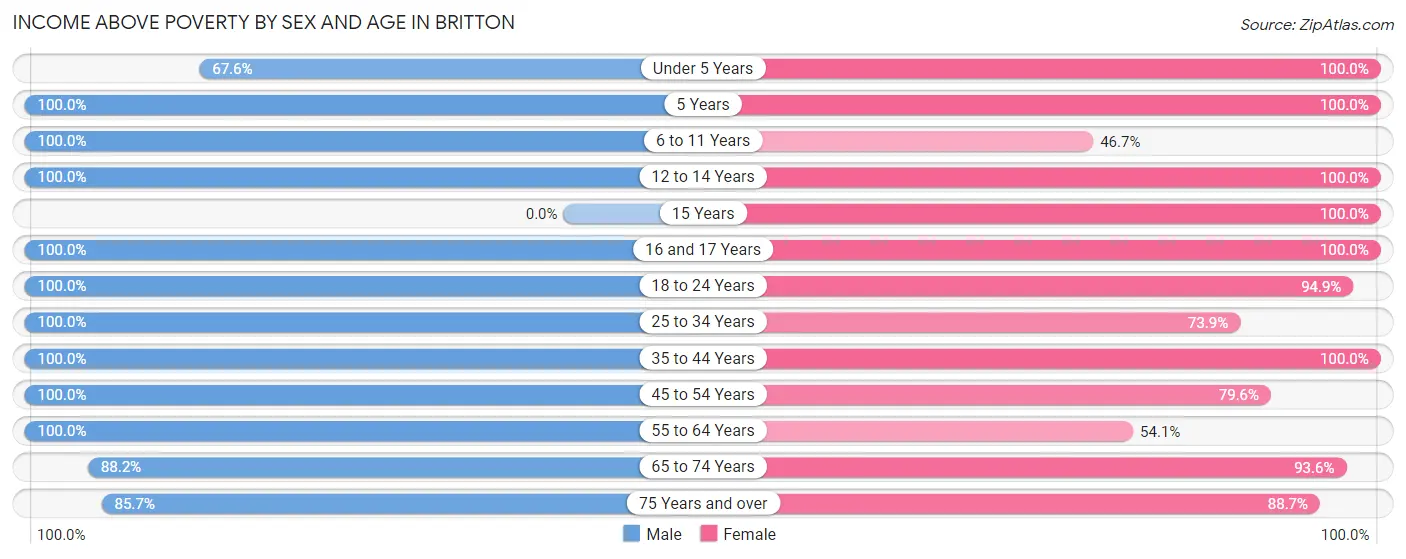
| Age Bracket | Male | Female |
| Under 5 Years | 25 (67.6%) | 32 (100.0%) |
| 5 Years | 5 (100.0%) | 12 (100.0%) |
| 6 to 11 Years | 34 (100.0%) | 14 (46.7%) |
| 12 to 14 Years | 22 (100.0%) | 21 (100.0%) |
| 15 Years | 0 (0.0%) | 3 (100.0%) |
| 16 and 17 Years | 31 (100.0%) | 3 (100.0%) |
| 18 to 24 Years | 33 (100.0%) | 56 (94.9%) |
| 25 to 34 Years | 76 (100.0%) | 68 (73.9%) |
| 35 to 44 Years | 76 (100.0%) | 43 (100.0%) |
| 45 to 54 Years | 35 (100.0%) | 43 (79.6%) |
| 55 to 64 Years | 77 (100.0%) | 53 (54.1%) |
| 65 to 74 Years | 15 (88.2%) | 44 (93.6%) |
| 75 Years and over | 24 (85.7%) | 63 (88.7%) |
| Total | 453 (96.2%) | 455 (80.5%) |
Income Below Poverty Among Married-Couple Families in Britton
The poverty statistics for married-couple families in Britton show that 2.0% or 4 of the total 203 families live below the poverty line. Families with no children have the highest poverty rate of 3.0%, comprising of 4 families. On the other hand, families with 1 or 2 children have the lowest poverty rate of 0.0%, which includes 0 families.
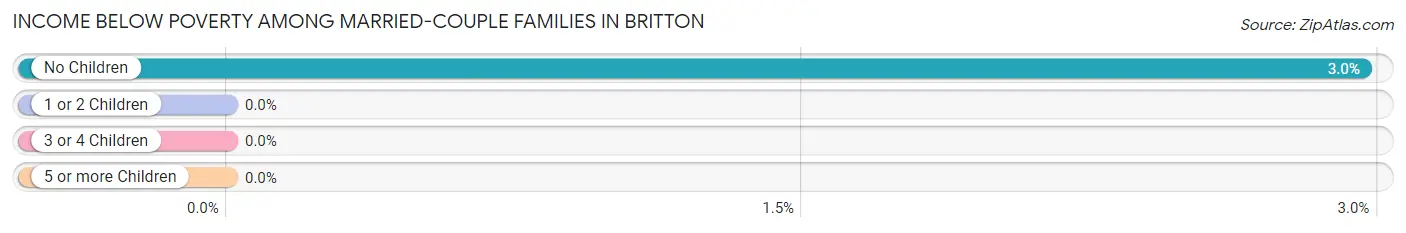
| Children | Above Poverty | Below Poverty |
| No Children | 131 (97.0%) | 4 (3.0%) |
| 1 or 2 Children | 29 (100.0%) | 0 (0.0%) |
| 3 or 4 Children | 36 (100.0%) | 0 (0.0%) |
| 5 or more Children | 3 (100.0%) | 0 (0.0%) |
| Total | 199 (98.0%) | 4 (2.0%) |
Income Below Poverty Among Single-Parent Households in Britton
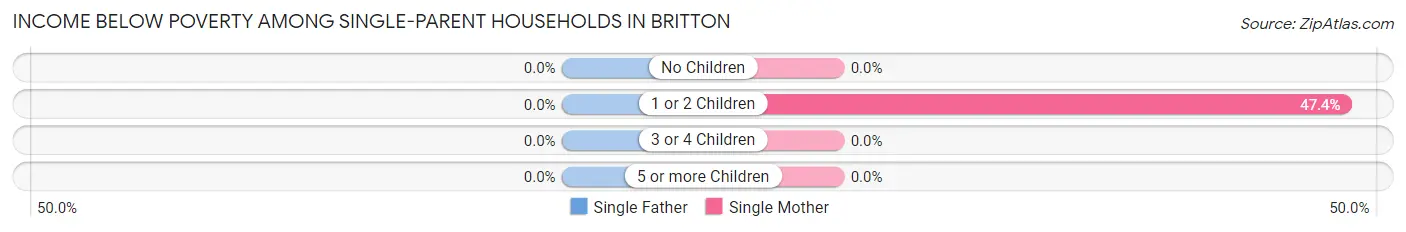
| Children | Single Father | Single Mother |
| No Children | 0 (0.0%) | 0 (0.0%) |
| 1 or 2 Children | 0 (0.0%) | 9 (47.4%) |
| 3 or 4 Children | 0 (0.0%) | 0 (0.0%) |
| 5 or more Children | 0 (0.0%) | 0 (0.0%) |
| Total | 0 (0.0%) | 9 (39.1%) |
Income Below Poverty Among Married-Couple vs Single-Parent Households in Britton
The poverty data for Britton shows that 4 of the married-couple family households (2.0%) and 9 of the single-parent households (27.3%) are living below the poverty level. Within the married-couple family households, those with no children have the highest poverty rate, with 4 households (3.0%) falling below the poverty line. Among the single-parent households, those with 1 or 2 children have the highest poverty rate, with 9 household (37.5%) living below poverty.
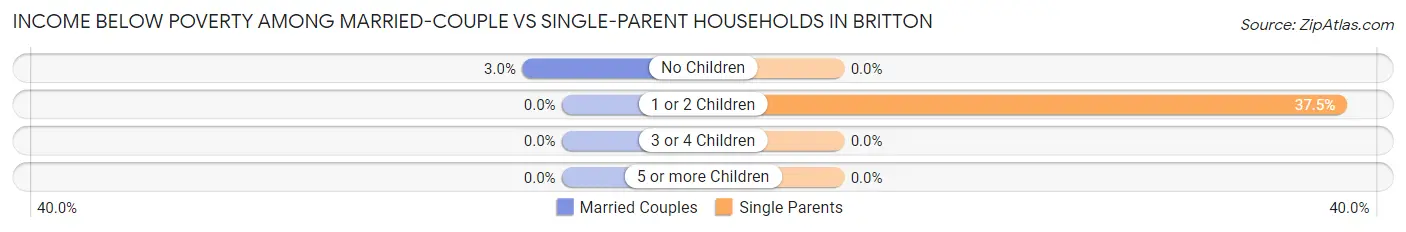
| Children | Married-Couple Families | Single-Parent Households |
| No Children | 4 (3.0%) | 0 (0.0%) |
| 1 or 2 Children | 0 (0.0%) | 9 (37.5%) |
| 3 or 4 Children | 0 (0.0%) | 0 (0.0%) |
| 5 or more Children | 0 (0.0%) | 0 (0.0%) |
| Total | 4 (2.0%) | 9 (27.3%) |
Race in Britton
The most populous races in Britton are White / Caucasian (961 | 86.7%), Two or more Races (83 | 7.5%), and Hispanic or Latino (74 | 6.7%).
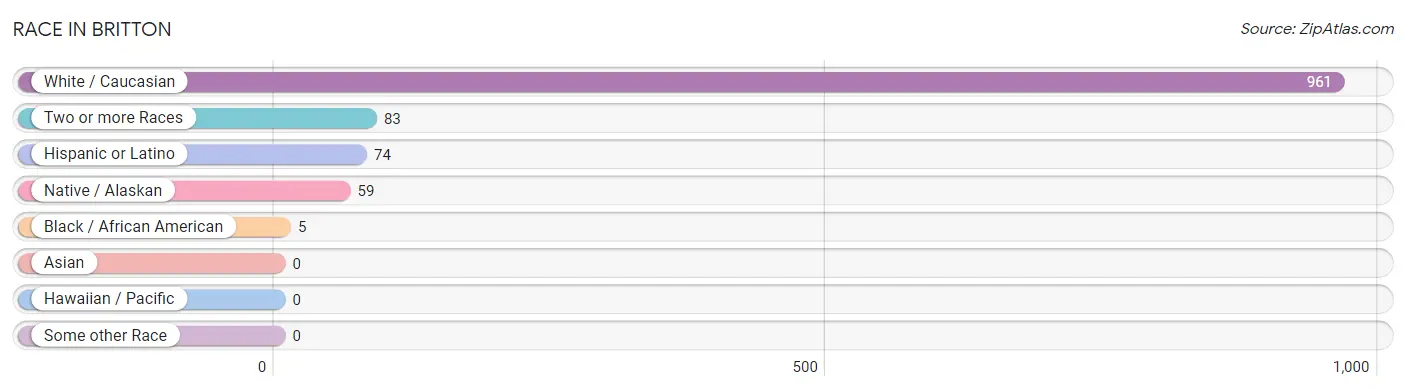
| Race | # Population | % Population |
| Asian | 0 | 0.0% |
| Black / African American | 5 | 0.4% |
| Hawaiian / Pacific | 0 | 0.0% |
| Hispanic or Latino | 74 | 6.7% |
| Native / Alaskan | 59 | 5.3% |
| White / Caucasian | 961 | 86.7% |
| Two or more Races | 83 | 7.5% |
| Some other Race | 0 | 0.0% |
| Total | 1,108 | 100.0% |
Ancestry in Britton
The most populous ancestries reported in Britton are German (496 | 44.8%), Norwegian (358 | 32.3%), Czech (61 | 5.5%), English (54 | 4.9%), and Swedish (53 | 4.8%), together accounting for 92.2% of all Britton residents.
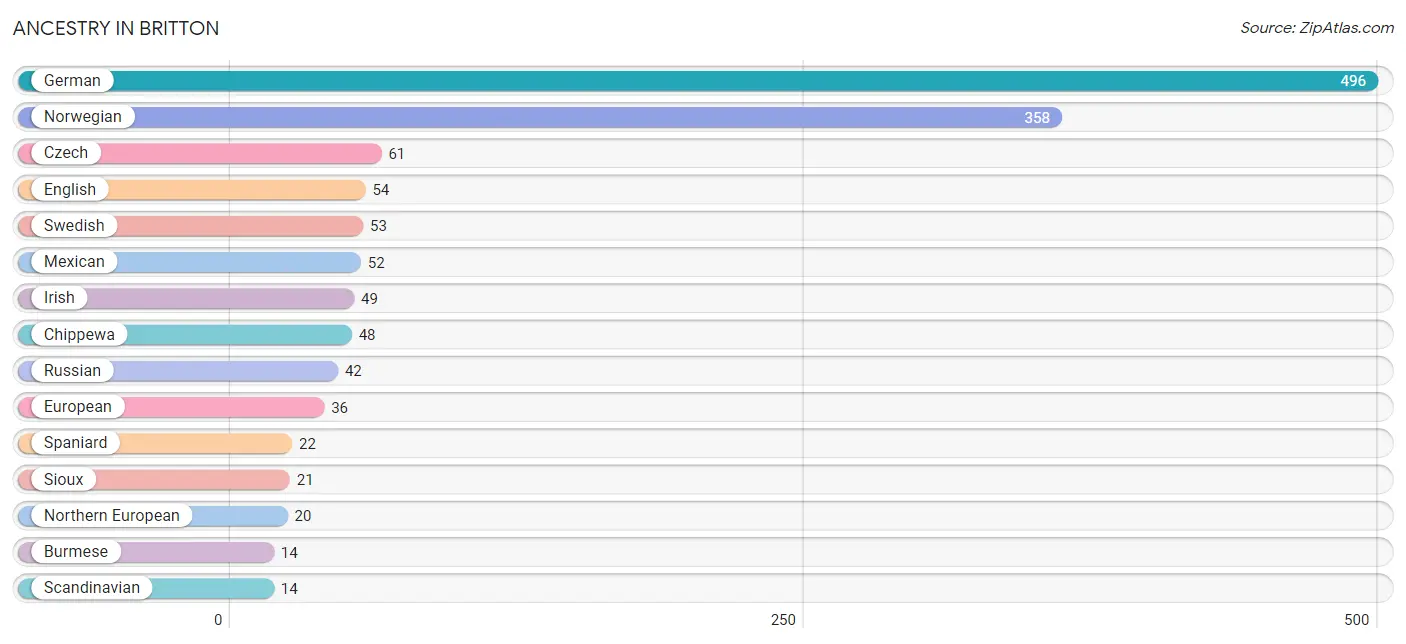
| Ancestry | # Population | % Population |
| American | 4 | 0.4% |
| Arab | 8 | 0.7% |
| British | 6 | 0.5% |
| Burmese | 14 | 1.3% |
| Chippewa | 48 | 4.3% |
| Czech | 61 | 5.5% |
| Czechoslovakian | 11 | 1.0% |
| Danish | 2 | 0.2% |
| English | 54 | 4.9% |
| European | 36 | 3.3% |
| Finnish | 6 | 0.5% |
| French | 4 | 0.4% |
| French Canadian | 4 | 0.4% |
| German | 496 | 44.8% |
| Greek | 9 | 0.8% |
| Hungarian | 11 | 1.0% |
| Irish | 49 | 4.4% |
| Italian | 2 | 0.2% |
| Mexican | 52 | 4.7% |
| Native Hawaiian | 3 | 0.3% |
| Northern European | 20 | 1.8% |
| Norwegian | 358 | 32.3% |
| Polish | 2 | 0.2% |
| Russian | 42 | 3.8% |
| Scandinavian | 14 | 1.3% |
| Scotch-Irish | 3 | 0.3% |
| Scottish | 3 | 0.3% |
| Sioux | 21 | 1.9% |
| Somali | 1 | 0.1% |
| Spaniard | 22 | 2.0% |
| Subsaharan African | 1 | 0.1% |
| Swedish | 53 | 4.8% |
| Swiss | 2 | 0.2% |
| Syrian | 8 | 0.7% | View All 34 Rows |
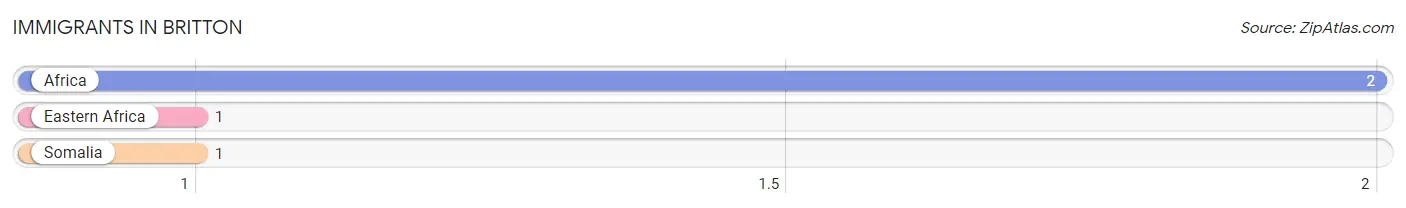
Immigrants in Britton
The most numerous immigrant groups reported in Britton came from Africa (2 | 0.2%), Eastern Africa (1 | 0.1%), and Somalia (1 | 0.1%), together accounting for 0.4% of all Britton residents.
| Immigration Origin | # Population | % Population |
| Africa | 2 | 0.2% |
| Eastern Africa | 1 | 0.1% |
| Somalia | 1 | 0.1% | View All 3 Rows |
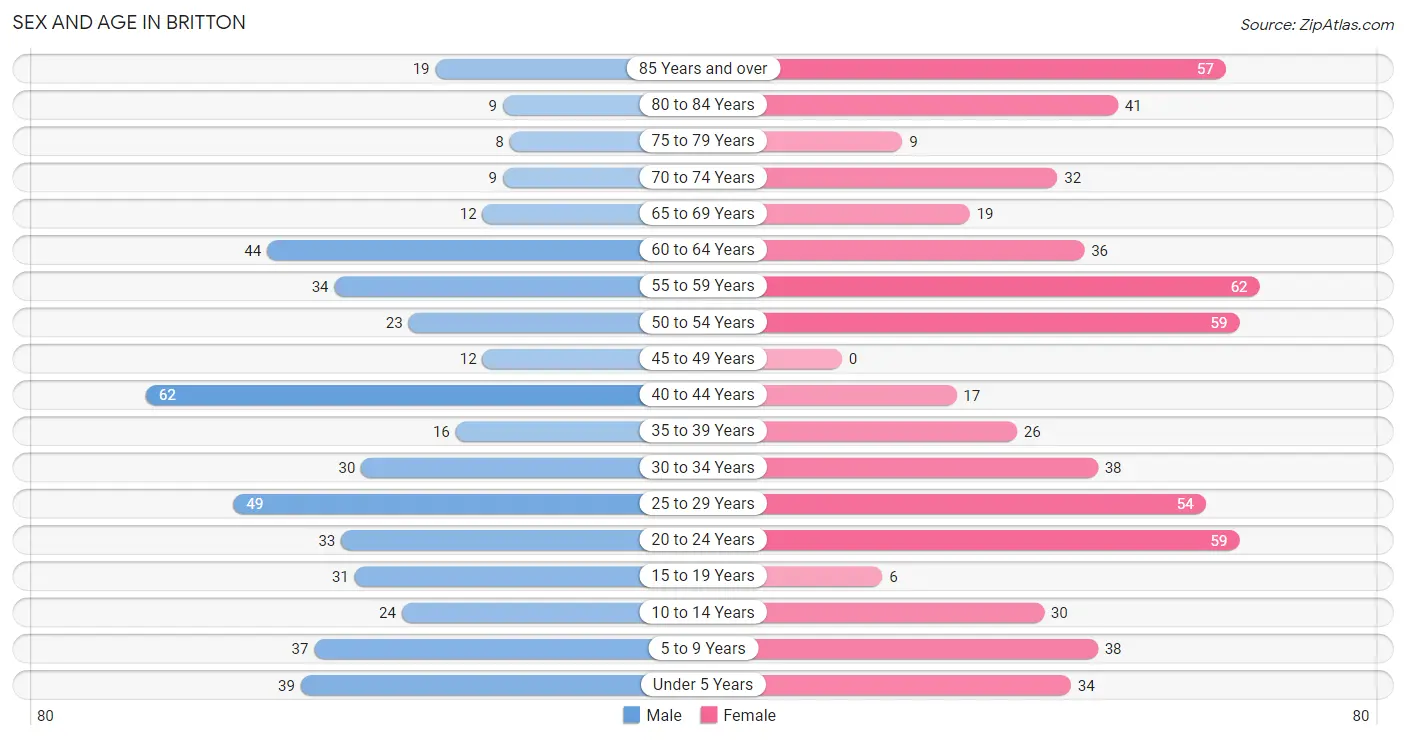
Sex and Age in Britton
Sex and Age in Britton
The most populous age groups in Britton are 40 to 44 Years (62 | 12.6%) for men and 55 to 59 Years (62 | 10.1%) for women.
| Age Bracket | Male | Female |
| Under 5 Years | 39 (7.9%) | 34 (5.5%) |
| 5 to 9 Years | 37 (7.5%) | 38 (6.2%) |
| 10 to 14 Years | 24 (4.9%) | 30 (4.9%) |
| 15 to 19 Years | 31 (6.3%) | 6 (1.0%) |
| 20 to 24 Years | 33 (6.7%) | 59 (9.6%) |
| 25 to 29 Years | 49 (10.0%) | 54 (8.7%) |
| 30 to 34 Years | 30 (6.1%) | 38 (6.2%) |
| 35 to 39 Years | 16 (3.3%) | 26 (4.2%) |
| 40 to 44 Years | 62 (12.6%) | 17 (2.8%) |
| 45 to 49 Years | 12 (2.4%) | 0 (0.0%) |
| 50 to 54 Years | 23 (4.7%) | 59 (9.6%) |
| 55 to 59 Years | 34 (6.9%) | 62 (10.1%) |
| 60 to 64 Years | 44 (9.0%) | 36 (5.8%) |
| 65 to 69 Years | 12 (2.4%) | 19 (3.1%) |
| 70 to 74 Years | 9 (1.8%) | 32 (5.2%) |
| 75 to 79 Years | 8 (1.6%) | 9 (1.5%) |
| 80 to 84 Years | 9 (1.8%) | 41 (6.7%) |
| 85 Years and over | 19 (3.9%) | 57 (9.2%) |
| Total | 491 (100.0%) | 617 (100.0%) |
Families and Households in Britton
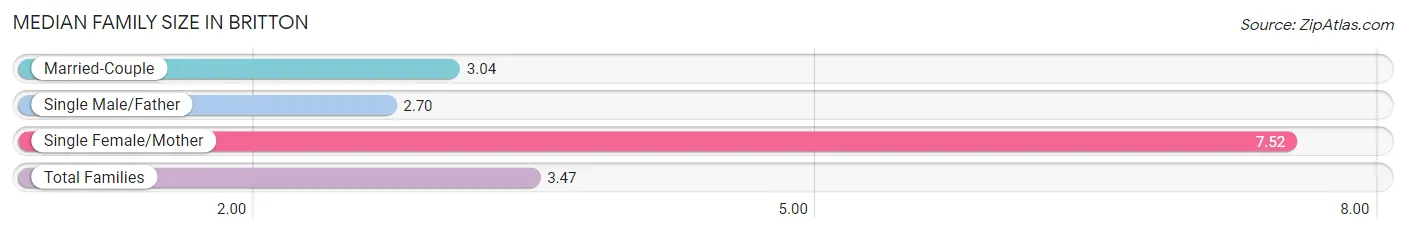
Median Family Size in Britton
The median family size in Britton is 3.47 persons per family, with single female/mother families (23 | 9.8%) accounting for the largest median family size of 7.52 persons per family. On the other hand, single male/father families (10 | 4.2%) represent the smallest median family size with 2.70 persons per family.
| Family Type | # Families | Family Size |
| Married-Couple | 203 (86.0%) | 3.04 |
| Single Male/Father | 10 (4.2%) | 2.70 |
| Single Female/Mother | 23 (9.8%) | 7.52 |
| Total Families | 236 (100.0%) | 3.47 |
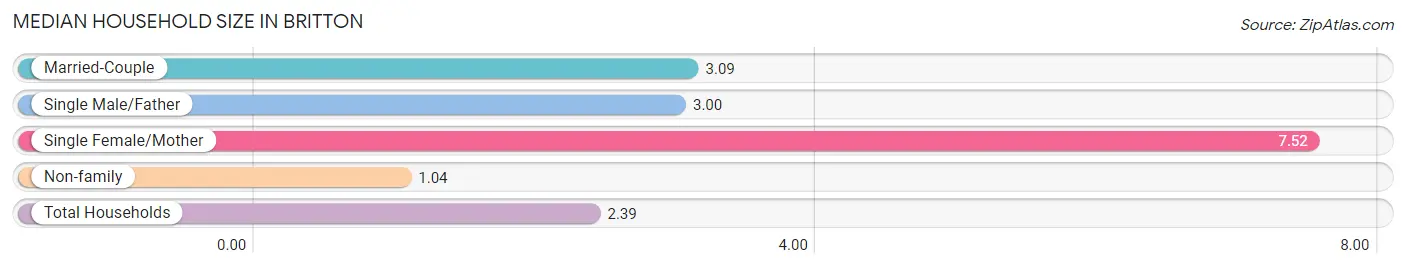
Median Household Size in Britton
The median household size in Britton is 2.39 persons per household, with single female/mother households (23 | 5.3%) accounting for the largest median household size of 7.52 persons per household. non-family households (196 | 45.4%) represent the smallest median household size with 1.04 persons per household.
| Household Type | # Households | Household Size |
| Married-Couple | 203 (47.0%) | 3.09 |
| Single Male/Father | 10 (2.3%) | 3.00 |
| Single Female/Mother | 23 (5.3%) | 7.52 |
| Non-family | 196 (45.4%) | 1.04 |
| Total Households | 432 (100.0%) | 2.39 |
Household Size by Marriage Status in Britton
Out of a total of 432 households in Britton, 236 (54.6%) are family households, while 196 (45.4%) are nonfamily households. The most numerous type of family households are 2-person households, comprising 123, and the most common type of nonfamily households are 1-person households, comprising 190.
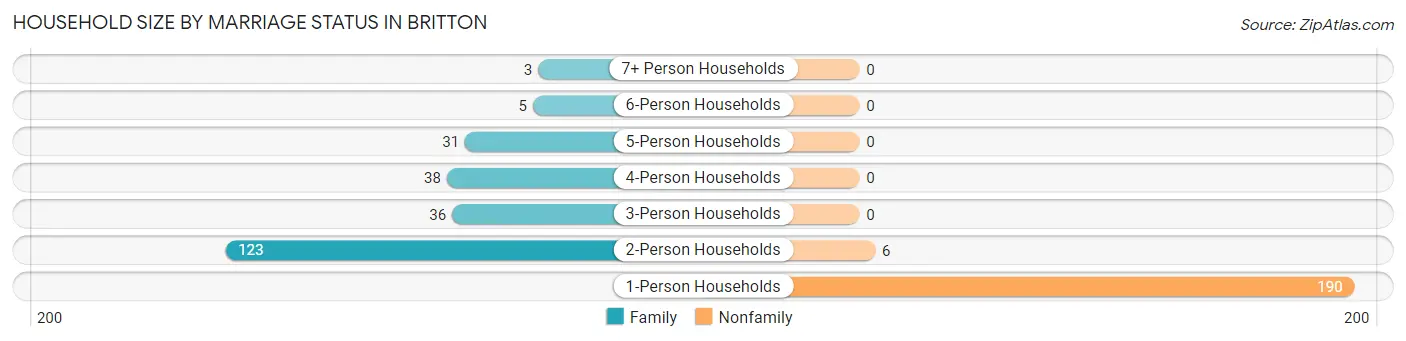
| Household Size | Family Households | Nonfamily Households |
| 1-Person Households | - | 190 (44.0%) |
| 2-Person Households | 123 (28.5%) | 6 (1.4%) |
| 3-Person Households | 36 (8.3%) | 0 (0.0%) |
| 4-Person Households | 38 (8.8%) | 0 (0.0%) |
| 5-Person Households | 31 (7.2%) | 0 (0.0%) |
| 6-Person Households | 5 (1.2%) | 0 (0.0%) |
| 7+ Person Households | 3 (0.7%) | 0 (0.0%) |
| Total | 236 (54.6%) | 196 (45.4%) |
Female Fertility in Britton
Fertility by Age in Britton
Average fertility rate in Britton is 74.0 births per 1,000 women. Women in the age bracket of 35 to 50 years have the highest fertility rate with 255.0 births per 1,000 women. Women in the age bracket of 35 to 50 years acount for 80.0% of all women with births.
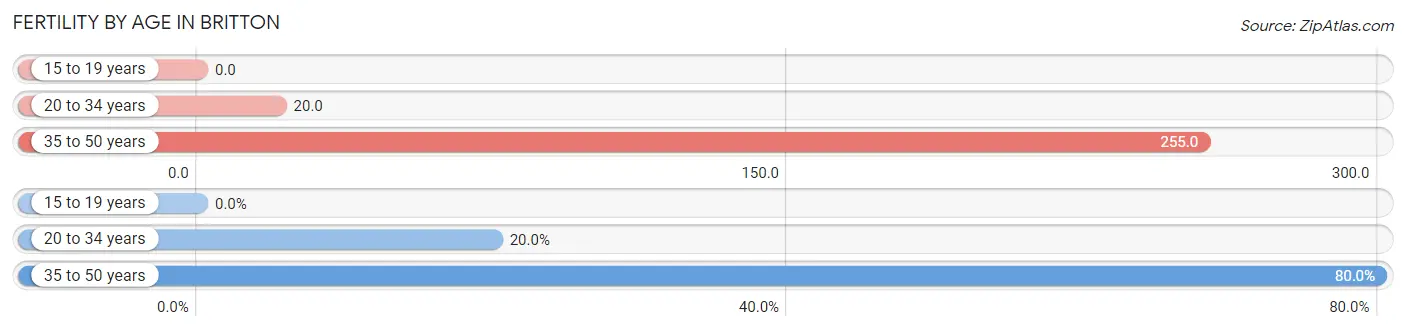
| Age Bracket | Women with Births | Births / 1,000 Women |
| 15 to 19 years | 0 (0.0%) | 0.0 |
| 20 to 34 years | 3 (20.0%) | 20.0 |
| 35 to 50 years | 12 (80.0%) | 255.0 |
| Total | 15 (100.0%) | 74.0 |
Fertility by Age by Marriage Status in Britton
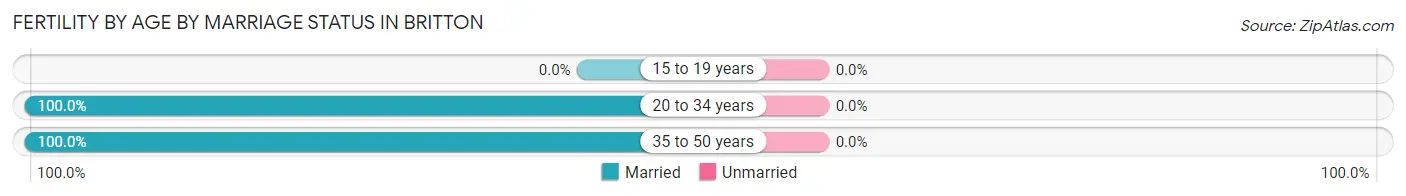
| Age Bracket | Married | Unmarried |
| 15 to 19 years | 0 (0.0%) | 0 (0.0%) |
| 20 to 34 years | 3 (100.0%) | 0 (0.0%) |
| 35 to 50 years | 12 (100.0%) | 0 (0.0%) |
| Total | 15 (100.0%) | 0 (0.0%) |
Fertility by Education in Britton
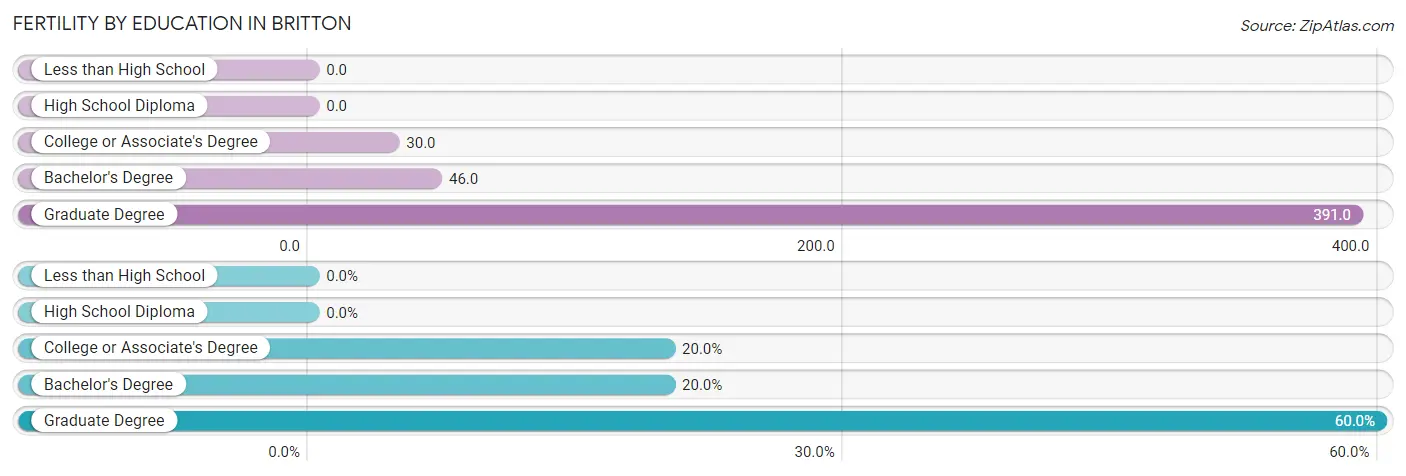
| Educational Attainment | Women with Births | Births / 1,000 Women |
| Less than High School | 0 (0.0%) | 0.0 |
| High School Diploma | 0 (0.0%) | 0.0 |
| College or Associate's Degree | 3 (20.0%) | 30.0 |
| Bachelor's Degree | 3 (20.0%) | 46.0 |
| Graduate Degree | 9 (60.0%) | 391.0 |
| Total | 15 (100.0%) | 74.0 |
Fertility by Education by Marriage Status in Britton
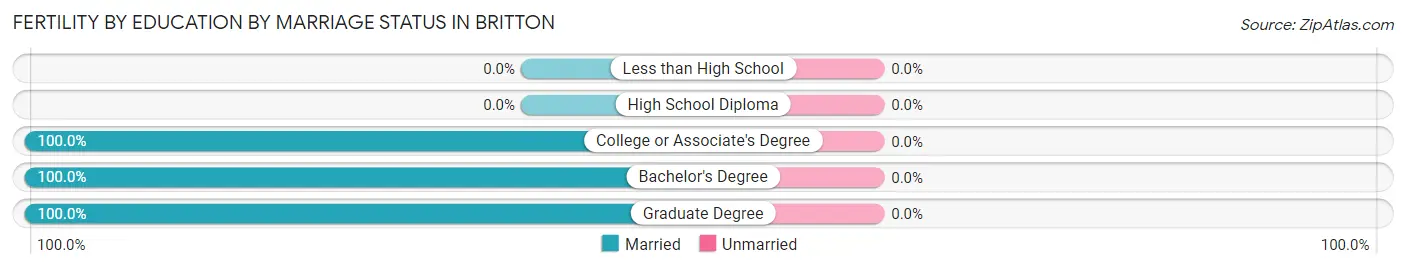
| Educational Attainment | Married | Unmarried |
| Less than High School | 0 (0.0%) | 0 (0.0%) |
| High School Diploma | 0 (0.0%) | 0 (0.0%) |
| College or Associate's Degree | 3 (100.0%) | 0 (0.0%) |
| Bachelor's Degree | 3 (100.0%) | 0 (0.0%) |
| Graduate Degree | 9 (100.0%) | 0 (0.0%) |
| Total | 15 (100.0%) | 0 (0.0%) |
Employment Characteristics in Britton
Employment by Class of Employer in Britton
Among the 574 employed individuals in Britton, private company employees (410 | 71.4%), not-for-profit organizations (65 | 11.3%), and local government employees (45 | 7.8%) make up the most common classes of employment.
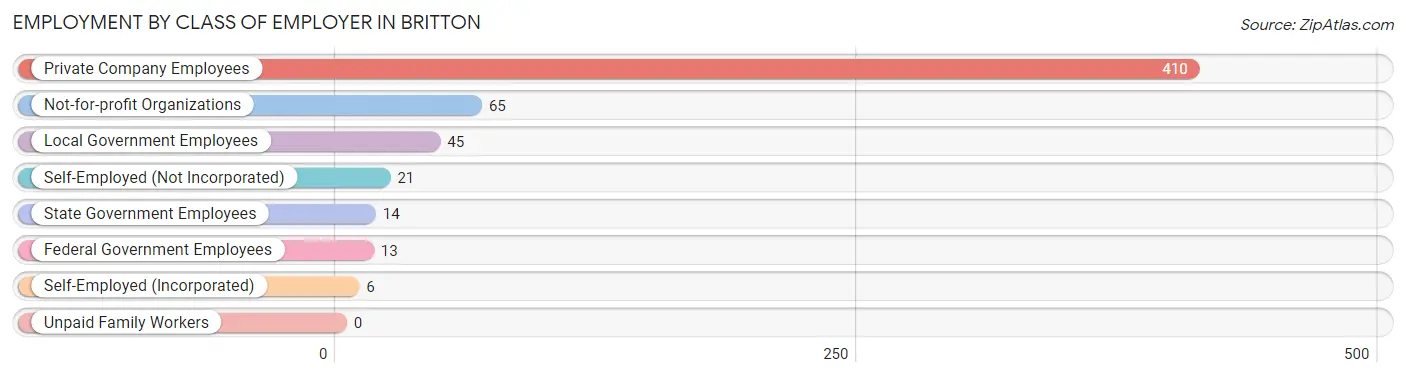
| Employer Class | # Employees | % Employees |
| Private Company Employees | 410 | 71.4% |
| Self-Employed (Incorporated) | 6 | 1.1% |
| Self-Employed (Not Incorporated) | 21 | 3.7% |
| Not-for-profit Organizations | 65 | 11.3% |
| Local Government Employees | 45 | 7.8% |
| State Government Employees | 14 | 2.4% |
| Federal Government Employees | 13 | 2.3% |
| Unpaid Family Workers | 0 | 0.0% |
| Total | 574 | 100.0% |
Employment Status by Age in Britton
According to the labor force statistics for Britton, out of the total population over 16 years of age (903), 64.5% or 582 individuals are in the labor force, with 1.0% or 6 of them unemployed. The age group with the highest labor force participation rate is 30 to 34 years, with 98.5% or 67 individuals in the labor force. Within the labor force, the 45 to 54 years age range has the highest percentage of unemployed individuals, with 6.9% or 6 of them being unemployed.
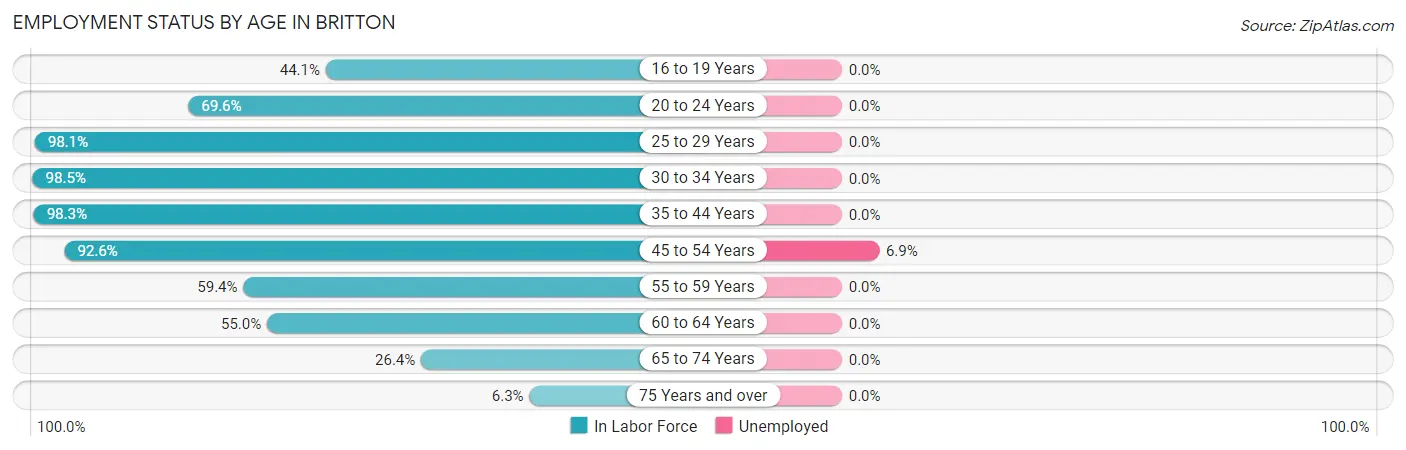
| Age Bracket | In Labor Force | Unemployed |
| 16 to 19 Years | 15 (44.1%) | 0 (0.0%) |
| 20 to 24 Years | 64 (69.6%) | 0 (0.0%) |
| 25 to 29 Years | 101 (98.1%) | 0 (0.0%) |
| 30 to 34 Years | 67 (98.5%) | 0 (0.0%) |
| 35 to 44 Years | 119 (98.3%) | 0 (0.0%) |
| 45 to 54 Years | 87 (92.6%) | 6 (6.9%) |
| 55 to 59 Years | 57 (59.4%) | 0 (0.0%) |
| 60 to 64 Years | 44 (55.0%) | 0 (0.0%) |
| 65 to 74 Years | 19 (26.4%) | 0 (0.0%) |
| 75 Years and over | 9 (6.3%) | 0 (0.0%) |
| Total | 582 (64.5%) | 6 (1.0%) |
Employment Status by Educational Attainment in Britton
According to labor force statistics for Britton, 84.5% of individuals (475) out of the total population between 25 and 64 years of age (562) are in the labor force, with 1.3% or 6 of them being unemployed. The group with the highest labor force participation rate are those with the educational attainment of bachelor's degree or higher, with 98.5% or 200 individuals in the labor force. Within the labor force, individuals with high school diploma education have the highest percentage of unemployment, with 5.9% or 6 of them being unemployed.
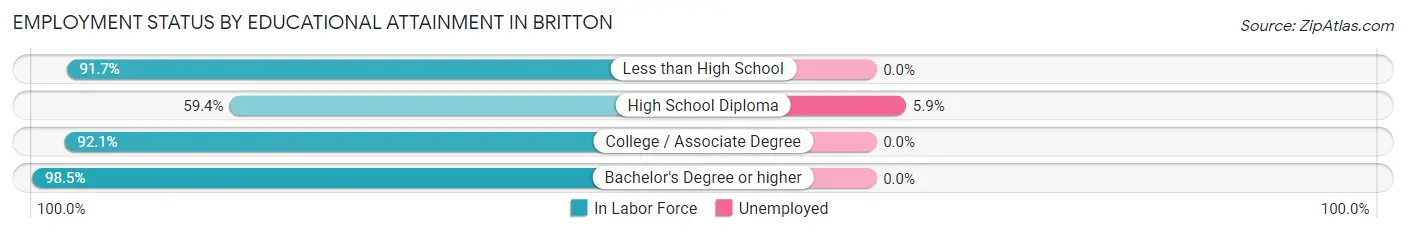
| Educational Attainment | In Labor Force | Unemployed |
| Less than High School | 11 (91.7%) | 0 (0.0%) |
| High School Diploma | 101 (59.4%) | 10 (5.9%) |
| College / Associate Degree | 163 (92.1%) | 0 (0.0%) |
| Bachelor's Degree or higher | 200 (98.5%) | 0 (0.0%) |
| Total | 475 (84.5%) | 7 (1.3%) |
Employment Occupations by Sex in Britton
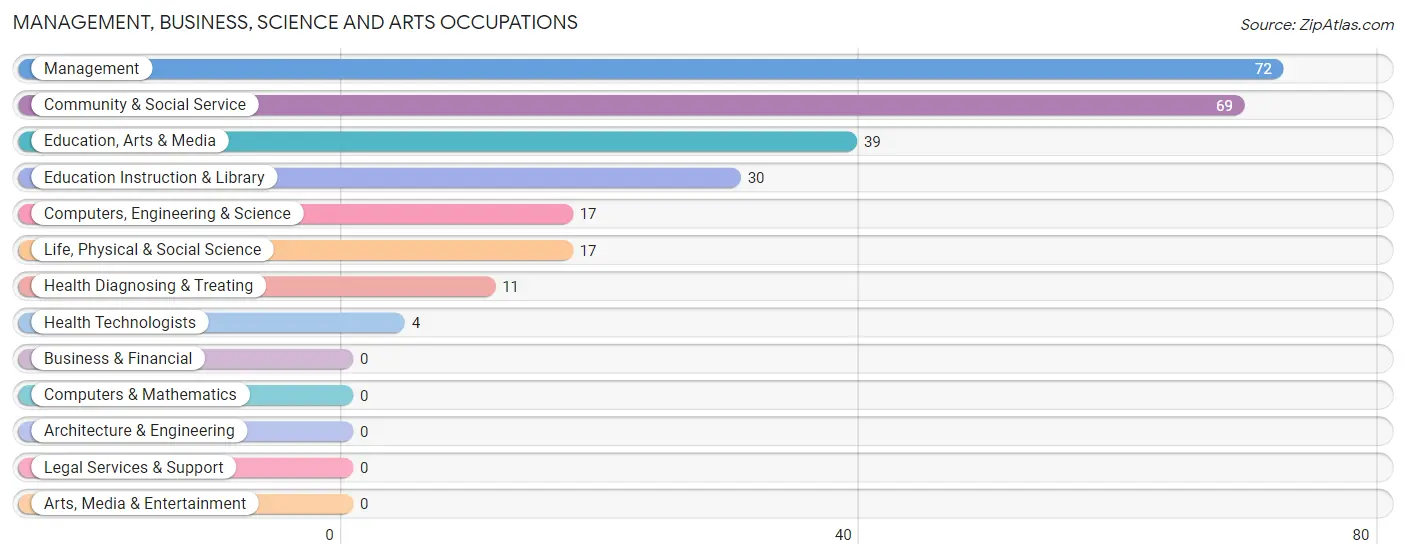
Management, Business, Science and Arts Occupations
The most common Management, Business, Science and Arts occupations in Britton are Management (72 | 12.5%), Community & Social Service (69 | 12.0%), Education, Arts & Media (39 | 6.8%), Education Instruction & Library (30 | 5.2%), and Computers, Engineering & Science (17 | 2.9%).
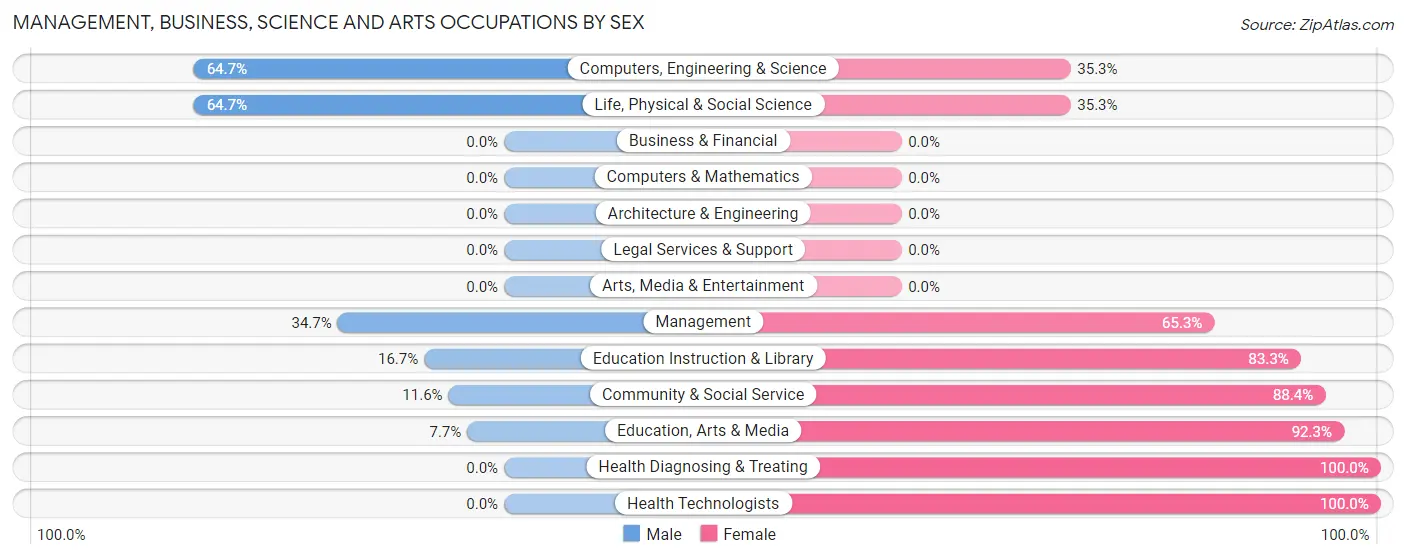
Management, Business, Science and Arts Occupations by Sex
Within the Management, Business, Science and Arts occupations in Britton, the most male-oriented occupations are Computers, Engineering & Science (64.7%), Life, Physical & Social Science (64.7%), and Management (34.7%), while the most female-oriented occupations are Health Diagnosing & Treating (100.0%), Health Technologists (100.0%), and Education, Arts & Media (92.3%).
| Occupation | Male | Female |
| Management | 25 (34.7%) | 47 (65.3%) |
| Business & Financial | 0 (0.0%) | 0 (0.0%) |
| Computers, Engineering & Science | 11 (64.7%) | 6 (35.3%) |
| Computers & Mathematics | 0 (0.0%) | 0 (0.0%) |
| Architecture & Engineering | 0 (0.0%) | 0 (0.0%) |
| Life, Physical & Social Science | 11 (64.7%) | 6 (35.3%) |
| Community & Social Service | 8 (11.6%) | 61 (88.4%) |
| Education, Arts & Media | 3 (7.7%) | 36 (92.3%) |
| Legal Services & Support | 0 (0.0%) | 0 (0.0%) |
| Education Instruction & Library | 5 (16.7%) | 25 (83.3%) |
| Arts, Media & Entertainment | 0 (0.0%) | 0 (0.0%) |
| Health Diagnosing & Treating | 0 (0.0%) | 11 (100.0%) |
| Health Technologists | 0 (0.0%) | 4 (100.0%) |
| Total (Category) | 44 (26.0%) | 125 (74.0%) |
| Total (Overall) | 271 (47.0%) | 305 (52.9%) |
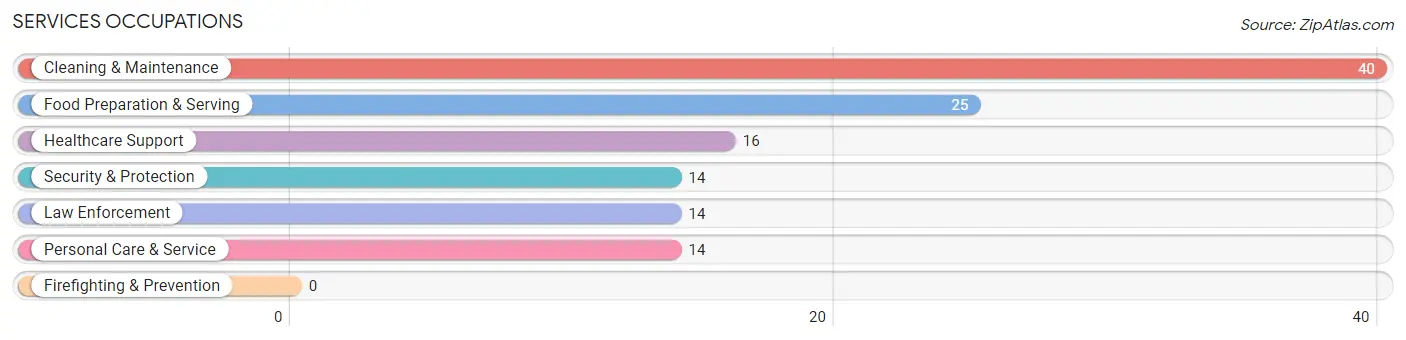
Services Occupations
The most common Services occupations in Britton are Cleaning & Maintenance (40 | 6.9%), Food Preparation & Serving (25 | 4.3%), Healthcare Support (16 | 2.8%), Security & Protection (14 | 2.4%), and Law Enforcement (14 | 2.4%).
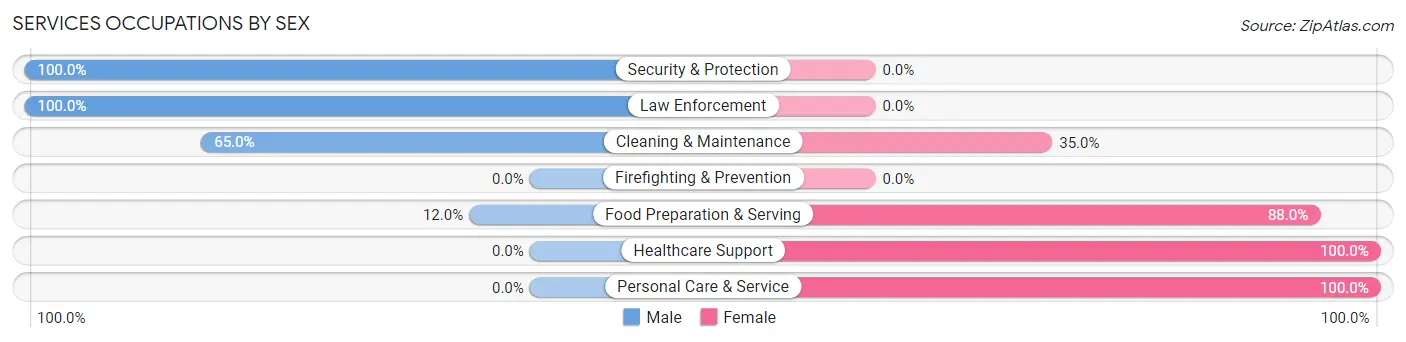
Services Occupations by Sex
Within the Services occupations in Britton, the most male-oriented occupations are Security & Protection (100.0%), Law Enforcement (100.0%), and Cleaning & Maintenance (65.0%), while the most female-oriented occupations are Healthcare Support (100.0%), Personal Care & Service (100.0%), and Food Preparation & Serving (88.0%).
| Occupation | Male | Female |
| Healthcare Support | 0 (0.0%) | 16 (100.0%) |
| Security & Protection | 14 (100.0%) | 0 (0.0%) |
| Firefighting & Prevention | 0 (0.0%) | 0 (0.0%) |
| Law Enforcement | 14 (100.0%) | 0 (0.0%) |
| Food Preparation & Serving | 3 (12.0%) | 22 (88.0%) |
| Cleaning & Maintenance | 26 (65.0%) | 14 (35.0%) |
| Personal Care & Service | 0 (0.0%) | 14 (100.0%) |
| Total (Category) | 43 (39.5%) | 66 (60.6%) |
| Total (Overall) | 271 (47.0%) | 305 (52.9%) |
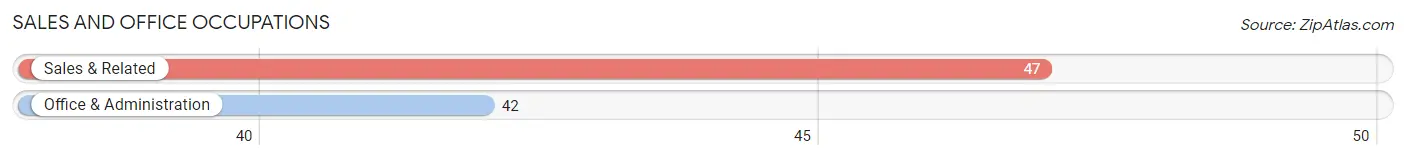
Sales and Office Occupations
The most common Sales and Office occupations in Britton are Sales & Related (47 | 8.2%), and Office & Administration (42 | 7.3%).
Sales and Office Occupations by Sex
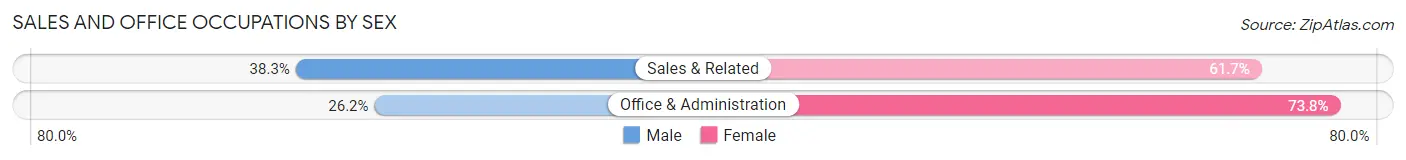
| Occupation | Male | Female |
| Sales & Related | 18 (38.3%) | 29 (61.7%) |
| Office & Administration | 11 (26.2%) | 31 (73.8%) |
| Total (Category) | 29 (32.6%) | 60 (67.4%) |
| Total (Overall) | 271 (47.0%) | 305 (52.9%) |
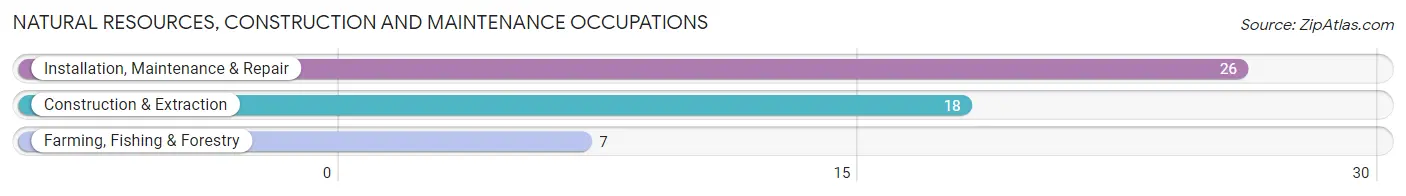
Natural Resources, Construction and Maintenance Occupations
The most common Natural Resources, Construction and Maintenance occupations in Britton are Installation, Maintenance & Repair (26 | 4.5%), Construction & Extraction (18 | 3.1%), and Farming, Fishing & Forestry (7 | 1.2%).
Natural Resources, Construction and Maintenance Occupations by Sex
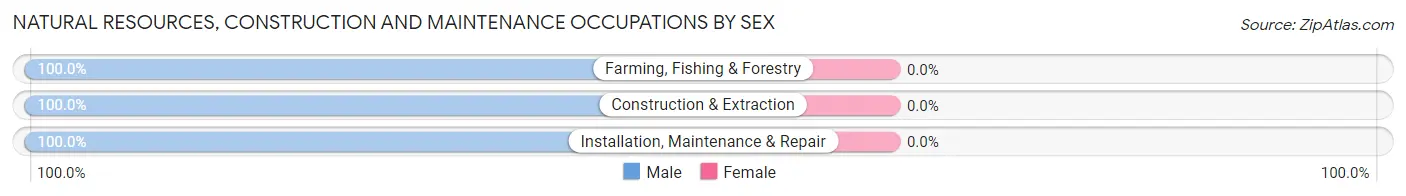
| Occupation | Male | Female |
| Farming, Fishing & Forestry | 7 (100.0%) | 0 (0.0%) |
| Construction & Extraction | 18 (100.0%) | 0 (0.0%) |
| Installation, Maintenance & Repair | 26 (100.0%) | 0 (0.0%) |
| Total (Category) | 51 (100.0%) | 0 (0.0%) |
| Total (Overall) | 271 (47.0%) | 305 (52.9%) |
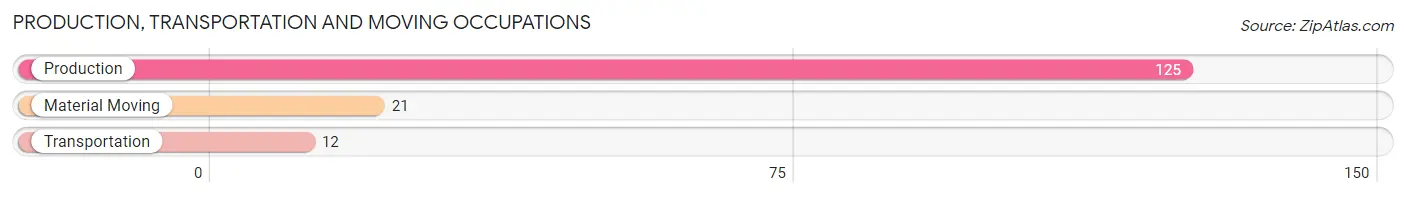
Production, Transportation and Moving Occupations
The most common Production, Transportation and Moving occupations in Britton are Production (125 | 21.7%), Material Moving (21 | 3.6%), and Transportation (12 | 2.1%).
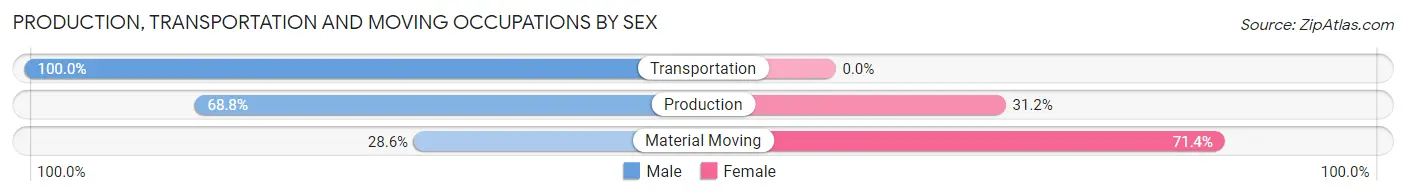
Production, Transportation and Moving Occupations by Sex
| Occupation | Male | Female |
| Production | 86 (68.8%) | 39 (31.2%) |
| Transportation | 12 (100.0%) | 0 (0.0%) |
| Material Moving | 6 (28.6%) | 15 (71.4%) |
| Total (Category) | 104 (65.8%) | 54 (34.2%) |
| Total (Overall) | 271 (47.0%) | 305 (52.9%) |
Employment Industries by Sex in Britton
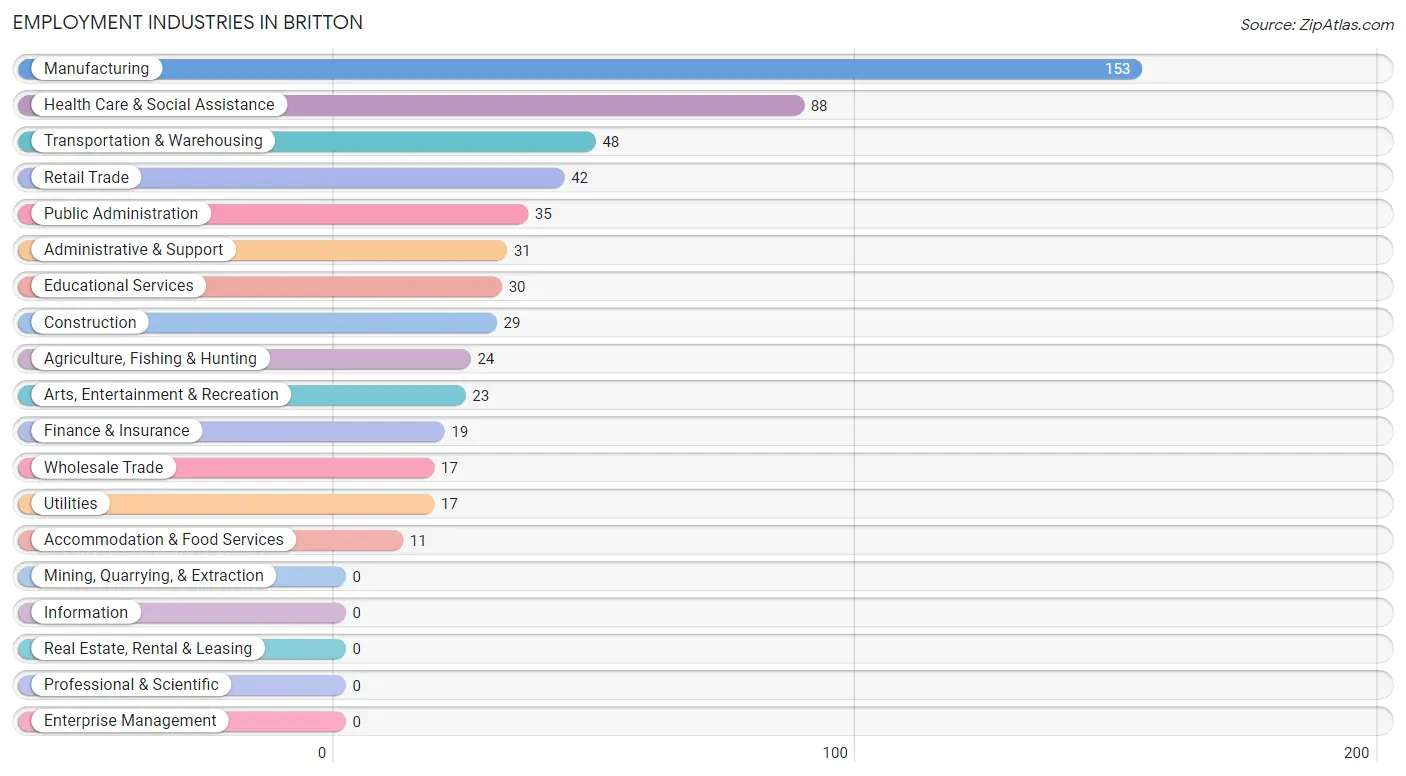
Employment Industries in Britton
The major employment industries in Britton include Manufacturing (153 | 26.6%), Health Care & Social Assistance (88 | 15.3%), Transportation & Warehousing (48 | 8.3%), Retail Trade (42 | 7.3%), and Public Administration (35 | 6.1%).
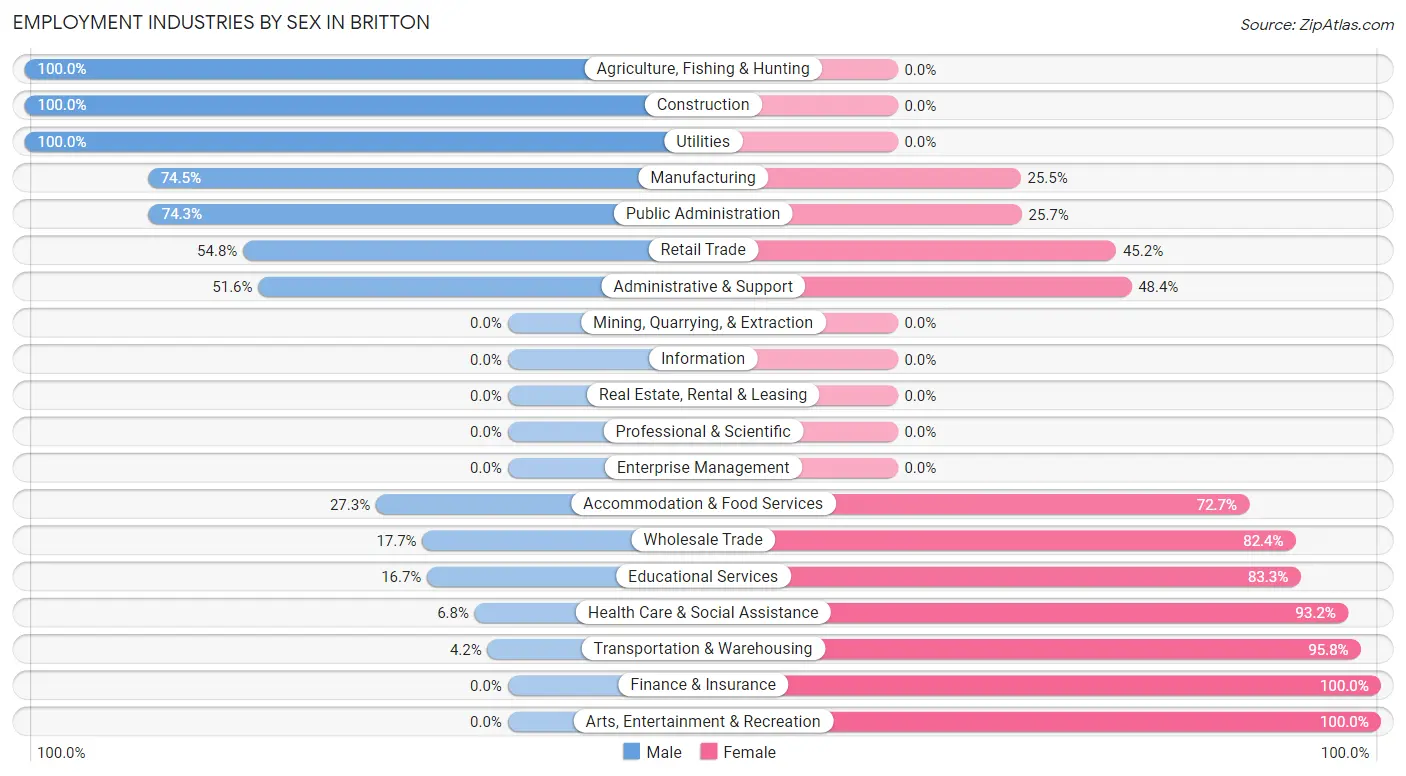
Employment Industries by Sex in Britton
The Britton industries that see more men than women are Agriculture, Fishing & Hunting (100.0%), Construction (100.0%), and Utilities (100.0%), whereas the industries that tend to have a higher number of women are Finance & Insurance (100.0%), Arts, Entertainment & Recreation (100.0%), and Transportation & Warehousing (95.8%).
| Industry | Male | Female |
| Agriculture, Fishing & Hunting | 24 (100.0%) | 0 (0.0%) |
| Mining, Quarrying, & Extraction | 0 (0.0%) | 0 (0.0%) |
| Construction | 29 (100.0%) | 0 (0.0%) |
| Manufacturing | 114 (74.5%) | 39 (25.5%) |
| Wholesale Trade | 3 (17.6%) | 14 (82.4%) |
| Retail Trade | 23 (54.8%) | 19 (45.2%) |
| Transportation & Warehousing | 2 (4.2%) | 46 (95.8%) |
| Utilities | 17 (100.0%) | 0 (0.0%) |
| Information | 0 (0.0%) | 0 (0.0%) |
| Finance & Insurance | 0 (0.0%) | 19 (100.0%) |
| Real Estate, Rental & Leasing | 0 (0.0%) | 0 (0.0%) |
| Professional & Scientific | 0 (0.0%) | 0 (0.0%) |
| Enterprise Management | 0 (0.0%) | 0 (0.0%) |
| Administrative & Support | 16 (51.6%) | 15 (48.4%) |
| Educational Services | 5 (16.7%) | 25 (83.3%) |
| Health Care & Social Assistance | 6 (6.8%) | 82 (93.2%) |
| Arts, Entertainment & Recreation | 0 (0.0%) | 23 (100.0%) |
| Accommodation & Food Services | 3 (27.3%) | 8 (72.7%) |
| Public Administration | 26 (74.3%) | 9 (25.7%) |
| Total | 271 (47.0%) | 305 (52.9%) |
Education in Britton
School Enrollment in Britton
The most common levels of schooling among the 201 students in Britton are elementary school (53 | 26.4%), high school (53 | 26.4%), and middle school (36 | 17.9%).
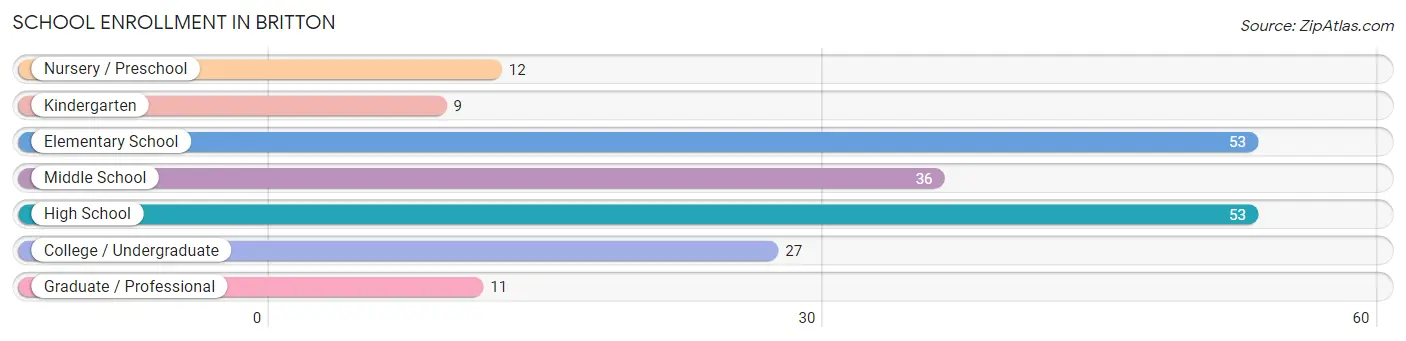
| School Level | # Students | % Students |
| Nursery / Preschool | 12 | 6.0% |
| Kindergarten | 9 | 4.5% |
| Elementary School | 53 | 26.4% |
| Middle School | 36 | 17.9% |
| High School | 53 | 26.4% |
| College / Undergraduate | 27 | 13.4% |
| Graduate / Professional | 11 | 5.5% |
| Total | 201 | 100.0% |
School Enrollment by Age by Funding Source in Britton
Out of a total of 201 students who are enrolled in schools in Britton, 15 (7.5%) attend a private institution, while the remaining 186 (92.5%) are enrolled in public schools. The age group of 15 to 17 year olds has the highest likelihood of being enrolled in private schools, with 9 (24.3% in the age bracket) enrolled. Conversely, the age group of 10 to 14 year olds has the lowest likelihood of being enrolled in a private school, with 54 (100.0% in the age bracket) attending a public institution.
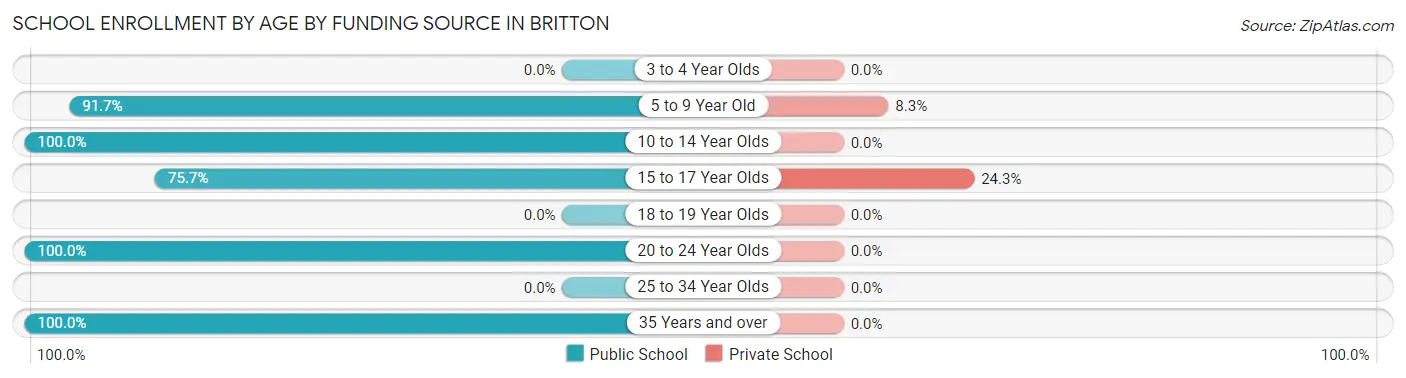
| Age Bracket | Public School | Private School |
| 3 to 4 Year Olds | 0 (0.0%) | 0 (0.0%) |
| 5 to 9 Year Old | 66 (91.7%) | 6 (8.3%) |
| 10 to 14 Year Olds | 54 (100.0%) | 0 (0.0%) |
| 15 to 17 Year Olds | 28 (75.7%) | 9 (24.3%) |
| 18 to 19 Year Olds | 0 (0.0%) | 0 (0.0%) |
| 20 to 24 Year Olds | 15 (100.0%) | 0 (0.0%) |
| 25 to 34 Year Olds | 0 (0.0%) | 0 (0.0%) |
| 35 Years and over | 23 (100.0%) | 0 (0.0%) |
| Total | 186 (92.5%) | 15 (7.5%) |
Educational Attainment by Field of Study in Britton
Business (48 | 21.1%), bio, nature & agricultural (34 | 15.0%), engineering (34 | 15.0%), science & technology (33 | 14.5%), and education (32 | 14.1%) are the most common fields of study among 227 individuals in Britton who have obtained a bachelor's degree or higher.
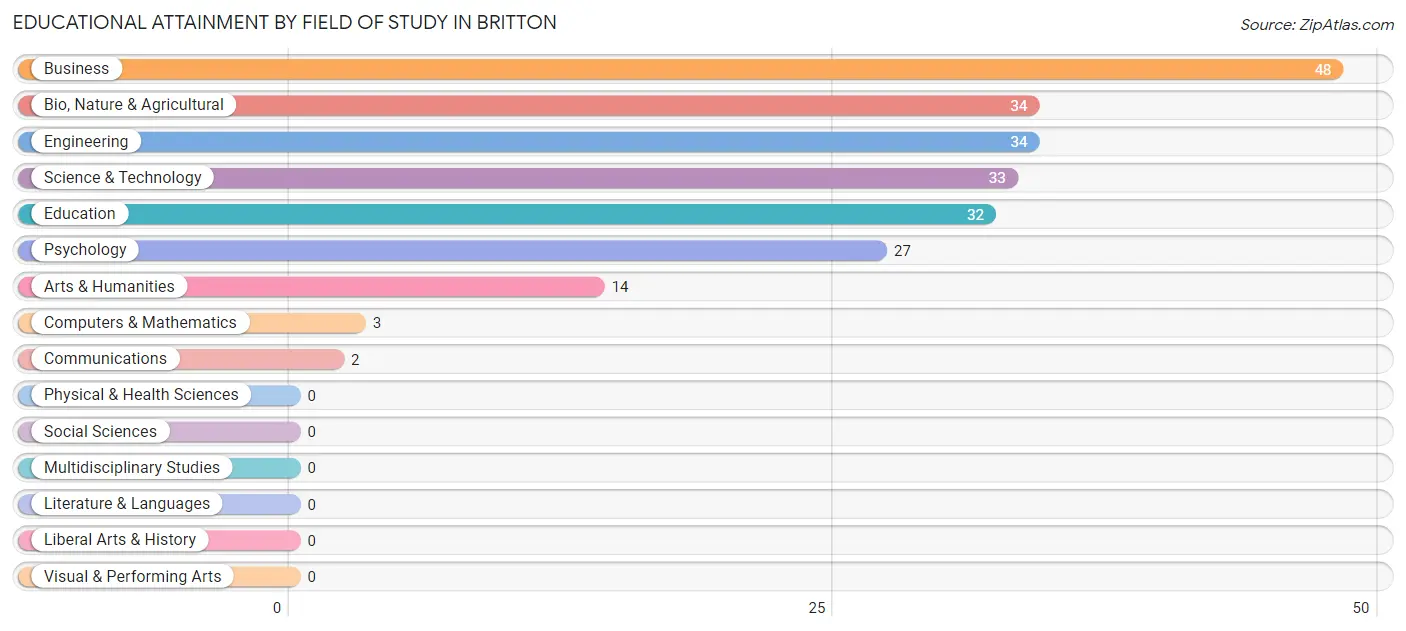
| Field of Study | # Graduates | % Graduates |
| Computers & Mathematics | 3 | 1.3% |
| Bio, Nature & Agricultural | 34 | 15.0% |
| Physical & Health Sciences | 0 | 0.0% |
| Psychology | 27 | 11.9% |
| Social Sciences | 0 | 0.0% |
| Engineering | 34 | 15.0% |
| Multidisciplinary Studies | 0 | 0.0% |
| Science & Technology | 33 | 14.5% |
| Business | 48 | 21.1% |
| Education | 32 | 14.1% |
| Literature & Languages | 0 | 0.0% |
| Liberal Arts & History | 0 | 0.0% |
| Visual & Performing Arts | 0 | 0.0% |
| Communications | 2 | 0.9% |
| Arts & Humanities | 14 | 6.2% |
| Total | 227 | 100.0% |
Transportation & Commute in Britton
Vehicle Availability by Sex in Britton
The most prevalent vehicle ownership categories in Britton are males with 2 vehicles (108, accounting for 40.2%) and females with 2 vehicles (115, making up 36.7%).
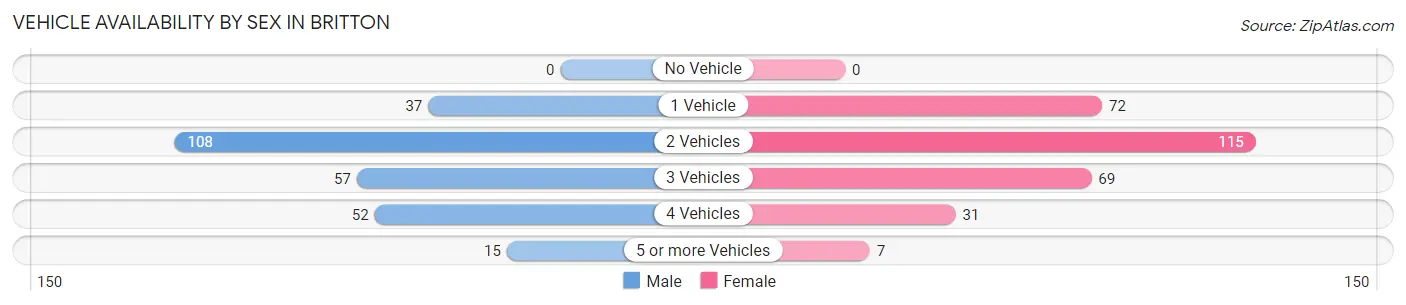
| Vehicles Available | Male | Female |
| No Vehicle | 0 (0.0%) | 0 (0.0%) |
| 1 Vehicle | 37 (13.8%) | 72 (24.5%) |
| 2 Vehicles | 108 (40.2%) | 115 (39.1%) |
| 3 Vehicles | 57 (21.2%) | 69 (23.5%) |
| 4 Vehicles | 52 (19.3%) | 31 (10.5%) |
| 5 or more Vehicles | 15 (5.6%) | 7 (2.4%) |
| Total | 269 (100.0%) | 294 (100.0%) |
Commute Time in Britton
The most frequently occuring commute durations in Britton are 5 to 9 minutes (215 commuters, 38.7%), less than 5 minutes (206 commuters, 37.1%), and 10 to 14 minutes (65 commuters, 11.7%).
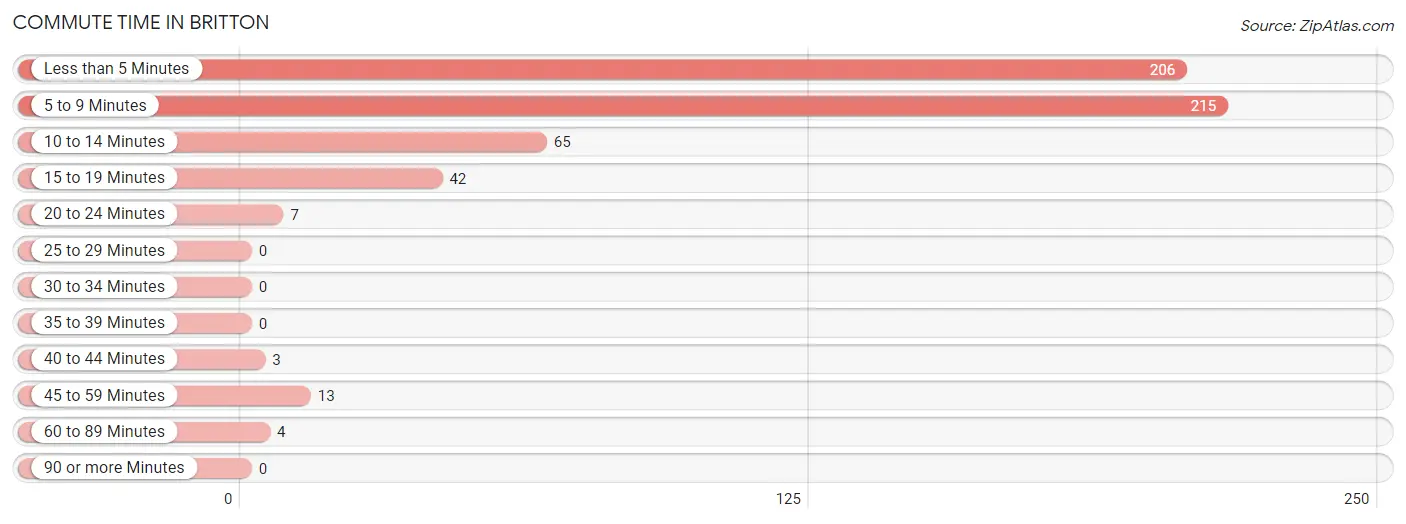
| Commute Time | # Commuters | % Commuters |
| Less than 5 Minutes | 206 | 37.1% |
| 5 to 9 Minutes | 215 | 38.7% |
| 10 to 14 Minutes | 65 | 11.7% |
| 15 to 19 Minutes | 42 | 7.6% |
| 20 to 24 Minutes | 7 | 1.3% |
| 25 to 29 Minutes | 0 | 0.0% |
| 30 to 34 Minutes | 0 | 0.0% |
| 35 to 39 Minutes | 0 | 0.0% |
| 40 to 44 Minutes | 3 | 0.5% |
| 45 to 59 Minutes | 13 | 2.3% |
| 60 to 89 Minutes | 4 | 0.7% |
| 90 or more Minutes | 0 | 0.0% |
Commute Time by Sex in Britton
The most common commute times in Britton are less than 5 minutes (127 commuters, 47.2%) for males and 5 to 9 minutes (155 commuters, 54.2%) for females.
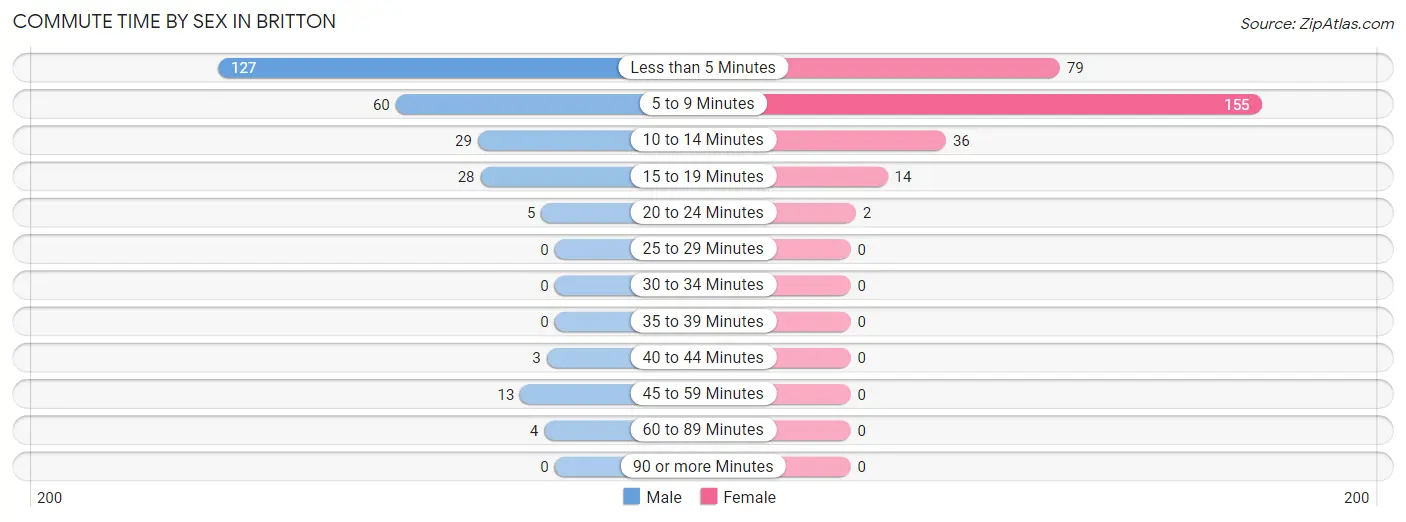
| Commute Time | Male | Female |
| Less than 5 Minutes | 127 (47.2%) | 79 (27.6%) |
| 5 to 9 Minutes | 60 (22.3%) | 155 (54.2%) |
| 10 to 14 Minutes | 29 (10.8%) | 36 (12.6%) |
| 15 to 19 Minutes | 28 (10.4%) | 14 (4.9%) |
| 20 to 24 Minutes | 5 (1.9%) | 2 (0.7%) |
| 25 to 29 Minutes | 0 (0.0%) | 0 (0.0%) |
| 30 to 34 Minutes | 0 (0.0%) | 0 (0.0%) |
| 35 to 39 Minutes | 0 (0.0%) | 0 (0.0%) |
| 40 to 44 Minutes | 3 (1.1%) | 0 (0.0%) |
| 45 to 59 Minutes | 13 (4.8%) | 0 (0.0%) |
| 60 to 89 Minutes | 4 (1.5%) | 0 (0.0%) |
| 90 or more Minutes | 0 (0.0%) | 0 (0.0%) |
Time of Departure to Work by Sex in Britton
The most frequent times of departure to work in Britton are 6:00 AM to 6:29 AM (63, 23.4%) for males and 12:00 PM to 3:59 PM (63, 22.0%) for females.
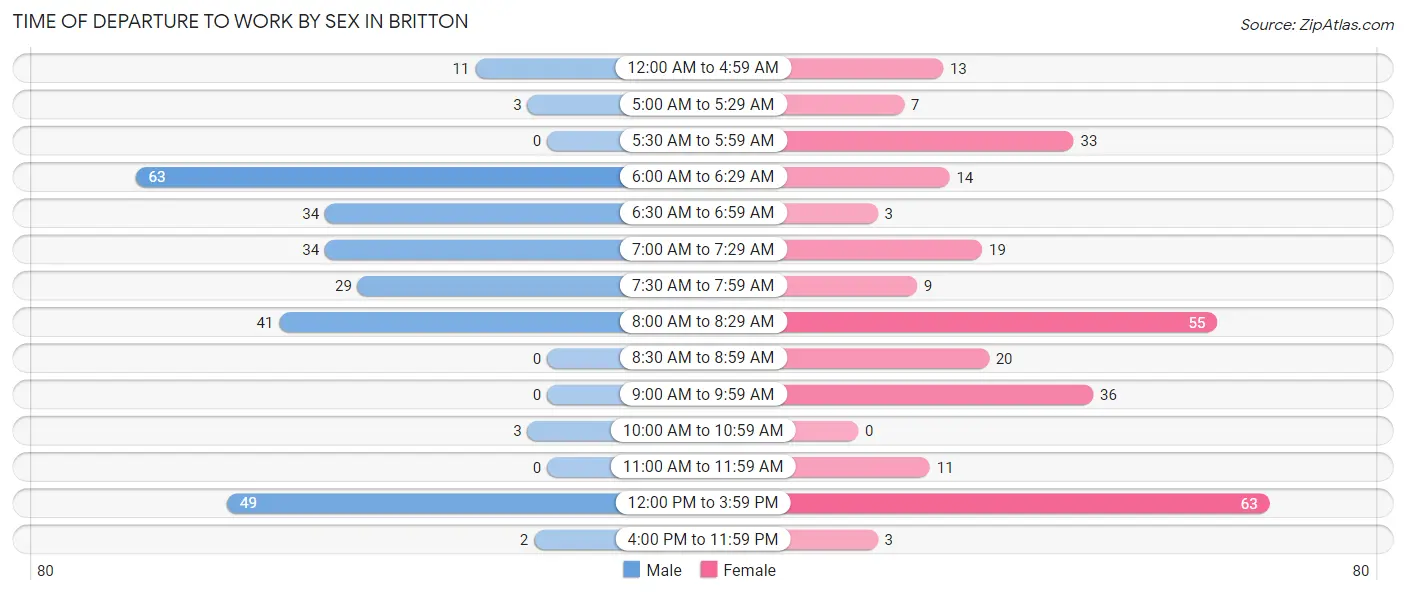
| Time of Departure | Male | Female |
| 12:00 AM to 4:59 AM | 11 (4.1%) | 13 (4.5%) |
| 5:00 AM to 5:29 AM | 3 (1.1%) | 7 (2.5%) |
| 5:30 AM to 5:59 AM | 0 (0.0%) | 33 (11.5%) |
| 6:00 AM to 6:29 AM | 63 (23.4%) | 14 (4.9%) |
| 6:30 AM to 6:59 AM | 34 (12.6%) | 3 (1.1%) |
| 7:00 AM to 7:29 AM | 34 (12.6%) | 19 (6.6%) |
| 7:30 AM to 7:59 AM | 29 (10.8%) | 9 (3.2%) |
| 8:00 AM to 8:29 AM | 41 (15.2%) | 55 (19.2%) |
| 8:30 AM to 8:59 AM | 0 (0.0%) | 20 (7.0%) |
| 9:00 AM to 9:59 AM | 0 (0.0%) | 36 (12.6%) |
| 10:00 AM to 10:59 AM | 3 (1.1%) | 0 (0.0%) |
| 11:00 AM to 11:59 AM | 0 (0.0%) | 11 (3.8%) |
| 12:00 PM to 3:59 PM | 49 (18.2%) | 63 (22.0%) |
| 4:00 PM to 11:59 PM | 2 (0.7%) | 3 (1.1%) |
| Total | 269 (100.0%) | 286 (100.0%) |
Housing Occupancy in Britton
Occupancy by Ownership in Britton
Of the total 432 dwellings in Britton, owner-occupied units account for 328 (75.9%), while renter-occupied units make up 104 (24.1%).
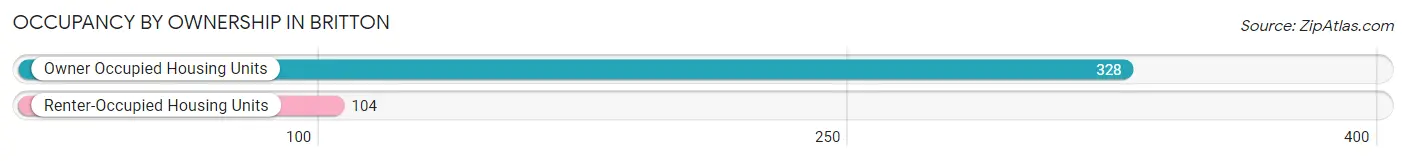
| Occupancy | # Housing Units | % Housing Units |
| Owner Occupied Housing Units | 328 | 75.9% |
| Renter-Occupied Housing Units | 104 | 24.1% |
| Total Occupied Housing Units | 432 | 100.0% |
Occupancy by Household Size in Britton
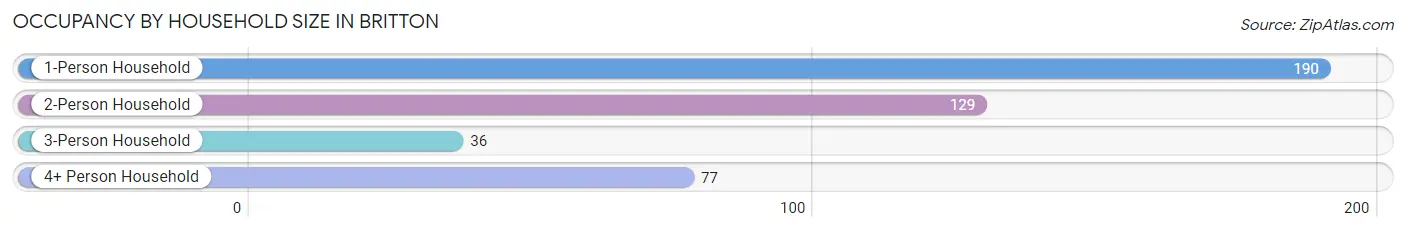
| Household Size | # Housing Units | % Housing Units |
| 1-Person Household | 190 | 44.0% |
| 2-Person Household | 129 | 29.9% |
| 3-Person Household | 36 | 8.3% |
| 4+ Person Household | 77 | 17.8% |
| Total Housing Units | 432 | 100.0% |
Occupancy by Ownership by Household Size in Britton
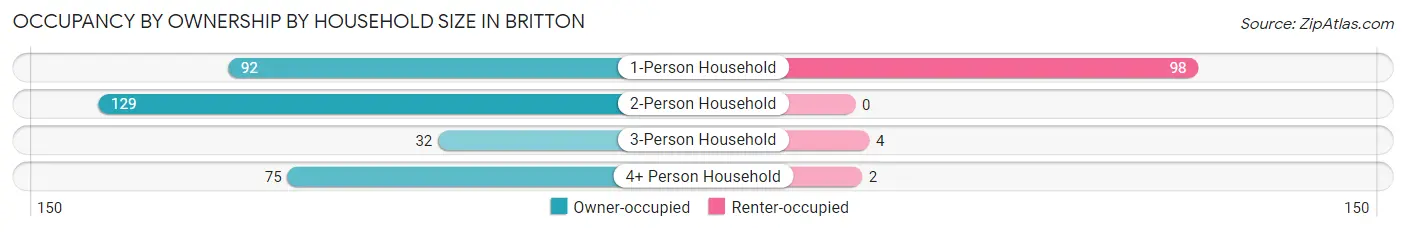
| Household Size | Owner-occupied | Renter-occupied |
| 1-Person Household | 92 (48.4%) | 98 (51.6%) |
| 2-Person Household | 129 (100.0%) | 0 (0.0%) |
| 3-Person Household | 32 (88.9%) | 4 (11.1%) |
| 4+ Person Household | 75 (97.4%) | 2 (2.6%) |
| Total Housing Units | 328 (75.9%) | 104 (24.1%) |
Occupancy by Educational Attainment in Britton
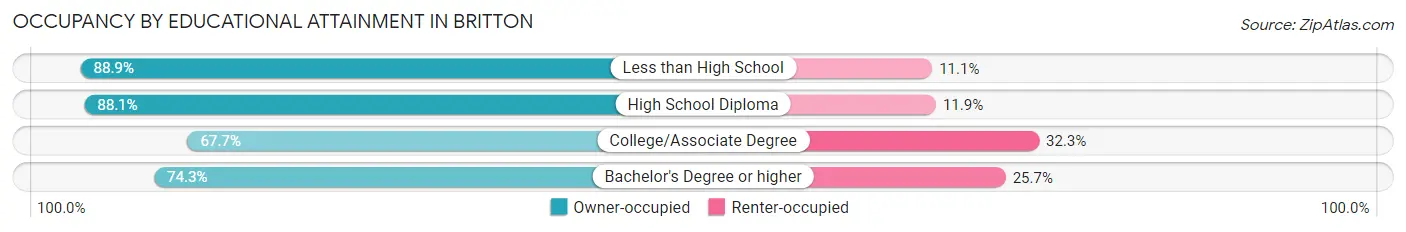
| Household Size | Owner-occupied | Renter-occupied |
| Less than High School | 8 (88.9%) | 1 (11.1%) |
| High School Diploma | 104 (88.1%) | 14 (11.9%) |
| College/Associate Degree | 109 (67.7%) | 52 (32.3%) |
| Bachelor's Degree or higher | 107 (74.3%) | 37 (25.7%) |
Occupancy by Age of Householder in Britton
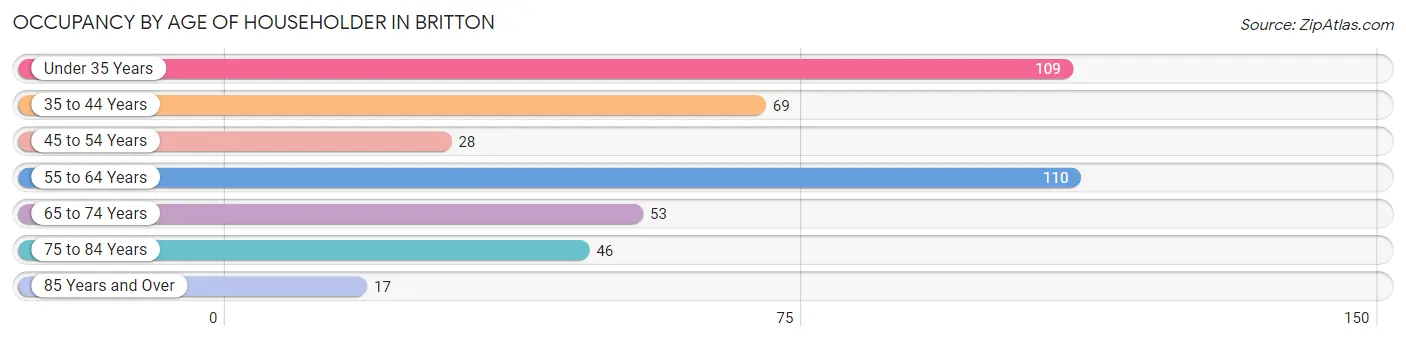
| Age Bracket | # Households | % Households |
| Under 35 Years | 109 | 25.2% |
| 35 to 44 Years | 69 | 16.0% |
| 45 to 54 Years | 28 | 6.5% |
| 55 to 64 Years | 110 | 25.5% |
| 65 to 74 Years | 53 | 12.3% |
| 75 to 84 Years | 46 | 10.6% |
| 85 Years and Over | 17 | 3.9% |
| Total | 432 | 100.0% |
Housing Finances in Britton
Median Income by Occupancy in Britton
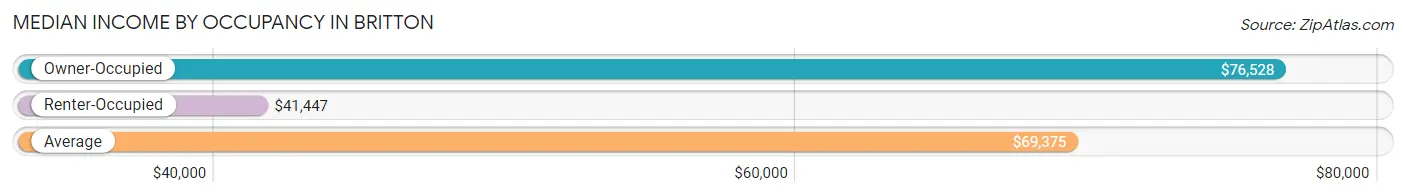
| Occupancy Type | # Households | Median Income |
| Owner-Occupied | 328 (75.9%) | $76,528 |
| Renter-Occupied | 104 (24.1%) | $41,447 |
| Average | 432 (100.0%) | $69,375 |
Occupancy by Householder Income Bracket in Britton
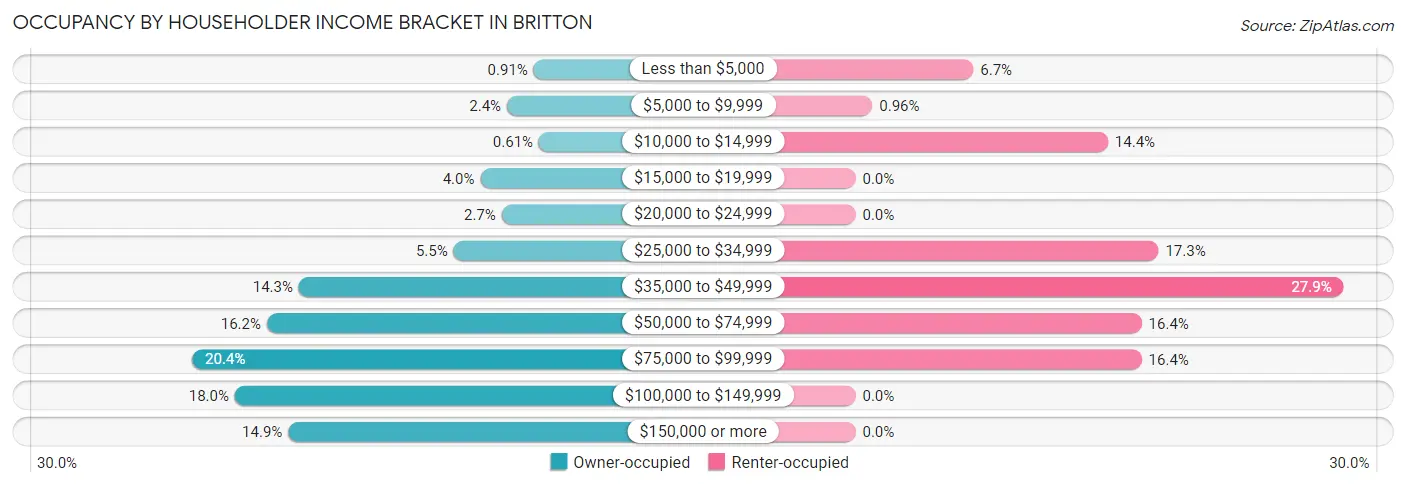
| Income Bracket | Owner-occupied | Renter-occupied |
| Less than $5,000 | 3 (0.9%) | 7 (6.7%) |
| $5,000 to $9,999 | 8 (2.4%) | 1 (1.0%) |
| $10,000 to $14,999 | 2 (0.6%) | 15 (14.4%) |
| $15,000 to $19,999 | 13 (4.0%) | 0 (0.0%) |
| $20,000 to $24,999 | 9 (2.7%) | 0 (0.0%) |
| $25,000 to $34,999 | 18 (5.5%) | 18 (17.3%) |
| $35,000 to $49,999 | 47 (14.3%) | 29 (27.9%) |
| $50,000 to $74,999 | 53 (16.2%) | 17 (16.4%) |
| $75,000 to $99,999 | 67 (20.4%) | 17 (16.4%) |
| $100,000 to $149,999 | 59 (18.0%) | 0 (0.0%) |
| $150,000 or more | 49 (14.9%) | 0 (0.0%) |
| Total | 328 (100.0%) | 104 (100.0%) |
Monthly Housing Cost Tiers in Britton
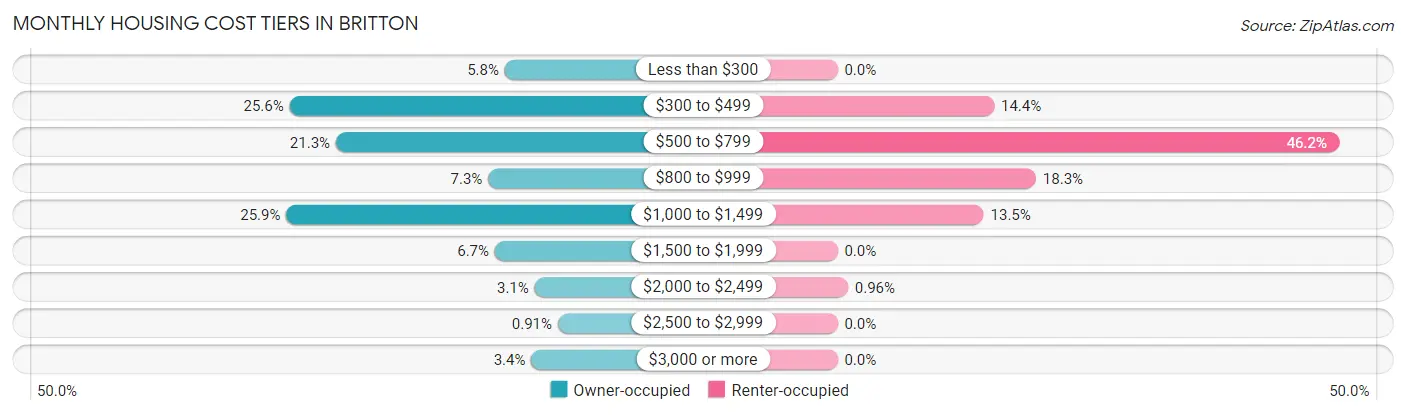
| Monthly Cost | Owner-occupied | Renter-occupied |
| Less than $300 | 19 (5.8%) | 0 (0.0%) |
| $300 to $499 | 84 (25.6%) | 15 (14.4%) |
| $500 to $799 | 70 (21.3%) | 48 (46.2%) |
| $800 to $999 | 24 (7.3%) | 19 (18.3%) |
| $1,000 to $1,499 | 85 (25.9%) | 14 (13.5%) |
| $1,500 to $1,999 | 22 (6.7%) | 0 (0.0%) |
| $2,000 to $2,499 | 10 (3.0%) | 1 (1.0%) |
| $2,500 to $2,999 | 3 (0.9%) | 0 (0.0%) |
| $3,000 or more | 11 (3.4%) | 0 (0.0%) |
| Total | 328 (100.0%) | 104 (100.0%) |
Physical Housing Characteristics in Britton
Housing Structures in Britton
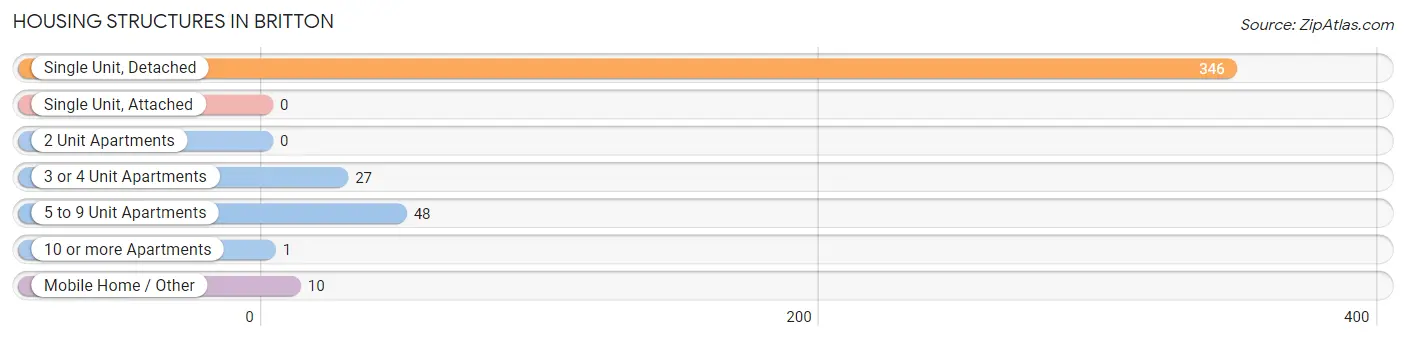
| Structure Type | # Housing Units | % Housing Units |
| Single Unit, Detached | 346 | 80.1% |
| Single Unit, Attached | 0 | 0.0% |
| 2 Unit Apartments | 0 | 0.0% |
| 3 or 4 Unit Apartments | 27 | 6.2% |
| 5 to 9 Unit Apartments | 48 | 11.1% |
| 10 or more Apartments | 1 | 0.2% |
| Mobile Home / Other | 10 | 2.3% |
| Total | 432 | 100.0% |
Housing Structures by Occupancy in Britton
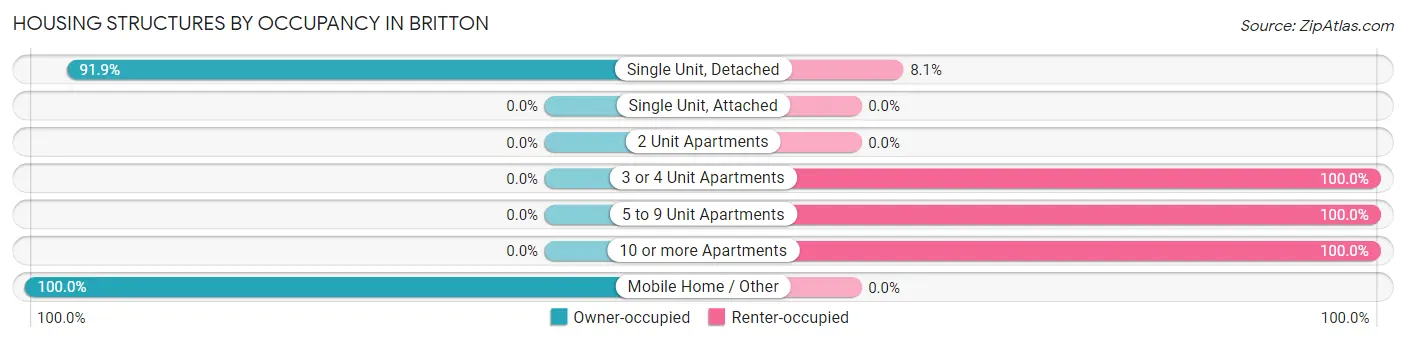
| Structure Type | Owner-occupied | Renter-occupied |
| Single Unit, Detached | 318 (91.9%) | 28 (8.1%) |
| Single Unit, Attached | 0 (0.0%) | 0 (0.0%) |
| 2 Unit Apartments | 0 (0.0%) | 0 (0.0%) |
| 3 or 4 Unit Apartments | 0 (0.0%) | 27 (100.0%) |
| 5 to 9 Unit Apartments | 0 (0.0%) | 48 (100.0%) |
| 10 or more Apartments | 0 (0.0%) | 1 (100.0%) |
| Mobile Home / Other | 10 (100.0%) | 0 (0.0%) |
| Total | 328 (75.9%) | 104 (24.1%) |
Housing Structures by Number of Rooms in Britton
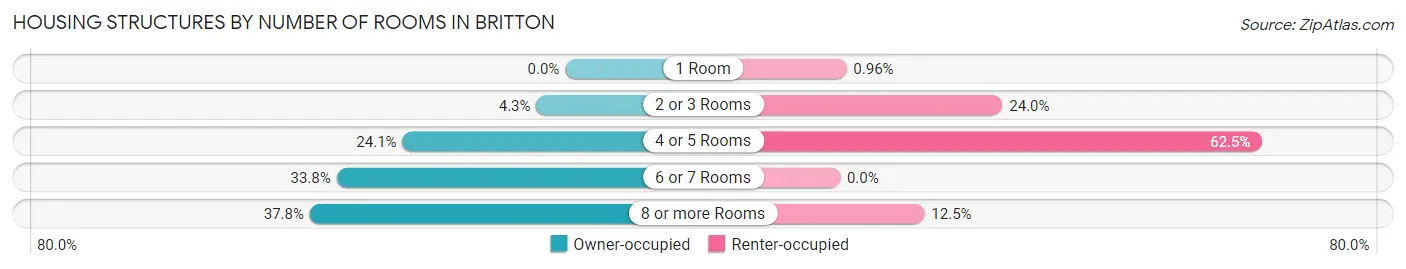
| Number of Rooms | Owner-occupied | Renter-occupied |
| 1 Room | 0 (0.0%) | 1 (1.0%) |
| 2 or 3 Rooms | 14 (4.3%) | 25 (24.0%) |
| 4 or 5 Rooms | 79 (24.1%) | 65 (62.5%) |
| 6 or 7 Rooms | 111 (33.8%) | 0 (0.0%) |
| 8 or more Rooms | 124 (37.8%) | 13 (12.5%) |
| Total | 328 (100.0%) | 104 (100.0%) |
Housing Structure by Heating Type in Britton
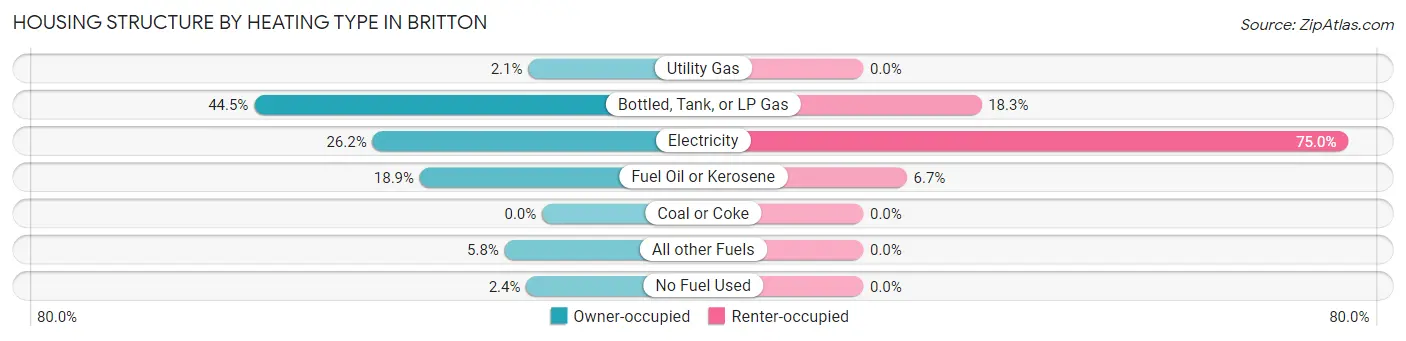
| Heating Type | Owner-occupied | Renter-occupied |
| Utility Gas | 7 (2.1%) | 0 (0.0%) |
| Bottled, Tank, or LP Gas | 146 (44.5%) | 19 (18.3%) |
| Electricity | 86 (26.2%) | 78 (75.0%) |
| Fuel Oil or Kerosene | 62 (18.9%) | 7 (6.7%) |
| Coal or Coke | 0 (0.0%) | 0 (0.0%) |
| All other Fuels | 19 (5.8%) | 0 (0.0%) |
| No Fuel Used | 8 (2.4%) | 0 (0.0%) |
| Total | 328 (100.0%) | 104 (100.0%) |
Household Vehicle Usage in Britton
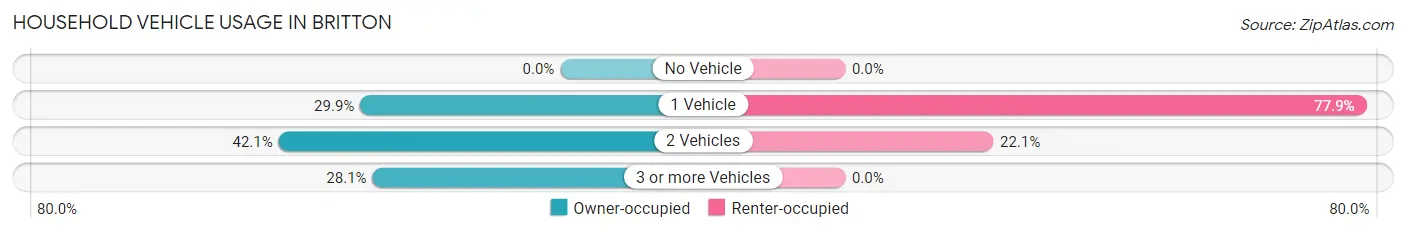
| Vehicles per Household | Owner-occupied | Renter-occupied |
| No Vehicle | 0 (0.0%) | 0 (0.0%) |
| 1 Vehicle | 98 (29.9%) | 81 (77.9%) |
| 2 Vehicles | 138 (42.1%) | 23 (22.1%) |
| 3 or more Vehicles | 92 (28.1%) | 0 (0.0%) |
| Total | 328 (100.0%) | 104 (100.0%) |
Real Estate & Mortgages in Britton
Real Estate and Mortgage Overview in Britton
| Characteristic | Without Mortgage | With Mortgage |
| Housing Units | 156 | 172 |
| Median Property Value | $81,100 | $151,000 |
| Median Household Income | $41,563 | $30 |
| Monthly Housing Costs | $462 | $11 |
| Real Estate Taxes | $752 | $0 |
Property Value by Mortgage Status in Britton
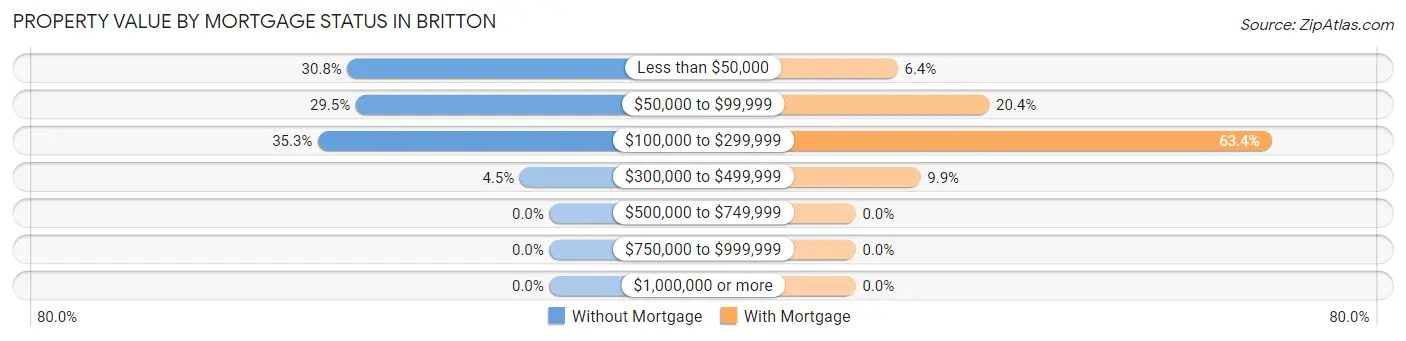
| Property Value | Without Mortgage | With Mortgage |
| Less than $50,000 | 48 (30.8%) | 11 (6.4%) |
| $50,000 to $99,999 | 46 (29.5%) | 35 (20.3%) |
| $100,000 to $299,999 | 55 (35.3%) | 109 (63.4%) |
| $300,000 to $499,999 | 7 (4.5%) | 17 (9.9%) |
| $500,000 to $749,999 | 0 (0.0%) | 0 (0.0%) |
| $750,000 to $999,999 | 0 (0.0%) | 0 (0.0%) |
| $1,000,000 or more | 0 (0.0%) | 0 (0.0%) |
| Total | 156 (100.0%) | 172 (100.0%) |
Household Income by Mortgage Status in Britton
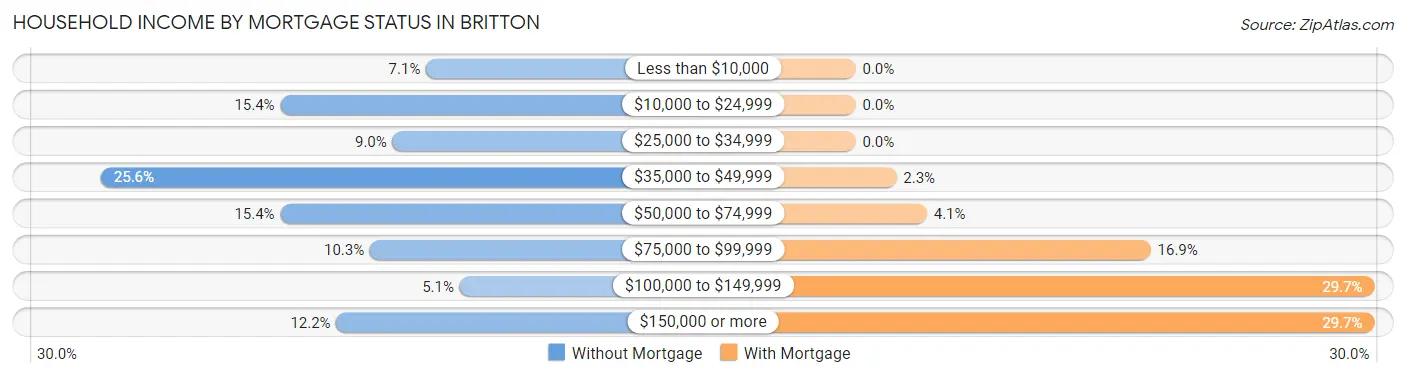
| Household Income | Without Mortgage | With Mortgage |
| Less than $10,000 | 11 (7.0%) | 0 (0.0%) |
| $10,000 to $24,999 | 24 (15.4%) | 0 (0.0%) |
| $25,000 to $34,999 | 14 (9.0%) | 0 (0.0%) |
| $35,000 to $49,999 | 40 (25.6%) | 4 (2.3%) |
| $50,000 to $74,999 | 24 (15.4%) | 7 (4.1%) |
| $75,000 to $99,999 | 16 (10.3%) | 29 (16.9%) |
| $100,000 to $149,999 | 8 (5.1%) | 51 (29.6%) |
| $150,000 or more | 19 (12.2%) | 51 (29.6%) |
| Total | 156 (100.0%) | 172 (100.0%) |
Property Value to Household Income Ratio in Britton
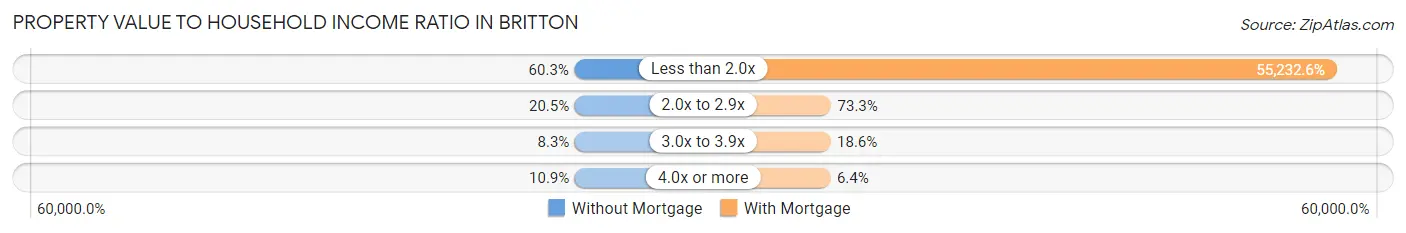
| Value-to-Income Ratio | Without Mortgage | With Mortgage |
| Less than 2.0x | 94 (60.3%) | 95,000 (55,232.6%) |
| 2.0x to 2.9x | 32 (20.5%) | 126 (73.3%) |
| 3.0x to 3.9x | 13 (8.3%) | 32 (18.6%) |
| 4.0x or more | 17 (10.9%) | 11 (6.4%) |
| Total | 156 (100.0%) | 172 (100.0%) |
Real Estate Taxes by Mortgage Status in Britton
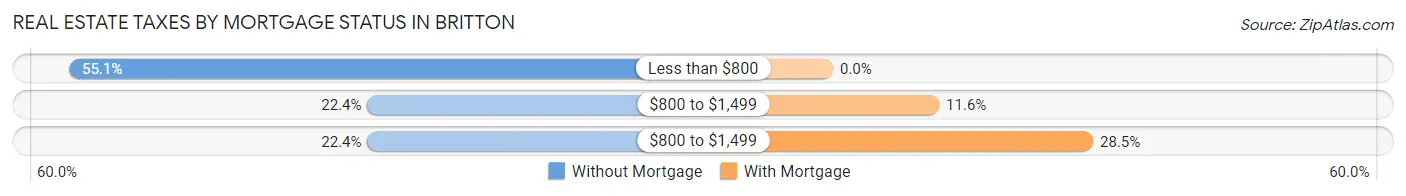
| Property Taxes | Without Mortgage | With Mortgage |
| Less than $800 | 86 (55.1%) | 0 (0.0%) |
| $800 to $1,499 | 35 (22.4%) | 20 (11.6%) |
| $800 to $1,499 | 35 (22.4%) | 49 (28.5%) |
| Total | 156 (100.0%) | 172 (100.0%) |
Health & Disability in Britton
Health Insurance Coverage by Age in Britton
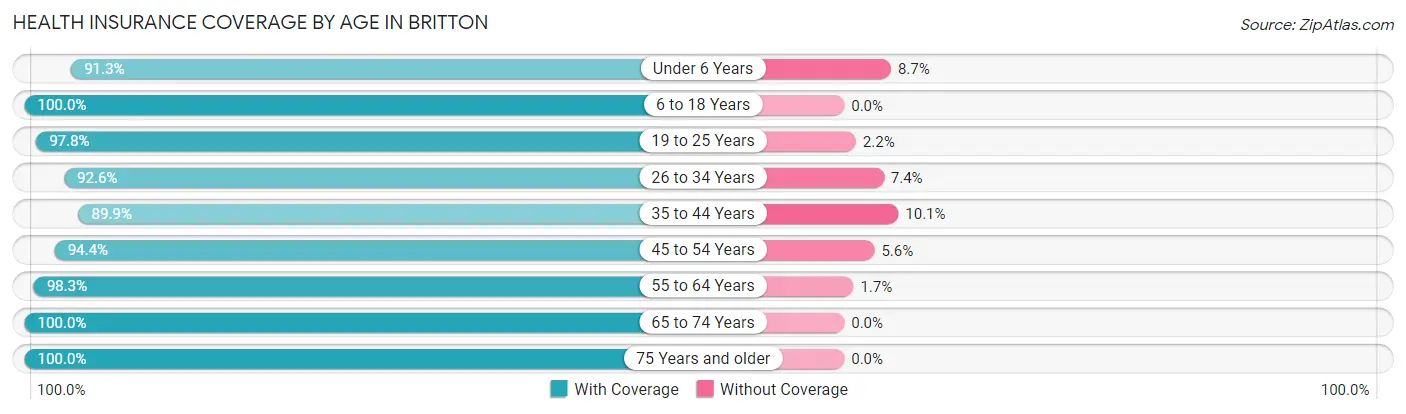
| Age Bracket | With Coverage | Without Coverage |
| Under 6 Years | 84 (91.3%) | 8 (8.7%) |
| 6 to 18 Years | 147 (100.0%) | 0 (0.0%) |
| 19 to 25 Years | 135 (97.8%) | 3 (2.2%) |
| 26 to 34 Years | 113 (92.6%) | 9 (7.4%) |
| 35 to 44 Years | 107 (89.9%) | 12 (10.1%) |
| 45 to 54 Years | 84 (94.4%) | 5 (5.6%) |
| 55 to 64 Years | 172 (98.3%) | 3 (1.7%) |
| 65 to 74 Years | 64 (100.0%) | 0 (0.0%) |
| 75 Years and older | 99 (100.0%) | 0 (0.0%) |
| Total | 1,005 (96.2%) | 40 (3.8%) |
Health Insurance Coverage by Citizenship Status in Britton
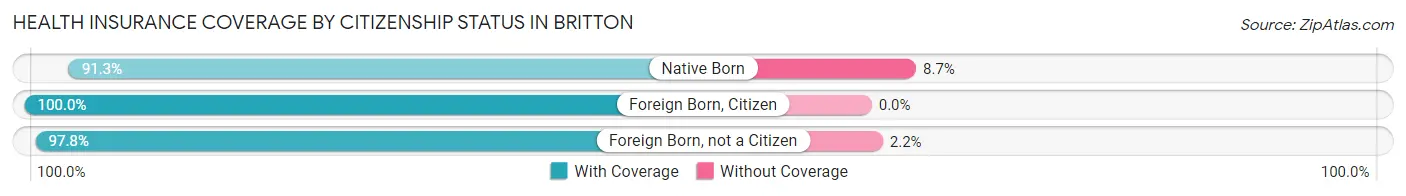
| Citizenship Status | With Coverage | Without Coverage |
| Native Born | 84 (91.3%) | 8 (8.7%) |
| Foreign Born, Citizen | 147 (100.0%) | 0 (0.0%) |
| Foreign Born, not a Citizen | 135 (97.8%) | 3 (2.2%) |
Health Insurance Coverage by Household Income in Britton
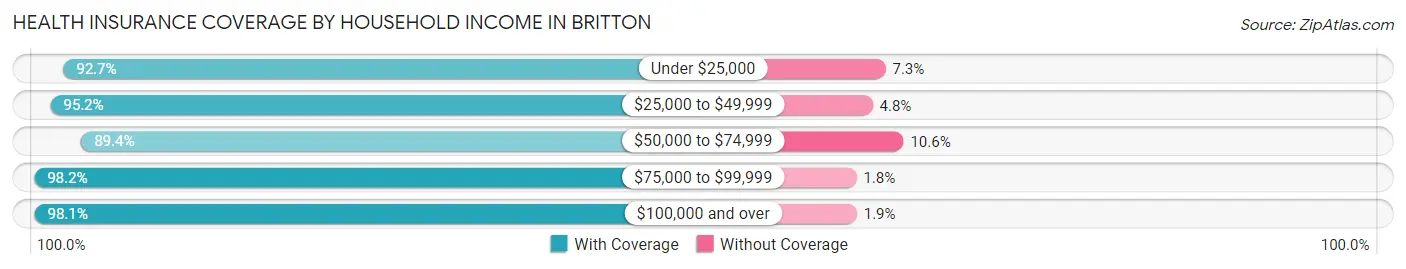
| Household Income | With Coverage | Without Coverage |
| Under $25,000 | 115 (92.7%) | 9 (7.3%) |
| $25,000 to $49,999 | 138 (95.2%) | 7 (4.8%) |
| $50,000 to $74,999 | 101 (89.4%) | 12 (10.6%) |
| $75,000 to $99,999 | 272 (98.2%) | 5 (1.8%) |
| $100,000 and over | 368 (98.1%) | 7 (1.9%) |
Public vs Private Health Insurance Coverage by Age in Britton
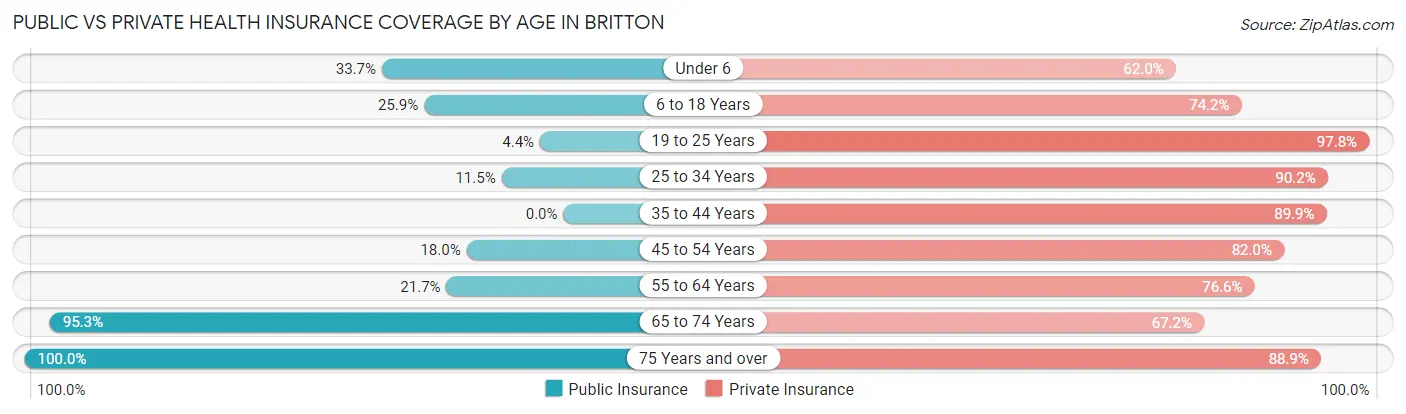
| Age Bracket | Public Insurance | Private Insurance |
| Under 6 | 31 (33.7%) | 57 (62.0%) |
| 6 to 18 Years | 38 (25.9%) | 109 (74.2%) |
| 19 to 25 Years | 6 (4.3%) | 135 (97.8%) |
| 25 to 34 Years | 14 (11.5%) | 110 (90.2%) |
| 35 to 44 Years | 0 (0.0%) | 107 (89.9%) |
| 45 to 54 Years | 16 (18.0%) | 73 (82.0%) |
| 55 to 64 Years | 38 (21.7%) | 134 (76.6%) |
| 65 to 74 Years | 61 (95.3%) | 43 (67.2%) |
| 75 Years and over | 99 (100.0%) | 88 (88.9%) |
| Total | 303 (29.0%) | 856 (81.9%) |
Disability Status by Sex by Age in Britton
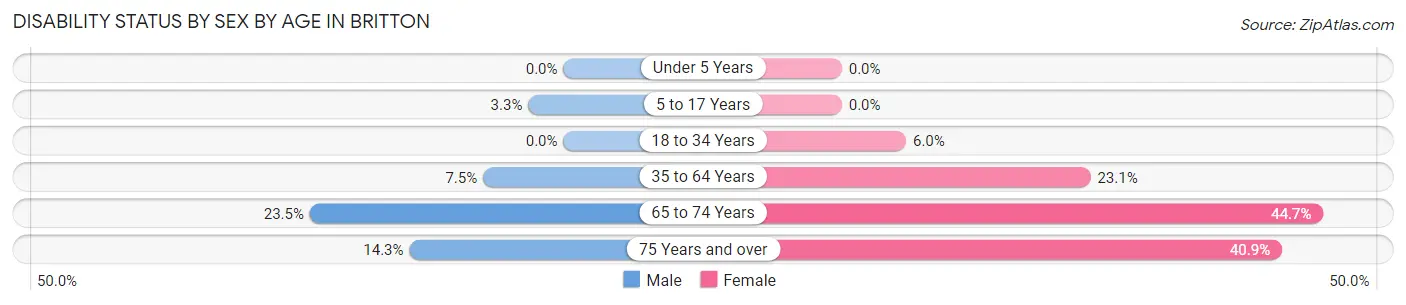
| Age Bracket | Male | Female |
| Under 5 Years | 0 (0.0%) | 0 (0.0%) |
| 5 to 17 Years | 3 (3.3%) | 0 (0.0%) |
| 18 to 34 Years | 0 (0.0%) | 9 (6.0%) |
| 35 to 64 Years | 14 (7.4%) | 45 (23.1%) |
| 65 to 74 Years | 4 (23.5%) | 21 (44.7%) |
| 75 Years and over | 4 (14.3%) | 29 (40.8%) |
Disability Class by Sex by Age in Britton
Disability Class: Hearing Difficulty
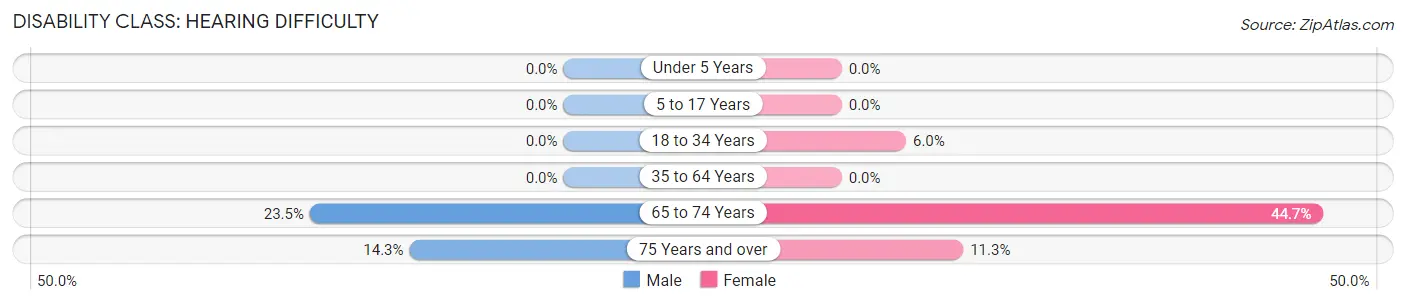
| Age Bracket | Male | Female |
| Under 5 Years | 0 (0.0%) | 0 (0.0%) |
| 5 to 17 Years | 0 (0.0%) | 0 (0.0%) |
| 18 to 34 Years | 0 (0.0%) | 9 (6.0%) |
| 35 to 64 Years | 0 (0.0%) | 0 (0.0%) |
| 65 to 74 Years | 4 (23.5%) | 21 (44.7%) |
| 75 Years and over | 4 (14.3%) | 8 (11.3%) |
Disability Class: Vision Difficulty
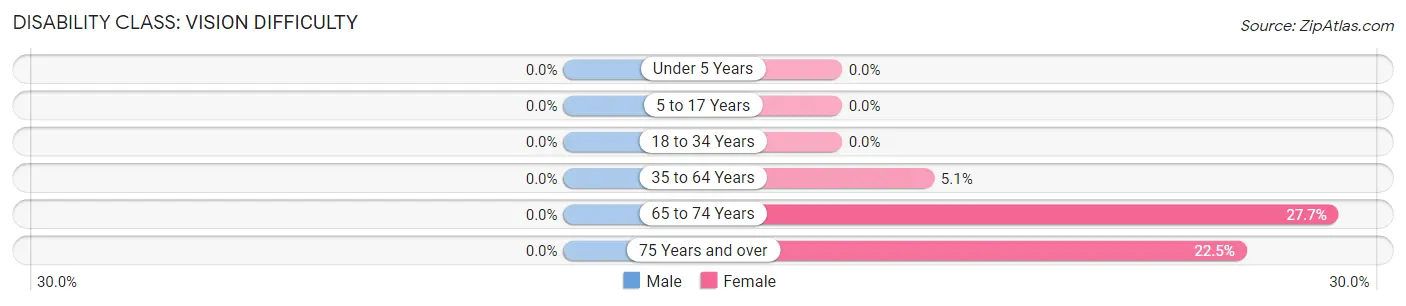
| Age Bracket | Male | Female |
| Under 5 Years | 0 (0.0%) | 0 (0.0%) |
| 5 to 17 Years | 0 (0.0%) | 0 (0.0%) |
| 18 to 34 Years | 0 (0.0%) | 0 (0.0%) |
| 35 to 64 Years | 0 (0.0%) | 10 (5.1%) |
| 65 to 74 Years | 0 (0.0%) | 13 (27.7%) |
| 75 Years and over | 0 (0.0%) | 16 (22.5%) |
Disability Class: Cognitive Difficulty
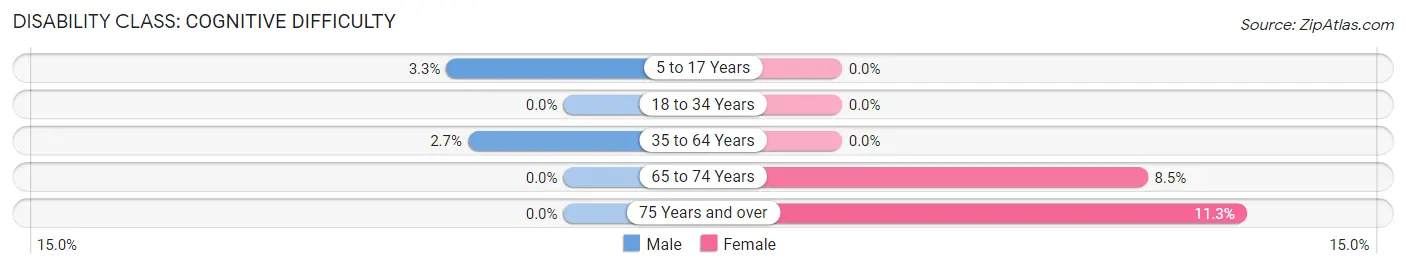
| Age Bracket | Male | Female |
| 5 to 17 Years | 3 (3.3%) | 0 (0.0%) |
| 18 to 34 Years | 0 (0.0%) | 0 (0.0%) |
| 35 to 64 Years | 5 (2.7%) | 0 (0.0%) |
| 65 to 74 Years | 0 (0.0%) | 4 (8.5%) |
| 75 Years and over | 0 (0.0%) | 8 (11.3%) |
Disability Class: Ambulatory Difficulty
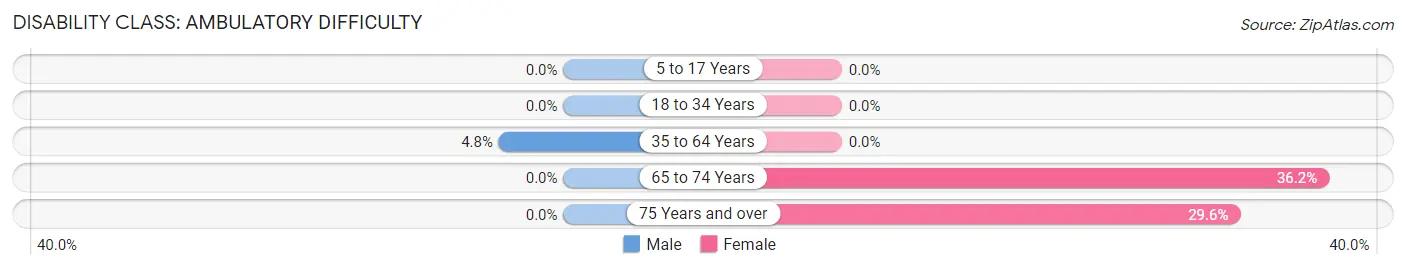
| Age Bracket | Male | Female |
| 5 to 17 Years | 0 (0.0%) | 0 (0.0%) |
| 18 to 34 Years | 0 (0.0%) | 0 (0.0%) |
| 35 to 64 Years | 9 (4.8%) | 0 (0.0%) |
| 65 to 74 Years | 0 (0.0%) | 17 (36.2%) |
| 75 Years and over | 0 (0.0%) | 21 (29.6%) |
Disability Class: Self-Care Difficulty
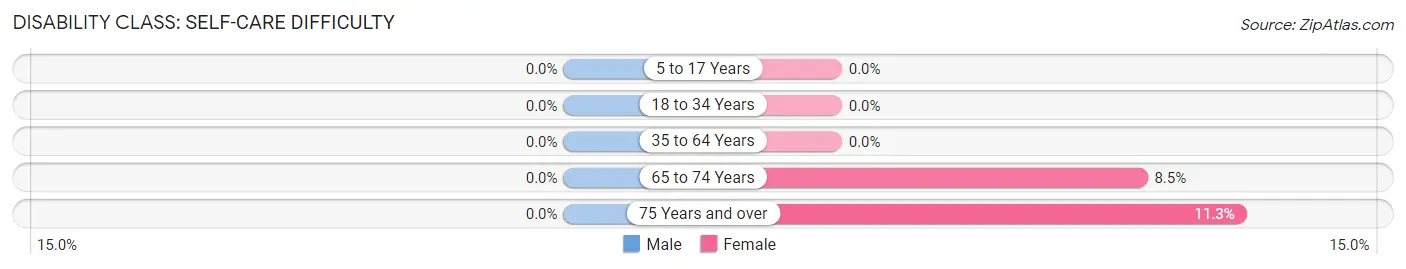
| Age Bracket | Male | Female |
| 5 to 17 Years | 0 (0.0%) | 0 (0.0%) |
| 18 to 34 Years | 0 (0.0%) | 0 (0.0%) |
| 35 to 64 Years | 0 (0.0%) | 0 (0.0%) |
| 65 to 74 Years | 0 (0.0%) | 4 (8.5%) |
| 75 Years and over | 0 (0.0%) | 8 (11.3%) |
Technology Access in Britton
Computing Device Access in Britton
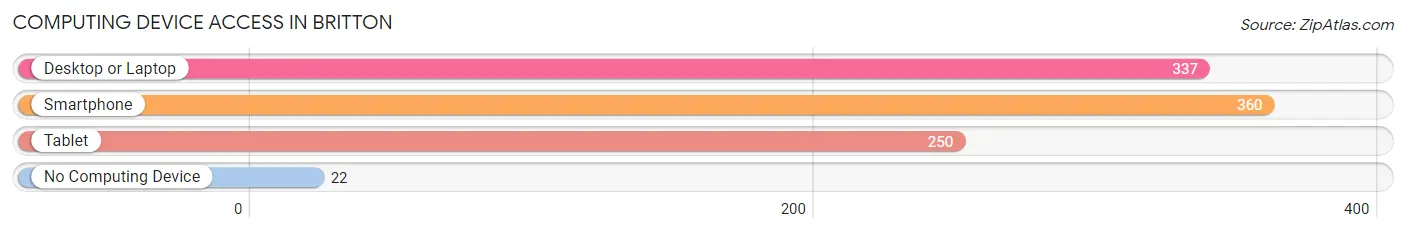
| Device Type | # Households | % Households |
| Desktop or Laptop | 337 | 78.0% |
| Smartphone | 360 | 83.3% |
| Tablet | 250 | 57.9% |
| No Computing Device | 22 | 5.1% |
| Total | 432 | 100.0% |
Internet Access in Britton
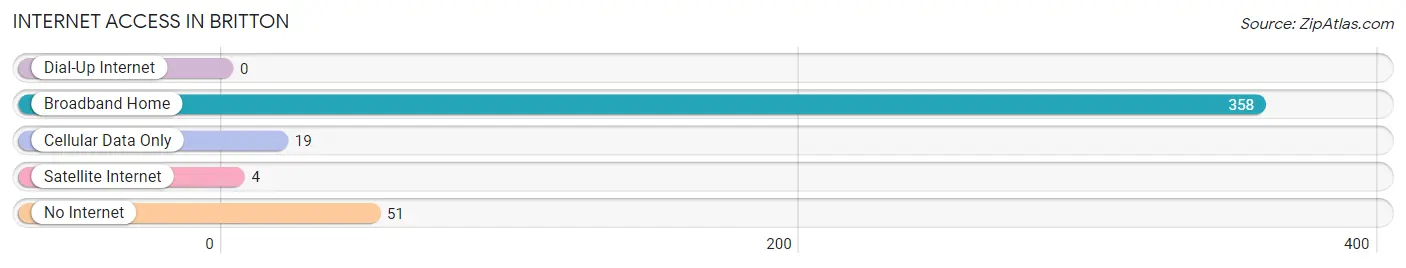
| Internet Type | # Households | % Households |
| Dial-Up Internet | 0 | 0.0% |
| Broadband Home | 358 | 82.9% |
| Cellular Data Only | 19 | 4.4% |
| Satellite Internet | 4 | 0.9% |
| No Internet | 51 | 11.8% |
| Total | 432 | 100.0% |
Britton Summary
Britton is a city located in Marshall County, South Dakota, United States. It is the county seat of Marshall County and is located along the James River. The population was 1,541 at the 2010 census.
History
The area that is now Britton was first settled in 1879 by a group of Norwegian immigrants. The town was originally named Norway, but was later changed to Britton in honor of the first postmaster, John Britton. The town was officially incorporated in 1883.
In the early 1900s, Britton was a thriving agricultural community. The town was home to several grain elevators, a creamery, a flour mill, and a lumber yard. The railroad also played an important role in the town's development, as it provided transportation for goods and people.
Geography
Britton is located at 45°45'25" North, 97°25'45" West (45.756944, -97.429167). According to the United States Census Bureau, the city has a total area of 1.2 square miles (3.1 km2), all of it land.
Economy
Britton's economy is largely based on agriculture. The town is home to several grain elevators, a feed mill, and a fertilizer plant. The town also has a number of small businesses, including a grocery store, a hardware store, and a restaurant.
Demographics
As of the census of 2010, there were 1,541 people, 645 households, and 393 families residing in the city. The population density was 1,279.2 people per square mile (492.3/km2). There were 717 housing units at an average density of 598.3 per square mile (231.2/km2). The racial makeup of the city was 97.2% White, 0.2% African American, 0.4% Native American, 0.2% Asian, 0.2% from other races, and 1.8% from two or more races. Hispanic or Latino of any race were 1.2% of the population.
There were 645 households, out of which 28.2% had children under the age of 18 living with them, 48.2% were married couples living together, 8.3% had a female householder with no husband present, and 39.7% were non-families. 35.3% of all households were made up of individuals, and 19.7% had someone living alone who was 65 years of age or older. The average household size was 2.30 and the average family size was 2.97.
In the city, the population was spread out, with 24.7% under the age of 18, 6.7% from 18 to 24, 23.2% from 25 to 44, 22.2% from 45 to 64, and 23.2% who were 65 years of age or older. The median age was 41 years. For every 100 females, there were 87.2 males. For every 100 females age 18 and over, there were 83.2 males.
The median income for a household in the city was $31,250, and the median income for a family was $41,250. Males had a median income of $30,000 versus $20,000 for females. The per capita income for the city was $17,845. About 8.2% of families and 11.2% of the population were below the poverty line, including 14.2% of those under age 18 and 10.2% of those age 65 or over.
Common Questions
What is Per Capita Income in Britton?
Per Capita income in Britton is $33,126.
What is the Median Family Income in Britton?
Median Family Income in Britton is $93,889.
What is the Median Household income in Britton?
Median Household Income in Britton is $69,375.
What is Income or Wage Gap in Britton?
Income or Wage Gap in Britton is 32.6%.
Women in Britton earn 67.4 cents for every dollar earned by a man.
What is Inequality or Gini Index in Britton?
Inequality or Gini Index in Britton is 0.38.
What is the Total Population of Britton?
Total Population of Britton is 1,108.
What is the Total Male Population of Britton?
Total Male Population of Britton is 491.
What is the Total Female Population of Britton?
Total Female Population of Britton is 617.
What is the Ratio of Males per 100 Females in Britton?
There are 79.58 Males per 100 Females in Britton.
What is the Ratio of Females per 100 Males in Britton?
There are 125.66 Females per 100 Males in Britton.
What is the Median Population Age in Britton?
Median Population Age in Britton is 40.9 Years.
What is the Average Family Size in Britton
Average Family Size in Britton is 3.5 People.
What is the Average Household Size in Britton
Average Household Size in Britton is 2.4 People.
How Large is the Labor Force in Britton?
There are 582 People in the Labor Forcein in Britton.
What is the Percentage of People in the Labor Force in Britton?
64.5% of People are in the Labor Force in Britton.
What is the Unemployment Rate in Britton?
Unemployment Rate in Britton is 1.0%.