Armour, SD Map & Demographics
Armour Map
Armour Overview
$38,931
PER CAPITA INCOME
$75,938
AVG FAMILY INCOME
$60,341
AVG HOUSEHOLD INCOME
24.8%
WAGE / INCOME GAP [ % ]
75.2¢/ $1
WAGE / INCOME GAP [ $ ]
0.48
INEQUALITY / GINI INDEX
642
TOTAL POPULATION
322
MALE POPULATION
320
FEMALE POPULATION
100.62
MALES / 100 FEMALES
99.38
FEMALES / 100 MALES
46.4
MEDIAN AGE
2.9
AVG FAMILY SIZE
2.2
AVG HOUSEHOLD SIZE
304
LABOR FORCE [ PEOPLE ]
62.3%
PERCENT IN LABOR FORCE
1.3%
UNEMPLOYMENT RATE
Armour Zip Codes
Armour Area Codes
Income in Armour
Income Overview in Armour
Per Capita Income in Armour is $38,931, while median incomes of families and households are $75,938 and $60,341 respectively.
| Characteristic | Number | Measure |
| Per Capita Income | 642 | $38,931 |
| Median Family Income | 156 | $75,938 |
| Mean Family Income | 156 | $95,294 |
| Median Household Income | 269 | $60,341 |
| Mean Household Income | 269 | $87,103 |
| Income Deficit | 156 | $0 |
| Wage / Income Gap (%) | 642 | 24.79% |
| Wage / Income Gap ($) | 642 | 75.21¢ per $1 |
| Gini / Inequality Index | 642 | 0.48 |
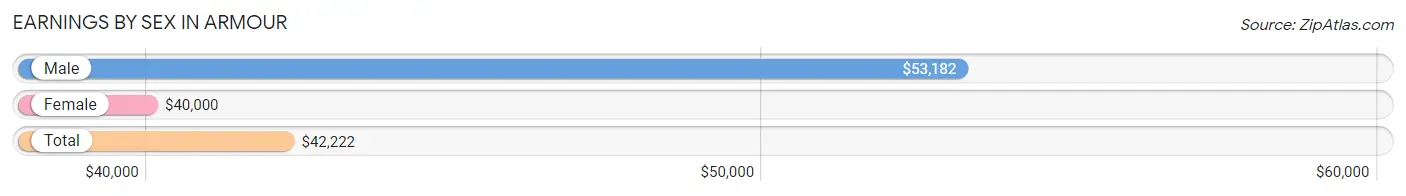
Earnings by Sex in Armour
Average Earnings in Armour are $42,222, $53,182 for men and $40,000 for women, a difference of 24.8%.
| Sex | Number | Average Earnings |
| Male | 166 (51.9%) | $53,182 |
| Female | 154 (48.1%) | $40,000 |
| Total | 320 (100.0%) | $42,222 |
Earnings by Sex by Income Bracket in Armour
The most common earnings brackets in Armour are $75,000 to $99,999 for men (28 | 16.9%) and $40,000 to $44,999 for women (37 | 24.0%).
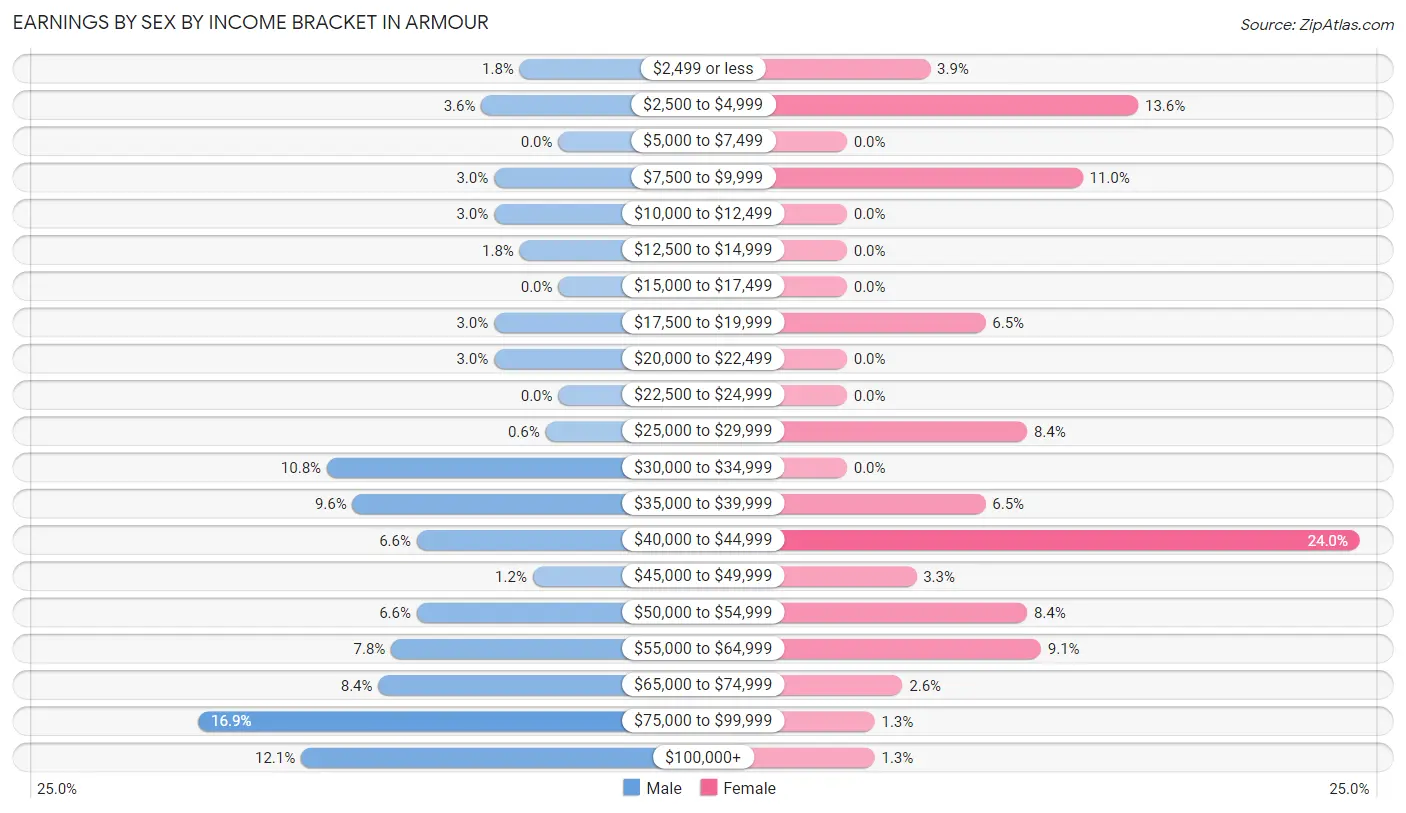
| Income | Male | Female |
| $2,499 or less | 3 (1.8%) | 6 (3.9%) |
| $2,500 to $4,999 | 6 (3.6%) | 21 (13.6%) |
| $5,000 to $7,499 | 0 (0.0%) | 0 (0.0%) |
| $7,500 to $9,999 | 5 (3.0%) | 17 (11.0%) |
| $10,000 to $12,499 | 5 (3.0%) | 0 (0.0%) |
| $12,500 to $14,999 | 3 (1.8%) | 0 (0.0%) |
| $15,000 to $17,499 | 0 (0.0%) | 0 (0.0%) |
| $17,500 to $19,999 | 5 (3.0%) | 10 (6.5%) |
| $20,000 to $22,499 | 5 (3.0%) | 0 (0.0%) |
| $22,500 to $24,999 | 0 (0.0%) | 0 (0.0%) |
| $25,000 to $29,999 | 1 (0.6%) | 13 (8.4%) |
| $30,000 to $34,999 | 18 (10.8%) | 0 (0.0%) |
| $35,000 to $39,999 | 16 (9.6%) | 10 (6.5%) |
| $40,000 to $44,999 | 11 (6.6%) | 37 (24.0%) |
| $45,000 to $49,999 | 2 (1.2%) | 5 (3.3%) |
| $50,000 to $54,999 | 11 (6.6%) | 13 (8.4%) |
| $55,000 to $64,999 | 13 (7.8%) | 14 (9.1%) |
| $65,000 to $74,999 | 14 (8.4%) | 4 (2.6%) |
| $75,000 to $99,999 | 28 (16.9%) | 2 (1.3%) |
| $100,000+ | 20 (12.0%) | 2 (1.3%) |
| Total | 166 (100.0%) | 154 (100.0%) |
Earnings by Sex by Educational Attainment in Armour
Average earnings in Armour are $55,536 for men and $40,833 for women, a difference of 26.5%. Men with an educational attainment of college or associate's degree enjoy the highest average annual earnings of $58,438, while those with bachelor's degree education earn the least with $52,813. Women with an educational attainment of graduate degree earn the most with the average annual earnings of $53,125, while those with bachelor's degree education have the smallest earnings of $40,179.
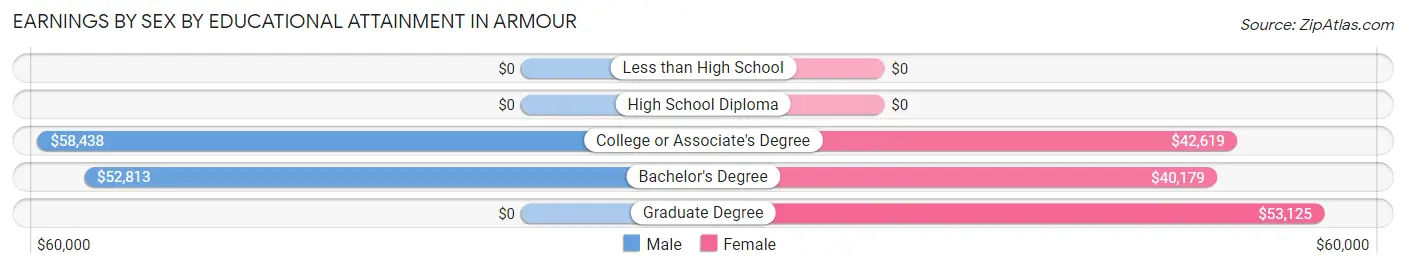
| Educational Attainment | Male Income | Female Income |
| Less than High School | - | - |
| High School Diploma | - | - |
| College or Associate's Degree | $58,438 | $42,619 |
| Bachelor's Degree | $52,813 | $40,179 |
| Graduate Degree | - | - |
| Total | $55,536 | $40,833 |
Family Income in Armour
Family Income Brackets in Armour
According to the Armour family income data, there are 37 families falling into the $35,000 to $49,999 income range, which is the most common income bracket and makes up 23.7% of all families.
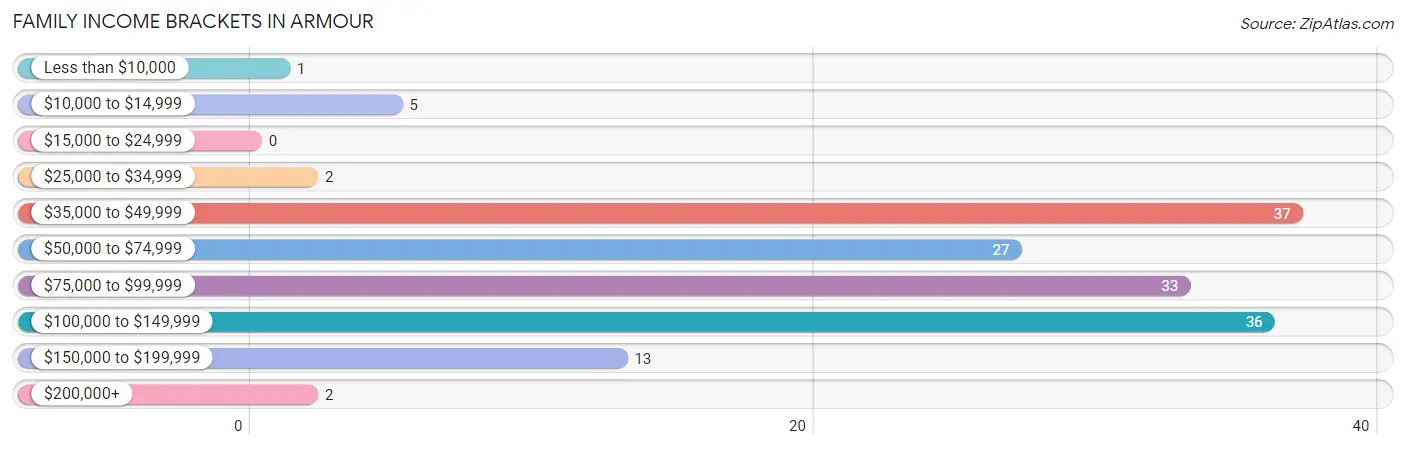
| Income Bracket | # Families | % Families |
| Less than $10,000 | 1 | 0.6% |
| $10,000 to $14,999 | 5 | 3.2% |
| $15,000 to $24,999 | 0 | 0.0% |
| $25,000 to $34,999 | 2 | 1.3% |
| $35,000 to $49,999 | 37 | 23.7% |
| $50,000 to $74,999 | 27 | 17.3% |
| $75,000 to $99,999 | 33 | 21.2% |
| $100,000 to $149,999 | 36 | 23.1% |
| $150,000 to $199,999 | 13 | 8.3% |
| $200,000+ | 2 | 1.3% |
Family Income by Famaliy Size in Armour
5-person families (19 | 12.2%) account for the highest median family income in Armour with $125,125 per family, while 2-person families (85 | 54.5%) have the highest median income of $38,086 per family member.
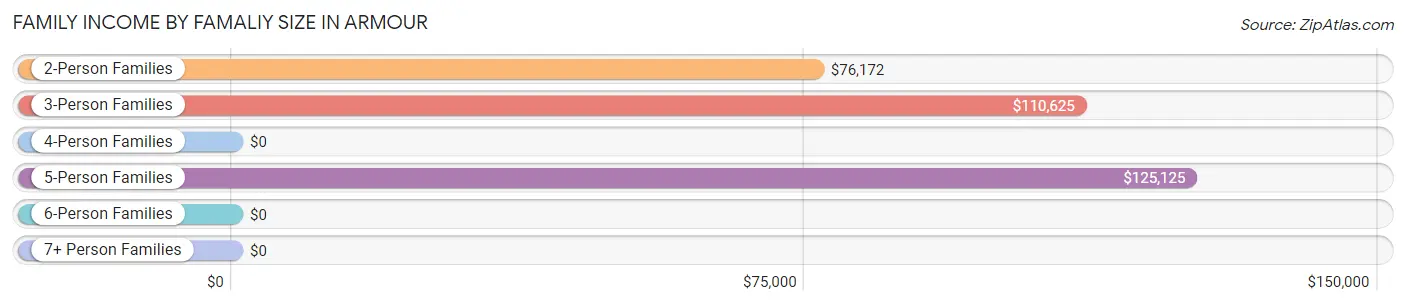
| Income Bracket | # Families | Median Income |
| 2-Person Families | 85 (54.5%) | $76,172 |
| 3-Person Families | 12 (7.7%) | $110,625 |
| 4-Person Families | 22 (14.1%) | $0 |
| 5-Person Families | 19 (12.2%) | $125,125 |
| 6-Person Families | 18 (11.5%) | $0 |
| 7+ Person Families | 0 (0.0%) | $0 |
| Total | 156 (100.0%) | $75,938 |
Family Income by Number of Earners in Armour
The median family income in Armour is $75,938, with families comprising 3+ earners (9) having the highest median family income of $111,563, while families with 1 earner (26) have the lowest median family income of $41,944, accounting for 5.8% and 16.7% of families, respectively.
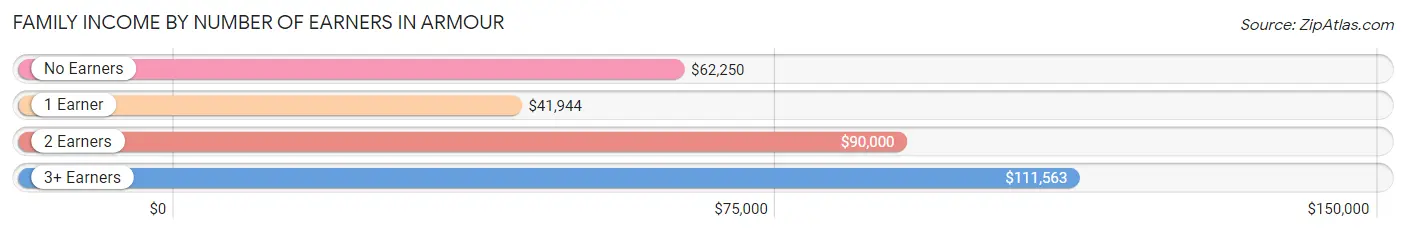
| Number of Earners | # Families | Median Income |
| No Earners | 31 (19.9%) | $62,250 |
| 1 Earner | 26 (16.7%) | $41,944 |
| 2 Earners | 90 (57.7%) | $90,000 |
| 3+ Earners | 9 (5.8%) | $111,563 |
| Total | 156 (100.0%) | $75,938 |
Household Income in Armour
Household Income Brackets in Armour
With 46 households falling in the category, the $35,000 to $49,999 income range is the most frequent in Armour, accounting for 17.1% of all households. In contrast, only 9 households (3.4%) fall into the less than $10,000 income bracket, making it the least populous group.
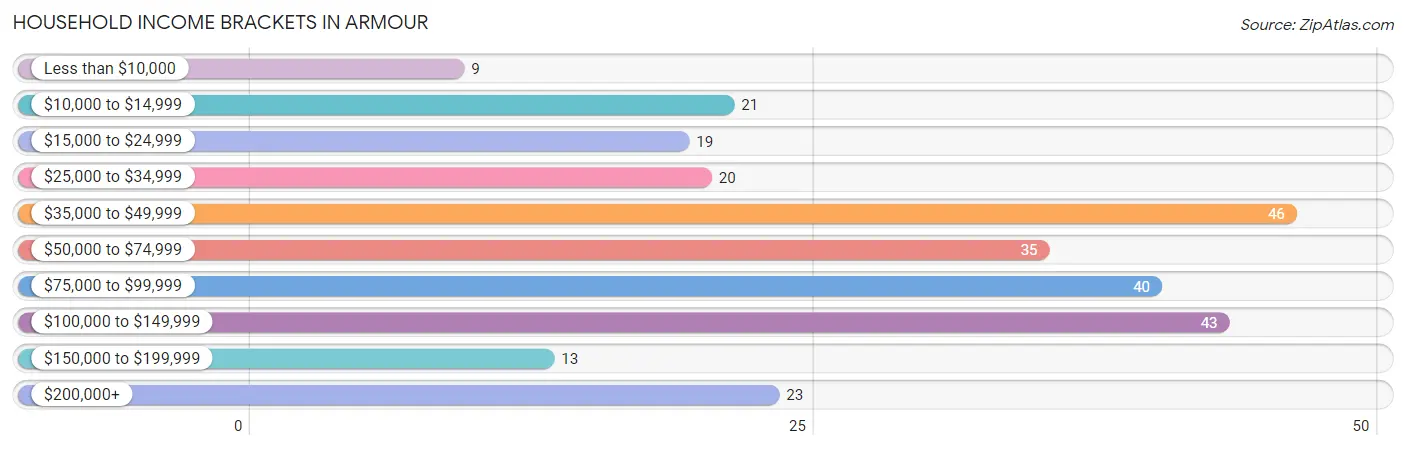
| Income Bracket | # Households | % Households |
| Less than $10,000 | 9 | 3.3% |
| $10,000 to $14,999 | 21 | 7.8% |
| $15,000 to $24,999 | 19 | 7.1% |
| $25,000 to $34,999 | 20 | 7.4% |
| $35,000 to $49,999 | 46 | 17.1% |
| $50,000 to $74,999 | 35 | 13.0% |
| $75,000 to $99,999 | 40 | 14.9% |
| $100,000 to $149,999 | 43 | 16.0% |
| $150,000 to $199,999 | 13 | 4.8% |
| $200,000+ | 23 | 8.6% |
Household Income by Householder Age in Armour
The median household income in Armour is $60,341, with the highest median household income of $113,750 found in the 45 to 64 years age bracket for the primary householder. A total of 90 households (33.5%) fall into this category. Meanwhile, the 15 to 24 years age bracket for the primary householder has the lowest median household income of $0, with 9 households (3.4%) in this group.
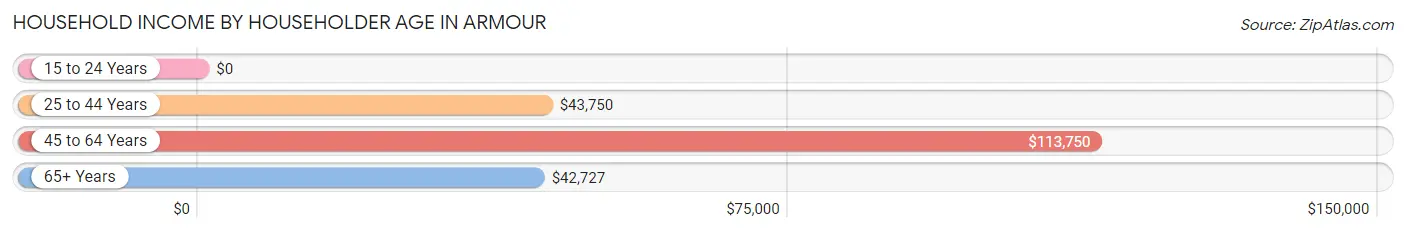
| Income Bracket | # Households | Median Income |
| 15 to 24 Years | 9 (3.4%) | $0 |
| 25 to 44 Years | 78 (29.0%) | $43,750 |
| 45 to 64 Years | 90 (33.5%) | $113,750 |
| 65+ Years | 92 (34.2%) | $42,727 |
| Total | 269 (100.0%) | $60,341 |
Poverty in Armour
Income Below Poverty by Sex and Age in Armour
With 19.6% poverty level for males and 14.8% for females among the residents of Armour, 12 to 14 year old males and 16 and 17 year old females are the most vulnerable to poverty, with 10 males (100.0%) and 3 females (37.5%) in their respective age groups living below the poverty level.
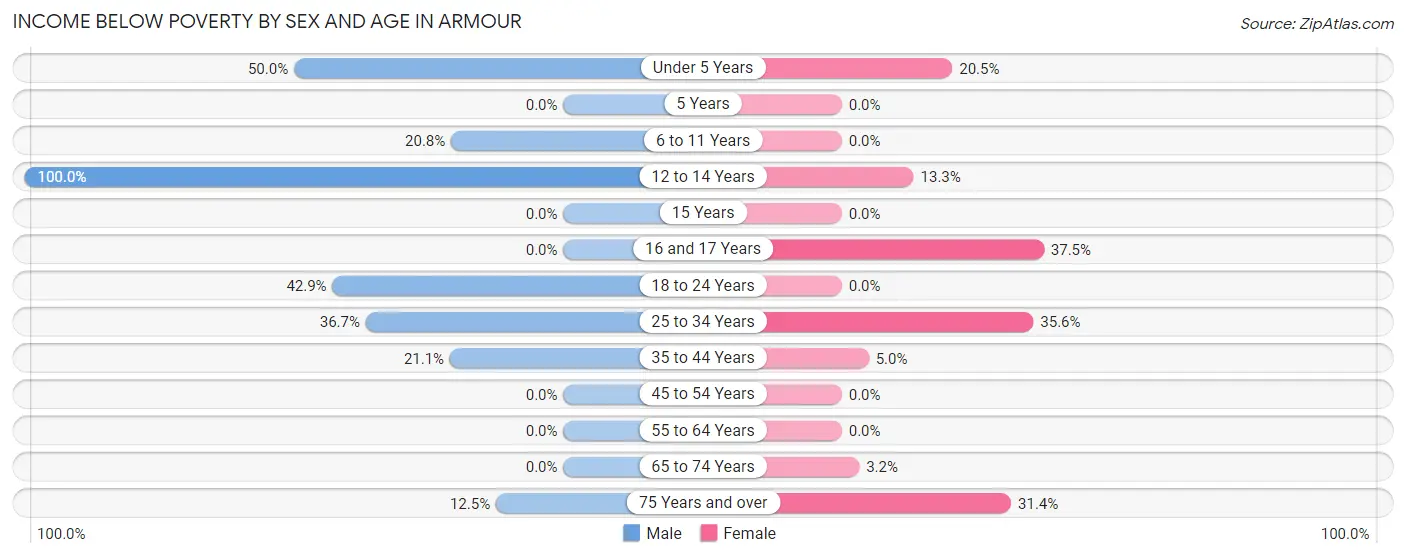
| Age Bracket | Male | Female |
| Under 5 Years | 11 (50.0%) | 8 (20.5%) |
| 5 Years | 0 (0.0%) | 0 (0.0%) |
| 6 to 11 Years | 10 (20.8%) | 0 (0.0%) |
| 12 to 14 Years | 10 (100.0%) | 2 (13.3%) |
| 15 Years | 0 (0.0%) | 0 (0.0%) |
| 16 and 17 Years | 0 (0.0%) | 3 (37.5%) |
| 18 to 24 Years | 6 (42.9%) | 0 (0.0%) |
| 25 to 34 Years | 11 (36.7%) | 16 (35.6%) |
| 35 to 44 Years | 8 (21.0%) | 1 (5.0%) |
| 45 to 54 Years | 0 (0.0%) | 0 (0.0%) |
| 55 to 64 Years | 0 (0.0%) | 0 (0.0%) |
| 65 to 74 Years | 0 (0.0%) | 1 (3.2%) |
| 75 Years and over | 5 (12.5%) | 11 (31.4%) |
| Total | 61 (19.6%) | 42 (14.8%) |
Income Above Poverty by Sex and Age in Armour
According to the poverty statistics in Armour, males aged 16 and 17 years and females aged 6 to 11 years are the age groups that are most secure financially, with 100.0% of males and 100.0% of females in these age groups living above the poverty line.
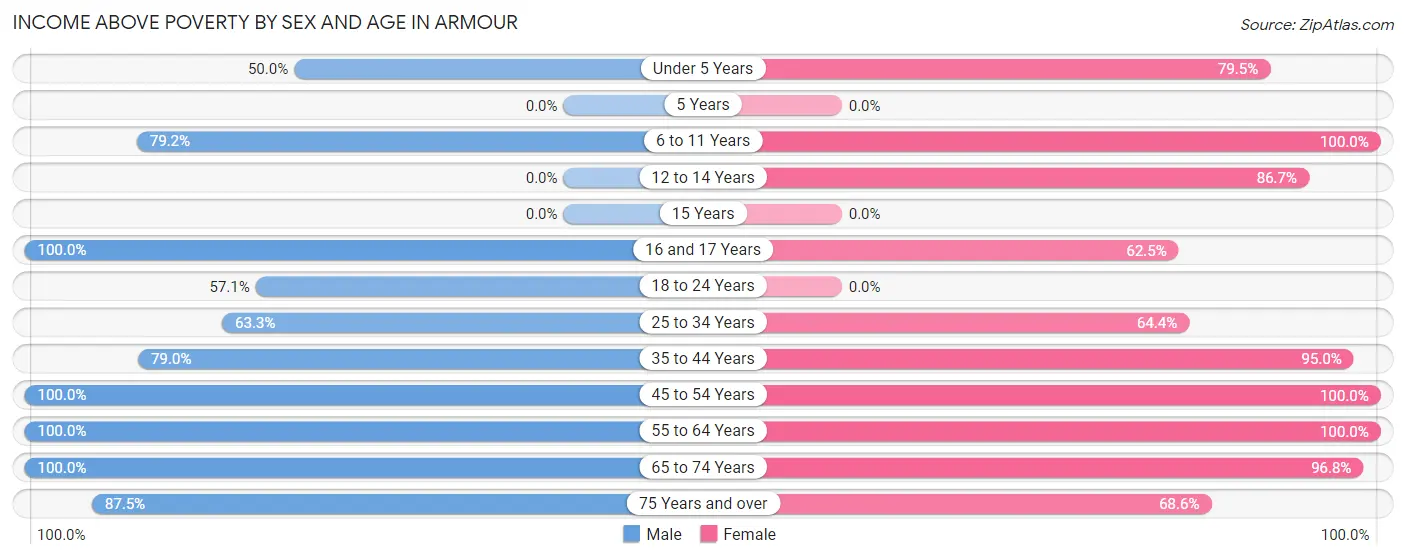
| Age Bracket | Male | Female |
| Under 5 Years | 11 (50.0%) | 31 (79.5%) |
| 5 Years | 0 (0.0%) | 0 (0.0%) |
| 6 to 11 Years | 38 (79.2%) | 20 (100.0%) |
| 12 to 14 Years | 0 (0.0%) | 13 (86.7%) |
| 15 Years | 0 (0.0%) | 0 (0.0%) |
| 16 and 17 Years | 5 (100.0%) | 5 (62.5%) |
| 18 to 24 Years | 8 (57.1%) | 0 (0.0%) |
| 25 to 34 Years | 19 (63.3%) | 29 (64.4%) |
| 35 to 44 Years | 30 (78.9%) | 19 (95.0%) |
| 45 to 54 Years | 22 (100.0%) | 26 (100.0%) |
| 55 to 64 Years | 51 (100.0%) | 44 (100.0%) |
| 65 to 74 Years | 31 (100.0%) | 30 (96.8%) |
| 75 Years and over | 35 (87.5%) | 24 (68.6%) |
| Total | 250 (80.4%) | 241 (85.2%) |
Income Below Poverty Among Married-Couple Families in Armour
The poverty statistics for married-couple families in Armour show that 12.5% or 16 of the total 128 families live below the poverty line. Families with 3 or 4 children have the highest poverty rate of 47.1%, comprising of 16 families. On the other hand, families with no children have the lowest poverty rate of 0.0%, which includes 0 families.
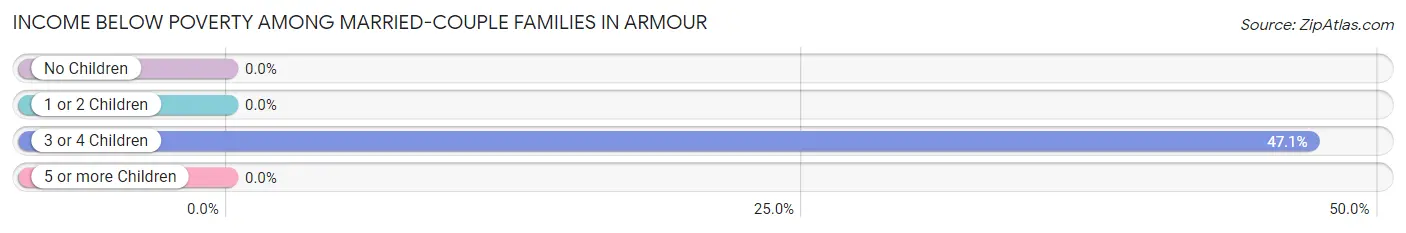
| Children | Above Poverty | Below Poverty |
| No Children | 70 (100.0%) | 0 (0.0%) |
| 1 or 2 Children | 24 (100.0%) | 0 (0.0%) |
| 3 or 4 Children | 18 (52.9%) | 16 (47.1%) |
| 5 or more Children | 0 (0.0%) | 0 (0.0%) |
| Total | 112 (87.5%) | 16 (12.5%) |
Income Below Poverty Among Single-Parent Households in Armour
According to the poverty data in Armour, 27.8% or 5 single-father households and 10.0% or 1 single-mother households are living below the poverty line. Among single-father households, those with 1 or 2 children have the highest poverty rate, with 5 households (41.7%) experiencing poverty. Likewise, among single-mother households, those with 1 or 2 children have the highest poverty rate, with 1 households (10.0%) falling below the poverty line.
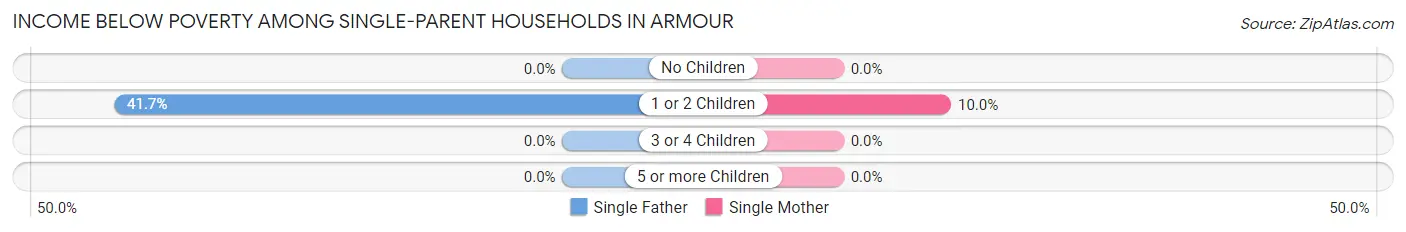
| Children | Single Father | Single Mother |
| No Children | 0 (0.0%) | 0 (0.0%) |
| 1 or 2 Children | 5 (41.7%) | 1 (10.0%) |
| 3 or 4 Children | 0 (0.0%) | 0 (0.0%) |
| 5 or more Children | 0 (0.0%) | 0 (0.0%) |
| Total | 5 (27.8%) | 1 (10.0%) |
Income Below Poverty Among Married-Couple vs Single-Parent Households in Armour
The poverty data for Armour shows that 16 of the married-couple family households (12.5%) and 6 of the single-parent households (21.4%) are living below the poverty level. Within the married-couple family households, those with 3 or 4 children have the highest poverty rate, with 16 households (47.1%) falling below the poverty line. Among the single-parent households, those with 1 or 2 children have the highest poverty rate, with 6 household (27.3%) living below poverty.
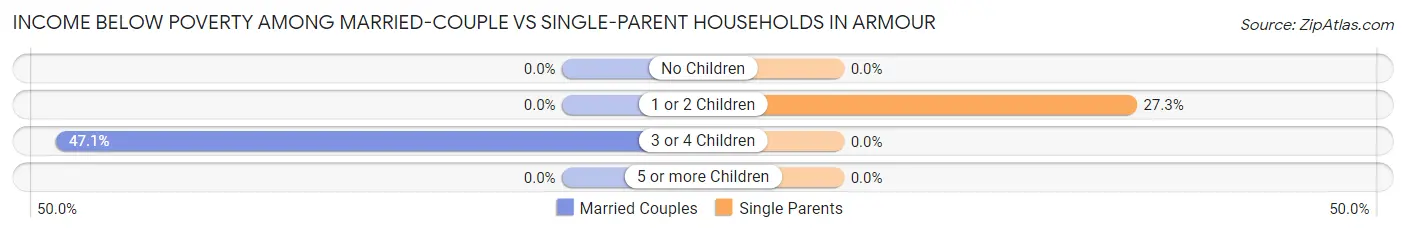
| Children | Married-Couple Families | Single-Parent Households |
| No Children | 0 (0.0%) | 0 (0.0%) |
| 1 or 2 Children | 0 (0.0%) | 6 (27.3%) |
| 3 or 4 Children | 16 (47.1%) | 0 (0.0%) |
| 5 or more Children | 0 (0.0%) | 0 (0.0%) |
| Total | 16 (12.5%) | 6 (21.4%) |
Race in Armour
The most populous races in Armour are White / Caucasian (555 | 86.5%), Black / African American (47 | 7.3%), and Hispanic or Latino (34 | 5.3%).
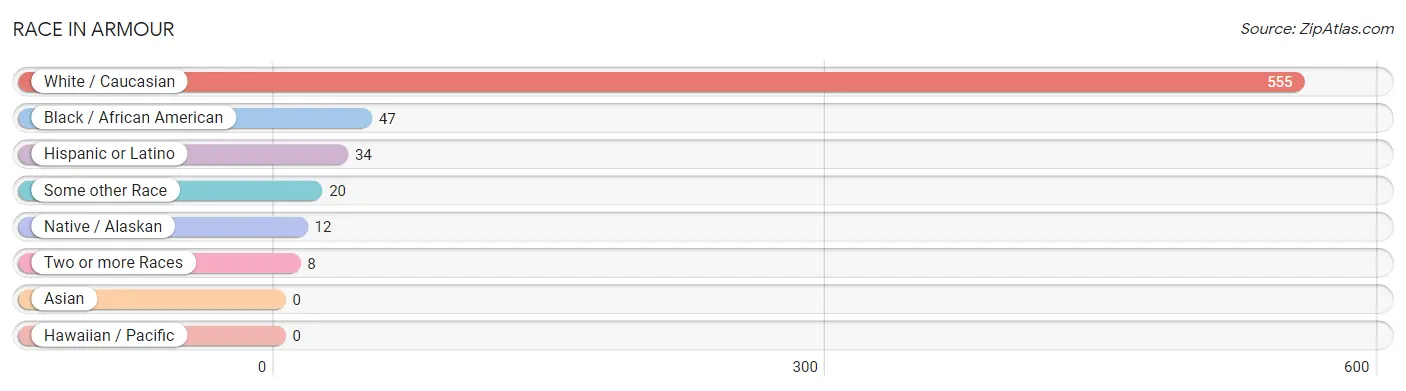
| Race | # Population | % Population |
| Asian | 0 | 0.0% |
| Black / African American | 47 | 7.3% |
| Hawaiian / Pacific | 0 | 0.0% |
| Hispanic or Latino | 34 | 5.3% |
| Native / Alaskan | 12 | 1.9% |
| White / Caucasian | 555 | 86.5% |
| Two or more Races | 8 | 1.3% |
| Some other Race | 20 | 3.1% |
| Total | 642 | 100.0% |
Ancestry in Armour
The most populous ancestries reported in Armour are German (226 | 35.2%), American (78 | 12.1%), Irish (56 | 8.7%), Dutch (48 | 7.5%), and Norwegian (46 | 7.2%), together accounting for 70.7% of all Armour residents.
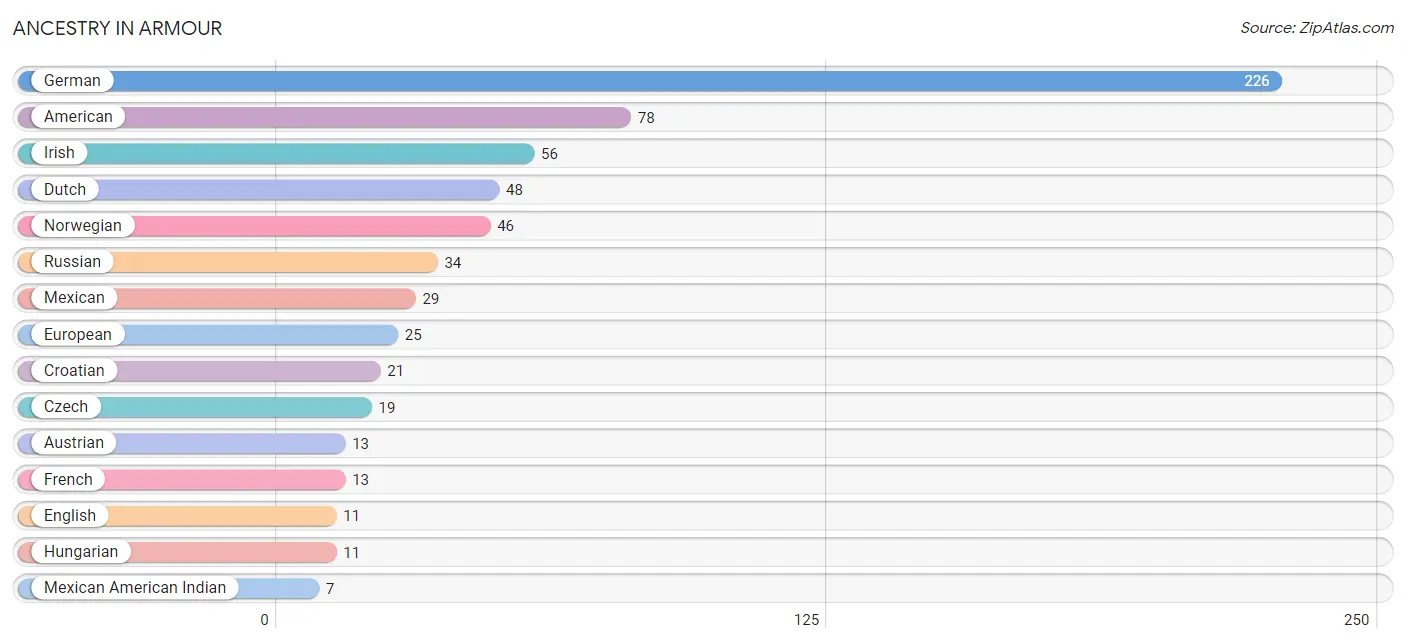
| Ancestry | # Population | % Population |
| American | 78 | 12.1% |
| Arab | 2 | 0.3% |
| Austrian | 13 | 2.0% |
| Central American | 5 | 0.8% |
| Croatian | 21 | 3.3% |
| Czech | 19 | 3.0% |
| Danish | 1 | 0.2% |
| Dutch | 48 | 7.5% |
| English | 11 | 1.7% |
| European | 25 | 3.9% |
| French | 13 | 2.0% |
| German | 226 | 35.2% |
| Hungarian | 11 | 1.7% |
| Irish | 56 | 8.7% |
| Mexican | 29 | 4.5% |
| Mexican American Indian | 7 | 1.1% |
| Norwegian | 46 | 7.2% |
| Palestinian | 2 | 0.3% |
| Pennsylvania German | 4 | 0.6% |
| Russian | 34 | 5.3% |
| Salvadoran | 5 | 0.8% |
| Scandinavian | 1 | 0.2% |
| Scotch-Irish | 3 | 0.5% |
| Sioux | 5 | 0.8% |
| Swedish | 2 | 0.3% | View All 25 Rows |
Immigrants in Armour
The most numerous immigrant groups reported in Armour came from Central America (25 | 3.9%), Latin America (25 | 3.9%), Mexico (20 | 3.1%), and El Salvador (5 | 0.8%), together accounting for 11.7% of all Armour residents.
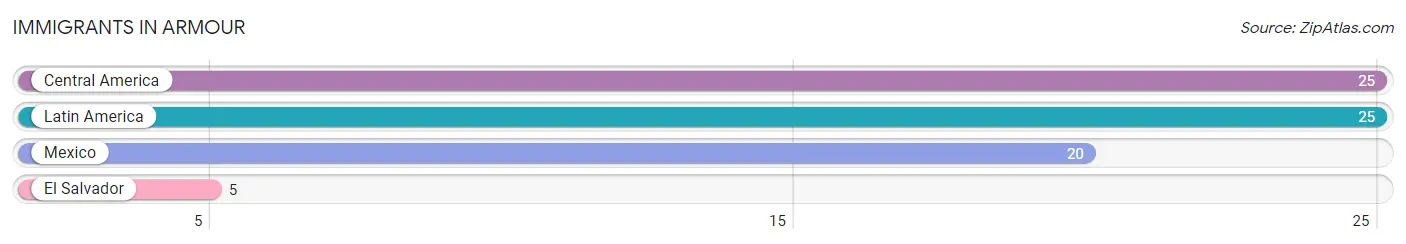
| Immigration Origin | # Population | % Population |
| Central America | 25 | 3.9% |
| El Salvador | 5 | 0.8% |
| Latin America | 25 | 3.9% |
| Mexico | 20 | 3.1% | View All 4 Rows |
Sex and Age in Armour
Sex and Age in Armour
The most populous age groups in Armour are 10 to 14 Years (32 | 9.9%) for men and 85 Years and over (47 | 14.7%) for women.
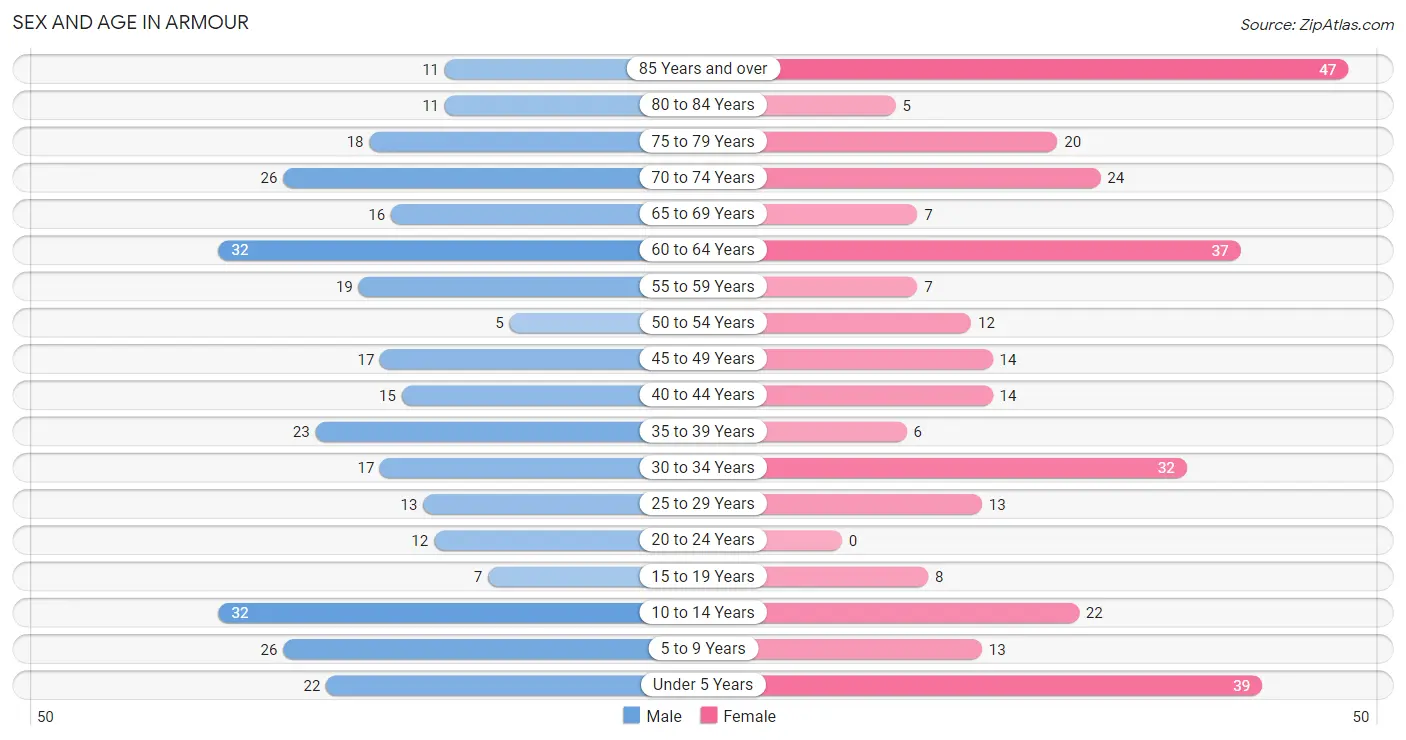
| Age Bracket | Male | Female |
| Under 5 Years | 22 (6.8%) | 39 (12.2%) |
| 5 to 9 Years | 26 (8.1%) | 13 (4.1%) |
| 10 to 14 Years | 32 (9.9%) | 22 (6.9%) |
| 15 to 19 Years | 7 (2.2%) | 8 (2.5%) |
| 20 to 24 Years | 12 (3.7%) | 0 (0.0%) |
| 25 to 29 Years | 13 (4.0%) | 13 (4.1%) |
| 30 to 34 Years | 17 (5.3%) | 32 (10.0%) |
| 35 to 39 Years | 23 (7.1%) | 6 (1.9%) |
| 40 to 44 Years | 15 (4.7%) | 14 (4.4%) |
| 45 to 49 Years | 17 (5.3%) | 14 (4.4%) |
| 50 to 54 Years | 5 (1.5%) | 12 (3.7%) |
| 55 to 59 Years | 19 (5.9%) | 7 (2.2%) |
| 60 to 64 Years | 32 (9.9%) | 37 (11.6%) |
| 65 to 69 Years | 16 (5.0%) | 7 (2.2%) |
| 70 to 74 Years | 26 (8.1%) | 24 (7.5%) |
| 75 to 79 Years | 18 (5.6%) | 20 (6.2%) |
| 80 to 84 Years | 11 (3.4%) | 5 (1.6%) |
| 85 Years and over | 11 (3.4%) | 47 (14.7%) |
| Total | 322 (100.0%) | 320 (100.0%) |
Families and Households in Armour
Median Family Size in Armour
The median family size in Armour is 2.93 persons per family, with single female/mother families (10 | 6.4%) accounting for the largest median family size of 3.5 persons per family. On the other hand, single male/father families (18 | 11.5%) represent the smallest median family size with 1.83 persons per family.
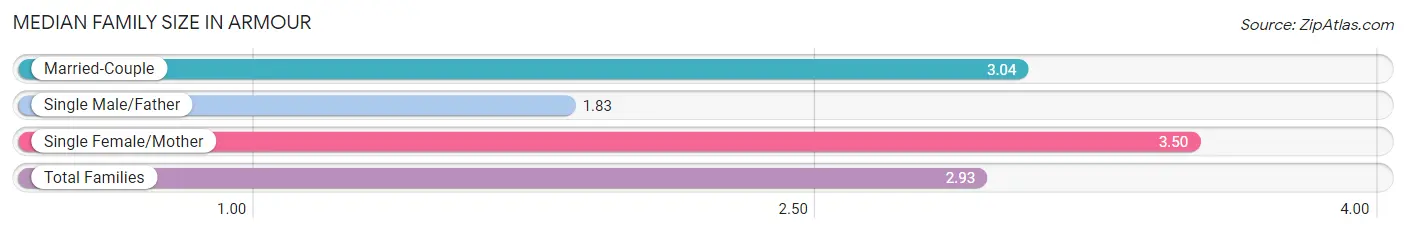
| Family Type | # Families | Family Size |
| Married-Couple | 128 (82.1%) | 3.04 |
| Single Male/Father | 18 (11.5%) | 1.83 |
| Single Female/Mother | 10 (6.4%) | 3.50 |
| Total Families | 156 (100.0%) | 2.93 |
Median Household Size in Armour
The median household size in Armour is 2.18 persons per household, with single female/mother households (10 | 3.7%) accounting for the largest median household size of 4.3 persons per household. non-family households (113 | 42.0%) represent the smallest median household size with 1.02 persons per household.
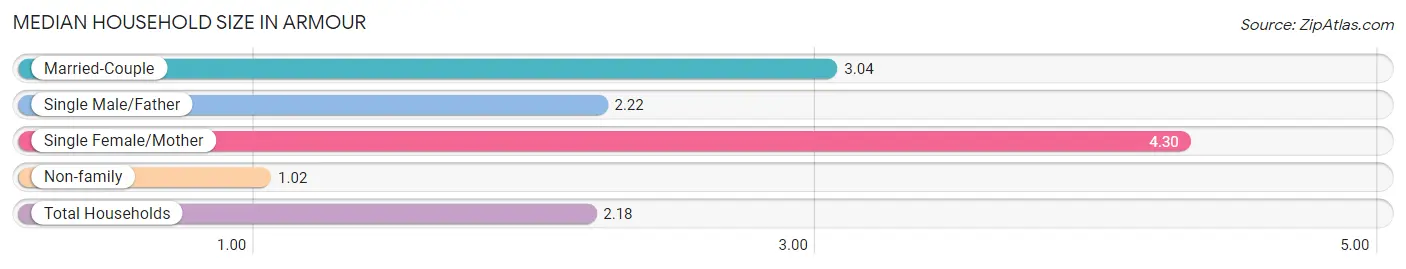
| Household Type | # Households | Household Size |
| Married-Couple | 128 (47.6%) | 3.04 |
| Single Male/Father | 18 (6.7%) | 2.22 |
| Single Female/Mother | 10 (3.7%) | 4.30 |
| Non-family | 113 (42.0%) | 1.02 |
| Total Households | 269 (100.0%) | 2.18 |
Household Size by Marriage Status in Armour
Out of a total of 269 households in Armour, 156 (58.0%) are family households, while 113 (42.0%) are nonfamily households. The most numerous type of family households are 2-person households, comprising 79, and the most common type of nonfamily households are 1-person households, comprising 109.
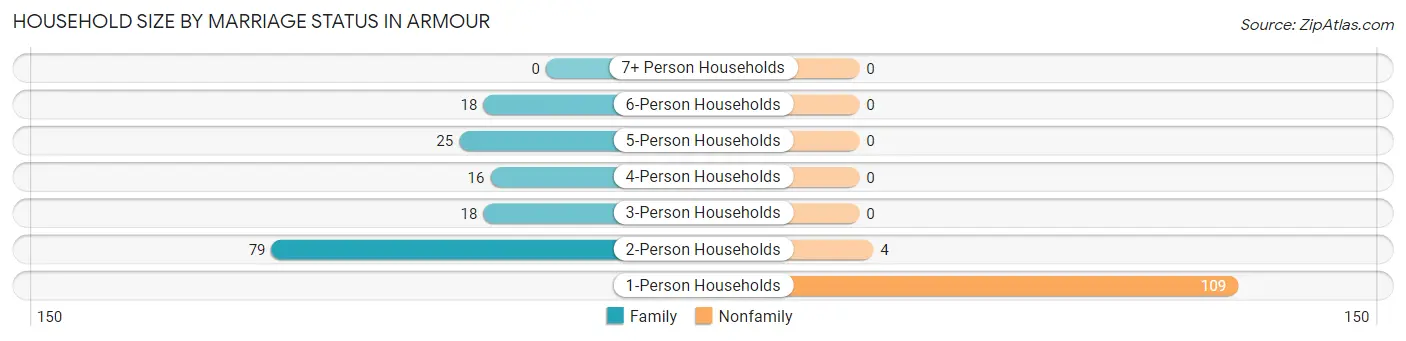
| Household Size | Family Households | Nonfamily Households |
| 1-Person Households | - | 109 (40.5%) |
| 2-Person Households | 79 (29.4%) | 4 (1.5%) |
| 3-Person Households | 18 (6.7%) | 0 (0.0%) |
| 4-Person Households | 16 (5.9%) | 0 (0.0%) |
| 5-Person Households | 25 (9.3%) | 0 (0.0%) |
| 6-Person Households | 18 (6.7%) | 0 (0.0%) |
| 7+ Person Households | 0 (0.0%) | 0 (0.0%) |
| Total | 156 (58.0%) | 113 (42.0%) |
Female Fertility in Armour
Fertility by Age in Armour
Average fertility rate in Armour is 132.0 births per 1,000 women. Women in the age bracket of 35 to 50 years have the highest fertility rate with 158.0 births per 1,000 women. Women in the age bracket of 20 to 34 years acount for 50.0% of all women with births.
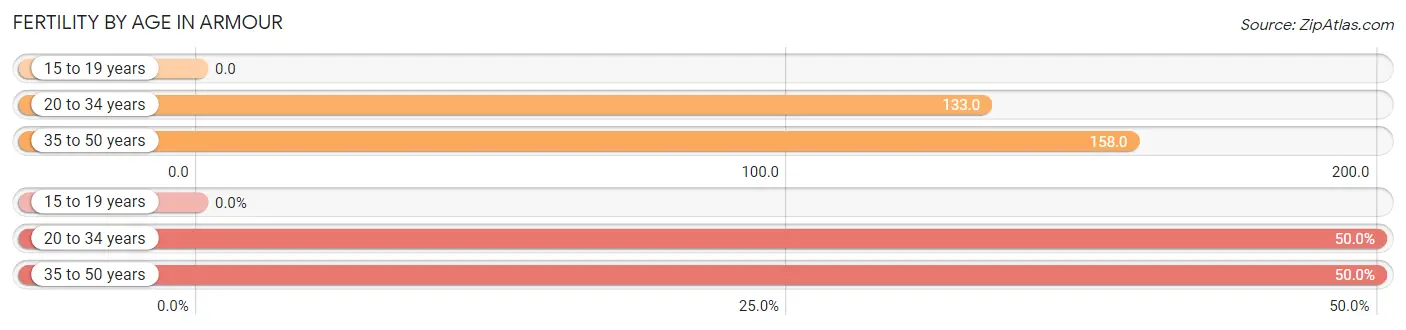
| Age Bracket | Women with Births | Births / 1,000 Women |
| 15 to 19 years | 0 (0.0%) | 0.0 |
| 20 to 34 years | 6 (50.0%) | 133.0 |
| 35 to 50 years | 6 (50.0%) | 158.0 |
| Total | 12 (100.0%) | 132.0 |
Fertility by Age by Marriage Status in Armour
50.0% of women with births (12) in Armour are married. The highest percentage of unmarried women with births falls into 35 to 50 years age bracket with 100.0% of them unmarried at the time of birth, while the lowest percentage of unmarried women with births belong to 20 to 34 years age bracket with 0.0% of them unmarried.
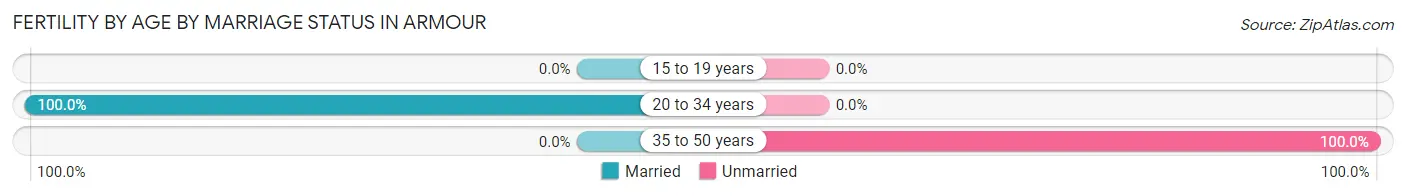
| Age Bracket | Married | Unmarried |
| 15 to 19 years | 0 (0.0%) | 0 (0.0%) |
| 20 to 34 years | 6 (100.0%) | 0 (0.0%) |
| 35 to 50 years | 0 (0.0%) | 6 (100.0%) |
| Total | 6 (50.0%) | 6 (50.0%) |
Fertility by Education in Armour
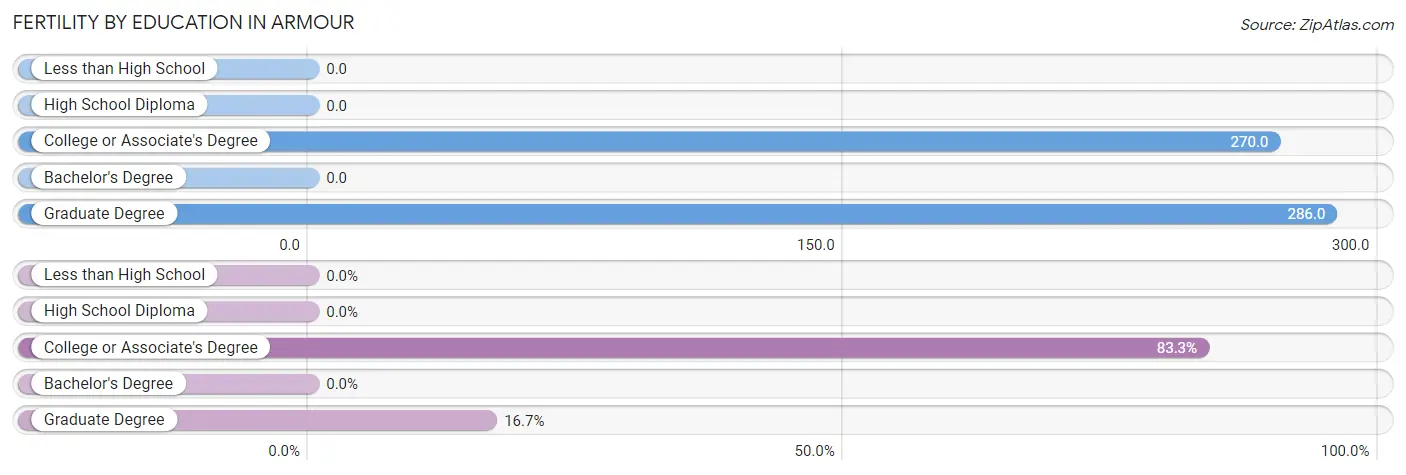
| Educational Attainment | Women with Births | Births / 1,000 Women |
| Less than High School | 0 (0.0%) | 0.0 |
| High School Diploma | 0 (0.0%) | 0.0 |
| College or Associate's Degree | 10 (83.3%) | 270.0 |
| Bachelor's Degree | 0 (0.0%) | 0.0 |
| Graduate Degree | 2 (16.7%) | 286.0 |
| Total | 12 (100.0%) | 132.0 |
Fertility by Education by Marriage Status in Armour
50.0% of women with births in Armour are unmarried. Women with the educational attainment of graduate degree are most likely to be married with 100.0% of them married at childbirth, while women with the educational attainment of college or associate's degree are least likely to be married with 60.0% of them unmarried at childbirth.
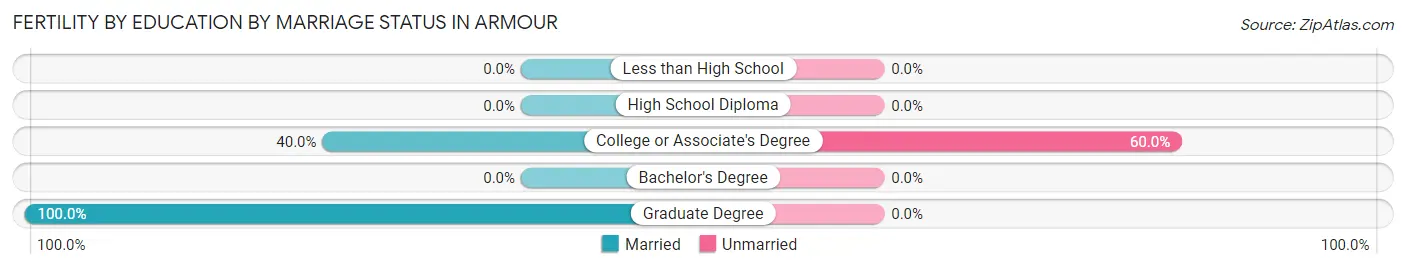
| Educational Attainment | Married | Unmarried |
| Less than High School | 0 (0.0%) | 0 (0.0%) |
| High School Diploma | 0 (0.0%) | 0 (0.0%) |
| College or Associate's Degree | 4 (40.0%) | 6 (60.0%) |
| Bachelor's Degree | 0 (0.0%) | 0 (0.0%) |
| Graduate Degree | 2 (100.0%) | 0 (0.0%) |
| Total | 6 (50.0%) | 6 (50.0%) |
Employment Characteristics in Armour
Employment by Class of Employer in Armour
Among the 300 employed individuals in Armour, private company employees (166 | 55.3%), self-employed (not incorporated) (43 | 14.3%), and local government employees (37 | 12.3%) make up the most common classes of employment.
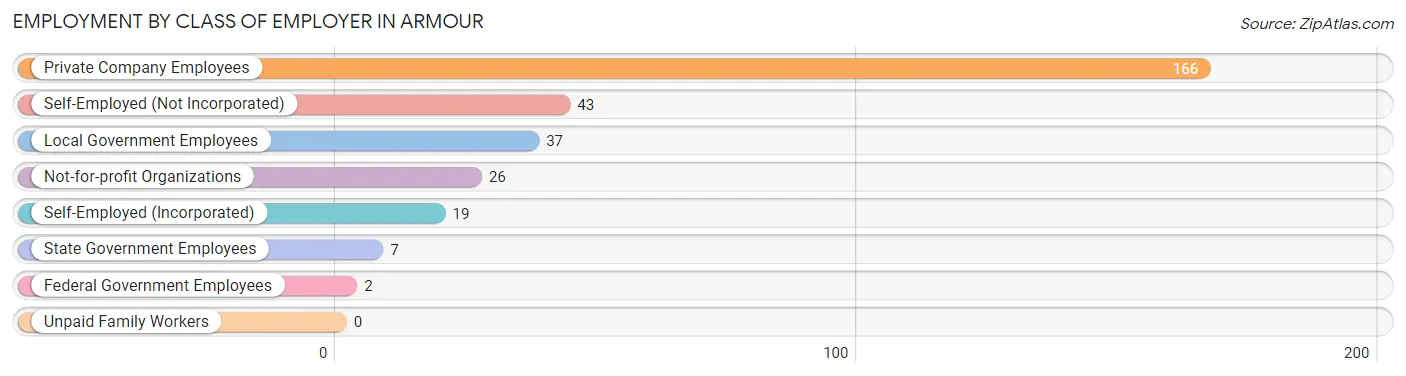
| Employer Class | # Employees | % Employees |
| Private Company Employees | 166 | 55.3% |
| Self-Employed (Incorporated) | 19 | 6.3% |
| Self-Employed (Not Incorporated) | 43 | 14.3% |
| Not-for-profit Organizations | 26 | 8.7% |
| Local Government Employees | 37 | 12.3% |
| State Government Employees | 7 | 2.3% |
| Federal Government Employees | 2 | 0.7% |
| Unpaid Family Workers | 0 | 0.0% |
| Total | 300 | 100.0% |
Employment Status by Age in Armour
According to the labor force statistics for Armour, out of the total population over 16 years of age (488), 62.3% or 304 individuals are in the labor force, with 1.3% or 4 of them unemployed. The age group with the highest labor force participation rate is 35 to 44 years, with 100.0% or 58 individuals in the labor force. Within the labor force, the 16 to 19 years age range has the highest percentage of unemployed individuals, with 37.5% or 3 of them being unemployed.
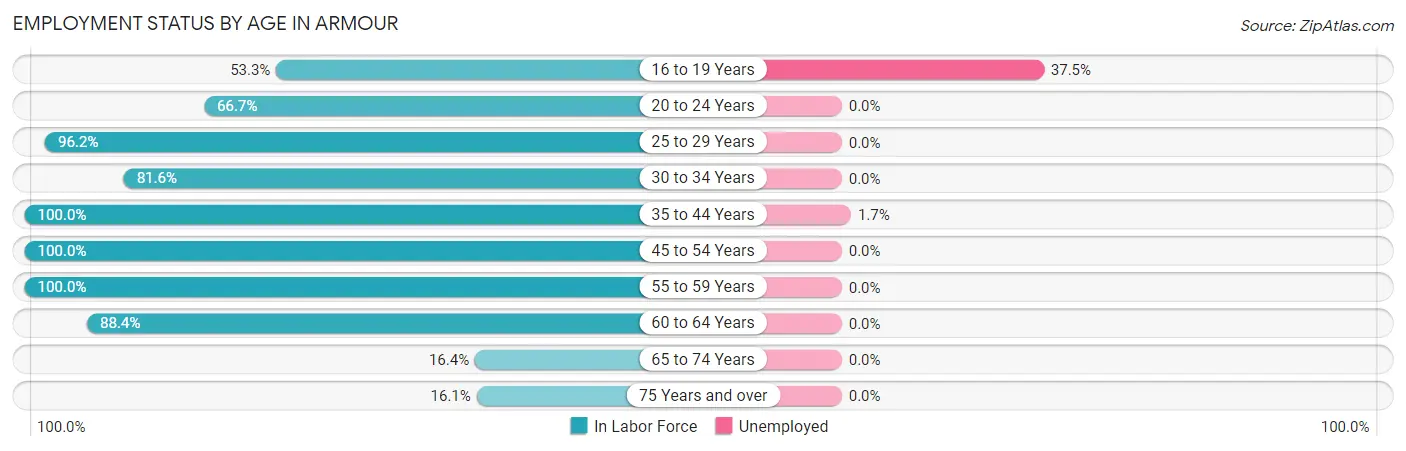
| Age Bracket | In Labor Force | Unemployed |
| 16 to 19 Years | 8 (53.3%) | 3 (37.5%) |
| 20 to 24 Years | 8 (66.7%) | 0 (0.0%) |
| 25 to 29 Years | 25 (96.2%) | 0 (0.0%) |
| 30 to 34 Years | 40 (81.6%) | 0 (0.0%) |
| 35 to 44 Years | 58 (100.0%) | 1 (1.7%) |
| 45 to 54 Years | 48 (100.0%) | 0 (0.0%) |
| 55 to 59 Years | 26 (100.0%) | 0 (0.0%) |
| 60 to 64 Years | 61 (88.4%) | 0 (0.0%) |
| 65 to 74 Years | 12 (16.4%) | 0 (0.0%) |
| 75 Years and over | 18 (16.1%) | 0 (0.0%) |
| Total | 304 (62.3%) | 4 (1.3%) |
Employment Status by Educational Attainment in Armour
According to labor force statistics for Armour, 93.5% of individuals (258) out of the total population between 25 and 64 years of age (276) are in the labor force, with 0.4% or 1 of them being unemployed. The group with the highest labor force participation rate are those with the educational attainment of less than high school, with 100.0% or 8 individuals in the labor force. Within the labor force, individuals with college / associate degree education have the highest percentage of unemployment, with 1.0% or 1 of them being unemployed.
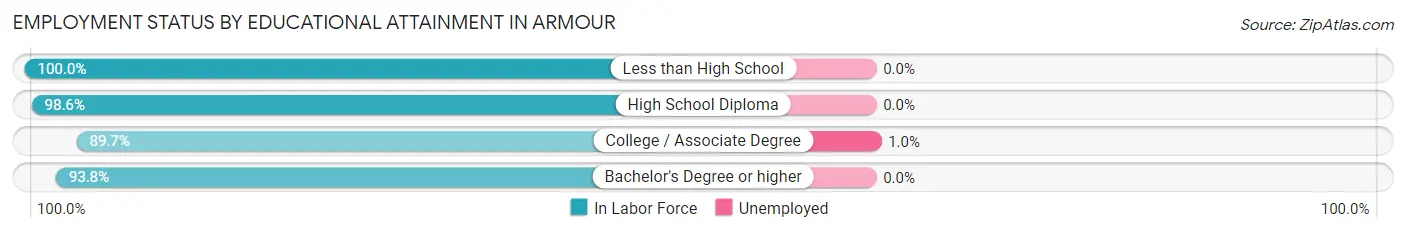
| Educational Attainment | In Labor Force | Unemployed |
| Less than High School | 8 (100.0%) | 0 (0.0%) |
| High School Diploma | 71 (98.6%) | 0 (0.0%) |
| College / Associate Degree | 104 (89.7%) | 1 (1.0%) |
| Bachelor's Degree or higher | 75 (93.8%) | 0 (0.0%) |
| Total | 258 (93.5%) | 1 (0.4%) |
Employment Occupations by Sex in Armour
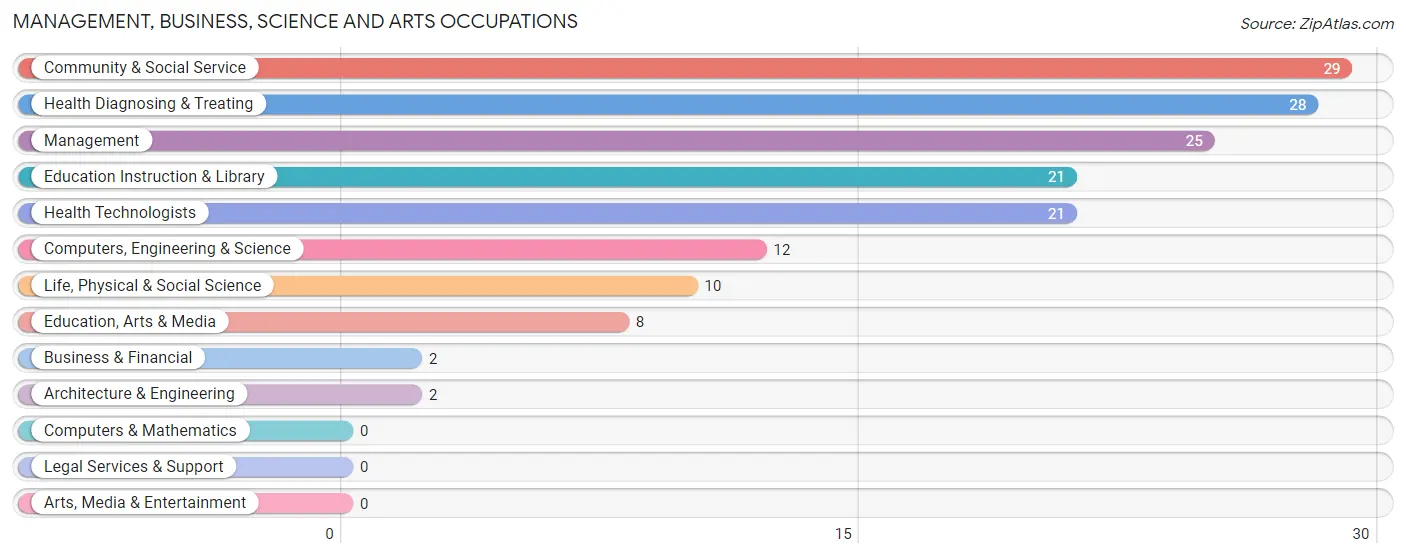
Management, Business, Science and Arts Occupations
The most common Management, Business, Science and Arts occupations in Armour are Community & Social Service (29 | 9.7%), Health Diagnosing & Treating (28 | 9.3%), Management (25 | 8.3%), Education Instruction & Library (21 | 7.0%), and Health Technologists (21 | 7.0%).
Management, Business, Science and Arts Occupations by Sex
Within the Management, Business, Science and Arts occupations in Armour, the most male-oriented occupations are Life, Physical & Social Science (100.0%), Computers, Engineering & Science (83.3%), and Management (32.0%), while the most female-oriented occupations are Business & Financial (100.0%), Architecture & Engineering (100.0%), and Health Diagnosing & Treating (100.0%).
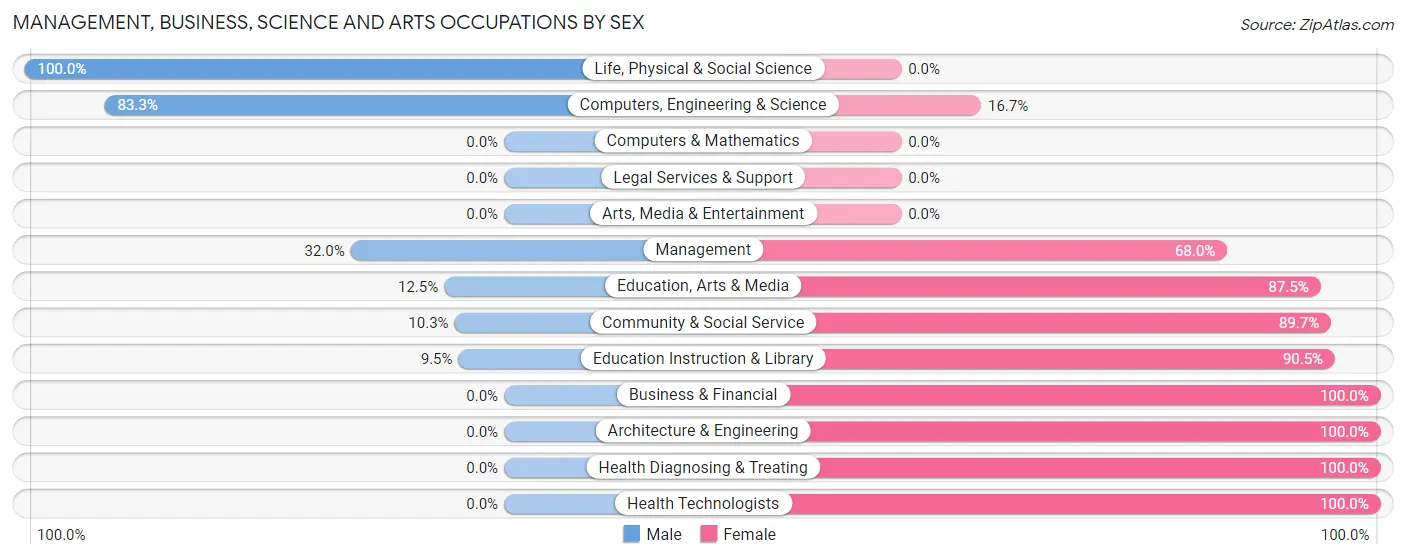
| Occupation | Male | Female |
| Management | 8 (32.0%) | 17 (68.0%) |
| Business & Financial | 0 (0.0%) | 2 (100.0%) |
| Computers, Engineering & Science | 10 (83.3%) | 2 (16.7%) |
| Computers & Mathematics | 0 (0.0%) | 0 (0.0%) |
| Architecture & Engineering | 0 (0.0%) | 2 (100.0%) |
| Life, Physical & Social Science | 10 (100.0%) | 0 (0.0%) |
| Community & Social Service | 3 (10.3%) | 26 (89.7%) |
| Education, Arts & Media | 1 (12.5%) | 7 (87.5%) |
| Legal Services & Support | 0 (0.0%) | 0 (0.0%) |
| Education Instruction & Library | 2 (9.5%) | 19 (90.5%) |
| Arts, Media & Entertainment | 0 (0.0%) | 0 (0.0%) |
| Health Diagnosing & Treating | 0 (0.0%) | 28 (100.0%) |
| Health Technologists | 0 (0.0%) | 21 (100.0%) |
| Total (Category) | 21 (21.9%) | 75 (78.1%) |
| Total (Overall) | 155 (51.7%) | 145 (48.3%) |
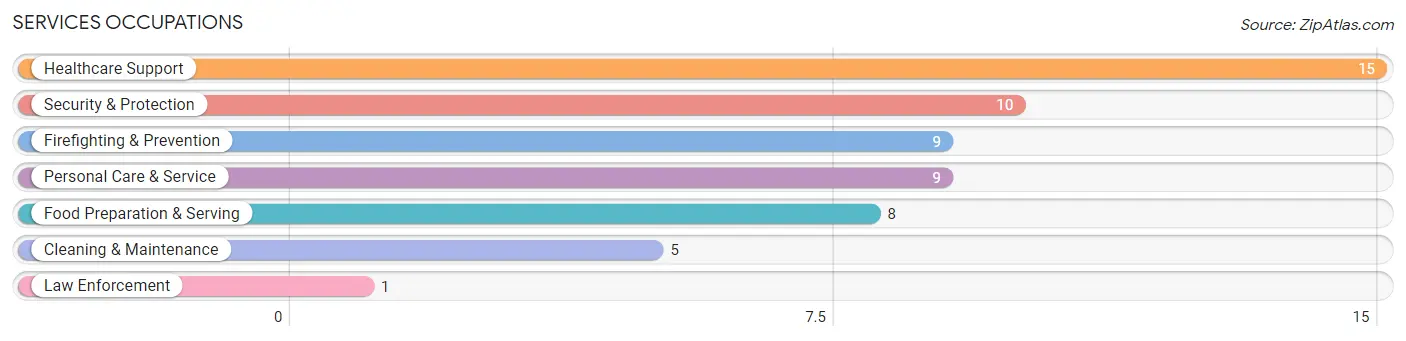
Services Occupations
The most common Services occupations in Armour are Healthcare Support (15 | 5.0%), Security & Protection (10 | 3.3%), Firefighting & Prevention (9 | 3.0%), Personal Care & Service (9 | 3.0%), and Food Preparation & Serving (8 | 2.7%).
Services Occupations by Sex
Within the Services occupations in Armour, the most male-oriented occupations are Law Enforcement (100.0%), Cleaning & Maintenance (100.0%), and Security & Protection (70.0%), while the most female-oriented occupations are Food Preparation & Serving (100.0%), Personal Care & Service (100.0%), and Healthcare Support (86.7%).
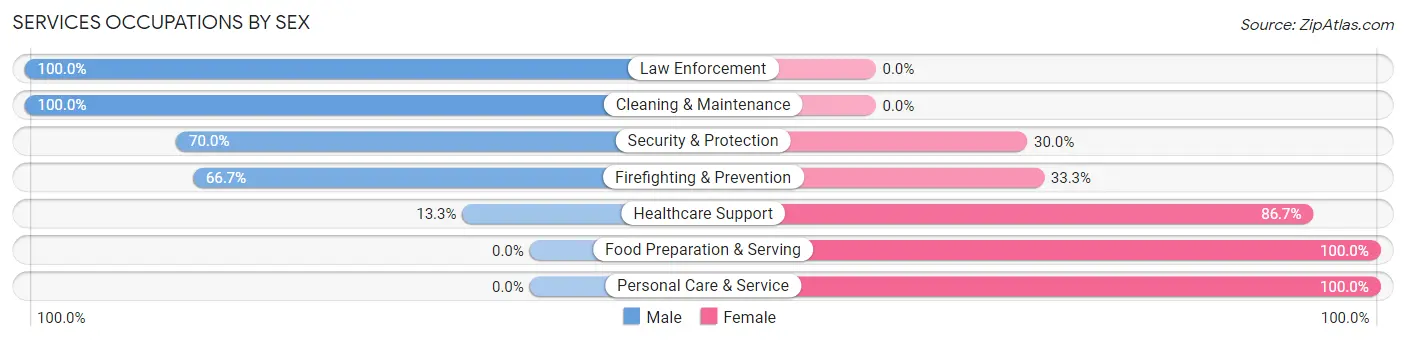
| Occupation | Male | Female |
| Healthcare Support | 2 (13.3%) | 13 (86.7%) |
| Security & Protection | 7 (70.0%) | 3 (30.0%) |
| Firefighting & Prevention | 6 (66.7%) | 3 (33.3%) |
| Law Enforcement | 1 (100.0%) | 0 (0.0%) |
| Food Preparation & Serving | 0 (0.0%) | 8 (100.0%) |
| Cleaning & Maintenance | 5 (100.0%) | 0 (0.0%) |
| Personal Care & Service | 0 (0.0%) | 9 (100.0%) |
| Total (Category) | 14 (29.8%) | 33 (70.2%) |
| Total (Overall) | 155 (51.7%) | 145 (48.3%) |
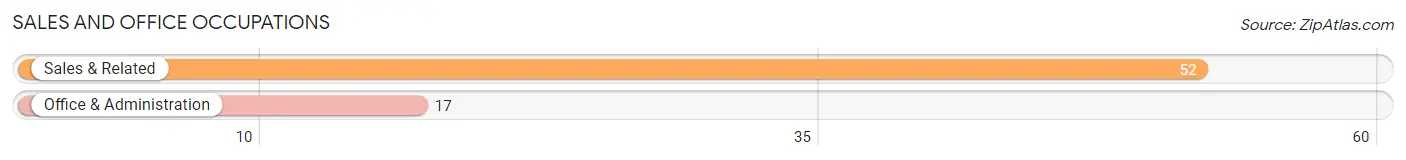
Sales and Office Occupations
The most common Sales and Office occupations in Armour are Sales & Related (52 | 17.3%), and Office & Administration (17 | 5.7%).
Sales and Office Occupations by Sex
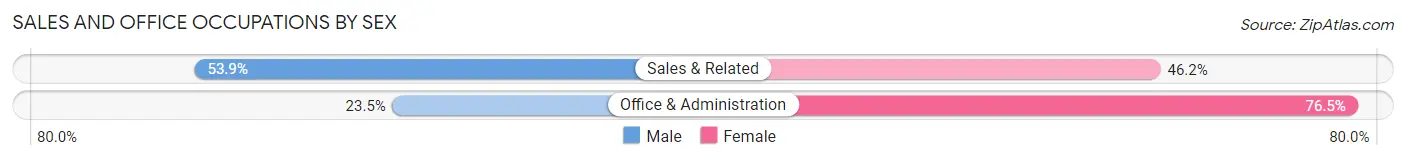
| Occupation | Male | Female |
| Sales & Related | 28 (53.8%) | 24 (46.2%) |
| Office & Administration | 4 (23.5%) | 13 (76.5%) |
| Total (Category) | 32 (46.4%) | 37 (53.6%) |
| Total (Overall) | 155 (51.7%) | 145 (48.3%) |
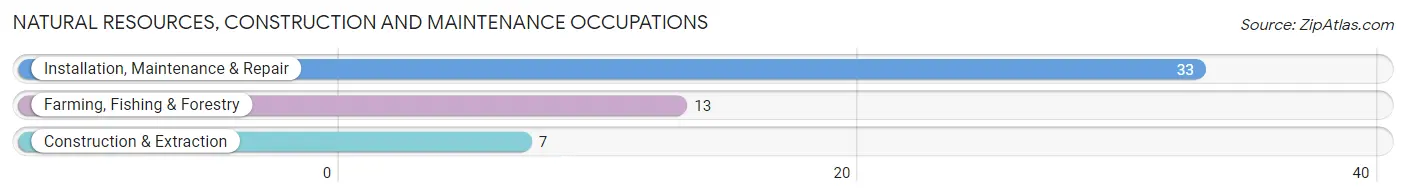
Natural Resources, Construction and Maintenance Occupations
The most common Natural Resources, Construction and Maintenance occupations in Armour are Installation, Maintenance & Repair (33 | 11.0%), Farming, Fishing & Forestry (13 | 4.3%), and Construction & Extraction (7 | 2.3%).
Natural Resources, Construction and Maintenance Occupations by Sex
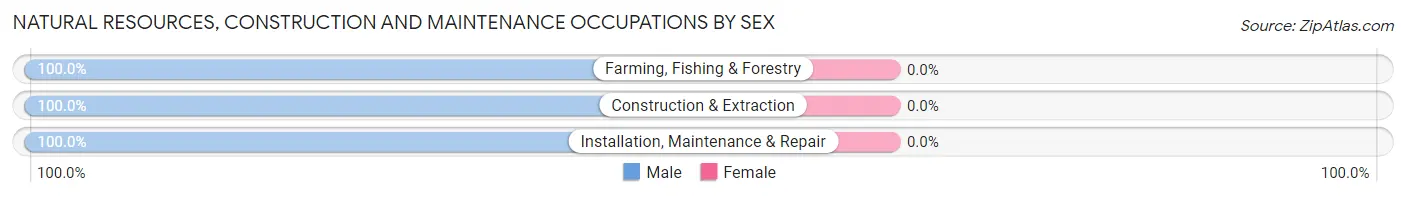
| Occupation | Male | Female |
| Farming, Fishing & Forestry | 13 (100.0%) | 0 (0.0%) |
| Construction & Extraction | 7 (100.0%) | 0 (0.0%) |
| Installation, Maintenance & Repair | 33 (100.0%) | 0 (0.0%) |
| Total (Category) | 53 (100.0%) | 0 (0.0%) |
| Total (Overall) | 155 (51.7%) | 145 (48.3%) |
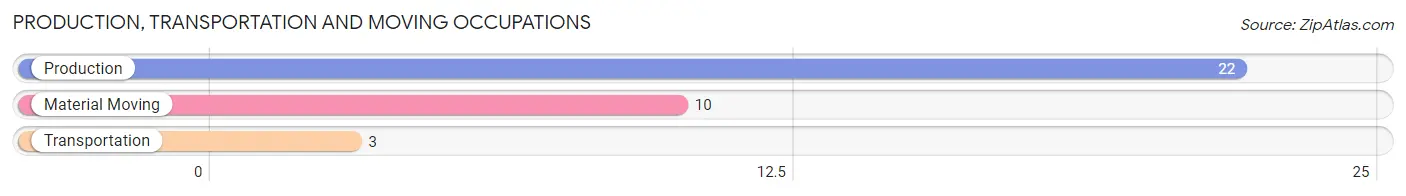
Production, Transportation and Moving Occupations
The most common Production, Transportation and Moving occupations in Armour are Production (22 | 7.3%), Material Moving (10 | 3.3%), and Transportation (3 | 1.0%).
Production, Transportation and Moving Occupations by Sex
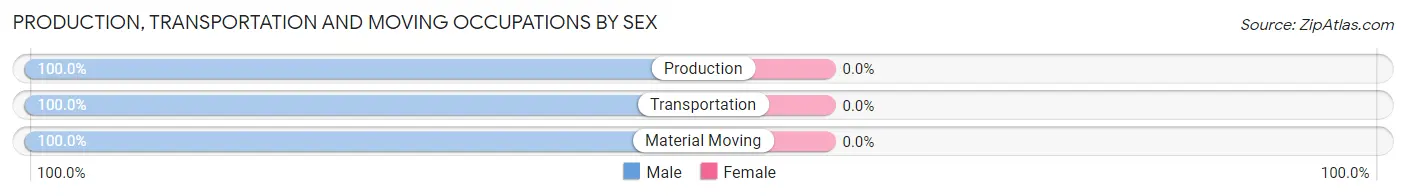
| Occupation | Male | Female |
| Production | 22 (100.0%) | 0 (0.0%) |
| Transportation | 3 (100.0%) | 0 (0.0%) |
| Material Moving | 10 (100.0%) | 0 (0.0%) |
| Total (Category) | 35 (100.0%) | 0 (0.0%) |
| Total (Overall) | 155 (51.7%) | 145 (48.3%) |
Employment Industries by Sex in Armour
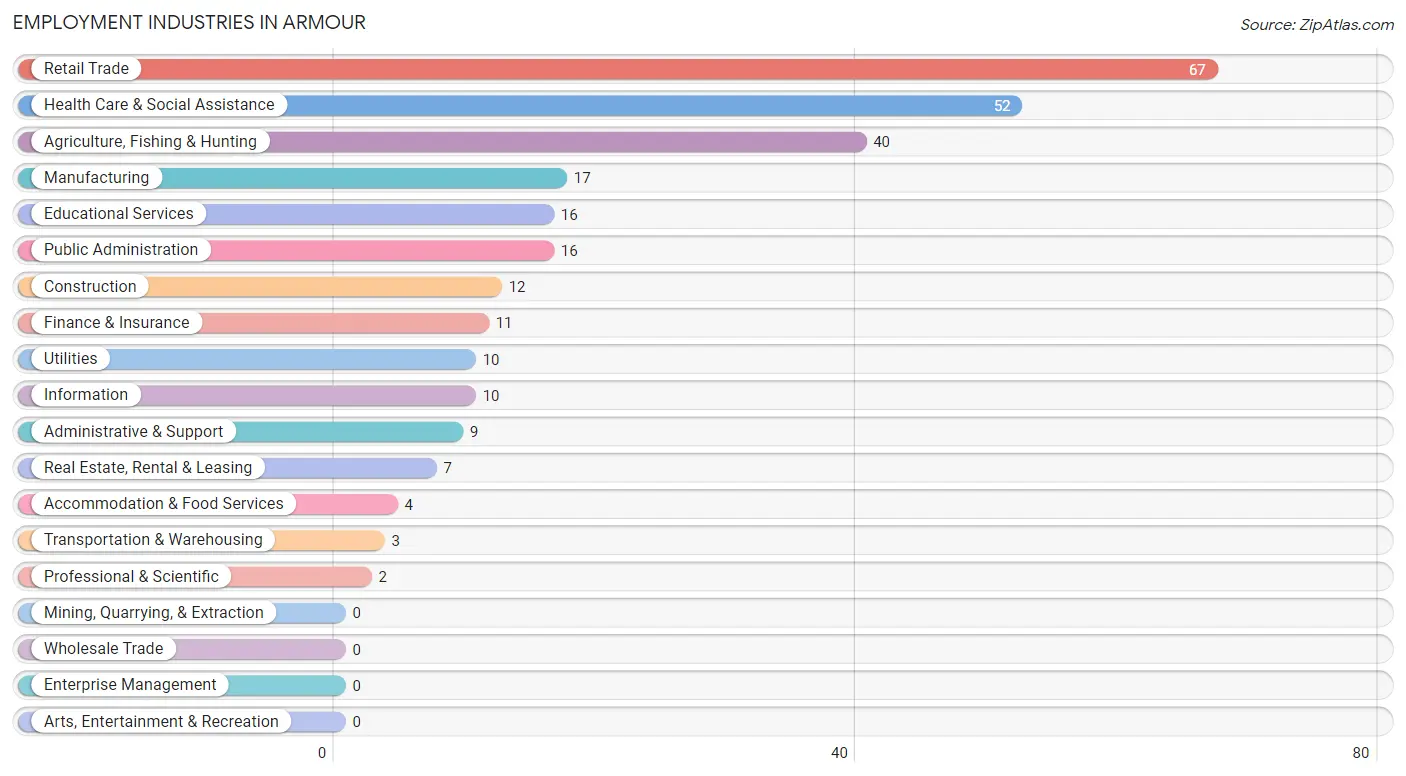
Employment Industries in Armour
The major employment industries in Armour include Retail Trade (67 | 22.3%), Health Care & Social Assistance (52 | 17.3%), Agriculture, Fishing & Hunting (40 | 13.3%), Manufacturing (17 | 5.7%), and Educational Services (16 | 5.3%).
Employment Industries by Sex in Armour
The Armour industries that see more men than women are Construction (100.0%), Manufacturing (100.0%), and Transportation & Warehousing (100.0%), whereas the industries that tend to have a higher number of women are Real Estate, Rental & Leasing (100.0%), Professional & Scientific (100.0%), and Accommodation & Food Services (100.0%).
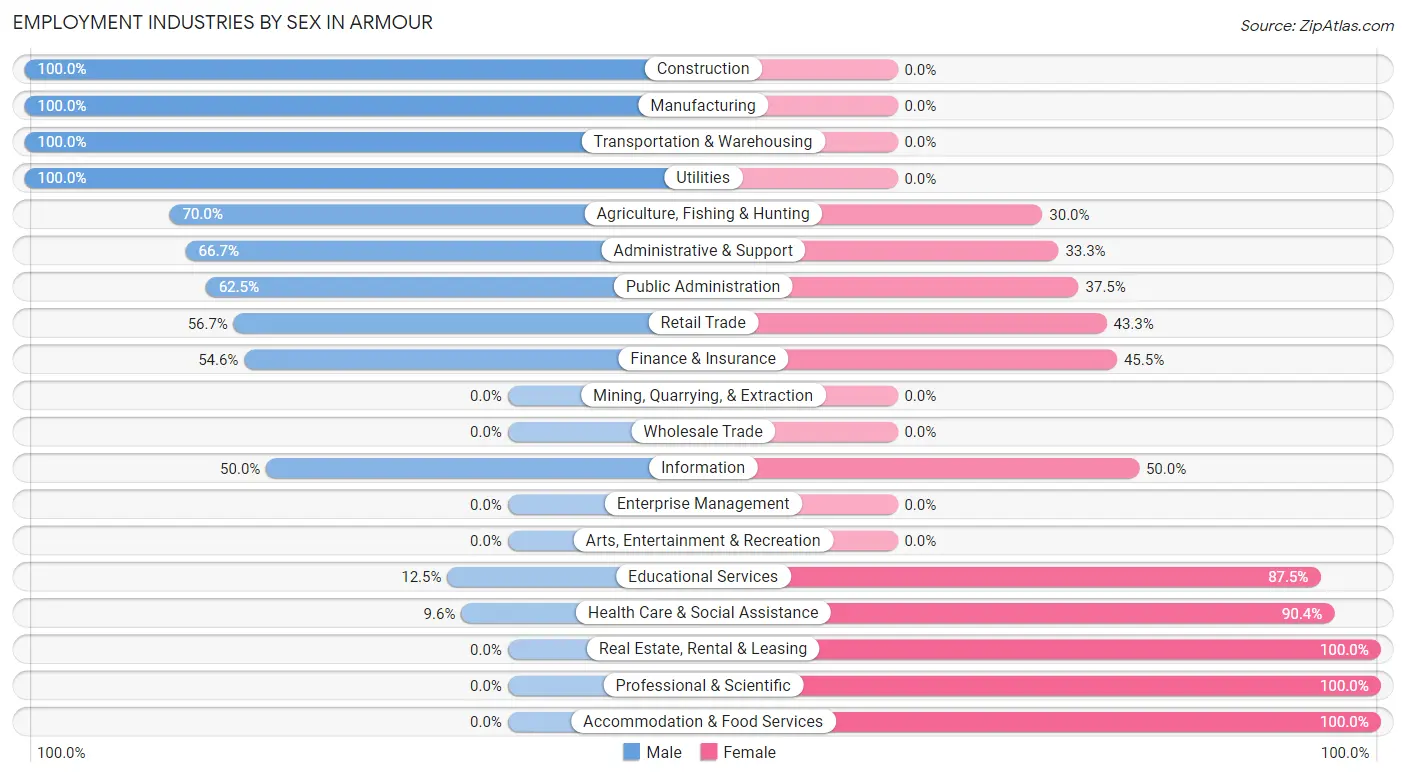
| Industry | Male | Female |
| Agriculture, Fishing & Hunting | 28 (70.0%) | 12 (30.0%) |
| Mining, Quarrying, & Extraction | 0 (0.0%) | 0 (0.0%) |
| Construction | 12 (100.0%) | 0 (0.0%) |
| Manufacturing | 17 (100.0%) | 0 (0.0%) |
| Wholesale Trade | 0 (0.0%) | 0 (0.0%) |
| Retail Trade | 38 (56.7%) | 29 (43.3%) |
| Transportation & Warehousing | 3 (100.0%) | 0 (0.0%) |
| Utilities | 10 (100.0%) | 0 (0.0%) |
| Information | 5 (50.0%) | 5 (50.0%) |
| Finance & Insurance | 6 (54.5%) | 5 (45.5%) |
| Real Estate, Rental & Leasing | 0 (0.0%) | 7 (100.0%) |
| Professional & Scientific | 0 (0.0%) | 2 (100.0%) |
| Enterprise Management | 0 (0.0%) | 0 (0.0%) |
| Administrative & Support | 6 (66.7%) | 3 (33.3%) |
| Educational Services | 2 (12.5%) | 14 (87.5%) |
| Health Care & Social Assistance | 5 (9.6%) | 47 (90.4%) |
| Arts, Entertainment & Recreation | 0 (0.0%) | 0 (0.0%) |
| Accommodation & Food Services | 0 (0.0%) | 4 (100.0%) |
| Public Administration | 10 (62.5%) | 6 (37.5%) |
| Total | 155 (51.7%) | 145 (48.3%) |
Education in Armour
School Enrollment in Armour
The most common levels of schooling among the 130 students in Armour are elementary school (50 | 38.5%), middle school (42 | 32.3%), and nursery / preschool (18 | 13.9%).
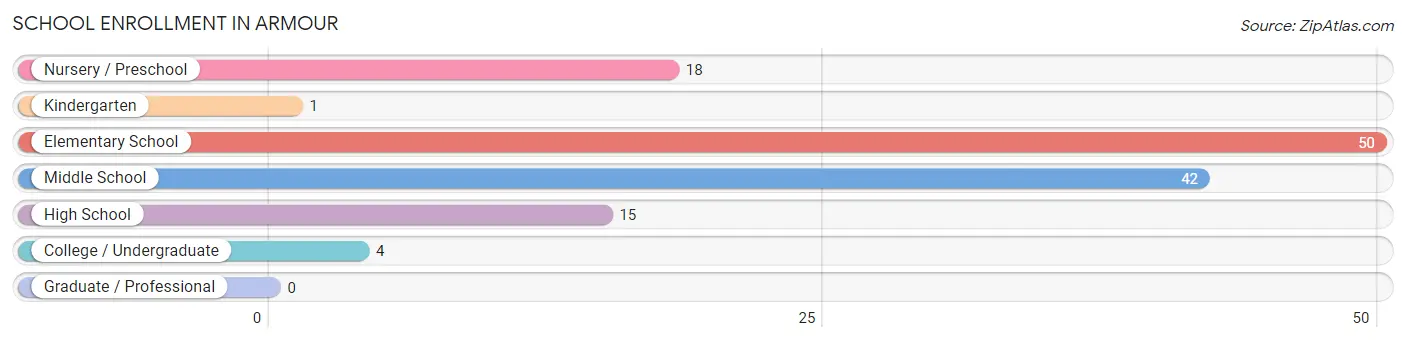
| School Level | # Students | % Students |
| Nursery / Preschool | 18 | 13.9% |
| Kindergarten | 1 | 0.8% |
| Elementary School | 50 | 38.5% |
| Middle School | 42 | 32.3% |
| High School | 15 | 11.5% |
| College / Undergraduate | 4 | 3.1% |
| Graduate / Professional | 0 | 0.0% |
| Total | 130 | 100.0% |
School Enrollment by Age by Funding Source in Armour
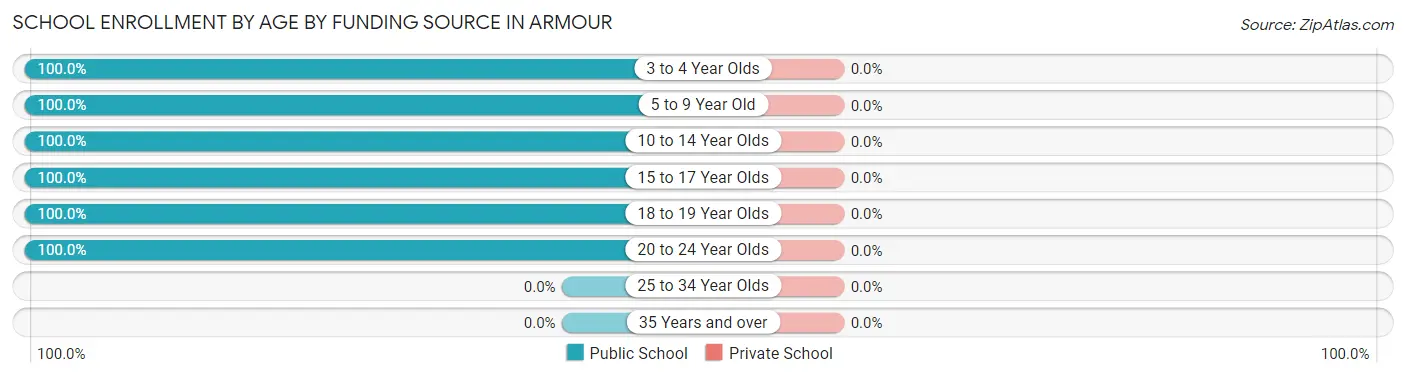
| Age Bracket | Public School | Private School |
| 3 to 4 Year Olds | 18 (100.0%) | 0 (0.0%) |
| 5 to 9 Year Old | 39 (100.0%) | 0 (0.0%) |
| 10 to 14 Year Olds | 54 (100.0%) | 0 (0.0%) |
| 15 to 17 Year Olds | 13 (100.0%) | 0 (0.0%) |
| 18 to 19 Year Olds | 2 (100.0%) | 0 (0.0%) |
| 20 to 24 Year Olds | 4 (100.0%) | 0 (0.0%) |
| 25 to 34 Year Olds | 0 (0.0%) | 0 (0.0%) |
| 35 Years and over | 0 (0.0%) | 0 (0.0%) |
| Total | 130 (100.0%) | 0 (0.0%) |
Educational Attainment by Field of Study in Armour
Bio, nature & agricultural (46 | 37.7%), education (41 | 33.6%), business (15 | 12.3%), science & technology (9 | 7.4%), and visual & performing arts (5 | 4.1%) are the most common fields of study among 122 individuals in Armour who have obtained a bachelor's degree or higher.
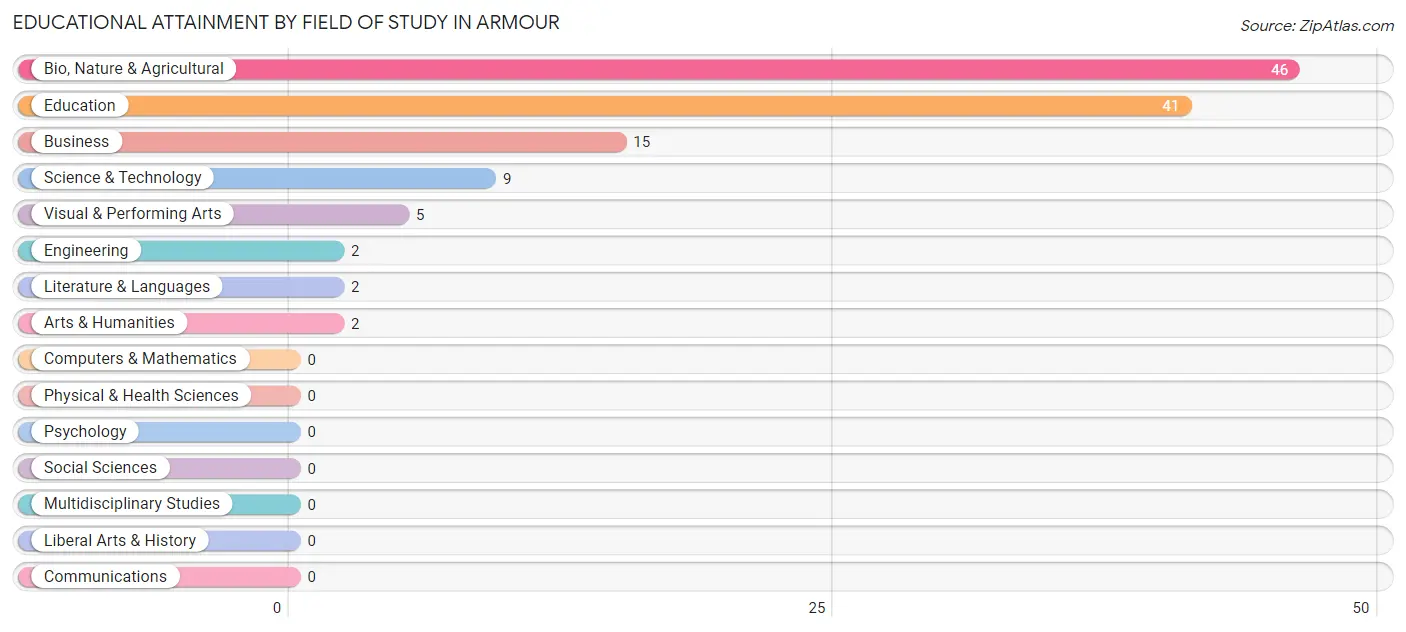
| Field of Study | # Graduates | % Graduates |
| Computers & Mathematics | 0 | 0.0% |
| Bio, Nature & Agricultural | 46 | 37.7% |
| Physical & Health Sciences | 0 | 0.0% |
| Psychology | 0 | 0.0% |
| Social Sciences | 0 | 0.0% |
| Engineering | 2 | 1.6% |
| Multidisciplinary Studies | 0 | 0.0% |
| Science & Technology | 9 | 7.4% |
| Business | 15 | 12.3% |
| Education | 41 | 33.6% |
| Literature & Languages | 2 | 1.6% |
| Liberal Arts & History | 0 | 0.0% |
| Visual & Performing Arts | 5 | 4.1% |
| Communications | 0 | 0.0% |
| Arts & Humanities | 2 | 1.6% |
| Total | 122 | 100.0% |
Transportation & Commute in Armour
Vehicle Availability by Sex in Armour
The most prevalent vehicle ownership categories in Armour are males with 2 vehicles (55, accounting for 35.9%) and females with 2 vehicles (56, making up 37.9%).
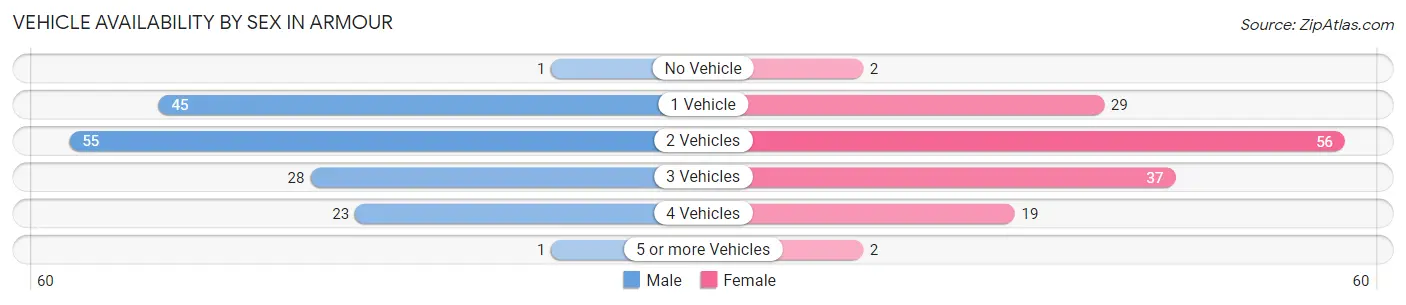
| Vehicles Available | Male | Female |
| No Vehicle | 1 (0.6%) | 2 (1.4%) |
| 1 Vehicle | 45 (29.4%) | 29 (20.0%) |
| 2 Vehicles | 55 (35.9%) | 56 (38.6%) |
| 3 Vehicles | 28 (18.3%) | 37 (25.5%) |
| 4 Vehicles | 23 (15.0%) | 19 (13.1%) |
| 5 or more Vehicles | 1 (0.6%) | 2 (1.4%) |
| Total | 153 (100.0%) | 145 (100.0%) |
Commute Time in Armour
The most frequently occuring commute durations in Armour are less than 5 minutes (73 commuters, 25.3%), 5 to 9 minutes (66 commuters, 22.8%), and 25 to 29 minutes (34 commuters, 11.8%).
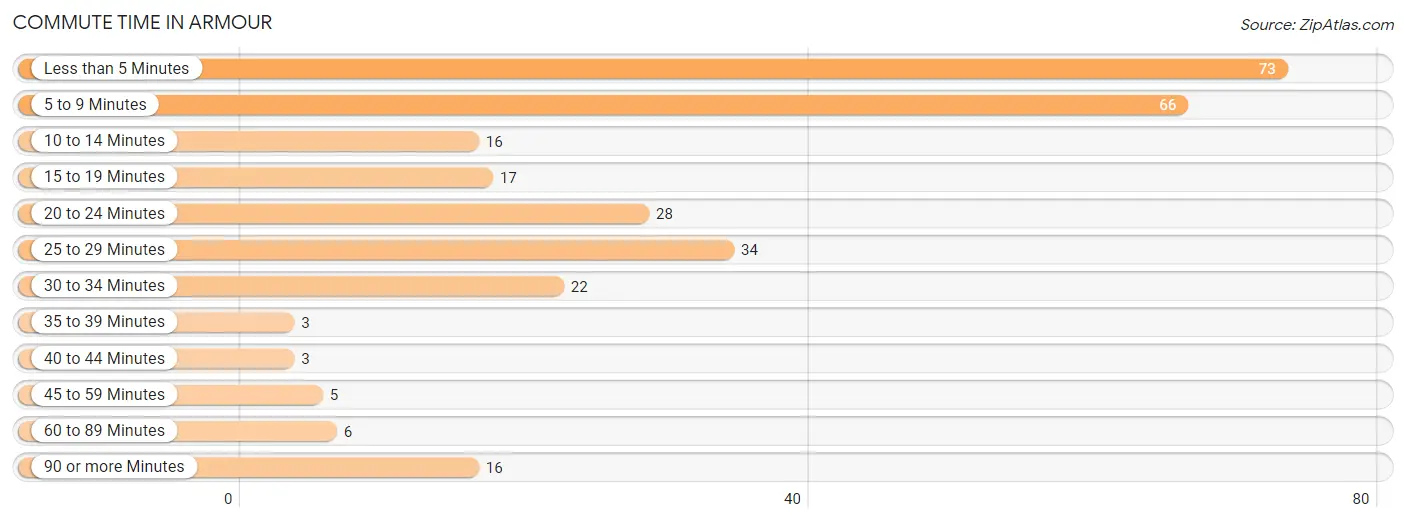
| Commute Time | # Commuters | % Commuters |
| Less than 5 Minutes | 73 | 25.3% |
| 5 to 9 Minutes | 66 | 22.8% |
| 10 to 14 Minutes | 16 | 5.5% |
| 15 to 19 Minutes | 17 | 5.9% |
| 20 to 24 Minutes | 28 | 9.7% |
| 25 to 29 Minutes | 34 | 11.8% |
| 30 to 34 Minutes | 22 | 7.6% |
| 35 to 39 Minutes | 3 | 1.0% |
| 40 to 44 Minutes | 3 | 1.0% |
| 45 to 59 Minutes | 5 | 1.7% |
| 60 to 89 Minutes | 6 | 2.1% |
| 90 or more Minutes | 16 | 5.5% |
Commute Time by Sex in Armour
The most common commute times in Armour are less than 5 minutes (41 commuters, 26.5%) for males and 5 to 9 minutes (41 commuters, 30.6%) for females.
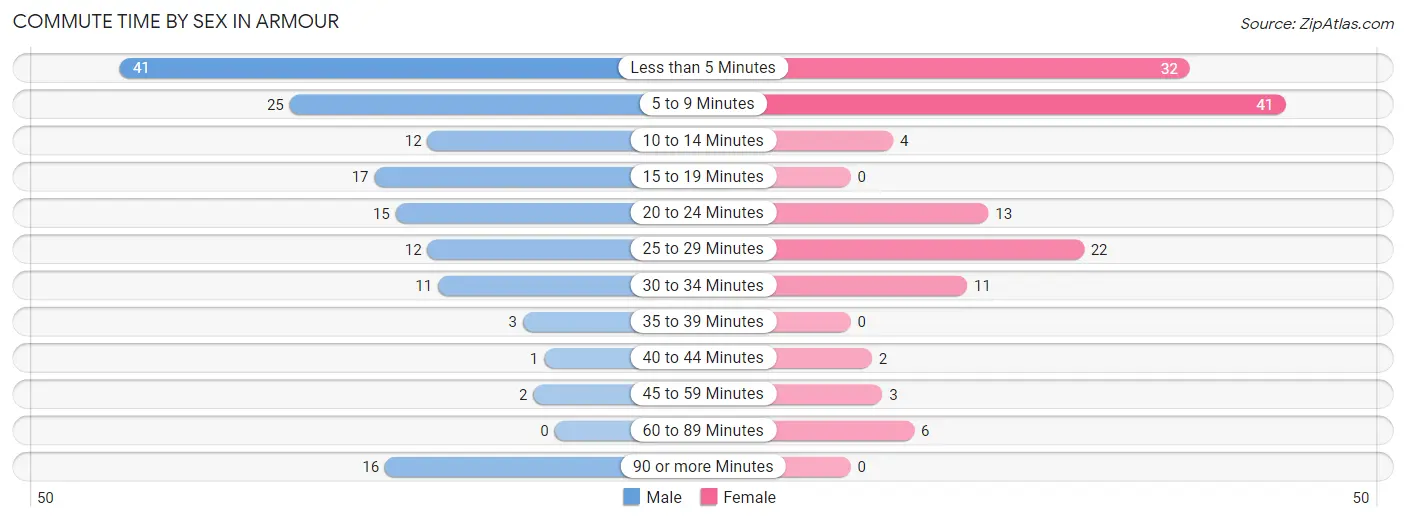
| Commute Time | Male | Female |
| Less than 5 Minutes | 41 (26.5%) | 32 (23.9%) |
| 5 to 9 Minutes | 25 (16.1%) | 41 (30.6%) |
| 10 to 14 Minutes | 12 (7.7%) | 4 (3.0%) |
| 15 to 19 Minutes | 17 (11.0%) | 0 (0.0%) |
| 20 to 24 Minutes | 15 (9.7%) | 13 (9.7%) |
| 25 to 29 Minutes | 12 (7.7%) | 22 (16.4%) |
| 30 to 34 Minutes | 11 (7.1%) | 11 (8.2%) |
| 35 to 39 Minutes | 3 (1.9%) | 0 (0.0%) |
| 40 to 44 Minutes | 1 (0.6%) | 2 (1.5%) |
| 45 to 59 Minutes | 2 (1.3%) | 3 (2.2%) |
| 60 to 89 Minutes | 0 (0.0%) | 6 (4.5%) |
| 90 or more Minutes | 16 (10.3%) | 0 (0.0%) |
Time of Departure to Work by Sex in Armour
The most frequent times of departure to work in Armour are 7:30 AM to 7:59 AM (44, 28.4%) for males and 7:30 AM to 7:59 AM (29, 21.6%) for females.
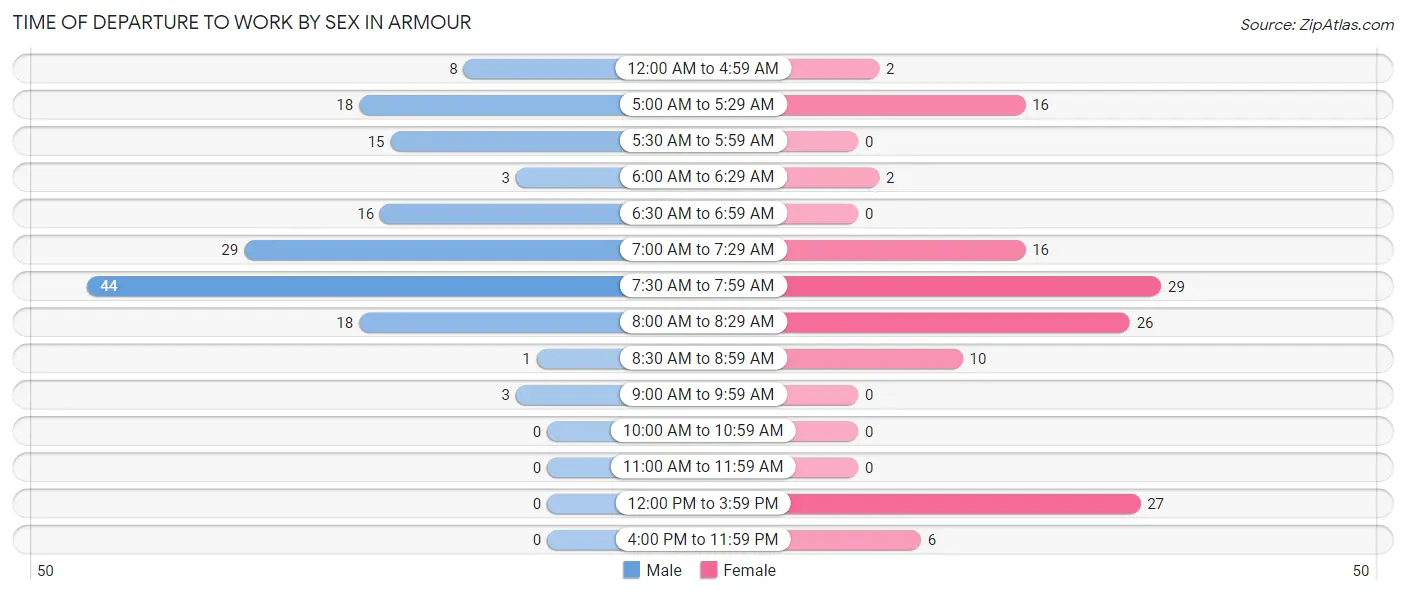
| Time of Departure | Male | Female |
| 12:00 AM to 4:59 AM | 8 (5.2%) | 2 (1.5%) |
| 5:00 AM to 5:29 AM | 18 (11.6%) | 16 (11.9%) |
| 5:30 AM to 5:59 AM | 15 (9.7%) | 0 (0.0%) |
| 6:00 AM to 6:29 AM | 3 (1.9%) | 2 (1.5%) |
| 6:30 AM to 6:59 AM | 16 (10.3%) | 0 (0.0%) |
| 7:00 AM to 7:29 AM | 29 (18.7%) | 16 (11.9%) |
| 7:30 AM to 7:59 AM | 44 (28.4%) | 29 (21.6%) |
| 8:00 AM to 8:29 AM | 18 (11.6%) | 26 (19.4%) |
| 8:30 AM to 8:59 AM | 1 (0.6%) | 10 (7.5%) |
| 9:00 AM to 9:59 AM | 3 (1.9%) | 0 (0.0%) |
| 10:00 AM to 10:59 AM | 0 (0.0%) | 0 (0.0%) |
| 11:00 AM to 11:59 AM | 0 (0.0%) | 0 (0.0%) |
| 12:00 PM to 3:59 PM | 0 (0.0%) | 27 (20.2%) |
| 4:00 PM to 11:59 PM | 0 (0.0%) | 6 (4.5%) |
| Total | 155 (100.0%) | 134 (100.0%) |
Housing Occupancy in Armour
Occupancy by Ownership in Armour
Of the total 269 dwellings in Armour, owner-occupied units account for 207 (76.9%), while renter-occupied units make up 62 (23.1%).
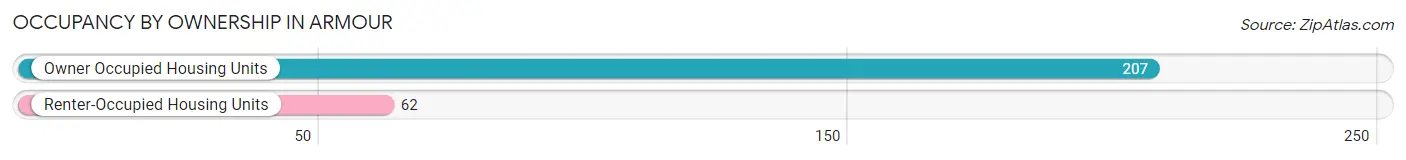
| Occupancy | # Housing Units | % Housing Units |
| Owner Occupied Housing Units | 207 | 76.9% |
| Renter-Occupied Housing Units | 62 | 23.1% |
| Total Occupied Housing Units | 269 | 100.0% |
Occupancy by Household Size in Armour
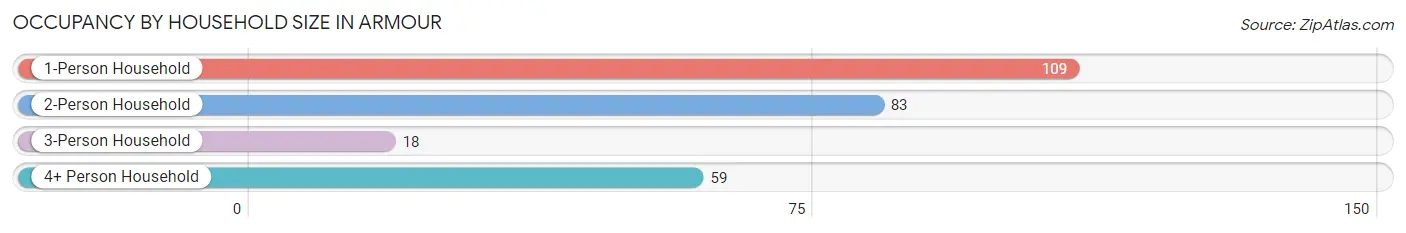
| Household Size | # Housing Units | % Housing Units |
| 1-Person Household | 109 | 40.5% |
| 2-Person Household | 83 | 30.9% |
| 3-Person Household | 18 | 6.7% |
| 4+ Person Household | 59 | 21.9% |
| Total Housing Units | 269 | 100.0% |
Occupancy by Ownership by Household Size in Armour
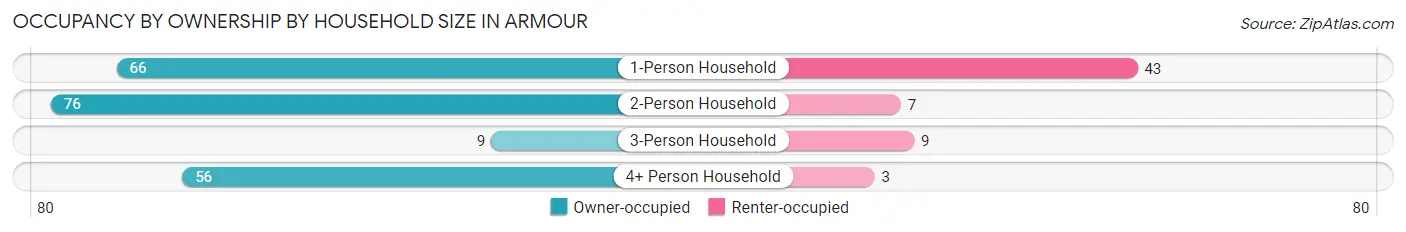
| Household Size | Owner-occupied | Renter-occupied |
| 1-Person Household | 66 (60.6%) | 43 (39.5%) |
| 2-Person Household | 76 (91.6%) | 7 (8.4%) |
| 3-Person Household | 9 (50.0%) | 9 (50.0%) |
| 4+ Person Household | 56 (94.9%) | 3 (5.1%) |
| Total Housing Units | 207 (76.9%) | 62 (23.1%) |
Occupancy by Educational Attainment in Armour
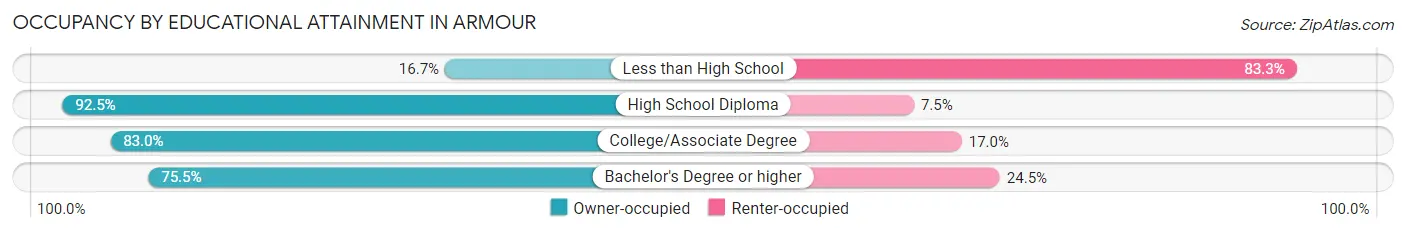
| Household Size | Owner-occupied | Renter-occupied |
| Less than High School | 5 (16.7%) | 25 (83.3%) |
| High School Diploma | 74 (92.5%) | 6 (7.5%) |
| College/Associate Degree | 88 (83.0%) | 18 (17.0%) |
| Bachelor's Degree or higher | 40 (75.5%) | 13 (24.5%) |
Occupancy by Age of Householder in Armour
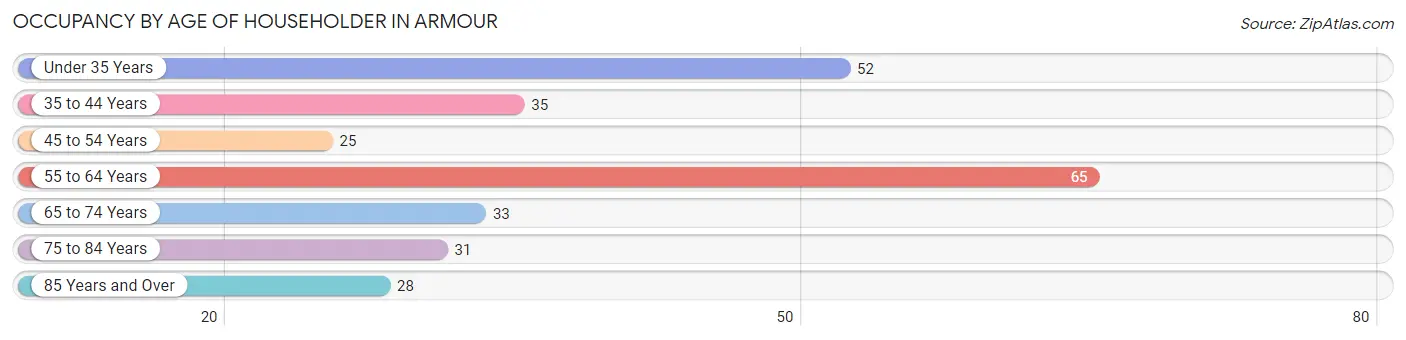
| Age Bracket | # Households | % Households |
| Under 35 Years | 52 | 19.3% |
| 35 to 44 Years | 35 | 13.0% |
| 45 to 54 Years | 25 | 9.3% |
| 55 to 64 Years | 65 | 24.2% |
| 65 to 74 Years | 33 | 12.3% |
| 75 to 84 Years | 31 | 11.5% |
| 85 Years and Over | 28 | 10.4% |
| Total | 269 | 100.0% |
Housing Finances in Armour
Median Income by Occupancy in Armour
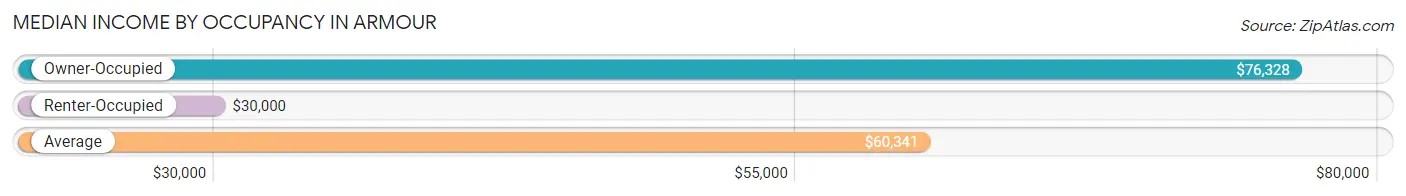
| Occupancy Type | # Households | Median Income |
| Owner-Occupied | 207 (76.9%) | $76,328 |
| Renter-Occupied | 62 (23.1%) | $30,000 |
| Average | 269 (100.0%) | $60,341 |
Occupancy by Householder Income Bracket in Armour
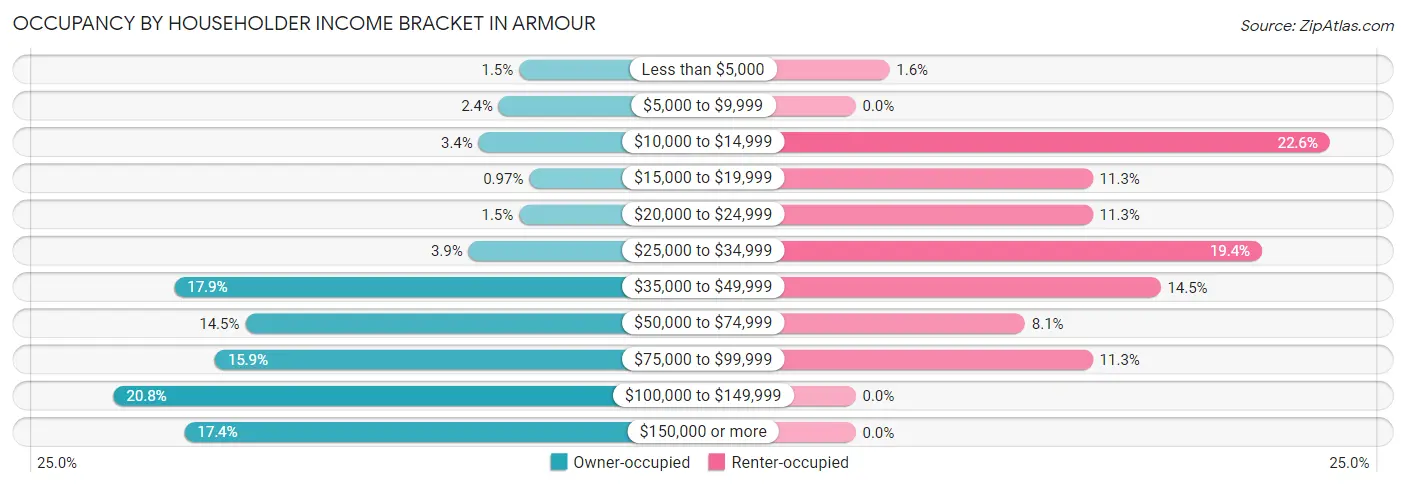
| Income Bracket | Owner-occupied | Renter-occupied |
| Less than $5,000 | 3 (1.5%) | 1 (1.6%) |
| $5,000 to $9,999 | 5 (2.4%) | 0 (0.0%) |
| $10,000 to $14,999 | 7 (3.4%) | 14 (22.6%) |
| $15,000 to $19,999 | 2 (1.0%) | 7 (11.3%) |
| $20,000 to $24,999 | 3 (1.5%) | 7 (11.3%) |
| $25,000 to $34,999 | 8 (3.9%) | 12 (19.4%) |
| $35,000 to $49,999 | 37 (17.9%) | 9 (14.5%) |
| $50,000 to $74,999 | 30 (14.5%) | 5 (8.1%) |
| $75,000 to $99,999 | 33 (15.9%) | 7 (11.3%) |
| $100,000 to $149,999 | 43 (20.8%) | 0 (0.0%) |
| $150,000 or more | 36 (17.4%) | 0 (0.0%) |
| Total | 207 (100.0%) | 62 (100.0%) |
Monthly Housing Cost Tiers in Armour
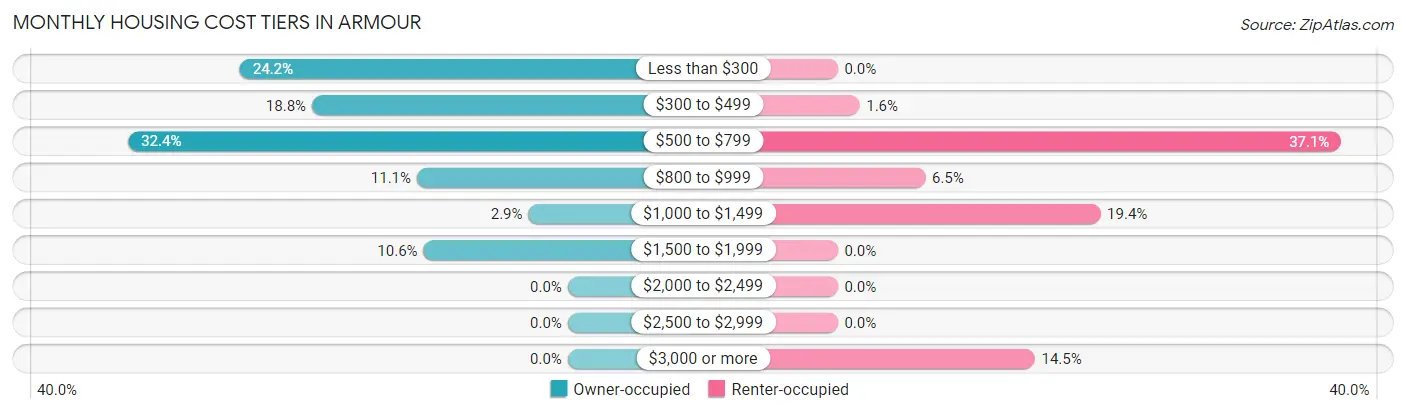
| Monthly Cost | Owner-occupied | Renter-occupied |
| Less than $300 | 50 (24.1%) | 0 (0.0%) |
| $300 to $499 | 39 (18.8%) | 1 (1.6%) |
| $500 to $799 | 67 (32.4%) | 23 (37.1%) |
| $800 to $999 | 23 (11.1%) | 4 (6.5%) |
| $1,000 to $1,499 | 6 (2.9%) | 12 (19.4%) |
| $1,500 to $1,999 | 22 (10.6%) | 0 (0.0%) |
| $2,000 to $2,499 | 0 (0.0%) | 0 (0.0%) |
| $2,500 to $2,999 | 0 (0.0%) | 0 (0.0%) |
| $3,000 or more | 0 (0.0%) | 9 (14.5%) |
| Total | 207 (100.0%) | 62 (100.0%) |
Physical Housing Characteristics in Armour
Housing Structures in Armour
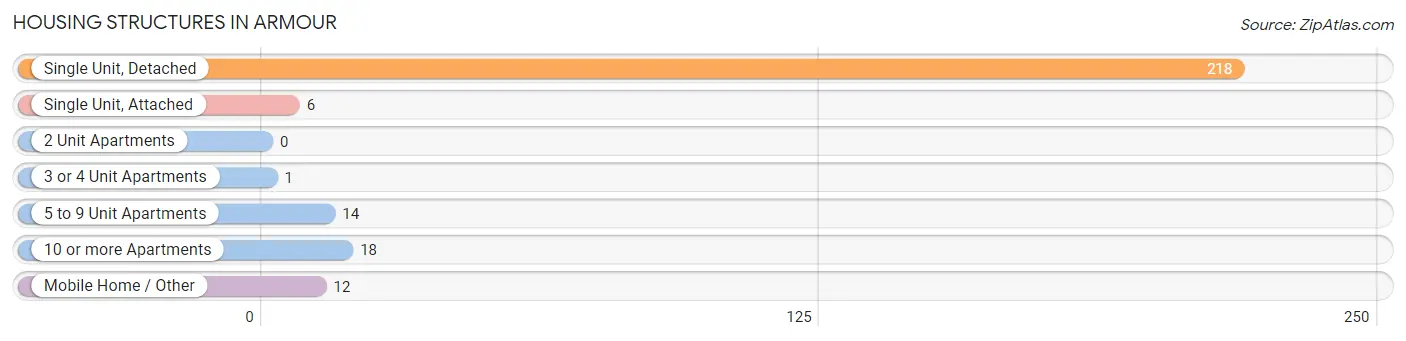
| Structure Type | # Housing Units | % Housing Units |
| Single Unit, Detached | 218 | 81.0% |
| Single Unit, Attached | 6 | 2.2% |
| 2 Unit Apartments | 0 | 0.0% |
| 3 or 4 Unit Apartments | 1 | 0.4% |
| 5 to 9 Unit Apartments | 14 | 5.2% |
| 10 or more Apartments | 18 | 6.7% |
| Mobile Home / Other | 12 | 4.5% |
| Total | 269 | 100.0% |
Housing Structures by Occupancy in Armour
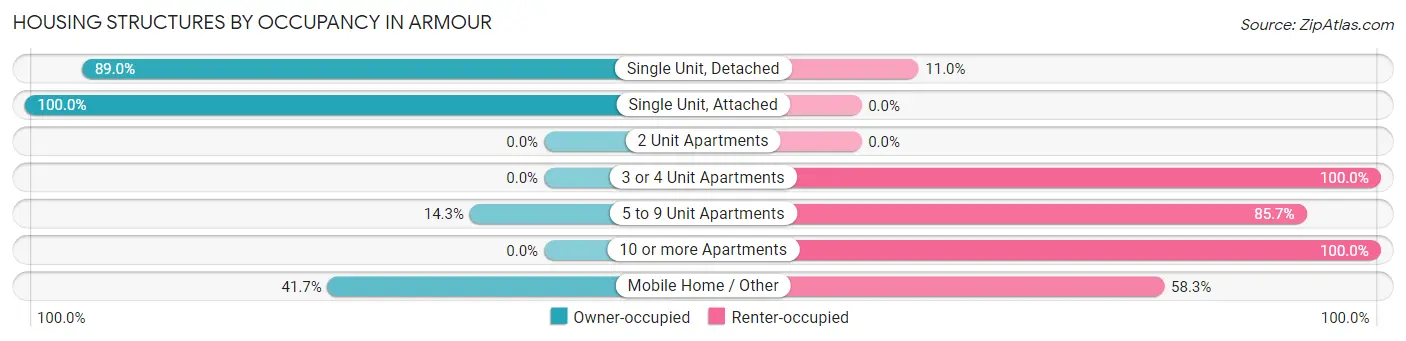
| Structure Type | Owner-occupied | Renter-occupied |
| Single Unit, Detached | 194 (89.0%) | 24 (11.0%) |
| Single Unit, Attached | 6 (100.0%) | 0 (0.0%) |
| 2 Unit Apartments | 0 (0.0%) | 0 (0.0%) |
| 3 or 4 Unit Apartments | 0 (0.0%) | 1 (100.0%) |
| 5 to 9 Unit Apartments | 2 (14.3%) | 12 (85.7%) |
| 10 or more Apartments | 0 (0.0%) | 18 (100.0%) |
| Mobile Home / Other | 5 (41.7%) | 7 (58.3%) |
| Total | 207 (76.9%) | 62 (23.1%) |
Housing Structures by Number of Rooms in Armour
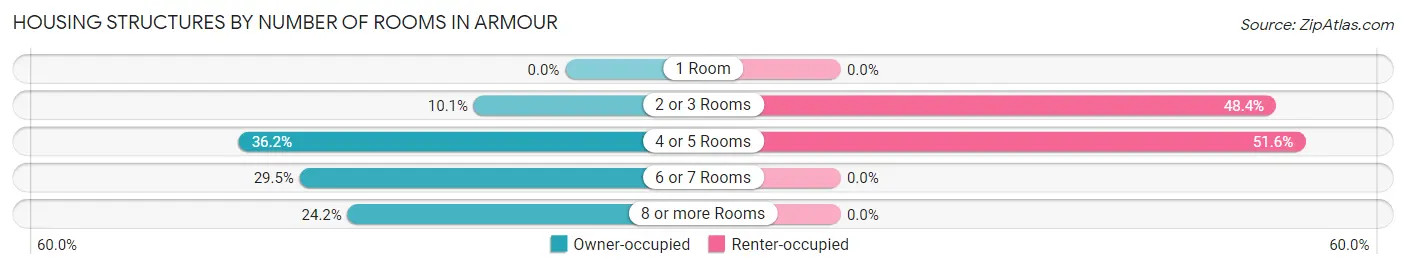
| Number of Rooms | Owner-occupied | Renter-occupied |
| 1 Room | 0 (0.0%) | 0 (0.0%) |
| 2 or 3 Rooms | 21 (10.1%) | 30 (48.4%) |
| 4 or 5 Rooms | 75 (36.2%) | 32 (51.6%) |
| 6 or 7 Rooms | 61 (29.5%) | 0 (0.0%) |
| 8 or more Rooms | 50 (24.1%) | 0 (0.0%) |
| Total | 207 (100.0%) | 62 (100.0%) |
Housing Structure by Heating Type in Armour
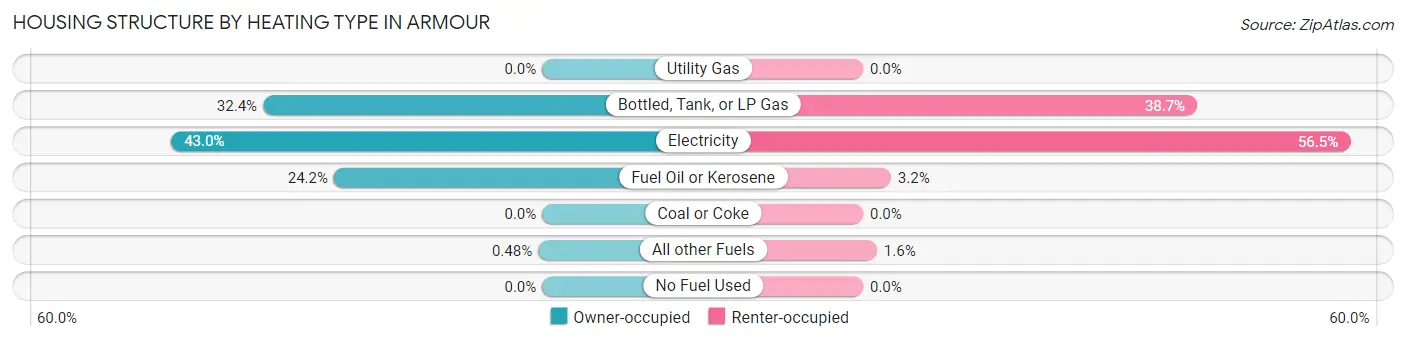
| Heating Type | Owner-occupied | Renter-occupied |
| Utility Gas | 0 (0.0%) | 0 (0.0%) |
| Bottled, Tank, or LP Gas | 67 (32.4%) | 24 (38.7%) |
| Electricity | 89 (43.0%) | 35 (56.5%) |
| Fuel Oil or Kerosene | 50 (24.1%) | 2 (3.2%) |
| Coal or Coke | 0 (0.0%) | 0 (0.0%) |
| All other Fuels | 1 (0.5%) | 1 (1.6%) |
| No Fuel Used | 0 (0.0%) | 0 (0.0%) |
| Total | 207 (100.0%) | 62 (100.0%) |
Household Vehicle Usage in Armour
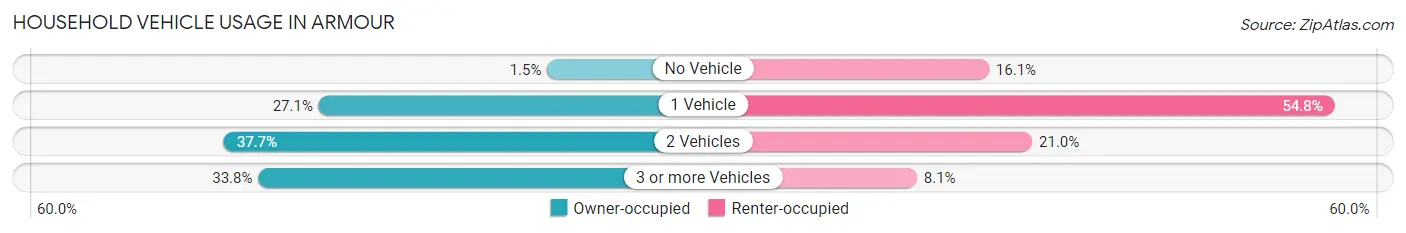
| Vehicles per Household | Owner-occupied | Renter-occupied |
| No Vehicle | 3 (1.5%) | 10 (16.1%) |
| 1 Vehicle | 56 (27.1%) | 34 (54.8%) |
| 2 Vehicles | 78 (37.7%) | 13 (21.0%) |
| 3 or more Vehicles | 70 (33.8%) | 5 (8.1%) |
| Total | 207 (100.0%) | 62 (100.0%) |
Real Estate & Mortgages in Armour
Real Estate and Mortgage Overview in Armour
| Characteristic | Without Mortgage | With Mortgage |
| Housing Units | 154 | 53 |
| Median Property Value | $95,600 | $129,700 |
| Median Household Income | $66,250 | $2 |
| Monthly Housing Costs | $425 | $0 |
| Real Estate Taxes | $1,307 | $0 |
Property Value by Mortgage Status in Armour
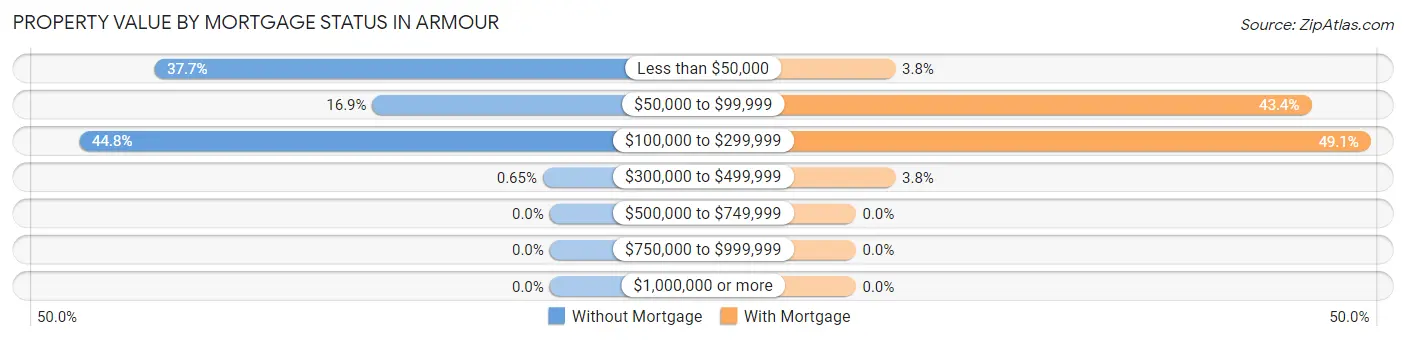
| Property Value | Without Mortgage | With Mortgage |
| Less than $50,000 | 58 (37.7%) | 2 (3.8%) |
| $50,000 to $99,999 | 26 (16.9%) | 23 (43.4%) |
| $100,000 to $299,999 | 69 (44.8%) | 26 (49.1%) |
| $300,000 to $499,999 | 1 (0.6%) | 2 (3.8%) |
| $500,000 to $749,999 | 0 (0.0%) | 0 (0.0%) |
| $750,000 to $999,999 | 0 (0.0%) | 0 (0.0%) |
| $1,000,000 or more | 0 (0.0%) | 0 (0.0%) |
| Total | 154 (100.0%) | 53 (100.0%) |
Household Income by Mortgage Status in Armour
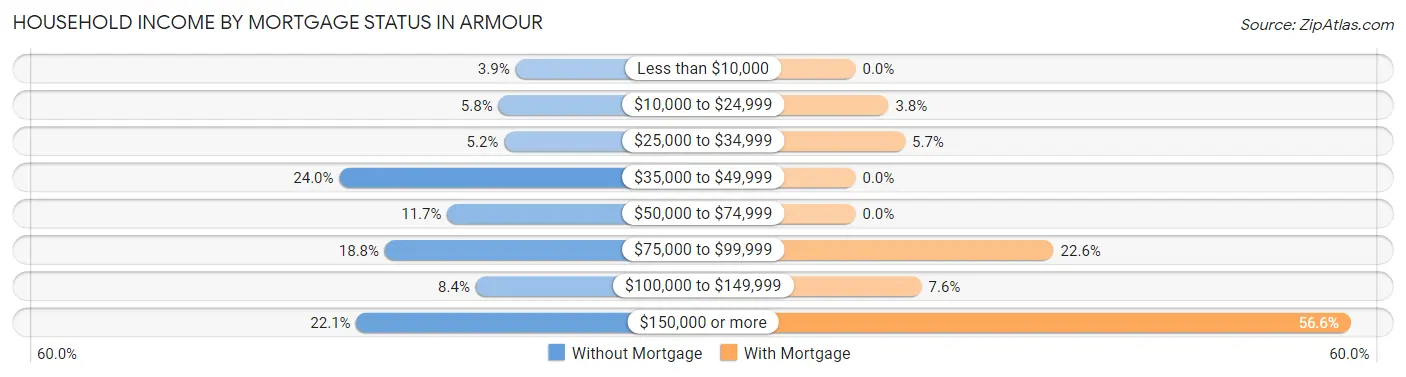
| Household Income | Without Mortgage | With Mortgage |
| Less than $10,000 | 6 (3.9%) | 0 (0.0%) |
| $10,000 to $24,999 | 9 (5.8%) | 2 (3.8%) |
| $25,000 to $34,999 | 8 (5.2%) | 3 (5.7%) |
| $35,000 to $49,999 | 37 (24.0%) | 0 (0.0%) |
| $50,000 to $74,999 | 18 (11.7%) | 0 (0.0%) |
| $75,000 to $99,999 | 29 (18.8%) | 12 (22.6%) |
| $100,000 to $149,999 | 13 (8.4%) | 4 (7.5%) |
| $150,000 or more | 34 (22.1%) | 30 (56.6%) |
| Total | 154 (100.0%) | 53 (100.0%) |
Property Value to Household Income Ratio in Armour
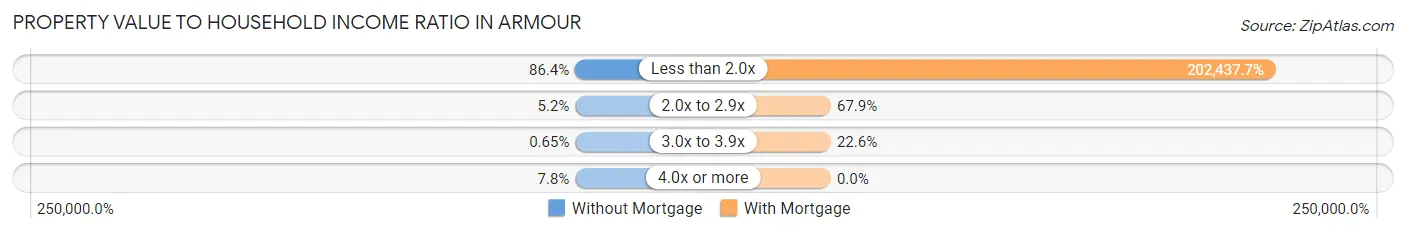
| Value-to-Income Ratio | Without Mortgage | With Mortgage |
| Less than 2.0x | 133 (86.4%) | 107,292 (202,437.7%) |
| 2.0x to 2.9x | 8 (5.2%) | 36 (67.9%) |
| 3.0x to 3.9x | 1 (0.6%) | 12 (22.6%) |
| 4.0x or more | 12 (7.8%) | 0 (0.0%) |
| Total | 154 (100.0%) | 53 (100.0%) |
Real Estate Taxes by Mortgage Status in Armour
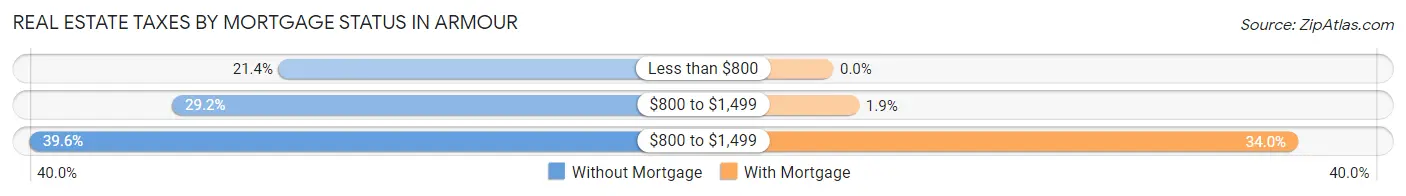
| Property Taxes | Without Mortgage | With Mortgage |
| Less than $800 | 33 (21.4%) | 0 (0.0%) |
| $800 to $1,499 | 45 (29.2%) | 1 (1.9%) |
| $800 to $1,499 | 61 (39.6%) | 18 (34.0%) |
| Total | 154 (100.0%) | 53 (100.0%) |
Health & Disability in Armour
Health Insurance Coverage by Age in Armour
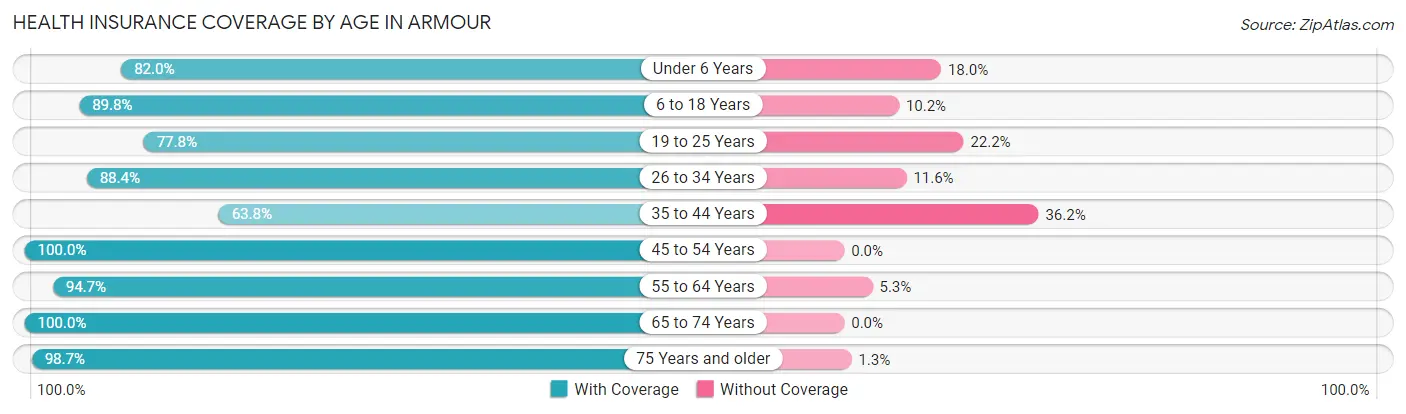
| Age Bracket | With Coverage | Without Coverage |
| Under 6 Years | 50 (82.0%) | 11 (18.0%) |
| 6 to 18 Years | 97 (89.8%) | 11 (10.2%) |
| 19 to 25 Years | 14 (77.8%) | 4 (22.2%) |
| 26 to 34 Years | 61 (88.4%) | 8 (11.6%) |
| 35 to 44 Years | 37 (63.8%) | 21 (36.2%) |
| 45 to 54 Years | 48 (100.0%) | 0 (0.0%) |
| 55 to 64 Years | 90 (94.7%) | 5 (5.3%) |
| 65 to 74 Years | 62 (100.0%) | 0 (0.0%) |
| 75 Years and older | 74 (98.7%) | 1 (1.3%) |
| Total | 533 (89.7%) | 61 (10.3%) |
Health Insurance Coverage by Citizenship Status in Armour
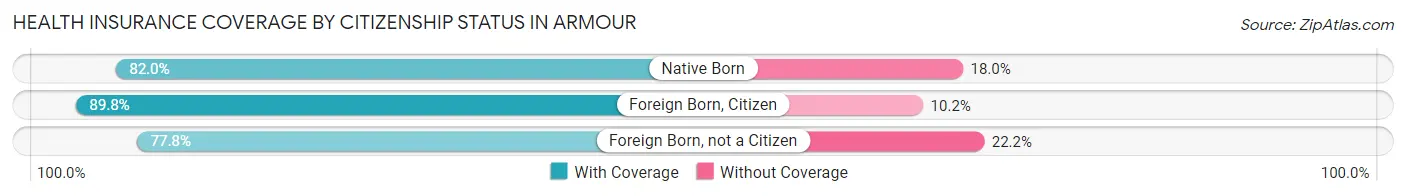
| Citizenship Status | With Coverage | Without Coverage |
| Native Born | 50 (82.0%) | 11 (18.0%) |
| Foreign Born, Citizen | 97 (89.8%) | 11 (10.2%) |
| Foreign Born, not a Citizen | 14 (77.8%) | 4 (22.2%) |
Health Insurance Coverage by Household Income in Armour
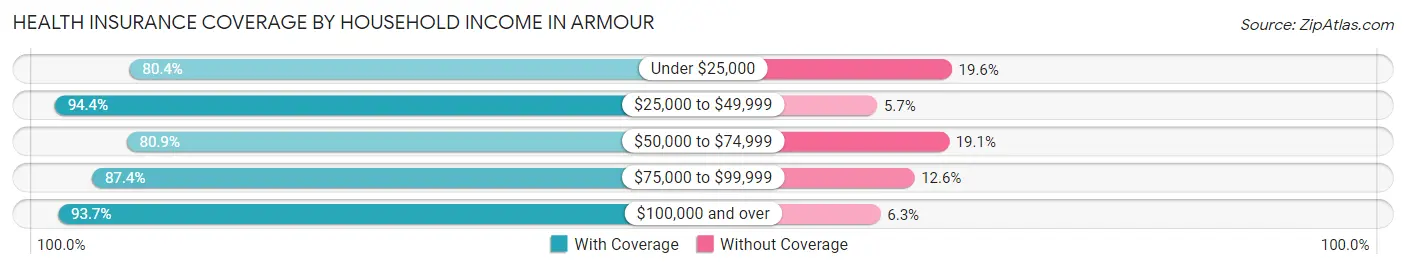
| Household Income | With Coverage | Without Coverage |
| Under $25,000 | 45 (80.4%) | 11 (19.6%) |
| $25,000 to $49,999 | 117 (94.4%) | 7 (5.7%) |
| $50,000 to $74,999 | 72 (80.9%) | 17 (19.1%) |
| $75,000 to $99,999 | 83 (87.4%) | 12 (12.6%) |
| $100,000 and over | 209 (93.7%) | 14 (6.3%) |
Public vs Private Health Insurance Coverage by Age in Armour
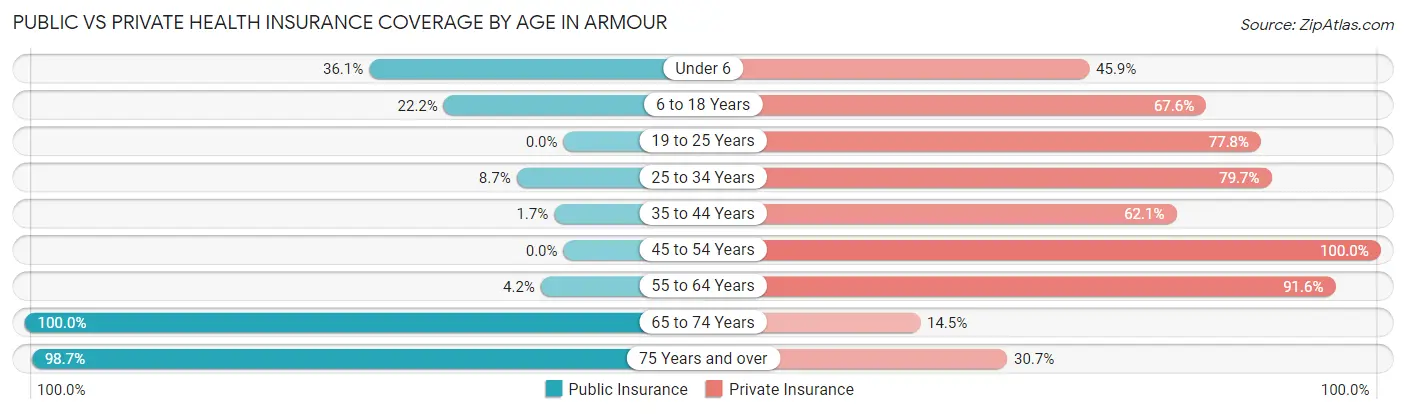
| Age Bracket | Public Insurance | Private Insurance |
| Under 6 | 22 (36.1%) | 28 (45.9%) |
| 6 to 18 Years | 24 (22.2%) | 73 (67.6%) |
| 19 to 25 Years | 0 (0.0%) | 14 (77.8%) |
| 25 to 34 Years | 6 (8.7%) | 55 (79.7%) |
| 35 to 44 Years | 1 (1.7%) | 36 (62.1%) |
| 45 to 54 Years | 0 (0.0%) | 48 (100.0%) |
| 55 to 64 Years | 4 (4.2%) | 87 (91.6%) |
| 65 to 74 Years | 62 (100.0%) | 9 (14.5%) |
| 75 Years and over | 74 (98.7%) | 23 (30.7%) |
| Total | 193 (32.5%) | 373 (62.8%) |
Disability Status by Sex by Age in Armour
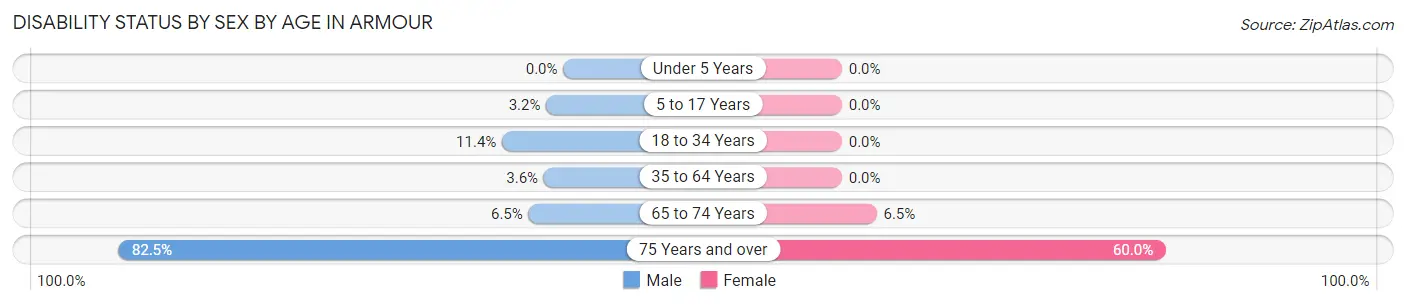
| Age Bracket | Male | Female |
| Under 5 Years | 0 (0.0%) | 0 (0.0%) |
| 5 to 17 Years | 2 (3.2%) | 0 (0.0%) |
| 18 to 34 Years | 5 (11.4%) | 0 (0.0%) |
| 35 to 64 Years | 4 (3.6%) | 0 (0.0%) |
| 65 to 74 Years | 2 (6.5%) | 2 (6.5%) |
| 75 Years and over | 33 (82.5%) | 21 (60.0%) |
Disability Class by Sex by Age in Armour
Disability Class: Hearing Difficulty
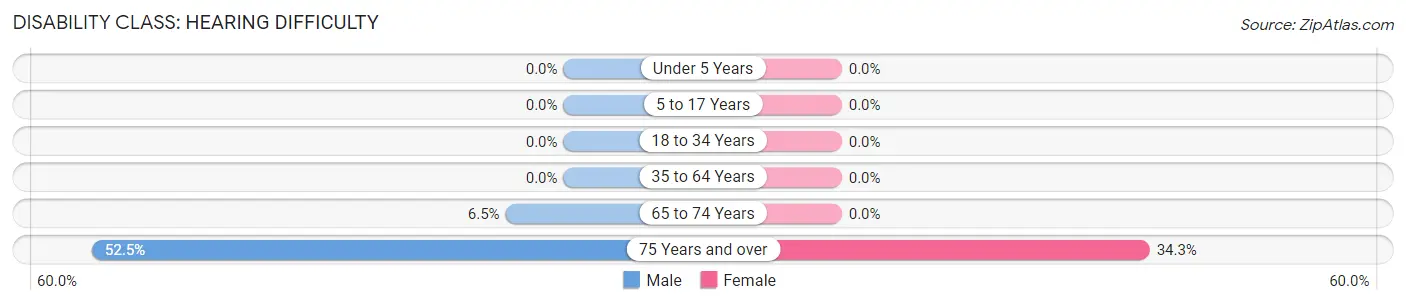
| Age Bracket | Male | Female |
| Under 5 Years | 0 (0.0%) | 0 (0.0%) |
| 5 to 17 Years | 0 (0.0%) | 0 (0.0%) |
| 18 to 34 Years | 0 (0.0%) | 0 (0.0%) |
| 35 to 64 Years | 0 (0.0%) | 0 (0.0%) |
| 65 to 74 Years | 2 (6.5%) | 0 (0.0%) |
| 75 Years and over | 21 (52.5%) | 12 (34.3%) |
Disability Class: Vision Difficulty
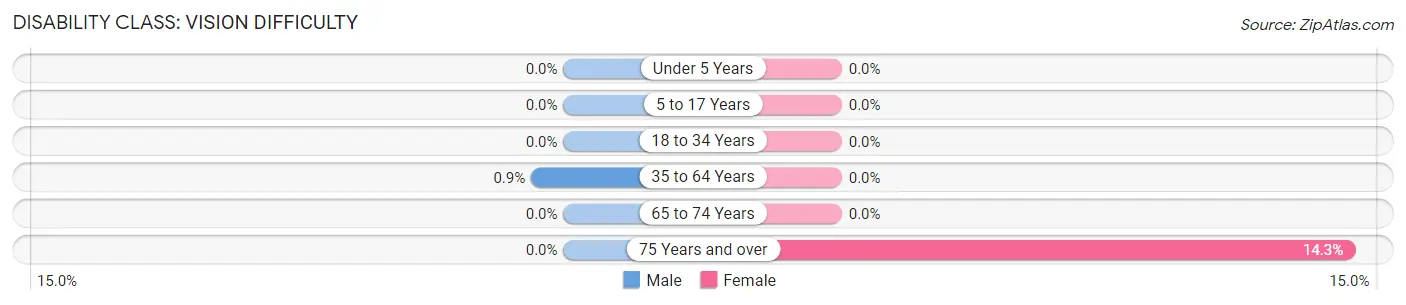
| Age Bracket | Male | Female |
| Under 5 Years | 0 (0.0%) | 0 (0.0%) |
| 5 to 17 Years | 0 (0.0%) | 0 (0.0%) |
| 18 to 34 Years | 0 (0.0%) | 0 (0.0%) |
| 35 to 64 Years | 1 (0.9%) | 0 (0.0%) |
| 65 to 74 Years | 0 (0.0%) | 0 (0.0%) |
| 75 Years and over | 0 (0.0%) | 5 (14.3%) |
Disability Class: Cognitive Difficulty
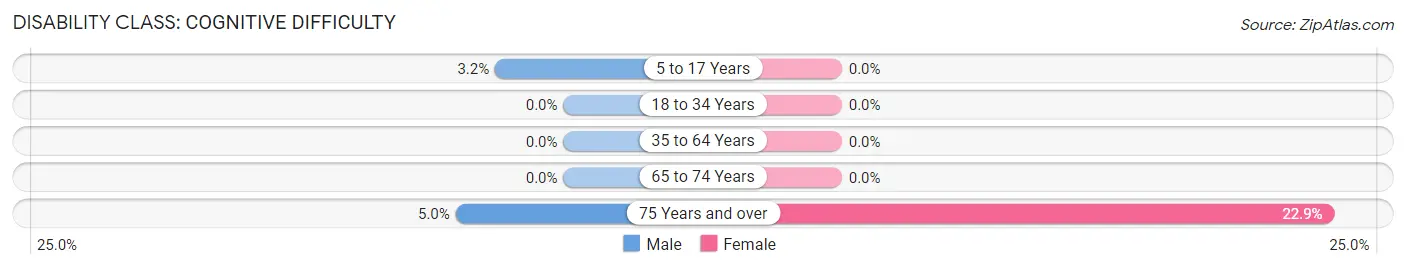
| Age Bracket | Male | Female |
| 5 to 17 Years | 2 (3.2%) | 0 (0.0%) |
| 18 to 34 Years | 0 (0.0%) | 0 (0.0%) |
| 35 to 64 Years | 0 (0.0%) | 0 (0.0%) |
| 65 to 74 Years | 0 (0.0%) | 0 (0.0%) |
| 75 Years and over | 2 (5.0%) | 8 (22.9%) |
Disability Class: Ambulatory Difficulty
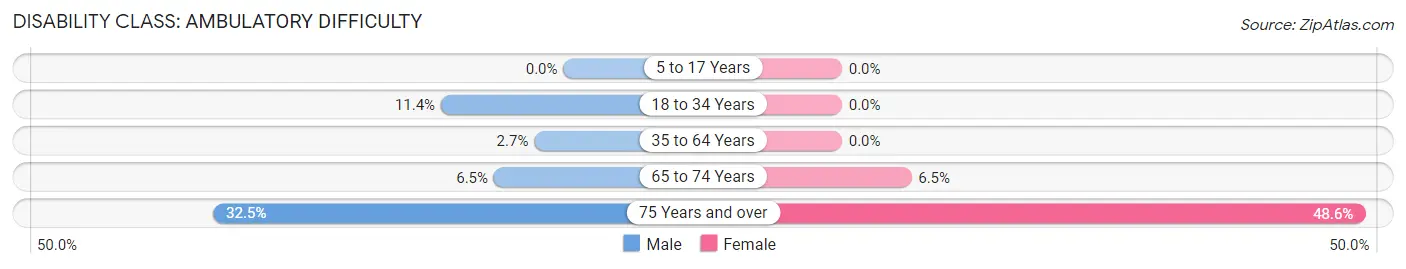
| Age Bracket | Male | Female |
| 5 to 17 Years | 0 (0.0%) | 0 (0.0%) |
| 18 to 34 Years | 5 (11.4%) | 0 (0.0%) |
| 35 to 64 Years | 3 (2.7%) | 0 (0.0%) |
| 65 to 74 Years | 2 (6.5%) | 2 (6.5%) |
| 75 Years and over | 13 (32.5%) | 17 (48.6%) |
Disability Class: Self-Care Difficulty
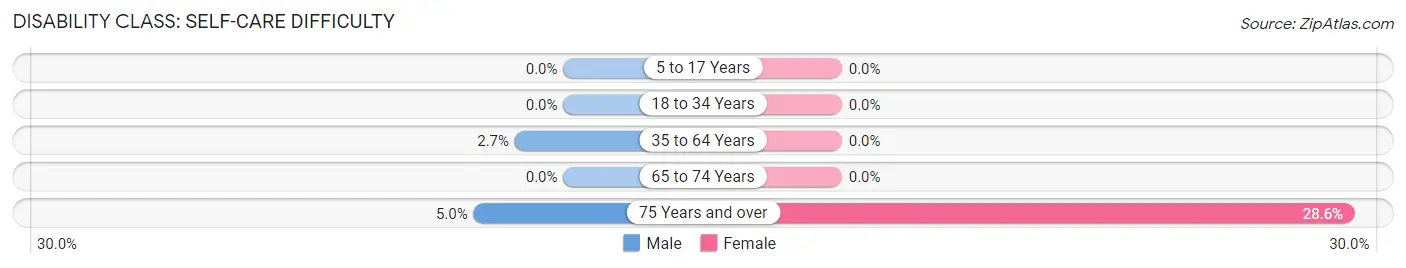
| Age Bracket | Male | Female |
| 5 to 17 Years | 0 (0.0%) | 0 (0.0%) |
| 18 to 34 Years | 0 (0.0%) | 0 (0.0%) |
| 35 to 64 Years | 3 (2.7%) | 0 (0.0%) |
| 65 to 74 Years | 0 (0.0%) | 0 (0.0%) |
| 75 Years and over | 2 (5.0%) | 10 (28.6%) |
Technology Access in Armour
Computing Device Access in Armour
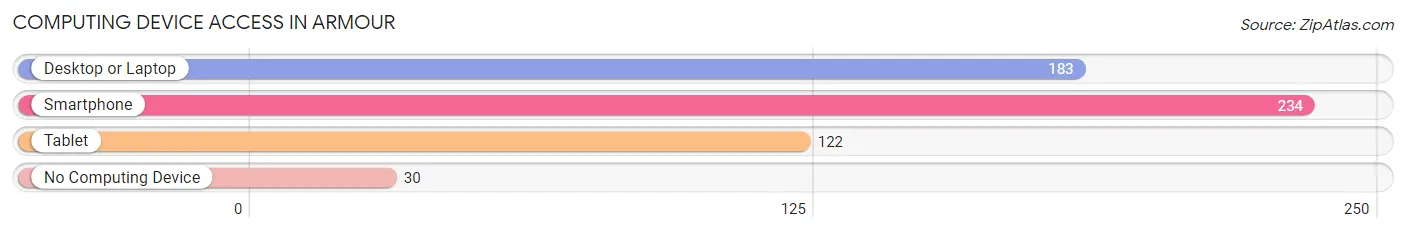
| Device Type | # Households | % Households |
| Desktop or Laptop | 183 | 68.0% |
| Smartphone | 234 | 87.0% |
| Tablet | 122 | 45.4% |
| No Computing Device | 30 | 11.2% |
| Total | 269 | 100.0% |
Internet Access in Armour
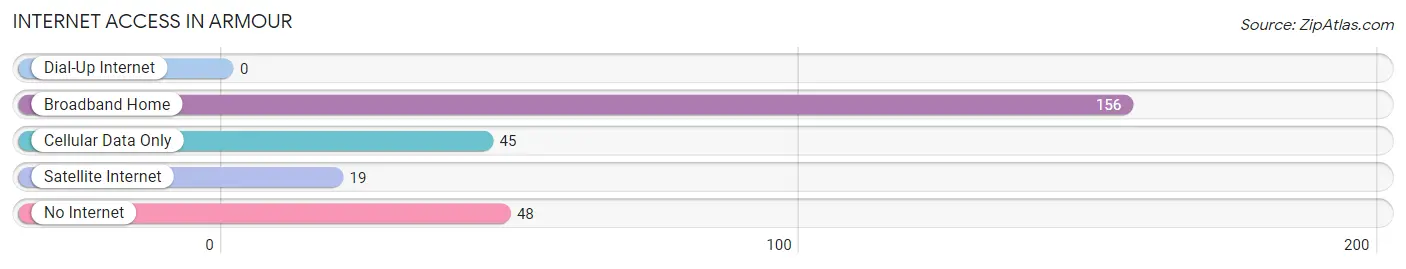
| Internet Type | # Households | % Households |
| Dial-Up Internet | 0 | 0.0% |
| Broadband Home | 156 | 58.0% |
| Cellular Data Only | 45 | 16.7% |
| Satellite Internet | 19 | 7.1% |
| No Internet | 48 | 17.8% |
| Total | 269 | 100.0% |
Armour Summary
SD (South Dakota) is a state located in the Midwestern region of the United States. It is bordered by North Dakota to the north, Minnesota to the east, Iowa to the southeast, Nebraska to the south, and Wyoming and Montana to the west. The state has an area of 77,116 square miles, making it the 17th largest state in the country. As of 2019, the population of South Dakota was estimated to be 884,659, making it the 46th most populous state in the country.
History
The area that is now South Dakota has been inhabited by various Native American tribes for thousands of years. The first Europeans to explore the area were French fur traders, who arrived in the late 17th century. In the early 19th century, the United States acquired the area through the Louisiana Purchase. The area was organized as part of the Dakota Territory in 1861, and was admitted to the Union as the 40th state in 1889.
During the late 19th and early 20th centuries, South Dakota experienced a period of rapid growth and development. The Homestead Act of 1862 encouraged settlers to move to the area, and the construction of railroads in the 1880s and 1890s further facilitated the settlement of the region. The state also experienced a period of economic growth during this time, as the mining of gold, silver, and other minerals, as well as the development of agriculture, helped to drive the economy.
Geography
South Dakota is located in the Midwestern region of the United States. It is bordered by North Dakota to the north, Minnesota to the east, Iowa to the southeast, Nebraska to the south, and Wyoming and Montana to the west. The state has an area of 77,116 square miles, making it the 17th largest state in the country.
The geography of South Dakota is varied, with the eastern part of the state being dominated by the Great Plains, while the western part of the state is characterized by the Black Hills and the Badlands. The Missouri River forms the eastern border of the state, while the Big Sioux River forms the western border. The state also contains several large lakes, including Lake Oahe, Lake Sharpe, and Lake Francis Case.
Economy
South Dakota has a diversified economy, with agriculture, manufacturing, and tourism being the main drivers of economic growth. Agriculture is the largest sector of the state’s economy, with the production of corn, soybeans, wheat, and other crops being the main sources of income. Manufacturing is also an important part of the economy, with the production of food products, machinery, and other goods being the main sources of employment. Tourism is also an important part of the economy, with the state’s many national parks and monuments attracting millions of visitors each year.
Demographics
As of 2019, the population of South Dakota was estimated to be 884,659, making it the 46th most populous state in the country. The state has a population density of 11.5 people per square mile, making it the 48th most densely populated state in the country. The racial makeup of the state is 87.2% White, 8.2% Native American, 1.7% Black, 0.7% Asian, and 2.2% from other races. The median household income in the state is $54,467, and the median age is 38.7 years.
Common Questions
What is Per Capita Income in Armour?
Per Capita income in Armour is $38,931.
What is the Median Family Income in Armour?
Median Family Income in Armour is $75,938.
What is the Median Household income in Armour?
Median Household Income in Armour is $60,341.
What is Income or Wage Gap in Armour?
Income or Wage Gap in Armour is 24.8%.
Women in Armour earn 75.2 cents for every dollar earned by a man.
What is Inequality or Gini Index in Armour?
Inequality or Gini Index in Armour is 0.48.
What is the Total Population of Armour?
Total Population of Armour is 642.
What is the Total Male Population of Armour?
Total Male Population of Armour is 322.
What is the Total Female Population of Armour?
Total Female Population of Armour is 320.
What is the Ratio of Males per 100 Females in Armour?
There are 100.62 Males per 100 Females in Armour.
What is the Ratio of Females per 100 Males in Armour?
There are 99.38 Females per 100 Males in Armour.
What is the Median Population Age in Armour?
Median Population Age in Armour is 46.4 Years.
What is the Average Family Size in Armour
Average Family Size in Armour is 2.9 People.
What is the Average Household Size in Armour
Average Household Size in Armour is 2.2 People.
How Large is the Labor Force in Armour?
There are 304 People in the Labor Forcein in Armour.
What is the Percentage of People in the Labor Force in Armour?
62.3% of People are in the Labor Force in Armour.
What is the Unemployment Rate in Armour?
Unemployment Rate in Armour is 1.3%.