Hartford, SD Map & Demographics
Hartford Map
Hartford Overview
$42,474
PER CAPITA INCOME
$94,752
AVG FAMILY INCOME
$93,762
AVG HOUSEHOLD INCOME
33.5%
WAGE / INCOME GAP [ % ]
66.5¢/ $1
WAGE / INCOME GAP [ $ ]
0.37
INEQUALITY / GINI INDEX
3,340
TOTAL POPULATION
1,710
MALE POPULATION
1,630
FEMALE POPULATION
104.91
MALES / 100 FEMALES
95.32
FEMALES / 100 MALES
38.6
MEDIAN AGE
2.8
AVG FAMILY SIZE
2.6
AVG HOUSEHOLD SIZE
1,995
LABOR FORCE [ PEOPLE ]
76.6%
PERCENT IN LABOR FORCE
2.9%
UNEMPLOYMENT RATE
Hartford Zip Codes
Hartford Area Codes
Income in Hartford
Income Overview in Hartford
Per Capita Income in Hartford is $42,474, while median incomes of families and households are $94,752 and $93,762 respectively.
| Characteristic | Number | Measure |
| Per Capita Income | 3,340 | $42,474 |
| Median Family Income | 1,029 | $94,752 |
| Mean Family Income | 1,029 | $117,802 |
| Median Household Income | 1,295 | $93,762 |
| Mean Household Income | 1,295 | $107,796 |
| Income Deficit | 1,029 | $0 |
| Wage / Income Gap (%) | 3,340 | 33.53% |
| Wage / Income Gap ($) | 3,340 | 66.47¢ per $1 |
| Gini / Inequality Index | 3,340 | 0.37 |
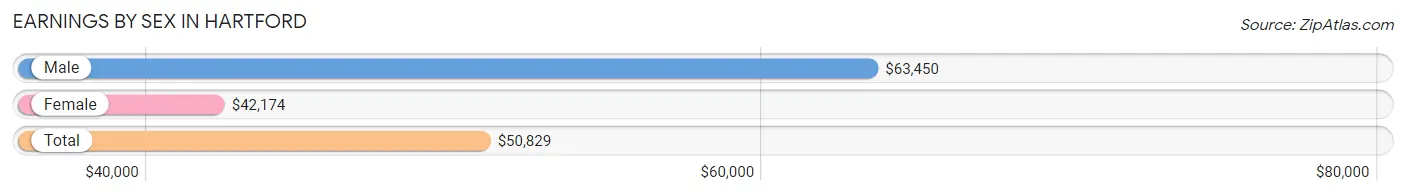
Earnings by Sex in Hartford
Average Earnings in Hartford are $50,829, $63,450 for men and $42,174 for women, a difference of 33.5%.
| Sex | Number | Average Earnings |
| Male | 1,043 (50.8%) | $63,450 |
| Female | 1,010 (49.2%) | $42,174 |
| Total | 2,053 (100.0%) | $50,829 |
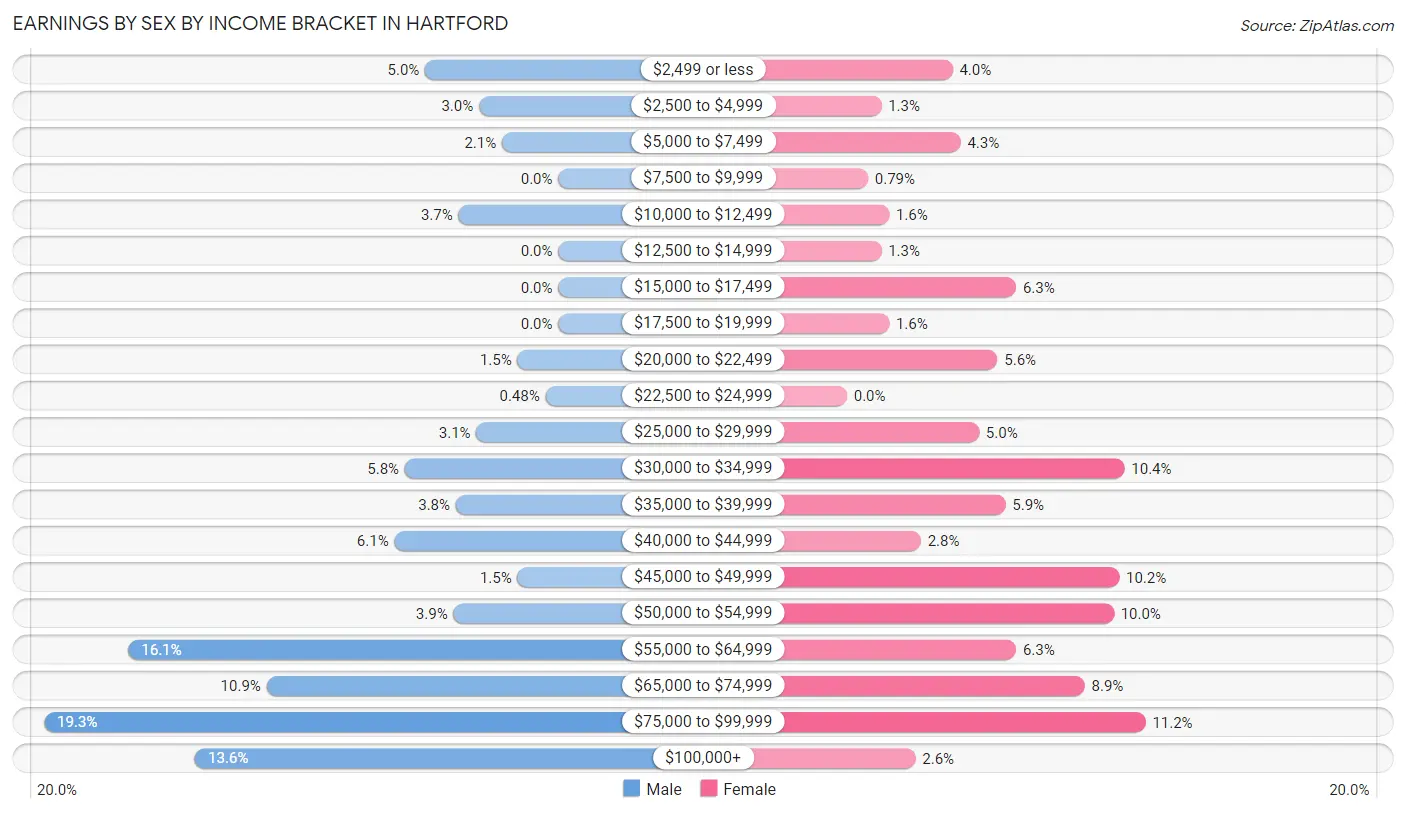
Earnings by Sex by Income Bracket in Hartford
The most common earnings brackets in Hartford are $75,000 to $99,999 for men (201 | 19.3%) and $75,000 to $99,999 for women (113 | 11.2%).
| Income | Male | Female |
| $2,499 or less | 52 (5.0%) | 40 (4.0%) |
| $2,500 to $4,999 | 31 (3.0%) | 13 (1.3%) |
| $5,000 to $7,499 | 22 (2.1%) | 43 (4.3%) |
| $7,500 to $9,999 | 0 (0.0%) | 8 (0.8%) |
| $10,000 to $12,499 | 39 (3.7%) | 16 (1.6%) |
| $12,500 to $14,999 | 0 (0.0%) | 13 (1.3%) |
| $15,000 to $17,499 | 0 (0.0%) | 64 (6.3%) |
| $17,500 to $19,999 | 0 (0.0%) | 16 (1.6%) |
| $20,000 to $22,499 | 16 (1.5%) | 57 (5.6%) |
| $22,500 to $24,999 | 5 (0.5%) | 0 (0.0%) |
| $25,000 to $29,999 | 32 (3.1%) | 50 (5.0%) |
| $30,000 to $34,999 | 60 (5.8%) | 105 (10.4%) |
| $35,000 to $39,999 | 40 (3.8%) | 60 (5.9%) |
| $40,000 to $44,999 | 64 (6.1%) | 28 (2.8%) |
| $45,000 to $49,999 | 16 (1.5%) | 103 (10.2%) |
| $50,000 to $54,999 | 41 (3.9%) | 101 (10.0%) |
| $55,000 to $64,999 | 168 (16.1%) | 64 (6.3%) |
| $65,000 to $74,999 | 114 (10.9%) | 90 (8.9%) |
| $75,000 to $99,999 | 201 (19.3%) | 113 (11.2%) |
| $100,000+ | 142 (13.6%) | 26 (2.6%) |
| Total | 1,043 (100.0%) | 1,010 (100.0%) |
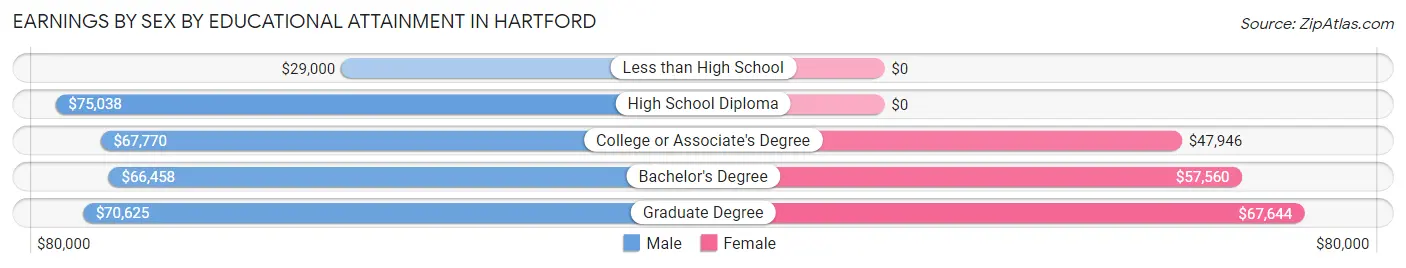
Earnings by Sex by Educational Attainment in Hartford
Average earnings in Hartford are $65,324 for men and $47,696 for women, a difference of 27.0%. Men with an educational attainment of high school diploma enjoy the highest average annual earnings of $75,038, while those with less than high school education earn the least with $29,000. Women with an educational attainment of graduate degree earn the most with the average annual earnings of $67,644, while those with college or associate's degree education have the smallest earnings of $47,946.
| Educational Attainment | Male Income | Female Income |
| Less than High School | $29,000 | $0 |
| High School Diploma | $75,038 | $0 |
| College or Associate's Degree | $67,770 | $47,946 |
| Bachelor's Degree | $66,458 | $57,560 |
| Graduate Degree | $70,625 | $67,644 |
| Total | $65,324 | $47,696 |
Family Income in Hartford
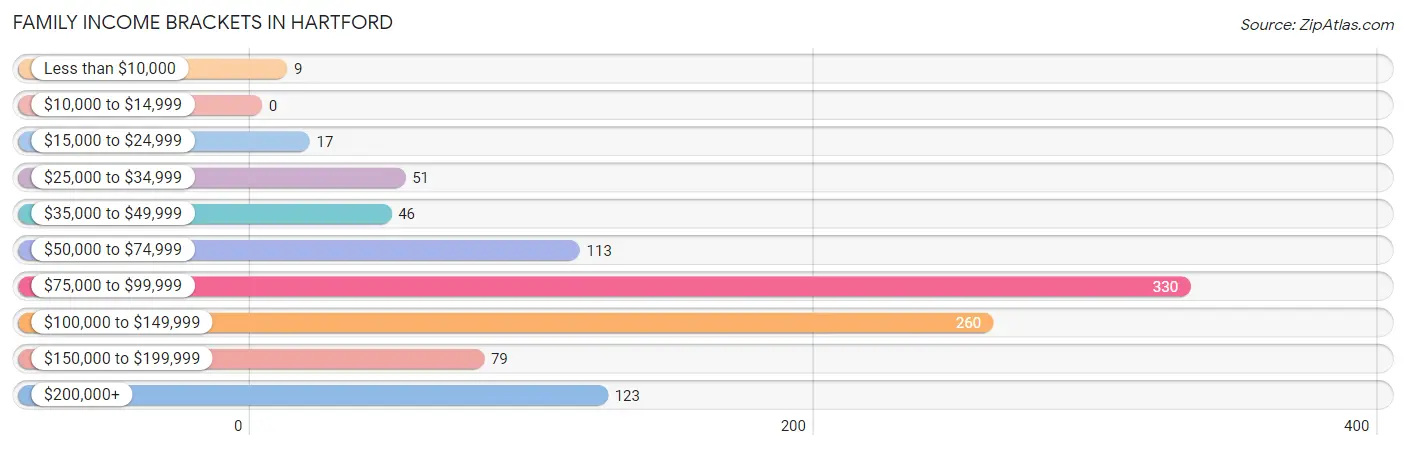
Family Income Brackets in Hartford
According to the Hartford family income data, there are 330 families falling into the $75,000 to $99,999 income range, which is the most common income bracket and makes up 32.1% of all families.
| Income Bracket | # Families | % Families |
| Less than $10,000 | 9 | 0.9% |
| $10,000 to $14,999 | 0 | 0.0% |
| $15,000 to $24,999 | 17 | 1.7% |
| $25,000 to $34,999 | 51 | 5.0% |
| $35,000 to $49,999 | 46 | 4.5% |
| $50,000 to $74,999 | 113 | 11.0% |
| $75,000 to $99,999 | 330 | 32.1% |
| $100,000 to $149,999 | 260 | 25.3% |
| $150,000 to $199,999 | 79 | 7.7% |
| $200,000+ | 123 | 12.0% |
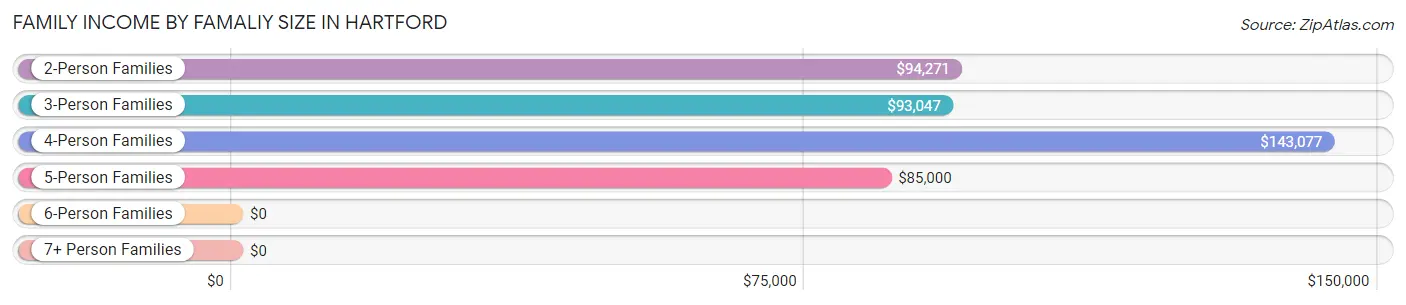
Family Income by Famaliy Size in Hartford
4-person families (212 | 20.6%) account for the highest median family income in Hartford with $143,077 per family, while 2-person families (531 | 51.6%) have the highest median income of $47,136 per family member.
| Income Bracket | # Families | Median Income |
| 2-Person Families | 531 (51.6%) | $94,271 |
| 3-Person Families | 225 (21.9%) | $93,047 |
| 4-Person Families | 212 (20.6%) | $143,077 |
| 5-Person Families | 54 (5.2%) | $85,000 |
| 6-Person Families | 7 (0.7%) | $0 |
| 7+ Person Families | 0 (0.0%) | $0 |
| Total | 1,029 (100.0%) | $94,752 |
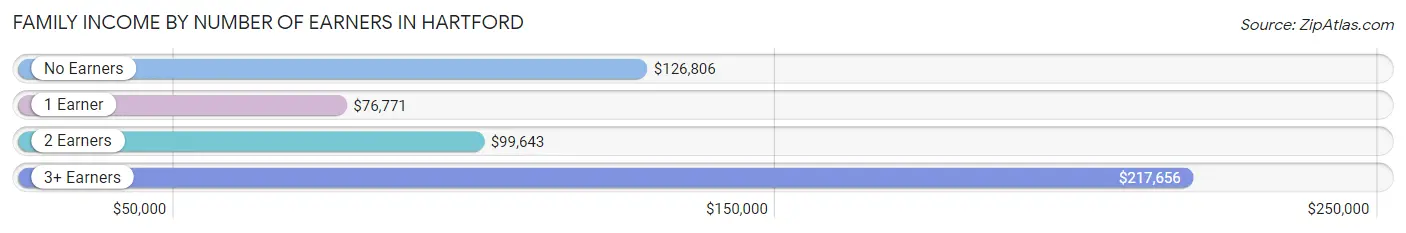
Family Income by Number of Earners in Hartford
The median family income in Hartford is $94,752, with families comprising 3+ earners (151) having the highest median family income of $217,656, while families with 1 earner (267) have the lowest median family income of $76,771, accounting for 14.7% and 26.0% of families, respectively.
| Number of Earners | # Families | Median Income |
| No Earners | 109 (10.6%) | $126,806 |
| 1 Earner | 267 (26.0%) | $76,771 |
| 2 Earners | 502 (48.8%) | $99,643 |
| 3+ Earners | 151 (14.7%) | $217,656 |
| Total | 1,029 (100.0%) | $94,752 |
Household Income in Hartford
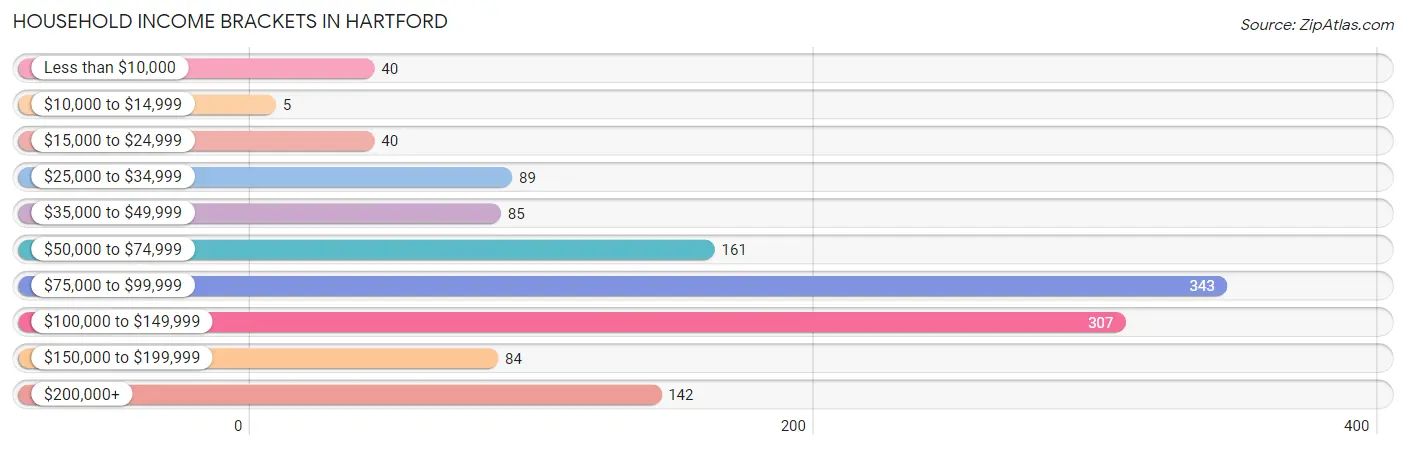
Household Income Brackets in Hartford
With 343 households falling in the category, the $75,000 to $99,999 income range is the most frequent in Hartford, accounting for 26.5% of all households. In contrast, only 5 households (0.4%) fall into the $10,000 to $14,999 income bracket, making it the least populous group.
| Income Bracket | # Households | % Households |
| Less than $10,000 | 40 | 3.1% |
| $10,000 to $14,999 | 5 | 0.4% |
| $15,000 to $24,999 | 40 | 3.1% |
| $25,000 to $34,999 | 89 | 6.9% |
| $35,000 to $49,999 | 85 | 6.6% |
| $50,000 to $74,999 | 161 | 12.4% |
| $75,000 to $99,999 | 343 | 26.5% |
| $100,000 to $149,999 | 307 | 23.7% |
| $150,000 to $199,999 | 84 | 6.5% |
| $200,000+ | 142 | 11.0% |
Household Income by Householder Age in Hartford
The median household income in Hartford is $93,762, with the highest median household income of $97,946 found in the 45 to 64 years age bracket for the primary householder. A total of 499 households (38.5%) fall into this category. Meanwhile, the 15 to 24 years age bracket for the primary householder has the lowest median household income of $0, with 11 households (0.9%) in this group.
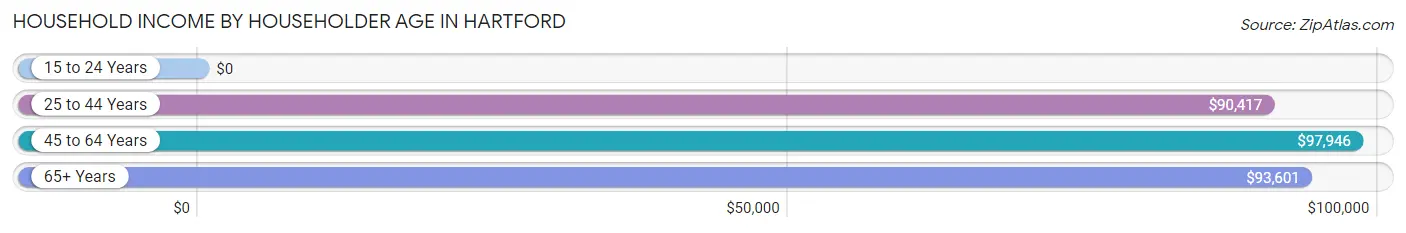
| Income Bracket | # Households | Median Income |
| 15 to 24 Years | 11 (0.9%) | $0 |
| 25 to 44 Years | 443 (34.2%) | $90,417 |
| 45 to 64 Years | 499 (38.5%) | $97,946 |
| 65+ Years | 342 (26.4%) | $93,601 |
| Total | 1,295 (100.0%) | $93,762 |
Poverty in Hartford
Income Below Poverty by Sex and Age in Hartford
With 4.0% poverty level for males and 3.0% for females among the residents of Hartford, 35 to 44 year old males and 75 year old and over females are the most vulnerable to poverty, with 40 males (16.5%) and 23 females (13.5%) in their respective age groups living below the poverty level.
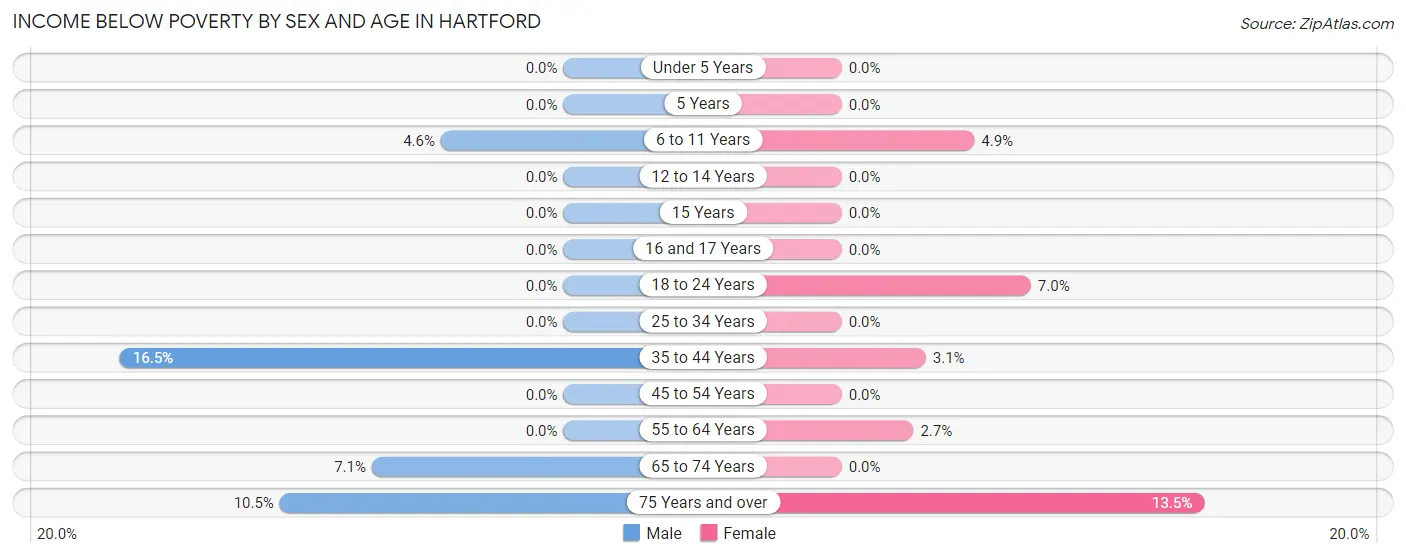
| Age Bracket | Male | Female |
| Under 5 Years | 0 (0.0%) | 0 (0.0%) |
| 5 Years | 0 (0.0%) | 0 (0.0%) |
| 6 to 11 Years | 8 (4.5%) | 9 (4.9%) |
| 12 to 14 Years | 0 (0.0%) | 0 (0.0%) |
| 15 Years | 0 (0.0%) | 0 (0.0%) |
| 16 and 17 Years | 0 (0.0%) | 0 (0.0%) |
| 18 to 24 Years | 0 (0.0%) | 4 (7.0%) |
| 25 to 34 Years | 0 (0.0%) | 0 (0.0%) |
| 35 to 44 Years | 40 (16.5%) | 8 (3.1%) |
| 45 to 54 Years | 0 (0.0%) | 0 (0.0%) |
| 55 to 64 Years | 0 (0.0%) | 5 (2.7%) |
| 65 to 74 Years | 17 (7.1%) | 0 (0.0%) |
| 75 Years and over | 4 (10.5%) | 23 (13.5%) |
| Total | 69 (4.0%) | 49 (3.0%) |
Income Above Poverty by Sex and Age in Hartford
According to the poverty statistics in Hartford, males aged under 5 years and females aged under 5 years are the age groups that are most secure financially, with 100.0% of males and 100.0% of females in these age groups living above the poverty line.
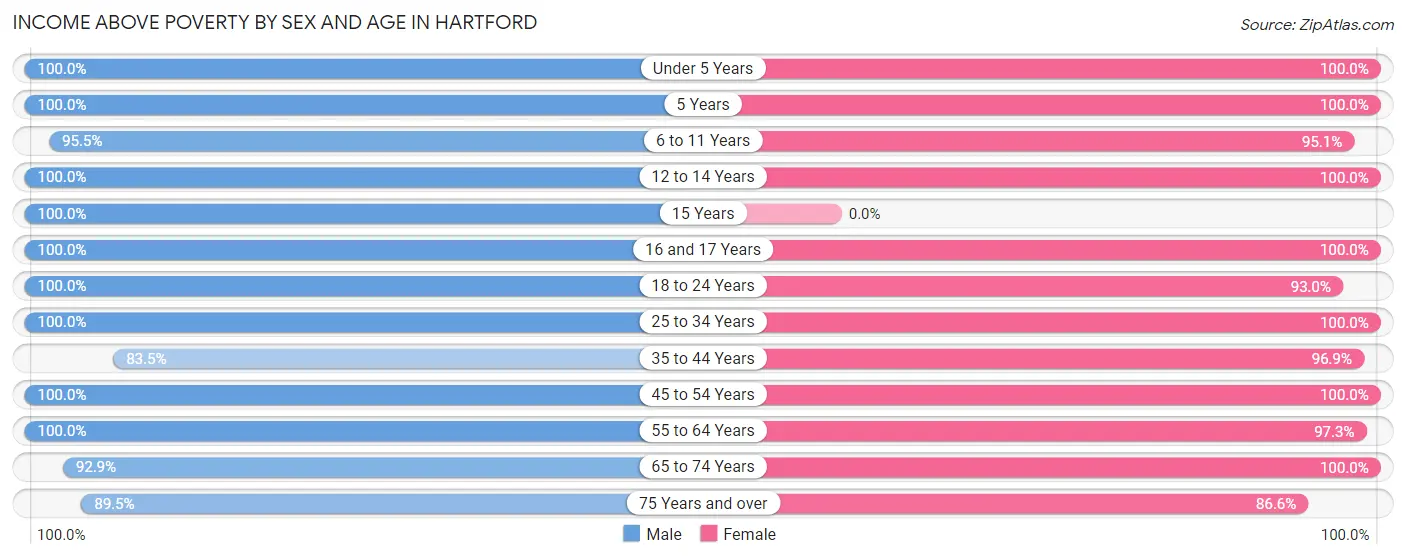
| Age Bracket | Male | Female |
| Under 5 Years | 86 (100.0%) | 93 (100.0%) |
| 5 Years | 13 (100.0%) | 7 (100.0%) |
| 6 to 11 Years | 168 (95.5%) | 174 (95.1%) |
| 12 to 14 Years | 78 (100.0%) | 62 (100.0%) |
| 15 Years | 26 (100.0%) | 0 (0.0%) |
| 16 and 17 Years | 48 (100.0%) | 52 (100.0%) |
| 18 to 24 Years | 104 (100.0%) | 53 (93.0%) |
| 25 to 34 Years | 266 (100.0%) | 211 (100.0%) |
| 35 to 44 Years | 203 (83.5%) | 248 (96.9%) |
| 45 to 54 Years | 205 (100.0%) | 219 (100.0%) |
| 55 to 64 Years | 188 (100.0%) | 183 (97.3%) |
| 65 to 74 Years | 222 (92.9%) | 119 (100.0%) |
| 75 Years and over | 34 (89.5%) | 148 (86.6%) |
| Total | 1,641 (96.0%) | 1,569 (97.0%) |
Income Below Poverty Among Married-Couple Families in Hartford
The poverty statistics for married-couple families in Hartford show that 1.1% or 9 of the total 819 families live below the poverty line. Families with 1 or 2 children have the highest poverty rate of 3.3%, comprising of 9 families. On the other hand, families with no children have the lowest poverty rate of 0.0%, which includes 0 families.
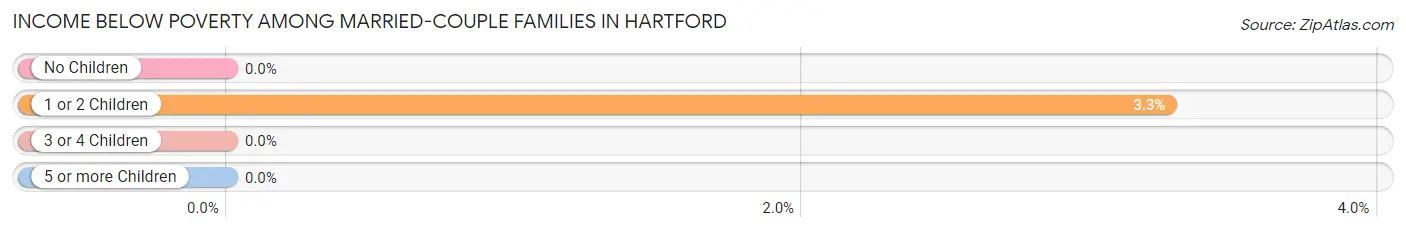
| Children | Above Poverty | Below Poverty |
| No Children | 489 (100.0%) | 0 (0.0%) |
| 1 or 2 Children | 266 (96.7%) | 9 (3.3%) |
| 3 or 4 Children | 55 (100.0%) | 0 (0.0%) |
| 5 or more Children | 0 (0.0%) | 0 (0.0%) |
| Total | 810 (98.9%) | 9 (1.1%) |
Income Below Poverty Among Single-Parent Households in Hartford
| Children | Single Father | Single Mother |
| No Children | 0 (0.0%) | 0 (0.0%) |
| 1 or 2 Children | 0 (0.0%) | 0 (0.0%) |
| 3 or 4 Children | 0 (0.0%) | 0 (0.0%) |
| 5 or more Children | 0 (0.0%) | 0 (0.0%) |
| Total | 0 (0.0%) | 0 (0.0%) |
Income Below Poverty Among Married-Couple vs Single-Parent Households in Hartford
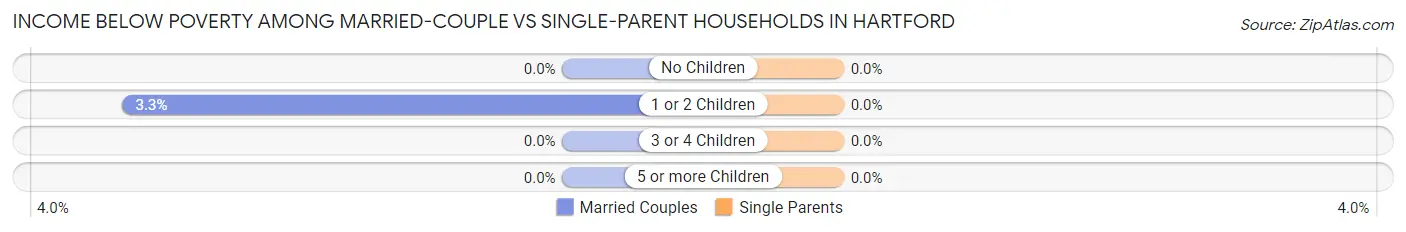
| Children | Married-Couple Families | Single-Parent Households |
| No Children | 0 (0.0%) | 0 (0.0%) |
| 1 or 2 Children | 9 (3.3%) | 0 (0.0%) |
| 3 or 4 Children | 0 (0.0%) | 0 (0.0%) |
| 5 or more Children | 0 (0.0%) | 0 (0.0%) |
| Total | 9 (1.1%) | 0 (0.0%) |
Race in Hartford
The most populous races in Hartford are White / Caucasian (3,025 | 90.6%), Two or more Races (259 | 7.7%), and Hispanic or Latino (83 | 2.5%).
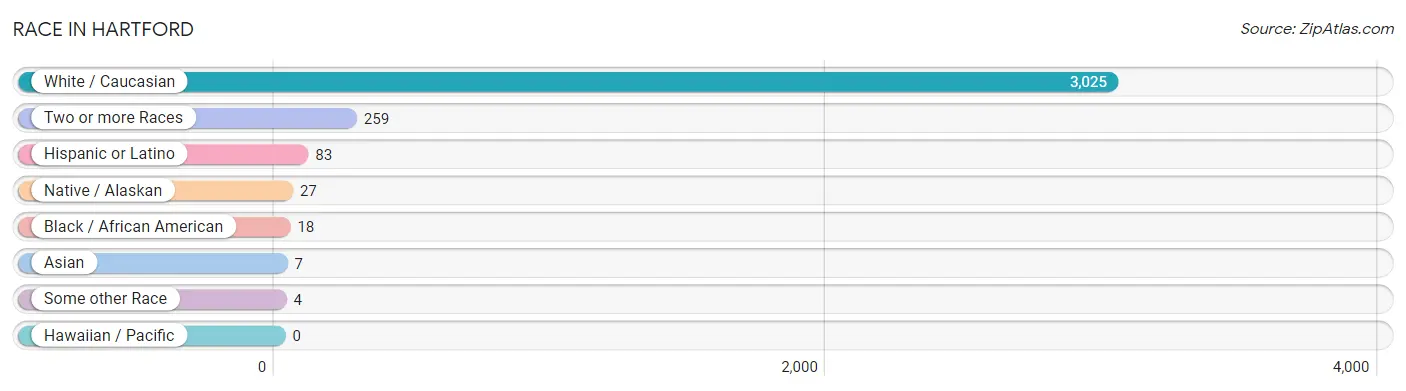
| Race | # Population | % Population |
| Asian | 7 | 0.2% |
| Black / African American | 18 | 0.5% |
| Hawaiian / Pacific | 0 | 0.0% |
| Hispanic or Latino | 83 | 2.5% |
| Native / Alaskan | 27 | 0.8% |
| White / Caucasian | 3,025 | 90.6% |
| Two or more Races | 259 | 7.7% |
| Some other Race | 4 | 0.1% |
| Total | 3,340 | 100.0% |
Ancestry in Hartford
The most populous ancestries reported in Hartford are German (907 | 27.2%), American (419 | 12.5%), Norwegian (325 | 9.7%), Dutch (209 | 6.3%), and English (205 | 6.1%), together accounting for 61.8% of all Hartford residents.
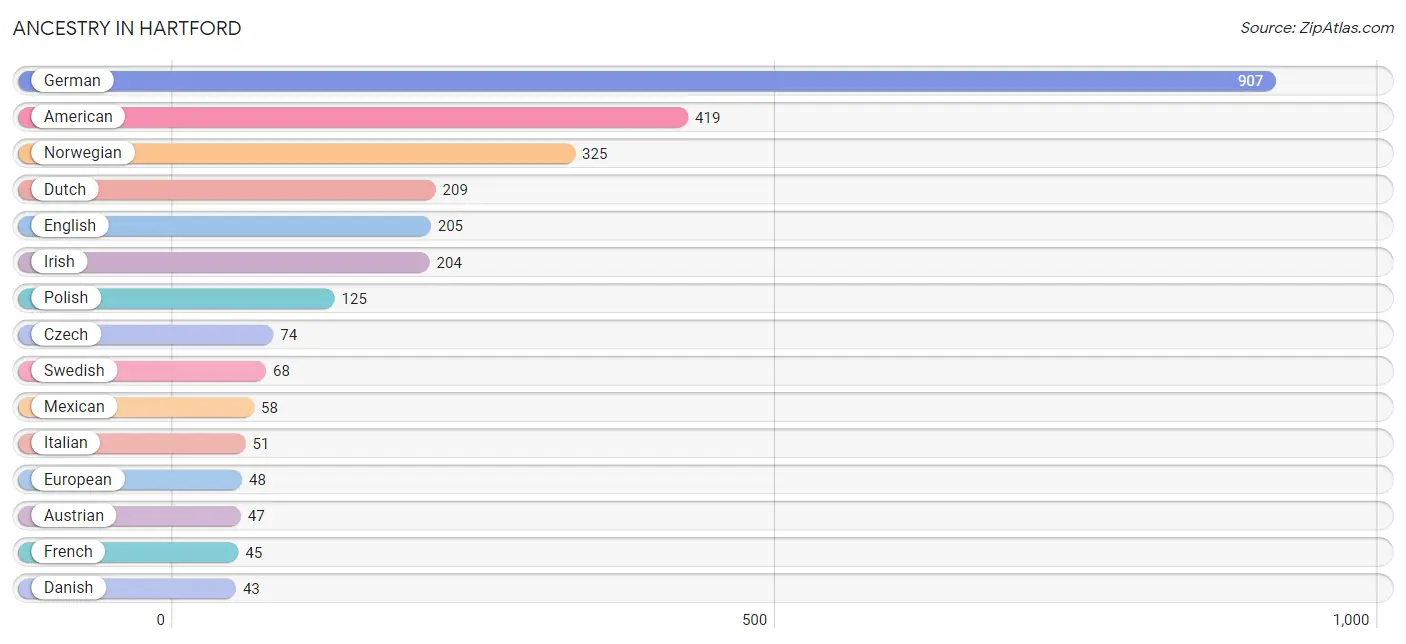
| Ancestry | # Population | % Population |
| American | 419 | 12.5% |
| Austrian | 47 | 1.4% |
| British | 16 | 0.5% |
| Central American | 4 | 0.1% |
| Choctaw | 27 | 0.8% |
| Croatian | 4 | 0.1% |
| Czech | 74 | 2.2% |
| Czechoslovakian | 4 | 0.1% |
| Danish | 43 | 1.3% |
| Dutch | 209 | 6.3% |
| English | 205 | 6.1% |
| European | 48 | 1.4% |
| French | 45 | 1.3% |
| German | 907 | 27.2% |
| Guatemalan | 4 | 0.1% |
| Indian (Asian) | 7 | 0.2% |
| Irish | 204 | 6.1% |
| Italian | 51 | 1.5% |
| Mexican | 58 | 1.7% |
| Norwegian | 325 | 9.7% |
| Polish | 125 | 3.7% |
| Romanian | 1 | 0.0% |
| Russian | 6 | 0.2% |
| Scandinavian | 4 | 0.1% |
| Scotch-Irish | 32 | 1.0% |
| Sioux | 24 | 0.7% |
| Spaniard | 21 | 0.6% |
| Swedish | 68 | 2.0% | View All 28 Rows |
Immigrants in Hartford
The most numerous immigrant groups reported in Hartford came from Europe (62 | 1.9%), England (53 | 1.6%), Northern Europe (53 | 1.6%), Germany (9 | 0.3%), and Western Europe (9 | 0.3%), together accounting for 5.6% of all Hartford residents.
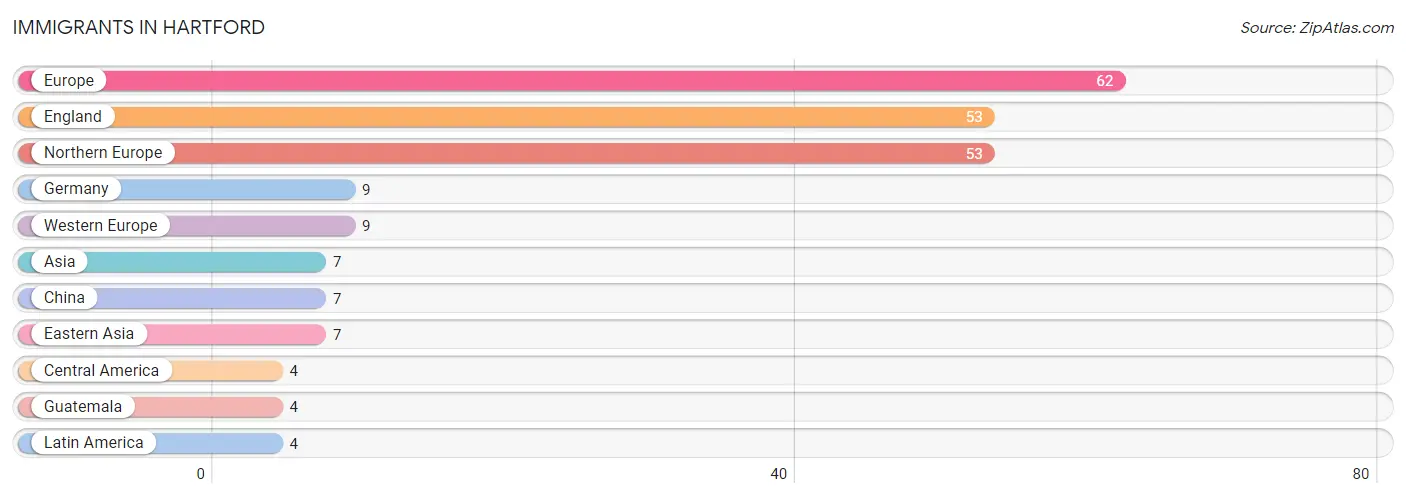
| Immigration Origin | # Population | % Population |
| Asia | 7 | 0.2% |
| Central America | 4 | 0.1% |
| China | 7 | 0.2% |
| Eastern Asia | 7 | 0.2% |
| England | 53 | 1.6% |
| Europe | 62 | 1.9% |
| Germany | 9 | 0.3% |
| Guatemala | 4 | 0.1% |
| Latin America | 4 | 0.1% |
| Northern Europe | 53 | 1.6% |
| Western Europe | 9 | 0.3% | View All 11 Rows |
Sex and Age in Hartford
Sex and Age in Hartford
The most populous age groups in Hartford are 70 to 74 Years (181 | 10.6%) for men and 35 to 39 Years (155 | 9.5%) for women.
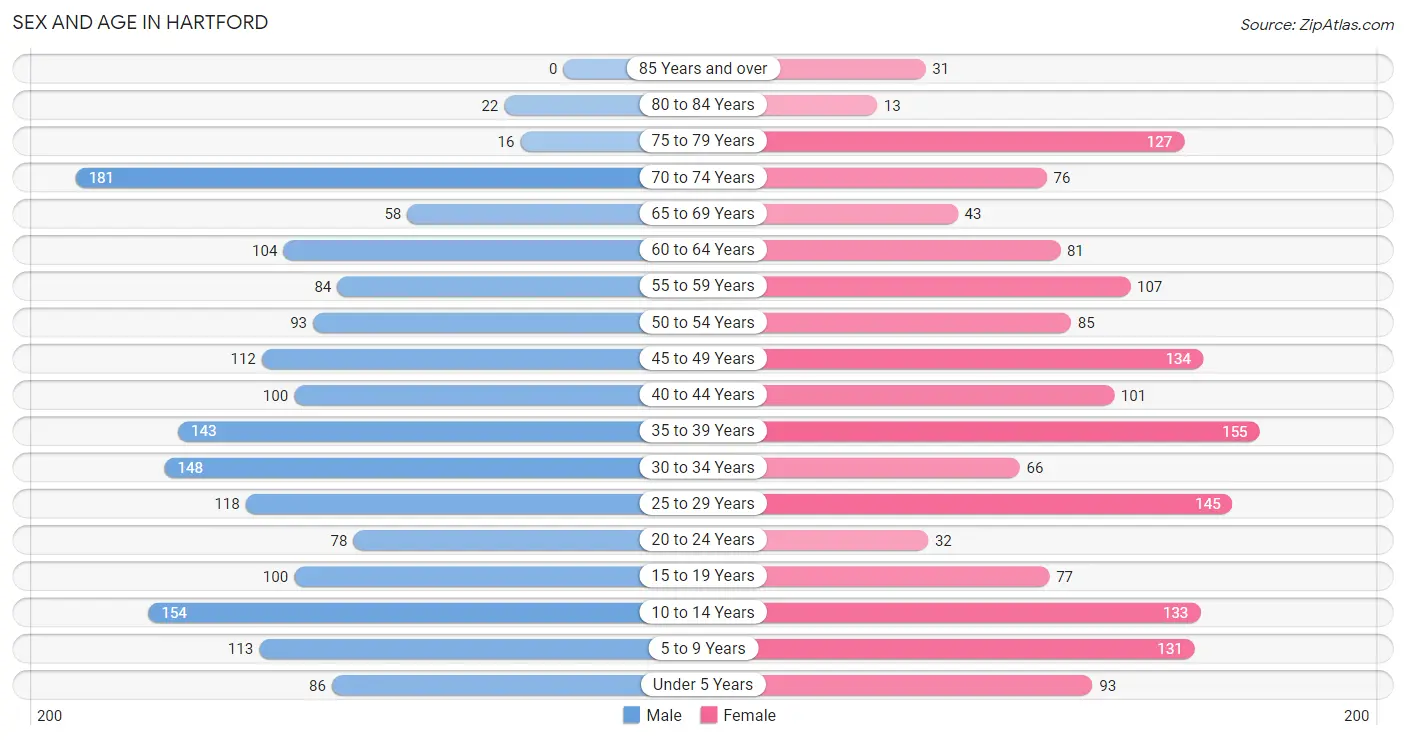
| Age Bracket | Male | Female |
| Under 5 Years | 86 (5.0%) | 93 (5.7%) |
| 5 to 9 Years | 113 (6.6%) | 131 (8.0%) |
| 10 to 14 Years | 154 (9.0%) | 133 (8.2%) |
| 15 to 19 Years | 100 (5.9%) | 77 (4.7%) |
| 20 to 24 Years | 78 (4.6%) | 32 (2.0%) |
| 25 to 29 Years | 118 (6.9%) | 145 (8.9%) |
| 30 to 34 Years | 148 (8.6%) | 66 (4.1%) |
| 35 to 39 Years | 143 (8.4%) | 155 (9.5%) |
| 40 to 44 Years | 100 (5.9%) | 101 (6.2%) |
| 45 to 49 Years | 112 (6.6%) | 134 (8.2%) |
| 50 to 54 Years | 93 (5.4%) | 85 (5.2%) |
| 55 to 59 Years | 84 (4.9%) | 107 (6.6%) |
| 60 to 64 Years | 104 (6.1%) | 81 (5.0%) |
| 65 to 69 Years | 58 (3.4%) | 43 (2.6%) |
| 70 to 74 Years | 181 (10.6%) | 76 (4.7%) |
| 75 to 79 Years | 16 (0.9%) | 127 (7.8%) |
| 80 to 84 Years | 22 (1.3%) | 13 (0.8%) |
| 85 Years and over | 0 (0.0%) | 31 (1.9%) |
| Total | 1,710 (100.0%) | 1,630 (100.0%) |
Families and Households in Hartford
Median Family Size in Hartford
The median family size in Hartford is 2.77 persons per family, with married-couple families (819 | 79.6%) accounting for the largest median family size of 2.8 persons per family. On the other hand, single male/father families (56 | 5.4%) represent the smallest median family size with 2.52 persons per family.
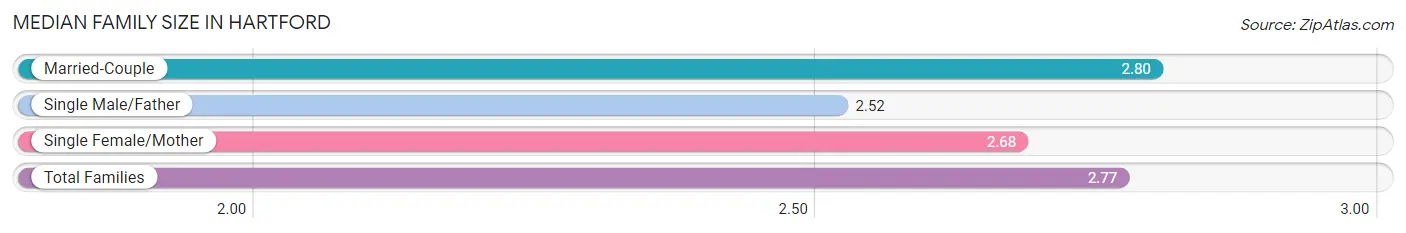
| Family Type | # Families | Family Size |
| Married-Couple | 819 (79.6%) | 2.80 |
| Single Male/Father | 56 (5.4%) | 2.52 |
| Single Female/Mother | 154 (15.0%) | 2.68 |
| Total Families | 1,029 (100.0%) | 2.77 |
Median Household Size in Hartford
The median household size in Hartford is 2.58 persons per household, with single female/mother households (154 | 11.9%) accounting for the largest median household size of 3.5 persons per household. non-family households (266 | 20.5%) represent the smallest median household size with 1.22 persons per household.
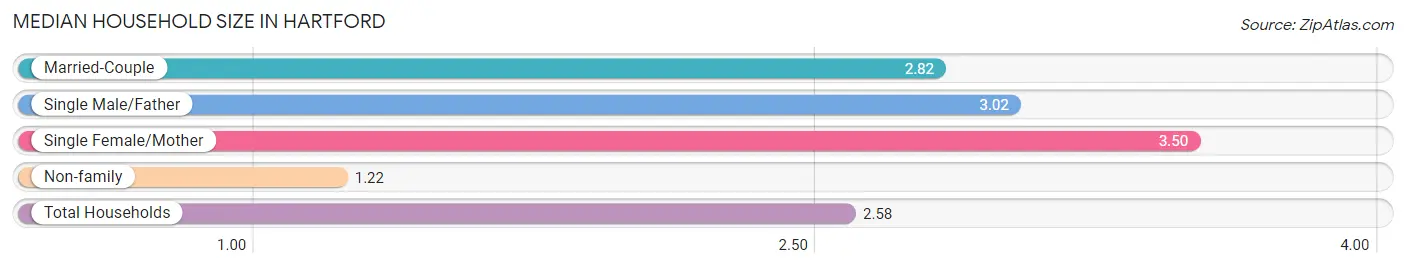
| Household Type | # Households | Household Size |
| Married-Couple | 819 (63.2%) | 2.82 |
| Single Male/Father | 56 (4.3%) | 3.02 |
| Single Female/Mother | 154 (11.9%) | 3.50 |
| Non-family | 266 (20.5%) | 1.22 |
| Total Households | 1,295 (100.0%) | 2.58 |
Household Size by Marriage Status in Hartford
Out of a total of 1,295 households in Hartford, 1,029 (79.5%) are family households, while 266 (20.5%) are nonfamily households. The most numerous type of family households are 2-person households, comprising 478, and the most common type of nonfamily households are 1-person households, comprising 225.
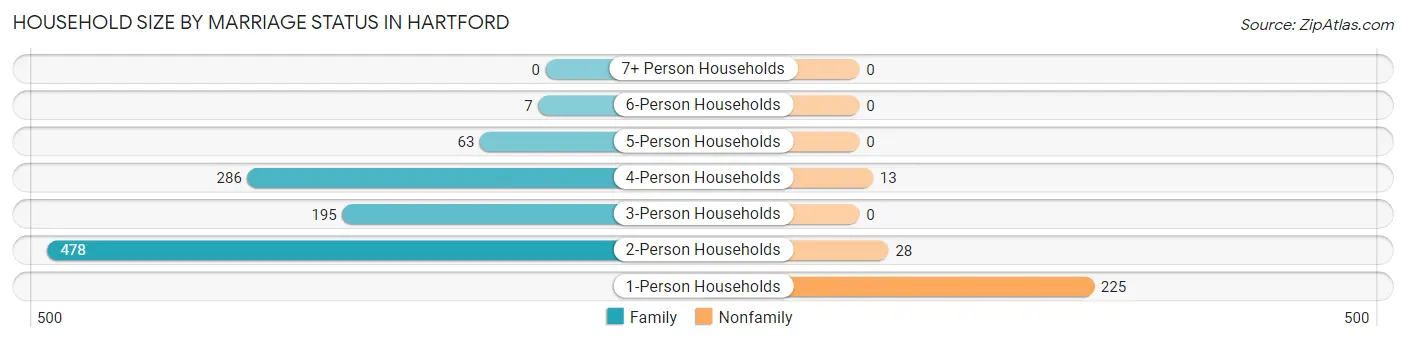
| Household Size | Family Households | Nonfamily Households |
| 1-Person Households | - | 225 (17.4%) |
| 2-Person Households | 478 (36.9%) | 28 (2.2%) |
| 3-Person Households | 195 (15.1%) | 0 (0.0%) |
| 4-Person Households | 286 (22.1%) | 13 (1.0%) |
| 5-Person Households | 63 (4.9%) | 0 (0.0%) |
| 6-Person Households | 7 (0.5%) | 0 (0.0%) |
| 7+ Person Households | 0 (0.0%) | 0 (0.0%) |
| Total | 1,029 (79.5%) | 266 (20.5%) |
Female Fertility in Hartford
Fertility by Age in Hartford
Average fertility rate in Hartford is 74.0 births per 1,000 women. Women in the age bracket of 20 to 34 years have the highest fertility rate with 218.0 births per 1,000 women. Women in the age bracket of 20 to 34 years acount for 100.0% of all women with births.
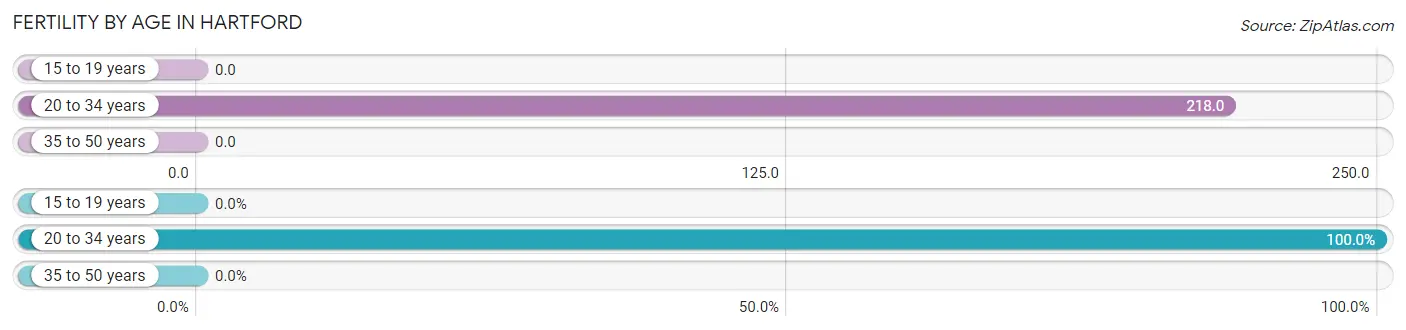
| Age Bracket | Women with Births | Births / 1,000 Women |
| 15 to 19 years | 0 (0.0%) | 0.0 |
| 20 to 34 years | 53 (100.0%) | 218.0 |
| 35 to 50 years | 0 (0.0%) | 0.0 |
| Total | 53 (100.0%) | 74.0 |
Fertility by Age by Marriage Status in Hartford
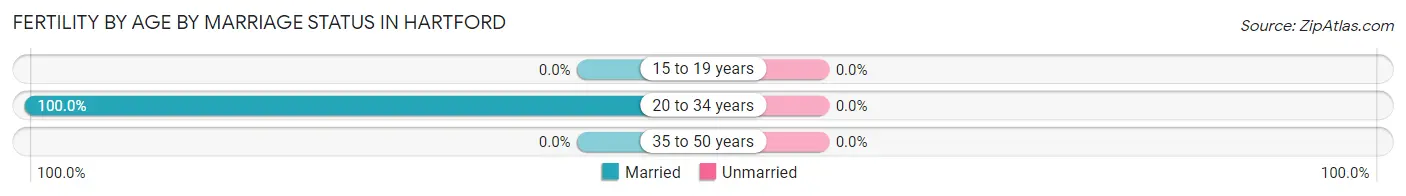
| Age Bracket | Married | Unmarried |
| 15 to 19 years | 0 (0.0%) | 0 (0.0%) |
| 20 to 34 years | 53 (100.0%) | 0 (0.0%) |
| 35 to 50 years | 0 (0.0%) | 0 (0.0%) |
| Total | 53 (100.0%) | 0 (0.0%) |
Fertility by Education in Hartford
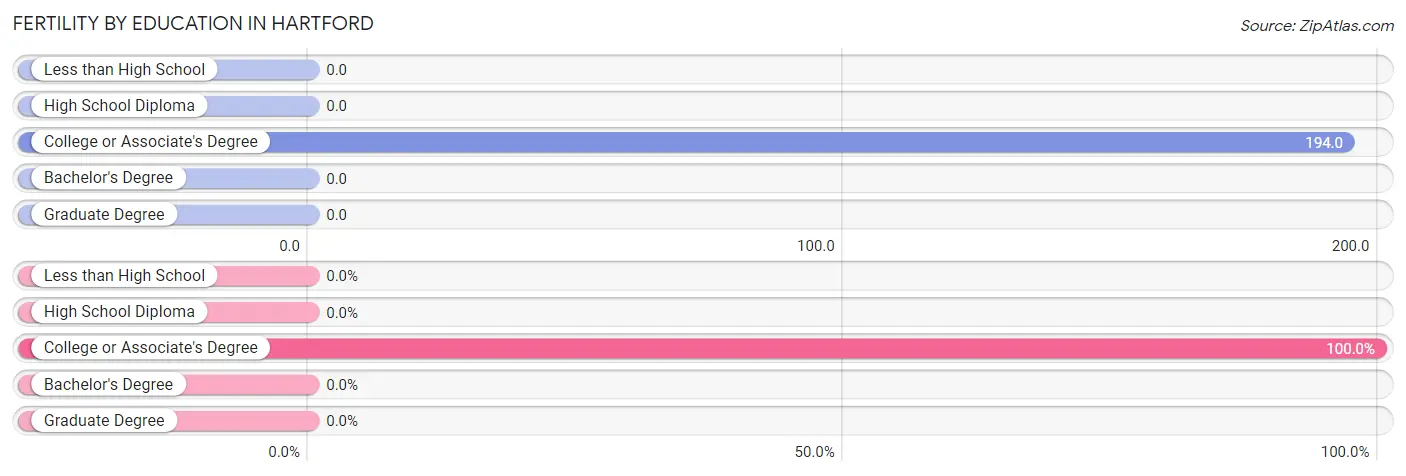
| Educational Attainment | Women with Births | Births / 1,000 Women |
| Less than High School | 0 (0.0%) | 0.0 |
| High School Diploma | 0 (0.0%) | 0.0 |
| College or Associate's Degree | 53 (100.0%) | 194.0 |
| Bachelor's Degree | 0 (0.0%) | 0.0 |
| Graduate Degree | 0 (0.0%) | 0.0 |
| Total | 53 (100.0%) | 74.0 |
Fertility by Education by Marriage Status in Hartford
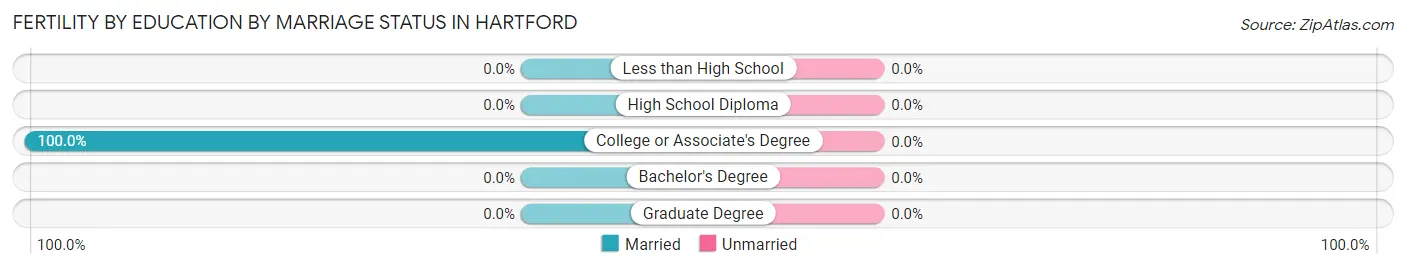
| Educational Attainment | Married | Unmarried |
| Less than High School | 0 (0.0%) | 0 (0.0%) |
| High School Diploma | 0 (0.0%) | 0 (0.0%) |
| College or Associate's Degree | 53 (100.0%) | 0 (0.0%) |
| Bachelor's Degree | 0 (0.0%) | 0 (0.0%) |
| Graduate Degree | 0 (0.0%) | 0 (0.0%) |
| Total | 53 (100.0%) | 0 (0.0%) |
Employment Characteristics in Hartford
Employment by Class of Employer in Hartford
Among the 1,923 employed individuals in Hartford, private company employees (1,256 | 65.3%), not-for-profit organizations (249 | 13.0%), and local government employees (159 | 8.3%) make up the most common classes of employment.
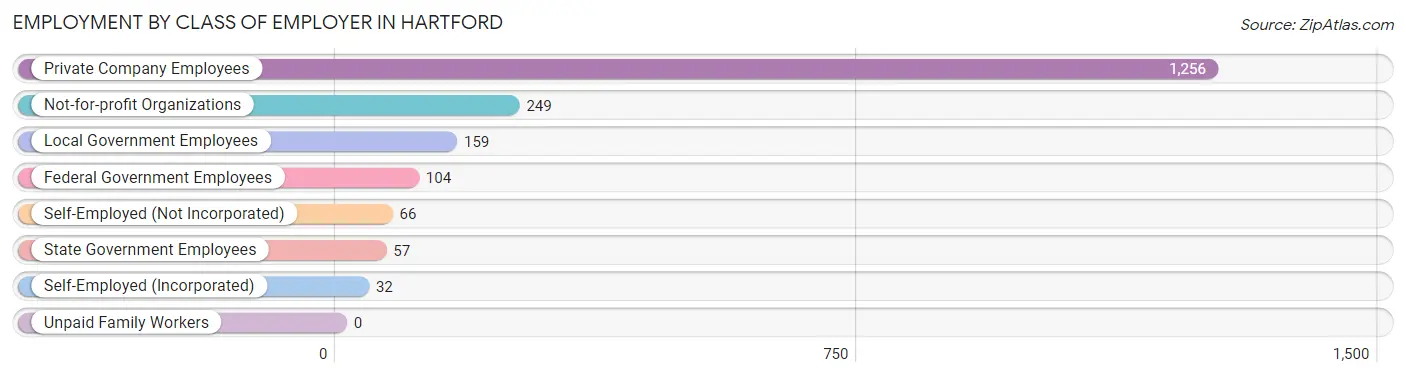
| Employer Class | # Employees | % Employees |
| Private Company Employees | 1,256 | 65.3% |
| Self-Employed (Incorporated) | 32 | 1.7% |
| Self-Employed (Not Incorporated) | 66 | 3.4% |
| Not-for-profit Organizations | 249 | 13.0% |
| Local Government Employees | 159 | 8.3% |
| State Government Employees | 57 | 3.0% |
| Federal Government Employees | 104 | 5.4% |
| Unpaid Family Workers | 0 | 0.0% |
| Total | 1,923 | 100.0% |
Employment Status by Age in Hartford
According to the labor force statistics for Hartford, out of the total population over 16 years of age (2,604), 76.6% or 1,995 individuals are in the labor force, with 2.9% or 58 of them unemployed. The age group with the highest labor force participation rate is 35 to 44 years, with 98.2% or 490 individuals in the labor force. Within the labor force, the 16 to 19 years age range has the highest percentage of unemployed individuals, with 24.2% or 16 of them being unemployed.
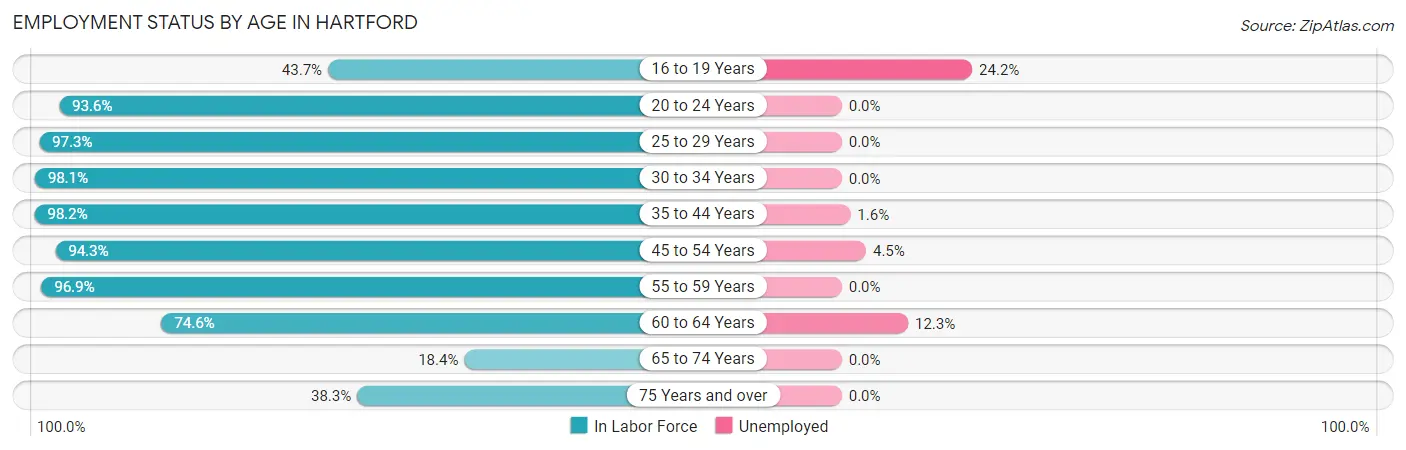
| Age Bracket | In Labor Force | Unemployed |
| 16 to 19 Years | 66 (43.7%) | 16 (24.2%) |
| 20 to 24 Years | 103 (93.6%) | 0 (0.0%) |
| 25 to 29 Years | 256 (97.3%) | 0 (0.0%) |
| 30 to 34 Years | 210 (98.1%) | 0 (0.0%) |
| 35 to 44 Years | 490 (98.2%) | 8 (1.6%) |
| 45 to 54 Years | 400 (94.3%) | 18 (4.5%) |
| 55 to 59 Years | 185 (96.9%) | 0 (0.0%) |
| 60 to 64 Years | 138 (74.6%) | 17 (12.3%) |
| 65 to 74 Years | 66 (18.4%) | 0 (0.0%) |
| 75 Years and over | 80 (38.3%) | 0 (0.0%) |
| Total | 1,995 (76.6%) | 58 (2.9%) |
Employment Status by Educational Attainment in Hartford
According to labor force statistics for Hartford, 94.5% of individuals (1,678) out of the total population between 25 and 64 years of age (1,776) are in the labor force, with 2.5% or 42 of them being unemployed. The group with the highest labor force participation rate are those with the educational attainment of less than high school, with 100.0% or 56 individuals in the labor force. Within the labor force, individuals with high school diploma education have the highest percentage of unemployment, with 6.3% or 17 of them being unemployed.
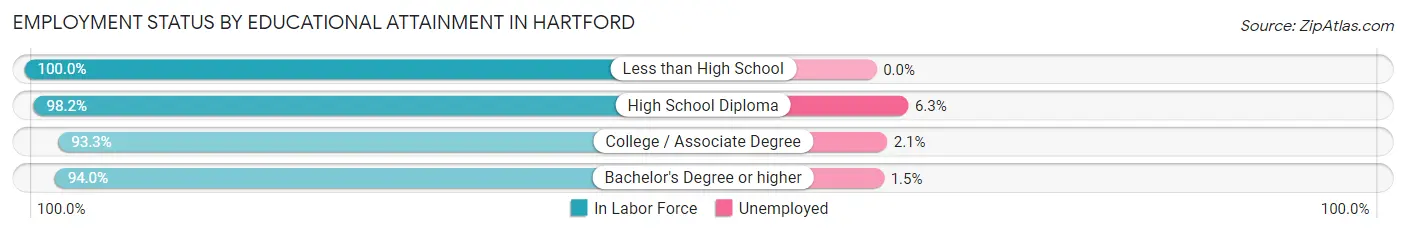
| Educational Attainment | In Labor Force | Unemployed |
| Less than High School | 56 (100.0%) | 0 (0.0%) |
| High School Diploma | 277 (98.2%) | 18 (6.3%) |
| College / Associate Degree | 762 (93.3%) | 17 (2.1%) |
| Bachelor's Degree or higher | 584 (94.0%) | 9 (1.5%) |
| Total | 1,678 (94.5%) | 44 (2.5%) |
Employment Occupations by Sex in Hartford
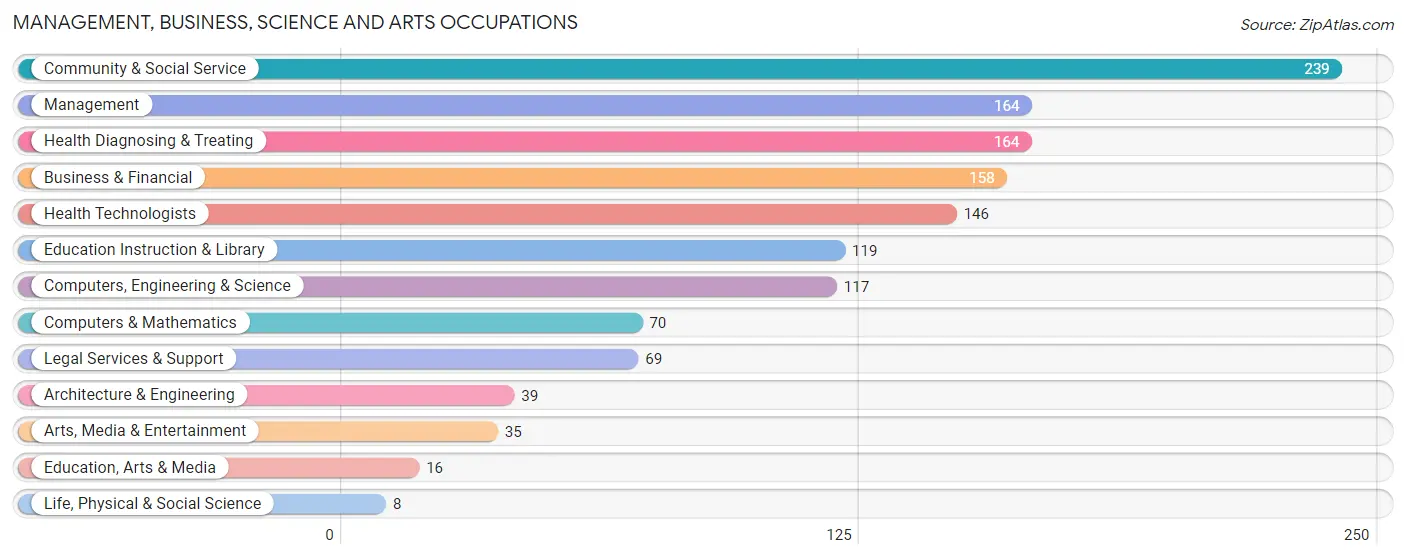
Management, Business, Science and Arts Occupations
The most common Management, Business, Science and Arts occupations in Hartford are Community & Social Service (239 | 12.7%), Management (164 | 8.7%), Health Diagnosing & Treating (164 | 8.7%), Business & Financial (158 | 8.4%), and Health Technologists (146 | 7.7%).
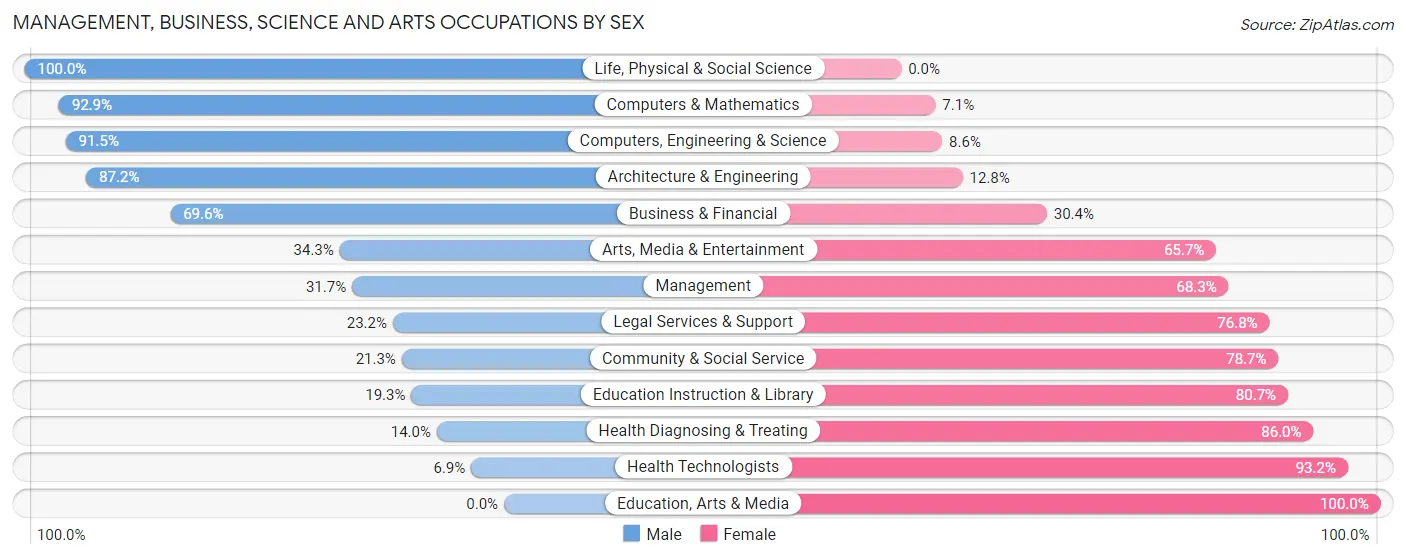
Management, Business, Science and Arts Occupations by Sex
Within the Management, Business, Science and Arts occupations in Hartford, the most male-oriented occupations are Life, Physical & Social Science (100.0%), Computers & Mathematics (92.9%), and Computers, Engineering & Science (91.4%), while the most female-oriented occupations are Education, Arts & Media (100.0%), Health Technologists (93.1%), and Health Diagnosing & Treating (86.0%).
| Occupation | Male | Female |
| Management | 52 (31.7%) | 112 (68.3%) |
| Business & Financial | 110 (69.6%) | 48 (30.4%) |
| Computers, Engineering & Science | 107 (91.4%) | 10 (8.6%) |
| Computers & Mathematics | 65 (92.9%) | 5 (7.1%) |
| Architecture & Engineering | 34 (87.2%) | 5 (12.8%) |
| Life, Physical & Social Science | 8 (100.0%) | 0 (0.0%) |
| Community & Social Service | 51 (21.3%) | 188 (78.7%) |
| Education, Arts & Media | 0 (0.0%) | 16 (100.0%) |
| Legal Services & Support | 16 (23.2%) | 53 (76.8%) |
| Education Instruction & Library | 23 (19.3%) | 96 (80.7%) |
| Arts, Media & Entertainment | 12 (34.3%) | 23 (65.7%) |
| Health Diagnosing & Treating | 23 (14.0%) | 141 (86.0%) |
| Health Technologists | 10 (6.9%) | 136 (93.1%) |
| Total (Category) | 343 (40.7%) | 499 (59.3%) |
| Total (Overall) | 921 (48.7%) | 969 (51.3%) |
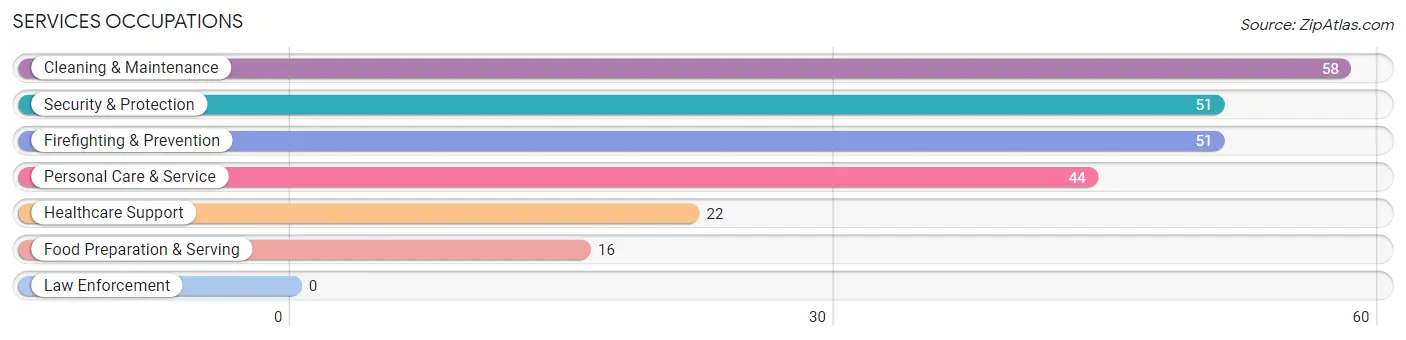
Services Occupations
The most common Services occupations in Hartford are Cleaning & Maintenance (58 | 3.1%), Security & Protection (51 | 2.7%), Firefighting & Prevention (51 | 2.7%), Personal Care & Service (44 | 2.3%), and Healthcare Support (22 | 1.2%).
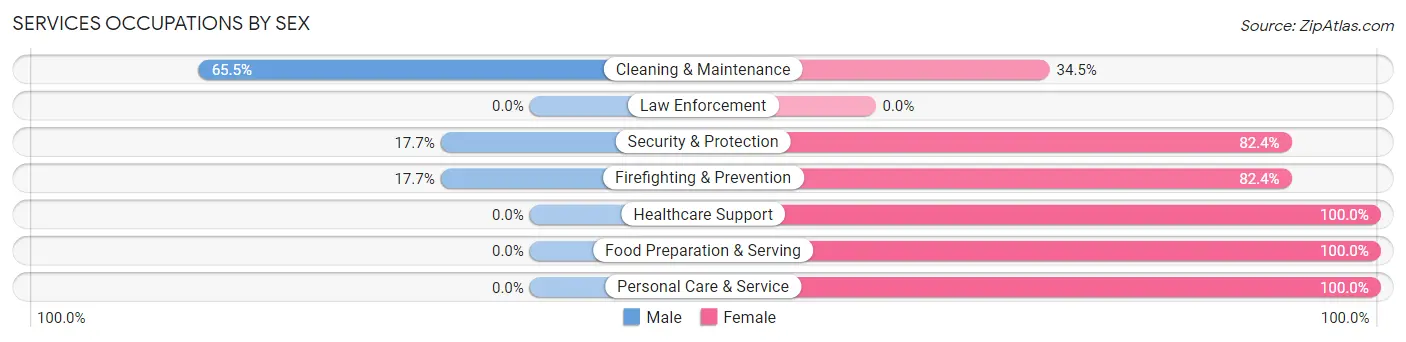
Services Occupations by Sex
Within the Services occupations in Hartford, the most male-oriented occupations are Cleaning & Maintenance (65.5%), Security & Protection (17.6%), and Firefighting & Prevention (17.6%), while the most female-oriented occupations are Healthcare Support (100.0%), Food Preparation & Serving (100.0%), and Personal Care & Service (100.0%).
| Occupation | Male | Female |
| Healthcare Support | 0 (0.0%) | 22 (100.0%) |
| Security & Protection | 9 (17.6%) | 42 (82.4%) |
| Firefighting & Prevention | 9 (17.6%) | 42 (82.4%) |
| Law Enforcement | 0 (0.0%) | 0 (0.0%) |
| Food Preparation & Serving | 0 (0.0%) | 16 (100.0%) |
| Cleaning & Maintenance | 38 (65.5%) | 20 (34.5%) |
| Personal Care & Service | 0 (0.0%) | 44 (100.0%) |
| Total (Category) | 47 (24.6%) | 144 (75.4%) |
| Total (Overall) | 921 (48.7%) | 969 (51.3%) |
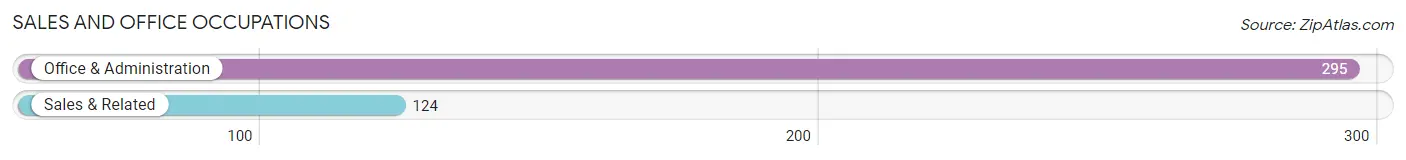
Sales and Office Occupations
The most common Sales and Office occupations in Hartford are Office & Administration (295 | 15.6%), and Sales & Related (124 | 6.6%).
Sales and Office Occupations by Sex
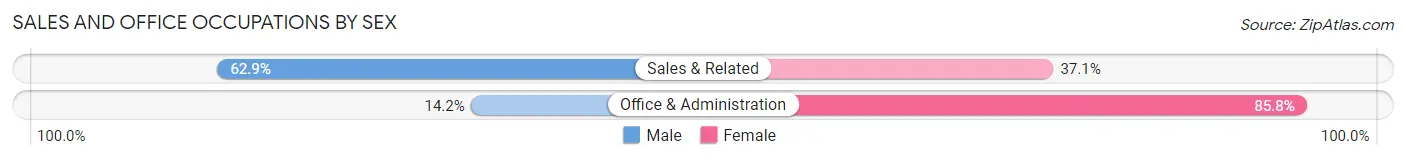
| Occupation | Male | Female |
| Sales & Related | 78 (62.9%) | 46 (37.1%) |
| Office & Administration | 42 (14.2%) | 253 (85.8%) |
| Total (Category) | 120 (28.6%) | 299 (71.4%) |
| Total (Overall) | 921 (48.7%) | 969 (51.3%) |
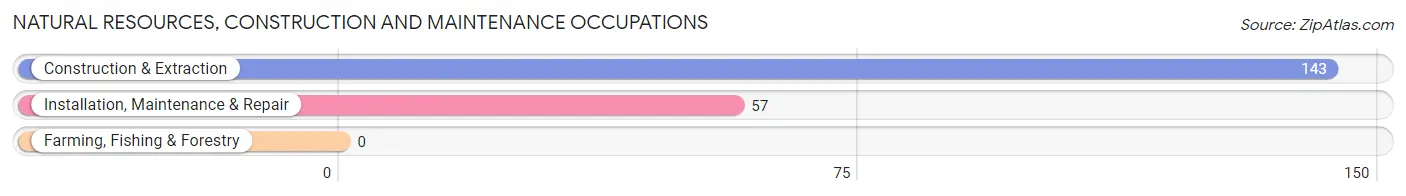
Natural Resources, Construction and Maintenance Occupations
The most common Natural Resources, Construction and Maintenance occupations in Hartford are Construction & Extraction (143 | 7.6%), and Installation, Maintenance & Repair (57 | 3.0%).
Natural Resources, Construction and Maintenance Occupations by Sex
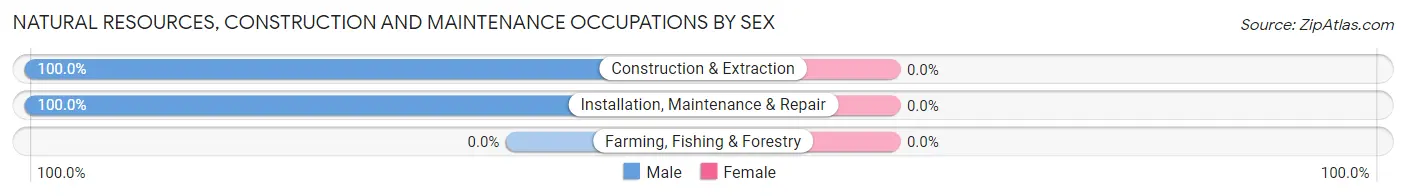
| Occupation | Male | Female |
| Farming, Fishing & Forestry | 0 (0.0%) | 0 (0.0%) |
| Construction & Extraction | 143 (100.0%) | 0 (0.0%) |
| Installation, Maintenance & Repair | 57 (100.0%) | 0 (0.0%) |
| Total (Category) | 200 (100.0%) | 0 (0.0%) |
| Total (Overall) | 921 (48.7%) | 969 (51.3%) |
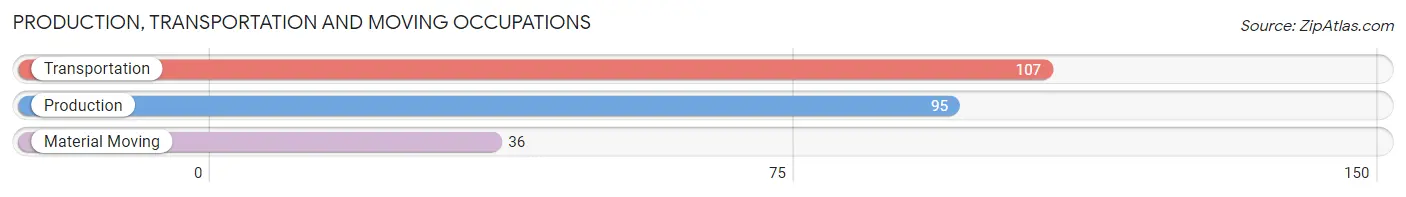
Production, Transportation and Moving Occupations
The most common Production, Transportation and Moving occupations in Hartford are Transportation (107 | 5.7%), Production (95 | 5.0%), and Material Moving (36 | 1.9%).
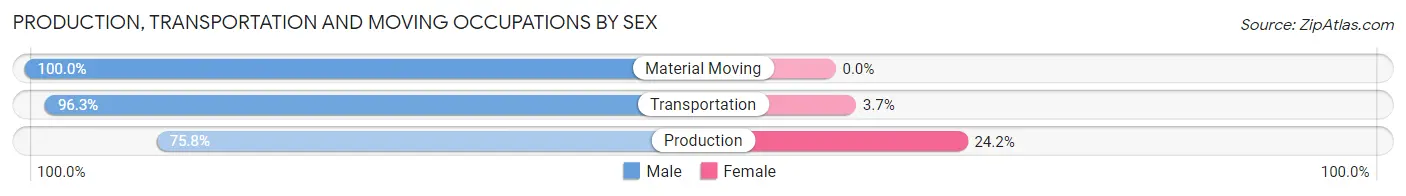
Production, Transportation and Moving Occupations by Sex
| Occupation | Male | Female |
| Production | 72 (75.8%) | 23 (24.2%) |
| Transportation | 103 (96.3%) | 4 (3.7%) |
| Material Moving | 36 (100.0%) | 0 (0.0%) |
| Total (Category) | 211 (88.7%) | 27 (11.3%) |
| Total (Overall) | 921 (48.7%) | 969 (51.3%) |
Employment Industries by Sex in Hartford
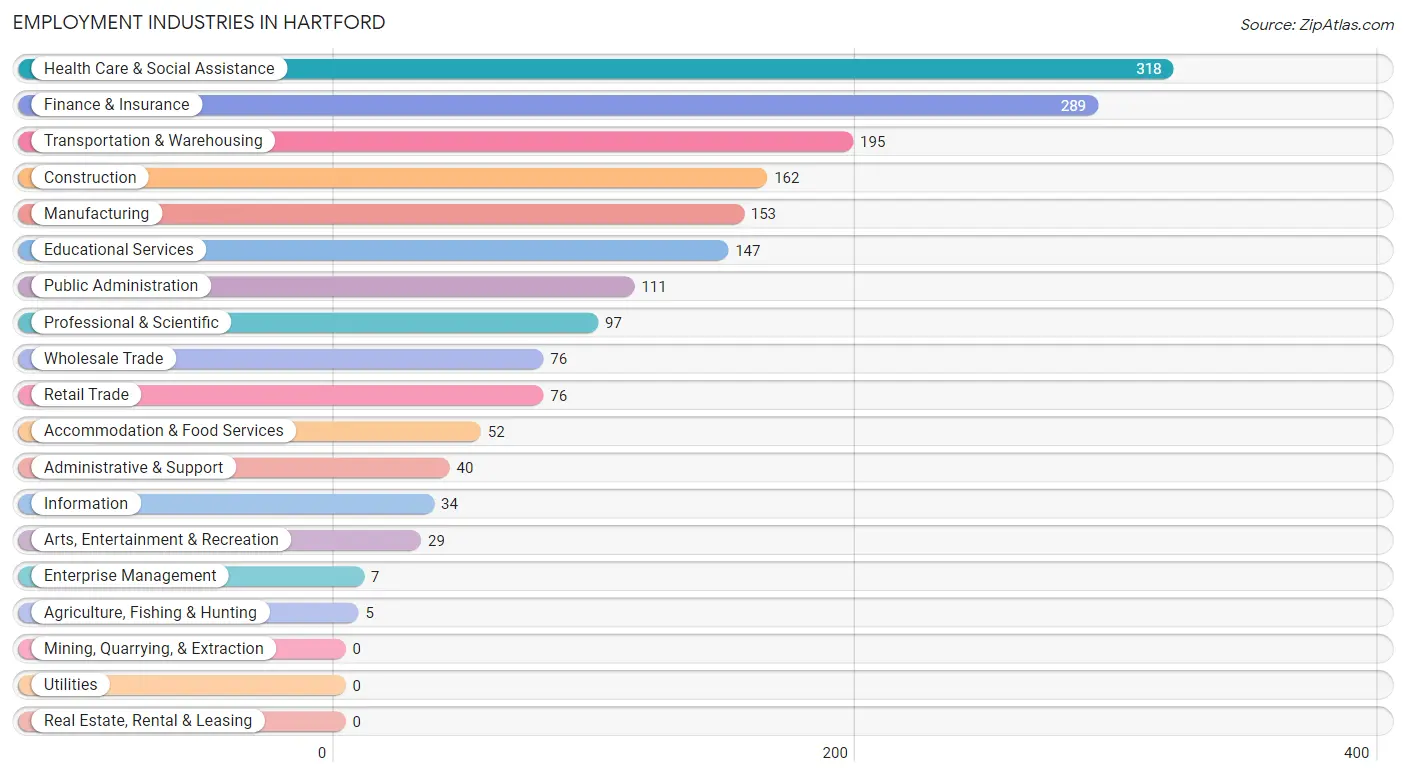
Employment Industries in Hartford
The major employment industries in Hartford include Health Care & Social Assistance (318 | 16.8%), Finance & Insurance (289 | 15.3%), Transportation & Warehousing (195 | 10.3%), Construction (162 | 8.6%), and Manufacturing (153 | 8.1%).
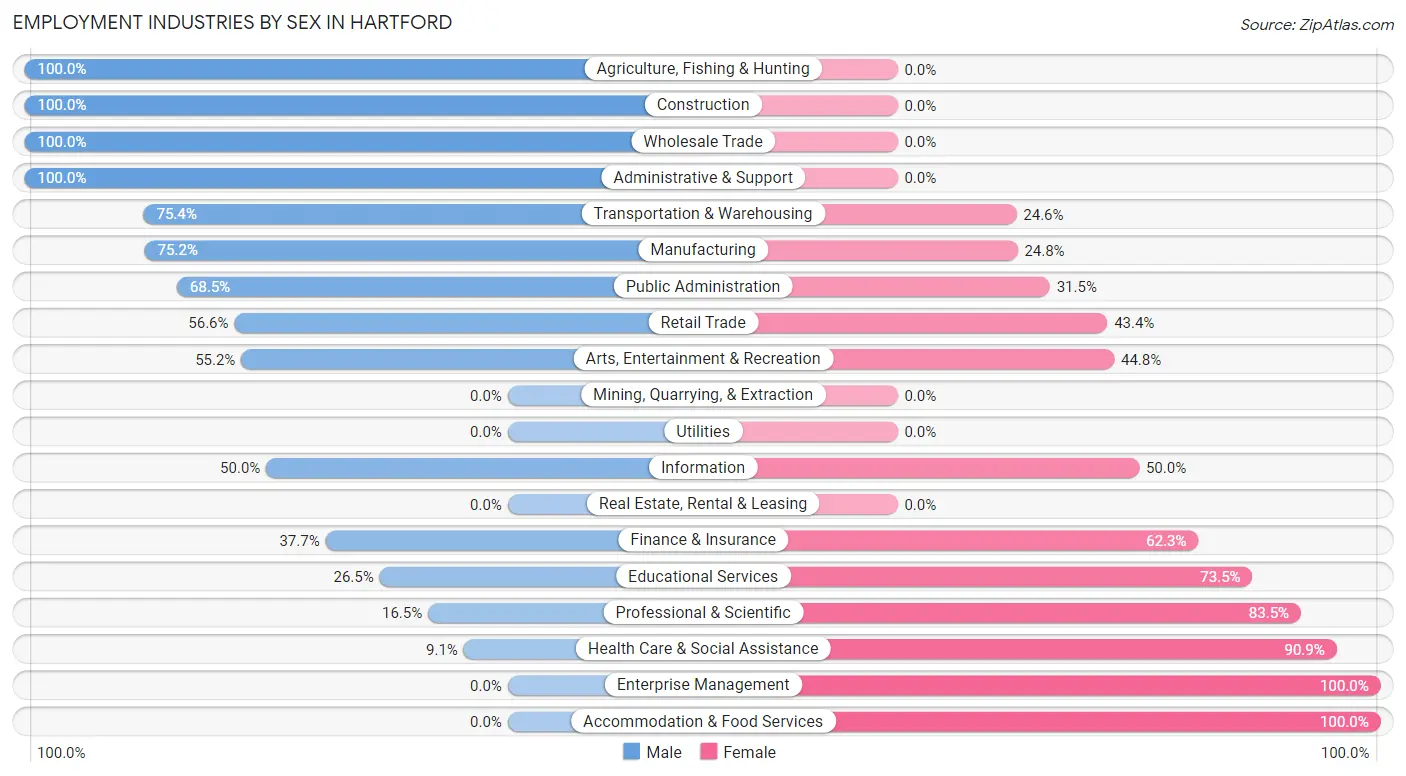
Employment Industries by Sex in Hartford
The Hartford industries that see more men than women are Agriculture, Fishing & Hunting (100.0%), Construction (100.0%), and Wholesale Trade (100.0%), whereas the industries that tend to have a higher number of women are Enterprise Management (100.0%), Accommodation & Food Services (100.0%), and Health Care & Social Assistance (90.9%).
| Industry | Male | Female |
| Agriculture, Fishing & Hunting | 5 (100.0%) | 0 (0.0%) |
| Mining, Quarrying, & Extraction | 0 (0.0%) | 0 (0.0%) |
| Construction | 162 (100.0%) | 0 (0.0%) |
| Manufacturing | 115 (75.2%) | 38 (24.8%) |
| Wholesale Trade | 76 (100.0%) | 0 (0.0%) |
| Retail Trade | 43 (56.6%) | 33 (43.4%) |
| Transportation & Warehousing | 147 (75.4%) | 48 (24.6%) |
| Utilities | 0 (0.0%) | 0 (0.0%) |
| Information | 17 (50.0%) | 17 (50.0%) |
| Finance & Insurance | 109 (37.7%) | 180 (62.3%) |
| Real Estate, Rental & Leasing | 0 (0.0%) | 0 (0.0%) |
| Professional & Scientific | 16 (16.5%) | 81 (83.5%) |
| Enterprise Management | 0 (0.0%) | 7 (100.0%) |
| Administrative & Support | 40 (100.0%) | 0 (0.0%) |
| Educational Services | 39 (26.5%) | 108 (73.5%) |
| Health Care & Social Assistance | 29 (9.1%) | 289 (90.9%) |
| Arts, Entertainment & Recreation | 16 (55.2%) | 13 (44.8%) |
| Accommodation & Food Services | 0 (0.0%) | 52 (100.0%) |
| Public Administration | 76 (68.5%) | 35 (31.5%) |
| Total | 921 (48.7%) | 969 (51.3%) |
Education in Hartford
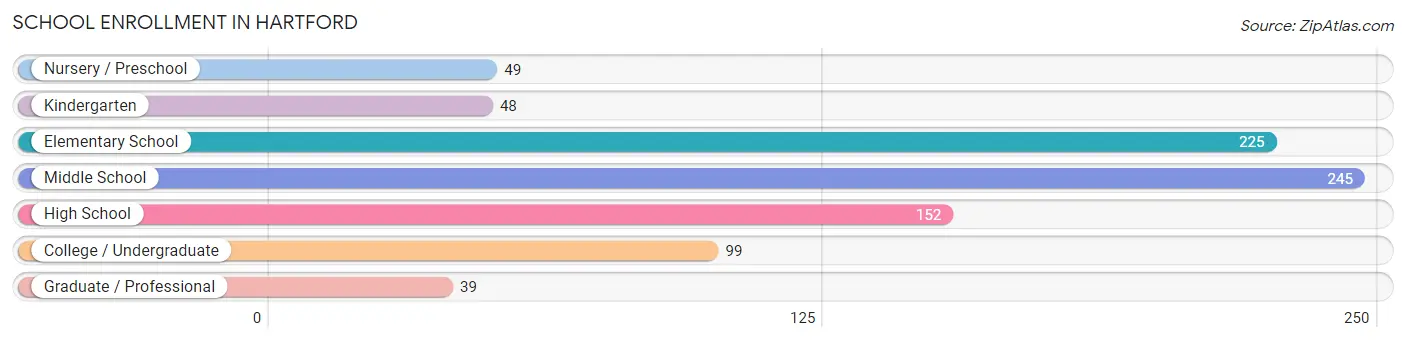
School Enrollment in Hartford
The most common levels of schooling among the 857 students in Hartford are middle school (245 | 28.6%), elementary school (225 | 26.3%), and high school (152 | 17.7%).
| School Level | # Students | % Students |
| Nursery / Preschool | 49 | 5.7% |
| Kindergarten | 48 | 5.6% |
| Elementary School | 225 | 26.3% |
| Middle School | 245 | 28.6% |
| High School | 152 | 17.7% |
| College / Undergraduate | 99 | 11.6% |
| Graduate / Professional | 39 | 4.5% |
| Total | 857 | 100.0% |
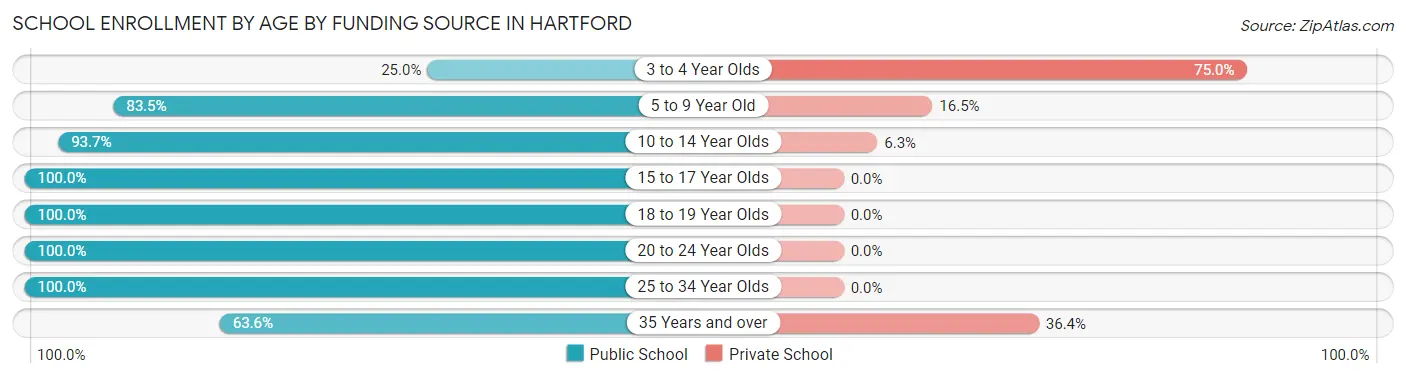
School Enrollment by Age by Funding Source in Hartford
Out of a total of 857 students who are enrolled in schools in Hartford, 98 (11.4%) attend a private institution, while the remaining 759 (88.6%) are enrolled in public schools. The age group of 3 to 4 year olds has the highest likelihood of being enrolled in private schools, with 33 (75.0% in the age bracket) enrolled. Conversely, the age group of 15 to 17 year olds has the lowest likelihood of being enrolled in a private school, with 126 (100.0% in the age bracket) attending a public institution.
| Age Bracket | Public School | Private School |
| 3 to 4 Year Olds | 11 (25.0%) | 33 (75.0%) |
| 5 to 9 Year Old | 197 (83.5%) | 39 (16.5%) |
| 10 to 14 Year Olds | 269 (93.7%) | 18 (6.3%) |
| 15 to 17 Year Olds | 126 (100.0%) | 0 (0.0%) |
| 18 to 19 Year Olds | 46 (100.0%) | 0 (0.0%) |
| 20 to 24 Year Olds | 43 (100.0%) | 0 (0.0%) |
| 25 to 34 Year Olds | 53 (100.0%) | 0 (0.0%) |
| 35 Years and over | 14 (63.6%) | 8 (36.4%) |
| Total | 759 (88.6%) | 98 (11.4%) |
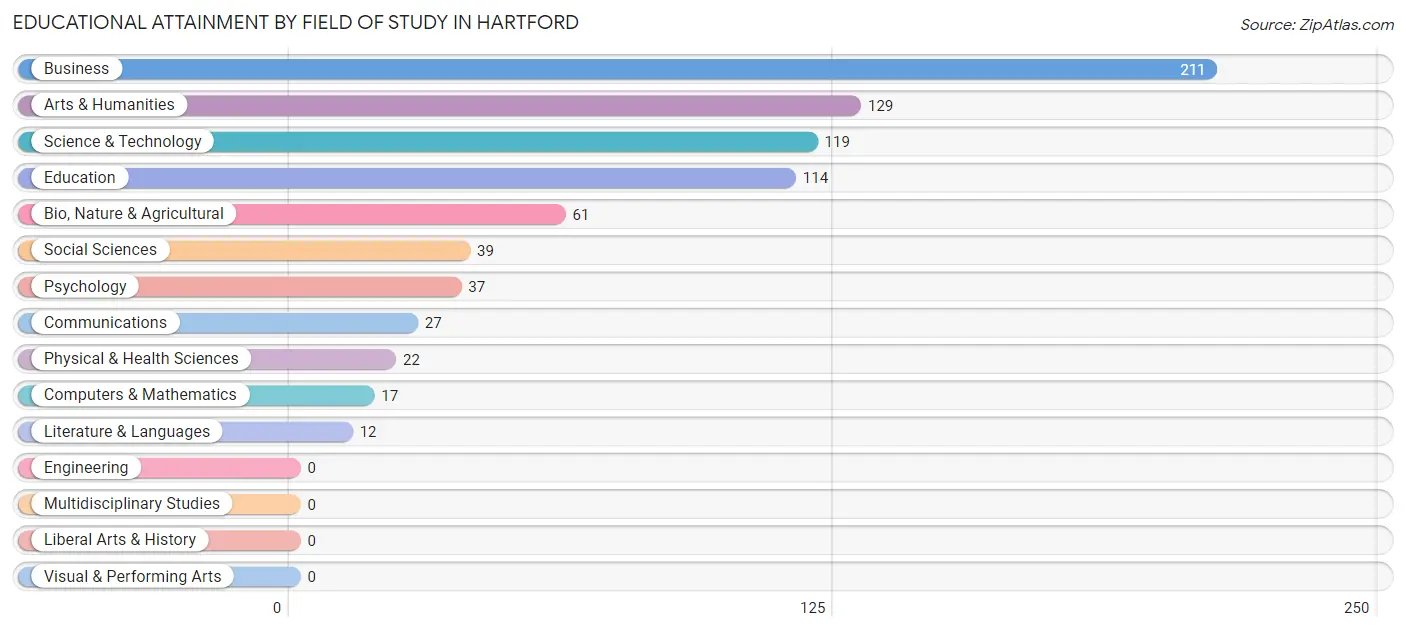
Educational Attainment by Field of Study in Hartford
Business (211 | 26.8%), arts & humanities (129 | 16.4%), science & technology (119 | 15.1%), education (114 | 14.5%), and bio, nature & agricultural (61 | 7.7%) are the most common fields of study among 788 individuals in Hartford who have obtained a bachelor's degree or higher.
| Field of Study | # Graduates | % Graduates |
| Computers & Mathematics | 17 | 2.2% |
| Bio, Nature & Agricultural | 61 | 7.7% |
| Physical & Health Sciences | 22 | 2.8% |
| Psychology | 37 | 4.7% |
| Social Sciences | 39 | 5.0% |
| Engineering | 0 | 0.0% |
| Multidisciplinary Studies | 0 | 0.0% |
| Science & Technology | 119 | 15.1% |
| Business | 211 | 26.8% |
| Education | 114 | 14.5% |
| Literature & Languages | 12 | 1.5% |
| Liberal Arts & History | 0 | 0.0% |
| Visual & Performing Arts | 0 | 0.0% |
| Communications | 27 | 3.4% |
| Arts & Humanities | 129 | 16.4% |
| Total | 788 | 100.0% |
Transportation & Commute in Hartford
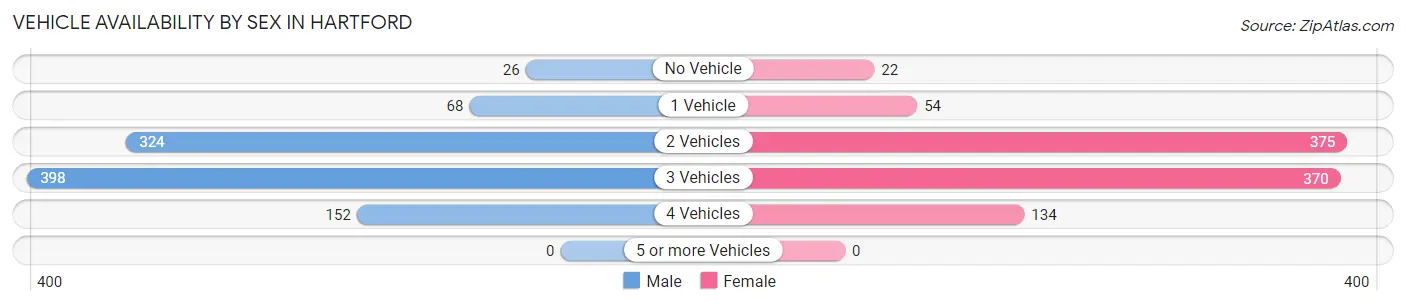
Vehicle Availability by Sex in Hartford
The most prevalent vehicle ownership categories in Hartford are males with 3 vehicles (398, accounting for 41.1%) and females with 3 vehicles (370, making up 41.7%).
| Vehicles Available | Male | Female |
| No Vehicle | 26 (2.7%) | 22 (2.3%) |
| 1 Vehicle | 68 (7.0%) | 54 (5.7%) |
| 2 Vehicles | 324 (33.5%) | 375 (39.3%) |
| 3 Vehicles | 398 (41.1%) | 370 (38.7%) |
| 4 Vehicles | 152 (15.7%) | 134 (14.0%) |
| 5 or more Vehicles | 0 (0.0%) | 0 (0.0%) |
| Total | 968 (100.0%) | 955 (100.0%) |
Commute Time in Hartford
The most frequently occuring commute durations in Hartford are 20 to 24 minutes (574 commuters, 31.1%), 15 to 19 minutes (258 commuters, 14.0%), and 30 to 34 minutes (246 commuters, 13.3%).
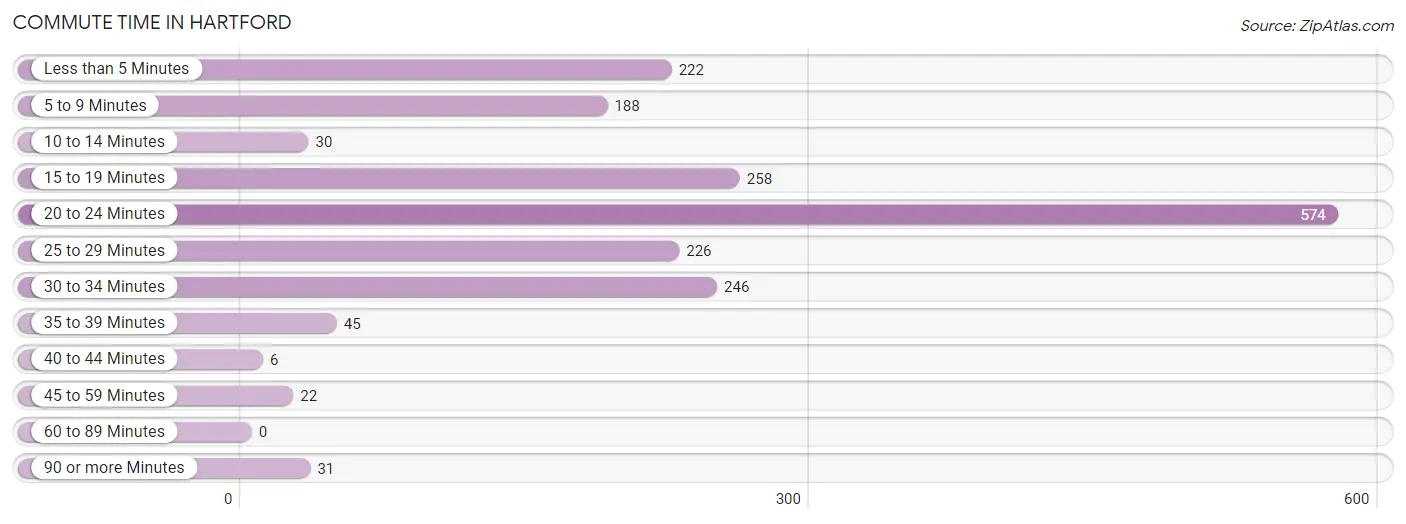
| Commute Time | # Commuters | % Commuters |
| Less than 5 Minutes | 222 | 12.0% |
| 5 to 9 Minutes | 188 | 10.2% |
| 10 to 14 Minutes | 30 | 1.6% |
| 15 to 19 Minutes | 258 | 14.0% |
| 20 to 24 Minutes | 574 | 31.1% |
| 25 to 29 Minutes | 226 | 12.2% |
| 30 to 34 Minutes | 246 | 13.3% |
| 35 to 39 Minutes | 45 | 2.4% |
| 40 to 44 Minutes | 6 | 0.3% |
| 45 to 59 Minutes | 22 | 1.2% |
| 60 to 89 Minutes | 0 | 0.0% |
| 90 or more Minutes | 31 | 1.7% |
Commute Time by Sex in Hartford
The most common commute times in Hartford are 20 to 24 minutes (319 commuters, 33.8%) for males and 20 to 24 minutes (255 commuters, 28.2%) for females.
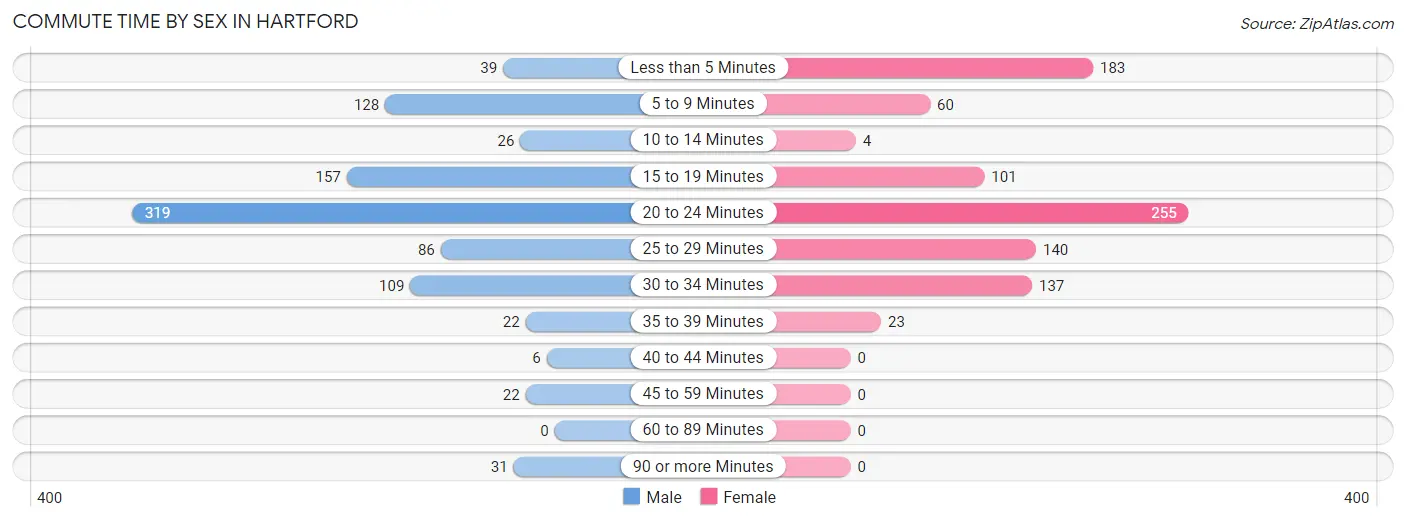
| Commute Time | Male | Female |
| Less than 5 Minutes | 39 (4.1%) | 183 (20.3%) |
| 5 to 9 Minutes | 128 (13.5%) | 60 (6.6%) |
| 10 to 14 Minutes | 26 (2.8%) | 4 (0.4%) |
| 15 to 19 Minutes | 157 (16.6%) | 101 (11.2%) |
| 20 to 24 Minutes | 319 (33.8%) | 255 (28.2%) |
| 25 to 29 Minutes | 86 (9.1%) | 140 (15.5%) |
| 30 to 34 Minutes | 109 (11.5%) | 137 (15.2%) |
| 35 to 39 Minutes | 22 (2.3%) | 23 (2.5%) |
| 40 to 44 Minutes | 6 (0.6%) | 0 (0.0%) |
| 45 to 59 Minutes | 22 (2.3%) | 0 (0.0%) |
| 60 to 89 Minutes | 0 (0.0%) | 0 (0.0%) |
| 90 or more Minutes | 31 (3.3%) | 0 (0.0%) |
Time of Departure to Work by Sex in Hartford
The most frequent times of departure to work in Hartford are 7:00 AM to 7:29 AM (269, 28.5%) for males and 7:30 AM to 7:59 AM (303, 33.6%) for females.
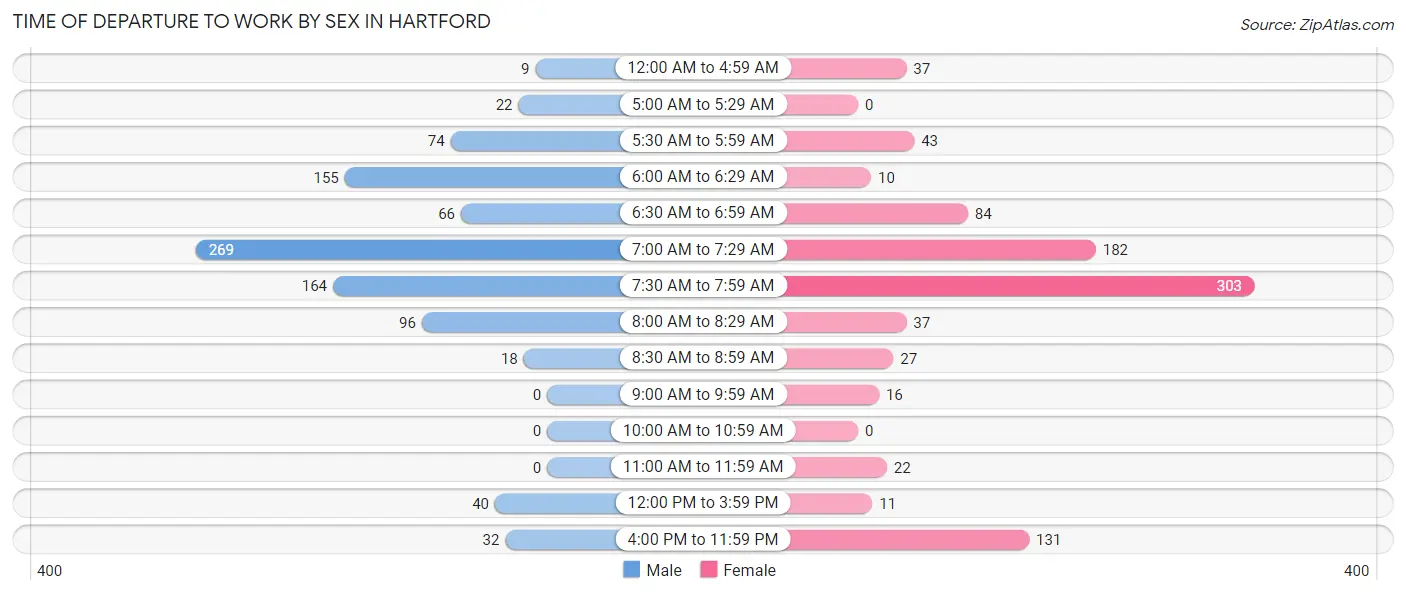
| Time of Departure | Male | Female |
| 12:00 AM to 4:59 AM | 9 (0.9%) | 37 (4.1%) |
| 5:00 AM to 5:29 AM | 22 (2.3%) | 0 (0.0%) |
| 5:30 AM to 5:59 AM | 74 (7.8%) | 43 (4.8%) |
| 6:00 AM to 6:29 AM | 155 (16.4%) | 10 (1.1%) |
| 6:30 AM to 6:59 AM | 66 (7.0%) | 84 (9.3%) |
| 7:00 AM to 7:29 AM | 269 (28.5%) | 182 (20.2%) |
| 7:30 AM to 7:59 AM | 164 (17.3%) | 303 (33.6%) |
| 8:00 AM to 8:29 AM | 96 (10.2%) | 37 (4.1%) |
| 8:30 AM to 8:59 AM | 18 (1.9%) | 27 (3.0%) |
| 9:00 AM to 9:59 AM | 0 (0.0%) | 16 (1.8%) |
| 10:00 AM to 10:59 AM | 0 (0.0%) | 0 (0.0%) |
| 11:00 AM to 11:59 AM | 0 (0.0%) | 22 (2.4%) |
| 12:00 PM to 3:59 PM | 40 (4.2%) | 11 (1.2%) |
| 4:00 PM to 11:59 PM | 32 (3.4%) | 131 (14.5%) |
| Total | 945 (100.0%) | 903 (100.0%) |
Housing Occupancy in Hartford
Occupancy by Ownership in Hartford
Of the total 1,295 dwellings in Hartford, owner-occupied units account for 1,012 (78.1%), while renter-occupied units make up 283 (21.8%).
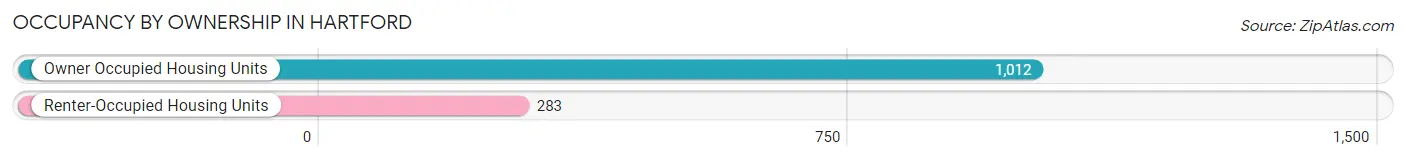
| Occupancy | # Housing Units | % Housing Units |
| Owner Occupied Housing Units | 1,012 | 78.1% |
| Renter-Occupied Housing Units | 283 | 21.8% |
| Total Occupied Housing Units | 1,295 | 100.0% |
Occupancy by Household Size in Hartford
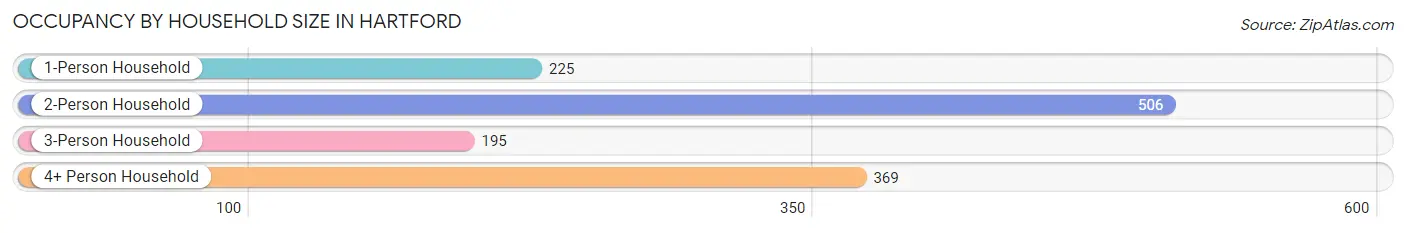
| Household Size | # Housing Units | % Housing Units |
| 1-Person Household | 225 | 17.4% |
| 2-Person Household | 506 | 39.1% |
| 3-Person Household | 195 | 15.1% |
| 4+ Person Household | 369 | 28.5% |
| Total Housing Units | 1,295 | 100.0% |
Occupancy by Ownership by Household Size in Hartford
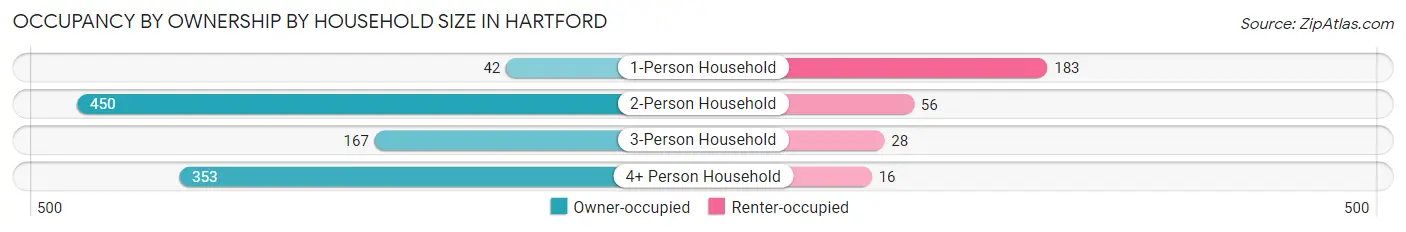
| Household Size | Owner-occupied | Renter-occupied |
| 1-Person Household | 42 (18.7%) | 183 (81.3%) |
| 2-Person Household | 450 (88.9%) | 56 (11.1%) |
| 3-Person Household | 167 (85.6%) | 28 (14.4%) |
| 4+ Person Household | 353 (95.7%) | 16 (4.3%) |
| Total Housing Units | 1,012 (78.1%) | 283 (21.8%) |
Occupancy by Educational Attainment in Hartford
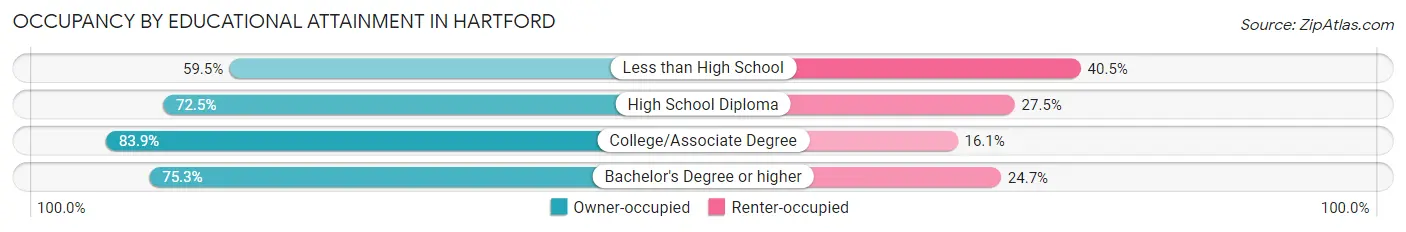
| Household Size | Owner-occupied | Renter-occupied |
| Less than High School | 22 (59.5%) | 15 (40.5%) |
| High School Diploma | 214 (72.5%) | 81 (27.5%) |
| College/Associate Degree | 499 (83.9%) | 96 (16.1%) |
| Bachelor's Degree or higher | 277 (75.3%) | 91 (24.7%) |
Occupancy by Age of Householder in Hartford
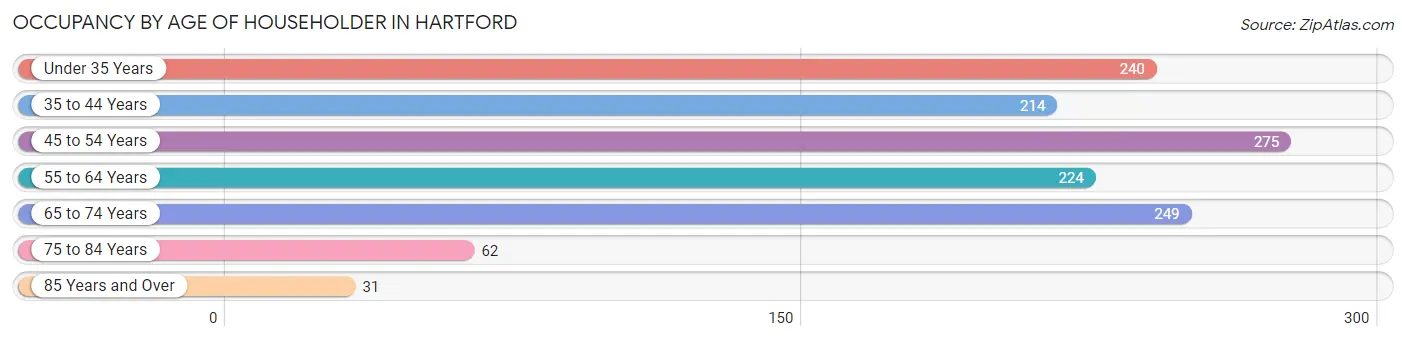
| Age Bracket | # Households | % Households |
| Under 35 Years | 240 | 18.5% |
| 35 to 44 Years | 214 | 16.5% |
| 45 to 54 Years | 275 | 21.2% |
| 55 to 64 Years | 224 | 17.3% |
| 65 to 74 Years | 249 | 19.2% |
| 75 to 84 Years | 62 | 4.8% |
| 85 Years and Over | 31 | 2.4% |
| Total | 1,295 | 100.0% |
Housing Finances in Hartford
Median Income by Occupancy in Hartford
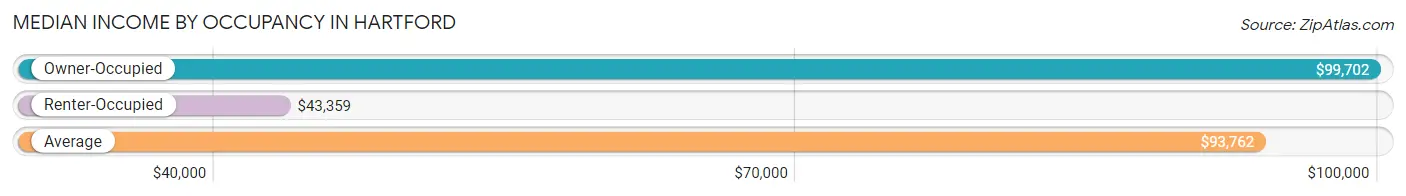
| Occupancy Type | # Households | Median Income |
| Owner-Occupied | 1,012 (78.1%) | $99,702 |
| Renter-Occupied | 283 (21.8%) | $43,359 |
| Average | 1,295 (100.0%) | $93,762 |
Occupancy by Householder Income Bracket in Hartford
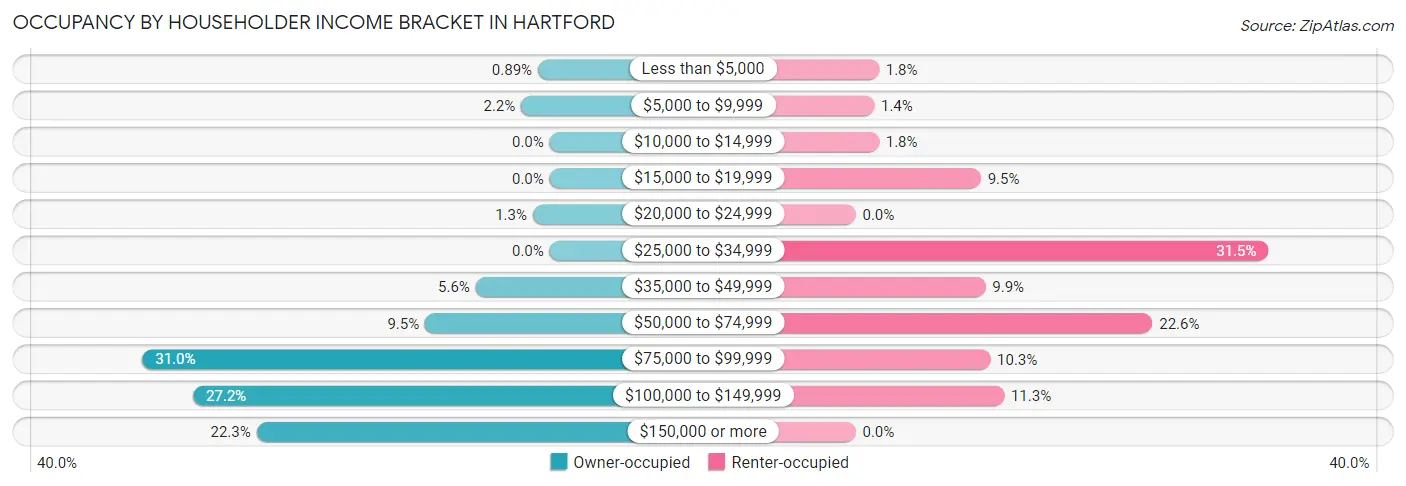
| Income Bracket | Owner-occupied | Renter-occupied |
| Less than $5,000 | 9 (0.9%) | 5 (1.8%) |
| $5,000 to $9,999 | 22 (2.2%) | 4 (1.4%) |
| $10,000 to $14,999 | 0 (0.0%) | 5 (1.8%) |
| $15,000 to $19,999 | 0 (0.0%) | 27 (9.5%) |
| $20,000 to $24,999 | 13 (1.3%) | 0 (0.0%) |
| $25,000 to $34,999 | 0 (0.0%) | 89 (31.5%) |
| $35,000 to $49,999 | 57 (5.6%) | 28 (9.9%) |
| $50,000 to $74,999 | 96 (9.5%) | 64 (22.6%) |
| $75,000 to $99,999 | 314 (31.0%) | 29 (10.2%) |
| $100,000 to $149,999 | 275 (27.2%) | 32 (11.3%) |
| $150,000 or more | 226 (22.3%) | 0 (0.0%) |
| Total | 1,012 (100.0%) | 283 (100.0%) |
Monthly Housing Cost Tiers in Hartford
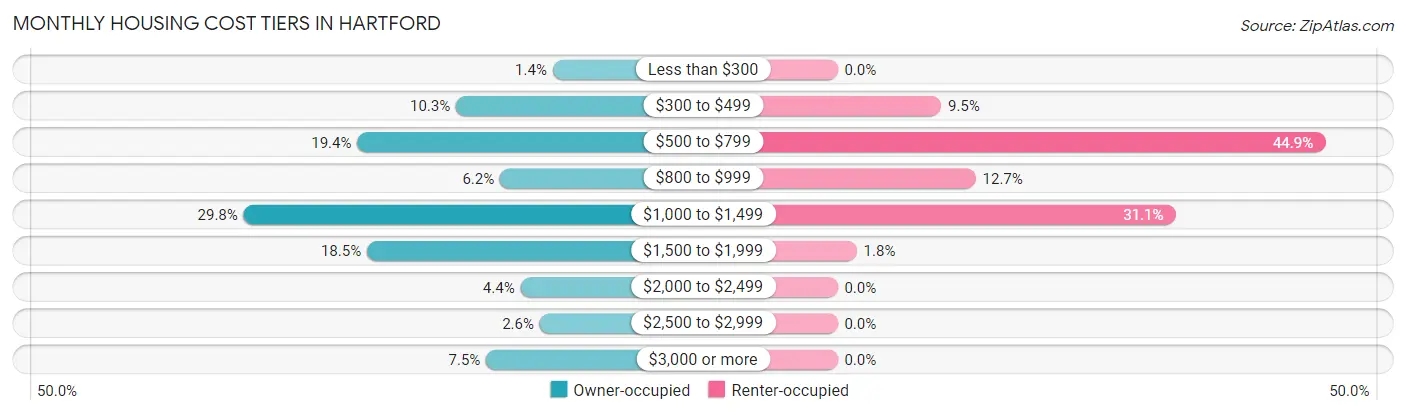
| Monthly Cost | Owner-occupied | Renter-occupied |
| Less than $300 | 14 (1.4%) | 0 (0.0%) |
| $300 to $499 | 104 (10.3%) | 27 (9.5%) |
| $500 to $799 | 196 (19.4%) | 127 (44.9%) |
| $800 to $999 | 63 (6.2%) | 36 (12.7%) |
| $1,000 to $1,499 | 302 (29.8%) | 88 (31.1%) |
| $1,500 to $1,999 | 187 (18.5%) | 5 (1.8%) |
| $2,000 to $2,499 | 44 (4.3%) | 0 (0.0%) |
| $2,500 to $2,999 | 26 (2.6%) | 0 (0.0%) |
| $3,000 or more | 76 (7.5%) | 0 (0.0%) |
| Total | 1,012 (100.0%) | 283 (100.0%) |
Physical Housing Characteristics in Hartford
Housing Structures in Hartford
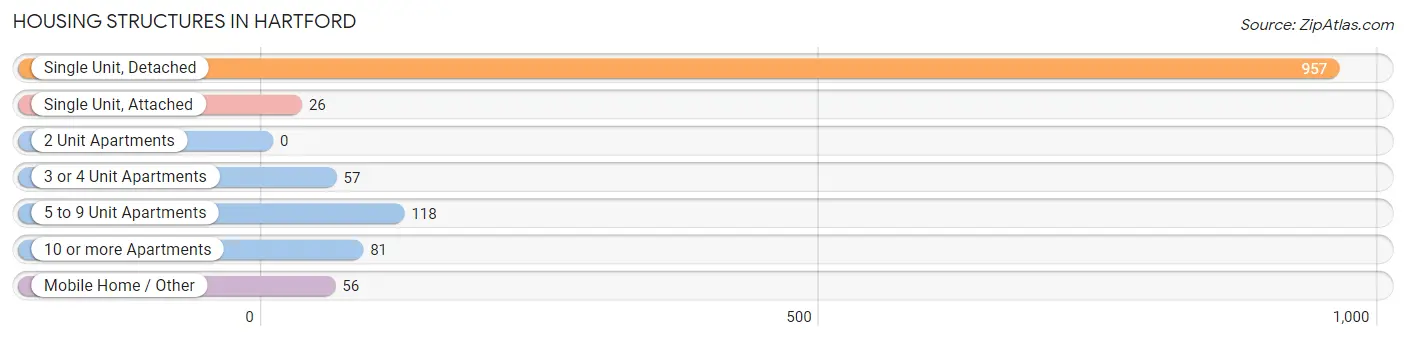
| Structure Type | # Housing Units | % Housing Units |
| Single Unit, Detached | 957 | 73.9% |
| Single Unit, Attached | 26 | 2.0% |
| 2 Unit Apartments | 0 | 0.0% |
| 3 or 4 Unit Apartments | 57 | 4.4% |
| 5 to 9 Unit Apartments | 118 | 9.1% |
| 10 or more Apartments | 81 | 6.2% |
| Mobile Home / Other | 56 | 4.3% |
| Total | 1,295 | 100.0% |
Housing Structures by Occupancy in Hartford
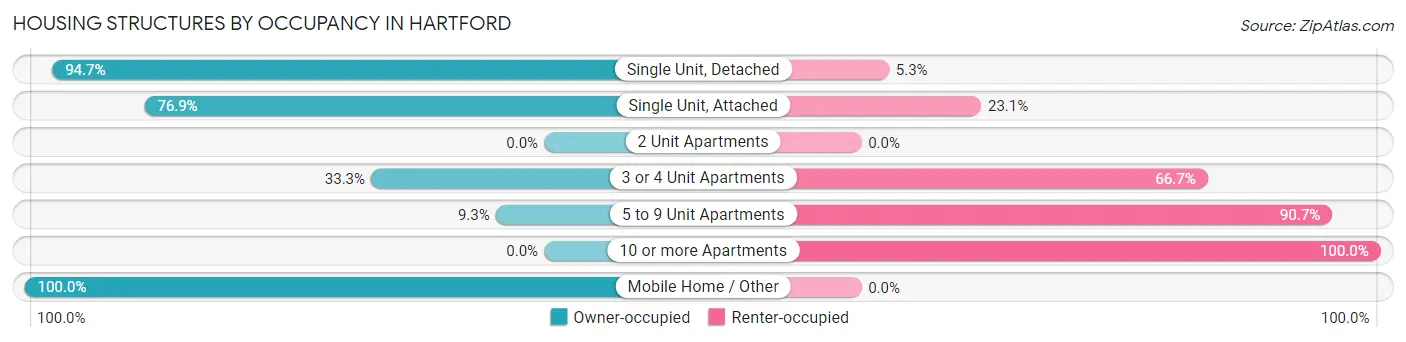
| Structure Type | Owner-occupied | Renter-occupied |
| Single Unit, Detached | 906 (94.7%) | 51 (5.3%) |
| Single Unit, Attached | 20 (76.9%) | 6 (23.1%) |
| 2 Unit Apartments | 0 (0.0%) | 0 (0.0%) |
| 3 or 4 Unit Apartments | 19 (33.3%) | 38 (66.7%) |
| 5 to 9 Unit Apartments | 11 (9.3%) | 107 (90.7%) |
| 10 or more Apartments | 0 (0.0%) | 81 (100.0%) |
| Mobile Home / Other | 56 (100.0%) | 0 (0.0%) |
| Total | 1,012 (78.1%) | 283 (21.8%) |
Housing Structures by Number of Rooms in Hartford
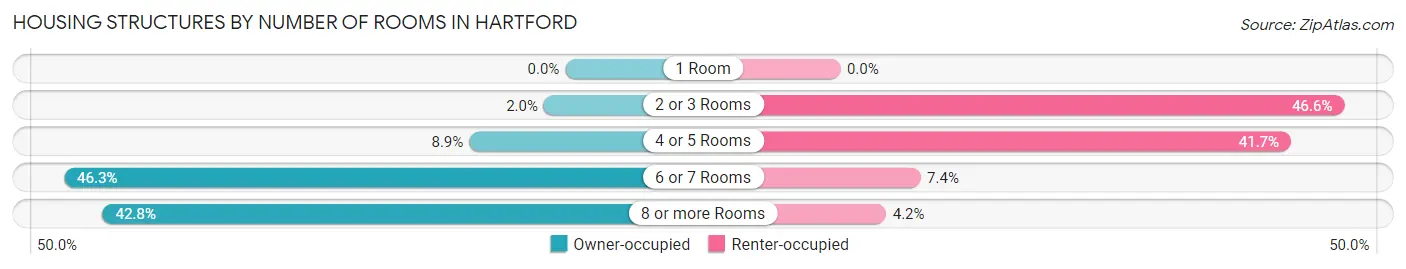
| Number of Rooms | Owner-occupied | Renter-occupied |
| 1 Room | 0 (0.0%) | 0 (0.0%) |
| 2 or 3 Rooms | 20 (2.0%) | 132 (46.6%) |
| 4 or 5 Rooms | 90 (8.9%) | 118 (41.7%) |
| 6 or 7 Rooms | 469 (46.3%) | 21 (7.4%) |
| 8 or more Rooms | 433 (42.8%) | 12 (4.2%) |
| Total | 1,012 (100.0%) | 283 (100.0%) |
Housing Structure by Heating Type in Hartford
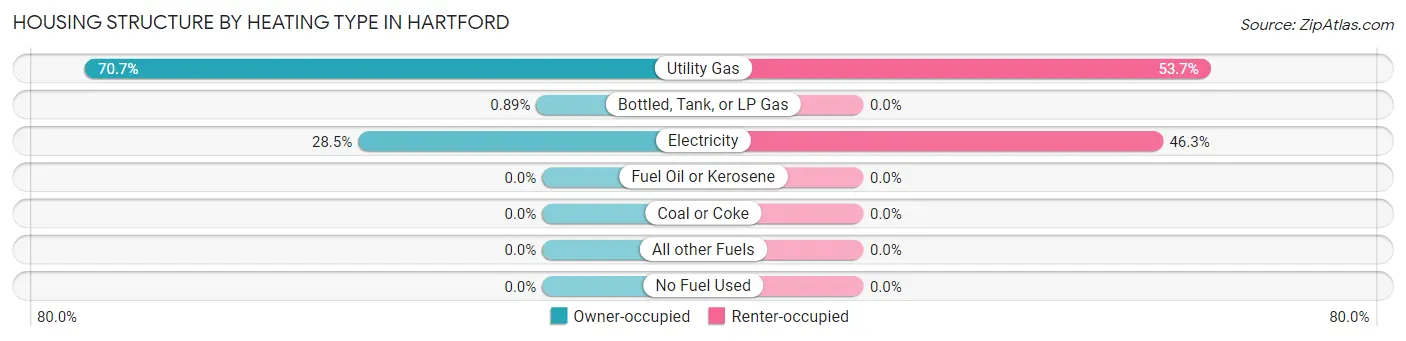
| Heating Type | Owner-occupied | Renter-occupied |
| Utility Gas | 715 (70.7%) | 152 (53.7%) |
| Bottled, Tank, or LP Gas | 9 (0.9%) | 0 (0.0%) |
| Electricity | 288 (28.5%) | 131 (46.3%) |
| Fuel Oil or Kerosene | 0 (0.0%) | 0 (0.0%) |
| Coal or Coke | 0 (0.0%) | 0 (0.0%) |
| All other Fuels | 0 (0.0%) | 0 (0.0%) |
| No Fuel Used | 0 (0.0%) | 0 (0.0%) |
| Total | 1,012 (100.0%) | 283 (100.0%) |
Household Vehicle Usage in Hartford
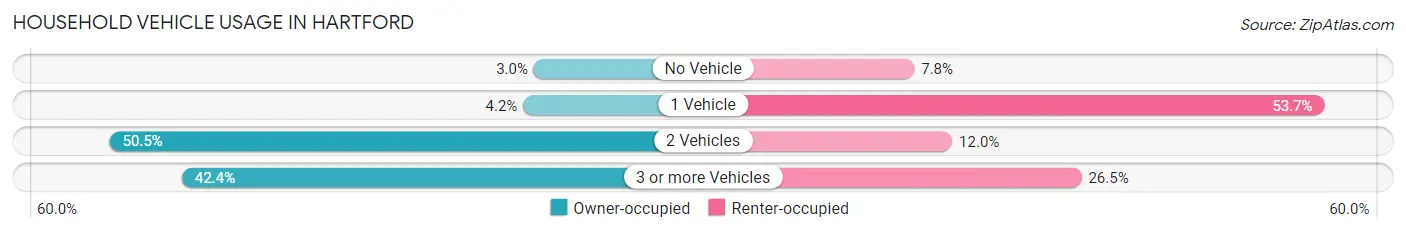
| Vehicles per Household | Owner-occupied | Renter-occupied |
| No Vehicle | 30 (3.0%) | 22 (7.8%) |
| 1 Vehicle | 42 (4.2%) | 152 (53.7%) |
| 2 Vehicles | 511 (50.5%) | 34 (12.0%) |
| 3 or more Vehicles | 429 (42.4%) | 75 (26.5%) |
| Total | 1,012 (100.0%) | 283 (100.0%) |
Real Estate & Mortgages in Hartford
Real Estate and Mortgage Overview in Hartford
| Characteristic | Without Mortgage | With Mortgage |
| Housing Units | 320 | 692 |
| Median Property Value | $150,000 | $230,000 |
| Median Household Income | $99,524 | $130 |
| Monthly Housing Costs | $562 | $76 |
| Real Estate Taxes | $3,000 | $5 |
Property Value by Mortgage Status in Hartford
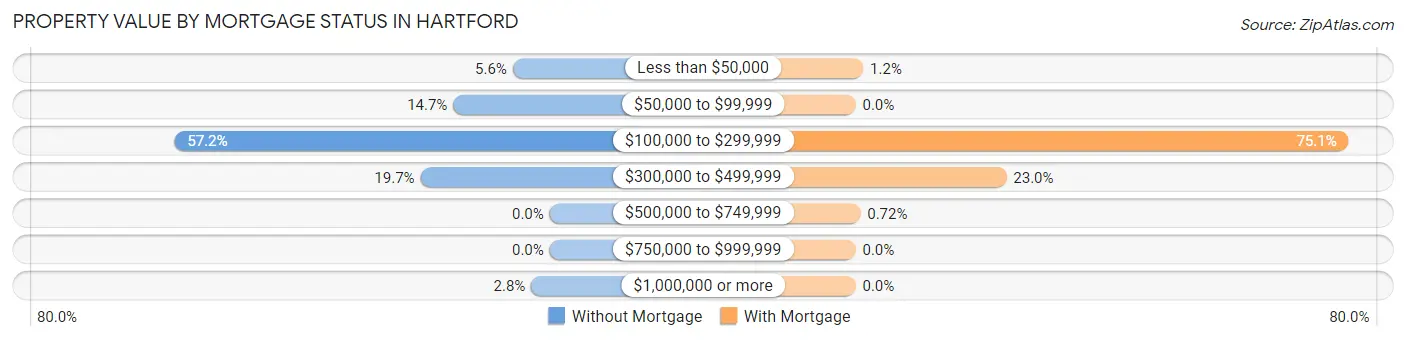
| Property Value | Without Mortgage | With Mortgage |
| Less than $50,000 | 18 (5.6%) | 8 (1.2%) |
| $50,000 to $99,999 | 47 (14.7%) | 0 (0.0%) |
| $100,000 to $299,999 | 183 (57.2%) | 520 (75.1%) |
| $300,000 to $499,999 | 63 (19.7%) | 159 (23.0%) |
| $500,000 to $749,999 | 0 (0.0%) | 5 (0.7%) |
| $750,000 to $999,999 | 0 (0.0%) | 0 (0.0%) |
| $1,000,000 or more | 9 (2.8%) | 0 (0.0%) |
| Total | 320 (100.0%) | 692 (100.0%) |
Household Income by Mortgage Status in Hartford
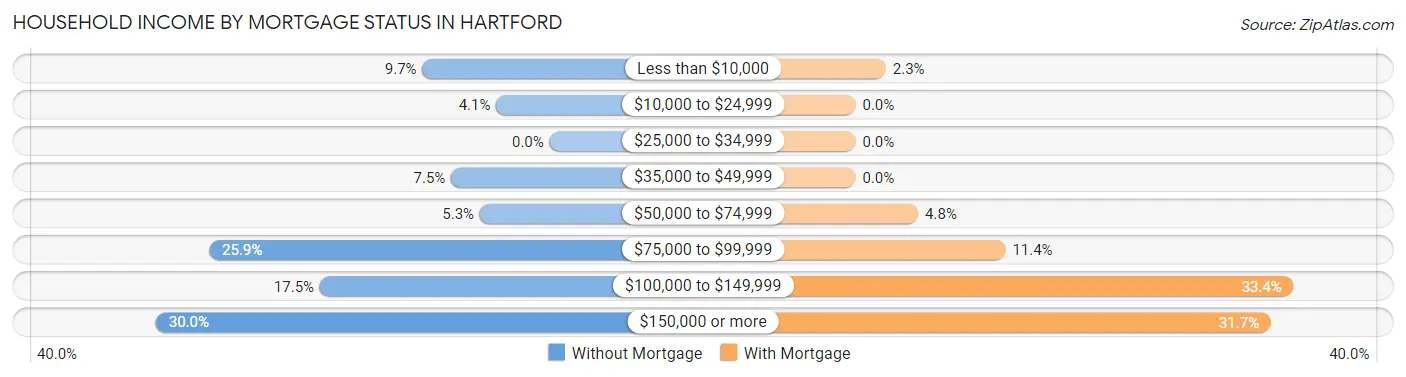
| Household Income | Without Mortgage | With Mortgage |
| Less than $10,000 | 31 (9.7%) | 16 (2.3%) |
| $10,000 to $24,999 | 13 (4.1%) | 0 (0.0%) |
| $25,000 to $34,999 | 0 (0.0%) | 0 (0.0%) |
| $35,000 to $49,999 | 24 (7.5%) | 0 (0.0%) |
| $50,000 to $74,999 | 17 (5.3%) | 33 (4.8%) |
| $75,000 to $99,999 | 83 (25.9%) | 79 (11.4%) |
| $100,000 to $149,999 | 56 (17.5%) | 231 (33.4%) |
| $150,000 or more | 96 (30.0%) | 219 (31.7%) |
| Total | 320 (100.0%) | 692 (100.0%) |
Property Value to Household Income Ratio in Hartford
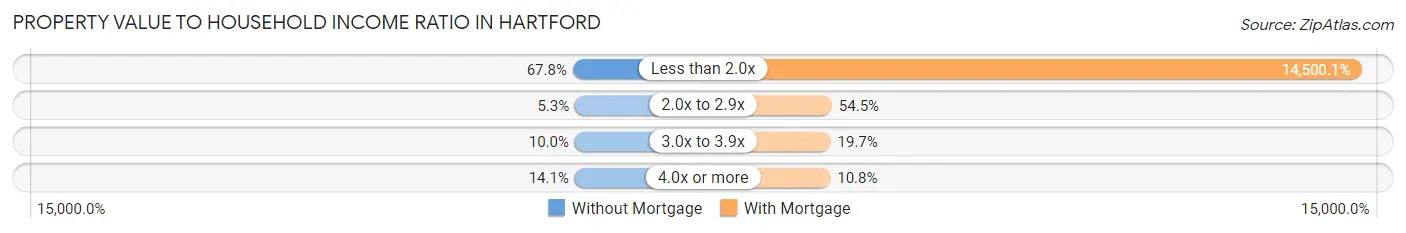
| Value-to-Income Ratio | Without Mortgage | With Mortgage |
| Less than 2.0x | 217 (67.8%) | 100,341 (14,500.1%) |
| 2.0x to 2.9x | 17 (5.3%) | 377 (54.5%) |
| 3.0x to 3.9x | 32 (10.0%) | 136 (19.7%) |
| 4.0x or more | 45 (14.1%) | 75 (10.8%) |
| Total | 320 (100.0%) | 692 (100.0%) |
Real Estate Taxes by Mortgage Status in Hartford
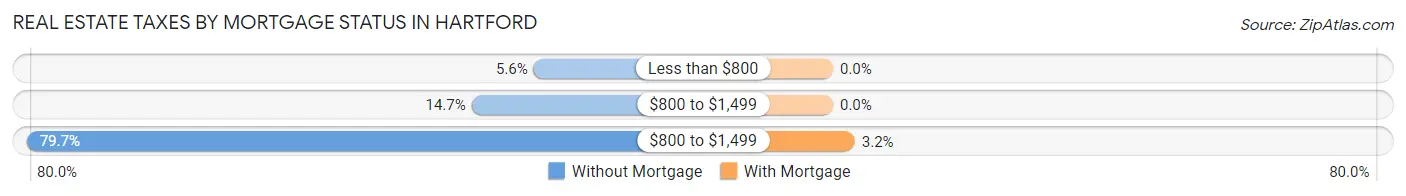
| Property Taxes | Without Mortgage | With Mortgage |
| Less than $800 | 18 (5.6%) | 0 (0.0%) |
| $800 to $1,499 | 47 (14.7%) | 0 (0.0%) |
| $800 to $1,499 | 255 (79.7%) | 22 (3.2%) |
| Total | 320 (100.0%) | 692 (100.0%) |
Health & Disability in Hartford
Health Insurance Coverage by Age in Hartford
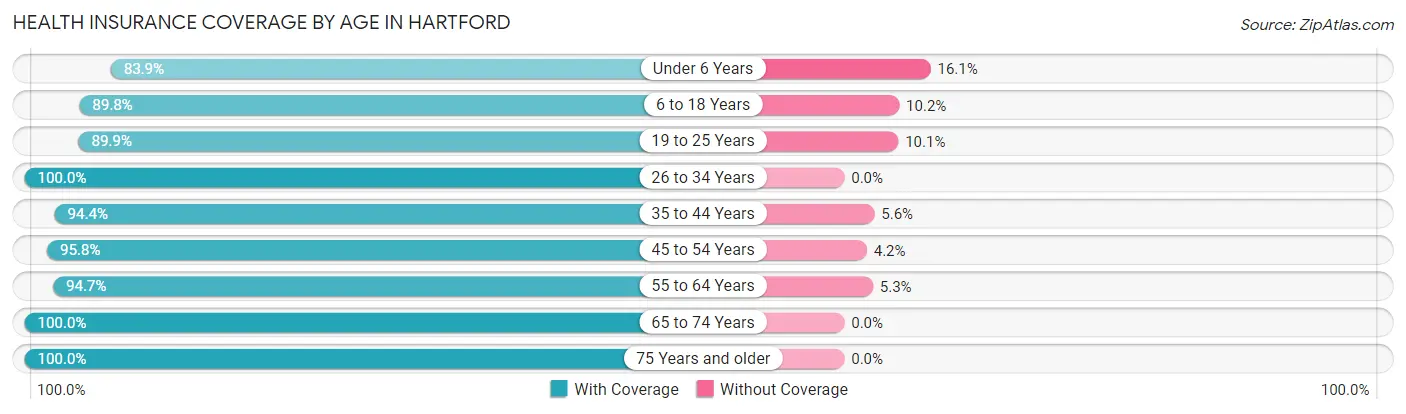
| Age Bracket | With Coverage | Without Coverage |
| Under 6 Years | 167 (83.9%) | 32 (16.1%) |
| 6 to 18 Years | 614 (89.8%) | 70 (10.2%) |
| 19 to 25 Years | 152 (89.9%) | 17 (10.1%) |
| 26 to 34 Years | 417 (100.0%) | 0 (0.0%) |
| 35 to 44 Years | 471 (94.4%) | 28 (5.6%) |
| 45 to 54 Years | 366 (95.8%) | 16 (4.2%) |
| 55 to 64 Years | 356 (94.7%) | 20 (5.3%) |
| 65 to 74 Years | 358 (100.0%) | 0 (0.0%) |
| 75 Years and older | 209 (100.0%) | 0 (0.0%) |
| Total | 3,110 (94.4%) | 183 (5.6%) |
Health Insurance Coverage by Citizenship Status in Hartford
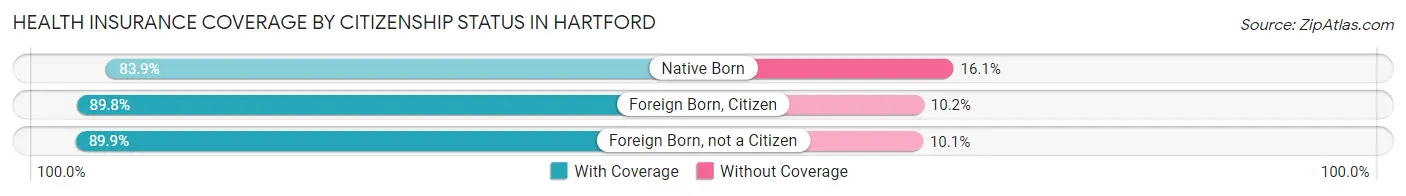
| Citizenship Status | With Coverage | Without Coverage |
| Native Born | 167 (83.9%) | 32 (16.1%) |
| Foreign Born, Citizen | 614 (89.8%) | 70 (10.2%) |
| Foreign Born, not a Citizen | 152 (89.9%) | 17 (10.1%) |
Health Insurance Coverage by Household Income in Hartford
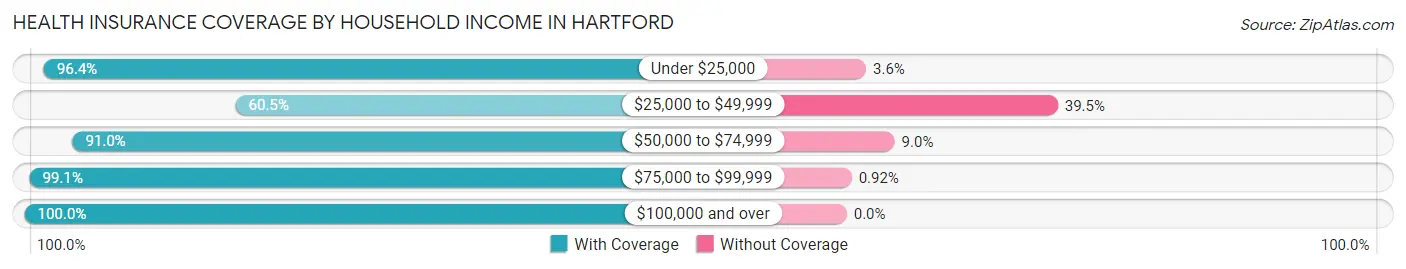
| Household Income | With Coverage | Without Coverage |
| Under $25,000 | 133 (96.4%) | 5 (3.6%) |
| $25,000 to $49,999 | 208 (60.5%) | 136 (39.5%) |
| $50,000 to $74,999 | 345 (91.0%) | 34 (9.0%) |
| $75,000 to $99,999 | 857 (99.1%) | 8 (0.9%) |
| $100,000 and over | 1,567 (100.0%) | 0 (0.0%) |
Public vs Private Health Insurance Coverage by Age in Hartford
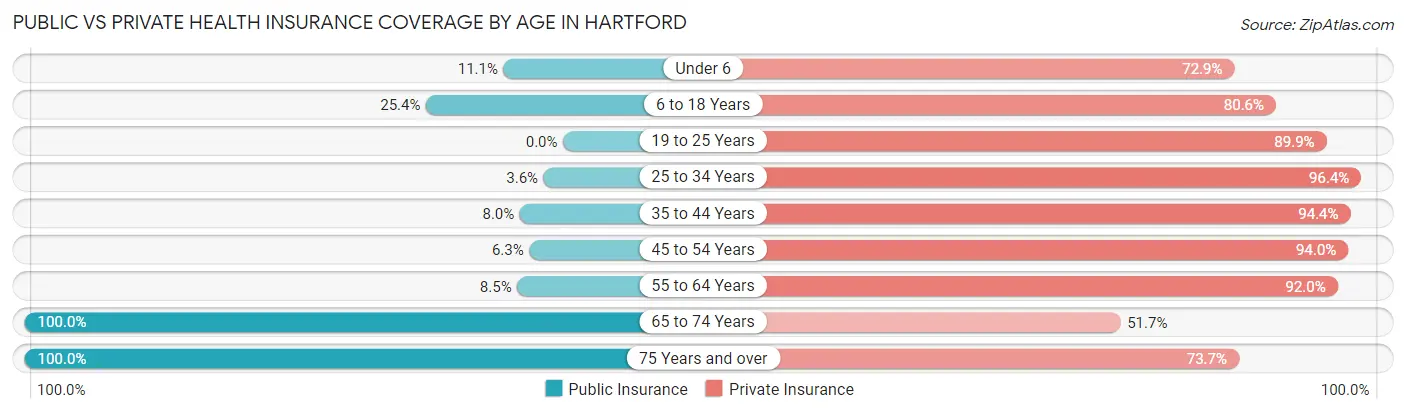
| Age Bracket | Public Insurance | Private Insurance |
| Under 6 | 22 (11.1%) | 145 (72.9%) |
| 6 to 18 Years | 174 (25.4%) | 551 (80.6%) |
| 19 to 25 Years | 0 (0.0%) | 152 (89.9%) |
| 25 to 34 Years | 15 (3.6%) | 402 (96.4%) |
| 35 to 44 Years | 40 (8.0%) | 471 (94.4%) |
| 45 to 54 Years | 24 (6.3%) | 359 (94.0%) |
| 55 to 64 Years | 32 (8.5%) | 346 (92.0%) |
| 65 to 74 Years | 358 (100.0%) | 185 (51.7%) |
| 75 Years and over | 209 (100.0%) | 154 (73.7%) |
| Total | 874 (26.5%) | 2,765 (84.0%) |
Disability Status by Sex by Age in Hartford
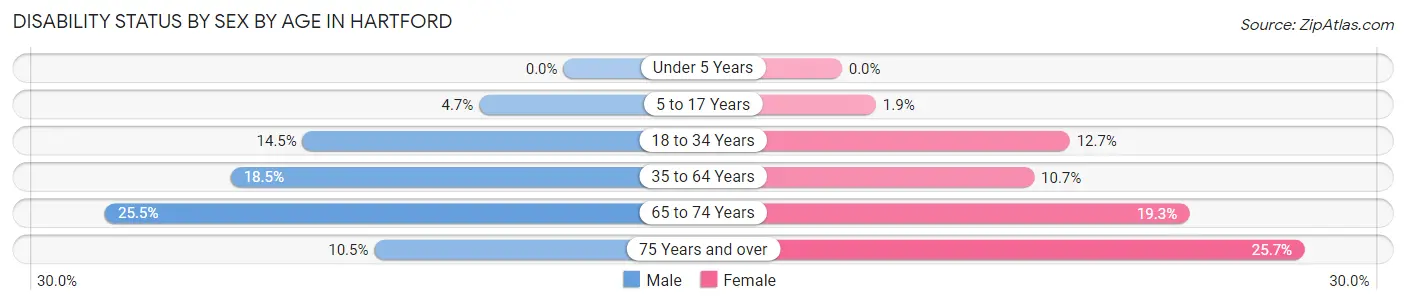
| Age Bracket | Male | Female |
| Under 5 Years | 0 (0.0%) | 0 (0.0%) |
| 5 to 17 Years | 16 (4.7%) | 6 (1.9%) |
| 18 to 34 Years | 53 (14.5%) | 34 (12.7%) |
| 35 to 64 Years | 110 (18.5%) | 71 (10.7%) |
| 65 to 74 Years | 61 (25.5%) | 23 (19.3%) |
| 75 Years and over | 4 (10.5%) | 44 (25.7%) |
Disability Class by Sex by Age in Hartford
Disability Class: Hearing Difficulty
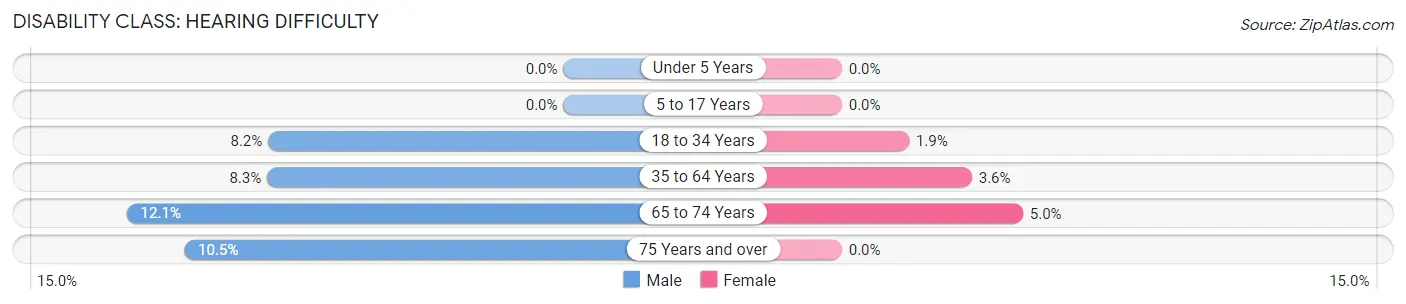
| Age Bracket | Male | Female |
| Under 5 Years | 0 (0.0%) | 0 (0.0%) |
| 5 to 17 Years | 0 (0.0%) | 0 (0.0%) |
| 18 to 34 Years | 30 (8.2%) | 5 (1.9%) |
| 35 to 64 Years | 49 (8.3%) | 24 (3.6%) |
| 65 to 74 Years | 29 (12.1%) | 6 (5.0%) |
| 75 Years and over | 4 (10.5%) | 0 (0.0%) |
Disability Class: Vision Difficulty
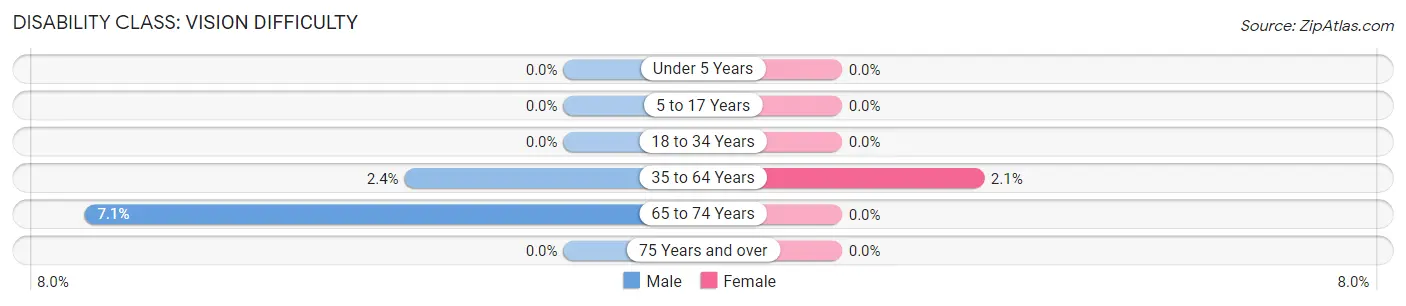
| Age Bracket | Male | Female |
| Under 5 Years | 0 (0.0%) | 0 (0.0%) |
| 5 to 17 Years | 0 (0.0%) | 0 (0.0%) |
| 18 to 34 Years | 0 (0.0%) | 0 (0.0%) |
| 35 to 64 Years | 14 (2.4%) | 14 (2.1%) |
| 65 to 74 Years | 17 (7.1%) | 0 (0.0%) |
| 75 Years and over | 0 (0.0%) | 0 (0.0%) |
Disability Class: Cognitive Difficulty
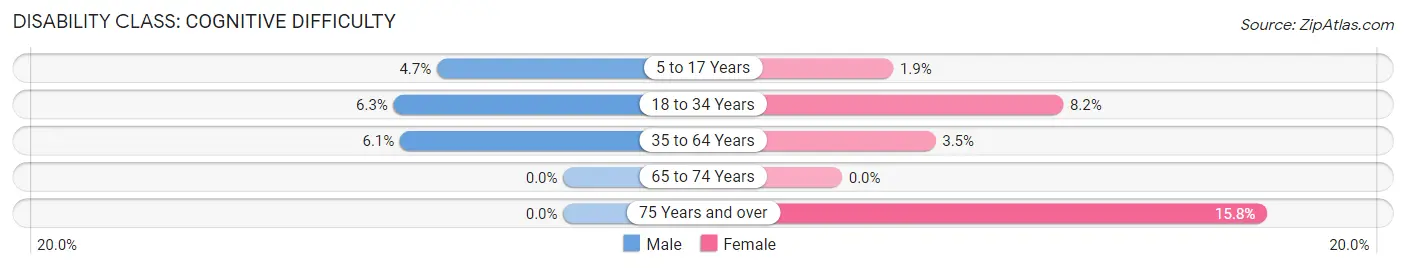
| Age Bracket | Male | Female |
| 5 to 17 Years | 16 (4.7%) | 6 (1.9%) |
| 18 to 34 Years | 23 (6.3%) | 22 (8.2%) |
| 35 to 64 Years | 36 (6.1%) | 23 (3.5%) |
| 65 to 74 Years | 0 (0.0%) | 0 (0.0%) |
| 75 Years and over | 0 (0.0%) | 27 (15.8%) |
Disability Class: Ambulatory Difficulty
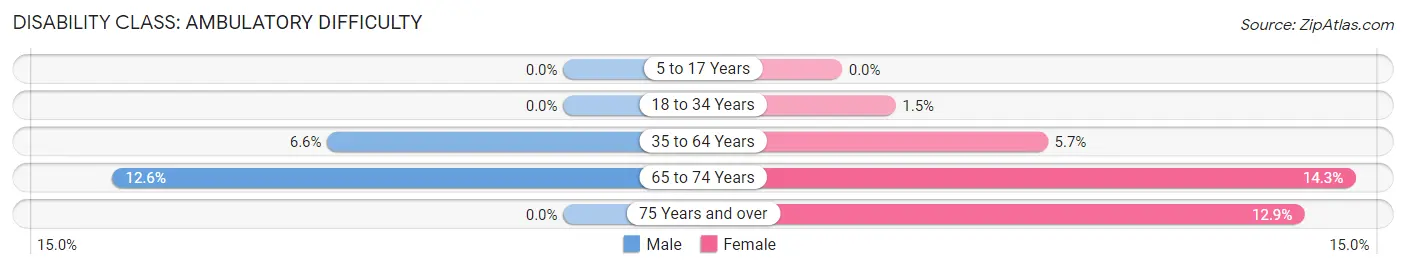
| Age Bracket | Male | Female |
| 5 to 17 Years | 0 (0.0%) | 0 (0.0%) |
| 18 to 34 Years | 0 (0.0%) | 4 (1.5%) |
| 35 to 64 Years | 39 (6.6%) | 38 (5.7%) |
| 65 to 74 Years | 30 (12.6%) | 17 (14.3%) |
| 75 Years and over | 0 (0.0%) | 22 (12.9%) |
Disability Class: Self-Care Difficulty
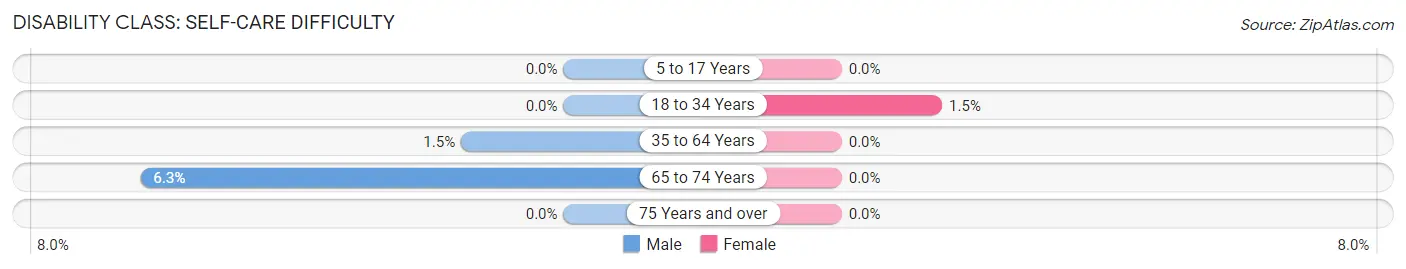
| Age Bracket | Male | Female |
| 5 to 17 Years | 0 (0.0%) | 0 (0.0%) |
| 18 to 34 Years | 0 (0.0%) | 4 (1.5%) |
| 35 to 64 Years | 9 (1.5%) | 0 (0.0%) |
| 65 to 74 Years | 15 (6.3%) | 0 (0.0%) |
| 75 Years and over | 0 (0.0%) | 0 (0.0%) |
Technology Access in Hartford
Computing Device Access in Hartford
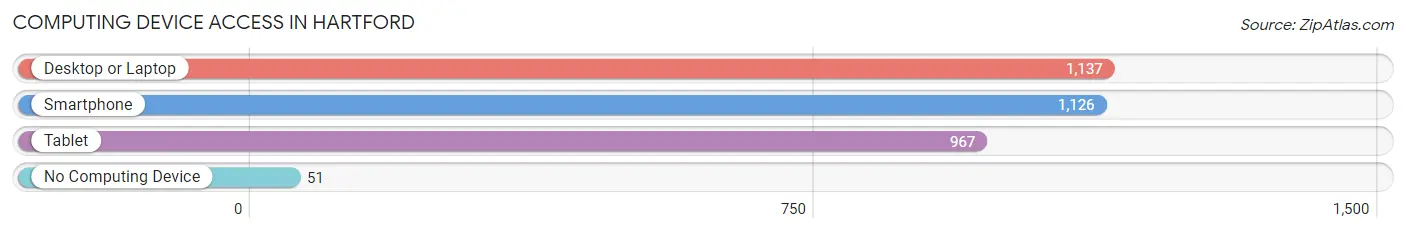
| Device Type | # Households | % Households |
| Desktop or Laptop | 1,137 | 87.8% |
| Smartphone | 1,126 | 87.0% |
| Tablet | 967 | 74.7% |
| No Computing Device | 51 | 3.9% |
| Total | 1,295 | 100.0% |
Internet Access in Hartford
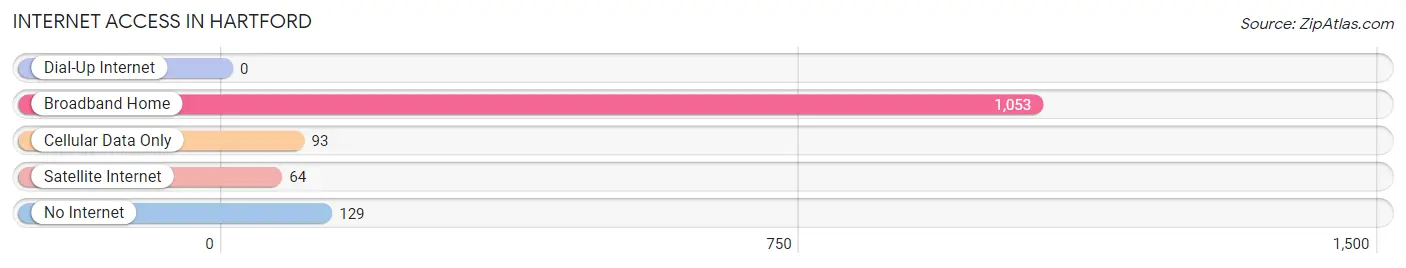
| Internet Type | # Households | % Households |
| Dial-Up Internet | 0 | 0.0% |
| Broadband Home | 1,053 | 81.3% |
| Cellular Data Only | 93 | 7.2% |
| Satellite Internet | 64 | 4.9% |
| No Internet | 129 | 10.0% |
| Total | 1,295 | 100.0% |
Hartford Summary
Hartford, South Dakota is a small city located in the southeastern corner of the state. It is the county seat of Minnehaha County and is part of the Sioux Falls Metropolitan Statistical Area. The city has a population of approximately 5,000 people and is located along the Big Sioux River.
History
Hartford was founded in 1881 by a group of settlers from Hartford, Connecticut. The settlers were looking for a place to start a new life and chose the area due to its fertile soil and abundant natural resources. The city was named after the settlers’ hometown and was incorporated in 1883.
The city quickly grew and by the early 1900s, it had become a major agricultural center. The city was home to several grain elevators, a flour mill, and a creamery. The city also had a thriving business district with several stores, banks, and other businesses.
In the early 1900s, the city was also home to a large number of immigrants from Europe. These immigrants brought with them their culture and traditions, which still influence the city today.
Geography
Hartford is located in the southeastern corner of South Dakota, near the Big Sioux River. The city is located in the rolling hills of the Great Plains and is surrounded by farmland. The city is located about 20 miles from Sioux Falls, the largest city in the state.
The city has a total area of 2.3 square miles, all of which is land. The city has a humid continental climate, with hot summers and cold winters. The average temperature in the summer is around 75 degrees Fahrenheit, while the average temperature in the winter is around 20 degrees Fahrenheit.
Economy
The economy of Hartford is largely based on agriculture. The city is home to several grain elevators, a flour mill, and a creamery. The city also has a thriving business district with several stores, banks, and other businesses.
The city is also home to several manufacturing companies, including a plastics manufacturer and a metal fabrication company. The city is also home to a number of healthcare facilities, including a hospital and several clinics.
Demographics
As of the 2010 census, the population of Hartford was 5,000. The city has a population density of 2,100 people per square mile. The median age of the population is 37.7 years, and the median household income is $45,000.
The racial makeup of the city is 94.2% White, 1.2% African American, 0.7% Native American, 0.7% Asian, 0.1% Pacific Islander, 1.2% from other races, and 1.7% from two or more races. The city is also home to a large number of immigrants from Europe, which makes up 4.2% of the population.
Conclusion
Hartford, South Dakota is a small city located in the southeastern corner of the state. It is the county seat of Minnehaha County and is part of the Sioux Falls Metropolitan Statistical Area. The city has a population of approximately 5,000 people and is located along the Big Sioux River. The city has a thriving economy based on agriculture and manufacturing, and is home to a large number of immigrants from Europe.
Common Questions
What is Per Capita Income in Hartford?
Per Capita income in Hartford is $42,474.
What is the Median Family Income in Hartford?
Median Family Income in Hartford is $94,752.
What is the Median Household income in Hartford?
Median Household Income in Hartford is $93,762.
What is Income or Wage Gap in Hartford?
Income or Wage Gap in Hartford is 33.5%.
Women in Hartford earn 66.5 cents for every dollar earned by a man.
What is Inequality or Gini Index in Hartford?
Inequality or Gini Index in Hartford is 0.37.
What is the Total Population of Hartford?
Total Population of Hartford is 3,340.
What is the Total Male Population of Hartford?
Total Male Population of Hartford is 1,710.
What is the Total Female Population of Hartford?
Total Female Population of Hartford is 1,630.
What is the Ratio of Males per 100 Females in Hartford?
There are 104.91 Males per 100 Females in Hartford.
What is the Ratio of Females per 100 Males in Hartford?
There are 95.32 Females per 100 Males in Hartford.
What is the Median Population Age in Hartford?
Median Population Age in Hartford is 38.6 Years.
What is the Average Family Size in Hartford
Average Family Size in Hartford is 2.8 People.
What is the Average Household Size in Hartford
Average Household Size in Hartford is 2.6 People.
How Large is the Labor Force in Hartford?
There are 1,995 People in the Labor Forcein in Hartford.
What is the Percentage of People in the Labor Force in Hartford?
76.6% of People are in the Labor Force in Hartford.
What is the Unemployment Rate in Hartford?
Unemployment Rate in Hartford is 2.9%.