Zip Codes with the Highest Percentage of Population Employed in Security & Protection in Sioux Falls, SD
RELATED REPORTS & OPTIONS
Security & Protection
Sioux Falls
Compare Zip Codes
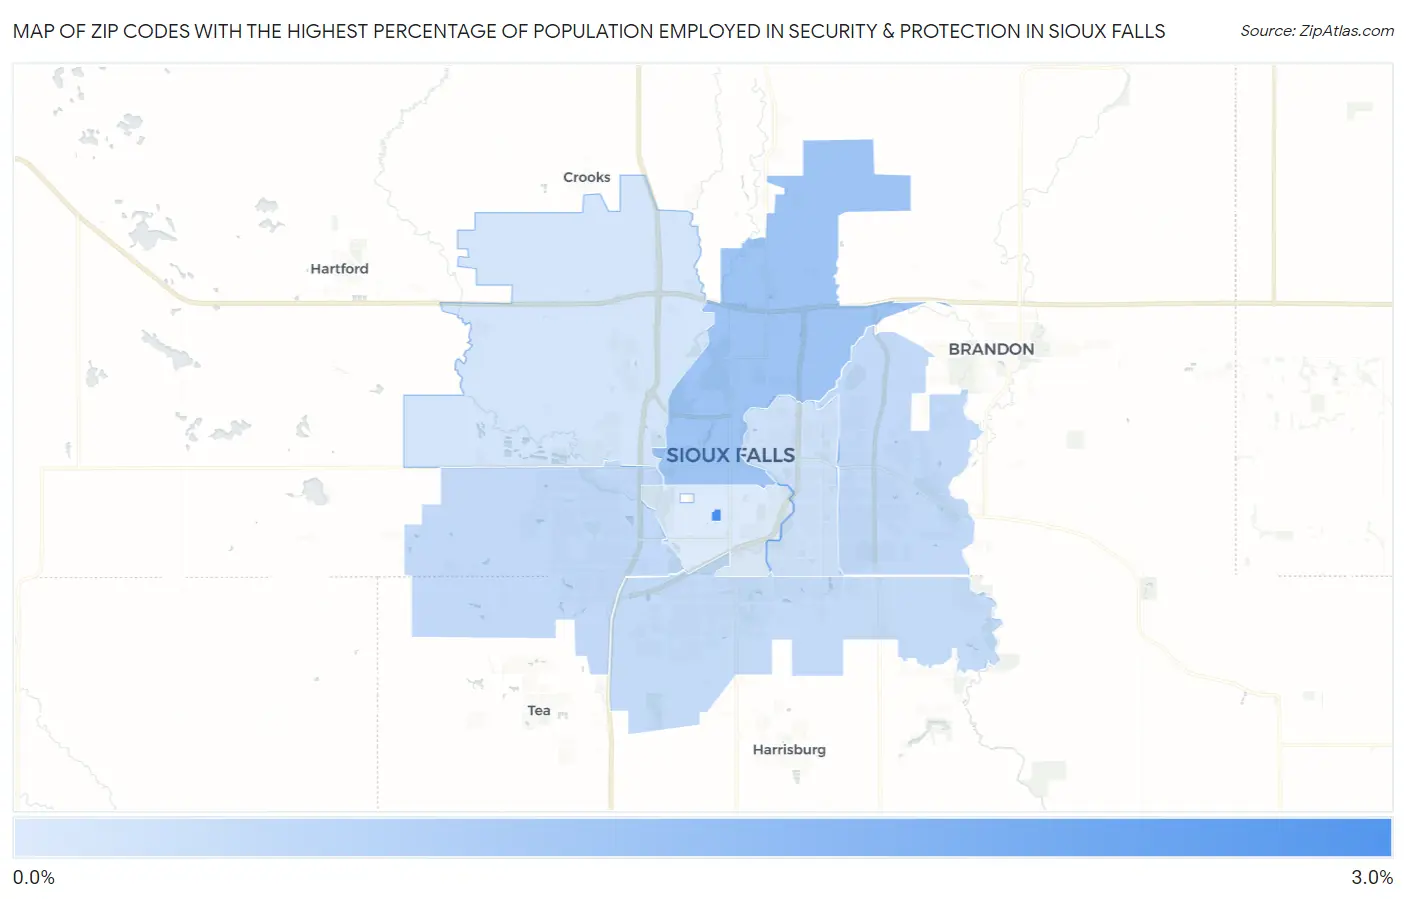
Map of Zip Codes with the Highest Percentage of Population Employed in Security & Protection in Sioux Falls
0.92%
2.9%
Zip Codes with the Highest Percentage of Population Employed in Security & Protection in Sioux Falls, SD
| Zip Code | % Employed | vs State | vs National | |
| 1. | 57197 | 2.9% | 1.8%(+1.12)#57 | 2.1%(+0.729)#7,737 |
| 2. | 57104 | 1.7% | 1.8%(-0.025)#100 | 2.1%(-0.415)#14,433 |
| 3. | 57110 | 1.3% | 1.8%(-0.466)#129 | 2.1%(-0.857)#17,812 |
| 4. | 57106 | 1.3% | 1.8%(-0.473)#131 | 2.1%(-0.863)#17,868 |
| 5. | 57108 | 1.2% | 1.8%(-0.512)#134 | 2.1%(-0.903)#18,156 |
| 6. | 57103 | 1.1% | 1.8%(-0.658)#146 | 2.1%(-1.05)#19,281 |
| 7. | 57107 | 1.0% | 1.8%(-0.716)#150 | 2.1%(-1.11)#19,722 |
| 8. | 57105 | 0.92% | 1.8%(-0.834)#157 | 2.1%(-1.22)#20,625 |
1
Common Questions
What are the Top 5 Zip Codes with the Highest Percentage of Population Employed in Security & Protection in Sioux Falls, SD?
Top 5 Zip Codes with the Highest Percentage of Population Employed in Security & Protection in Sioux Falls, SD are:
What zip code has the Highest Percentage of Population Employed in Security & Protection in Sioux Falls, SD?
57197 has the Highest Percentage of Population Employed in Security & Protection in Sioux Falls, SD with 2.9%.
What is the Percentage of Population Employed in Security & Protection in Sioux Falls, SD?
Percentage of Population Employed in Security & Protection in Sioux Falls is 1.3%.
What is the Percentage of Population Employed in Security & Protection in South Dakota?
Percentage of Population Employed in Security & Protection in South Dakota is 1.8%.
What is the Percentage of Population Employed in Security & Protection in the United States?
Percentage of Population Employed in Security & Protection in the United States is 2.1%.