Clear Lake, SD Map & Demographics
Clear Lake Map
Clear Lake Overview
$20,558
PER CAPITA INCOME
28.8%
WAGE / INCOME GAP [ % ]
71.2¢/ $1
WAGE / INCOME GAP [ $ ]
0.35
INEQUALITY / GINI INDEX
100
TOTAL POPULATION
60
MALE POPULATION
40
FEMALE POPULATION
150.00
MALES / 100 FEMALES
66.67
FEMALES / 100 MALES
31.2
MEDIAN AGE
4.1
AVG FAMILY SIZE
3.0
AVG HOUSEHOLD SIZE
24
LABOR FORCE [ PEOPLE ]
43.6%
PERCENT IN LABOR FORCE
Clear Lake Zip Codes
Clear Lake Area Codes
Income in Clear Lake
Income Overview in Clear Lake
| Characteristic | Number | Measure |
| Per Capita Income | 100 | $20,558 |
| Median Family Income | 18 | $0 |
| Mean Family Income | 18 | $0 |
| Median Household Income | 32 | $0 |
| Mean Household Income | 32 | $61,166 |
| Income Deficit | 18 | $0 |
| Wage / Income Gap (%) | 100 | 28.84% |
| Wage / Income Gap ($) | 100 | 71.16¢ per $1 |
| Gini / Inequality Index | 100 | 0.35 |
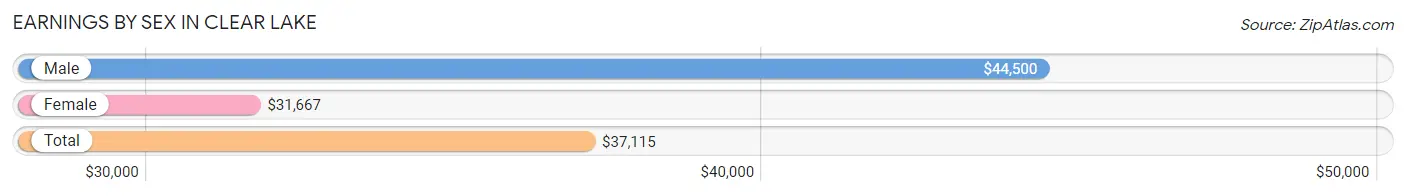
Earnings by Sex in Clear Lake
Average Earnings in Clear Lake are $37,115, $44,500 for men and $31,667 for women, a difference of 28.8%.
| Sex | Number | Average Earnings |
| Male | 13 (39.4%) | $44,500 |
| Female | 20 (60.6%) | $31,667 |
| Total | 33 (100.0%) | $37,115 |
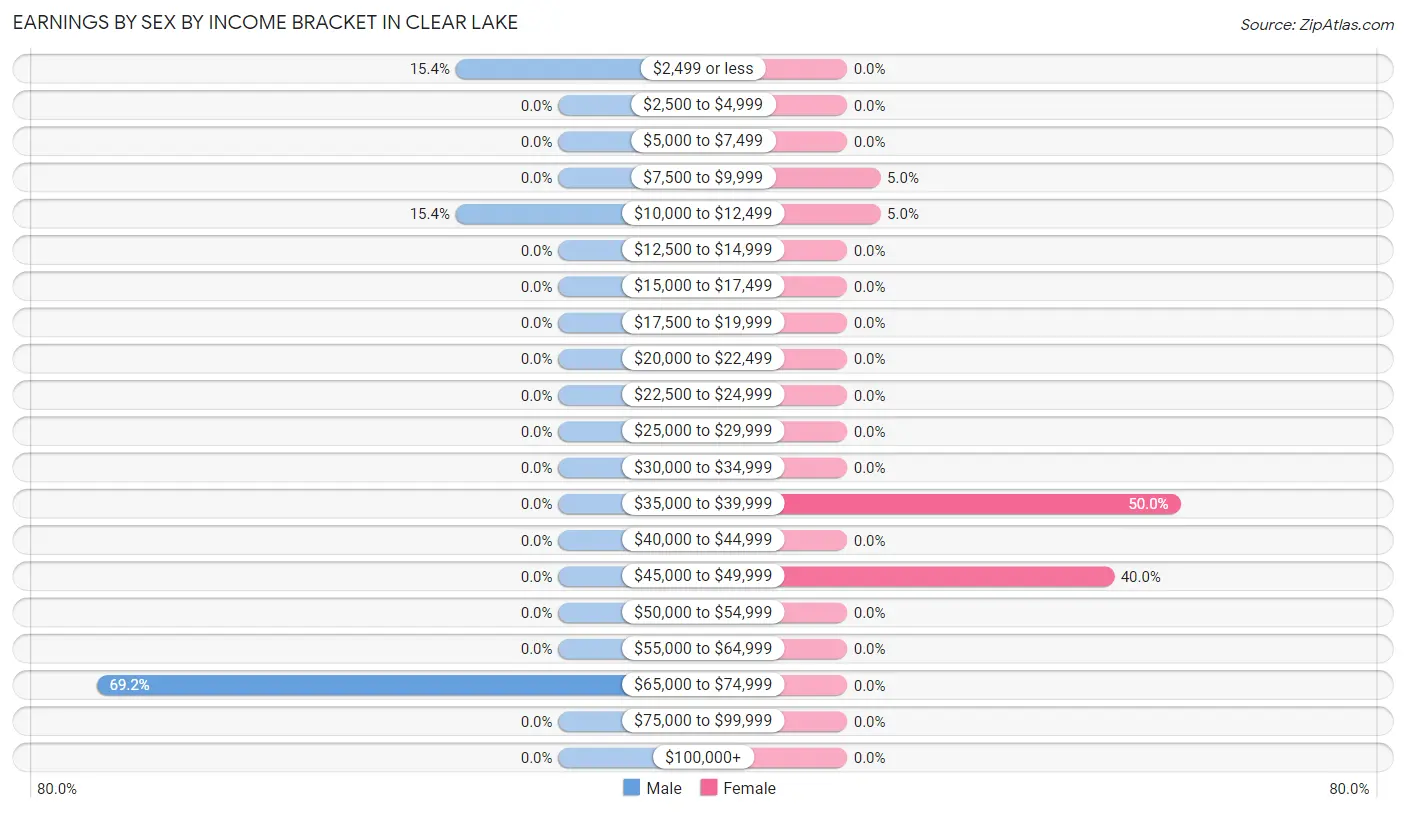
Earnings by Sex by Income Bracket in Clear Lake
The most common earnings brackets in Clear Lake are $65,000 to $74,999 for men (9 | 69.2%) and $35,000 to $39,999 for women (10 | 50.0%).
| Income | Male | Female |
| $2,499 or less | 2 (15.4%) | 0 (0.0%) |
| $2,500 to $4,999 | 0 (0.0%) | 0 (0.0%) |
| $5,000 to $7,499 | 0 (0.0%) | 0 (0.0%) |
| $7,500 to $9,999 | 0 (0.0%) | 1 (5.0%) |
| $10,000 to $12,499 | 2 (15.4%) | 1 (5.0%) |
| $12,500 to $14,999 | 0 (0.0%) | 0 (0.0%) |
| $15,000 to $17,499 | 0 (0.0%) | 0 (0.0%) |
| $17,500 to $19,999 | 0 (0.0%) | 0 (0.0%) |
| $20,000 to $22,499 | 0 (0.0%) | 0 (0.0%) |
| $22,500 to $24,999 | 0 (0.0%) | 0 (0.0%) |
| $25,000 to $29,999 | 0 (0.0%) | 0 (0.0%) |
| $30,000 to $34,999 | 0 (0.0%) | 0 (0.0%) |
| $35,000 to $39,999 | 0 (0.0%) | 10 (50.0%) |
| $40,000 to $44,999 | 0 (0.0%) | 0 (0.0%) |
| $45,000 to $49,999 | 0 (0.0%) | 8 (40.0%) |
| $50,000 to $54,999 | 0 (0.0%) | 0 (0.0%) |
| $55,000 to $64,999 | 0 (0.0%) | 0 (0.0%) |
| $65,000 to $74,999 | 9 (69.2%) | 0 (0.0%) |
| $75,000 to $99,999 | 0 (0.0%) | 0 (0.0%) |
| $100,000+ | 0 (0.0%) | 0 (0.0%) |
| Total | 13 (100.0%) | 20 (100.0%) |
Earnings by Sex by Educational Attainment in Clear Lake
| Educational Attainment | Male Income | Female Income |
| Less than High School | - | - |
| High School Diploma | - | - |
| College or Associate's Degree | - | - |
| Bachelor's Degree | - | - |
| Graduate Degree | - | - |
| Total | - | - |
Family Income in Clear Lake
Family Income Brackets in Clear Lake
According to the Clear Lake family income data, there are 10 families falling into the $50,000 to $74,999 income range, which is the most common income bracket and makes up 55.6% of all families.
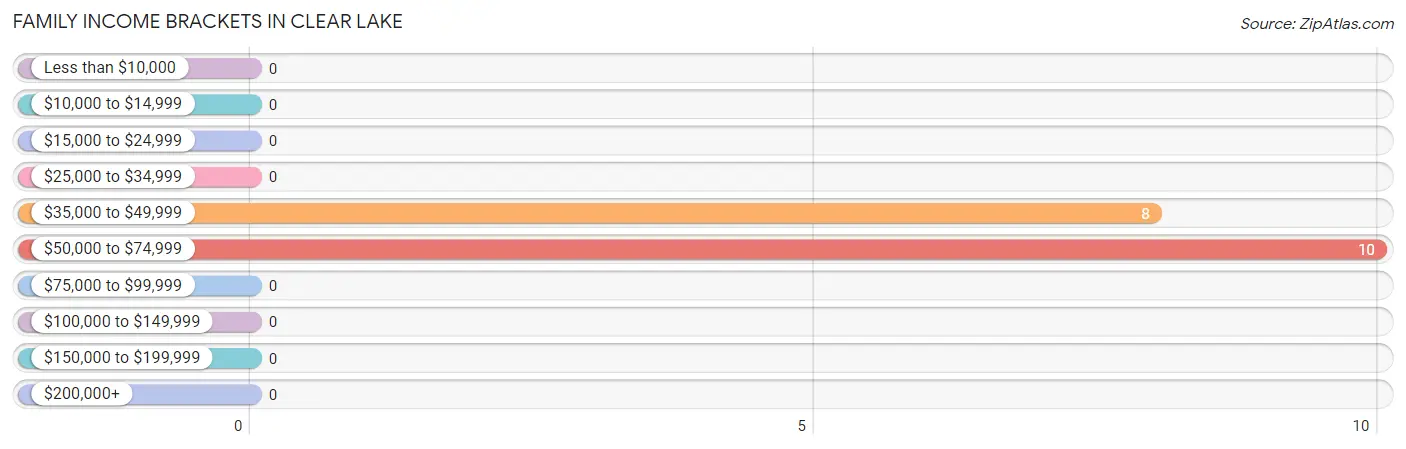
| Income Bracket | # Families | % Families |
| Less than $10,000 | 0 | 0.0% |
| $10,000 to $14,999 | 0 | 0.0% |
| $15,000 to $24,999 | 0 | 0.0% |
| $25,000 to $34,999 | 0 | 0.0% |
| $35,000 to $49,999 | 8 | 44.4% |
| $50,000 to $74,999 | 10 | 55.6% |
| $75,000 to $99,999 | 0 | 0.0% |
| $100,000 to $149,999 | 0 | 0.0% |
| $150,000 to $199,999 | 0 | 0.0% |
| $200,000+ | 0 | 0.0% |
Family Income by Famaliy Size in Clear Lake
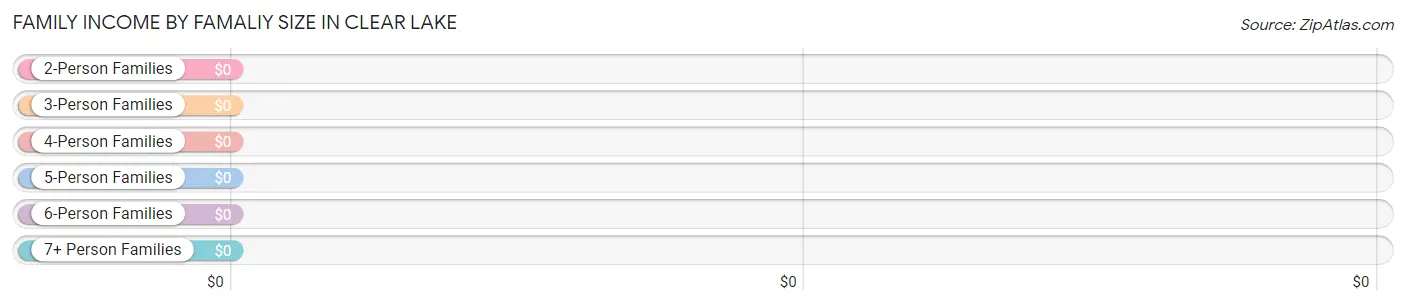
| Income Bracket | # Families | Median Income |
| 2-Person Families | 10 (55.6%) | $0 |
| 3-Person Families | 0 (0.0%) | $0 |
| 4-Person Families | 0 (0.0%) | $0 |
| 5-Person Families | 0 (0.0%) | $0 |
| 6-Person Families | 0 (0.0%) | $0 |
| 7+ Person Families | 8 (44.4%) | $0 |
| Total | 18 (100.0%) | $0 |
Family Income by Number of Earners in Clear Lake
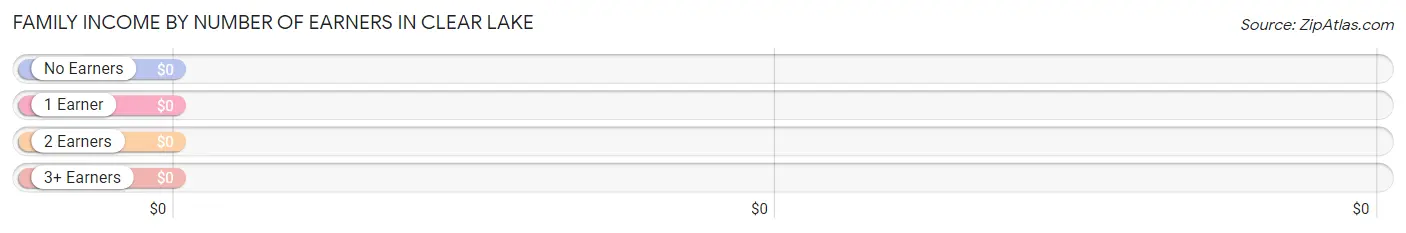
| Number of Earners | # Families | Median Income |
| No Earners | 0 (0.0%) | $0 |
| 1 Earner | 18 (100.0%) | $0 |
| 2 Earners | 0 (0.0%) | $0 |
| 3+ Earners | 0 (0.0%) | $0 |
| Total | 18 (100.0%) | $0 |
Household Income in Clear Lake
Household Income Brackets in Clear Lake
With 12 households falling in the category, the $15,000 to $24,999 income range is the most frequent in Clear Lake, accounting for 37.5% of all households.
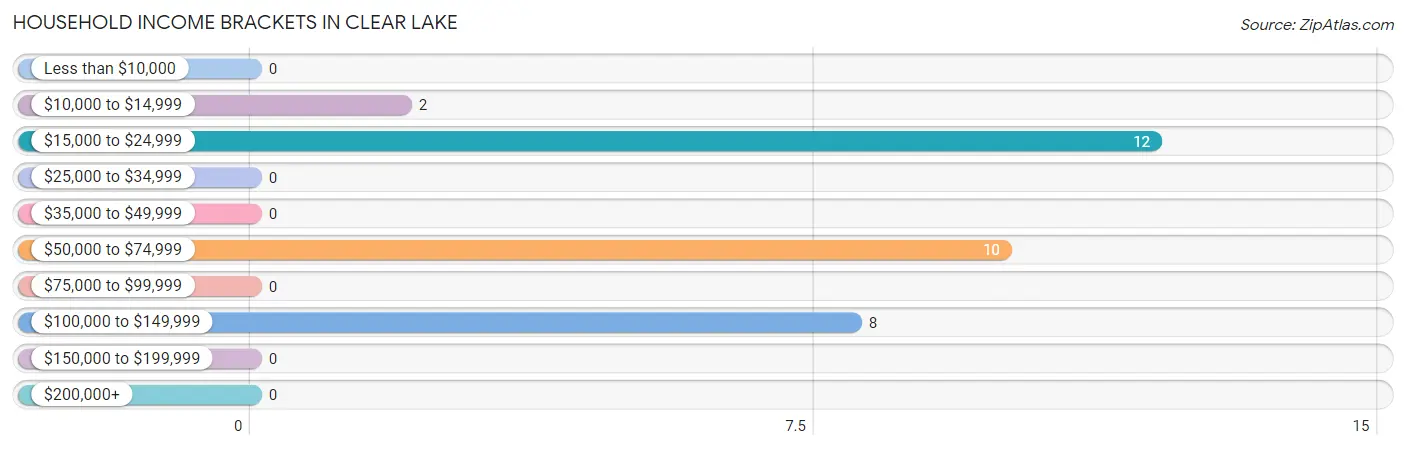
| Income Bracket | # Households | % Households |
| Less than $10,000 | 0 | 0.0% |
| $10,000 to $14,999 | 2 | 6.3% |
| $15,000 to $24,999 | 12 | 37.5% |
| $25,000 to $34,999 | 0 | 0.0% |
| $35,000 to $49,999 | 0 | 0.0% |
| $50,000 to $74,999 | 10 | 31.3% |
| $75,000 to $99,999 | 0 | 0.0% |
| $100,000 to $149,999 | 8 | 25.0% |
| $150,000 to $199,999 | 0 | 0.0% |
| $200,000+ | 0 | 0.0% |
Household Income by Householder Age in Clear Lake
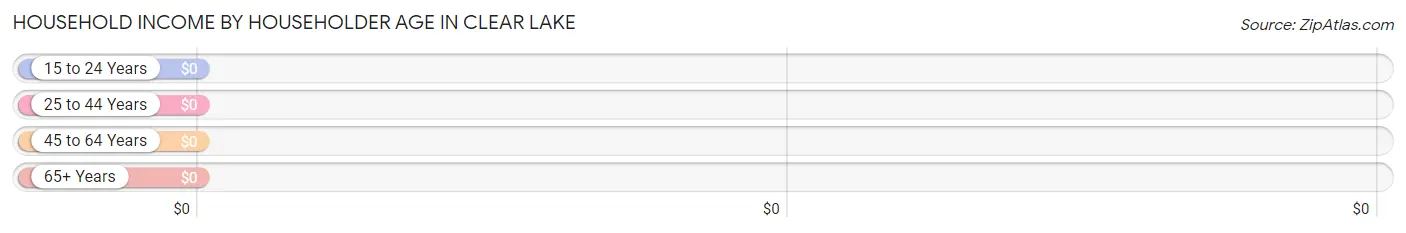
| Income Bracket | # Households | Median Income |
| 15 to 24 Years | 0 (0.0%) | $0 |
| 25 to 44 Years | 8 (25.0%) | $0 |
| 45 to 64 Years | 0 (0.0%) | $0 |
| 65+ Years | 24 (75.0%) | $0 |
| Total | 32 (100.0%) | $0 |
Poverty in Clear Lake
Income Below Poverty by Sex and Age in Clear Lake
With 6.7% poverty level for males and 5.0% for females among the residents of Clear Lake, 18 to 24 year old males and 18 to 24 year old females are the most vulnerable to poverty, with 1 males (100.0%) and 1 females (100.0%) in their respective age groups living below the poverty level.
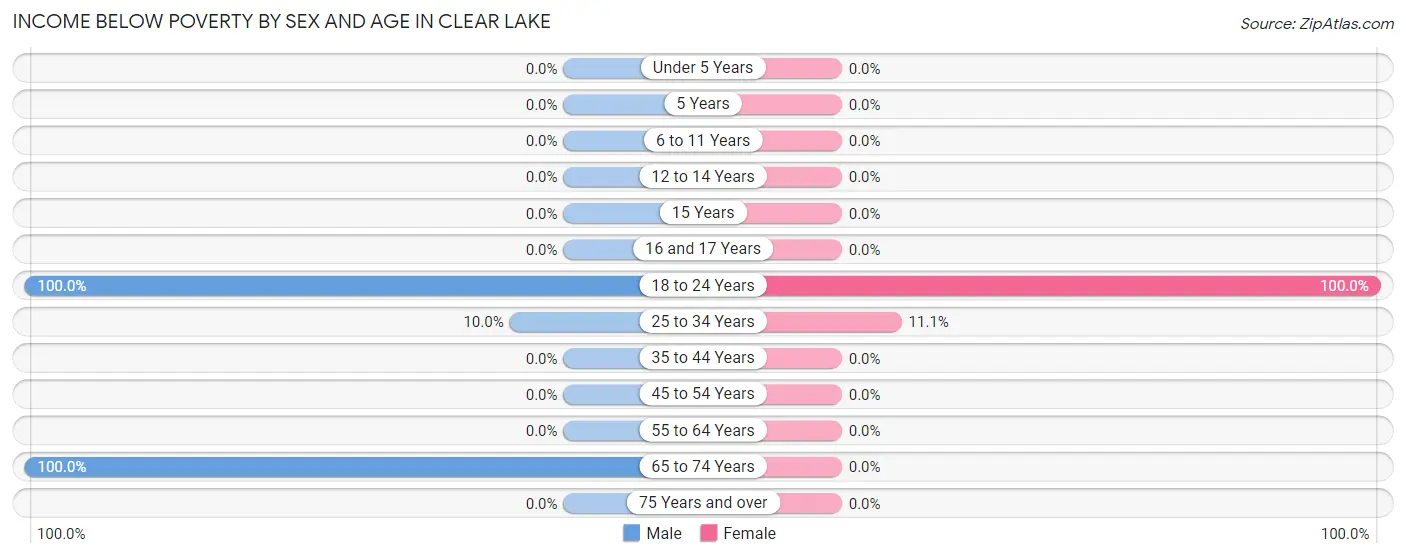
| Age Bracket | Male | Female |
| Under 5 Years | 0 (0.0%) | 0 (0.0%) |
| 5 Years | 0 (0.0%) | 0 (0.0%) |
| 6 to 11 Years | 0 (0.0%) | 0 (0.0%) |
| 12 to 14 Years | 0 (0.0%) | 0 (0.0%) |
| 15 Years | 0 (0.0%) | 0 (0.0%) |
| 16 and 17 Years | 0 (0.0%) | 0 (0.0%) |
| 18 to 24 Years | 1 (100.0%) | 1 (100.0%) |
| 25 to 34 Years | 1 (10.0%) | 1 (11.1%) |
| 35 to 44 Years | 0 (0.0%) | 0 (0.0%) |
| 45 to 54 Years | 0 (0.0%) | 0 (0.0%) |
| 55 to 64 Years | 0 (0.0%) | 0 (0.0%) |
| 65 to 74 Years | 2 (100.0%) | 0 (0.0%) |
| 75 Years and over | 0 (0.0%) | 0 (0.0%) |
| Total | 4 (6.7%) | 2 (5.0%) |
Income Above Poverty by Sex and Age in Clear Lake
According to the poverty statistics in Clear Lake, males aged under 5 years and females aged 6 to 11 years are the age groups that are most secure financially, with 100.0% of males and 100.0% of females in these age groups living above the poverty line.
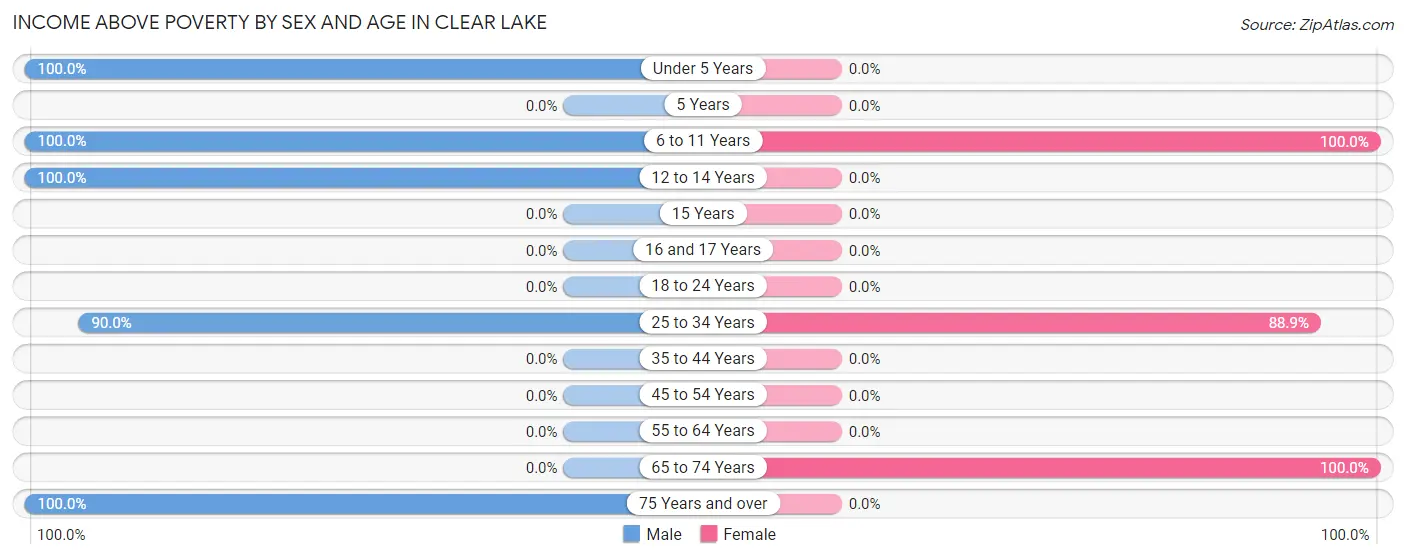
| Age Bracket | Male | Female |
| Under 5 Years | 11 (100.0%) | 0 (0.0%) |
| 5 Years | 0 (0.0%) | 0 (0.0%) |
| 6 to 11 Years | 9 (100.0%) | 8 (100.0%) |
| 12 to 14 Years | 17 (100.0%) | 0 (0.0%) |
| 15 Years | 0 (0.0%) | 0 (0.0%) |
| 16 and 17 Years | 0 (0.0%) | 0 (0.0%) |
| 18 to 24 Years | 0 (0.0%) | 0 (0.0%) |
| 25 to 34 Years | 9 (90.0%) | 8 (88.9%) |
| 35 to 44 Years | 0 (0.0%) | 0 (0.0%) |
| 45 to 54 Years | 0 (0.0%) | 0 (0.0%) |
| 55 to 64 Years | 0 (0.0%) | 0 (0.0%) |
| 65 to 74 Years | 0 (0.0%) | 22 (100.0%) |
| 75 Years and over | 10 (100.0%) | 0 (0.0%) |
| Total | 56 (93.3%) | 38 (95.0%) |
Income Below Poverty Among Married-Couple Families in Clear Lake
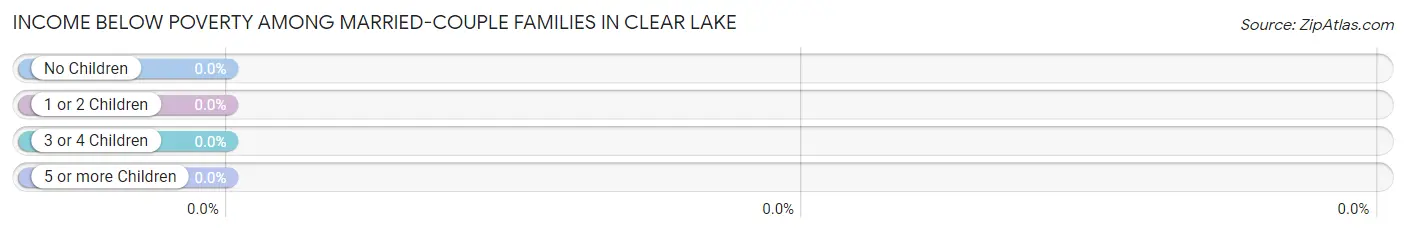
| Children | Above Poverty | Below Poverty |
| No Children | 10 (100.0%) | 0 (0.0%) |
| 1 or 2 Children | 0 (0.0%) | 0 (0.0%) |
| 3 or 4 Children | 0 (0.0%) | 0 (0.0%) |
| 5 or more Children | 0 (0.0%) | 0 (0.0%) |
| Total | 10 (100.0%) | 0 (0.0%) |
Income Below Poverty Among Single-Parent Households in Clear Lake
| Children | Single Father | Single Mother |
| No Children | 0 (0.0%) | 0 (0.0%) |
| 1 or 2 Children | 0 (0.0%) | 0 (0.0%) |
| 3 or 4 Children | 0 (0.0%) | 0 (0.0%) |
| 5 or more Children | 0 (0.0%) | 0 (0.0%) |
| Total | 0 (0.0%) | 0 (0.0%) |
Income Below Poverty Among Married-Couple vs Single-Parent Households in Clear Lake
| Children | Married-Couple Families | Single-Parent Households |
| No Children | 0 (0.0%) | 0 (0.0%) |
| 1 or 2 Children | 0 (0.0%) | 0 (0.0%) |
| 3 or 4 Children | 0 (0.0%) | 0 (0.0%) |
| 5 or more Children | 0 (0.0%) | 0 (0.0%) |
| Total | 0 (0.0%) | 0 (0.0%) |
Race in Clear Lake
The most populous races in Clear Lake are Native / Alaskan (74 | 74.0%), White / Caucasian (25 | 25.0%), and Black / African American (1 | 1.0%).
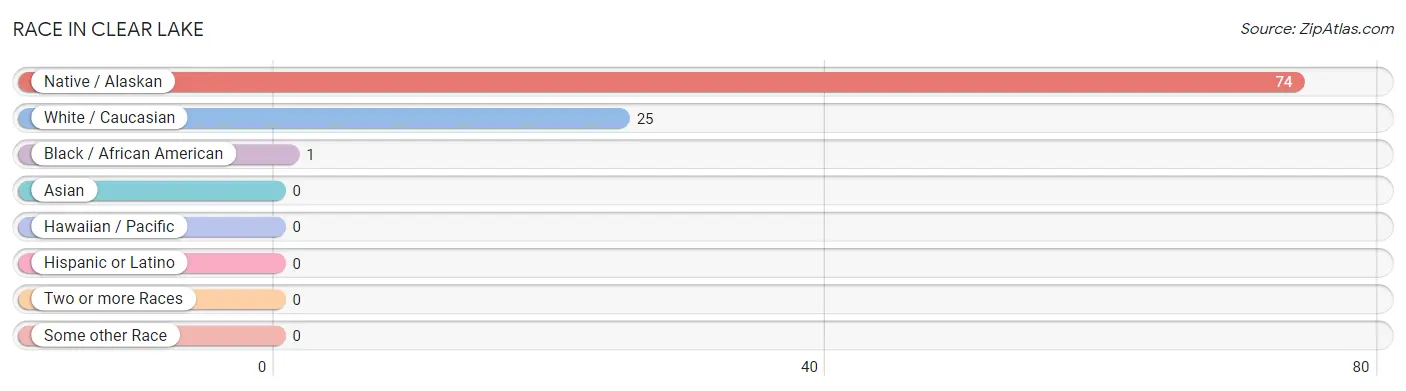
| Race | # Population | % Population |
| Asian | 0 | 0.0% |
| Black / African American | 1 | 1.0% |
| Hawaiian / Pacific | 0 | 0.0% |
| Hispanic or Latino | 0 | 0.0% |
| Native / Alaskan | 74 | 74.0% |
| White / Caucasian | 25 | 25.0% |
| Two or more Races | 0 | 0.0% |
| Some other Race | 0 | 0.0% |
| Total | 100 | 100.0% |
Ancestry in Clear Lake
The most populous ancestries reported in Clear Lake are Sioux (52 | 52.0%), German (13 | 13.0%), Swiss (10 | 10.0%), Cheyenne (9 | 9.0%), and Norwegian (2 | 2.0%), together accounting for 86.0% of all Clear Lake residents.
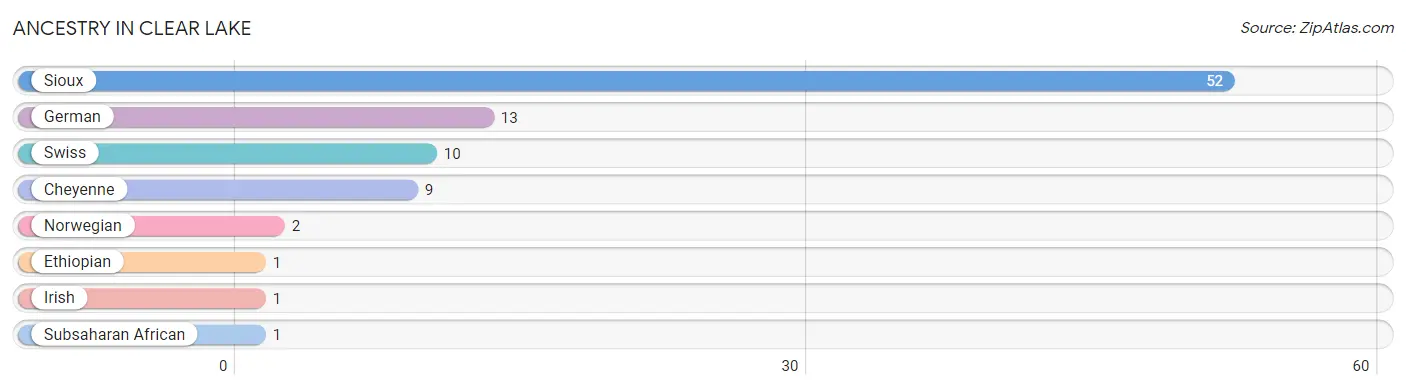
| Ancestry | # Population | % Population |
| Cheyenne | 9 | 9.0% |
| Ethiopian | 1 | 1.0% |
| German | 13 | 13.0% |
| Irish | 1 | 1.0% |
| Norwegian | 2 | 2.0% |
| Sioux | 52 | 52.0% |
| Subsaharan African | 1 | 1.0% |
| Swiss | 10 | 10.0% | View All 8 Rows |
Immigrants in Clear Lake
The most numerous immigrant groups reported in Clear Lake came from Africa (1 | 1.0%), Eastern Africa (1 | 1.0%), and Ethiopia (1 | 1.0%), together accounting for 3.0% of all Clear Lake residents.
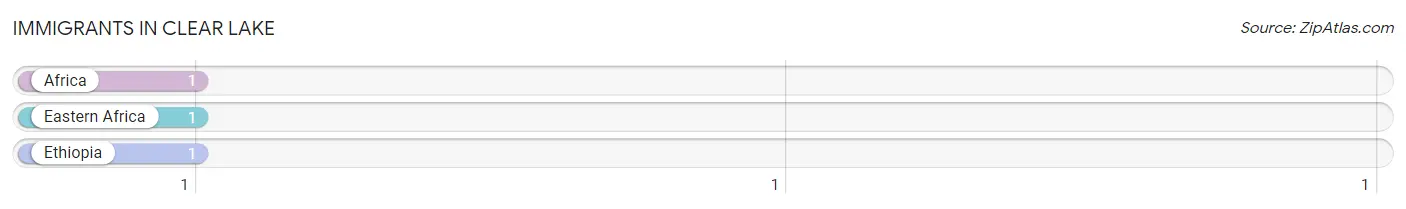
| Immigration Origin | # Population | % Population |
| Africa | 1 | 1.0% |
| Eastern Africa | 1 | 1.0% |
| Ethiopia | 1 | 1.0% | View All 3 Rows |
Sex and Age in Clear Lake
Sex and Age in Clear Lake
The most populous age groups in Clear Lake are 10 to 14 Years (17 | 28.3%) for men and 65 to 69 Years (22 | 55.0%) for women.
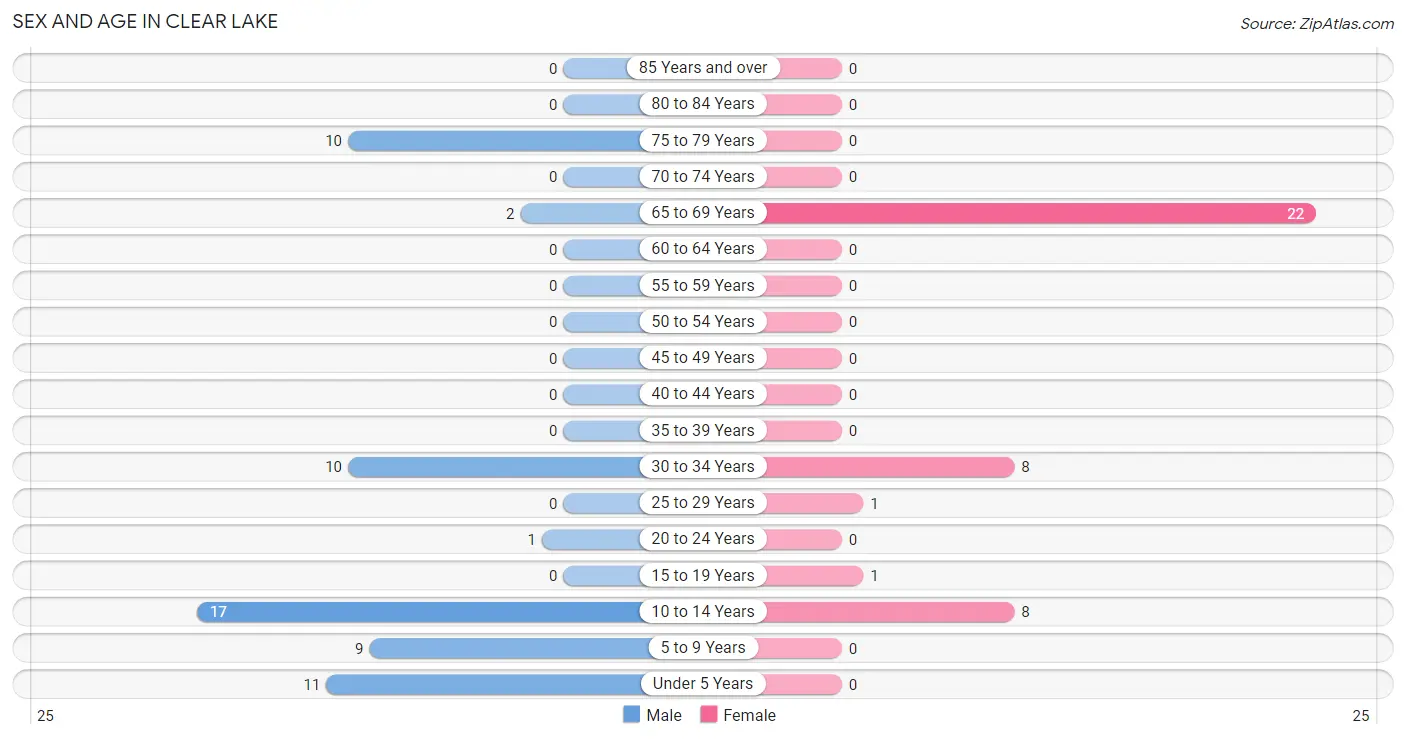
| Age Bracket | Male | Female |
| Under 5 Years | 11 (18.3%) | 0 (0.0%) |
| 5 to 9 Years | 9 (15.0%) | 0 (0.0%) |
| 10 to 14 Years | 17 (28.3%) | 8 (20.0%) |
| 15 to 19 Years | 0 (0.0%) | 1 (2.5%) |
| 20 to 24 Years | 1 (1.7%) | 0 (0.0%) |
| 25 to 29 Years | 0 (0.0%) | 1 (2.5%) |
| 30 to 34 Years | 10 (16.7%) | 8 (20.0%) |
| 35 to 39 Years | 0 (0.0%) | 0 (0.0%) |
| 40 to 44 Years | 0 (0.0%) | 0 (0.0%) |
| 45 to 49 Years | 0 (0.0%) | 0 (0.0%) |
| 50 to 54 Years | 0 (0.0%) | 0 (0.0%) |
| 55 to 59 Years | 0 (0.0%) | 0 (0.0%) |
| 60 to 64 Years | 0 (0.0%) | 0 (0.0%) |
| 65 to 69 Years | 2 (3.3%) | 22 (55.0%) |
| 70 to 74 Years | 0 (0.0%) | 0 (0.0%) |
| 75 to 79 Years | 10 (16.7%) | 0 (0.0%) |
| 80 to 84 Years | 0 (0.0%) | 0 (0.0%) |
| 85 Years and over | 0 (0.0%) | 0 (0.0%) |
| Total | 60 (100.0%) | 40 (100.0%) |
Families and Households in Clear Lake
Median Family Size in Clear Lake
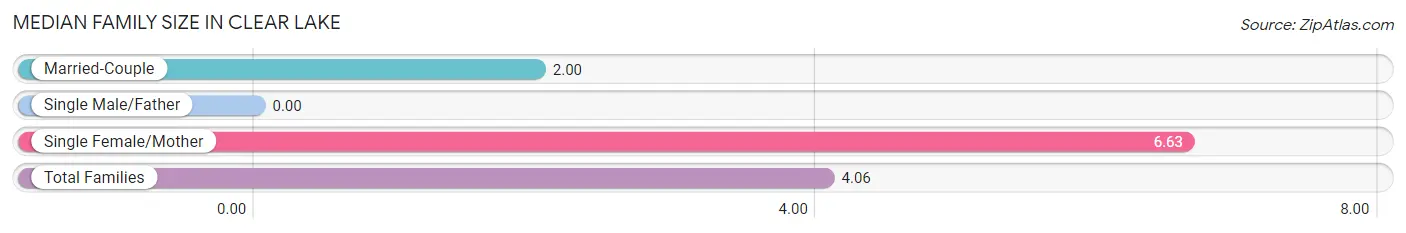
| Family Type | # Families | Family Size |
| Married-Couple | 10 (55.6%) | 2.00 |
| Single Male/Father | 0 (0.0%) | - |
| Single Female/Mother | 8 (44.4%) | 6.63 |
| Total Families | 18 (100.0%) | 4.06 |
Median Household Size in Clear Lake
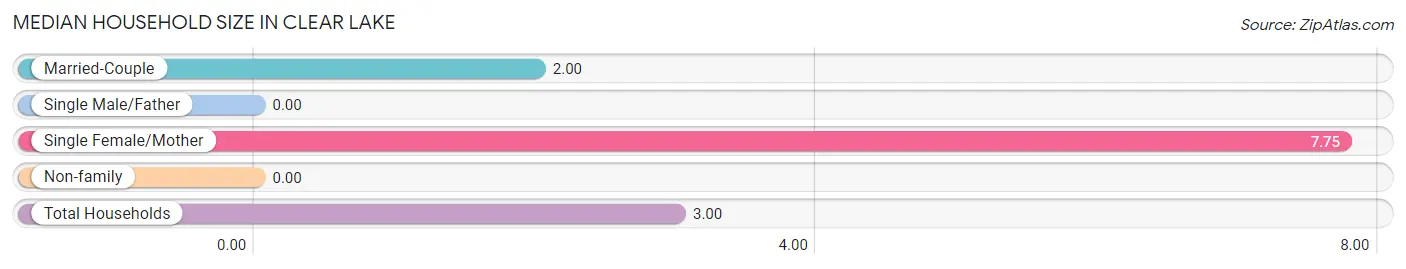
| Household Type | # Households | Household Size |
| Married-Couple | 10 (31.2%) | 2.00 |
| Single Male/Father | 0 (0.0%) | - |
| Single Female/Mother | 8 (25.0%) | 7.75 |
| Non-family | 14 (43.8%) | - |
| Total Households | 32 (100.0%) | 3.00 |
Household Size by Marriage Status in Clear Lake
Out of a total of 32 households in Clear Lake, 18 (56.2%) are family households, while 14 (43.8%) are nonfamily households. The most numerous type of family households are 2-person households, comprising 10, and the most common type of nonfamily households are 1-person households, comprising 14.
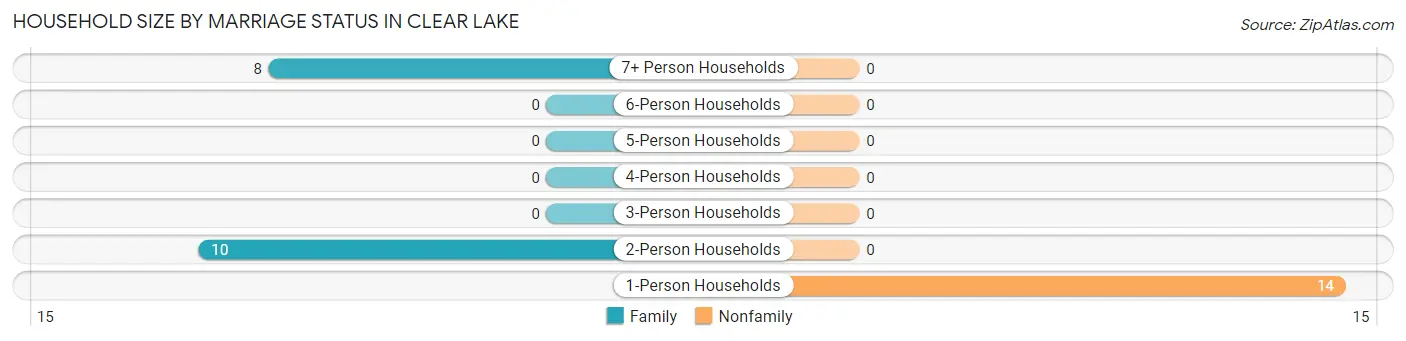
| Household Size | Family Households | Nonfamily Households |
| 1-Person Households | - | 14 (43.8%) |
| 2-Person Households | 10 (31.2%) | 0 (0.0%) |
| 3-Person Households | 0 (0.0%) | 0 (0.0%) |
| 4-Person Households | 0 (0.0%) | 0 (0.0%) |
| 5-Person Households | 0 (0.0%) | 0 (0.0%) |
| 6-Person Households | 0 (0.0%) | 0 (0.0%) |
| 7+ Person Households | 8 (25.0%) | 0 (0.0%) |
| Total | 18 (56.2%) | 14 (43.8%) |
Female Fertility in Clear Lake
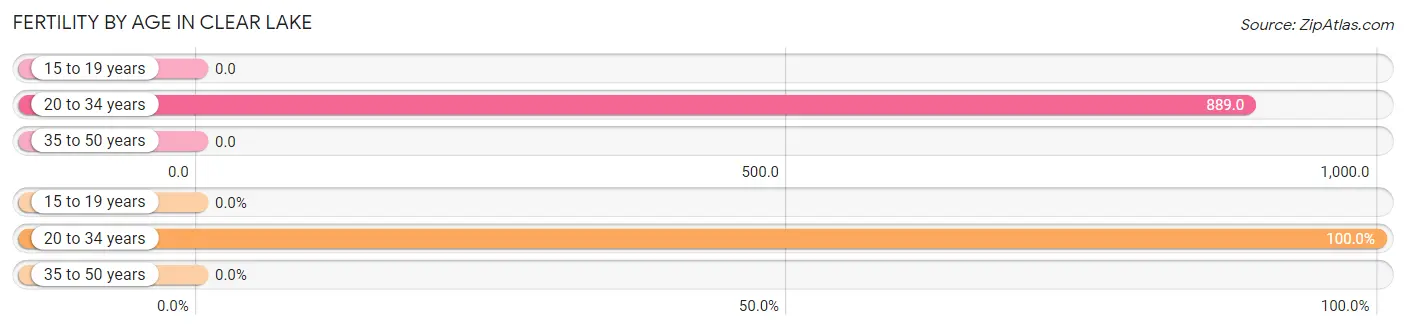
Fertility by Age in Clear Lake
Average fertility rate in Clear Lake is 800.0 births per 1,000 women. Women in the age bracket of 20 to 34 years have the highest fertility rate with 889.0 births per 1,000 women. Women in the age bracket of 20 to 34 years acount for 100.0% of all women with births.
| Age Bracket | Women with Births | Births / 1,000 Women |
| 15 to 19 years | 0 (0.0%) | 0.0 |
| 20 to 34 years | 8 (100.0%) | 889.0 |
| 35 to 50 years | 0 (0.0%) | 0.0 |
| Total | 8 (100.0%) | 800.0 |
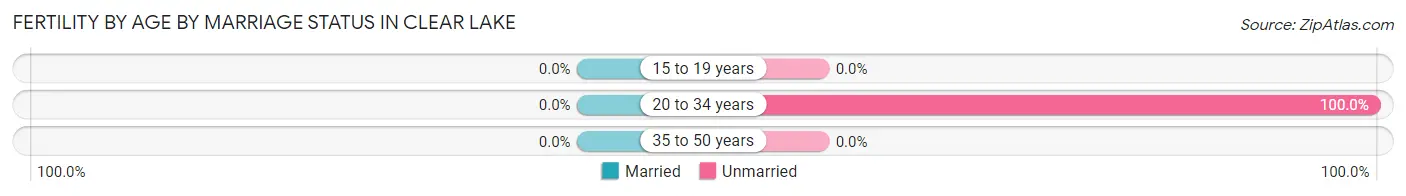
Fertility by Age by Marriage Status in Clear Lake
| Age Bracket | Married | Unmarried |
| 15 to 19 years | 0 (0.0%) | 0 (0.0%) |
| 20 to 34 years | 0 (0.0%) | 8 (100.0%) |
| 35 to 50 years | 0 (0.0%) | 0 (0.0%) |
| Total | 0 (0.0%) | 8 (100.0%) |
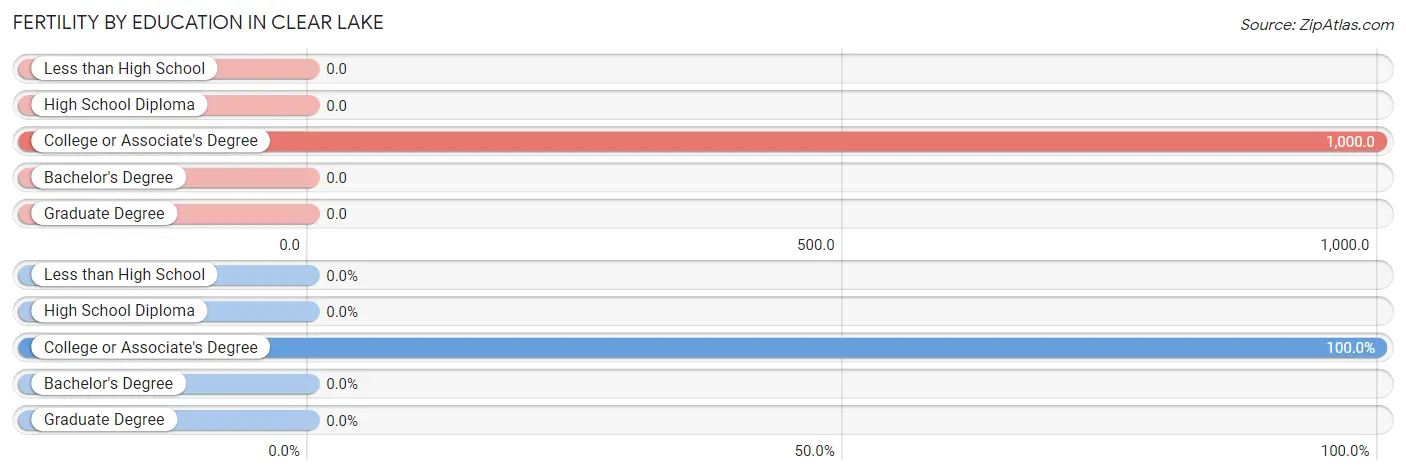
Fertility by Education in Clear Lake
| Educational Attainment | Women with Births | Births / 1,000 Women |
| Less than High School | 0 (0.0%) | 0.0 |
| High School Diploma | 0 (0.0%) | 0.0 |
| College or Associate's Degree | 8 (100.0%) | 1,000.0 |
| Bachelor's Degree | 0 (0.0%) | 0.0 |
| Graduate Degree | 0 (0.0%) | 0.0 |
| Total | 8 (100.0%) | 800.0 |
Fertility by Education by Marriage Status in Clear Lake
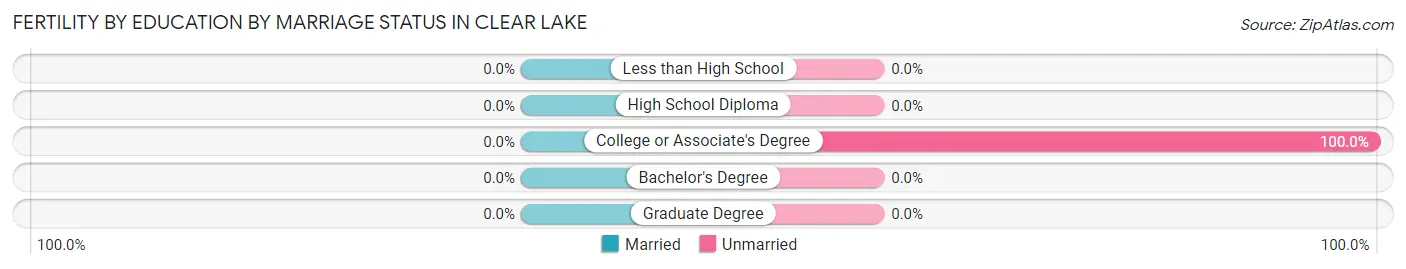
| Educational Attainment | Married | Unmarried |
| Less than High School | 0 (0.0%) | 0 (0.0%) |
| High School Diploma | 0 (0.0%) | 0 (0.0%) |
| College or Associate's Degree | 0 (0.0%) | 8 (100.0%) |
| Bachelor's Degree | 0 (0.0%) | 0 (0.0%) |
| Graduate Degree | 0 (0.0%) | 0 (0.0%) |
| Total | 0 (0.0%) | 8 (100.0%) |
Employment Characteristics in Clear Lake
Employment by Class of Employer in Clear Lake
Among the 24 employed individuals in Clear Lake, local government employees (18 | 75.0%), private company employees (5 | 20.8%), and federal government employees (1 | 4.2%) make up the most common classes of employment.
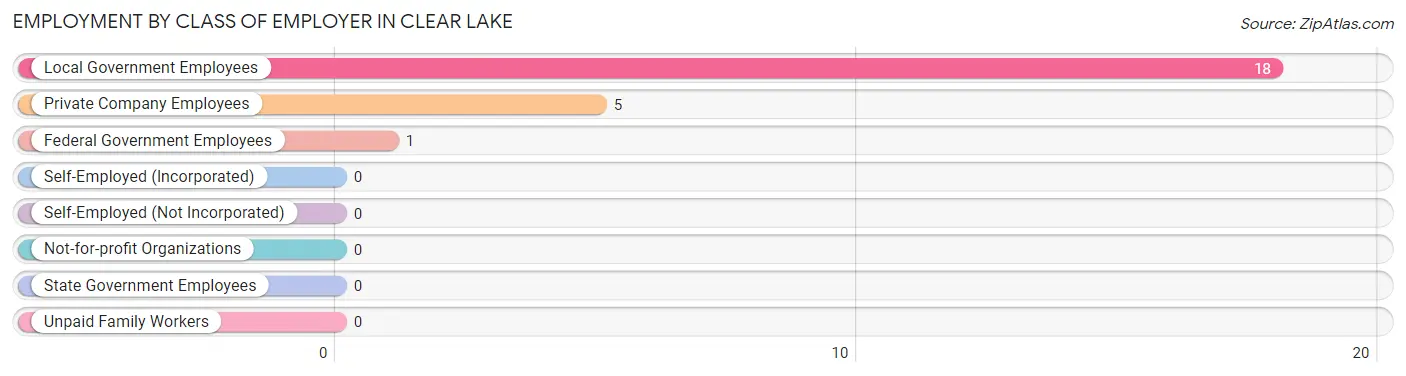
| Employer Class | # Employees | % Employees |
| Private Company Employees | 5 | 20.8% |
| Self-Employed (Incorporated) | 0 | 0.0% |
| Self-Employed (Not Incorporated) | 0 | 0.0% |
| Not-for-profit Organizations | 0 | 0.0% |
| Local Government Employees | 18 | 75.0% |
| State Government Employees | 0 | 0.0% |
| Federal Government Employees | 1 | 4.2% |
| Unpaid Family Workers | 0 | 0.0% |
| Total | 24 | 100.0% |
Employment Status by Age in Clear Lake
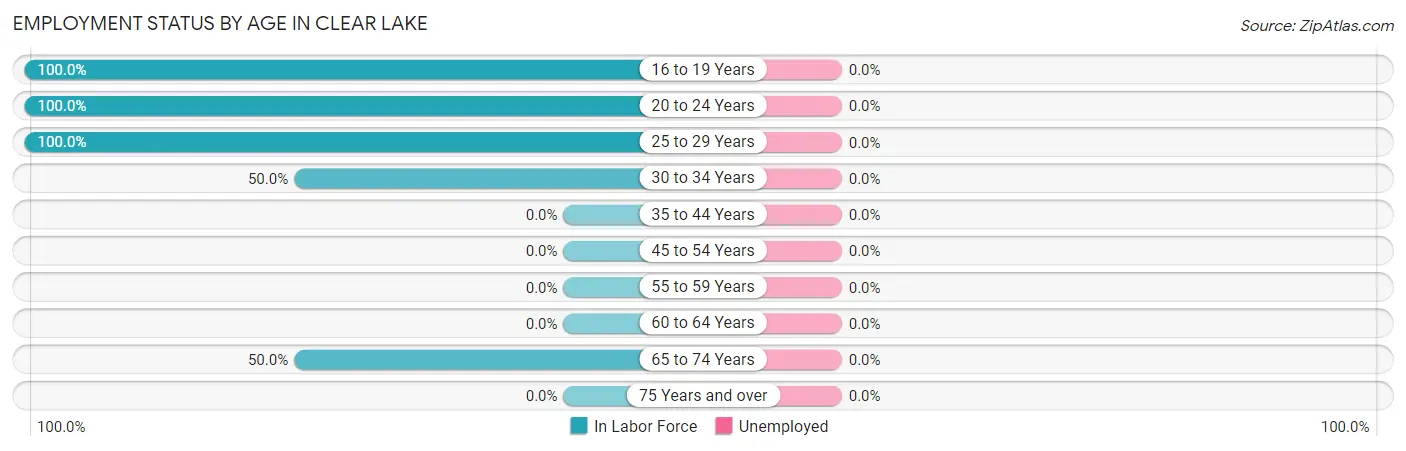
| Age Bracket | In Labor Force | Unemployed |
| 16 to 19 Years | 1 (100.0%) | 0 (0.0%) |
| 20 to 24 Years | 1 (100.0%) | 0 (0.0%) |
| 25 to 29 Years | 1 (100.0%) | 0 (0.0%) |
| 30 to 34 Years | 9 (50.0%) | 0 (0.0%) |
| 35 to 44 Years | 0 (0.0%) | 0 (0.0%) |
| 45 to 54 Years | 0 (0.0%) | 0 (0.0%) |
| 55 to 59 Years | 0 (0.0%) | 0 (0.0%) |
| 60 to 64 Years | 0 (0.0%) | 0 (0.0%) |
| 65 to 74 Years | 12 (50.0%) | 0 (0.0%) |
| 75 Years and over | 0 (0.0%) | 0 (0.0%) |
| Total | 24 (43.6%) | 0 (0.0%) |
Employment Status by Educational Attainment in Clear Lake
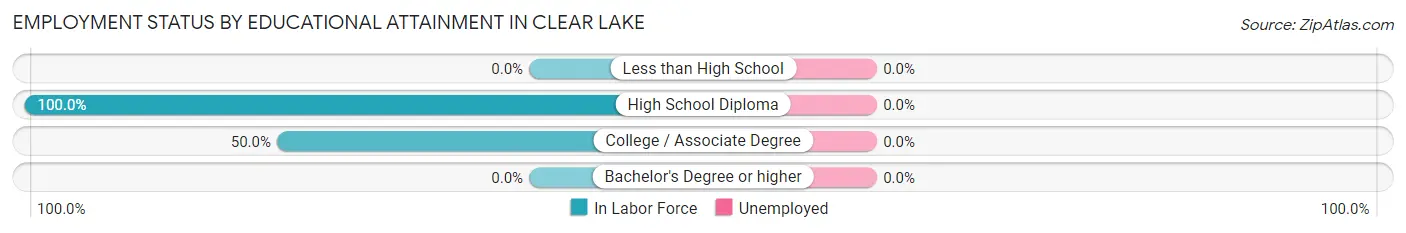
| Educational Attainment | In Labor Force | Unemployed |
| Less than High School | 0 (0.0%) | 0 (0.0%) |
| High School Diploma | 1 (100.0%) | 0 (0.0%) |
| College / Associate Degree | 9 (50.0%) | 0 (0.0%) |
| Bachelor's Degree or higher | 0 (0.0%) | 0 (0.0%) |
| Total | 10 (52.6%) | 0 (0.0%) |
Employment Occupations by Sex in Clear Lake
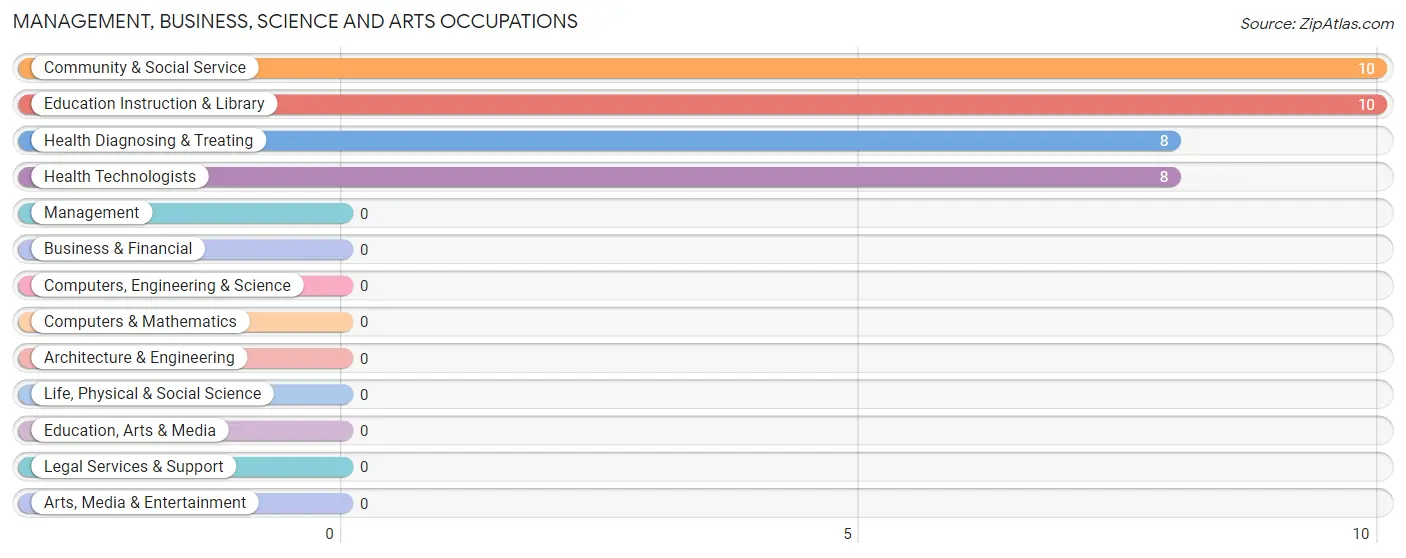
Management, Business, Science and Arts Occupations
The most common Management, Business, Science and Arts occupations in Clear Lake are Community & Social Service (10 | 41.7%), Education Instruction & Library (10 | 41.7%), Health Diagnosing & Treating (8 | 33.3%), and Health Technologists (8 | 33.3%).
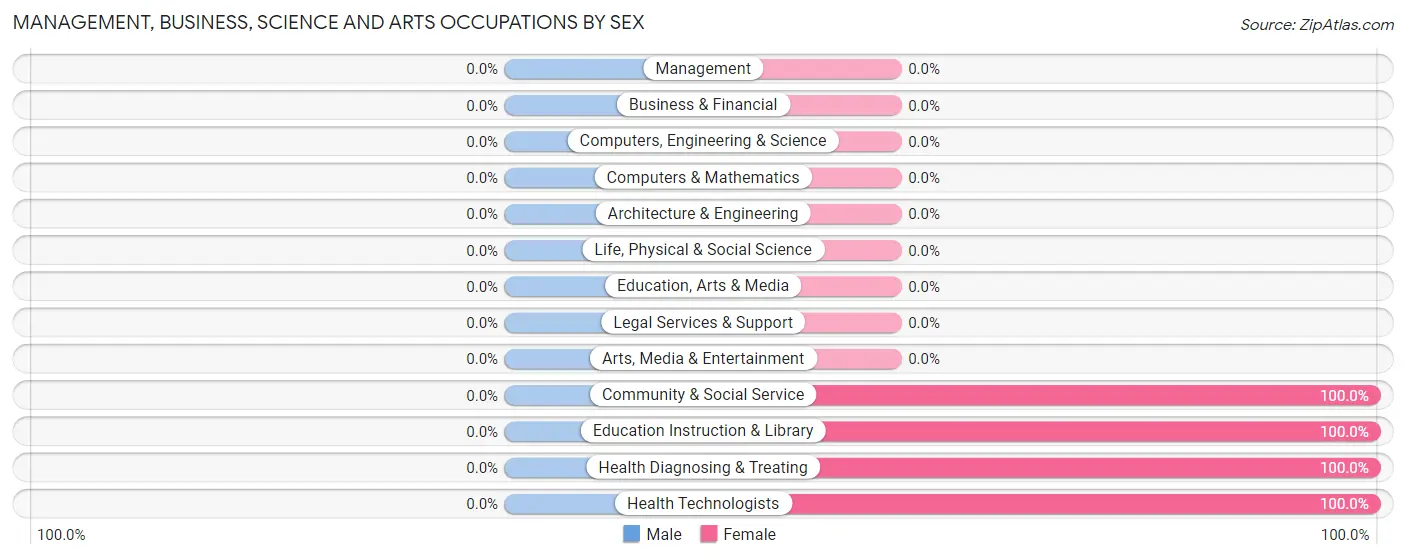
Management, Business, Science and Arts Occupations by Sex
| Occupation | Male | Female |
| Management | 0 (0.0%) | 0 (0.0%) |
| Business & Financial | 0 (0.0%) | 0 (0.0%) |
| Computers, Engineering & Science | 0 (0.0%) | 0 (0.0%) |
| Computers & Mathematics | 0 (0.0%) | 0 (0.0%) |
| Architecture & Engineering | 0 (0.0%) | 0 (0.0%) |
| Life, Physical & Social Science | 0 (0.0%) | 0 (0.0%) |
| Community & Social Service | 0 (0.0%) | 10 (100.0%) |
| Education, Arts & Media | 0 (0.0%) | 0 (0.0%) |
| Legal Services & Support | 0 (0.0%) | 0 (0.0%) |
| Education Instruction & Library | 0 (0.0%) | 10 (100.0%) |
| Arts, Media & Entertainment | 0 (0.0%) | 0 (0.0%) |
| Health Diagnosing & Treating | 0 (0.0%) | 8 (100.0%) |
| Health Technologists | 0 (0.0%) | 8 (100.0%) |
| Total (Category) | 0 (0.0%) | 18 (100.0%) |
| Total (Overall) | 4 (16.7%) | 20 (83.3%) |
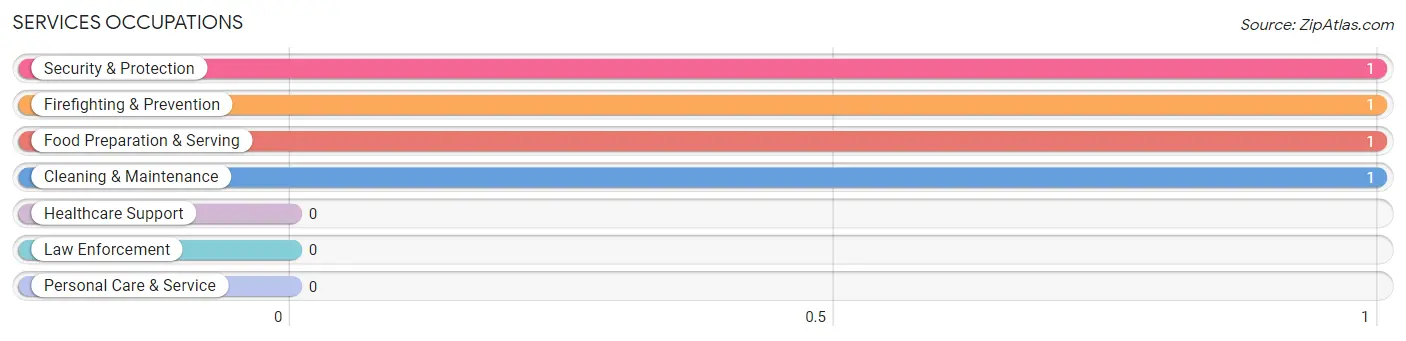
Services Occupations
The most common Services occupations in Clear Lake are Security & Protection (1 | 4.2%), Firefighting & Prevention (1 | 4.2%), Food Preparation & Serving (1 | 4.2%), and Cleaning & Maintenance (1 | 4.2%).
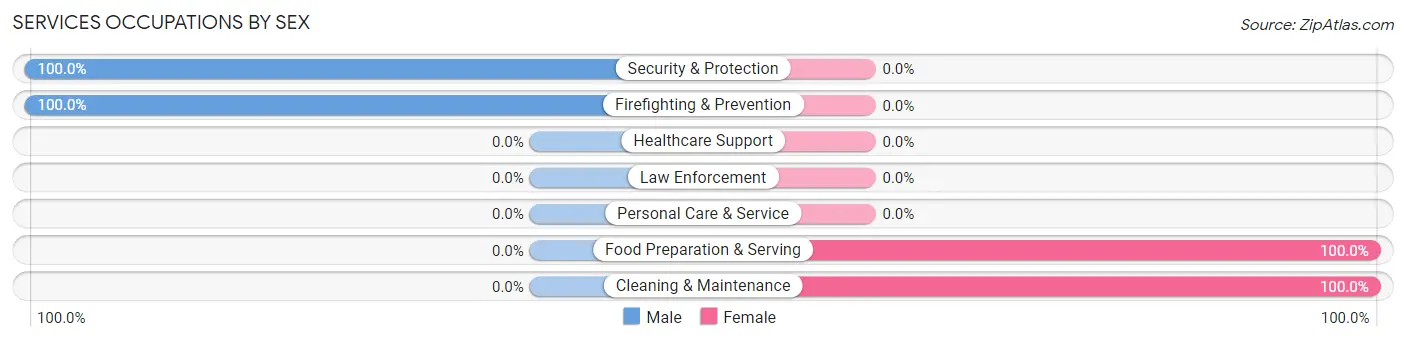
Services Occupations by Sex
Within the Services occupations in Clear Lake, the most male-oriented occupations are Security & Protection (100.0%), and Firefighting & Prevention (100.0%), while the most female-oriented occupations are Food Preparation & Serving (100.0%), and Cleaning & Maintenance (100.0%).
| Occupation | Male | Female |
| Healthcare Support | 0 (0.0%) | 0 (0.0%) |
| Security & Protection | 1 (100.0%) | 0 (0.0%) |
| Firefighting & Prevention | 1 (100.0%) | 0 (0.0%) |
| Law Enforcement | 0 (0.0%) | 0 (0.0%) |
| Food Preparation & Serving | 0 (0.0%) | 1 (100.0%) |
| Cleaning & Maintenance | 0 (0.0%) | 1 (100.0%) |
| Personal Care & Service | 0 (0.0%) | 0 (0.0%) |
| Total (Category) | 1 (33.3%) | 2 (66.7%) |
| Total (Overall) | 4 (16.7%) | 20 (83.3%) |
Sales and Office Occupations
The most common Sales and Office occupations in Clear Lake are , and Office & Administration (1 | 4.2%).
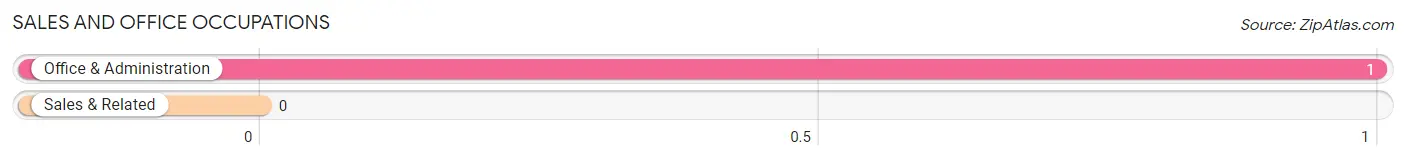
Sales and Office Occupations by Sex
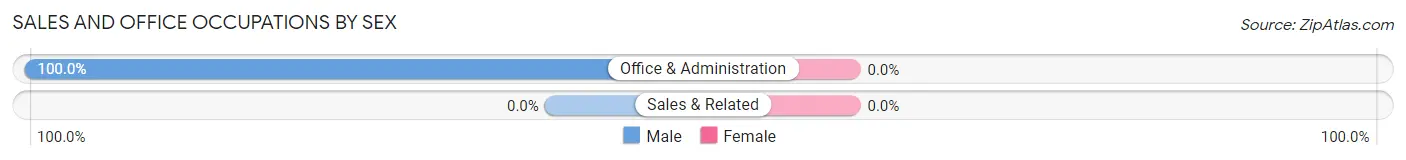
| Occupation | Male | Female |
| Sales & Related | 0 (0.0%) | 0 (0.0%) |
| Office & Administration | 1 (100.0%) | 0 (0.0%) |
| Total (Category) | 1 (100.0%) | 0 (0.0%) |
| Total (Overall) | 4 (16.7%) | 20 (83.3%) |
Natural Resources, Construction and Maintenance Occupations
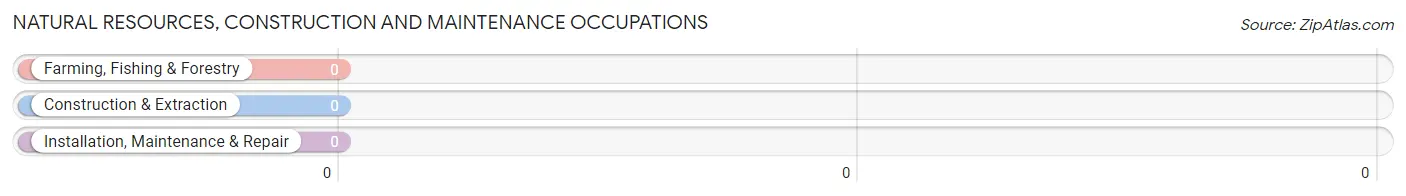
Natural Resources, Construction and Maintenance Occupations by Sex
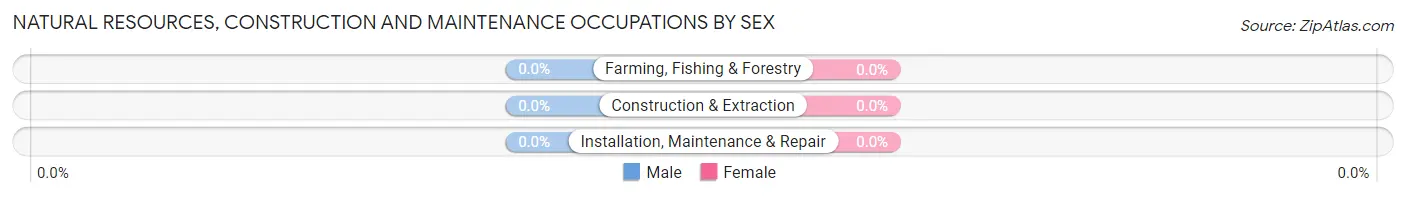
| Occupation | Male | Female |
| Farming, Fishing & Forestry | 0 (0.0%) | 0 (0.0%) |
| Construction & Extraction | 0 (0.0%) | 0 (0.0%) |
| Installation, Maintenance & Repair | 0 (0.0%) | 0 (0.0%) |
| Total (Category) | 0 (0.0%) | 0 (0.0%) |
| Total (Overall) | 4 (16.7%) | 20 (83.3%) |
Production, Transportation and Moving Occupations
The most common Production, Transportation and Moving occupations in Clear Lake are , and Transportation (2 | 8.3%).
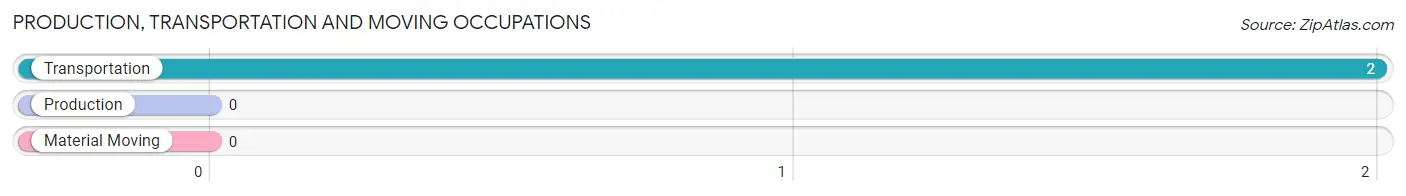
Production, Transportation and Moving Occupations by Sex
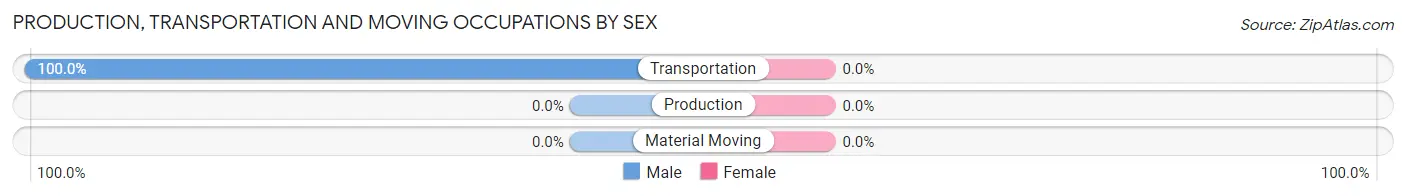
| Occupation | Male | Female |
| Production | 0 (0.0%) | 0 (0.0%) |
| Transportation | 2 (100.0%) | 0 (0.0%) |
| Material Moving | 0 (0.0%) | 0 (0.0%) |
| Total (Category) | 2 (100.0%) | 0 (0.0%) |
| Total (Overall) | 4 (16.7%) | 20 (83.3%) |
Employment Industries by Sex in Clear Lake
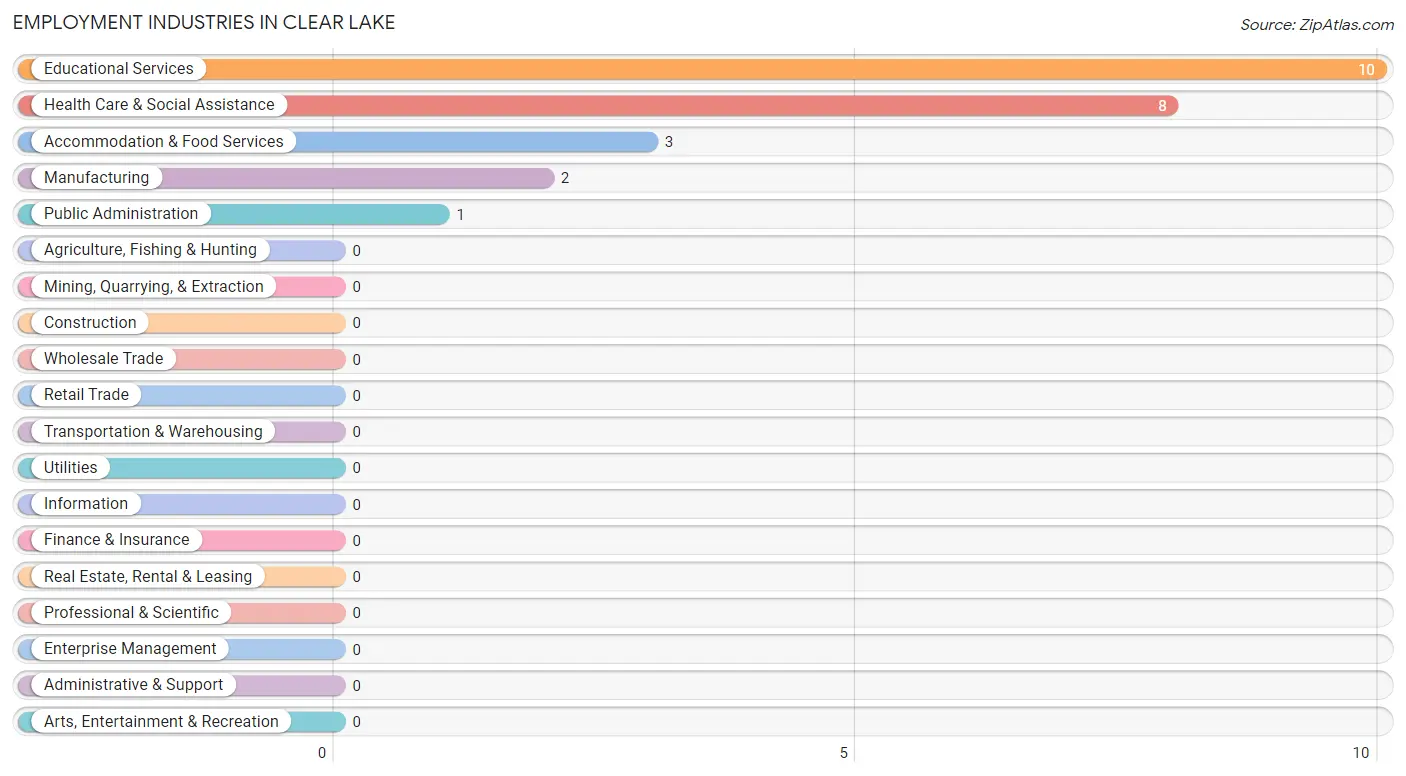
Employment Industries in Clear Lake
The major employment industries in Clear Lake include Educational Services (10 | 41.7%), Health Care & Social Assistance (8 | 33.3%), Accommodation & Food Services (3 | 12.5%), Manufacturing (2 | 8.3%), and Public Administration (1 | 4.2%).
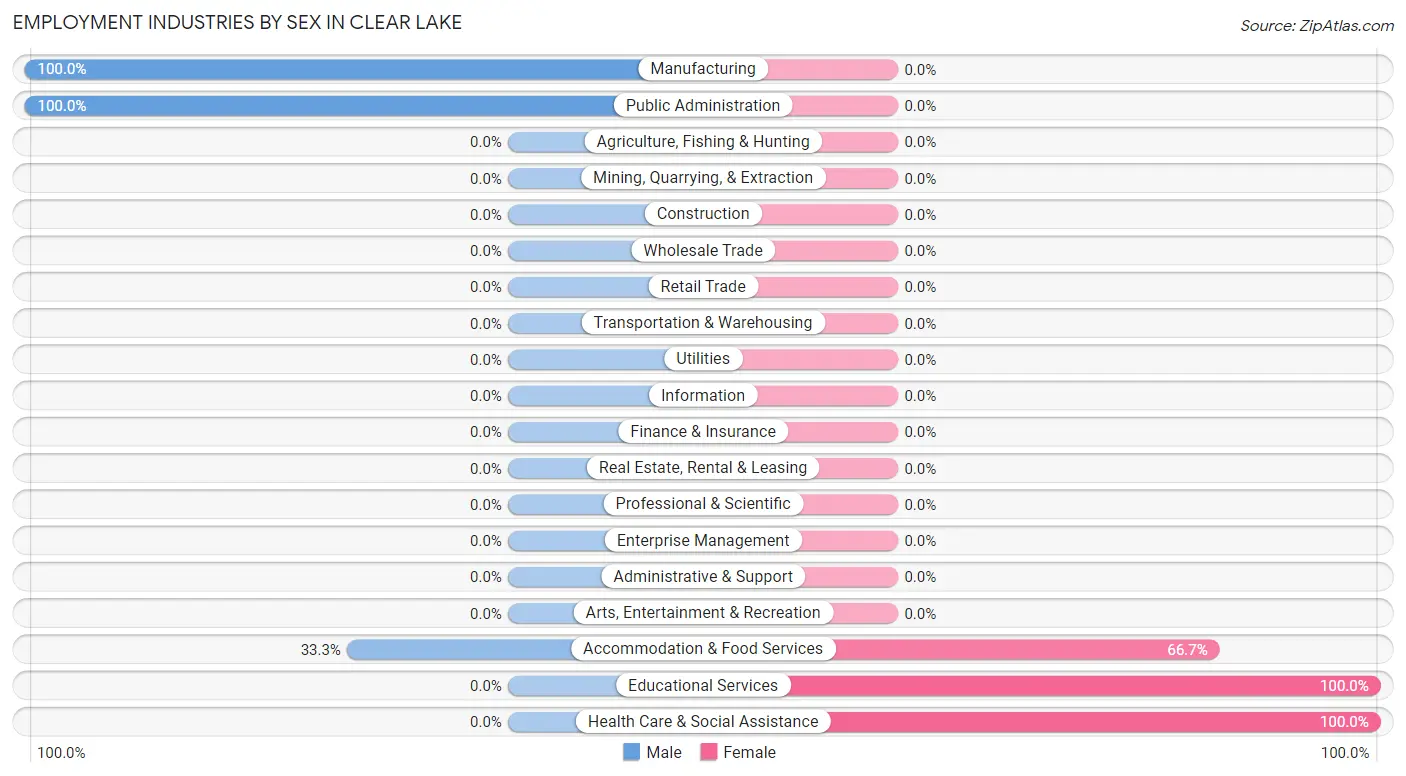
Employment Industries by Sex in Clear Lake
The Clear Lake industries that see more men than women are Manufacturing (100.0%), Public Administration (100.0%), and Accommodation & Food Services (33.3%), whereas the industries that tend to have a higher number of women are Educational Services (100.0%), Health Care & Social Assistance (100.0%), and Accommodation & Food Services (66.7%).
| Industry | Male | Female |
| Agriculture, Fishing & Hunting | 0 (0.0%) | 0 (0.0%) |
| Mining, Quarrying, & Extraction | 0 (0.0%) | 0 (0.0%) |
| Construction | 0 (0.0%) | 0 (0.0%) |
| Manufacturing | 2 (100.0%) | 0 (0.0%) |
| Wholesale Trade | 0 (0.0%) | 0 (0.0%) |
| Retail Trade | 0 (0.0%) | 0 (0.0%) |
| Transportation & Warehousing | 0 (0.0%) | 0 (0.0%) |
| Utilities | 0 (0.0%) | 0 (0.0%) |
| Information | 0 (0.0%) | 0 (0.0%) |
| Finance & Insurance | 0 (0.0%) | 0 (0.0%) |
| Real Estate, Rental & Leasing | 0 (0.0%) | 0 (0.0%) |
| Professional & Scientific | 0 (0.0%) | 0 (0.0%) |
| Enterprise Management | 0 (0.0%) | 0 (0.0%) |
| Administrative & Support | 0 (0.0%) | 0 (0.0%) |
| Educational Services | 0 (0.0%) | 10 (100.0%) |
| Health Care & Social Assistance | 0 (0.0%) | 8 (100.0%) |
| Arts, Entertainment & Recreation | 0 (0.0%) | 0 (0.0%) |
| Accommodation & Food Services | 1 (33.3%) | 2 (66.7%) |
| Public Administration | 1 (100.0%) | 0 (0.0%) |
| Total | 4 (16.7%) | 20 (83.3%) |
Education in Clear Lake
School Enrollment in Clear Lake
The most common levels of schooling among the 41 students in Clear Lake are middle school (25 | 61.0%), kindergarten (9 | 22.0%), and nursery / preschool (6 | 14.6%).
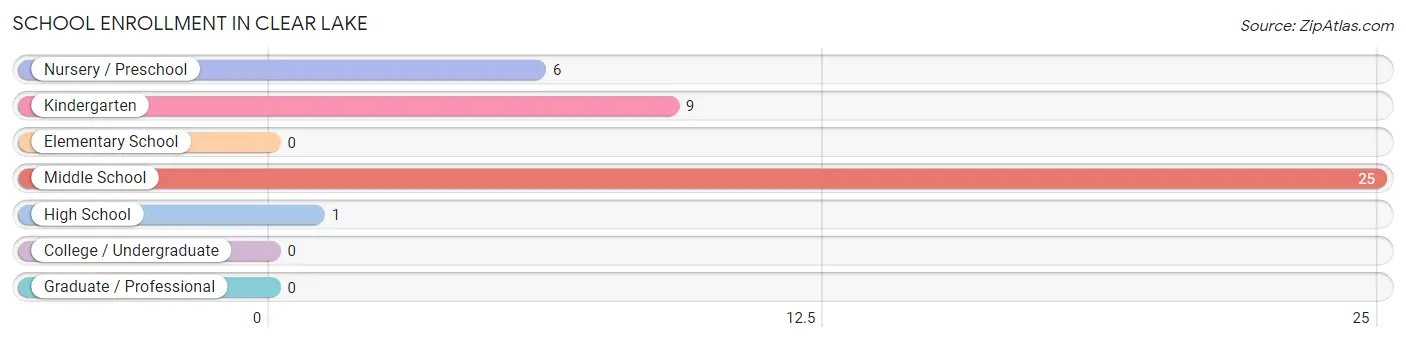
| School Level | # Students | % Students |
| Nursery / Preschool | 6 | 14.6% |
| Kindergarten | 9 | 22.0% |
| Elementary School | 0 | 0.0% |
| Middle School | 25 | 61.0% |
| High School | 1 | 2.4% |
| College / Undergraduate | 0 | 0.0% |
| Graduate / Professional | 0 | 0.0% |
| Total | 41 | 100.0% |
School Enrollment by Age by Funding Source in Clear Lake
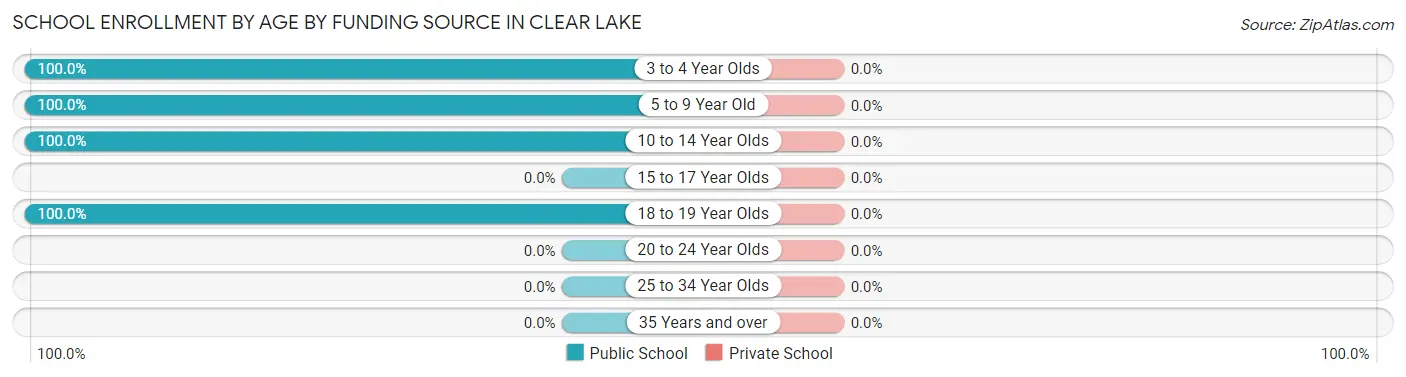
| Age Bracket | Public School | Private School |
| 3 to 4 Year Olds | 6 (100.0%) | 0 (0.0%) |
| 5 to 9 Year Old | 9 (100.0%) | 0 (0.0%) |
| 10 to 14 Year Olds | 25 (100.0%) | 0 (0.0%) |
| 15 to 17 Year Olds | 0 (0.0%) | 0 (0.0%) |
| 18 to 19 Year Olds | 1 (100.0%) | 0 (0.0%) |
| 20 to 24 Year Olds | 0 (0.0%) | 0 (0.0%) |
| 25 to 34 Year Olds | 0 (0.0%) | 0 (0.0%) |
| 35 Years and over | 0 (0.0%) | 0 (0.0%) |
| Total | 41 (100.0%) | 0 (0.0%) |
Educational Attainment by Field of Study in Clear Lake
, and education (20 | 100.0%) are the most common fields of study among 20 individuals in Clear Lake who have obtained a bachelor's degree or higher.
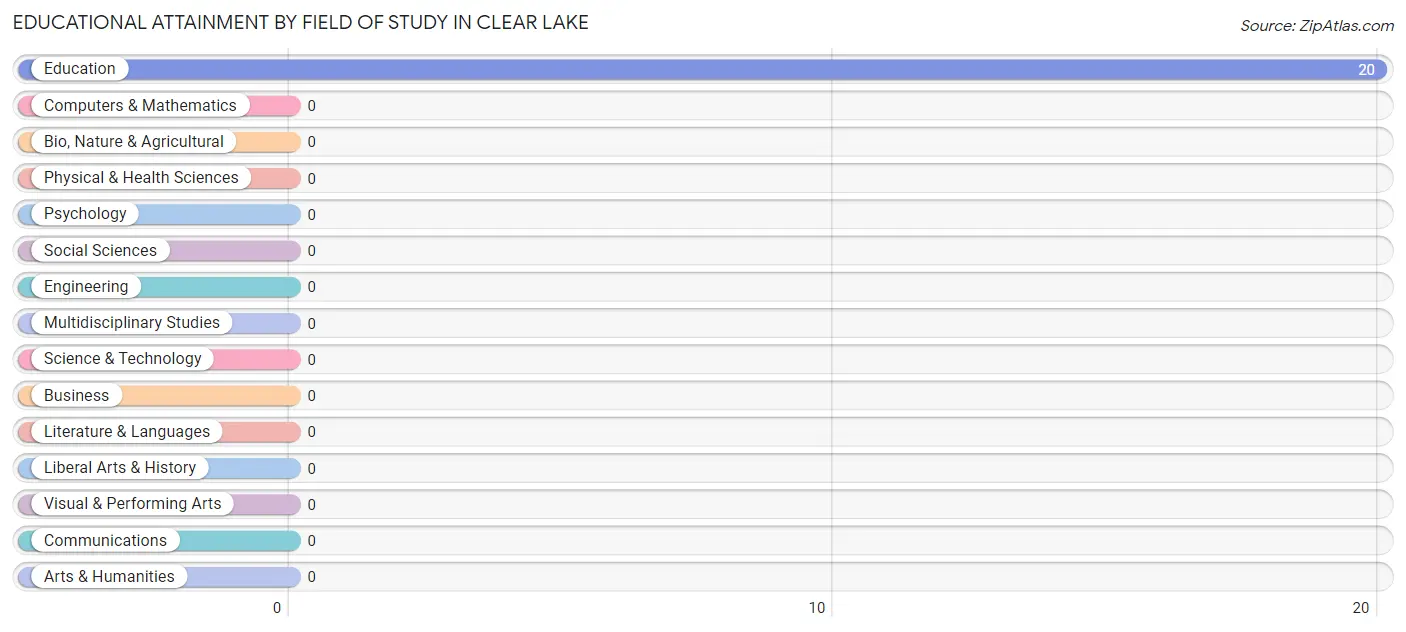
| Field of Study | # Graduates | % Graduates |
| Computers & Mathematics | 0 | 0.0% |
| Bio, Nature & Agricultural | 0 | 0.0% |
| Physical & Health Sciences | 0 | 0.0% |
| Psychology | 0 | 0.0% |
| Social Sciences | 0 | 0.0% |
| Engineering | 0 | 0.0% |
| Multidisciplinary Studies | 0 | 0.0% |
| Science & Technology | 0 | 0.0% |
| Business | 0 | 0.0% |
| Education | 20 | 100.0% |
| Literature & Languages | 0 | 0.0% |
| Liberal Arts & History | 0 | 0.0% |
| Visual & Performing Arts | 0 | 0.0% |
| Communications | 0 | 0.0% |
| Arts & Humanities | 0 | 0.0% |
| Total | 20 | 100.0% |
Transportation & Commute in Clear Lake
Vehicle Availability by Sex in Clear Lake
The most prevalent vehicle ownership categories in Clear Lake are males with 1 vehicle (2, accounting for 100.0%) and females with 1 vehicle (0, making up 11.1%).
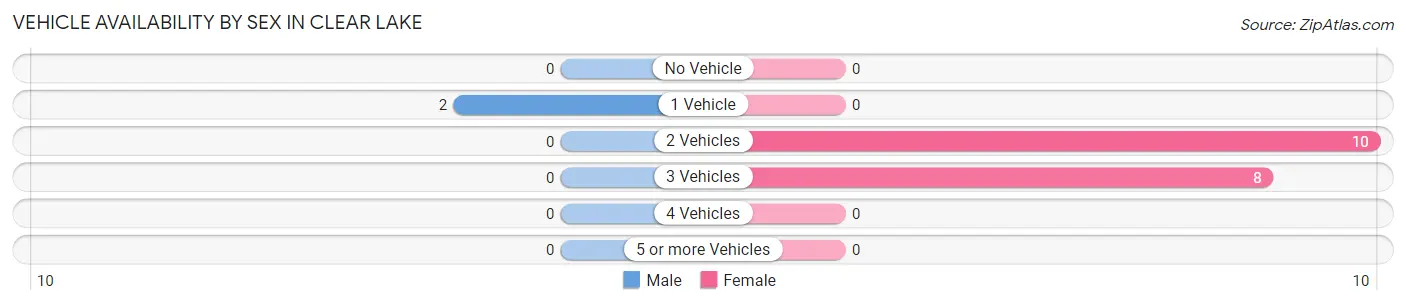
| Vehicles Available | Male | Female |
| No Vehicle | 0 (0.0%) | 0 (0.0%) |
| 1 Vehicle | 2 (100.0%) | 0 (0.0%) |
| 2 Vehicles | 0 (0.0%) | 10 (55.6%) |
| 3 Vehicles | 0 (0.0%) | 8 (44.4%) |
| 4 Vehicles | 0 (0.0%) | 0 (0.0%) |
| 5 or more Vehicles | 0 (0.0%) | 0 (0.0%) |
| Total | 2 (100.0%) | 18 (100.0%) |
Commute Time in Clear Lake
The most frequently occuring commute durations in Clear Lake are 25 to 29 minutes (18 commuters, 75.0%), 20 to 24 minutes (2 commuters, 8.3%), and 30 to 34 minutes (2 commuters, 8.3%).
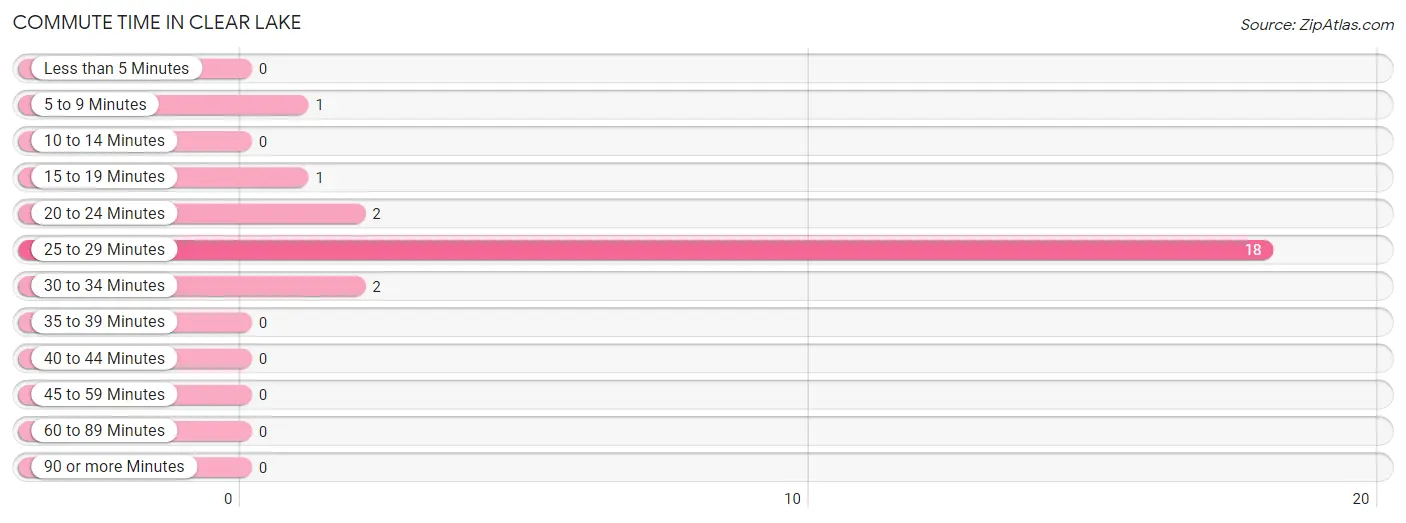
| Commute Time | # Commuters | % Commuters |
| Less than 5 Minutes | 0 | 0.0% |
| 5 to 9 Minutes | 1 | 4.2% |
| 10 to 14 Minutes | 0 | 0.0% |
| 15 to 19 Minutes | 1 | 4.2% |
| 20 to 24 Minutes | 2 | 8.3% |
| 25 to 29 Minutes | 18 | 75.0% |
| 30 to 34 Minutes | 2 | 8.3% |
| 35 to 39 Minutes | 0 | 0.0% |
| 40 to 44 Minutes | 0 | 0.0% |
| 45 to 59 Minutes | 0 | 0.0% |
| 60 to 89 Minutes | 0 | 0.0% |
| 90 or more Minutes | 0 | 0.0% |
Commute Time by Sex in Clear Lake
The most common commute times in Clear Lake are 20 to 24 minutes (2 commuters, 50.0%) for males and 25 to 29 minutes (18 commuters, 90.0%) for females.
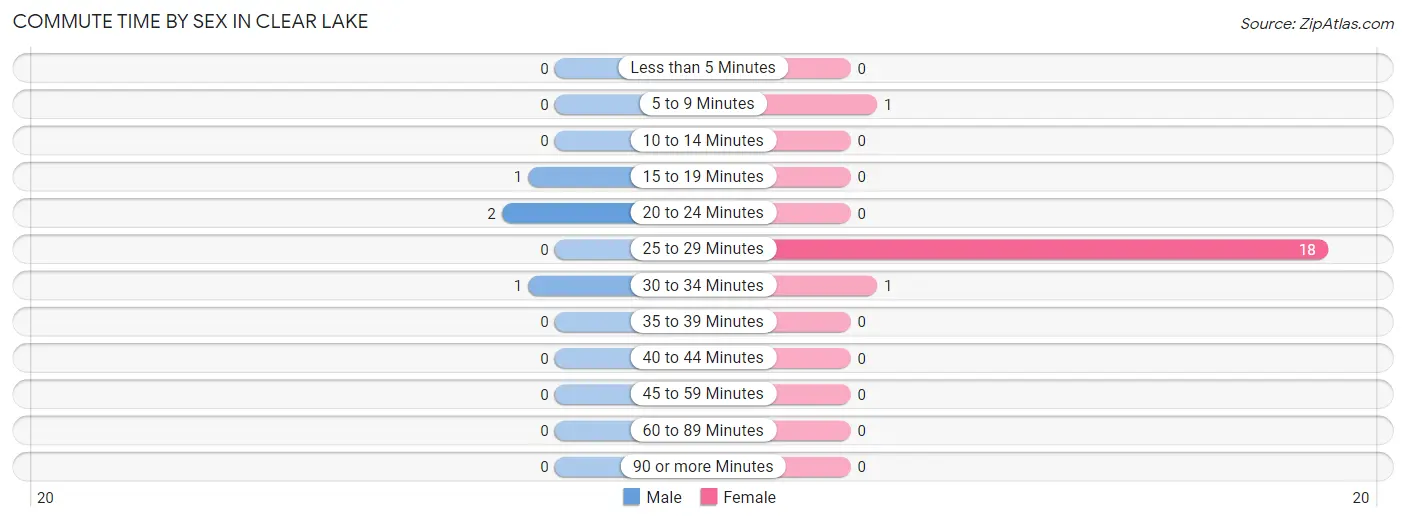
| Commute Time | Male | Female |
| Less than 5 Minutes | 0 (0.0%) | 0 (0.0%) |
| 5 to 9 Minutes | 0 (0.0%) | 1 (5.0%) |
| 10 to 14 Minutes | 0 (0.0%) | 0 (0.0%) |
| 15 to 19 Minutes | 1 (25.0%) | 0 (0.0%) |
| 20 to 24 Minutes | 2 (50.0%) | 0 (0.0%) |
| 25 to 29 Minutes | 0 (0.0%) | 18 (90.0%) |
| 30 to 34 Minutes | 1 (25.0%) | 1 (5.0%) |
| 35 to 39 Minutes | 0 (0.0%) | 0 (0.0%) |
| 40 to 44 Minutes | 0 (0.0%) | 0 (0.0%) |
| 45 to 59 Minutes | 0 (0.0%) | 0 (0.0%) |
| 60 to 89 Minutes | 0 (0.0%) | 0 (0.0%) |
| 90 or more Minutes | 0 (0.0%) | 0 (0.0%) |
Time of Departure to Work by Sex in Clear Lake
The most frequent times of departure to work in Clear Lake are 6:00 AM to 6:29 AM (2, 50.0%) for males and 7:30 AM to 7:59 AM (19, 95.0%) for females.
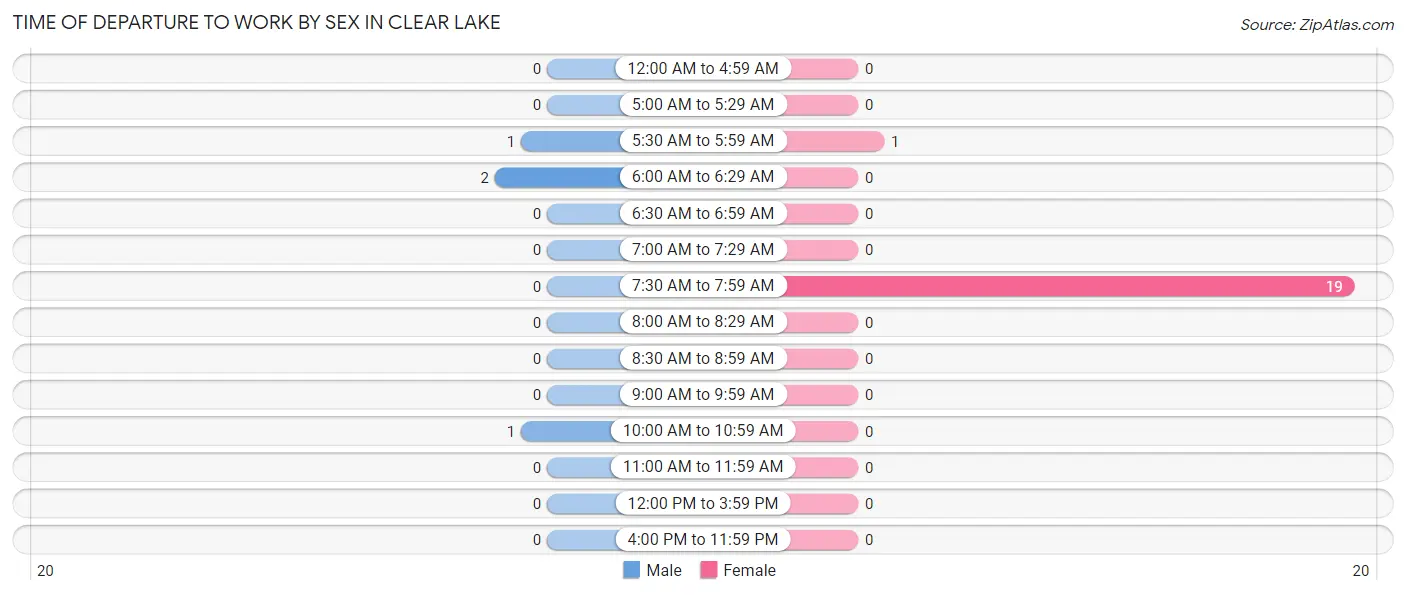
| Time of Departure | Male | Female |
| 12:00 AM to 4:59 AM | 0 (0.0%) | 0 (0.0%) |
| 5:00 AM to 5:29 AM | 0 (0.0%) | 0 (0.0%) |
| 5:30 AM to 5:59 AM | 1 (25.0%) | 1 (5.0%) |
| 6:00 AM to 6:29 AM | 2 (50.0%) | 0 (0.0%) |
| 6:30 AM to 6:59 AM | 0 (0.0%) | 0 (0.0%) |
| 7:00 AM to 7:29 AM | 0 (0.0%) | 0 (0.0%) |
| 7:30 AM to 7:59 AM | 0 (0.0%) | 19 (95.0%) |
| 8:00 AM to 8:29 AM | 0 (0.0%) | 0 (0.0%) |
| 8:30 AM to 8:59 AM | 0 (0.0%) | 0 (0.0%) |
| 9:00 AM to 9:59 AM | 0 (0.0%) | 0 (0.0%) |
| 10:00 AM to 10:59 AM | 1 (25.0%) | 0 (0.0%) |
| 11:00 AM to 11:59 AM | 0 (0.0%) | 0 (0.0%) |
| 12:00 PM to 3:59 PM | 0 (0.0%) | 0 (0.0%) |
| 4:00 PM to 11:59 PM | 0 (0.0%) | 0 (0.0%) |
| Total | 4 (100.0%) | 20 (100.0%) |
Housing Occupancy in Clear Lake
Occupancy by Ownership in Clear Lake
Of the total 560 dwellings in Clear Lake, owner-occupied units account for 405 (72.3%), while renter-occupied units make up 155 (27.7%).
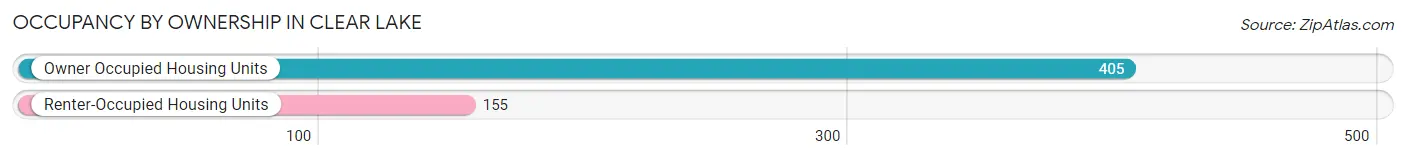
| Occupancy | # Housing Units | % Housing Units |
| Owner Occupied Housing Units | 405 | 72.3% |
| Renter-Occupied Housing Units | 155 | 27.7% |
| Total Occupied Housing Units | 560 | 100.0% |
Occupancy by Household Size in Clear Lake
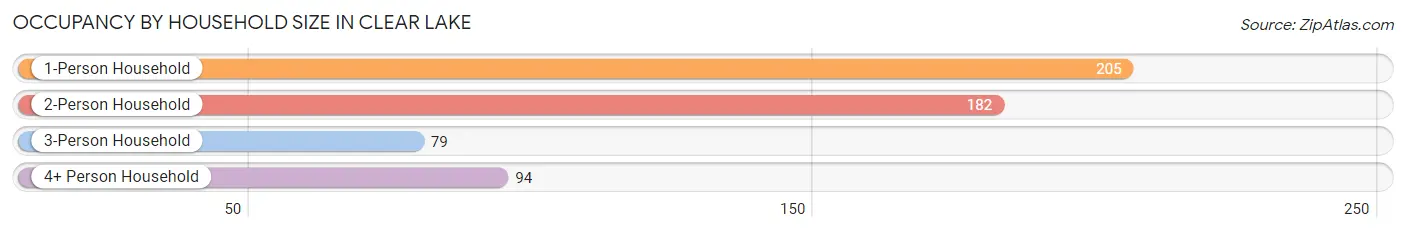
| Household Size | # Housing Units | % Housing Units |
| 1-Person Household | 205 | 36.6% |
| 2-Person Household | 182 | 32.5% |
| 3-Person Household | 79 | 14.1% |
| 4+ Person Household | 94 | 16.8% |
| Total Housing Units | 560 | 100.0% |
Occupancy by Ownership by Household Size in Clear Lake
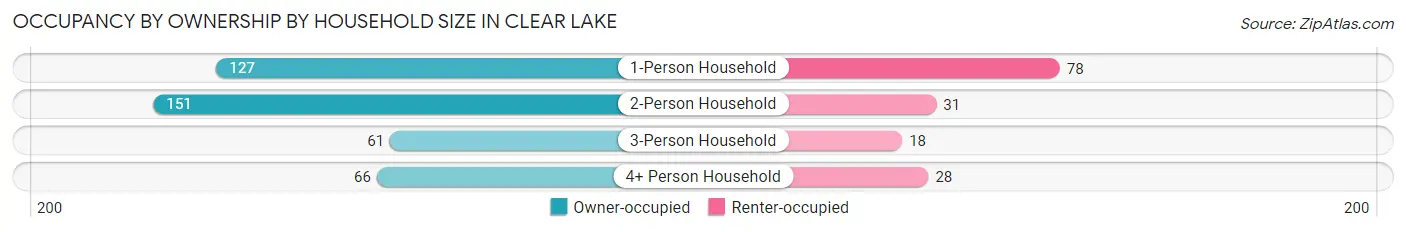
| Household Size | Owner-occupied | Renter-occupied |
| 1-Person Household | 127 (62.0%) | 78 (38.1%) |
| 2-Person Household | 151 (83.0%) | 31 (17.0%) |
| 3-Person Household | 61 (77.2%) | 18 (22.8%) |
| 4+ Person Household | 66 (70.2%) | 28 (29.8%) |
| Total Housing Units | 405 (72.3%) | 155 (27.7%) |
Occupancy by Educational Attainment in Clear Lake
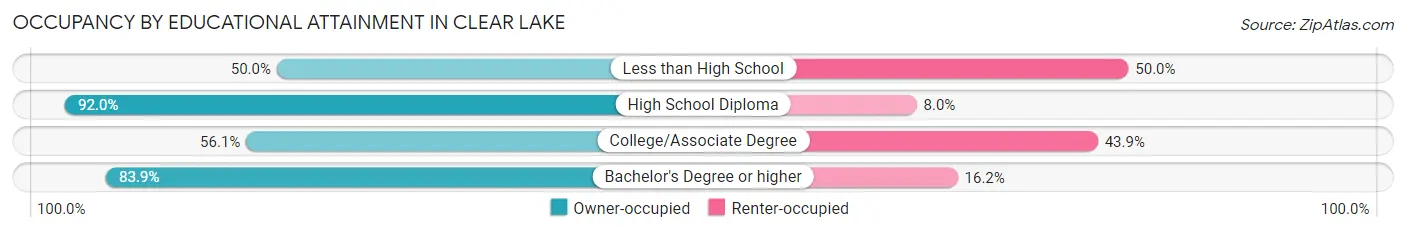
| Household Size | Owner-occupied | Renter-occupied |
| Less than High School | 27 (50.0%) | 27 (50.0%) |
| High School Diploma | 149 (92.0%) | 13 (8.0%) |
| College/Associate Degree | 120 (56.1%) | 94 (43.9%) |
| Bachelor's Degree or higher | 109 (83.9%) | 21 (16.2%) |
Occupancy by Age of Householder in Clear Lake
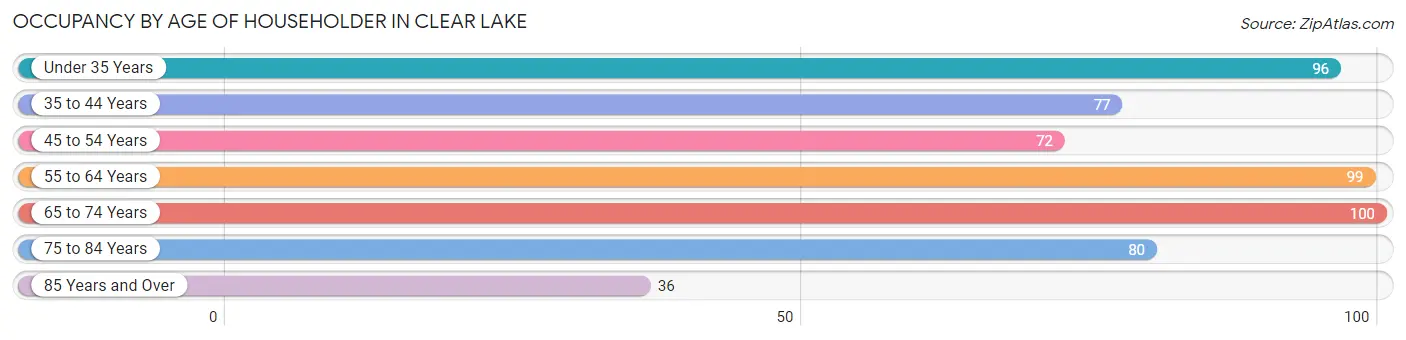
| Age Bracket | # Households | % Households |
| Under 35 Years | 96 | 17.1% |
| 35 to 44 Years | 77 | 13.8% |
| 45 to 54 Years | 72 | 12.9% |
| 55 to 64 Years | 99 | 17.7% |
| 65 to 74 Years | 100 | 17.9% |
| 75 to 84 Years | 80 | 14.3% |
| 85 Years and Over | 36 | 6.4% |
| Total | 560 | 100.0% |
Housing Finances in Clear Lake
Median Income by Occupancy in Clear Lake
| Occupancy Type | # Households | Median Income |
| Owner-Occupied | 12 (37.5%) | $0 |
| Renter-Occupied | 20 (62.5%) | $0 |
| Average | 32 (100.0%) | $0 |
Occupancy by Householder Income Bracket in Clear Lake
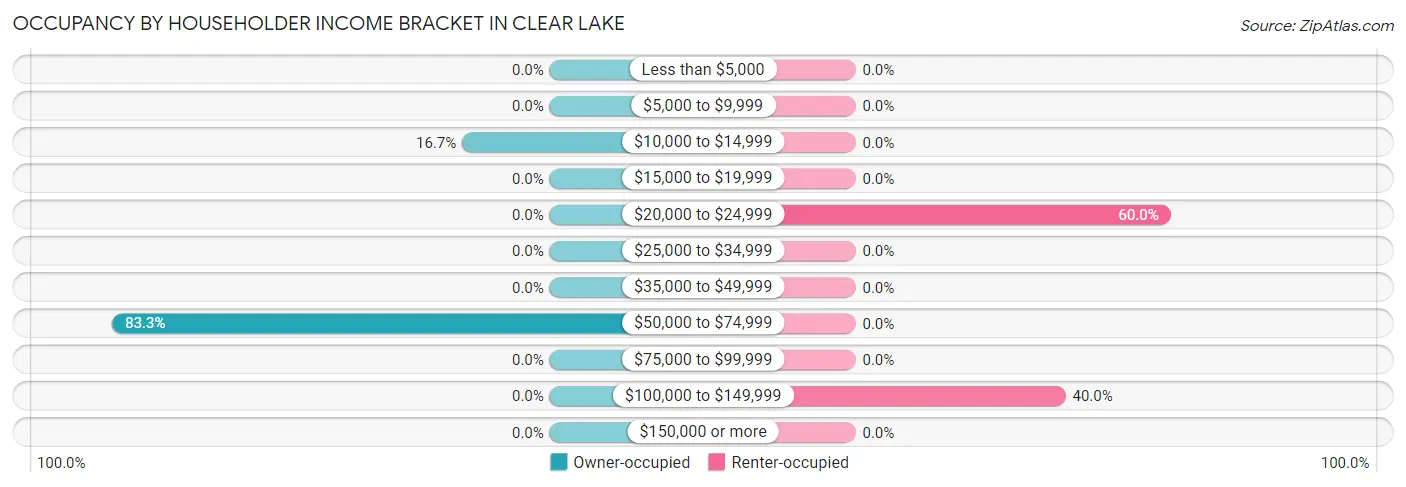
| Income Bracket | Owner-occupied | Renter-occupied |
| Less than $5,000 | 0 (0.0%) | 0 (0.0%) |
| $5,000 to $9,999 | 0 (0.0%) | 0 (0.0%) |
| $10,000 to $14,999 | 2 (16.7%) | 0 (0.0%) |
| $15,000 to $19,999 | 0 (0.0%) | 0 (0.0%) |
| $20,000 to $24,999 | 0 (0.0%) | 12 (60.0%) |
| $25,000 to $34,999 | 0 (0.0%) | 0 (0.0%) |
| $35,000 to $49,999 | 0 (0.0%) | 0 (0.0%) |
| $50,000 to $74,999 | 10 (83.3%) | 0 (0.0%) |
| $75,000 to $99,999 | 0 (0.0%) | 0 (0.0%) |
| $100,000 to $149,999 | 0 (0.0%) | 8 (40.0%) |
| $150,000 or more | 0 (0.0%) | 0 (0.0%) |
| Total | 12 (100.0%) | 20 (100.0%) |
Monthly Housing Cost Tiers in Clear Lake
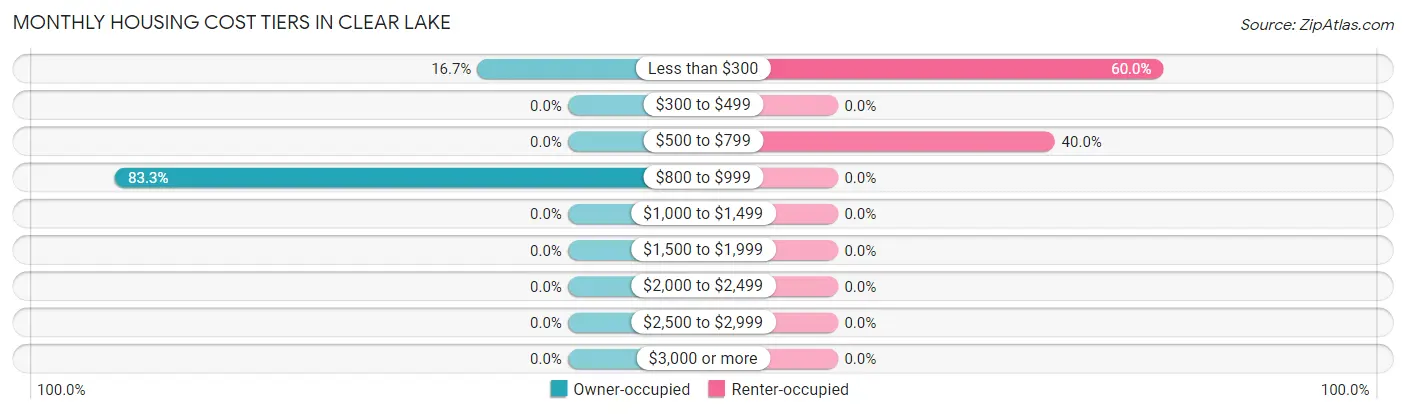
| Monthly Cost | Owner-occupied | Renter-occupied |
| Less than $300 | 2 (16.7%) | 12 (60.0%) |
| $300 to $499 | 0 (0.0%) | 0 (0.0%) |
| $500 to $799 | 0 (0.0%) | 8 (40.0%) |
| $800 to $999 | 10 (83.3%) | 0 (0.0%) |
| $1,000 to $1,499 | 0 (0.0%) | 0 (0.0%) |
| $1,500 to $1,999 | 0 (0.0%) | 0 (0.0%) |
| $2,000 to $2,499 | 0 (0.0%) | 0 (0.0%) |
| $2,500 to $2,999 | 0 (0.0%) | 0 (0.0%) |
| $3,000 or more | 0 (0.0%) | 0 (0.0%) |
| Total | 12 (100.0%) | 20 (100.0%) |
Physical Housing Characteristics in Clear Lake
Housing Structures in Clear Lake
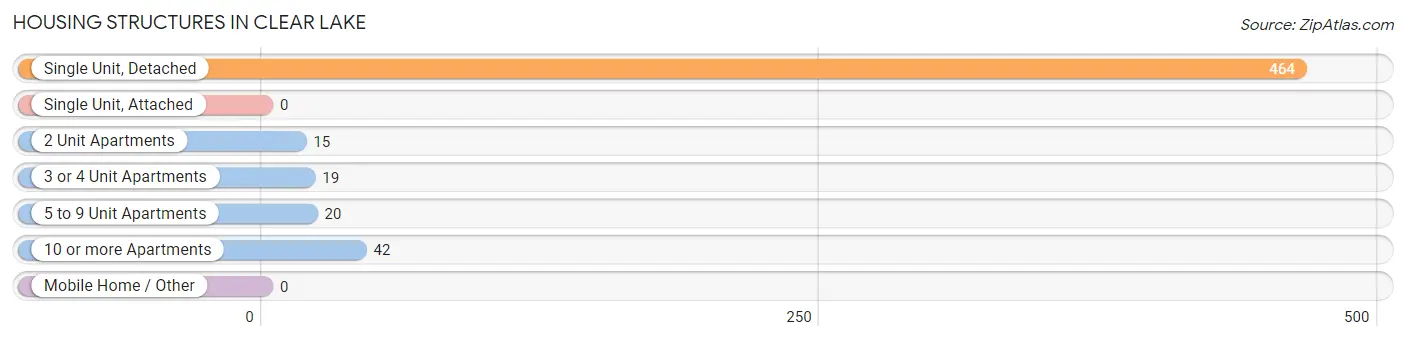
| Structure Type | # Housing Units | % Housing Units |
| Single Unit, Detached | 464 | 82.9% |
| Single Unit, Attached | 0 | 0.0% |
| 2 Unit Apartments | 15 | 2.7% |
| 3 or 4 Unit Apartments | 19 | 3.4% |
| 5 to 9 Unit Apartments | 20 | 3.6% |
| 10 or more Apartments | 42 | 7.5% |
| Mobile Home / Other | 0 | 0.0% |
| Total | 560 | 100.0% |
Housing Structures by Occupancy in Clear Lake
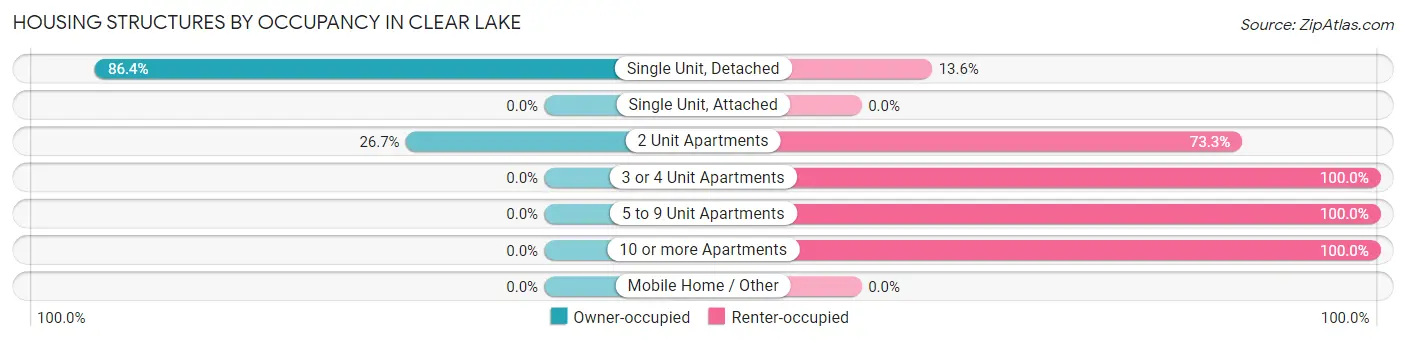
| Structure Type | Owner-occupied | Renter-occupied |
| Single Unit, Detached | 401 (86.4%) | 63 (13.6%) |
| Single Unit, Attached | 0 (0.0%) | 0 (0.0%) |
| 2 Unit Apartments | 4 (26.7%) | 11 (73.3%) |
| 3 or 4 Unit Apartments | 0 (0.0%) | 19 (100.0%) |
| 5 to 9 Unit Apartments | 0 (0.0%) | 20 (100.0%) |
| 10 or more Apartments | 0 (0.0%) | 42 (100.0%) |
| Mobile Home / Other | 0 (0.0%) | 0 (0.0%) |
| Total | 405 (72.3%) | 155 (27.7%) |
Housing Structures by Number of Rooms in Clear Lake
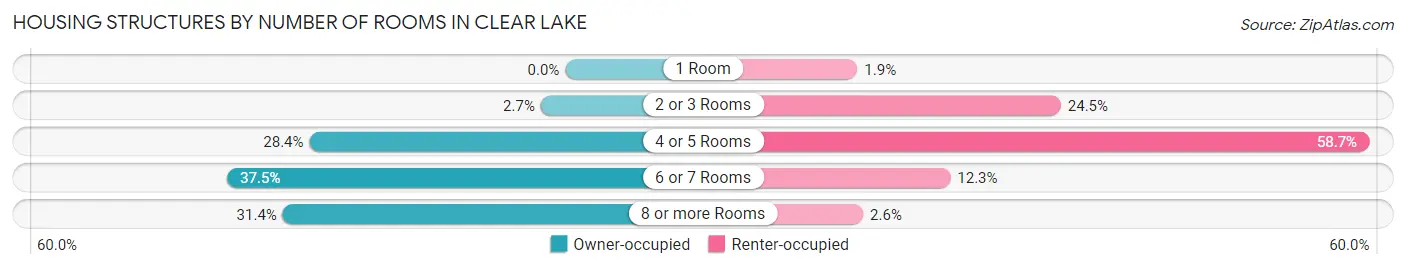
| Number of Rooms | Owner-occupied | Renter-occupied |
| 1 Room | 0 (0.0%) | 3 (1.9%) |
| 2 or 3 Rooms | 11 (2.7%) | 38 (24.5%) |
| 4 or 5 Rooms | 115 (28.4%) | 91 (58.7%) |
| 6 or 7 Rooms | 152 (37.5%) | 19 (12.3%) |
| 8 or more Rooms | 127 (31.4%) | 4 (2.6%) |
| Total | 405 (100.0%) | 155 (100.0%) |
Housing Structure by Heating Type in Clear Lake
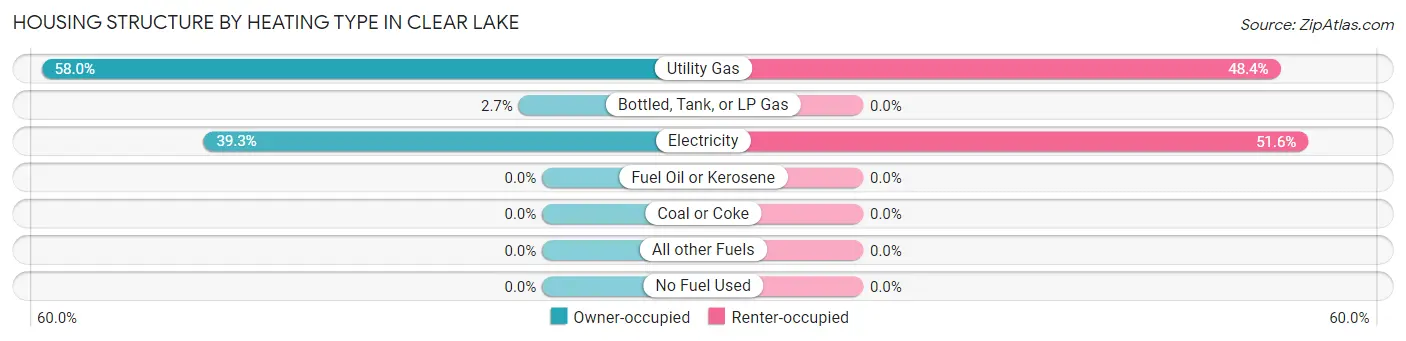
| Heating Type | Owner-occupied | Renter-occupied |
| Utility Gas | 235 (58.0%) | 75 (48.4%) |
| Bottled, Tank, or LP Gas | 11 (2.7%) | 0 (0.0%) |
| Electricity | 159 (39.3%) | 80 (51.6%) |
| Fuel Oil or Kerosene | 0 (0.0%) | 0 (0.0%) |
| Coal or Coke | 0 (0.0%) | 0 (0.0%) |
| All other Fuels | 0 (0.0%) | 0 (0.0%) |
| No Fuel Used | 0 (0.0%) | 0 (0.0%) |
| Total | 405 (100.0%) | 155 (100.0%) |
Household Vehicle Usage in Clear Lake
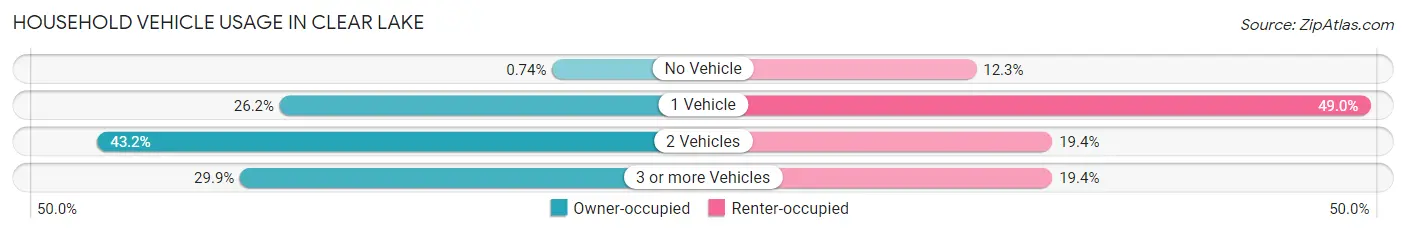
| Vehicles per Household | Owner-occupied | Renter-occupied |
| No Vehicle | 3 (0.7%) | 19 (12.3%) |
| 1 Vehicle | 106 (26.2%) | 76 (49.0%) |
| 2 Vehicles | 175 (43.2%) | 30 (19.4%) |
| 3 or more Vehicles | 121 (29.9%) | 30 (19.4%) |
| Total | 405 (100.0%) | 155 (100.0%) |
Real Estate & Mortgages in Clear Lake
Real Estate and Mortgage Overview in Clear Lake
| Characteristic | Without Mortgage | With Mortgage |
| Housing Units | 185 | 0 |
| Median Property Value | $162,000 | $0 |
| Median Household Income | $63,542 | $0 |
| Monthly Housing Costs | $520 | $0 |
| Real Estate Taxes | $1,969 | $0 |
Property Value by Mortgage Status in Clear Lake
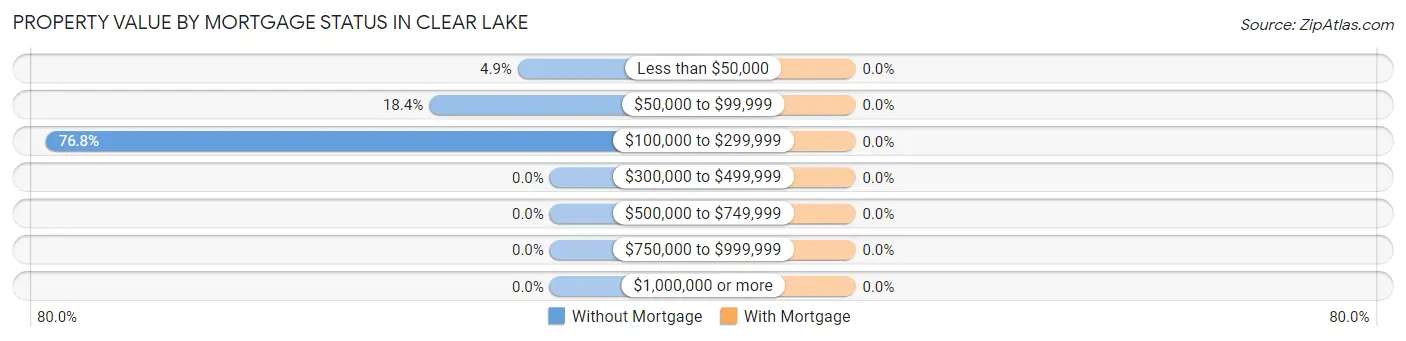
| Property Value | Without Mortgage | With Mortgage |
| Less than $50,000 | 9 (4.9%) | 0 (0.0%) |
| $50,000 to $99,999 | 34 (18.4%) | 0 (0.0%) |
| $100,000 to $299,999 | 142 (76.8%) | 0 (0.0%) |
| $300,000 to $499,999 | 0 (0.0%) | 0 (0.0%) |
| $500,000 to $749,999 | 0 (0.0%) | 0 (0.0%) |
| $750,000 to $999,999 | 0 (0.0%) | 0 (0.0%) |
| $1,000,000 or more | 0 (0.0%) | 0 (0.0%) |
| Total | 185 (100.0%) | 0 (0.0%) |
Household Income by Mortgage Status in Clear Lake
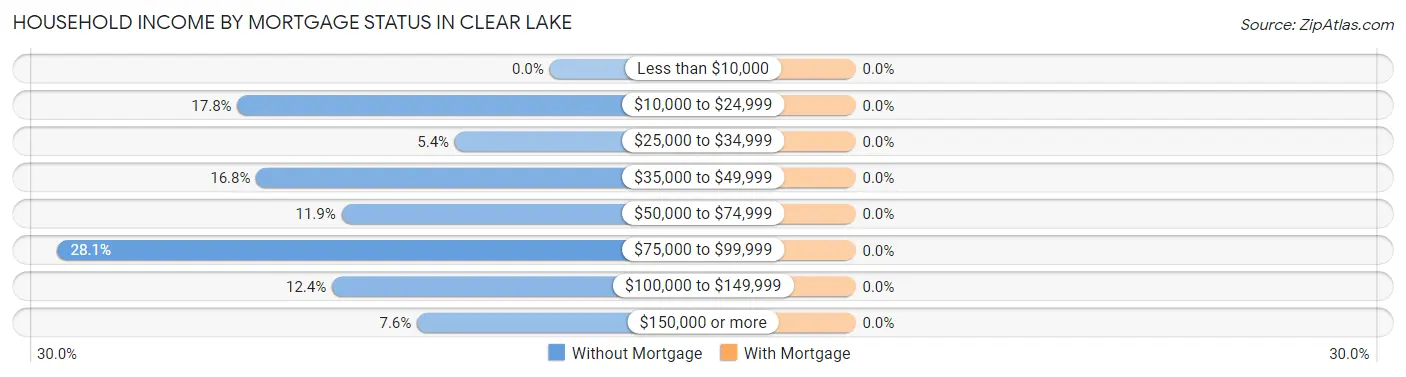
| Household Income | Without Mortgage | With Mortgage |
| Less than $10,000 | 0 (0.0%) | 0 (0.0%) |
| $10,000 to $24,999 | 33 (17.8%) | 0 (0.0%) |
| $25,000 to $34,999 | 10 (5.4%) | 0 (0.0%) |
| $35,000 to $49,999 | 31 (16.8%) | 0 (0.0%) |
| $50,000 to $74,999 | 22 (11.9%) | 0 (0.0%) |
| $75,000 to $99,999 | 52 (28.1%) | 0 (0.0%) |
| $100,000 to $149,999 | 23 (12.4%) | 0 (0.0%) |
| $150,000 or more | 14 (7.6%) | 0 (0.0%) |
| Total | 185 (100.0%) | 0 (0.0%) |
Property Value to Household Income Ratio in Clear Lake
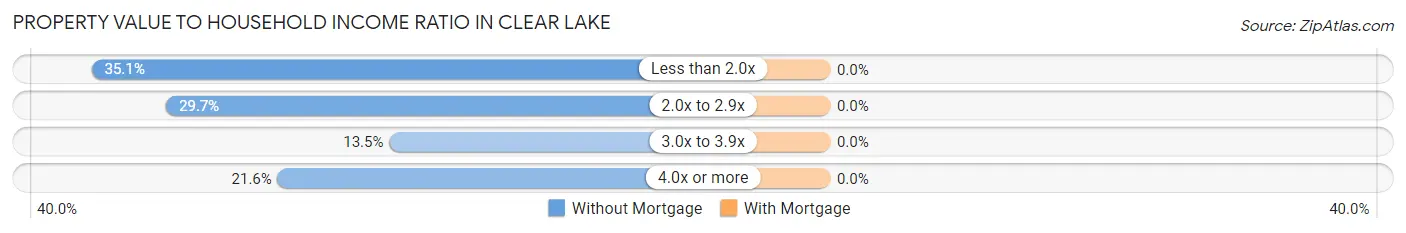
| Value-to-Income Ratio | Without Mortgage | With Mortgage |
| Less than 2.0x | 65 (35.1%) | 0 (0.0%) |
| 2.0x to 2.9x | 55 (29.7%) | 0 (0.0%) |
| 3.0x to 3.9x | 25 (13.5%) | 0 (0.0%) |
| 4.0x or more | 40 (21.6%) | 0 (0.0%) |
| Total | 185 (100.0%) | 0 (0.0%) |
Real Estate Taxes by Mortgage Status in Clear Lake
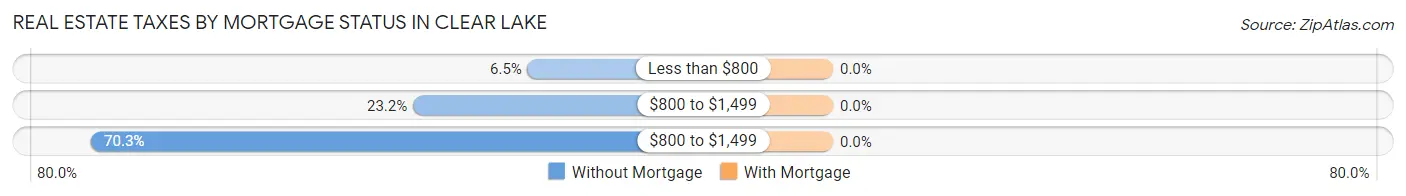
| Property Taxes | Without Mortgage | With Mortgage |
| Less than $800 | 12 (6.5%) | 0 (0.0%) |
| $800 to $1,499 | 43 (23.2%) | 0 (0.0%) |
| $800 to $1,499 | 130 (70.3%) | 0 (0.0%) |
| Total | 185 (100.0%) | 0 (0.0%) |
Health & Disability in Clear Lake
Health Insurance Coverage by Age in Clear Lake
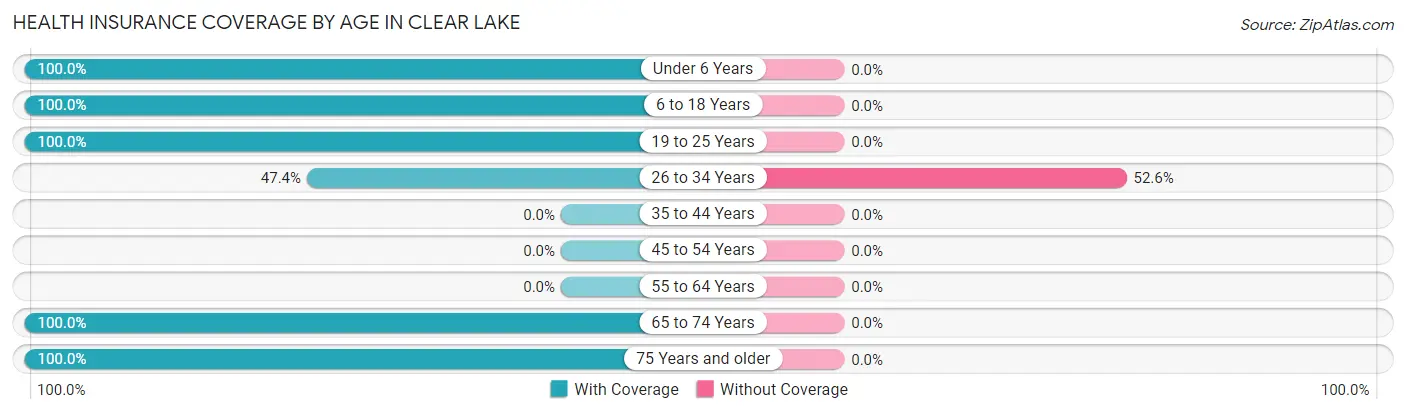
| Age Bracket | With Coverage | Without Coverage |
| Under 6 Years | 11 (100.0%) | 0 (0.0%) |
| 6 to 18 Years | 35 (100.0%) | 0 (0.0%) |
| 19 to 25 Years | 1 (100.0%) | 0 (0.0%) |
| 26 to 34 Years | 9 (47.4%) | 10 (52.6%) |
| 35 to 44 Years | 0 (0.0%) | 0 (0.0%) |
| 45 to 54 Years | 0 (0.0%) | 0 (0.0%) |
| 55 to 64 Years | 0 (0.0%) | 0 (0.0%) |
| 65 to 74 Years | 24 (100.0%) | 0 (0.0%) |
| 75 Years and older | 10 (100.0%) | 0 (0.0%) |
| Total | 90 (90.0%) | 10 (10.0%) |
Health Insurance Coverage by Citizenship Status in Clear Lake
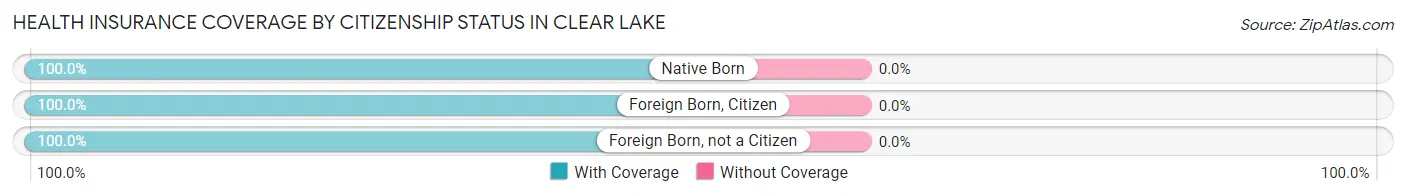
| Citizenship Status | With Coverage | Without Coverage |
| Native Born | 11 (100.0%) | 0 (0.0%) |
| Foreign Born, Citizen | 35 (100.0%) | 0 (0.0%) |
| Foreign Born, not a Citizen | 1 (100.0%) | 0 (0.0%) |
Health Insurance Coverage by Household Income in Clear Lake
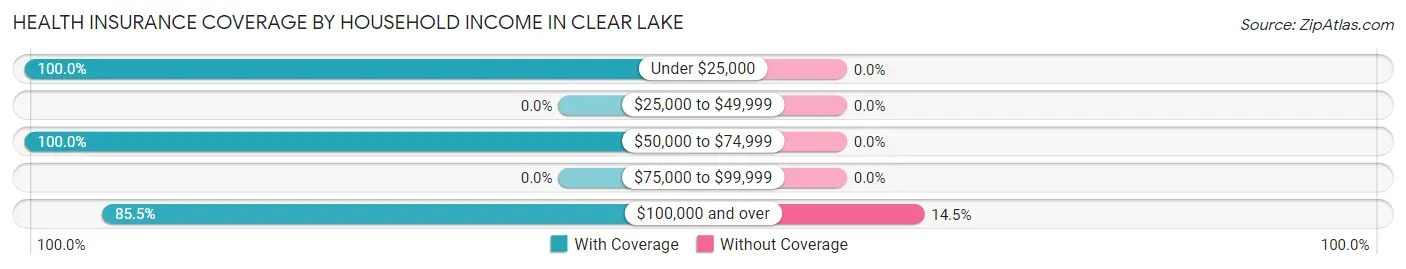
| Household Income | With Coverage | Without Coverage |
| Under $25,000 | 14 (100.0%) | 0 (0.0%) |
| $25,000 to $49,999 | 0 (0.0%) | 0 (0.0%) |
| $50,000 to $74,999 | 20 (100.0%) | 0 (0.0%) |
| $75,000 to $99,999 | 0 (0.0%) | 0 (0.0%) |
| $100,000 and over | 53 (85.5%) | 9 (14.5%) |
Public vs Private Health Insurance Coverage by Age in Clear Lake
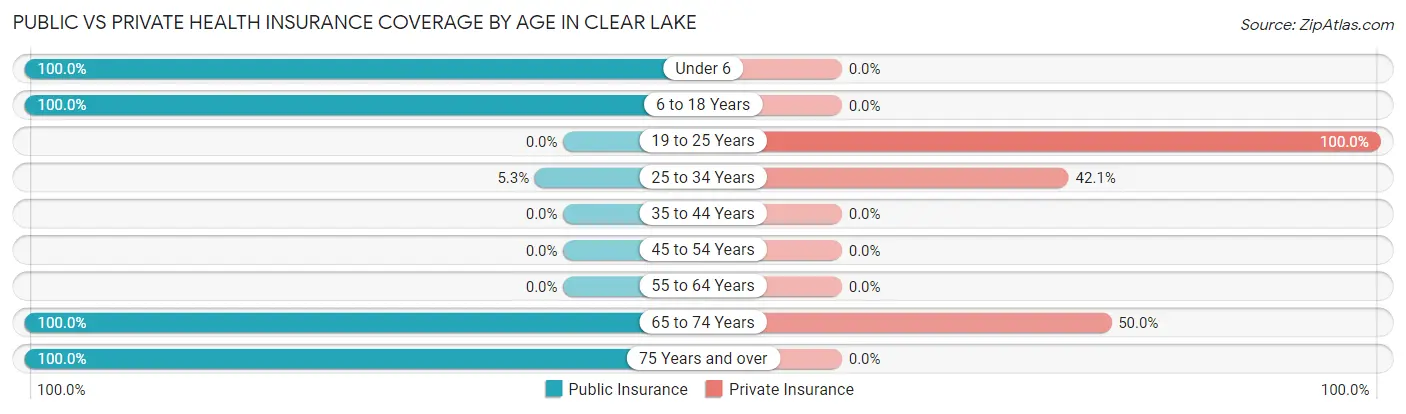
| Age Bracket | Public Insurance | Private Insurance |
| Under 6 | 11 (100.0%) | 0 (0.0%) |
| 6 to 18 Years | 35 (100.0%) | 0 (0.0%) |
| 19 to 25 Years | 0 (0.0%) | 1 (100.0%) |
| 25 to 34 Years | 1 (5.3%) | 8 (42.1%) |
| 35 to 44 Years | 0 (0.0%) | 0 (0.0%) |
| 45 to 54 Years | 0 (0.0%) | 0 (0.0%) |
| 55 to 64 Years | 0 (0.0%) | 0 (0.0%) |
| 65 to 74 Years | 24 (100.0%) | 12 (50.0%) |
| 75 Years and over | 10 (100.0%) | 0 (0.0%) |
| Total | 81 (81.0%) | 21 (21.0%) |
Disability Status by Sex by Age in Clear Lake
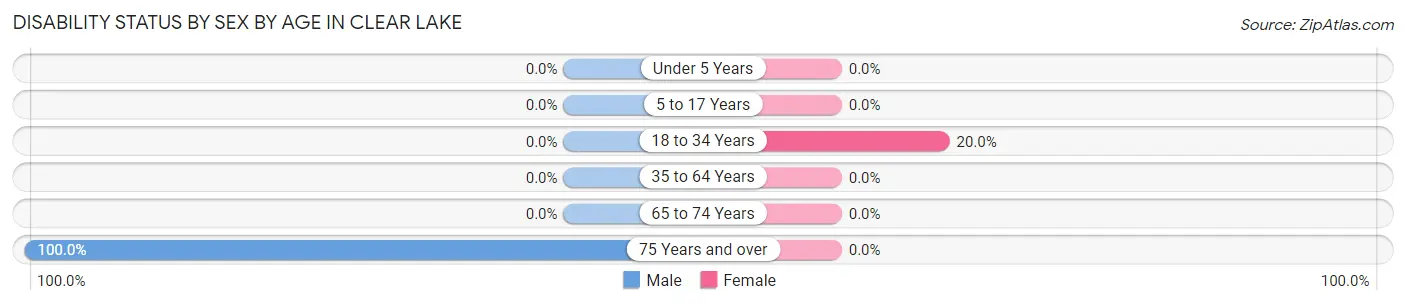
| Age Bracket | Male | Female |
| Under 5 Years | 0 (0.0%) | 0 (0.0%) |
| 5 to 17 Years | 0 (0.0%) | 0 (0.0%) |
| 18 to 34 Years | 0 (0.0%) | 2 (20.0%) |
| 35 to 64 Years | 0 (0.0%) | 0 (0.0%) |
| 65 to 74 Years | 0 (0.0%) | 0 (0.0%) |
| 75 Years and over | 10 (100.0%) | 0 (0.0%) |
Disability Class by Sex by Age in Clear Lake
Disability Class: Hearing Difficulty
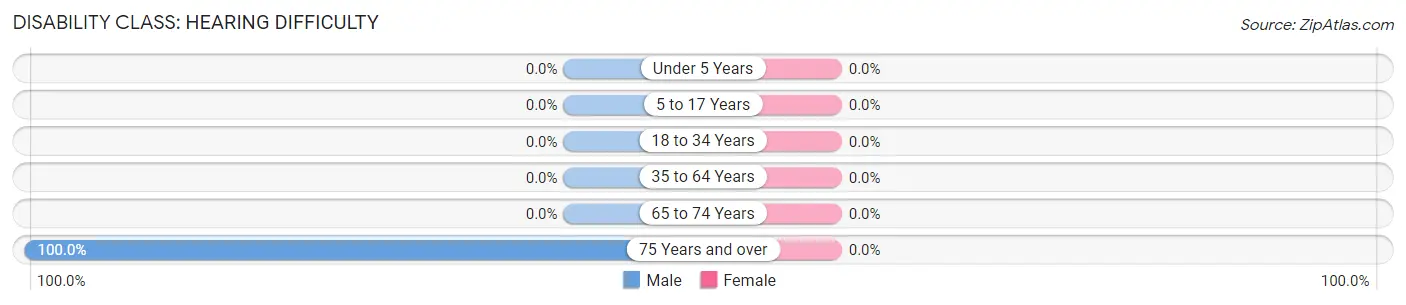
| Age Bracket | Male | Female |
| Under 5 Years | 0 (0.0%) | 0 (0.0%) |
| 5 to 17 Years | 0 (0.0%) | 0 (0.0%) |
| 18 to 34 Years | 0 (0.0%) | 0 (0.0%) |
| 35 to 64 Years | 0 (0.0%) | 0 (0.0%) |
| 65 to 74 Years | 0 (0.0%) | 0 (0.0%) |
| 75 Years and over | 10 (100.0%) | 0 (0.0%) |
Disability Class: Vision Difficulty
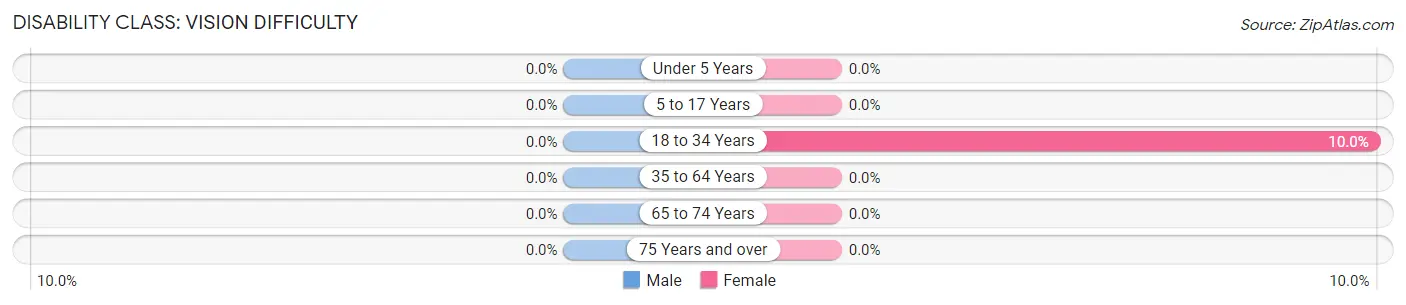
| Age Bracket | Male | Female |
| Under 5 Years | 0 (0.0%) | 0 (0.0%) |
| 5 to 17 Years | 0 (0.0%) | 0 (0.0%) |
| 18 to 34 Years | 0 (0.0%) | 1 (10.0%) |
| 35 to 64 Years | 0 (0.0%) | 0 (0.0%) |
| 65 to 74 Years | 0 (0.0%) | 0 (0.0%) |
| 75 Years and over | 0 (0.0%) | 0 (0.0%) |
Disability Class: Cognitive Difficulty
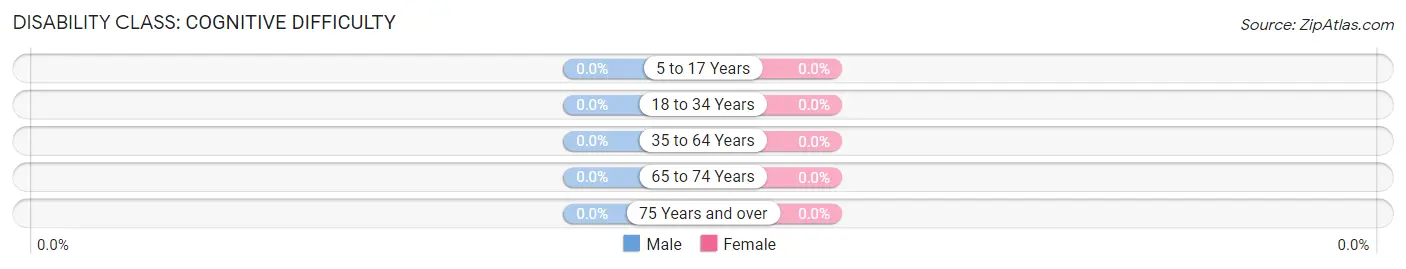
| Age Bracket | Male | Female |
| 5 to 17 Years | 0 (0.0%) | 0 (0.0%) |
| 18 to 34 Years | 0 (0.0%) | 0 (0.0%) |
| 35 to 64 Years | 0 (0.0%) | 0 (0.0%) |
| 65 to 74 Years | 0 (0.0%) | 0 (0.0%) |
| 75 Years and over | 0 (0.0%) | 0 (0.0%) |
Disability Class: Ambulatory Difficulty
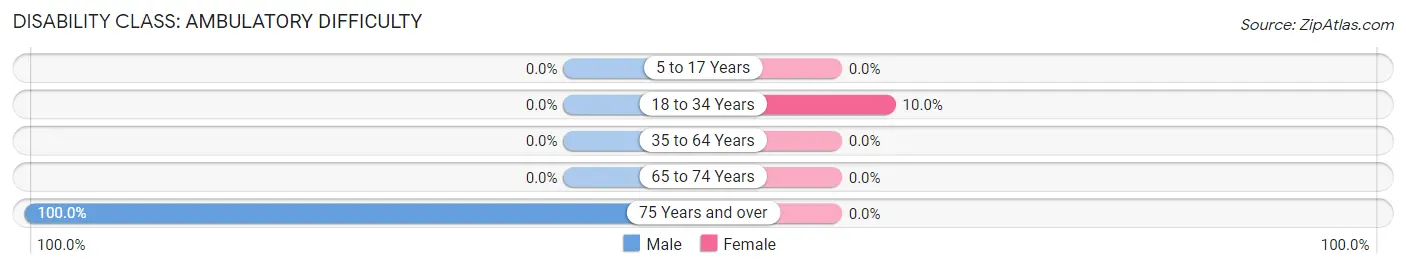
| Age Bracket | Male | Female |
| 5 to 17 Years | 0 (0.0%) | 0 (0.0%) |
| 18 to 34 Years | 0 (0.0%) | 1 (10.0%) |
| 35 to 64 Years | 0 (0.0%) | 0 (0.0%) |
| 65 to 74 Years | 0 (0.0%) | 0 (0.0%) |
| 75 Years and over | 10 (100.0%) | 0 (0.0%) |
Disability Class: Self-Care Difficulty
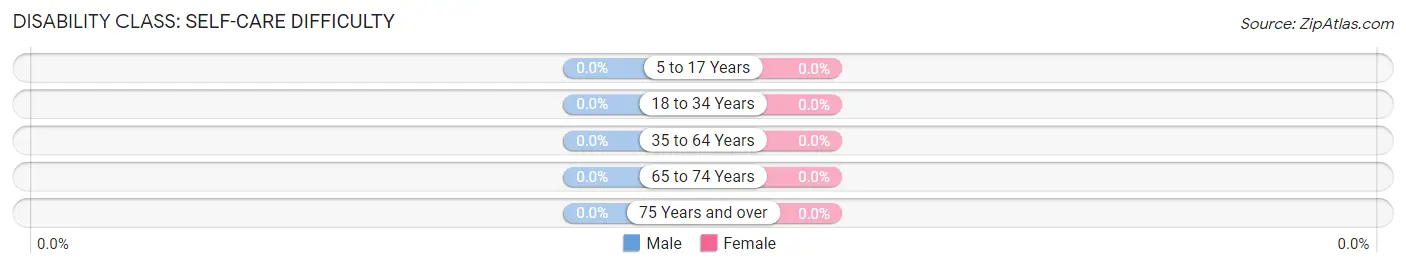
| Age Bracket | Male | Female |
| 5 to 17 Years | 0 (0.0%) | 0 (0.0%) |
| 18 to 34 Years | 0 (0.0%) | 0 (0.0%) |
| 35 to 64 Years | 0 (0.0%) | 0 (0.0%) |
| 65 to 74 Years | 0 (0.0%) | 0 (0.0%) |
| 75 Years and over | 0 (0.0%) | 0 (0.0%) |
Technology Access in Clear Lake
Computing Device Access in Clear Lake
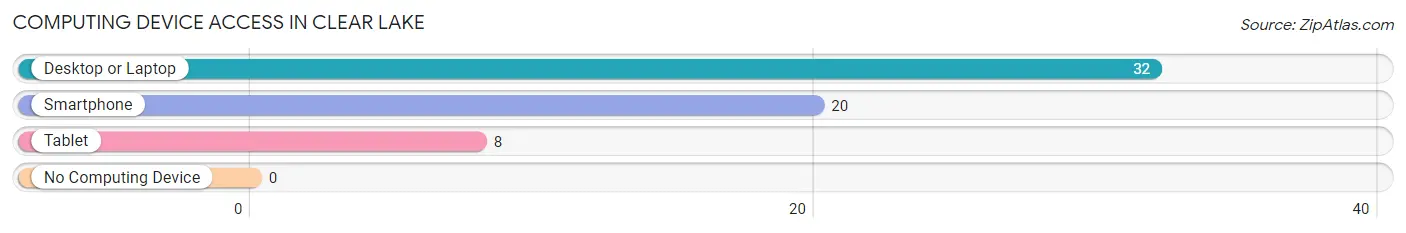
| Device Type | # Households | % Households |
| Desktop or Laptop | 32 | 100.0% |
| Smartphone | 20 | 62.5% |
| Tablet | 8 | 25.0% |
| No Computing Device | 0 | 0.0% |
| Total | 32 | 100.0% |
Internet Access in Clear Lake
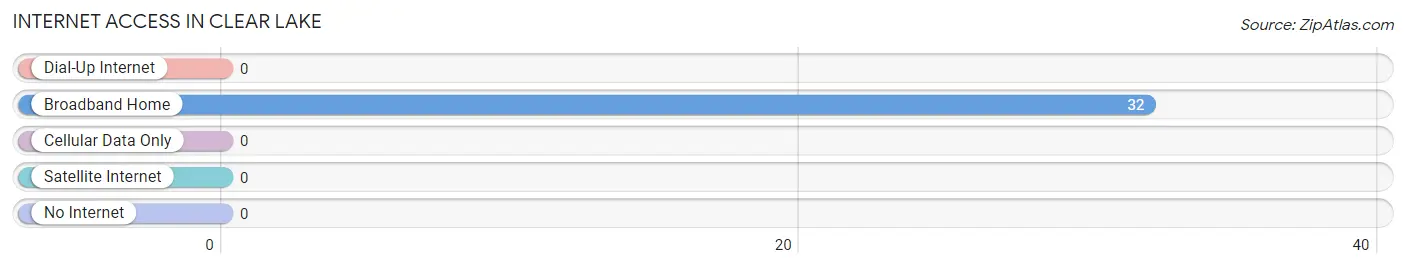
| Internet Type | # Households | % Households |
| Dial-Up Internet | 0 | 0.0% |
| Broadband Home | 32 | 100.0% |
| Cellular Data Only | 0 | 0.0% |
| Satellite Internet | 0 | 0.0% |
| No Internet | 0 | 0.0% |
| Total | 32 | 100.0% |
Clear Lake Summary
History
Located in the heart of South Dakota, Clear Lake is a small town with a rich history. The town was first settled in 1881 by a group of homesteaders from Minnesota. The town was originally named “Clearwater” after the nearby lake, but the name was changed to Clear Lake in 1883.
The town grew quickly, and by the early 1900s, it had become a bustling community with a variety of businesses, including a hotel, a bank, a general store, and a post office. The town also had a school, a church, and a newspaper.
In the 1920s, Clear Lake became a popular tourist destination. The town was known for its beautiful lake, which was a popular spot for swimming, fishing, and boating. The town also had a variety of other attractions, including a movie theater, a bowling alley, and a dance hall.
In the 1950s, Clear Lake began to decline as the population shifted to larger cities. The town’s businesses began to close, and the population dwindled. However, in the late 1970s, the town began to experience a resurgence. The town’s population began to grow again, and new businesses began to open.
Today, Clear Lake is a small but vibrant community. The town is home to a variety of businesses, including restaurants, shops, and a grocery store. The town also has a library, a museum, and a community center.
Geography
Clear Lake is located in the center of South Dakota, about 30 miles north of Sioux Falls. The town is situated on the shores of Clear Lake, a small lake that is fed by the Big Sioux River. The lake is a popular spot for swimming, fishing, and boating.
The town is surrounded by rolling hills and farmland. To the north is the Big Sioux River, and to the south is the James River. The town is also close to several state parks, including Big Sioux Recreation Area and Palisades State Park.
Economy
Clear Lake’s economy is largely based on agriculture. The town is home to several farms, which produce a variety of crops, including corn, soybeans, and wheat. The town also has a few small businesses, including restaurants, shops, and a grocery store.
The town is also home to a few manufacturing companies, which produce a variety of products, including furniture, clothing, and electronics.
Demographics
As of the 2010 census, Clear Lake had a population of 1,072. The town is predominantly white, with about 95% of the population identifying as such. The town also has a small Hispanic population, with about 4% of the population identifying as Hispanic or Latino.
The median household income in Clear Lake is $45,000, and the median home value is $125,000. The town has a low unemployment rate, with only about 4% of the population unemployed.
Conclusion
Clear Lake is a small town with a rich history and a vibrant economy. The town is home to a variety of businesses, including restaurants, shops, and a grocery store. The town is also home to several farms, which produce a variety of crops. The town has a predominantly white population, with a small Hispanic population. The median household income in Clear Lake is $45,000, and the median home value is $125,000. The town has a low unemployment rate, with only about 4% of the population unemployed.
Common Questions
What is Per Capita Income in Clear Lake?
Per Capita income in Clear Lake is $20,558.
What is Income or Wage Gap in Clear Lake?
Income or Wage Gap in Clear Lake is 28.8%.
Women in Clear Lake earn 71.2 cents for every dollar earned by a man.
What is Inequality or Gini Index in Clear Lake?
Inequality or Gini Index in Clear Lake is 0.35.
What is the Total Population of Clear Lake?
Total Population of Clear Lake is 100.
What is the Total Male Population of Clear Lake?
Total Male Population of Clear Lake is 60.
What is the Total Female Population of Clear Lake?
Total Female Population of Clear Lake is 40.
What is the Ratio of Males per 100 Females in Clear Lake?
There are 150.00 Males per 100 Females in Clear Lake.
What is the Ratio of Females per 100 Males in Clear Lake?
There are 66.67 Females per 100 Males in Clear Lake.
What is the Median Population Age in Clear Lake?
Median Population Age in Clear Lake is 31.2 Years.
What is the Average Family Size in Clear Lake
Average Family Size in Clear Lake is 4.1 People.
What is the Average Household Size in Clear Lake
Average Household Size in Clear Lake is 3.0 People.
How Large is the Labor Force in Clear Lake?
There are 24 People in the Labor Forcein in Clear Lake.
What is the Percentage of People in the Labor Force in Clear Lake?
43.6% of People are in the Labor Force in Clear Lake.